The Integrity of Pressure Components of Reactor Systems
272
INIS-mf—13935 IAEA Specialist's Meeting on The Integrity of Pressure Components of Reactor Systems Paks, Hungary 25-29 May, 1992
-
Upload
khangminh22 -
Category
Documents
-
view
1 -
download
0
Transcript of The Integrity of Pressure Components of Reactor Systems
INIS-mf—13935
IAEA Specialist's Meetingon
The Integrity of Pressure Componentsof Reactor Systems
Paks, Hungary25-29 May, 1992
IAEA Specialist's Meetingon
The Integrity of Pressure Componentsof Reactor Systems
Paks, Hungary25-29 Max 1992
Edited by: F. GiltemotG. Uri
The publishing of this proceeding was sponsored by the:
Nuclear Power Plant Paks,
Atomic Energy Research Institute (Budapest)
Note: The papers in this material has been supplied by the authors, and has notbeen revised or referred by the editors. The views expressed remain theresponsibility of the named authors and do not necessarily reflect those of thegoverment(s) of the designating Member State(s). In particular, neither theIAEA nor any other organization or body sponsoring this meeting can be heldresponsible for any material reproduced in this document.
IAEA Specialists' Meeting on the
Integrity of Pressure Components of Reactor Systems
Foreword
The IAEA Specialists' Meeting on the Integrity of Pressure Components ofReactor Systems was held at Paks, Hungary on 25-29 May, 1992. 53 delegatesrepresenting 16 countries or organizations were present.
The purpose of the meeting was to provide an international forum for discussion onrecent results in research and utility practice in the field of integrity of pressurizedcomponents of reactor systems
The Chairman for the meeting was Acad. L. Myrddin Davies from the UK, theIAEA Scientific Secretary was Mr. L. Ianko and the organizing committee consisted ofMr. Ferenc Gillemot and Mr, Peter Trampus.
The meeting was opened by the following speakers.
M. Davies Chairman
J. Balogi Deputy Director of NPP Paks
E. Bujdoso Hung.Comm. of Atomic Energy
F. Gillemot Atomic Energy Research Inst.
P. Trampus Organizing Committee
L lanko Scientific Secretary
The papers were arranged into a number of sessions and the session Chairmen andCo-Chairmen were:
Plenary sessionChairman: M. DaviesCo-chairman: P. Trampus
S e s s i o n 1 . Integrity assessment of pressurized components
Chairman: K. KohashiCo-chairman: F. Gillemot
S e s s i o n 2 . Integrity assessment of pressurized components
Chairman: M. BrumovskyCo-chairman: Gy. Mucskay

Session 2. (cont.)Chairman:Co-chairman:
G. EnglI. Havas
Session 3 . Integrity assessment methods
Chairman:Co-chairman:
Session 3. (cont.)Chairman:Co-chairman:
K. WichmanF. Oswald
Th. DuroyI. Artinger
Session 4. Assesment of Material Degredation an
Chairman:Co-chairman:
Session 4. (cont.)Chairman:Co-chairman:
S. RosinskyI. Becker
J. GuinovartE. Czoboly
The list of delegates and scientific programme are shown as Appendix 1 and 2.
The meeting included a visit to the Paks Nuclear Power Station.
The meeting was sponsored by the
• Hungarian Atomic Energy Comission
• Nuclear Power Plant Paks
• Atomic Energy Research Instititute (Budapest)
The proceedings edited by
F. Gillemot
G.Uri

IAEA Specialist's Meeting onThe Integrity of Pressure Components of Reactor Systems
Paks, Hungary, 25 May, 1992
Opening ceremony
Speakers:M. Davies ChairmanJ. Balogi Deputy Director of NPP PaksE. Bujdos6 Hung. Comm. of Atomic EnergyF. Giilemot Atomic Energy Research Inst.P. Trampus Organizing CommitteeL. Ianko Scientific Secretary
Plenary sessionChairman: M. DaviesCo-chairman: P. Trampus
Papers:1. Boothroyd, A.D.; Ianko, L:(IAEA) IWG-LMNPP activities
2. Guinovart,CapdevilaJose:(CEQ Presentation of CEC selectedstudies
3. Engl, G.; Crutzen, &: (EEQPISC m. A status report.
4. Hiser, A.; Wichman,K.: (USNRQ Overview of USNRC Plans onIrradiation Embrittlement Correlations (Reg. Guide 1.99)
Boothroyd, Ianko: IWG-LMNPP Activities..
IWG-LMNPP Activities on Nuclear Power Plant LifeManagement
A.D. Boothroyd, L IankoDivision of Nuclear PowerInternational Atomic Energy AgencyMay, 1992
ABSTRACT
By the dose of the year 2000 approximately 160 NPPs will be more than 25 yean old.The question of NPP life extension as an alternative to decommissioning will therefore beof growing importance worldwide.
Many technical, economic and safety aspects of NPPs ageing and life extension havebeen discussed at different IAEA meetings and have been included in the IAEAProgramme of Activity. The main problems which have been discussed are: economicanalysis, safety analysis methods for time-dependent phenomena, classification ofcomponents, methodology for effective management of the lives of critical components,establishment of data bank from information available in all countries. The activitiesplanned by the IAEA International Working Group on Life Management of Nuclear PowerPlants ( IWG-LMNPP ) include information exchange, meetings of several lands,development of publications and a data base. The purpose is to enable Member States withan interest in using nuclear power in the future to learn and gain a better understanding ofthe means available to protect and enhance the economic operating fife and safety of theirplants. The Agency co-operates closely with other international organizations to promotebetter understanding of all problems concerning NPP life management.
IWG-LMNPP ACTIVITIES
The purpose of this report is to provide description on the past and ongoing activitieswhich have been planned and are conducted within the framework of the InternationalWorking Group on Life Management of Nuclear Power Plants.
The International Working Group on Reliability of Reactor Pressure Components,which has been in existence for over 20 years, has carried out activities in the area ofmaterials of reactor pressure boundary components. The Working Group men decided toput a greater emphasis on ageing and life management and changed its name toInternational Working Group on Life Management on Nuclear Power Plants, also revisedthe aims and scope of its activities, which focus on aspects of reliable plant Ufe management(including specialists meetings, technical assistance, publications on aspects relating tomaintaining reliability of specific plant components and Co-ordinated ResearchProgrammes).
Boothrovd lanko: IWG-LMNFF Actmues...
• Directions of the IWG-LMNPP activities as adopted are:
• establishing a methodology to rank plant components according to their impacton planlifetime;
• defining the specifications for a suitable database for merging operatingexperience and classifying the consequences of operating events on the plantcomponents lifetime
• achieving a better understanding of the ageing phenomena and theirmechanisms,
• completing work on pressure boundary integrity surveillance programmes andtheir analysis.
It should be noted that the IWG-LMNPP during the reported period continued itswork in accordance with the Agency's Programme A2.02 "Nuclear Power Plant Ageingand Life Extension".
The Life Management Process is a complex team effort involving many areas oftechnology. The scope of IWG programme covers many of these technologies with aparticular emphasis on plant availability. This programme also goes a long way inpromoting safe operation, but there are some additional activities sponsored by IAEA'sSafety Division.
The major role that the International Working Group has been taking is in theprovision through research programmes of generic information of Nuclear Power PlantLife Management. In the technology area this consists of a wide variety of subject areas.Reports on Proceedings of Specialists' Meetings on many of these topics have beenproduced or are in preparation. A list of meeting topics held over the past five years arelisted in Appendix 1.
The key components to be considered will depend on the type of design, but generallyinclude:
1. Reactor pressure vessel
2. Heat transport piping
3. Containment and other concrete structures
4. Steam generators and other heat exchangers
5. Electrical insulation
6. Pump bearings and seals
The methodology used to assess the condition of a component depends of course onthe component. It's role and the design and safety criteria applied and the margins availablehave to be determined on a case-by-case basis at each plant. Methodology is an area whereIAEA has documents in preparation in both the safety area and for reliable achievement ofhigh availability.

Boothrovd lanko: IWG-LMNPP Acti\ities...
Understanding the phenomena which occur and the consequent degradationmechanisms is an extensive area of work. Radiation embnttlement of reactor pressurevessel steels has been the major area of concern but thermal degradation, corrosion andfatigue are also very significant In the monitoring field, non-destructive examinationtechniques and fracture mechanics are subject areas which are major contributors to theprocess.
In accordance with the recommendations made by participants at the last meeting inMarch 1990, there were a number of meetings to be organized within the framework of theIWG-LMNPP activities:
Specialists Meeting on "Sub-Critical Crack Growthty, was held 14-18 May 1990,in Moscow.
The purpose of the Specialists Meeting was to provide opportunities for discussion onthe topic of crack growth phenomena and methods of its investigation to improve the stateof knowledge of the topic and thus also improve nuclear power plant reliability, availabilityand safety. Papers presented emphasized that sub-critical crack growth affects the lifetimeof components in nuclear power plants, for example, reactor pressure vessels, steamgenerators, piping, etc. The proceedings are available.
Specialists Meeting on "Radiation Embrittlement of Nuclear Reactor PressureVessel Steels", was held 26-28 September, 1990, in Balatonfured,Hungary
The purpose of die Specialists Meeting was to provide an international forum fordiscussion on recent results in research and utility practice on surveillance and radiationembrittiement, allow better understanding of the mechanisms of embrittlement, the effectsof chemical and environmental factors, and to improve knowledge on the topic and thus togive directions for further investigations. The proceedings is published as ASTM STP1170.
Specialists Meeting on "Nuclear Power Plant Lifetime Assurance" was held 10-12October 1990, Stockholm, Sweden.
The purpose of the meeting was to provide a forum to allow a better understanding ofageing phenomena of key reactor components and the effects on environmental factors andto improve knowledge of the topic of plant lifetime management. There were 64participants representing 14 countries and 3 international organizations
The participants of the SPM concluded, that this meeting has contributed to betterunderstanding of ageing degradation process and methodologies for lifetime assurance ofNPP components. The proceedings are available
Specialists Meeting on "Nuclear Power Plant Components Maintenance, Repairand Replacement for Plant Life Management", 23-26 September 1991, Madrid, Spain
The purpose of the meeting was to review the experience gained in the area of repairand replacement. There was a special focus on various repair and replacement techniquesas well as on manufacturing and qualification of spare parts. Regulatory aspects, Codes andStandards were considered - taking into account the development after the commissioningof the plants. The proceedings are available
Boothrovd lanko: IWG-LMNPP Activities...
Specialists Meeting on "Thermal and Mechanical Degradation", 19-21 November1991, Abingdon, UK
The purpose of the Specialists Meeting was to provide an international forum fordiscussion on recent results in research and utility practice in the field of thermal andmechanical degradation effects in NPP reactor materials. Contributions gave results inpractice, experimental, thermal and environmental surveillance programmes. Theproceedings are available.
Coming back to the IWG specialists meeting programme, it should be noted that themeetings were well organized and provided valuable material which after pubUshing willpresent a useful information package
According to the Agency' Programme the process of TRS "Radiation Embrittlementof LWR Pressure Vessel Steels" updating is under way. At the initial Editorial BoardMeeting (November 1989, Vienna) chapters and the scientific scope were worked out.Since part of the reports was completed, the last Editorial Board Meeting (September1991, Vienna) paid attention to the consideration of the proposed chapters and theirauthors It was also agreed that the title of the book should be "The Effect of NeutronIrradiation on Reactor Pressure Vessel Steels".
Technical document of the "Methodology of Assessing Plant Ageing Phenomena"is planned to be completed on the basis of two consultants reports "Nuclear Power PlantAgeing and Life Extension", "Ageing Mechanisms of Reactor Key Components andIts Monitoring" and papers presented at the IAEA Specialists Meeting "Nuclear PowerPlant Lifetime Assurance" (October 1990, Stockholm, Sweden). After the finalreviewing the document will be submitted for printing.
Meeting of the International Working Group on Life Management of NPPs (17-19February 1992, Austria, VIC)
The objective of the meeting was to summarize and to discuss recent developments inthe field of Nuclear Power Plant Life Management, including understanding of ageingmechanisms, monitoring, mitigation, managing ageing and to identify future direction inIWG-LMNPP activities Recommendations of the Group are used in the definition ofactivities to be included in Agency programmes.
Phase III of the Co-ordinated Research Programme on "Optimizing ReactorPressure Vessel Surveillance Programmes" went into its final stage. The task of PhaseIII is to meet the principle goal of optimizing reactor pressure vessel surveillanceprogrammes and related methods of analysis for international application.
The following countries are participating in Phase III: Argentina, Austria, CSFR,Belgium, Germany (orginally both the GDR and FRG), Hungary, India, Japan, Finland,France, Spain, Switzerland, UK, The Russian Federation and USA
Boothrovd Ianko IWG-LMNPP Activities...
The CRP meeting in May 1989 (Vienna) decided to organize a data base for thecollection of uniform raw data from the national standard and optional projects. The basicidea of the Phase III data base is to collect the original measured data in a form that permitsinternational evaluation and in the future eventual re-evaluarion by newly developedmethods The data base is made for IBM PC and the basic software used is Dbase III orDbase IV. The national reports are carefully studied and the data included into thedatabase are validated. The final meeting was held in November 1993 in Vienna.
In response to requests by the Member States having operating nuclear power plant forassistance, to facilitate exchange of information on key components behaviour on a wideinternational basis, a programme on the development of reactor component ageing database has been established by the IAEA
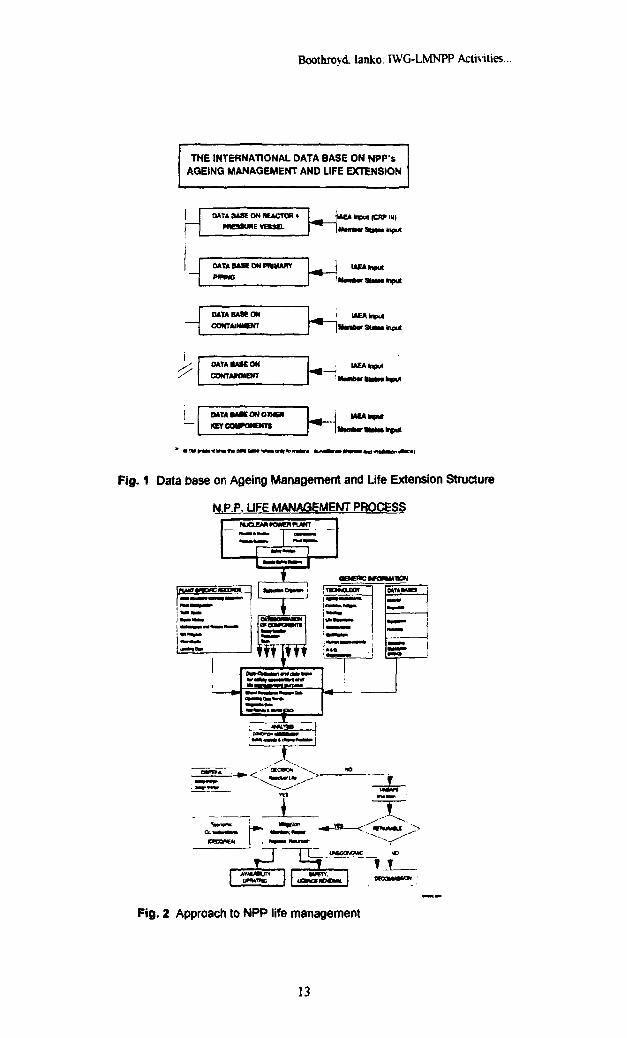
The objective of the programme from the beginning was the advancement inunderstanding of degradation mechanisms encountered in nuclear power plant operation.Initially the focus of the programme was the major degradation mechanism, irradiationembrittlement of the reactor pressure vessels. The scope of the programme has now beenexpanded to include nuclear power plant components important to safety and reliability ofoperation (Fig. I)
It has been recognized that data availability is a key aspect for effective lifemanagement and resolution of ageing related issues. The service life and reliability of anuclear power plant, are directly related to the quality and availability of the relevantinformation. Management, technical, operations, maintenance and administrative staffrequire timely, relevant, accurate and adequate information to make decisions which areessential for plant life management
There are a number of benefits relating to the management of ageing which are madepossible by an effective NPP data collection, record keeping and evaluation:
• The capability to make predictions of future NPP component performance andremaining service life which would provide a basis for predictive maintenancei.e., for decisions on the type and timing of preventive actions (such asmaintenance, refurbishing and replacement).
• The ability to identify and evaluate component degradation, failures andmalfunctions caused by ageing effects which would provide a basis forcorrective actions and also enhance the understanding of ageing mechanismsand help the development of effective methods for timely detection andmitigation of ageing effects
• The ability to identify new emerging ageing effects before their impact on plantsafety, reliability and service life
• Comprehensive information on plant operating and maintenance experiencewhich is anecessary input for licensing decisions concerning continuedoperation of NPPs and licence extensions.
• An improved feedback to designers on the performance of plant componentsunderactual service conditions which could serve as a basis for more effectivemanagement of ageing in the design of future plants
10
Boothroyd Ianko: IWG-LMNPP Activities...
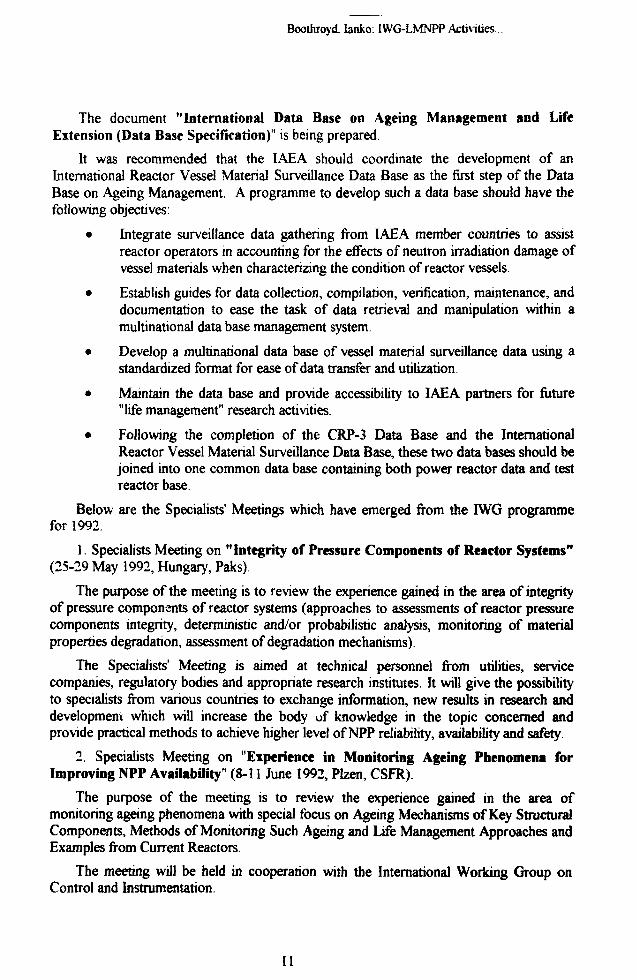
The document "International Data Base on Ageing Management and LifeExtension (Data Base Specification)" is being prepared.
It was recommended that the IAEA should coordinate the development of anInternational Reactor Vessel Material Surveillance Data Base as the first step of the DataBase on Ageing Management. A programme to develop such a data base should have thefollowing objectives:
• Integrate surveillance data gathering from IAEA member countries to assistreactor operators in accounting for the effects of neutron irradiation damage ofvessel materials when characterizing the condition of reactor vessels.
• Establish guides for data collection, compilation, verification, maintenance, anddocumentation to ease the task of data retrieval and manipulation within amultinational data base management system.
• Develop a multinational data base of vessel material surveillance data using astandardized format for ease of data transfer and utilization.
• Maintain the data base and provide accessibility to IAEA partners for future"life management" research activities.
• Following the completion of the CRP-3 Data Base and the InternationalReactor Vessel Material Surveillance Data Base, these two data bases should bejoined into one common data base containing both power reactor data and testreactor base.
Below are the Specialists' Meetings which have emerged from the IWG programmefor 1992.
1. Specialists Meeting on "Integrity of Pressure Components of Reactor Systems"(25-29 May 1992, Hungary, Paks)
The purpose of the meeting is to review the experience gained in the area of integrityof pressure components of reactor systems (approaches to assessments of reactor pressurecomponents integrity, deterministic and/or probabilistic analysis, monitoring of materialproperties degradation, assessment of degradation mechanisms).
The Specialists' Meeting is aimed at technical personnel from utilities, servicecompanies, regulatory bodies and appropriate research institutes It will give the possibilityto specialists from various countries to exchange information, new results in research anddevelopment which will increase the body of knowledge in the topic concerned andprovide practical methods to achieve higher level of NPP reliability, availability and safety.
2. Specialists Meeting on "Experience in Monitoring Ageing Phenomena forImproving NPP Availability" (8-11 June 1992, Plzen, CSFR)
The purpose of the meeting is to review the experience gained in the area ofmonitoring ageing phenomena with special focus on Ageing Mechanisms of Key StructuralComponents, Methods of Monitoring Such Ageing and Life Management Approaches andExamples from Current Reactors.
The meeting will be held in cooperation with the International Working Group onControl and Instrumentation.
II
Boothrovd, lanko: IWG-LMNPP Activities...
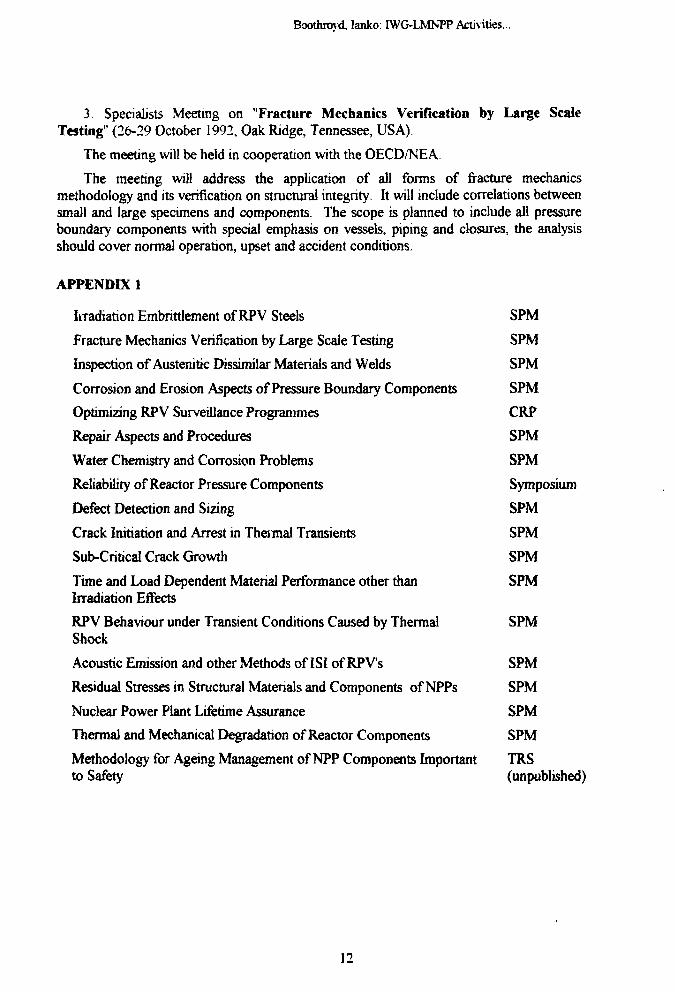
3 Specialists Meeting on "Fracture Mechanics Verification by Large ScaleTesting" (26-29 October 1992, Oak Ridge, Tennessee, USA).
The meeting will be held in cooperation with the OECD/NEA.
The meeting will address the application of all forms of fracture mechanicsmethodology and its verification on structural integrity. It will include correlations betweensmall and large specimens and components. The scope is planned to include all pressureboundary components with special emphasis on vessels, piping and closures, the analysisshould cover normal operation, upset and accident conditions.
APPENDIX 1
Irradiation Embrittlement of RPV Steels SPM
Fracture Mechanics Verification by Large Scale Testing SPM
Inspection of Austenitic Dissimilar Materials and Welds SPM
Corrosion and Erosion Aspects of Pressure Boundary Components SPM
Optimizing RPV Surveillance Programmes CRP
Repair Aspects and Procedures SPM
Water Chemistry and Corrosion Problems SPM
Reliability of Reactor Pressure Components Symposium
Defect Detection and Sizing SPM
Crack Initiation and Arrest in Theimal Transients SPM
Sub-Critical Crack Growth SPM
Time and Load Dependent Material Performance other than SPMIrradiation Effects
RPV Behaviour under Transient Conditions Caused by Thermal SPMShock
Acoustic Emission and other Methods of ISI of RPVs SPM
Residual Stresses in Structural Materials and Components of NPPs SPM
Nuclear Power Plant Lifetime Assurance SPM
Thermal and Mechanical Degradation of Reactor Components SPM
Methodology for Ageing Management of NPP Components Important TRSto Safety (unpublished)
12
Boothrovd. Ianko: IWG-LMNPP Activities..
THE INTERNATIONAL DATA BASE ON NPP'sAGEING MANAGEMENT AND LIFE EXTENSION
DATA BASE ON REACTOR » -HiDATA BASE ON PWMARYPIPING
Inprt
input
DATABAWONCONTAINICNr
UEAktpU
OATAMtCONCONTAMMOfr
^ ; lAEAhput
M M U t
MTAM1CONOIMBIKETCOMKIMBm |wnn>irlM>nt<ii«
Fig. 1 Data base on Ageing Management and Life Extension Structure
W.P.P. LJFE MANAGEMEhfT PROCESSNUOfMKMmnANT
OEteKMVMUTiaN
™ • " • • • • • " i r ' _ " _
J I '
Pig. 2 Approach to NPP life management
13
Guinovart: CEC Selected
CEC SELECTED STUDY CONTRACTS
J. Guinovart,CEC Comission DGX1I-D1
Introduction
The Commission of the European Communities CEC is assisted in its actions regardingfast breeder reactors by the Fast Breeder Coordinating Committee which has set up twoWorking Groups The Safety Working Group and the Working Group Codes andStandards WGCS. The latter's initial mandate (1974) was to:
• Draw a list of codes, standards and regulations related to design, constructionmaterials and inspection of FBR components.
• Define points of similarity and analyse problems posed by discrepancies.
• Define fields in which additional theoretical and experimental data are required.
• Later (1978) this mandate was extended by the requirements to try to reachconsensus on points of dissimilarity with the goal of a progressiveharmonization.
The WGCS has three sub-groups called Activity Groups:
• -AG1 Manufacturing Standards and In-service Inspection.
• -AG2 Structural Mechanics.
• -AG3 Materials
The WGCS is composed of about 15 members representing utilities, industry andresearch organzations. The three AG's have a size of 10 to IS permanent members,ocassionally independent experts participate in the works. Six countries have been up tonow represented: Belgium, France, Germany, Italy, the Netherlands and the UK. Themembers are nominated by their organizations, the Chairmen are elected by the membersthemselves and the CEC takes care of the secretariat.
An annual budget of the order of 0.8M ECU (1M US $) is available for studycontracts. The WGSC meets twice a year, each of the three AGs three times a year, mostlyfor two days. At these regular meetings tbe members:
• define the priorities for future activities.
• choose the studies to be funded each year and the organizations to performthem (mostly each study contract has several partners from different countriesin order to make pooling of data and the elaboration of proposals forharmonization easier).
• monitor the progress of on-going study contracts.
• review the final reports and decide on the pub 1 ication.
At this point we should stress that only less than 25% of the studies are of an interestrestricted to FBRs Most of the study contracts concern problems of interest to all types ofreactors and very often even non-nuclear applications {conventional power plants,chemical plants, etc.)
In this paper, three recent outstanding studies developed in the framework of theWorking Groups Codes and Standards are briefly described.
14
Guinovart: CEC Selected..
COMBINED ANALYSIS OF AUTOMATED PULSE ECHO AND TIME-OF-FLIGHT DIFFRACTION DATA
Authors: TBonn KI) Ashton HWinstanleyfrom AFA Technology (RJsley, UK).
This report presents the results of a practical study aimed at improving inspectioncapability for austenic welds from the combined analysis of automated pulse-echo and time-of-flight diffraction data on realistic defects in representative of real LMFBR welds.
Four specimens (figures 1, 2, 3, and 4) contained simulated fabrication or service-included defects. Each defective specimen was accompanied by an identical defect-freecontrol specimen
Description of Specimens
-A buttered T-butt Manual Metal Arc (MMA) weld in Type 316 ss plate containing acircular patch under the side arm to simulate a lack of fusion defect at tbe weld to butteringinterface. This specimen was fatigued by tensile loading of the side arm to encourage thegrowth of cracks from the edge of the patch into the butteriug to simulate service-includedsecondary cracing from a fabrication defect Specimen 1.
• An unbuttered T-butt MMA weld in Type 316ss plate containing a surface-breaking fatigue crack propagated along the side arm weld fusion face by bendloading of the side arm. Specimen 2
• An asymetric prep straight MMA butt weld in Type 316 stainless platecontaining a surface-breaking fatigue crack propagated in the weld by threepoint bending. Specimens 3
• A ferntic-to-austenitic transition weld specimen contained a simulated service-induced fatigue crack. Specimen 4
• Inspetion Methods
• (Specimens 1 and 2 only) o° pulse-echo inspection with 6 d B drop sizingusing a 2.25 MHz probe.
• (Specimen 3 only) Standard two probe TOFD inspection using 5 MHz andproducing 60° wave beams in steel. It was not possible to apply the two probeTOFD technique to the T-butt specimens due to the positions and orientationsof the defects in them.
• (specimen 4 only) Both multi-probe pulse-echo and Time-of-FIight Diffractionwere used for this test
Multi-probe several probes with overlapping focal regions were used for full depthcoverage to the weld (4 and 5 MHz frequencies, 0°, 45°, 60° and 70° beam angles)
Pulse-echo defect sizing was mainly by the 6 dB drop method Maximum amplitudetechnique was also used where diffracted signals from the defect tis could be identified
Time-of-Flight Diffraction defects identified by the pulse-echo inspection were sizedby the standard two probe TOFD technique using 10 MHz probes mounted on perspectwedges to produce 45° or 60° angled compression wave beams in the specimen.
A X-Y scanning mechanism linked to a MKI Zipscan automated inspection system wasused for the ultrasonic probes in specimens 1,2, 3 and pulse-echo test on the specimen 4. AMK3 Zipscan was used for the TOFD test on the specimen 4.
15
Guinovart: CEC Selected..
Conclusions
l.Test Specimen 1 contains a simulated lack of fusion defect which did not present adifficult test of detection or sizing techniques The intended secondary fatigue cracks werenot detected. The value of Test Specimen 1 in a round robin exercise will depend on whichtype of defect is required -the circular patches are still reasonably realistic representations oflack of fusion defects
2. Test Specimen 2 contains an easily detectable fatigue crack which may test somesizing techniques due to its proximity to the edge of the side arm and the limited inspectionaccess
3 Test Specimen 3 contains a tight fatigue crack which was both difficult to detect andsize due to relatively high ]evels of gram scatter noise and other spurious signals from theweld As such it should offer a severe test of ultrasonic inspection capabilities and isconsidered suitable for inclusion in a round robin test
4. Test Specimen 4. The use of multi-probe high sensitivity Pulse-echo scanning withoptimized probes greatly increases inspection confidence and aids interpretation ofinspection data. Pulse-echo and TOFD techniques offer complementary defect detection,sizing and characterization Possibilities which can be combined to improve inspectioncapability for realistic fabrication an in-service defects.
SIMPLIFIED ELASTIC PLASTIC FATIQUE ANALYSIS OF SMOOTHSTRUCTURES
Author: Dr Hiibel (Siemens, Germany)
Introduction
Engineering structures subjected to high cyclic straining play an important role in manyareas as power plants and turbines.
Due to stringent safety requirements, nuclear power plants must be designed carefullywith respect to such events. This is particularly true for Fast Breeder Reactors cooled byliquid metal (LMFBR), the high heat-transfer coefficient of which gives rise to high thermalloads, well in excess of the proportionality limit of the material. As a result of start-up andshut-down events and service-level variations, these thermal loads are cyclic in nature.
Basically, the structural response beyond the proportionality limit can be calculatedusing rigorous inelastic analysis methods, where stresses and strains are calculated on astep-by-step basis throughout a given load history. To account for nonlinearmaterial behaviour, equilibrium is found iteratively in each step Detailed knowledge ofthe material behaviour, expressed in mathematical form as constitutive equations, and aspecific load history of the different loads are required. Since this can oftenu not beprovided, and since such analyses are extremely complicated and expensive with respect tocomputer time, manpower, and real time, rigorous inelastic analyses cannot be used as astandard procedure, especially not in the early stages of design. Consequently, simplifiedinelastic methods of analysis are needed, which can be used to estimate the inelasticbehaviour of a structure on the basis of fictitious linear elastic analyses.
Fatique failure is one of the predominant failure modes to be guarded against whendesigning nuclear power plants. A fatique-damage assessment requires knowledge of strainranges occunng in a structure. The concept of "design by analysis" adopted by variousDesign Codes allows a determination of elastic-plastic strain ranges by making use ofplastic strain concentration factors. This means that a strain range determined by fictitiouselastic methods, is multiplied with a plastic strain range enhancement factor Ke, provided
16
Gumovart: CEC Selected
by Design Codes, to use in fatigue analysis In this respect, the background of some factorsKe, found in Design Codes is being reviewed in this report
Plastic strain ratige enhancement in simple structures
Two different material models. Bilinear and Ramberg-Osgood stress-strainrepresentations, to describe nonlinear elastic-plastic stress-strain behaviour are discussed.Both are sufficiently complex to describe the essential feature of material hardening, theyare at the same time however sufficiently simple for hand calculations and thus closed formsolutions for many simple structural geometries, and allow a relatively easy understandingof structural behaviour in more complicated situations.
Some simple structures are used for studying the basic features of plastic strainenhancement Three different kinds of bars are analysed - one of constant cross-sectionalarea along the length, one of two differet but constant cross-sections and one of linearlyvarying cross-section Two cantilever beams, one with I-profile, the other with a solidrectangular cross-section, are also studied For the most part, displacement-controlledloading is studied, since force-controlled loading produces trivial results for the majority ofthe geometries mentioned above. In all cases, the bilinear material model as well as theRamberg-Osgood model are used.
Tbe loading (and thus the fictious elastic stress) is considered to be appliedmonotonously, the factor K being a plastic strain enhancement factcor. In the absence ofprogressive deformation of any kind (e.g. due to a ratcheting mechanism) during a loadingcycle (i.e. the stress-strain hysteresis loop is closed, the strain amplitudes are identical intwo consecutive half-cycles), the factor Ke derived for monotonous loading can beinterpreted as a plastic strain range enhancement factor. Only the fictitions elastic stress isto be replaced by the fictitions elastic stress range and the material parameters (yield stressE , B, n) now describe either the loading or the unloading (or reversed loading) path of thestress-strain hysteresis loop after transformation of the origin of the axes to one of the twoextremes of the stress-strain hysteresis
The plastic strain enhancement factors for the simple structures considered can varybetween zero and infinity.
For displacement-controlled loading and bilinear (or Ramberg Osgood) stress-strainrepresentation K at the most highly stressed location ofthe structure grows from unity to amaximum value with increasing load level, and then decreases, tending to unity again at aninfinitely high load level (or grows monotonous]y from unity to a maximum value with theRamberg-Osgood material model If the loading is force controlled, Ke increasesmonotonously with tbe load level, approaching a constant value (or tends to infinity withthe Ramberg-Osgood material model) at an infinitely high load level.
The principal difference between the two models used here is that plastic strains in areal material are almost inevitably overestimated by the Ramberg-Osgood model atmoderate stress levels and underestimated by the bilinear model at near yiejd-stress levels.As a result, the Ramberg-Osgood material model tends to overestimate tbe contribution ofthe lower stressed parts of a structure to accomodating a displacement-controlled load,which in turn leads to an underestimation of the plastic strain enhancement factor at themost highly stressed location. Accordingly, the plastic strain enhancement factors for force-controlled loading are systematically overestimated by the Ramberg-Osgood model (viceversa with the bilinear model). To be conservative, the bilinear model should be preferredfor modelling the elastic-plastic behaviour of a real material uuder displacement-controlledloading (at least in the range of load levels realistic in the design of Fast Reactors)
Summarising, we observed that the plastic strain enhancement depends strongly on the
17

Gumovart: CEC Selected...
• geometry of the structure
• kind of loading
• load level
• material model and hardening parameters
Particularly for displacement-controlled loading, Ke may vary significantly from onegeometry to another, and usually has values somewhere between stress-controlled andstrain-controlled loading. On the other hand we have also studied cases where the plasticstrain enhancement was lower than under strain control.
In view of this situation, it is deemed unlikely that any one, simple, conservative, butnot overly conservative method can be established which provides plastic strainenhancement factors for use in all these circumstances.
Conservatjveness of Neuber's approach if used for smooth structures
Plastic strain enhancement at notches has been studied widely in the literature Manyapproaches are available for estimating the elastic-plastic strains at the notch root forvarious notch geometries and kinds of loading. For the present purpose it is sufficient toconcentrate on the one most widely used, i.e. Neuber's approach, wbich forms the basis fora number of more sophisticated methods and which is often adopted in Design Codes aswill be discussed later.
Neuber's approach states tbat the product of stress and strain is invariant underfictitious elastic or elastic-plastic conditions. This relation was derived early for shear-strained sharp notches in a prismatic body, however it is often used for any type of notchand even sometimes proposed for general use (i.e. also for smooth geometries), althoughthis cannot be justified theoretically.
Local elastic-plastic notch behaviour cannot be related to the global behaviour ofsmooth structures. In general, the plastic strain enhancement according to Neuber'sapproach differs greeatly (i.e. is sometimes conservative and sometimes not conservative)from those values derived for the simple smooth structures It can be shown that Neuber'sapproach is often not conservative in the region of prartical interest, i.e. for moderatehardening and moderate stress-levels.
Review of Design Codes
The plastic strain range enhancement factors stablished in the Design Codes forsmooth structures are discussed and compared in the report.
When the plastic strain range enhancement factor is plotted the curve RCC-MRassumes here that cyclic primary stresses are negligible and that no advantage is taken ofthe approach allowing a more favourable strain range enhancement factor when the loadingis, at least in part, strain controlled. As mentioned earlier, the Ramberg-Osgood modelpredicts plastic-strais even at very low stress levels, so that the factor Ke exceeds 1 even forstress ranges Sn /3Sm below 1.
It is shown that different Design Guides acomodate plastic strain enhancement insmooth structures in significantly different manners. Some Design Guides don't considerenhancement at all while others indicate a factor Ke which increases more or less steeplywith the stress level to a maximum value or even infinity.
Some Design Guides adopt Neuber's approach. This is potentially not conservative.The TRD and AD-Merkblatt, however, use Neuber's approach with a perfectly plasticmaterial model, the yield stress being wbich is extremely conservative for materials withkinematic and isotropic hardening.
18
Guinovart: CEC Selected
The RCC-MR adopts Neuber's approach with a Ramberg-Osgood model based on thefully saturated cyclic behaviour. This amplifies the fact that Neuber's approach applied tosmooth structures is not conservative in terms of plastic strain range enhancement, becausethe gradual increase in cyclic hardening shortly after having monotonous behaviour is notreflected. Fully saturated cyclic behaviour may not occur in practice. On the other hand, anadditional factor Ku is incorporated, which takes on approximately values similar to KeNeuber under the conditions assumed here
The TRD and AD-Merkblatt adopt Neuber's approach but do not take into account thegeometry of a structure and the kind of loading applied. Material behaviour is, however,taken into account, but in a very simple manner (perfect plasticity).
The SNR-300 Design Guide cannot reflect realistically Fast Reactor structuralgeometries and typical loading, since its plastic strain range enhancement factor is takenfrom the ASME Code, Section III, which is a LWR Design Guide. Material behaviour istaken into account (n,m,3Sm ) However, it is stated that n and m are not well founded.
The N-47 and the Monju Design Guide (general route) do not account for plasticstrain range enhancement in smooth structures at all.
The geometry of a structure and the kind of loading are not considered in Neuber'sapproach as used in the RCC-MR. However, an additive correction for biaxial stress slatesis introduced. The relevance of material data is recognised but use of the cyclic curve (inpractice the fully saturated one) is not conservative.
Tbe route in the Monju Design Guide for low-level long-term primary stressesprovides an obviously empirical plastic strain range enhancement procedure. The geometryand loading of typical Fast Reactor structures are not reflected expucitely, but a series ofstructural experiments indicates that the approach is conservative.
Typical Fatigue Problems in LMFBR 's
Fatigue problems encountered in LMFBR's arise usually in structures which are thin-walled and axisymmetric. They may be smooth or notched, and may or may not exhibitstiffness discontinuities. The loading situation is usually characterised by high cyclic thermalloads at low primary stresses, which may be constant or cyclic too.
The origin of the thermal stresses can be manifold. There are, for instance, axialtemperature gradients, stationary or travelling of constant or varying shape and magnitude(e.g. fluctuating sodium level problem in the reactor vessel). Furthermore, sudden axialtemperature gradients occur if a sodium temperature transient arrives at a structure havingcomponents with different thermal inertia (usually accompanied by differences in stiffness,eg pipe-to-flange connection)
Radial temperature gradients are associated with temperature transients too (e.g.through the wall of a pipe) Thermal stresses also occur if mean thermal expansion isprevented and if the boundaries of a structure are subjected to thermally induceddisplacements (e.g. piping system).
It should be emphasised here that all these kinds of loading are dorrunantly carried bybending stresses in real structures,, and not by membrane stresses. Recalling the simplestructures, in particular comparing the bar of two parts subject to axial elongation with thecantilever beam subject to a deflection, it becomes evident that this is of great significanceto plastic strain enhancement
Finally, a fatigue problem can be induced by thermal striping, but then normally at thehigh cycle end of the fatigue curve where plasticity is not involved.
Since displacement-controlled loading was studied in detail in simple structures andsince thermal strioine is not associated with Dlastic strain enhancement onlv loadings due
19
Guinovart: CEC Selected...
to radial and axial temperature gradients shall be examined closely. Such cyclic loads arenot only related to fatigue but may also give rise to cyclic strain accumulation if thestructure can develop a ratcheting mechanism, which is however not the subject of thepresent report. Plastic strain range enhancement due to unequal strain amplitudes tn twoconsecutive half-cycles, associated with ratcheting, will not be considered.
Simplified Methods
Design Codes do not reflect plastic strain enhancement of smooth structuressufficiently well. Some methods were proposed recently, providing procedures forquantifying plastic strain enhancement of smooth structures, without however having foundtheir way into Design Codes to date. They are simplified methods in the sense that theyprovide or at least strive to provide) information on the elastic-plastic behaviour of astructure sufficiently for performing fatigue analyses so that rigorous elastic-plastic analysiscan, in general, be avoided. They may be used also to help in deciding whether a rigorousanalysis, if unavoidable, is likely to demonstrate that fatigue limits will not be exceeded.
Two methods proposed for improving Design Codes are discussed. Both postulate thatthree different effects should be treated separately by assigning a separate plastic strainenhancement factor to each of them, one factor to account for multiaxiality in kinematicallydeterminate states of strain (Poisson's ratio effects), one factor to cover nocht effects, andone factor to account for the global behaviour of smooth structures (including stiffiiessdifferences).
The most important differences between these two methods are found in thefundamentals of the factor to account for global behaviour and in the interaction ofthe threedifferent factors. The author proposes a catalogue of different factors Ke for differentgeometries and kinds of loading. The cantilever beam under displacementcontrolledloading, which shall be the first entry in such a catalogue, seems suitable for almost allfatigue problems in Fast Reactors. Roche proposes a procedure based on the assumptionthat no redistribution of stress occurs due to plastic straining (Kachanov). A catalogue maybe required here also to indicate for which geometries and kinds of loading this assumptionis appropriate.
Both methods have their advantage and their disadvantages The report helps toidentify the areas in which the methods can be applied with confidence and to direct furtherwork for improving them as necessary.
MECHANICAL BEHAVIOUR OF DISSIMILAR METAL WELDS
Author: Mr. Escaravage, Framatome France.
This study is the revised final report of CEC Study Contract N°_ RAP-090-Fperformed under WGCS/Activity Group 3: Materials Most AG3 work concernscomparisons of material specifications and evaluations of material data to be used in designand construction codes
This report addresses the problems of dissimilar metal welds connecting an austeniticstainless steel component to a ferritic steel component. In LMFBRs such welds appear atthe juncion ofthe austenitic stainless steel vessel with the ferritic steel roof and in sodiumand water or steam pipes. The ]atter are exposed to high temperatures in the creep range. Awide range of austenitic stainless steels and ferritic steels (carbon steels, low alloy steels andalloy steels) are covered, the study encompasses more than 20 different weld metals(austenitic stainless steels and nickel base alloys)
20

Guinovart: CEC Selected...
The report begins with a presentation of the materials, geometries and weldingprocedures treated in the study. Follows a review of service experience from examinationsof dissimilar metal welds after elevated temperature service, in particular failed welds.Resuils of laboratory tests performed for reproducing service failures are then disscussed.
A further section is devoted to a review of test results on fatigue behaviour and impacttoughness for dissimilar metal welded joints when creep is not significant. Finally, theproblem of residual life assessment is addressed.
A set of recommendations concludes the report. They concern tbe material selection,welding procedure, life prediction and testing of dissimilar metal welds.
21
Crutzen, Engl, on the PISC 1H ...
THE PISC III PROGRAMME - A STATUS REPORT(December 1991)
S. CrutzenCEC, Joint Research Centre, Ispra EstablishmentIspra, (larese)
G. EnglSiemensKWUErlangen
ABSTRACT
The PISC programme is presently in its third phase: PISC III, which involvesseveral actions dealing with :
- expertise on real defects;evaluation of the effectiveness and reliability of NDE procedures when appliedon : full scale pressure vessels, safe-ends, stainless steel piping welds, steamgenerator tubes;
- validation of mathematical models;- identification and evaluation of human factors.
This third phase is also a validation exercise of the second one (PISC II) on heavysteel sections inspection. Final reports will not be ready before October 1993.
INTRODUCTION
The PISC Programme has the general objective of assessing procedures andtechniques in use for the inspection of pressure components (in particular the vesseland piping).
The Series of projects for the Inspection of Steel Components carried out since1974 under the auspices of the CEC/JRC and the OECD/NEA is a major internationaleffort to better assess the capability and reliability of Non-Destructive Inspectionprocedures of structural components.
The Ispra Joint Research Centre which, in its roles of Operating Agent andReference Laboratory, manages the programme and provides with the participants ofEC countries approximately 60% of the programme funding, the other 40% come viacontributions in kind from the non-EC participating countries. OECD/NEA providesthe Secretariat of the PISC Managing Board, consisting of representatives of 14countries (8 EC and 6 non-EC countries).
The programme is now in its third phase (PISC III); the activities concentrate onthe validation of the PISC II results (e.g. modification of the ASME Inspection Codes)on real structures containing service defects and the extension of the PISCmethodology to most important structural components made of different materials.Most of the PISC test assemblies and structured pieces are representative of (or arecoming from) nuclear reactor components.
22
Crutzen, Engl, on the PISC III....
PROGRAMME RESULTS
PISC I results showed shortcomings of some usual industrial ISI procedures;PISC I was in fact analysing the existing ASME 1974/1977 procedure [1]. PISC IIRRT results [2] (as well as some trials of PISC I) showed that:
a) improvement of the usual industrial NDE was possible; consequently,some changes of the ASME procedure were proposed: i) 20% DACinstead of 50% DAC; ii) use of techniques adapted to the defects to bedetected: e.g. "0 deg SEL probes;
b) several ISI procedures existed that met the requirements; for suchprocedures, no change was obviously required; optimization from aneconomic industrial reliability point of view was however necessary.
PISC II parametric studies on the effect of defect characteristics [3] showed theimportance of defect parameters like the type of defects (planar or volumetric, FigureI), the crack tip aspect, the position in depth, the angular position and the surfaceroughness These results were in fact the exact quantification of the trends shown bythe PISC II RRT on welded assemblies. As a conclusion, it was understood that,compared to the welded assemblies, the blocks fabricated for the PISC parametricstudies and containing cheap "realistic" artificial defects were good and even oftenconservative for the performance evaluation of NDE techniques in thick walledcomponents.
In 1986 in light of the PISC results, the US ASME Boiler and Pressure VesselCode Section XI was modified to reduce the recording level to 20% DAC and torequire 70° longitudinal wave probes.
Work in the US and elsewhere together with the results of PISC have establishedthe unreliability of ultrasonic testing and the need to achieve improvement in inspectionreliability [4 to 13]. One means to achieve the needed improvements is "performancedemonstration". The studies mentioned above established that performancedemonstration could be applied effectively and economically.
The ASME Section XI Code, in 1990, introduced a new Appendix VIII to codifyperformance demonstration as a means of improving inspection reliability, similarapproaches have and are being pursued in several other countries. The experience andexpertise developed in the PISC exercises can contribute significantly to thedevelopment and implementation of this concept of performance demonstration [14].
PISC m PROGRAMME STATUS
PISC III, the third phase of the PISC series insists on the capability demonstrationwith assemblies of real geometry containing realistic defects. The PISC methodology isalso extended to all major parts of the primary circuit of the LWR reactors. Moreover,the work done on the austenitic steel testing is of real value for the inspection ofLMFBR components. Eight programme Actions have been established. They areidentified in the Organization Scheme (Table I).
The present stage of PISC III work is that Round Robin Testing activities havebeen or are presently being performed in several of the PISC III Actions. The finalwork to be undertaken in all the eight Actions has been defined and most of thenecessary test samples and other resources have been obtained. The uncertainties thatprevailed during 1986/87 concerning the level of budgetary support have partly been
23
Crutzen, Engl, on the PISC III...
resolved by accepting delays for the AST (Austenitic Steel Testing) and for the SGT(Steam Generators Tubes Testing) actions. Resources from the CEC and fromparticipating organisations (participation in inspection, and contributions in kind) arenow assured to carry out the essential elements of most of the planned actions.
The objectives of each of these eight Actions of PISC III the status of work andthe expected implications on Licensing concerning Regulatory and Code type Attitudesare as follows.
Action No 1 (Real Contaminated Structures) seeks to collect results fromspecific investigations and limited round robin tests (RRT) on real service induceddefects in materials and structures of the primary circuit of light water reactors(LWRs) The hot cell facilities at JRC-Ispra are fully equipped for non-destructive anddestructive work on a collaborative basis.
Contaminated and cracked austenitic steel of primary circuit pipes fromSwitzerland have been inspected to give a full demonstration of the whole resourcesavailable [15].
Further samples are available from Spain, Sweden, USA and Finland. Several ofthese components, after certification in the PISC hot cells, have been allocated to theReliability exercise of Action 4 (Austenitic Steel Testing).
An important objective of Action 1 is the study of real defects from an NDTresponse point of view with the hope to establish a correlation between real andartificial realistic defects. The validity of test assemblies and of mock-ups depend onthe realism of the defects artificially introduced. The chances to improve NDTperformance at reasonable costs depend in part on the possibility to introduce defectsin test assemblies which would be absolutely artificial for possible parametrization andcost control. These artificial defects called "realistic" must produce the same physicalphenomena as the real ones for the NDT technique considered and thus appear as realdefects to the operator.
The "design" of realistic defects can only rely on a defectology study of damagedcomponents coming from plants which have been operated so that the components arecontaminated.
These PISC facilities installed for NDT performance appraisal in genera)(presently at JRC Ispra and at JRC Petten) provide also PISC members with thepossibility of expertise on real damaged structures and this service could be of help forother OECD and CEC programmes such as TMI.
Action No. 2 (Full Scale Vessel Tests) validates the results obtained byprocedures in the PISC II exercise but using more realistic inspection conditions.
The Full Scale Vessel (FSV) funded by the Federal Minister for Research andDevelopment (BMFT) and installed at the Staatliche Materialprufungsanstalt (MPA),Universitat Stuttgart, Germany is being, used. It is made of a BWR full scale vessel towhich have been added modular full scale PWR components. Nine teams participatedfrom 1988 to 1990 in Phase 1 concerning the sizing of selected defects in order toestablish the capability of sizing techniques; sizing results from the German nationalprogramme are also included.
Eight organizations participated in Phase 2. This phase was aimed at the validationof ASME type procedures by an international team using an ISI automatic scanner
24
Crutzen, Engl, on the PISC III....
base material, the weld and several natural flaws (exclusion is made of the PWRcomponents which were built in 1987 and 1988)
Action No. 3 (Nozzles and Dissimilar Metal Welds) completed in March 1991The round robin tests of 4 safe-ends representing some of the most difficult technicalaspects of In-Service-Inspection. In this work a Japanese-Italian BWR assembly ofnozzle plus safe-end, an American BWR assembly with two nozzles and safe-ends anda Spanish PWR safe-end were inspected in 13 countries (Figure 3).
The results so far evaluated by the PISC data analysis group show that thecapability exists for effective inspection of the configurations considered. Howeversome flaws characterized more by their position in the assembly (located in castmaterial like weld or buttering) than by their morphology present difficulties for theirdetection. The outcome of the exercise is likely to discuss four features.
- identification of capable techniques for defects detection and sizing;- indications on the most difficult cases to consider for exercises and or
performance demonstration mock-ups and on the way to manufacturesuch mock-ups at low costs;
- evaluation of the false calls probabilities and their justification: one ofthe safe-ends was free of any intentional defects:
- due to the realism of Assembly 20; its materials characteristics (basematerial defects of the 1970s); its weld realism (usual industrialautomatic and manual welding of the 1970s) information of value isgenerated in view of plant life management and plant life extension. Itattacks the problem of whether NDT has the capability to provide theLicensing Authority with a well documented status of the structure.
Action No. 4 (Austenitic Steel Testing) applies the PISC II methodology to theprimary circuit piping of LWRs. Round robin tests for the capability assessment andparametric studies started in 1990; some reliability evaluation of the testing procedureswill be considered [17]. Wrought pipe samples were offered by the USA, Japan andFrance, moreover, large cast samples have been ordered by JRC {Figure 4). Twentyfive teams have registered their intent to participate in one or more phases that willextend into 1992. Large assembbes are still in fabrication for the RRTon cast austeniticsteel
The programming of this Action No. 4 of PISC III suffered very much because ofthe non-timely availability of resources necessary to gather the raw material,manufacture assemblies and introduce real and realistic defects. The orders placed toget material were also executed with long delays due to the character of these orders:small quantities (5000 Kg.) of "exceptional castings". As a result this Action has failedsome 18 months behind the planned schedule.
The criteria used in the design of this action are similar or even more elaboratedthan those considered for Action 3. Safe-end Inspection. It is thus hoped to get asubstantial impact of Action 4 for the improvement of Codes and Practice for theinspection of Austenitic Steel Components in general; wrought or cast.
Action No. S (Steam Generator Tubes Tcstiire) involves in its present phaseround robin tests of individual tubes of steam generators containing realistic andartificial defects. The PISC Management Board has carried out a reassessment of thetechnical details to be considered taking into account the results coming from the Surrysteam generator studies in the USA. Preparatory work to acquire tubes and introduce
26
Crutzen, Engl, on the PISC III .
and validate defects has been carried out from April 1988 to October 1989 (tubes withdefects have been obtained from France, Japan, UK, the Netherlands and the UnitedStates). The Management Board has received advice from CSN1 (Principal WorkingGroup on Primary Circuit Integrity) on the defects types and characteristics of mostimportance with respect to safe operation. Thirty teams from 11 countries willparticipate in the RRT planned until 1993. The validation of defects has involvedexperts of Belgium, France, Germany, Italy, Japan, Spain, United Kingdom and UnitedStates of America. The Reference Laboratory (JRC Ispra) is preparing many artificialdefects in tubes Orders have been placed from the Operating Agent to get realisticcorrosion defects by CEA, MITSUBISHI, CEGB, KEMA
Emphasis has been put on corrosion defects (IGA, SWSCC, PWSCC) at three keylocations: Tube Sheet (above the rolbng zone), Tube Support Plates, U-bend transition[18].
The RRT started in January 1990 (figure 5). The particular character of this actionwith training boxes containing artificial but realistic defects with all information onpresence, location, size, characteristics, ET signals, given by the reference laboratory,is welcome by the participants and appears to be an effective demonstrative exercise onthe validity of performance demonstration.
Evaluation of results as discussed by the group of specialists of Action 5 leads to abetter understanding and perhaps harmonization of acceptance (plugging) criteria, atpresent, for the scope of results presentation only.
Action No. 6 (Mathematical Modelling on NDE) has the objective to validateexperimentally mathematical models and perform parametric studies in order to assessthe importance of defect characteristics. Sixteen organizations in eight countries haveregistered their intent to participate in studies to assess mathematical models ofultrasonic inspection by validating the models with experiment and assessing the utilityof these models in terms of limits of valid application, satisfactory and efficientcomputer performance and accuracy. Fifteen models have been offered for possiblestudy. An important objective is to promote the practical application of models as anaid to more effective and efficient inspection procedures and interpretation of results.The Modelling Group of PISC III has selected (April 1989) three models that werestudied by the Reference Lab for validation in 1989 (2 UK and 1 German models) aswell as models to be studied in 1990 and in 1991 (1 UK and 2 French ones) [19].
Parametric studies are an essential source of data for verifying models; the studiescommenced in PISC II have been extended in PISC III, four reports on the effect ofdefect characteristics on the ultrasonic signal response, one report on the effects of thecladding and two reports on the effects of the equipment characteristics are completed.This work was carried out in the United Kingdom, France, Belgium, Italy and at theJRC-Ispra.
The validation of the three first models has given now the assurance that modelscan be used to replace experiments (in some well limited conditions) withoutimperfections or errors due to the transducer characteristics, to the various calibrationsand normalization operations, to the imperfection of artificial defects, onto thesecondary effects like wave mode transformation often depending on defects sizes.
The Modelling Group of PISC III has decided to start new studies :
- calculation of the tip (edge) signals from smooth ultrasonic reflectors;
27
Crutzen, Engl, on the PISC ID....
- prediction of the signals detected from a smooth crack very close to thesurface.
These studies are validating the approach of the realistic defects (artificial) insimple blocks for techniques capability verification.
A further step already considered outside of the Nuclear Industry is the use ofmodels for inspection procedures capability evaluation and hence performanceverification (CEC-BRITE).
Action ftp. 7 (ffuman Reliability Studies) seeks to evaluate the influence ofhuman interpretation of inspection results, equipment malfunctions and humaninteraction on the overall inspection procedure.
Perhaps the most important result obtained in the recent reappraisal of the PISC IIresults was that UT effectiveness was dominated by human reliability aspects [20].Different teams using the same techniques and procedures could produce consistentlydifferent results and this difference accounted for much of the considerable scatter ineffectiveness. Analyses of the reasons for such differences are still in progress as part ofthe PISC III programme, bet an important parameter is thought to be that of theattitude of the management of the inspection team. This reveals an important area forthe attention of Regulatory inspectors, as well as stressing the need for personnelcertification and quality control of the inspection process itself.
Other systematic observations are being carried out at Risley UKAEA through theinspection by industrial UT operators of special assemblies and components used inPISC Actions {Figure 6). Some of them are inspected under conditions reproducingpractical industrial reality such as temperature, humidity and time constraints in amobile laboratory. The detailed objectives of this Action are as follows [21]:
- to study and identify the causes of variability between inspectors incalibrating their equipment, inspecting defective components andinterpreting ultrasonic data in clean, laboratory-type inspectionconditions;
- to study the influence of industrial inspection conditions on inspectionperformance to identify the significant factors and to aid the developmentof relevant safeguards.
Present results show the dominating influence of human factors when comparedwith the one of equipment, procedure or even defect characteristics. It is expected thatthe unreliability of inspection will often depend for more than 50% on the humanattitude. An essential move is the one of automatisation of inspections and eliminationof human influence even for equipment setting.
The PISC HI programme will thus give information on the best ways to carry outsuch assessment of human reliability and will direct attention to the key factors thatinfluence it. In particular, the PISC ED work can give initial indications on the relevantparameters to be observed, on the way to make economically appropriate specimens,on the use of medical/observational techniques and on the development of special testsand simulation exercises.
Another aspect emphasised by this work is the need for careful regulatoryspecifications of the quality observance aspects of personnel participating in ISI and ofthe surveillance needed to ensure that site-application effectively reproduces thetechniques used in the Procedure Demonstration work.
28
Crutzen, Engl, on the PISC III....
Action No. 8 (Support to Code and Standard C/S Organizations) proposedby the Management Board and approved by OECD-NEA and CEC-JRC gives directsupport through the PISC group of experts to C/S organizations. Such a proposal hasbeen supported by all PISC members and involves three aspects :
- Informing the relevant Codes and Standards Technical Committees ofPISC results and PISC related programme results.
- Critical rev/ew1 by PISC members of technical documents on request fromnational and international technical groups.
- Preparation of technical reports by PISC members related to Codes andStandards problems, for the benefit of National, CEN, ISO and IIWtechnical groups which elaborate standards.
The organization and support of Action 8, involves mainly the Operating Agent.
THE CONTRIBUTION OF PISC TO NDT PERFORMANCE DEMONSTRATION
As mentioned earlier, an approach which has great potential for encouraging theimprovement of NDT effectiveness is that of performance demonstration. Such aconcept has been worked on in USA for several years and a similar concept ofInspection Validation was recommended by the UK Marshall Committee [22] [23]. Inother countries including Germany, France and Japan specific examples ofperformance demonstration have been developed. The results of PISC have givenmajor encouragement to the further use of performance demonstration, both byemphasising the need for ensuring effective procedures and by demonstrating howsuch performance demonstration and its associated test assemblies can be achievedeffectively and economically [24].
Inspection techniques are or will soon be able to furnish in a reliable way theinformation needed for the structural integrity assessment of "Status of the structure"considering the presence, location, size and characteristics of defects. Such informationis relevant to Structural Integrity Assessment and thus to Plant Life Management.
The effectiveness and reliability of future inspections will depend very much onthe way in which "performance demonstration" is used both as a Quality Assurancetool and as a Harmonisation tool. From the PISC exercises, it appears that the firstquestion to be raised is whether, the inspection techniques proposed are intrinsicallycapable of the desired effectiveness. A critical aspect of assessing inspection capabilityby performance demonstration is the ability to propose appropriate and affordable testpieces to be used in the procedure demonstration of the inspection techniques. With aview to the inspection teams and the various techniques, such test pieces have tocontain defects which simulate both commonly occurring situations as well as thosesimilar to limiting cases that could be imagined during actual plant inspections. Onesolution, which has been attempted several times, is to accumulate samples removedfrom actual structures containing real defects; the objection to these however is thatthey always represent particular cases, which are possibly not the worst nor the mostdifficult that could arise in reality. An alternative or complementary approach is todesign and manufacture in realistic assemblies artificial defects which produce the samephysical phenomena as those from conservative real defects for the specific NDTtechnique considered. Some advantages of this latter approach are:
- the possibility of more certain characterisation;
29
Crutzen, Engl, on the PISC III...
- possible parametrization of the tests, including the provision of limitingcases;
-possible guickaice to experimenters for better understanding;- non-contaminated assemblies used for effectiveness assessment;- more relevant selection of structural geometry and material.
To be convincing, however, this second approach must demonstrate a goodcorrelation between the artificial "realistic" defects and a large number of realsituations.
The PISC II methodology has led to considerable development in this secondapproach and i*s results have throughout been associated with this approach. Theexperience of PISC II showed that using appropriate methods, artificial "realisticdefects" introduced in blocks and structures can provide affordable and reproducibledemonstration test samples [25],
Mathematical models, involving a better understanding of the physicalphenomena, indicate which artificial defects can be used to replace natural ones for thevalidating of NDT techniques and the training of inspection teams.
Experience and expertise in fabricating effective test blocks and in conductingblind capability tests have been developed in the PISC programme [14][24]. Thisexperience and expertise can contribute significantly to the implementation ofPerformance Demonstration in areas such as:
- simplified performance demonstration procedures based on simple testblocks;
- large coverage of possible cases by the use of artificial realistic defects(based on PISC knoM'-how) instead of only the particular cases that canbe covered by real defects;
- lower cost of assemblies by an order of magnitude;- the possibility of using identical approaches for performance demons-
tration at three levels• plant owner for its own verification• inspection company to validate its procedure:• licensing/regulatory authority or its agents to verify Safety targets;
- possibility to develop, within the PISC network of laboratories, a longstanding capability of using third parties for manufacturing of blocks anddefects, combining reproducibility of repeated similar samples withconfidentiality and the "double blind" approach.
• interpretation of inspection results (i.e. how to handle false calls versesmislocations, etc.).
Three applications of the general principle of Performance Demonstration resultfrom the PISC Round Robin Tests:
A. Use of thick steel section blocks containing well specified realistic defects tocertify the capability of inspection techniques for thick walled pressure vessels.The typical case is the one of LWR pressure vessels and the defects can beintroduced by special low cost machining.
B Certification of Steam Generator tubes inspection with Eddy Current Testing orUltrasonic Testing The various defects tested during the PISC RRT are suitablefor the evaluation and verification of the inspection techniques capability forcorrosion defects (PWSCC, SWSCC, IGA, ..) in the different types of alloys
30
Crutzen, Engl, on the PISC III....
used in the past (Inconel 600) or for the new steam generators (Inconel 690,Incaloy 800).
C. Piping testing certification or thin walled pressure vessels inspection certification:a. Welds sections in austenitic steel piping of four categories:
- wrought-to-wrought welded assemblies which pose inspection problemswhen defects are present or propagating in the weld material;
- wrought-to-cast welded assemblies which pose problems when defectsare in the weld or in the cast material which is often characterized by avery important texture;
- cast to-cast welded assemblies generally very difficult to be inspected;- dissimilar metal welds generally assembling up to four different metal
structures/textures and thus combining the diffictdt situations of thethree preceding cases.
The exercise now ended on Safe-ends inspection has given sufficient knowhow to define the necessary performance demonstration mock-ups in eachof the four cases here above.
b. Simplified validation blocks like the ones described above but made ofcarbon steel would be relevant to thin walled pressure vessels.
Application C on piping and simple vessels is not limited to nuclear applicationsbut is more general. It would provide the industrial welding industry with a simple toolfor the "Harmonization" of Inspection Codes and Standards and thus would be a realcontribution for the availability of Standards concerning the replacement ofcomponents. Similarly in many cases of piping, pipe welds, piping components (e.g.elbows, straight sections, per>etrations, nozzles), valve casings, and simple pressurevessels, the PISC RRT on "Safe-Ends" and on Piping has shown how to fabricaterealistic simple assemblies which would properly simulate difficult industrialinspections. In this way Performance Demonstration or Validation or Certification orsimply capability evaluation of inspection techniques can be easily organized by PISCor by others using the PISC know how.
Such assemblies containing realistic artificial defects are also ideal samples onwhich inspection procedures can be optimised and personnel can be chosen and trainedso as to reach the necessary performance with a reduced number of techniques andtherefore a reduced inspection effort.
REFERENCES
[1] Crutzen, S.. PISC I and PISC II Looking for effective and reliable inspectionprocedures. Nucl. Eng. and Design, Vol 86(1985), 197.218, Art. 25948.
[2] Crutzen, S., Jehenson, P., Nichols, R.W., McDonald, N.. The Major Resultsof the PISC II RRT. Nucl. Eng. and Design, Vol 115 (1989), 7.21.
[3] Crutzen, S., Certo, M., Dombret, Ph., Murgatroyd, R.. Summary of the PISCParametric Studies on the Effect of Defects Characteristics (EDC). PISC III ReportNo. 8, OECD-CEC, 1989.
[4] Chockie, L.J. 1980. PVRC Round Robin Ultrasonic Program, Results andAssessment of Reliability, Proceedings of Third International Conference on NDE inthe Nuclear Industry, Salt Lake City, Utah, American Society for Metals.
31
Crutzen, Engl, on the PISC in. . .
[5] Commission of the European Communities. 1979. Report on Plate InspectionSteering Committee (PISC-I), EHR-6371 (Vols. I-V), Brussels, Luxembourg.
[6) Doctor, S.R., Becker, F.L., and Selby. G.P. 1982. Effectiveness andReliability of U.S. Inservice Inspection Techniques, Periodic Inspection of PressurizedComponents, I. Mech. E Conf. Pub. 1982-9. Institute of Mechanical Engineering,London, England.
[7] Doctor, S.R., Becker, F.L., Heasler, P.G. and Selby G.P. 1984. Effectivenessof U.S. Inservice Inspection Techniques: A Round Robin Test, in Defect Detectionand Sizing, Proceedings of a Specialist Meeting, Vol. II. CSNI Report No. 75, JointResearch Centre, Ispra-Establishment, Varese, Italy pp. 669-678.
[8] Heasler, P.G., Bates, D.J., Taylor T.T., Doctor S.R. 1986. PerformanceDemonstration Tests for Detection of Intergranular Stress Corrosion Cracking.NUREG/CR-4464, PNL-5705, prepared by Pacific Northwest Laboratory for the U.S.Nuclear Regulatory Commission, Washington D.C.
[9] Nichols R.W. 1987. A review of work related to defining the reliability ofNDT. Final Report CEC Contract No. ECI-I460-B-7221-86 UK, (November 1987).
[10] Benoist, Ph. and al, Joint programme on detection and sizing of defects withUT and RT. Proc. 7th Int.Conf. on NDE in the Nuclear Industry, Grenoble (1985).
[11] Watkins, B. RRT in the Reliability of Thick Section UT. CSNI Report No.130 (March 1987).
[12] Foerli, O. and Pettersen, B. The unreliability of NDE. EURO NDT 87,Conference, London (Sept. 1987).
[13] Kauppinen, P. and Sillanpaa Reliability of Surface Inspection Methods.Proc. 12th World Conf. on NDT. Amsterdam (April 1989).
[14] Cowfer, CD.. Basis/Background for ASME Code Section ProposedAppendix VIII : Ultrasonic Examination Performance Demonstration. ASME, 1989ASME Pressure Vessels and Piping Conference (NDE, Vol. 5) Honolulu, July 23-27,1989.
[15] Cambini, M.,Crutzen, S., Jehenson, P.; Investigation on Field Removed PipeSections in the PISC Laboratories Hot. 10th Int. Conf on NDE, Glasgow June 11-14,1990.
[16] Crutzen S.; Herkenrath H.,Kussmaul K.; and Mletzko U.; Full Scale ISIWithin the FRV Action of PISC, III. SMIRT Post Conference Seminar No. 2, Taipei,Taiwan (August 1991).
[17] Doctor, S., Herkenrath, H.. The PISC III Austenitic Steel Piping Testingprogram and Assemblies. 10th Int. Conf. on NDE, Glasgow June 11-14 1990
[18] Birac, C , Herkenrath, H Miyake, Y., Maciga, G.. The Steam GeneratorProgram of PISC III. 10th Int. Conf. on NDE, Glasgow June 11-14, 1990.
[19] Schmitz, V., Coffey, J., Lakestani, F.. The Models Validation Work in PISCID. 10th Int. Conf on NDE, Glasgow June 11-14,1990
[20] Mugatroyd R., Crutzen, S., Vinche, C , Seed, H.. Retrospective Analysis ofPISC II Plate No. 3 Inspection. NDE in the Nuclear Industry, 9th InternationalConference ASM, Tokyo, April 25-28
32
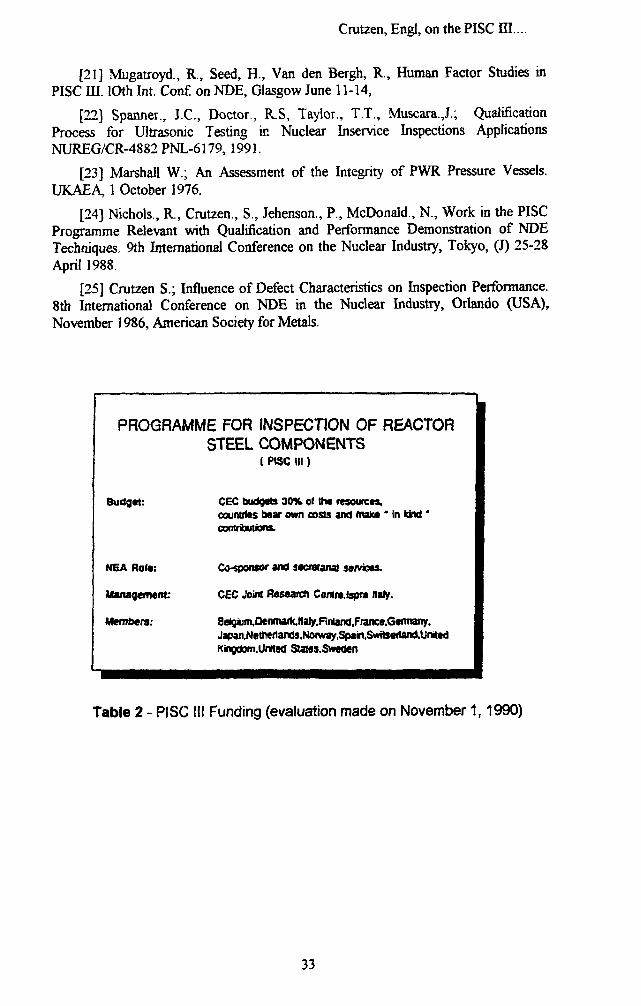
Crutzen, EngI, on the PISC HI...
[21] Mugatroyd., R., Seed, H., Van den Bergh, R , Human Factor Studies inPISC III. 10th Int. Conf. on NDE, Glasgow June 11-14,
[22] Spanner., J.C., Doctor., R.S, Taylor., T.T., Muscara.,1; QualificationProcess for Ultrasonic Testing in Nuclear Inservice Inspections ApplicationsNUREG/CR-4882 PNL-6179, 1991.
[23] Marshall W.; An Assessment of the Integrity of PWR Pressure Vessels.UKAEA, 1 October 1976.
[24] Nichols., R., Crutzen., S., Jehenson., P., McDonald., N., Work in the PISCProgramme Relevant with Qualification and Performance Demonstration of NDETechniques. 9th International Conference on the Nuclear Industry, Tokyo, (J) 25-28April 1988.
[25] Crutzen S.; Influence of Defect Characteristics on Inspection Performance.8th International Conference on NDE in the Nuclear Industry, Orlando (USA),November 1986, American Society for Metals.
PROGRAMME FOR INSPECTION OF REACTORSTEEL COMPONENTS
( PISC 111)
Budget:
NEA Roto:
Management:
Members:
CEC budgets 30% or the resources,countries bear own costs and mate* * In kind *contriwiions.
Co-sponsor and secretarial services.
CEC Joint Research Centre, (spra Italy.
8etg«jm,Denmark,ltaJy.RnlantJ,Fiance.Gem«ny.Japan^etrierlands.Norway,Spairt.SviritsefUrid.UrMedKingoom.Unrtsd States.Sweden
Table 2 - PISC 111 Funding (evaluation made on November 1,1990)
33
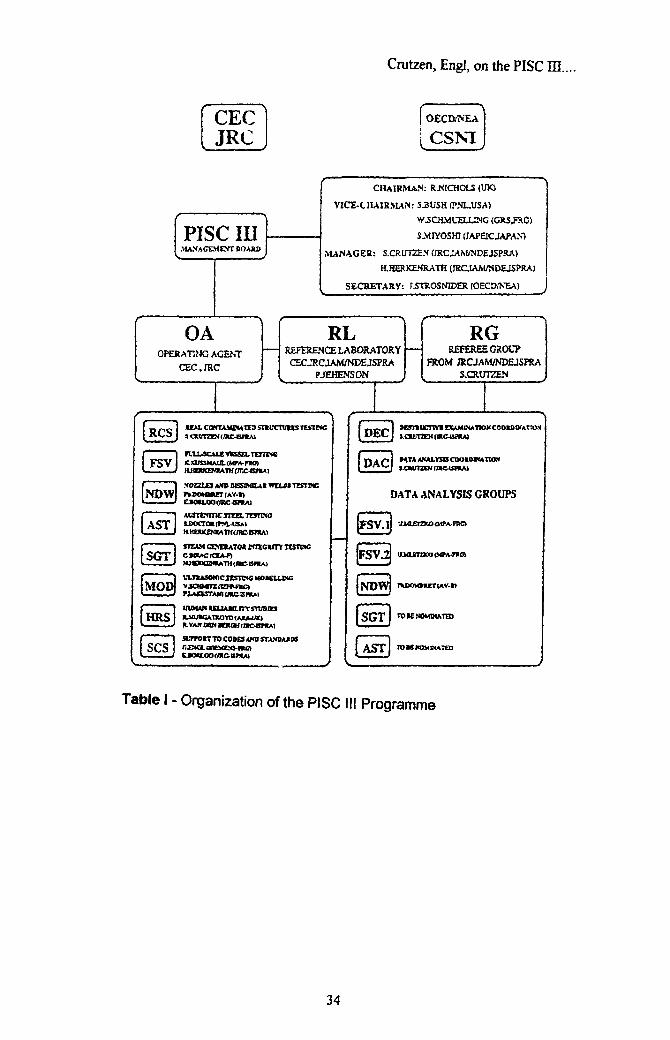
Crutzen, Engl, on the PISC ID.
CECJRC
j OECD/NEA I
[CSNIJ
PISC IDMANAGEMENT DOAKD
CHAIRMAN: RiflCHOLS (UK5
VICE-CHAIRMAN: S3VSH (?NL.USA>
W-SCHMUELUNG (GRS.FXO>
S.MIYOSHI (JAP3C JAPAN)
MANAGER: S.CRUTZEX (JRCJAM/NDEJSPRA)
H.HESKEHRATH (IRCIAAC/NDEJSPRAJ
SECRETARY: r.STOOSNIDER (OECD/KEA)
OAOPERATING AGENT
CEC.JRC
RLREFERENCE LABORATORY
CECJRCJAM/NDEJSPRA
PJEHENSON
RGREfEREEGROCP
FROM JRCJAM/>O5EJSPRA
S.OttrrZEN
UALCCWMMDMTiasntUCniUSTESIMC
ltXIIBMAUHII»*niO)
^^D^v
UXXT0ft<K<I.-tS*l
SGT
MOD
[HRS
SCS
JTIAM CIM3U7OI mECIUTT TICTWC
n-nuaotnc junnc MOKUKC
FIAOSTAMI imc-ontAt
UUMU< unjAicrrr JTODIO
wrroirr TO CODES ArtnfrANVMnsCXMCLCSEMCHl-fKO
DEC
DAC
M5nilCnVI CUMMAHOH COOlDtXj
»HXA AHALVta a x w o t u n o N
DATA ANALYSIS GROUPS
SV.lj '•'-
FSVJ
iNDW
l u a x n x o (MTA-mra
1 AST TOIt NOMINATED
Table I - Organization of the PISC III Programme
34
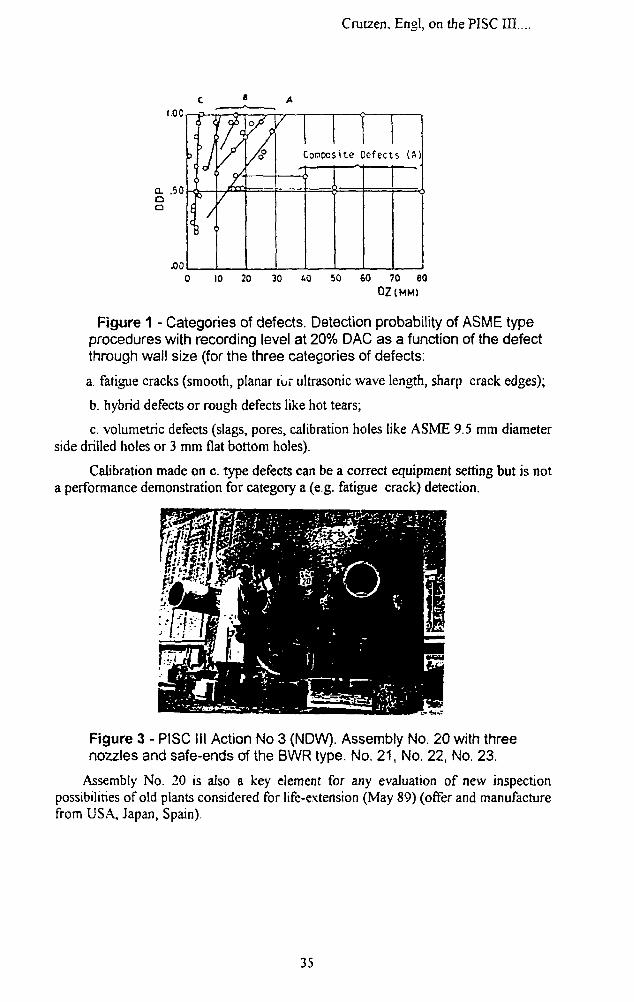
Crutzen, Engl, on the PISC ID....
JOO10 20 30 40 50 60 70 60
OZ(MM)
Figure 1 - Categories of defects. Detection probability of ASME typeprocedures with recording level at 20% DAC as a function of the defectthrough wall size (for the three categories of defects:
a. fatigue cracks (smooth, planar iur ultrasonic wave length, sharp crack edges);
b. hybrid defects or rough defects like hot tears;
c. volumetric defects (slags, pores, calibration holes like ASME 9.5 mm diameterside drilled holes or 3 mm flat bottom holes).
Calibration made on c. type defects can be a correct equipment setting but is nota performance demonstration for category a (e.g. fatigue crack) detection.
Figure 3 - PISC III Action No 3 (NDW). Assembly No. 20 with threenozzles and safe-ends of the BWR type. No. 21, No. 22, No. 23.
Assembly No. 20 is also a key element for any evaluation of new inspectionpossibilities of old plants considered for life-extension (May 89) (offer and manufacturefrom USA, Japan, Spain).
35
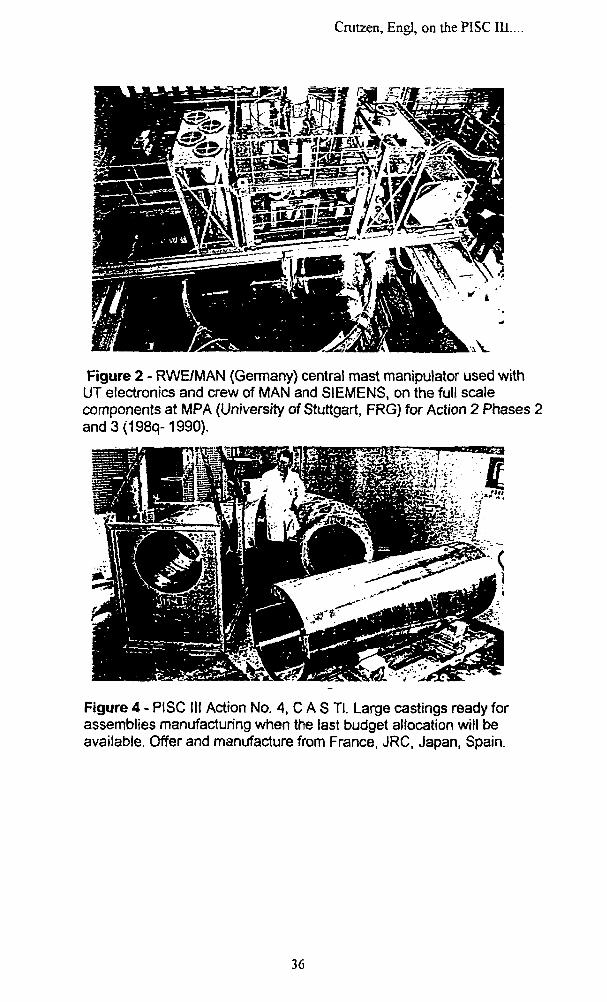
Crutzen, Engl, on the PISC 111.
Figure 2 - RWE/MAN (Germany) central mast manipulator used withUT electronics and crew of MAN and SIEMENS, on the full scalecomponents at MPA (University of Stuttgart, FRG) for Action 2 Phases 2and3(198q-1990).
Figure 4 - PISC III Action No. 4, C A S Tl. Large castings ready forassemblies manufacturing when the last budget allocation will beavailable. Offer and manufacture from France, JRC, Japan, Spain.
36
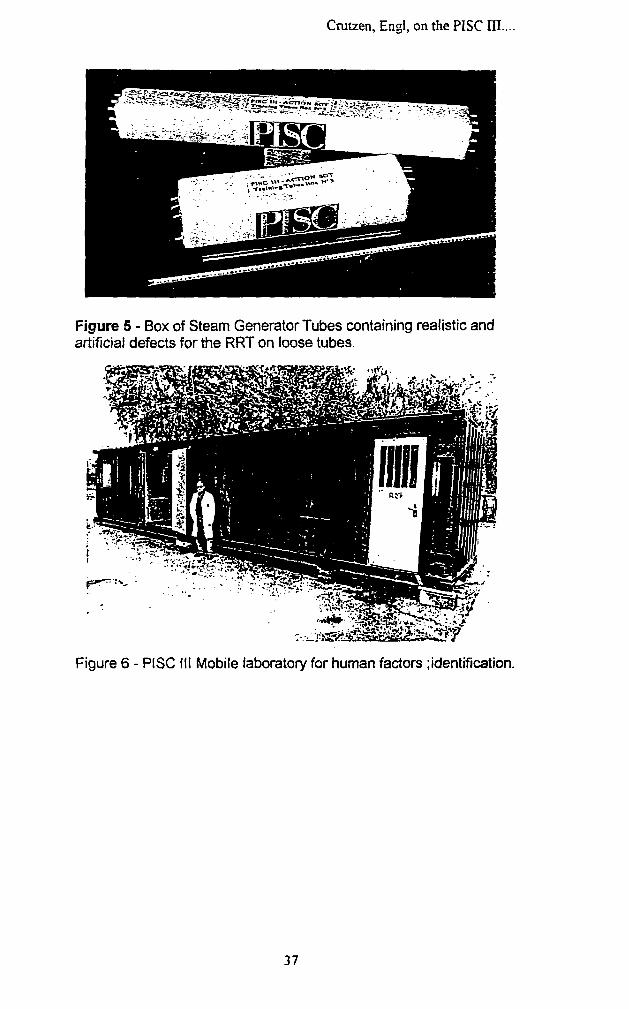
Crutzen, Engl, on the PISC EL.
Figure 5 - Box of Steam Generator Tubes containing realistic andartificial defects for the RRT on loose tubes.
Figure 6 - PISC III Mobile laboratory for human factors ;identification.
37
Hiser, Wichman on USNRC Plans on Inad....
OVERVIEW OF USNRC PLANS ON IRRADIATIONEMBRITTLEMENT CORRELATIONS (REG. GUIDE 1.99)
Prepared by: Allen L. Hiser, Jr.Presented by:Keith WichmanOffice of Nuclear Reactor RegulationUS Nuclear Regulatory Commission
Viewgraph 1. OVERVIEW OF RESEARCH PROGRAM
• New research program entitled"Improved Irradiation Embrittlement Correlations"
• Contractor is Modeling & Computing Services, located in Newark, California• Principal Investigator is Dr. E. Eason• Program initiated March 1992, to end March 1995
- Statistical work to be complete early 1994• Program Objectives
- Develop improved correlations for estimating irradiation embrittlement ofRPVsteeis, both transition temperature shift and upper shelf drop.
- Incorporate results into regulatory documents as appropriate (Reg. Guide1.99 and PTS Rule 10 CFR 50.61).
Viewgraph 2. IMPROVED IRRADIATION EMBRTTTLEMENT CORRELATIONS
TASK 1 : Working Database Development
TASK 2: Statistical Analysis of Data
TASK 3: Assistance to NRC Staff-incorporating results into regulatory documents
Viewgraph 3. SCOPE
• Establish a "working" irradiation embrittlement data base- US surveillance data (PR-EDB at ORNL)- US test reactor data collected by ORNL- Collect non-US surveillance and test reactor data- Russian data
• Apply advanced statistical methods (Pattern Recognition) to determine the criticalparameters and relationships between parameters for predictingirradiationembrittlement
• Calibrate the parameters using available irradiation data; analyses wii! be done withall data, and with only US data to detect any statistical bias.
Viewgraph 4. INDEPENDENT VARIABLES CONSIDERED
Material Type: Base Metal or WeldIrradiation Parameters: fluence, T|, t|, ATT|Annealing Parameters: T a , t a , ATTa
Chemistry: Cu, Ni, P, S, Si, Cr, Mo, MnCharpy Test Results: T(C v = 30), CVUSE
38
Hiser, Wichman on USNRC Plans on Irrad....
Viewgraph 5. MODEL VARIABLES
• Proposed Dependent Variables
- Entire Cv_ vs. Temperature curve-Transition Temperature Shift (@_ 30/t-Ib) due to irradiation-Upper Shelf Energy Drop due to irradiation
• Independent Variables To Be Considered:
- Material Type (Weld, Base metal)- Fluence, Flux- Irradiation Temperature- Chemical Composition- Mechanical Properties
Viewgraph 6. ANALYSIS APPROACH
• Identify correlations among independent variables• Pattern recognition and transformation analysis
- Rank variable importance- Determine functional forms for important variables
• Surface fit to models, using non-linear least squares• Analysis approach used previously to correlate J-R curve data with Charpy
upper shelf energy, chemistry and fluence (NUREG/CR-5729, May 1991 )• Analysis approach used recently with US annealing recovery data, to support
Yankee Rowe review- Preliminary letter report submitted in June- Looking to increase data base from non-US sources- Will publish a final report using all available data
Viewgraph 7. EVALUATION OF ANNEALING RECOVERY DATA
• US test reactor data, principally, building on Macdonald data base +
• Final model had PERCENT RECOVERY as a function of- Annealing Time- Annealing Temperature- Irradiation Time- Irradiation Temperature- Copper Content- Irradiation-induced Shift
• No statistical difference between weld and base metal+ ASTM STP 870
39
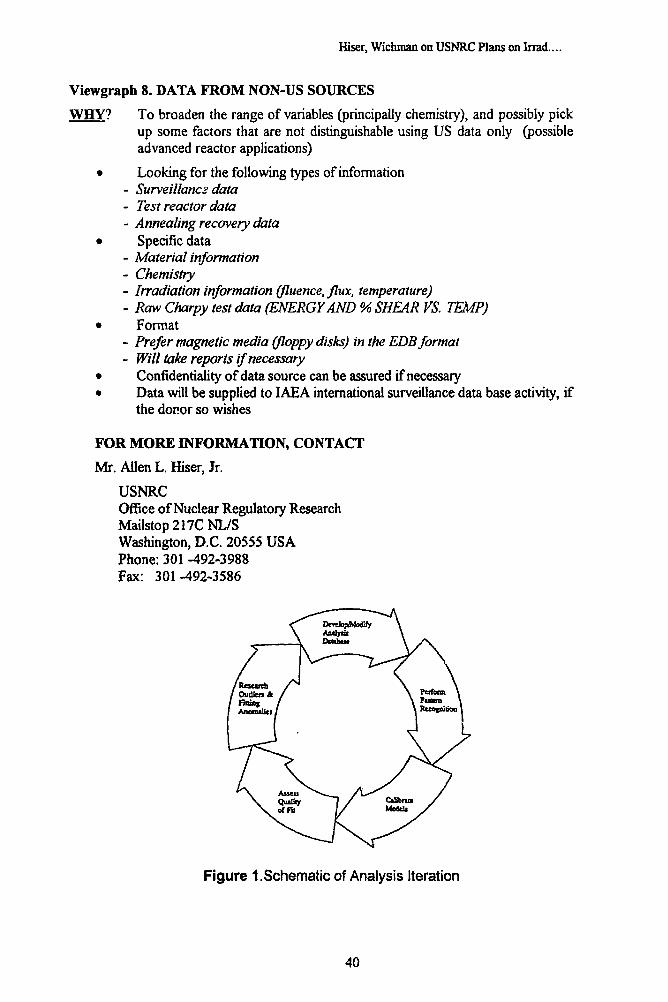
Hiser, Wichman on USNRC Plans on Irrad....
Viewgraph 8. DATA FROM NON-US SOURCES
WHY? To broaden the range of variables (principally chemistry), and possibly pickup some factors that are not distinguishable using US data only (possibleadvanced reactor applications)
• Looking for the following types of information- Surveillance data- Test reactor data- Annealing recovery data
• Specific data- Material information- Chemistry- Irradiation information (fluence, flux, temperature)- Raw Charpy test data (ENERGY AND % SHEAR VS. TEMP)
• Format- Prefer magnetic media (floppy disks) in the EDB format- Will take reports if necessary
• Confidentiality of data source can be assured if necessary• Data will be supplied to IAEA international surveillance data base activity, if
the donor so wishes
FOR MORE INFORMATION, CONTACT
Mr. Allen L. Hiser, Jr.
USNRCOffice of Nuclear Regulatory ResearchMailstop217CNL/SWashington, D.C. 20555 USAPhone: 301 -492-3988Fax: 301-492-3586
Figure 1. Schematic of Analysis Iteration
40
Plenary Session, Chairmen's report
Plenary Session
Chairmen's Report
Chairman: M. DaviesCo-Chairman: P. Trampus
Mr. Ianko (IAEA) gave an overview of the IAEAInternational Working Group on Nuclear Power Plant LifeManagement. Besides describing the content and relevanceof the work of the Group he outlined the past and futurespecialise meetings, the composition of the WorkingGroup, the Co-ordinated Research Programme on neutronirradiation effects on pressure vessel steels, thecurrent work on databases and the publications of theIAEA.
Mr. Guinovart (CEC) described some studies developedwith the framework of the CEC Working Group on Codes andStandards. Within the timing constraints of thepresentation he described work being developed for in-service inspection using combined analysis based onPulse-Echo and TOFD Techniques and structural analysiswhere a comparison of simplified elasto-plastic fatigueanalyses of smooth structures enforced by Codes andoutlined the basis of the proposed methods. Themechanical behaviour of dissimilar welds was carried out.The geometry and manufacture of defects for NDE exerciseson evaluation was a feature raised during discussion.
Mr. Engl(Siemens/KWU) presented a paper on thestatus of the PISC III programme based on the recent PISCReport N° 17 (Programme for the Inspection of SteelComponents) and outlined the history of the PISC Project.He mentioned the financial constraints on the programmebut also extolled its virtues -when taken with othersimilar exercises- representing an extensive data baseand thereby its potential supportive impact to Codes andStandards.
Mr. Wichman (USNRC) presented a paper on plans fordeveloping the correlation of data on irradiationembrittlement with particular respect to the RegulatoryGuide 1.99 and the PTS rule (10 CFR 50.61). He describedthe data requirements from non-US sources and indicatedthe origin of possible sources - which included Russiandata. He indicated the availability of the data. rudiscussion it was noted that the Eastern European and CISdata may not be compatible with the existing data set andcurrent and past "Western" data - because of material andirradiation variations including irradiation temperatureleading to mechanistic differences which may preclude thetreatment of the data as "one family" of data.
41
IAEA Specialist's Meeting onThe Integrity of Pressure Components of Reactor Systems
Paks, Hungary, 25 May, 1992
Integrity assessment of pressurized components
Session 1Chairman: K. KohashiCo-chairman: F, Gillemot
Papers:4. Blauel, J. G; Hodulak, L.; Kordish, H.; Nagel, G.; Schmitt, W.;Siegele, D.: (Germany) An updated and extended safety analysis for thereactor vessel of the NPP Stade /KKS/
5. Brumovsky, M.: (CSFR) W E R Reactor Pressure Vessel IntegrityAssessment, Comparison and Experimental Verification
Session 2Chairman: M. BrumovskyCo-chairman: Gy. Mucskay
Papers:6. Trampus, P. et at: (Hungary) RPV Integrity Assessment at NPP Paks
7. Gerard, P. ; Fabry, A.: (Belgium) Integrity Assessment of DOEL 1and 2 Reactor Pressure Vessels
8. Hugot, G: (France) Evaluation of In-service Ageing of Heavy PWRComponents
9. Zuzo, M.: (CSFR) Regulatory Requirements Point of View Integrity ofPressure Components of Reactor Systems
Session 2 (cont.)Chairman: G. EngICo-chairman: I. Havas
Papers:10. Zdarek, J.; Pecinka, L ; Kadecka, P.: (CSFR) Leak Before BreakConcept. Application for the W E R 440/230
/ / . Bartholome, G; Wellein, R.: (Germany) Leak-before-breakBehaviour of Nuclear Piping Systems
12, Cincura, I.; Hermansky, P.; Hrazsky, M ; Mikus, M.:(CSFR)life-time evaluation of Bohunice V1 NPP primary loop components
42
Blauel : An Updated and Extended ...
AN UPDATED AND EXTENDED SAFETY ANALYSISFOR THE REACTOR PRESSURE VESSEL OF THENUCLEAR POWER PLANT STADE (KKS)
byJ.G. BLAUEL, L. HODULAK, H. KORDISCH, G NAGEL*. W. SCHMITT, D. SIEGELEFrcnmhofer-Institutfitr Werkstqffmechanik, D-~800 Freiburg, Wohlerstr. 11, FRG*Preussen Ekktra AG, D-3000 Hannover 96, Treskowstr. 5, FRG
ABSTRACT
Two specific problems within the safety case of RPV Stade have been reanalysed:brittle fracture initiation and arrest under strip type emergency core cooling conditions andsafety margins against ductile failure from deep cracks as postulated by the rules. For EOLmaterial conditions exclusion of initiation is shown for cracks of more than twice the sizewhich is safely detectable by NDE; the Weibull-stress concept is used for the interpretationof the warm prestressing effects. For arbitrarily postulated large cracks it is demonstratedthat they are arrested within 3/4 of the wall thickness; therefore no critical crack size existsfor RPV Stade under strip cooling. Growth in depth of an assumed 3/4 t circumferentialflaw in the EOL embrittled girth weld could occur only at upper shelf temperatures and byloads higher than about twice the service pressure; leak before break was demonstrated ina constraint modified JR-curve crack growth analysis. But no transient or the plant itself isable to provide the necessary high loads. The LEFM and EPFM proofs are summarized ina multibarrier safety scheme.
Keywords: RPV-safety analysis, strip type ECC, fracture mechanics, LEFM, EPFM,crack initiation, crack arrest, final load carrying capacity
1. Introduction
The safety report for RPV Stade first published in 1985 [ 1 ] included a brittlefracture analysis for emergency core cooling which is still valid without changes. Inanswering questions of the authorities this report has been supplemented by detailedanalyses concerning safety against brittle fracture by strip type cooling and against failureafter arrest. The results reported here confirm the proof of safety of 1985.
2. Load Assumptions and Material Data Base
In the case of emergency core cooling (ECC) the formation of strips of lowtemperature water flowing down from the nozzles along the wall of the vessel can precederotationally symmetric cooling. Up to now this process was taken into an account in theanalysis by assuming an abrupt thermal shock from service temperature to 20§C applied tothe inner surface of the vessel. To replace this simplifying assumption new methods of
43
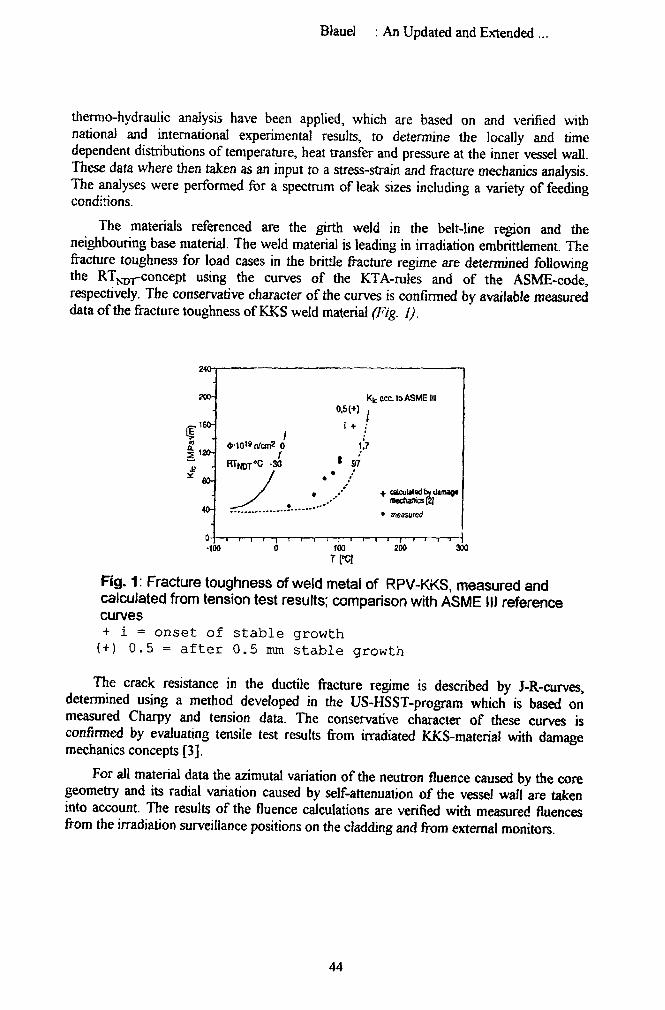
Blauel : An Updated and Extended ...
thermo-hydraulic analysis have been applied, which are based on and verified withnational and international experimental results, to determine the locally and timedependent distributions of temperature, heat transfer and pressure at the inner vessel wall.These data where then taken as an input to a stress-strain and fracture mechanics analysis.The analyses were performed for a spectrum of leak sizes including a variety of feedingconditions.
The materials referenced are the girth weld in the belt-line region and theneighbouring base material. The weld material is leading in irradiation embrittlement. Thefracture toughness for load cases in the brittle fracture regime are determined followingthe RTNT)T-concept using the curves of the KTA-rules and of the ASME-code,respectively. The conservative character of the curves is confirmed by available measureddata of the fracture toughness of KKS weld material (Fig. I).
240-
200-
l 1 2 O i
40-
0
30
KicSCCtoASMEIII
/
+ calcuWadbydtnugtmechanics (2]
• measured
•100 too 200 300
Fig. 1: Fracture toughness of weld metal of RPV-KKS, measured andcalculated from tension test results; comparison with ASME III referencecurves+ i = onset of stable growth(+) 0.5 = after 0.5 mm stable growth
The crack resistance in the ductile fracture regime is described by J-R-curves,determined using a method developed in the US-HSST-program which is based onmeasured Charpy and tension data. The conservative character of these curves isconfirmed by evaluating tensile test results from irradiated KKS-material with damagemechanics concepts [3].
For all material data the azimutal variation of the neutron fluence caused by the coregeometry and its radial variation caused by self-attenuation of the vessel wall are takeninto account. The results of the fluence calculations are verified with measured fluencesfrom the irradiation surveillance positions on the cladding and from external monitors.
44
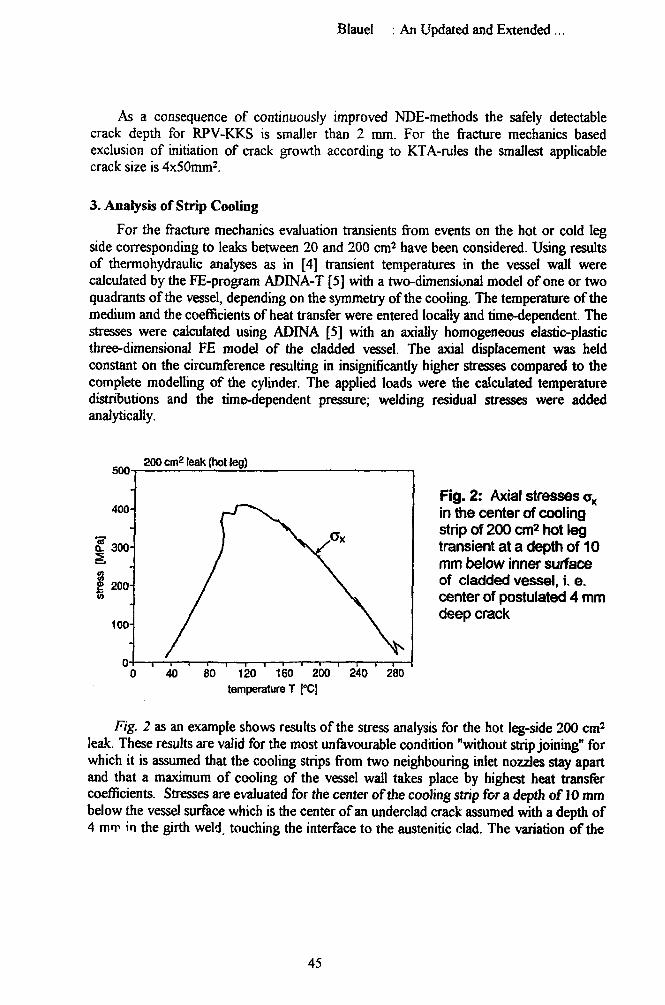
Blauel : An Updated and Extended ...
As a consequence of continuously improved NDE-methods the safely detectablecrack depth for RPV-KKS is smaller than 2 mm. For the fracture mechanics basedexclusion of initiation of crack growth according to KTA-rules the smallest applicablecrack size is 4x50mm2.
3. Analysis of Strip Cooling
For the fracture mechanics evaluation transients from events on the hot or cold legside corresponding to leaks between 20 and 200 cm2 have been considered. Using resultsof thermohydraulic analyses as in [4] transient temperatures in the vessel wall werecalculated by the FE-program ADINA-T [5] with a two-dimensional model of one or twoquadrants of the vessel, depending on the symmetry of the cooling. The temperature of themedium and the coefiScients of heat transfer were entered locally and time-dependent. Thestresses were calculated using ADINA [5] with an axiatly homogeneous elastic-plasticthree-dimensional FE model of the cladded vessel. The axial displacement was heldconstant on the circumference resulting in insignificantly higher stresses compared to thecomplete modelling of the cylinder. The applied loads were the calculated temperaturedistributions and the time-dependent pressure; welding residual stresses were addedanalytically.
500200 cm2 leak (hot leg)
40 80 120 160 200temperature T [°C]
280
Fig. 2: Axial stresses cx
in the center of coolingstrip of 200 cm2 hot legtransient at a depth of 10mm below inner surfaceof cladded vessel, i. e.center of postulated 4 mmdeep crack
Fig. 2 as an example shows results of the stress analysis for the hot leg-side 200 cm2
leak. These results are valid for the most unfavourable condition "without strip joining" forwhich it is assumed that the cooling strips from two neighbouring inlet nozzles stay apartand that a maximum of cooling of the vessel wall takes place by highest heat transfercoefficients. Stresses are evaluated for the center of the cooling strip for a depth of 10 mmbelow the vessel surface which is the center of an underclad crack assumed with a depth of4 mnr> in the girth weld, touching the interface to the austenitic clad. The variation of the
45
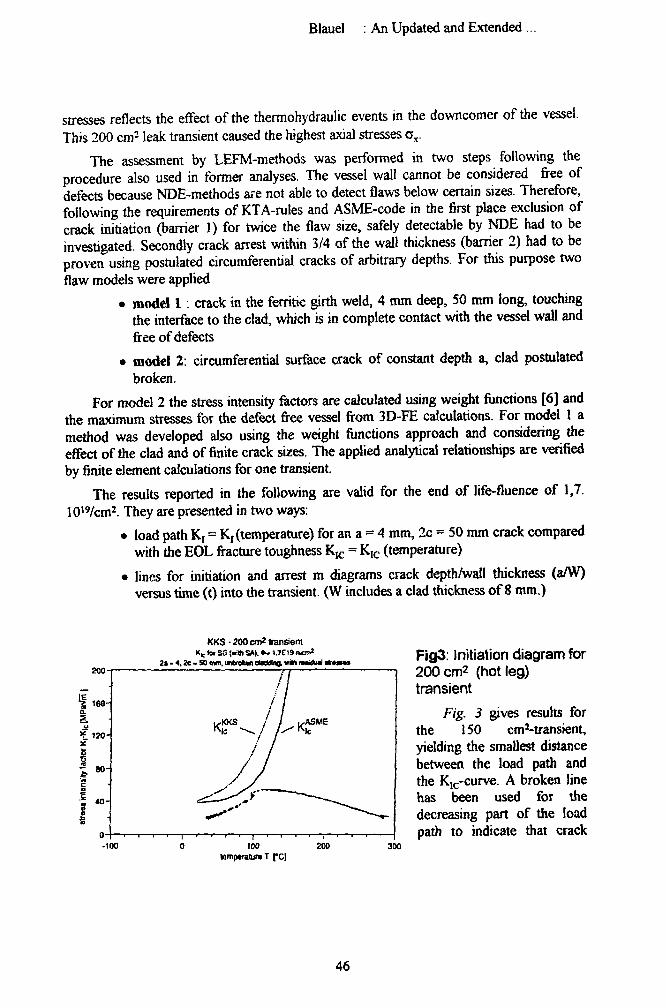
Blauel : An Updated and Extended ...
stresses reflects the effect of the thermohydraulic events in the downcomer of the vessel.This 200 cm2 leak transient caused the highest axial stresses o v
The assessment by LEFM-methods was performed in two steps following theprocedure also used in former analyses. The vessel wall cannot be considered free ofdefects because NDE-methods are not able to detect flaws below certain sizes. Therefore,following the requirements of KTA-rules and ASME-code in the first place exclusion ofcrack initiation (barrier 1) for twice the flaw size, safely detectable by NDE had to beinvestigated. Secondly crack arrest within 3/4 of the wall thickness (barrier 2) had to beproven using postulated circumferential cracks of arbitrary depths. For this purpose twoflaw models were applied
• model 1 : crack in the ferrinc girth weld, 4 mm deep, 50 mm long, touchingthe interface to the clad, which is in complete contact with the vessel wall andfree of defects
• model 2: circumferential surface crack of constant depth a, clad postulatedbroken.
For model 2 the stress intensity factors are calculated using weight functions [6] andthe maximum stresses for the defect free vessel from 3D-FE calculations. For model 1 amethod was developed also using the weight functions approach and considering theeffect of the clad and of finite crack sizes. The applied analytical relationships are verifiedby finite element calculations for one transient.
The results reported in the following are valid for the end of life-fluence of 1,7.10l9/cm2. They are presented in two ways:
• load path Kt = Kr (temperature) for an a = 4 mm, 2c = 50 mm crack comparedwith the EOL fracture toughness K,c = K1C (temperature)
• lines for initiation and arrest m diagrams crack depth/wall thickness (a/W)versus time (t) into the transient. (W includes a clad thickness of 8 mm.)
KKS- 200 cm* transientKK toi S3 (Mb SA). • - I.7CI9 IVOT*
2a - «. J c - SO mm. untntei Ottdino. wUt rmiOit) Mi*Fig3 Initiation diagram for200 cm2 (hot leg)transient
Fig. 3 gives results forthe 150 cm^-transient,yielding the smallest distancebetween the load path andthe Krc-curve. A broken linehas been used for thedecreasing part of the loadpath to indicate that crack
-100 tooMmpentura T (*C|
46
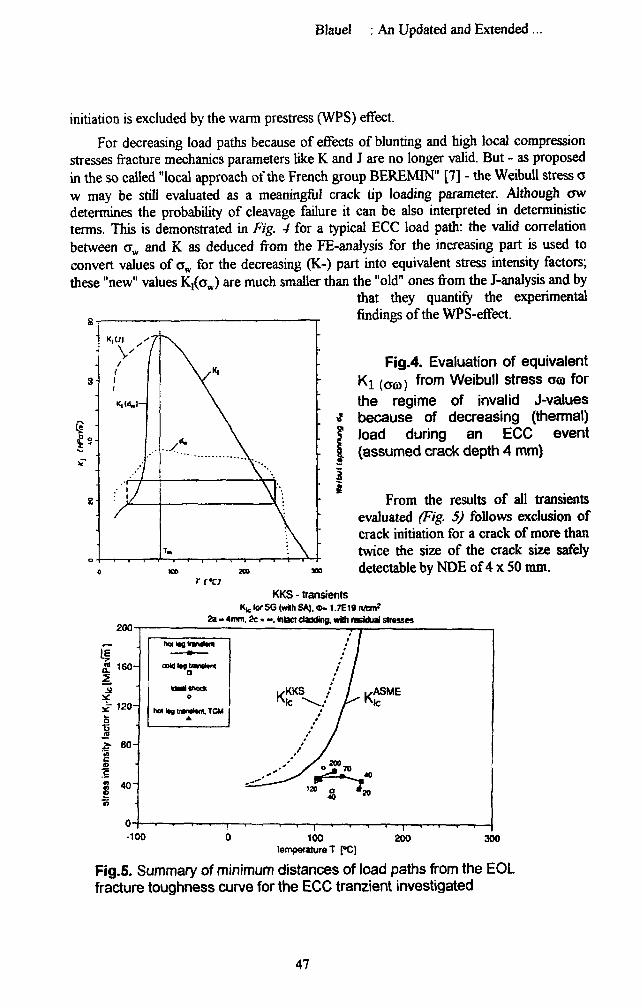
Blauel : An Updated and Extended
initiation is excluded by the warm prestress (WPS) effect.
For decreasing load paths because of effects of blunting and high local compressionstresses fracture mechanics parameters like K and J are no longer valid. But - as proposedin the so called "local approach of the French group BEREMIN" [7] - the Weibull stress aw may be still evaluated as a meaningful crack tip loading parameter. Although awdetermines the probability of cleavage failure it can be also interpreted in deterministicterms. This is demonstrated in Fig. 4 for a typical ECC load path: the valid correlationbetween <rw and K as deduced from the FE-analysis for the increasing part is used toconvert values of ow for the decreasing (K-) part into equivalent stress intensity factors;these "new" values KT(aJ are much smaller than the "old" ones from the J-analysis and by
that they quantify the experimentalfindings of the WPS-effect.
Fig.4. Evaluation of equivalent8-
s •
/11
1
K|«V,1-
/
"7
/
- - \ ,
\
—i—A-
(aw) fr°m Weibull stress a© forthe regime of invalid J-valuesbecause of decreasing (thermal)load during an ECC event(assumed crack depth 4 mm)
From the results of all transientsevaluated (Fig. 5) follows exclusion ofcrack initiation for a crack of more thantwice the size of the crack size safelydetectable by NDE of 4 x 50 mm.
200
KKS - transientsKte lor SG (with S A ) . « - 1.7E19 n/tm*
2a - 4mm, 2c . - . Intact daflding. with neodual stresses
160-
£ 120-
!
a
g 4 ° '
cddltgtnmitnto
Kail*guami«K.TCM
-100 100temperature T fC)
200 300
Fig.5. Summary of minimum distances of load paths from the EOLfracture toughness curve for the ECC tranzient investigated
47
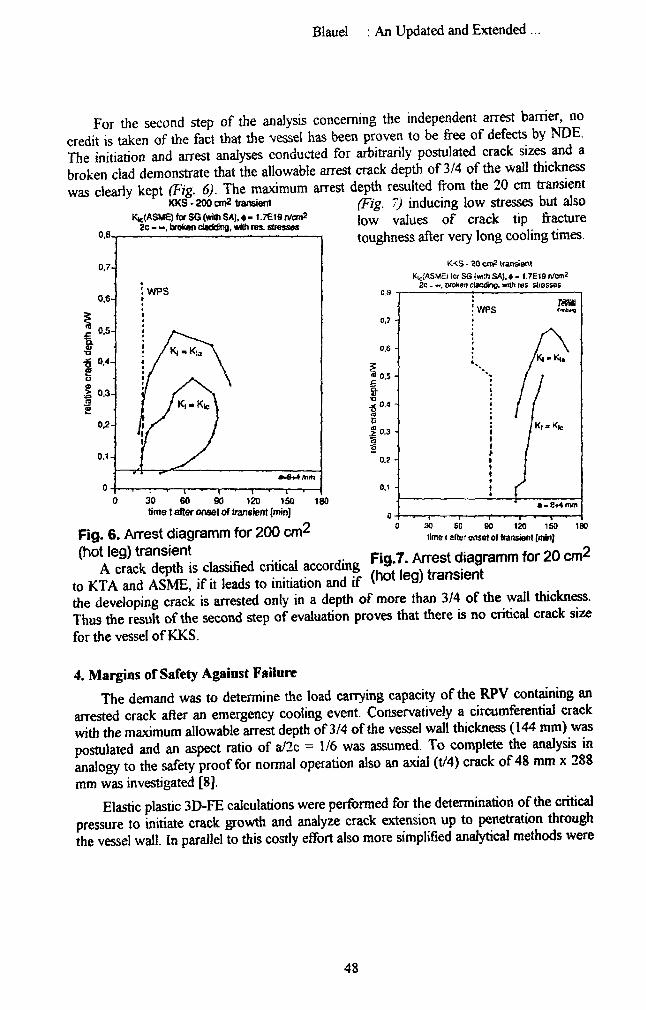
Blauel : An Updated and Extended ...
For the second step of the analysis concerning the independent arrest barrier, nocredit is taken of the fact that the vessel has been proven to be free of defects by NDE.The initiation and arrest analyses conducted for arbitrarily postulated crack sizes and abroken clad demonstrate that the allowable arrest crack depth of 3/4 of the wall thicknesswas clearly kept (Fig. 6). The maximum arrest depth resulted from the 20 cm transient
KKS - 200 cm2 transient (Fig. 7) inducing low stresses but alsoK^ASME) for SG (with SA),«-t.7Ei9rvem2 j o w v a i u e s o f crack tip fracture
2 c - - , broken dadtfng, with res. stresses " »"»"~ r
toughness after very long cooling times.
0 30 60 90 120 150tints t alter onset of transient [mm]
Fig. 6. Arrest diagramm for 200 cm2
(hot leg) transient
180
0 3 n
0,7 -
0.6 -
1•8J 0.4-<a0JO.3-ao
0.2 •
0.1 •
0 -
K<S-
K,c{ASMEt to SG
20 cnK transient•>:h SA). 4 - 1.7E 19 nfcmJ
2c - - . woken daadng. with lies sliosses
— • 1 • 1—
mmWPS f-«-^
AI 1/ // I
t 1
: i; /• \ m m 2*4 mm
•• T——. 1——I 1—> '
1800 30 60 80 120 160time t after onset of transient [minj
Dt leg) transient v , arf,nrri:n£r Fig.7. Arrest diagramm for 20 cm2A crack depth is classified critical according » transient
to KTA and ASME, if it leads to initiation and if <h o t i e 9 ) t r a n s i e n t
the developing crack is arrested only in a depth of more than 3/4 of the wall thickness.Thus the result of the second step of evaluation proves that there is no critical crack sizefor the vessel of KKS.
4. Margins of Safety Against FailureThe demand was to determine the load carrying capacity of the RPV containing an
arrested crack after an emergency cooling event. Conservatively a circumferential crackwith the maximum allowable arrest depth of 3/4 of the vessel wall thickness (144 mm) waspostulated and an aspect ratio of a/2c = 1/6 was assumed. To complete the analysis inanalogy to the safety proof for normal operation also an axial (t/4) crack of 48 mm x 288mm was investigated [8].
Elastic plastic 3D-FE calculations were performed for the determination of the criticalpressure to initiate crack growth and analyze crack extension up to penetration throughthe vessel wall. In parallel to this costly effort also more simplified analytical methods were
48
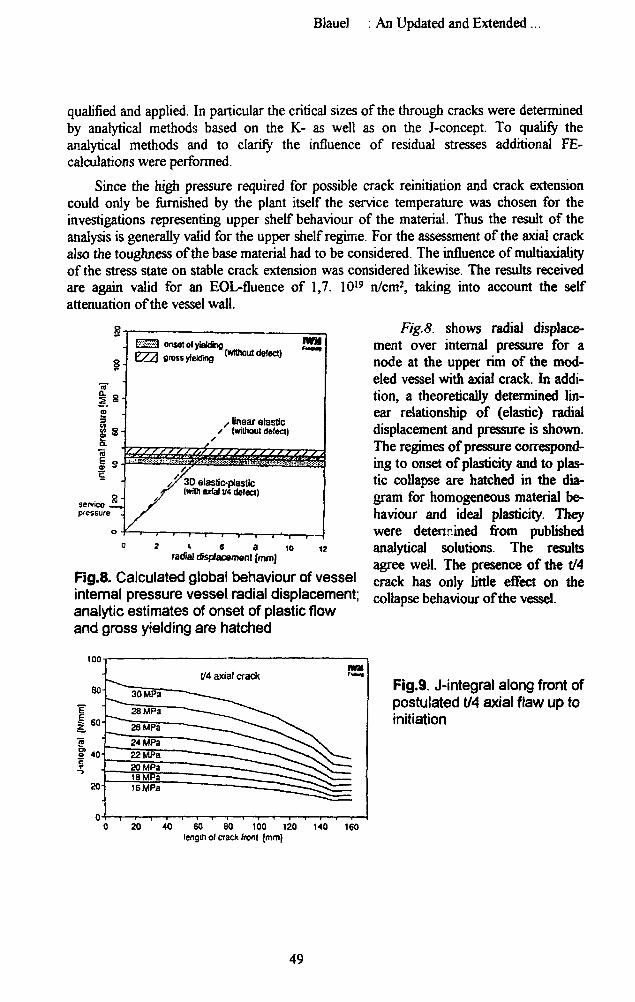
Blauel : An Updated and Extended ...
qualified and applied. In particular the critical sizes of the through cracks were determinedby analytical methods based on the K- as well as on the J-concept. To qualify theanalytical methods and to clarify the influence of residual stresses additional FE-calculations were performed.
Since the high pressure required for possible crack reinitiation and crack extensioncould only be furnished by the plant itself the service temperature was chosen for theinvestigations representing upper shelf behaviour of the material. Thus the result of theanalysis is generally valid for the upper shelf regime. For the assessment of the axial crackalso the toughness of the base material had to be considered. The influence of multiaxialityof the stress state on stable crack extension was considered likewise. The results receivedare again valid for an EOL-fluence of 1,7. 1019 n/cm2, taking into account the selfattenuation of the vessel wall.
s-
servicepressure
onset of yialdng
,,Snear elastic/ (without defect)
f/ZXi elastic-plastic(with axial V4 defect)
2 * 6 a 10radial displacement [mm]
12
Fig.8. Calculated global behaviour of vesselinternal pressure vessel radial displacement;analytic estimates of onset of plastic flowand gross yielding are hatched
Fig.8. shows radial displace-ment over internal pressure for anode at the upper rim of the mod-eled vessel with axial crack. In addi-tion, a theoretically determined lin-ear relationship of (elastic) radialdisplacement and pressure is shown.The regimes of pressure correspond-ing to onset of plasticity and to plas-tic collapse are hatched in the dia-gram for homogeneous material be-haviour and ideal plasticity. Theywere determined from publishedanalytical solutions. The resultsagree well. The presence of the t/4crack has only little effect on thecollapse behaviour of the vessel.
20 40 60 80 100 120length of crack fronl (mm)
140 160
Fig.9. J-integral along front ofpostulated t/4 axial flaw up toinitiation
49
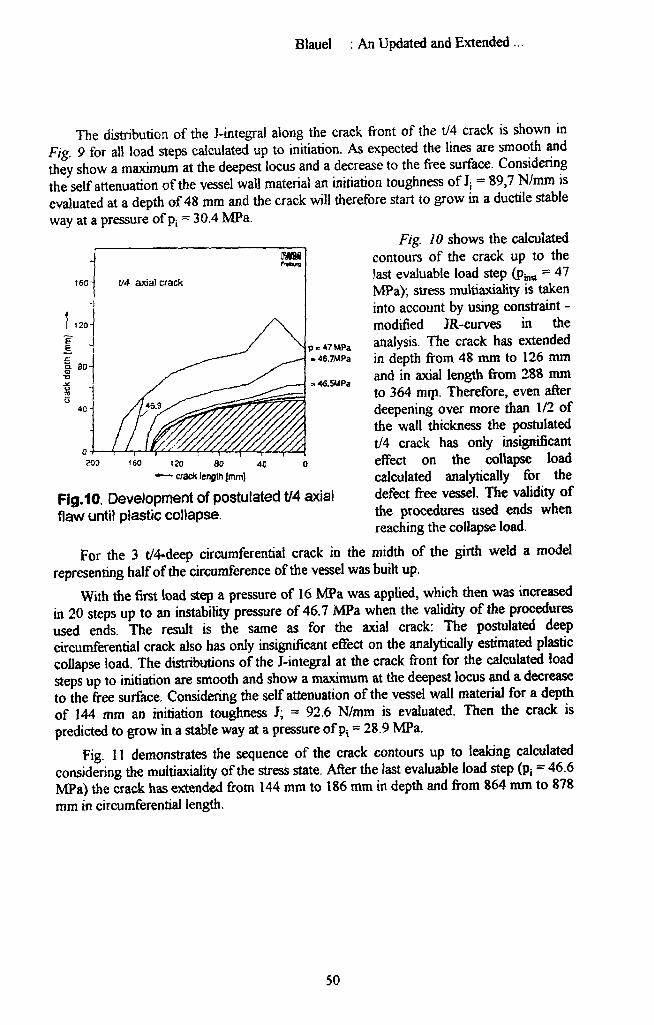
Blauel : An Updated and Extended
The distribution of the J-integral along the crack front of the t/4 crack is shown inFig. 9 for all load steps calculated up to initiation. As expected the lines are smooth andthey show a maximum at the deepest locus and a decrease to the free surface. Consideringthe self attenuation of the vessel wall material an initiation toughness of J; = 89,7 N/mm isevaluated at a depth of 48 mm and the crack will therefore start to grow in a ductile stableway at a pressure of p; = 30.4 MPa.
Fig. 10 shows the calculatedcontours of the crack up to thelast evaluable load step (pmA ~ 47MPa); stress multiaxiality is takeninto account by using constraint -modified JR-curves in theanalysis. The crack has extendedin depth from 48 mm to 126 mmand in axial length from 288 mmto 364 mm. Therefore, even afterdeepening over more than 1/2 ofthe wall thickness the postulatedt/4 crack has only insignificanteffect on the collapse loadcalculated analytically for thedefect free vessel. The validity ofthe procedures used ends whenreaching the collapse load.
203 160 120 80•*— crack length Jmm)
40
Fig.10. Development of postulated t/4 axialflaw until plastic collapse.
For the 3 t/4-deep circumferential crack in the midth of the girth weld a modelrepresenting half of the circumference of the vessel was built up.
With the first load step a pressure of 16 MPa was applied, which then was increasedin 20 steps up to an instability pressure of 46.7 MPa when the validity of the proceduresused ends. The result is the same as for the axial crack: The postulated deepcircumferential crack also has only insignificant effect on the analytically estimated plasticcollapse load. The distributions of the J-integral at the crack front for the calculated loadsteps up to initiation are smooth and show a maximum at the deepest locus and a decreaseto the free surface. Considering the self attenuation of the vessel wall material for a depthof 144 mm an initiation toughness J; = 92.6 N/mm is evaluated. Then the crack ispredicted to grow in a stable way at a pressure of pt = 28.9 MPa.
Fig. 11 demonstrates the sequence of the crack contours up to leaking calculatedconsidering the multiaxiality of the stress state. After the last evaluable load step (p; = 46.6MPa) the crack has extended from 144 mm to 186 mm in depth and from 864 mm to 878mm in circumferential length.
50
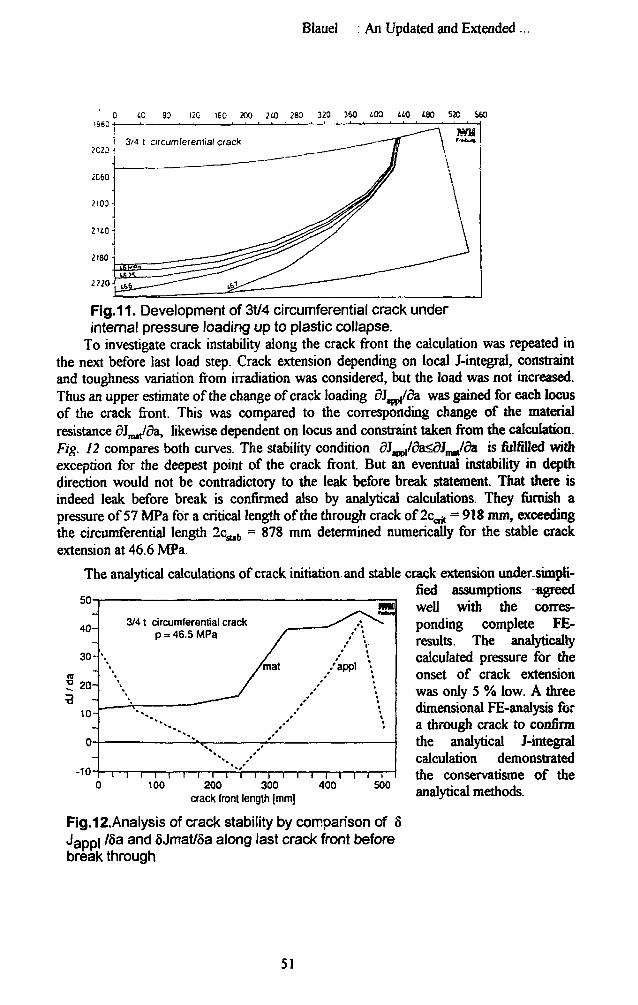
Blauel : An Updated and Extended ..
I96040 30 12C 160 200 210 280 320 360 400 440 480 52C S60
Fig.11. Development of 3t/4 circumferential crack underinternal pressure loading up to plastic collapse.
To investigate crack instability along the crack front the calculation was repeated inthe next before last load step. Crack extension depending on local J-integral, constraintand toughness variation from irradiation was considered, but the load was not increased.Thus an upper estimate of the change of crack loading dJ^da was gained for each locusof the crack front. This was compared to the corresponding change of the materialresistance di^/dz, likewise dependent on locus and constraint taken from the calculation.Fig. 12 compares both curves. The stability condition dl^/da^dl^/da is fulfilled withexception for the deepest point of the crack front. But an eventual instability in depthdirection would not be contradictory to the leak before break statement. That there isindeed leak before break is confirmed also by analytical calculations. They furnish apressure of 57 MPa for a critical length of the through crack of Ic^ = 918 mm, exceedingthe circumferential length 2csUb = 878 mm determined numerically for the stable crackextension at 46.6 MPa.
analytical calculations of crack initiation and stable crack extension under-simpli-fied assumptions agreedwell with the corres-ponding complete FE-results. The analyticallycalculated pressure for theonset of crack extensionwas only 5 % low. A threedimensional FE-analysis fora through crack to confirmthe analytical J-integralcalculation demonstratedthe conservatisme of theanalytical methods.
The
50
40-
30-
; 20-
10-
0
-10
3/41 circumferential crackp = 46.5 MPa
/mat /appl
100i i i i i i i r
200 300crack front length [mm]
400I i
500
Fig.12.Analysis of crack stability by comparison of 8Jappl /8a and SJmat/8a along last crack front beforebreak through
51
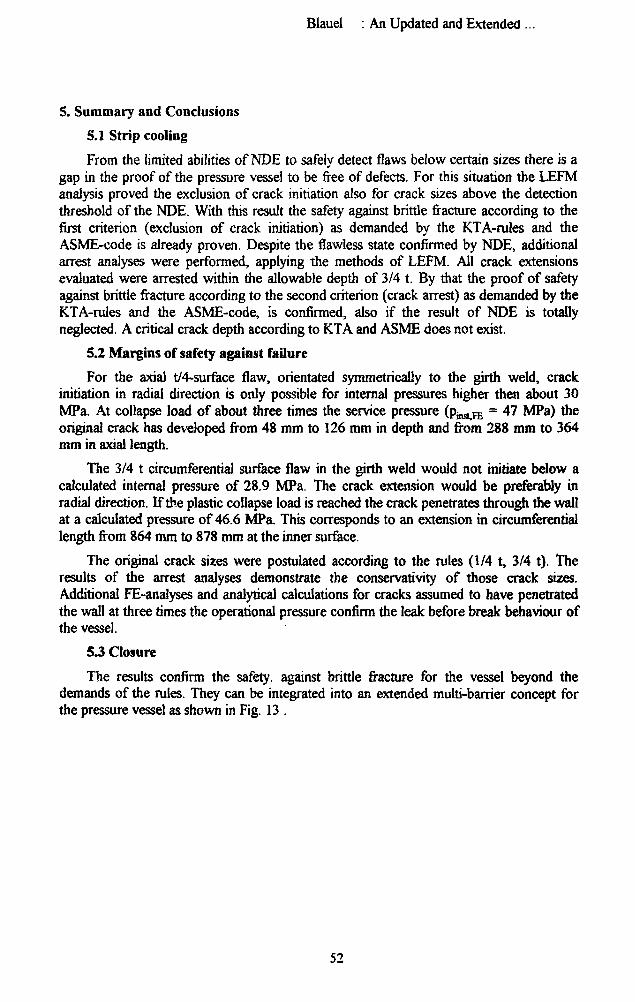
Blauel : An Updated and Extended ...
5. Summary and Conclusions
5.1 Strip cooling
From the limited abilities of NDE to safely detect flaws below certain sizes there is agap in the proof of the pressure vessel to be free of defects. For this situation the LEFManalysis proved the exclusion of crack initiation also for crack sizes above the detectionthreshold of the NDE. With this result the safety against brittle fracture according to thefirst criterion (exclusion of crack initiation) as demanded by the KTA-rules and theASME-code is already proven. Despite the flawless state confirmed by NDE, additionalarrest analyses were performed, applying the methods of LEFM. All crack extensionsevaluated were arrested within the allowable depth of 3/4 t. By that the proof of safetyagainst brittle fracture according to the second criterion (crack arrest) as demanded by theKTA-rules and the ASME-code, is confirmed, also if the result of NDE is totallyneglected. A critical crack depth according to KTA and ASME does not exist.
5.2 Margins of safety against failure
For the axial t/4-surface flaw, orientated symmetrically to the girth weld, crackinitiation in radial direction is only possible for internal pressures higher then about 30MPa. At collapse load of about three times the service pressure (p^ re = 47 MPa) theoriginal crack has developed from 48 mm to 126 mm in depth and from 288 mm to 364mm in axial length.
The 3/4 t circumferential surface flaw in the girth weld would not initiate below acalculated internal pressure of 28.9 MPa. The crack extension would be preferably inradial direction. If the plastic collapse load is reached the crack penetrates through the wallat a calculated pressure of 46.6 MPa. This corresponds to an extension in circumferentiallength from 864 mm to 878 mm at the inner surface.
The original crack sizes were postulated according to the rules (1/4 t, 3/4 t). Theresults of the arrest analyses demonstrate the conservativity of those crack sizes.Additional FE-analyses and analytical calculations for cracks assumed to have penetratedthe wall at three times the operational pressure confirm the leak before break behaviour ofthe vessel.
5.3 Closure
The results confirm the safety, against brittle fracture for the vessel beyond thedemands of the rules. They can be integrated into an extended multi-barrier concept forthe pressure vessel as shown in Fig. 13 .
52
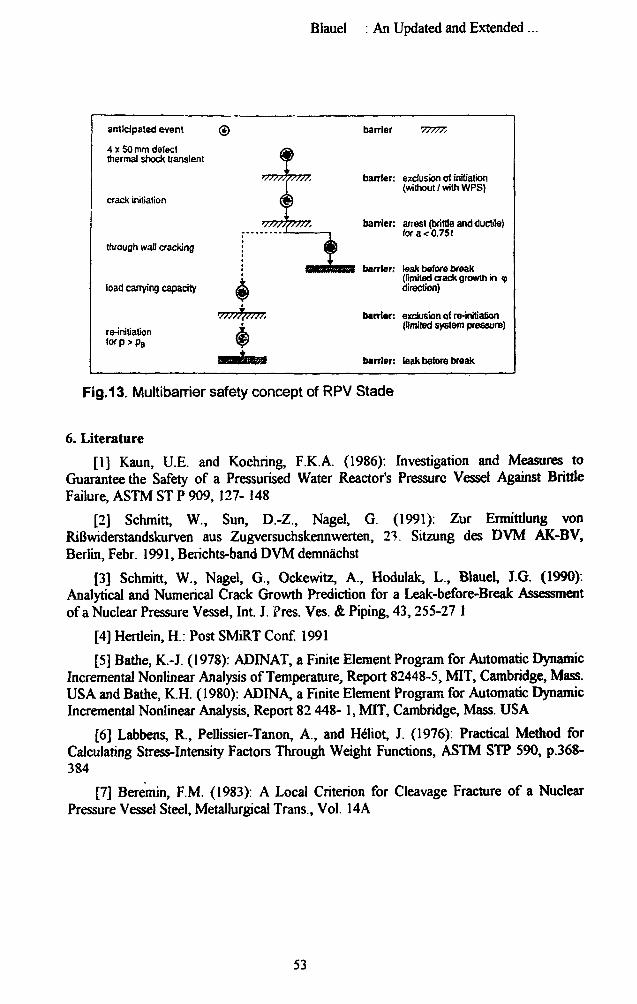
Blauel : An Updated and Extended ...
anticipated event (?)
4 x 50 mm detectthermal shock transient
crack initiation
through wall cracking
load carrying capacity A
re-initiation (forp>pB t!
7
\\
barrier '/////,
barrier: exclusion of initiation(without/with WPS)
barrier: arrest (bottle and ductile)fora<0.75t
1BH barrier; leak before break(limited aack growth in ipdirection}
barrier: exclusion of re-initiation(limited system pressure)
barrier: leak before break
Fig.13. Multibarrier safety concept of RPV Stade
6. Literature
[1] Kaun, U.E. and Koehring, F.K.A. (1986): Investigation and Measures toGuarantee the Safety of a Pressurised Water Reactor's Pressure Vessel Against BrittleFailure, ASTM ST P 909, 127- 148
[2] Schmitt, W., Sun, D.-Z., Nagel, G. (1991): Zur Ermittlung vonRiBwiderstandskurven aus Zugversuchskennwerten, 23. Sitzung des DVM AK-BV,Berlin, Febr. 1991, Berichts-band DVM demnachst
[3] Schmitt, W., Nagel, G., Ockewitz, A., Hodulak, L., Blauel, J.G. (1990):Analytical and Numerical Crack Growth Prediction for a Leak-before-Break Assessmentof a Nuclear Pressure Vessel, Int. J. Pres. Ves. & Piping, 43,255-27 1
[4] Hertlein, H.: Post SMiRT Conf. 1991
[5] Bathe, K.-J. (1978): ADINAT, a Finite Element Program for Automatic DynamicIncremental Nonlinear Analysis of Temperature, Report 82448-5, MIT, Cambridge, Mass.USA and Bathe, K.H. (1980): ADINA, a Finite Element Program for Automatic DynamicIncremental Nonlinear Analysis, Report 82 448- 1, MIT, Cambridge, Mass. USA
[6] Labbens, R., Pellissier-Tanon, A., and Heliot, J. (1976). Practical Method forCalculating Stress-Intensity Factors Through Weight Functions, ASTM STP 590, p.368-384
[7] Beremin, F.M. (1983): A Local Criterion for Cleavage Fracture of a NuclearPressure Vessel Steel, Metallurgical Trans., Vol. 14A
53
Brumovsky on W E R RPV Integrity
WER REACTOR PRESSURE VESSEL INTEGRITY-ASSESSMENT COMPARISON AND EXPERIMENTALVERIFICATION
yMILAN BRUMOVSKY
SKODA Concern, Nuclear Machinery Plant, 316 00Phen, CSFR
ABSTRACT
Paper deals with the most important problem that determines whole reactor pressurevessel lifetime - its integrity , with the aim to the W E R reactors .
Principal approach for the assessment of W E R reactor pressure vessel integrity andthus also its lifetime is discussed, mainly from the point of view of comparison ofapproaches, given in the Soviet Code as well as in the ASME Code, Section III and XI.Similarities and differences are shown and discussed and some numerical comparison for atypical vessel and operating conditions is also given. As two different approaches are usedin these Codes - i.e. initiation and/or arrest - their advantages are also discussed andcompared.
Principal parameters from the Code - fracture toughness curves - are compared with alarge set of experimental data.
Discussion is continuing also with respect to the possible application of the ASMECode for W E R reactors and some recommendations for necessary activities are also made.
Keywords :VVER reactors, ASME Code, USSR Code, brittle fracture, transitiontemperature, irradiation embrittlement, R T ^ ^ Tk0, fracture toughness, postulated defect
I. INTRODUCTION
Resistance of any materials or structures, including nuclear reactor pressure vessels isan objective property, but its assessment is strongly dependent on used approach, methodsand subsequently also Codes. Different resulting lifetime assessments can be received usingthe same approaches and methods, but different Codes, as each Code includes differentinput data, material properties, safety coefficients etc. Thus, speaking about resistanceagainst brittle fracture can be done only mentioning also used Code. As different Codes areused in different countries, their comparison is not easy and obvious. Moreover, design ofany reactor pressure vessel strongly depends on appropriate Code which contains not onlyrequirement on its design but also on assessment of its resistance against brittle fracture, i.e.design and Codes are very closely connected and cannot be analysed separately, or usingother Code than was used for design without any additional very deep analysis not only ofused methods and approaches but also of main principles put into Code construction.
Reactors of "Western" LWRs ( PWR, BWR ) are designed and assessed according tothe original ASME Code /I/ or its national modifications ( KTA, RCC-M etc. ) while"Eastern" VVER reactors { PWR type ) use Soviet ill or CMEA /3/ Codes. In both cases,
54
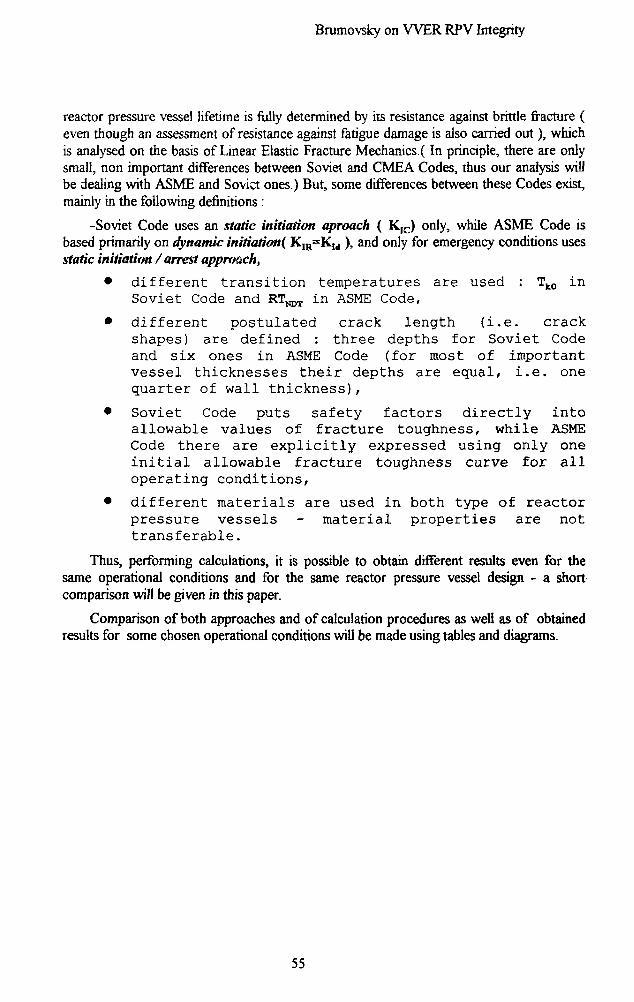
Brumovsky on W E R RPV Integrity
reactor pressure vessel lifetime is fully determined by its resistance against brittle fracture (even though an assessment of resistance against fatigue damage is also carried out ), whichis analysed on the basis of Linear Elastic Fracture Mechanics.( In principle, there are onlysmall, non important differences between Soviet and CMEA Codes, thus our analysis willbe dealing with ASME and Soviet ones.) But, some differences between these Codes exist,mainly in the following definitions :
-Soviet Code uses an static initiation aproach ( K,c) only, while ASME Code isbased primarily on dynamic initiation^ KIH=KW ), and only for emergency conditions usesstatic initiation /arrest approach,
• different transition temperatures are used : Tk0 inSoviet Code and RT ,,. in ASME Code,
• different postulated crack length (i.e. crackshapes) are defined : three depths for Soviet Codeand six ones in ASME Code (for most of importantvessel thicknesses their depths are equal, i.e. onequarter of wall thickness),
• Soviet Code puts safety factors directly intoallowable values of fracture toughness, while ASMECode there are explicitly expressed using only oneinitial allowable fracture toughness curve for alloperating conditions,
• different materials are used in both type of reactorpressure vessels - material properties are nottransferable.
Thus, performing calculations, it is possible to obtain different results even for thesame operational conditions and for the same reactor pressure vessel design - a shortcomparison will be given in this paper.
Comparison of both approaches and of calculation procedures as well as of obtainedresults for some chosen operational conditions will be made using tables and diagrams.
55
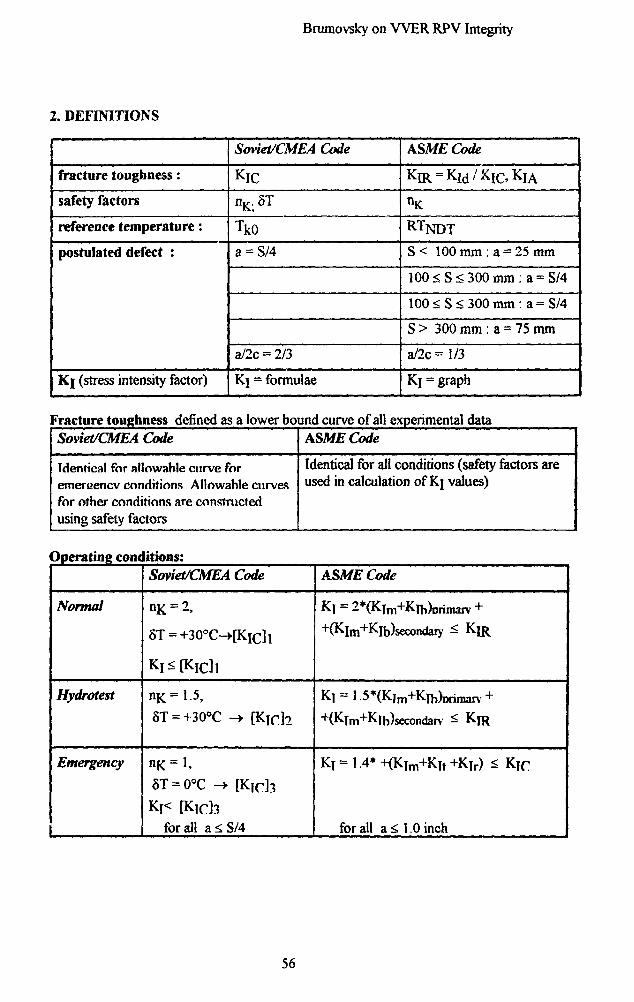
2. DEFINITIONS
Brumovsky on W E R RPV Integrity
fracture toughness:
safety factors
reference temperature:
postulated defect :
Kj (stress intensity factor)
Soviet/CMEA Code
KlC
nK. 5T
Tk0
a = S/4
a/2c = 2/3
Kj = formulae
ASME Code
K I R = K I d / X I C , K I A
nKR TNDT
S < 100 mm : a = 25 mm
100<S<300mm:a = S/4
100 < S< 300 mm :a=S/4
S > 300 mm : a = 75 mm
a/2c = 1/3
Kj = graph
Fracture toughness defined as a lower bound curve of all experimental dataSoviet/CMEA Code
Identical for allowable curve foremereencv conditions Allowahle curvesfor other conditions are constructedusing safety factors
ASME Code
Identical for all conditions (safety factors areused in calculation of Kj values)
Operating conditions:
Normal
Hydrotest
Emergency
Soviet/CMEA Code
8T = +3O°C-HKICh
nK = l-5,
ST = +30°C -> [Kjcb
8T = 0°C -> [K]Ch
for all a<S/4
ASME Code
K\ = 2*(K[m+Kih)Drimarv ++(Klm+^Ib)secondary ^ K [ R
KT=1.5*(KTm+KIh)Drimarv +
"'"(Klm+KThJsecondan ^ KrR
KT=1.4*+(KTm+KFt+Kir) < K T r
for all a <, 1.0 inch
56
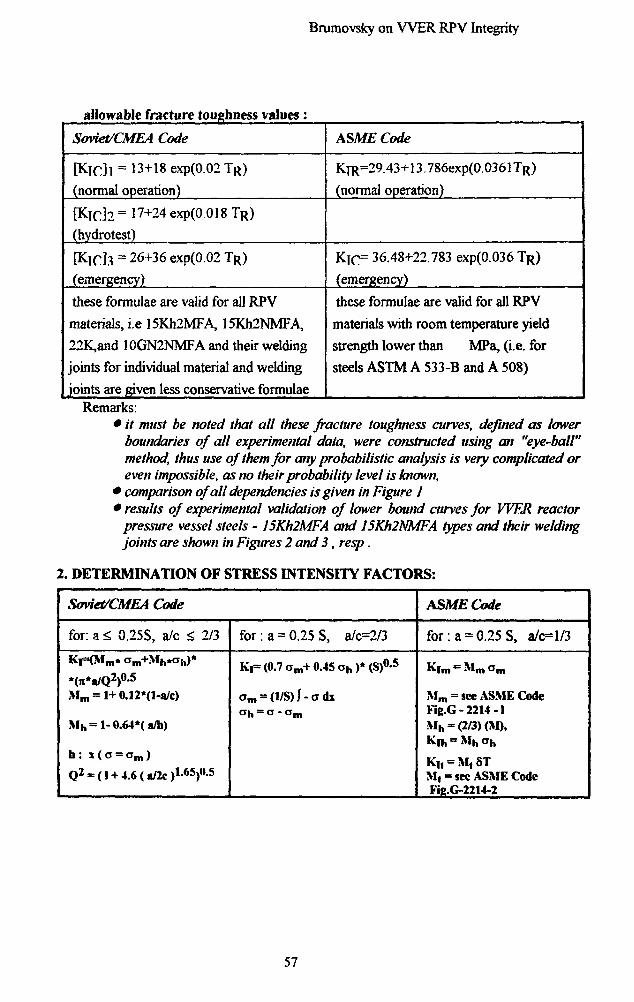
Bruraovsky on W E R RPV Integrity
allowable fracture toughness values:
Soviet/CMEA Code
[KTC]i = 13+18 exp(0.02TR)
(normal operation)
[KlCh = '7+24 exp(0.018 TR)
(hydrotest)
[KTC]3 = 26+36 exp(0.02 TR)
(emergency)
these formulae are valid for all RPV
materials, i.e 15Kh2MFA, 15Kh2NMFA,
22K,and 10GN2NMFA and their welding
joints for individual material and welding
joints are given less conservative formulae
ASMECode
KTR=29.43+13.786exp(0.0361TR)
(normal operation)
KTC= 36.48+22.783 exp(0.036 T R )
(emergency)
these formulae are valid for all RPV
materials with room temperature yield
strength lower than MPa, (i.e. for
steels ASTM A 533-B and A 508)
Remarks:* it must be noted that all these fracture toughness curves, defined as lower
boundaries of all experimental data, were constructed using an "eye-ball"method, thus use of them for any probabilistic analysis is very complicated oreven impossible, as no their probability level is known,
* comparison of all dependencies is given in Figure 1* results of experimental validation of lower bound curves for WER reactor
pressure vessel steels - J5Kh2MFA and 15Kh2NMFA types and their weldingjoints are shown in Figures 2 and 3, resp.
2. DETERMINATION OF STRESS INTENSITY FACTORS:
Soviet/CMEA Code
for: a <, 0.25S, a/c <: 2/3
Kf=(Mm« am+Mh*ah)*
*(w*a/Q2)0-5
M m = 1+ OAlHl-sUc)
Mh=l-0.64*(a/h)
Q2 = (1 + 4.6 (a/2c )l-65)0.5
for: a = 0.25 S, a/c=2/3
Ki= (0.7 am+ 0.45 oh )* (S)0-5
am = (l/S)J-ads
ASMECode
for:a = 0.25S, a/c=l/3
M m = see ASMECodeFig.G-2214-1
Ki, = M, 8TM, = sec ASME CodeFig.G-2214-2
57
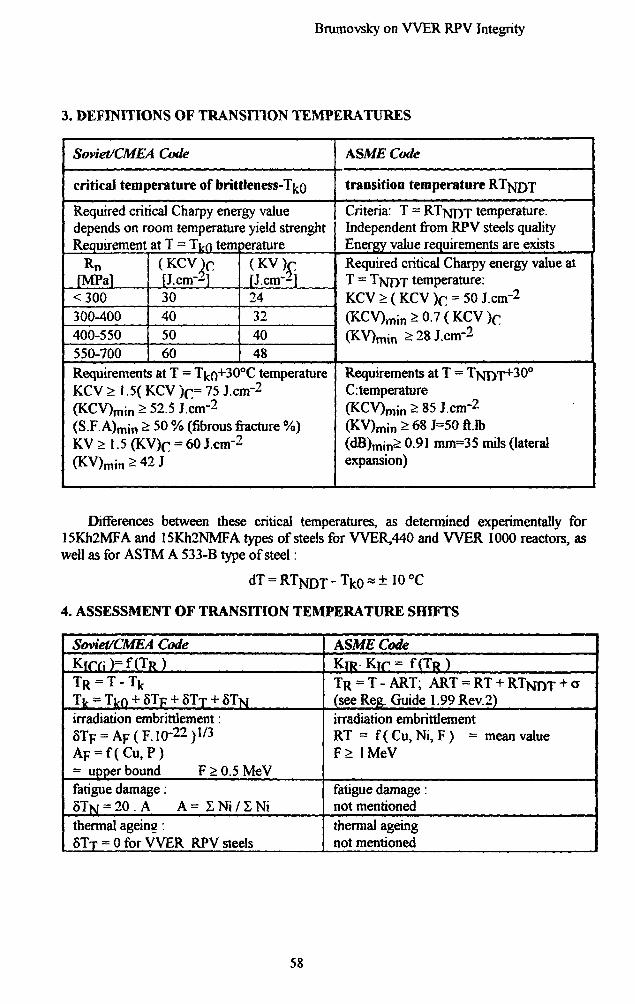
Brumovsky on W E R RPV Integrity
3. DEFINITIONS OF TRANSITION TEMPERATURES
Soviet/CMEA Code
critical temperature of brittleness-T^o
Required critical Charpy energy valuedepends on room temperature yield strenghtRequirement at T = T^o temperature
fMPa]<300300-400400-550550-700
(KCV) r
[J.cm-2]30405060
(KVVfj.cm-2]24324048
Requirements at T = Tjco+3O°C temperatureKCV > 1.5( KCV )r= 75 J.cnr2
(KCV)min>52.5J.cm-2(S.F. A)mjn > 50 % (fibrous fracture %)KV>1.5(KV) r = 60J.cm-2
(KV)m i n>42J
ASME Code
transition temperature RT^DT
Criteria: T = RTjvfryr- temperature.Independent from RPV steels qualityEnergy value requirements are existsRequired critical Charpy energy value atT = TNTYT temperature:KCV > ( KCV )c = 50 J.crn"2
(KCV) rT ,in^0.7(KCV) r
(KV)mm 2r28J.cm-2
Requirements at T = T^ryr^3 0 0
C: temperature(KCV)min > 85 J.cm-2(KV)min>68J=5Oft.Ib(dB)mjn> 0.91 mm=35 mils (lateralexpansion)
Differences between these critical temperatures, as determined experimentally for15Kh2MFA and 15Kh2NMFA types of steels for WER,440 and W E R 1000 reactors, aswell as for ASTM A 533-B type of steel:
dT = RTJVJDX - Tfco « ± 10 °C
4. ASSESSMENT OF TRANSITION TEMPERATURE SHIFTS
Soviet/CMEA CodeKTfYi)=f(TR)TR = T - T k
Tir = Two + STF + 6 T T + S T N
irradiation embrittlement:8TF = A F ( F . 10-22)1/3AF = f ( C u , P )= upper bound F > 0.5 MeVfatigue damage:8 T N = 20 . A A = 2 Ni / S Nithermal ageing:8TT = 0 for VVER RPV steels
AS;V/£ CodeKTR K T r = f ( T R )
T R = T - A R T ; A R T = R T + R T N D T + CT(see Reg. Guide 1.99 Rev.2)irradiation embrittlementRT = f ( Cu, Ni, F ) = mean valueF > 1 MeV
fatigue damage:not mentionedthermal ageingnot mentioned
58
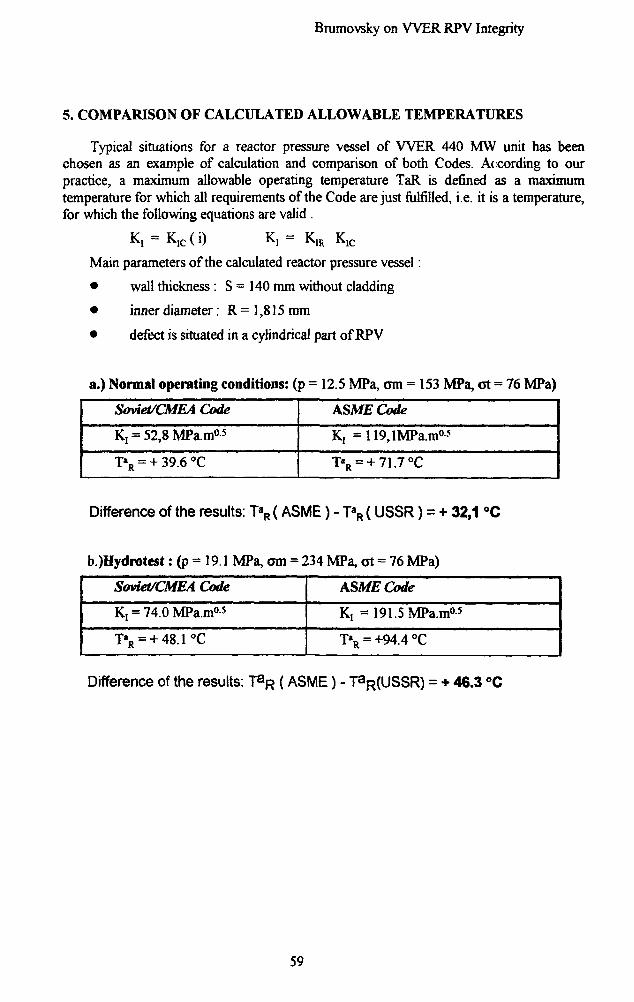
Brumovsky on W E R RPV Integrity
5. COMPARISON OF CALCULATED ALLOWABLE TEMPERATURES
Typical situations for a reactor pressure vessel of W E R 440 MW unit has beenchosen as an example of calculation and comparison of both Codes. According to ourpractice, a maximum allowable operating temperature TaR is denned as a maximumtemperature for which all requirements of the Code are just fulfilled, i.e. it is a temperature,for which the following equations are valid .
Ki = K I C( i) Kj = Km K1C
Main parameters of the calculated reactor pressure vessel:
• wall thickness : S = 140 mm without cladding
• inner diameter; R = 1,815 mm
• defect is situated in a cylindrical part of RPV
a.) Normal operating conditions: (p = 12.5 MPa, cm = 153 MPa, at = 76 MPa)
Soviet/CMEA Code
K, = 52,8MPa.m05
T»R = + 39.6 °C
ASME Code
K, = 119,lMPa.m05
T«R = + 71.7°C
Difference of the results: TaR (ASME) - Ta
R (USSR) = + 32,1 °C
b.)Hydrotest: (p = 19.1 MPa, am = 234 MPa, at = 76 MPa)
Soviet/CMEA Code
K: = 74.0 MPa.m°5
T*R = + 48.1°C
ASMECode
K, = 191.5 MPa.m05
T«R = +94.4°C
Difference of the results: TaR (ASME) - TaR(USSR) = + 46.3 °C
59
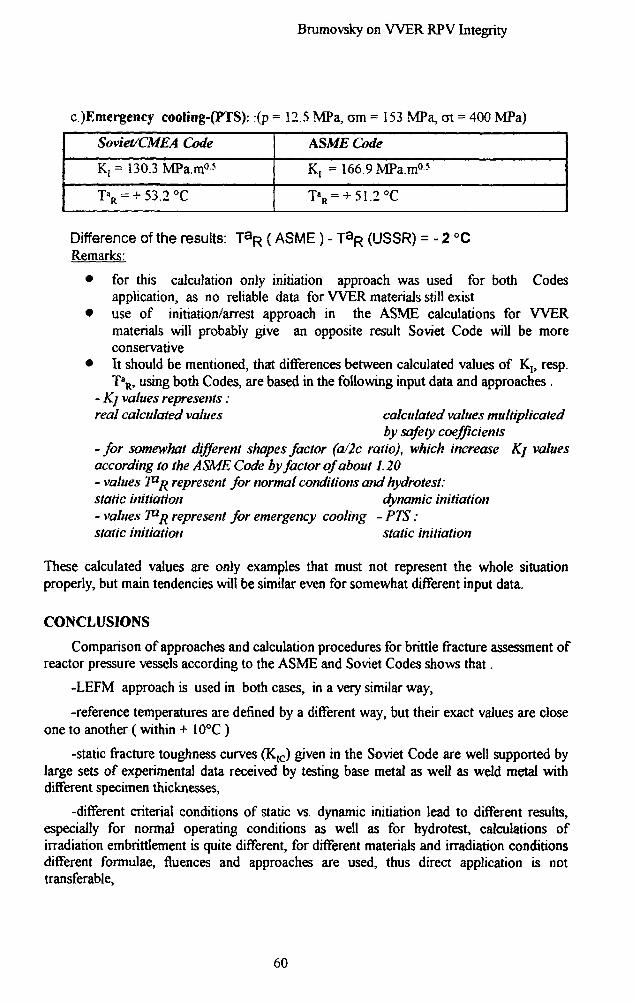
Brumovsky on W E R RPV Integrity
c.)Emergency cooling-(PTS): :(p = 12.5 MPa, ran = 153 MPa, at = 400 MPa)
Soviet/CMEA Code
K ( = 130.3 MPa.m0*
T«R = + 53.2 °C
ASME Code
K[ = 166.9 MPa.m0 5
T»R = + 51.2°C
Difference of the results: T^R (ASME ) - TaR (USSR) = - 2 °CRemarks:
• for this calculation only initiation approach was used for both Codesapplication, as no reliable data for VVER materials still exist
• use of initiation/arrest approach in the ASME calculations for W E Rmaterials will probably give an opposite result Soviet Code will be moreconservative
• It should be mentioned, that differences between calculated values of Kj, resp.Ta
R, using both Codes, are based in the following input data and approaches .- Kj values represents:real calculated values calculated values multiplicaied
by safety coefficients- for somewhat different shapes factor (a/2c ratio), which increase Kj valuesaccording to the ASME Code by factor of about 1.20- values 7°/^ represent for normal conditions and hydrotest:static initiation dynamic initiation- values 7°^ represent for emergency cooling - PTS:static initiation static initiation
These calculated values are only examples that must not represent the whole situationproperly, but main tendencies will be similar even for somewhat different input data.
CONCLUSIONS
Comparison of approaches and calculation procedures for brittle fracture assessment ofreactor pressure vessels according to the ASME and Soviet Codes shows that.
-LEFM approach is used in both cases, in a very similar way,
-reference temperatures are defined by a different way, but their exact values are closeone to another ( within + 10°C )
-static fracture toughness curves (K1C) given in the Soviet Code are well supported bylarge sets of experimental data received by testing base metal as well as weld metal withdifferent specimen thicknesses,
-different criteria! conditions of static vs. dynamic initiation lead to different results,especially for normal operating conditions as well as for hydrotest, calculations ofirradiation embrittlement is quite different, for different materials and irradiation conditionsdifferent formulae, fluences and approaches are used, thus direct application is nottransferable,
60
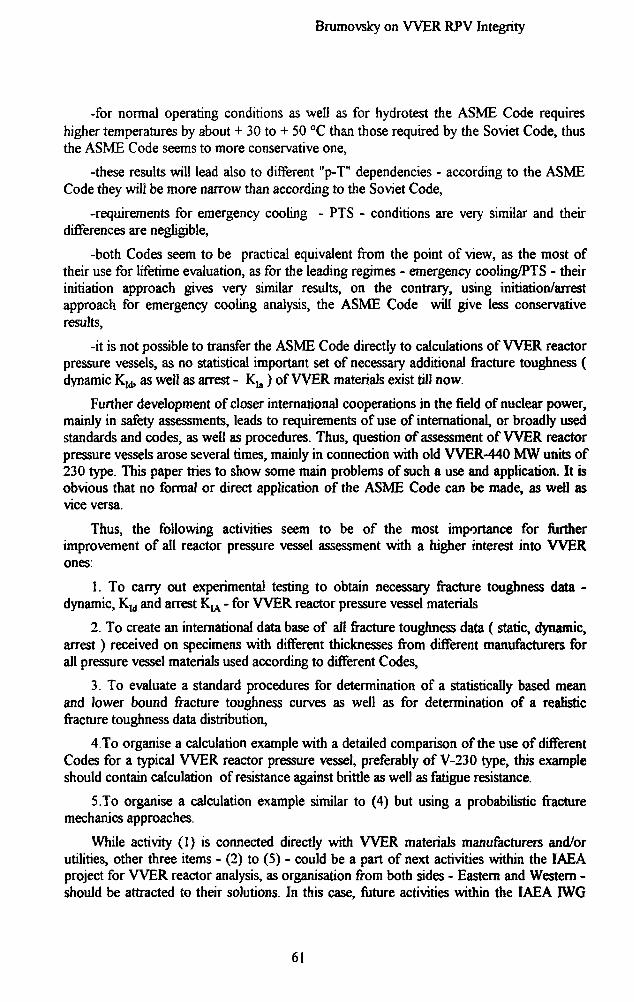
Brumovsky on W E R RPV Integrity
-for normal operating conditions as well as for hydrotest the ASME Code requireshigher temperatures by about + 30 to + 50 °C than those required by the Soviet Code, thusthe ASME Code seems to more conservative one,
-these results will lead also to different "p-T" dependencies - according to the ASMECode they will be more narrow than according to the Soviet Code,
-requirements for emergency cooling - PTS - conditions are very similar and theirdifferences are negligible,
-both Codes seem to be practical equivalent from the point of view, as the most oftheir use for lifetime evaluation, as for the leading regimes - emergency cooling/PTS - theirinitiation approach gives very similar results, on the contrary, using initiation/arrestapproach for emergency cooling analysis, the ASME Code will give less conservativeresults,
-it is not possible to transfer the ASME Code directly to calculations of W E R reactorpressure vessels, as no statistical important set of necessary additional fracture toughness (dynamic KId> as well as arrest - K u ) of W E R materials exist till now.
Further development of closer international cooperations in the field of nuclear power,mainly in safety assessments, leads to requirements of use of international, or broadly usedstandards and codes, as well as procedures. Thus, question of assessment of W E R reactorpressure vessels arose several times, mainly in connection with old WER-440 MW units of230 type. This paper tries to show some main problems of such a use and application. It isobvious that no formal or direct application of the ASME Code can be made, as well asvice versa.
Thus, the following activities seem to be of the most importance for furtherimprovement of all reactor pressure vessel assessment with a higher interest into W E Rones:
1. To carry out experimental testing to obtain necessary fracture toughness data -dynamic, KId and arrest K^ - for W E R reactor pressure vessel materials
2. To create an international data base of all fracture toughness data ( static, dynamic,arrest) received on specimens with different thicknesses from different manufacturers forall pressure vessel materials used according to different Codes,
3. To evaluate a standard procedures for determination of a statistically based meanand lower bound fracture toughness curves as well as for determination of a realisticfracture toughness data distribution,
4 To organise a calculation example with a detailed comparison of the use of differentCodes for a typical W E R reactor pressure vessel, preferably of V-230 type, this exampleshould contain calculation of resistance against brittle as well as fatigue resistance.
5.To organise a calculation example similar to (4) but using a probabilistic fracturemechanics approaches.
While activity (1) is connected directly with W E R materials manufacturers and/orutilities, other three items - (2) to (5) - could be a part of next activities within the IAEAproject for W E R reactor analysis, as organisation from both sides - Eastern and Western -should be attracted to their solutions. In this case, future activities within the IAEA IWG
61
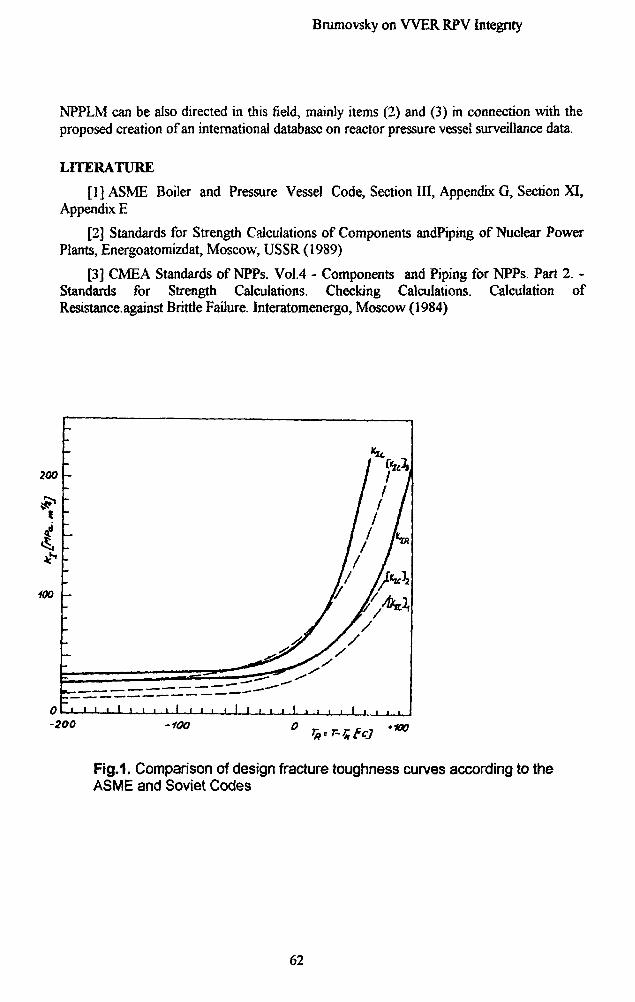
Brumovsky on W E R RPV Integrity
NPPLM can be also directed in this field, mainly items (2) and (3) m connection with theproposed creation of an international database on reactor pressure vessel surveillance data.
LITERATURE
[1]ASME Boiler and Pressure Vessel Code, Section III, Appendix G, Section XI,Appendix E
[2] Standards for Strength Calculations of Components andPiping of Nuclear PowerPlants, Energoatomizdat, Moscow, USSR (1989)
[3] CMEA Standards of NPPs. Vol.4 - Components and Piping for NPPs. Part 2. -Standards for Strength Calculations. Checking Calculations. Calculation ofResistance.against Brittle Failure. Interatomenergo, Moscow (1984)
200
4100
0
-
---
-
T. , • — r
" l 1 I . I . , , 1 I 1
/ ^ 71 ( j \1 ( 1I I I
1 / L1 / 1i h«\
J f/*y / /
_ I _ . I i I i . i i i . . • , i , , , .
-200 -iOO 0 r^r-stcj ***
Fig.1. Comparison of design fracture toughness curves according to theASME and Soviet Codes
62
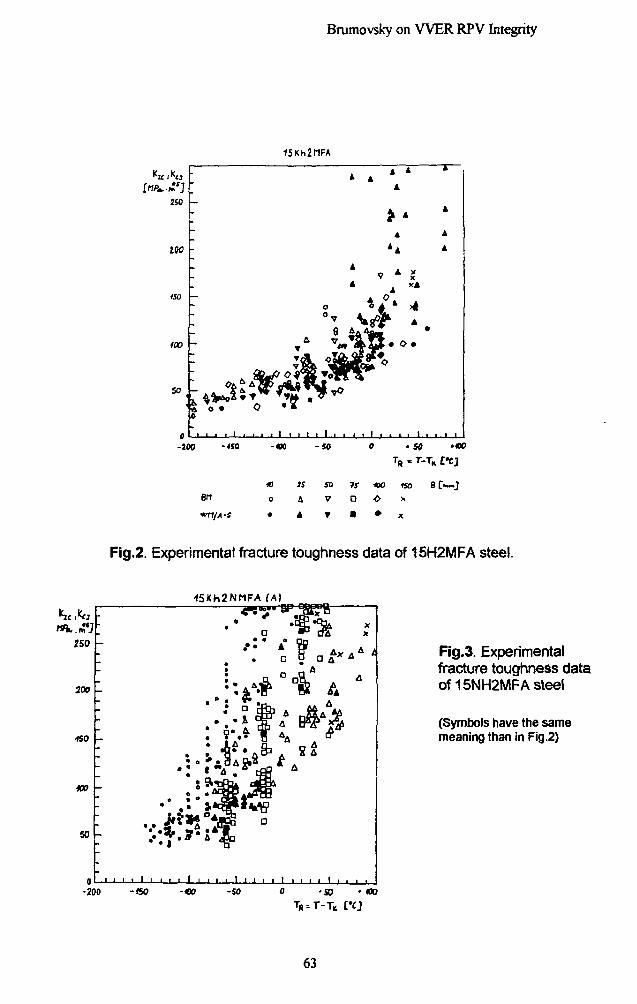
Brumovsky on W E R RPV Integrity
-100
Btt
•TT//I-S
IS SO W -tOO 150
A v a o >.A ? • • x
BT—J
Fig.2. Experimental fracture toughness data of 15H2MFA steel.
Fig.3. Experimentalfracture toughness dataof 15NH2MFA steel
(Symbols have the samemeaning than in Fig.2)
63
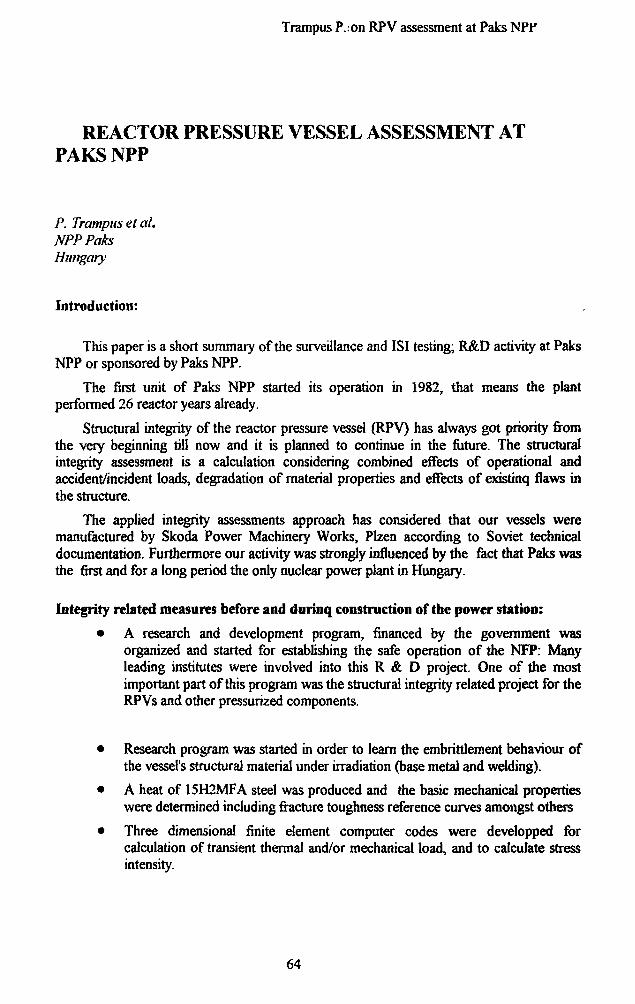
Trampus P.:on RPV assessment at Paks MPF
REACTOR PRESSURE VESSEL ASSESSMENT ATPAKS NPP
P. Trampus et ahNPP PaksHungary
Introduction:
This paper is a short summary of the surveillance and ISI testing; R&D activity at PaksNPP or sponsored by Paks NPP.
The first unit of Paks NPP started its operation in 1982, that means the plantperformed 26 reactor years already.
Structural integrity of the reactor pressure vessel (RPV) has always got priority fromthe very beginning till now and it is planned to continue in the future. The structuralintegrity assessment is a calculation considering combined effects of operational andaccident/incident loads, degradation of material properties and effects of existinq flaws inthe structure.
The applied integrity assessments approach has considered that our vessels weremanufactured by Skoda Power Machinery Works, Plzen according to Soviet technicaldocumentation. Furthermore our activity was strongly influenced by the fact that Paks wasthe first and for a long period the only nuclear power plant in Hungary.
Integrity related measures before and durioq construction of the power station:
• A research and development program, financed by the government wasorganized and started for establishing the safe operation of the NFP: Manyleading institutes were involved into this R & D project. One of the mostimportant part of this program was the structural integrity related project for theRPVs and other pressurized components.
• Research program was started in order to learn the embrittlement behaviour ofthe vessel's structural material under irradiation (base metal and welding).
• A heat of 15H2MFA steel was produced and the basic mechanical propertieswere determined including fracture toughness reference curves amongst others
• Three dimensional finite element computer codes were developped forcalculation of transient thermal and/or mechanical load, and to calculate stressintensity.
64
Trampus P. on RPV assessment at Paks NPP
• Effects of Loss-of-Coolant Accident ( LOCA) was analized taking a postulatedsemi-elliptical crack into accaunt, as large as one quarter of the wall thickness atthe belt-line region.
• Research programs has been started in the field of mechanized non-destructiveexamination. This program includes the development of methods andequipments used for acoustic emmission site testing during hydrotest.
• Research on fracture mechanics methodolody were also carried out and theresults are used to prepare the testing technology used for surveillance testing atthe hot cells of NPP Paks.
• The NPP set up an expert committee with members representing materialscience, neutron dosimetry^fracture mechanics, stress and strain calculation andnon-destructive testing. These experts, -using their professional and institutionalbackground- referre the surveillance and non-destructive testing results, or eventhey perform additional examinations or calculations if it is necessary. Thisindependent expert committee guaranties the reliability of the results. TheHungarian authority have also licensed this body.
Integrity related steps after commissioning of the units:
• On the basis of experiences gained during the construction and the earlyoperational years, the first surveillance and ultrasonic testing results of theRPV-s several steps has been already made to improve the l;evel of thestructural integrity. -
• The stress and strain analysis was shifted from large-break LOCA-s to thesmall-break LOCA events, and to the pressurized thermal schock,( PTS )calculations. In accordance with the recommendations of the main designer themost critical PTS transient events were determined and thoroughly analized.These are the rupture of steam generator heat exchanger- tube and the stuckopen of the relief valve.
• Attention was brought to determination of stress behaviour in the nozzle area incase of emergency core cooling and hydrotests.
• In two cases, stress distribution measurement was carried out at selectedlocations on one outlet nozzle during in-service hydrotest.
• The limits of the Russian-made ultrasonic system (USK-213) for RPV testingwere recognized after the very firts ISI testings. The reconstruction of thisexternal UT-system was realized under support from IAEA, and a Spanish-Hungarian contribution.
• Parallel to the use of the external system, internal ultrasonic testing has beenperformed in every fourth year by the staff of the manufacturer on acontractual basis. Skoda Works uses a Swedish designed remote controlledcentral mast manipulator (TRC=Reactortest).
65
Gerard; Fabry: Integrity Assesment of DOEL....
INTEGRITY ASSESSMENT OF DOEL 1 AND 2REACTOR PRESSURE VESSELS
R. GERARD (*), A. FABRY (**)* TRACTEBEL ENERGY ENGINEERING, Avenue Ariane 7,
B-1200 Brussels, BELGIUM** SCK/CENBoeretcm 200, B-2400, Mol, BELGIUM
Abstract
Doel 1 and 2 are two-loops pressurized water reactors of 390 MW electrical output,which were commissioned in 1974 and 1975 respectively. As in many other units of thisvintage, the weld assembling the two core shells (forged rings) displays a relativelyhigh copper content, detrimental to irradiation embrittlement sensitivity.
The surveillance program results are rather atypical, and the surveillance specimensmight not be fully representative of the vessel welds, which makes reliable predictions ofthe embrittlement difficult.This raises the issue of reactor vessel integrity in case ofpressurized thermal shock, which is further complicated in these units by a relativelyunusual safety injection system, with direct injection in the downcomer along thevessel wall.
The present paper describes the approach used to demonstrate the integrity of thereactor pressure vessels.
The first part consists of the assessment of the material degradation under serviceexposure, which involves:
Evaluation of surveillance program results;Charpy and mini-tensile specimens reconstitution ,in particular to optimise theuse of surveillance material;Chemical analyses;Microstructural examinations;Damage modelling (copper precipitation vs. other embrittlement.factors) andmicromechanics.( effect on fracture toughness).
The second part is the thermal-hydraulic and fracture mechanics analysis and thedefinition of mitigating measures (flux reduction, safety injection preheating, hardwaremodifications).
The approach used and the corrective actions that have been implemented (or will beimplemented in the near future), have made it possible to demonstrate successfully theintegrity of the pressure vessels in case of pressurized thermal shock.
66
Gerard;Fabry. IntegrityAssesmentofDOEL....
1. Introduction
Doel 1 and 2 are two-loop PWR's of 390 MW electrical output, ofWestinghouse design. They were the first commercial nuclear units to be commissioned inBelgium, in 1974 and 1975 respectively, and their vessels were manufactured in 1970-1972, at a time when the detrimental effect of copper and other residual elements onirradiation embrittlement sensitivity was not yet well known in the industry. The vesselswere manufactured in Belgium by Cockerill, according to the usual procedure at that time,which was to use copper-plated wire for submerged arc welding.
When the first surveillance capsules of these units were withdrawn after three years ofoperation, it became obvious that the weld was much more sensitive to irradiationembrittlement than expected. The RT^^ was still far from critical, but this raisednevertheless much concern about the future evolution of the embrittlement and it wasdecided to withdraw another capsule at Doel 1 and two at Doel 2 (the lead factorsbeing different, this would yield results for two different fluences), while at the same timethe chemical composition of the welds was investigated, in particular their copper contentsince its effect was now well known. The results from these surveillance capsules wererather reassuring, since the measured shifts of the RT^yj- were lower than for the firstcapsule, while the fluence was much higher.This atypical behaviour raised many questions, and one of them was the representativityof the weld surveillance material, since chemical analyses had evidenced a large scatterin copper content. Furthermore, the embrittlement behaviour was not fully consistentwith the usual copper embrittlement, and this led to various investigations relating tothe assessment of the material degradation under service exposure. A low leakagecore loading pattern was ako implemented in order to keep the end-of-life fluence as lowas possible.
At this time, (around 1983-1984) the pressurized thermal shock problem had becomea general concern in the industry and this was of course also the case for Doel 1 and 2.This concern was enhanced by a specific feature of these units, which is a rather uniquesafety injection system, injecting for one part in the cold leg, as usual, and for one partdirectly in the downcomer along the vessel wall. This causes locally a very severe thermalshock, the heat transfer being enhanced by the high velocity of the S. I. flow.Deterministic thermal-hydraulic and fracture mechanics calculations were performed forvarious worst-case PTS transients, with very conservative assumptions regarding theembrittlement. These analyses could not demonstrate the integrity of the pressurevessels for all the pressurized thermal shock transients considered, and this led to thedesign of hardware modifications reducing the severity of the thermal shock. In parallel,the knowledge of the material degradation had progressed significantly, showingthat the assumptions of the PTS analyses were exceedingly conservative and yieldingadditional margins that allow to be confident in the possibility for these units to reach theend of their design life and even to contemplate life extension.
67
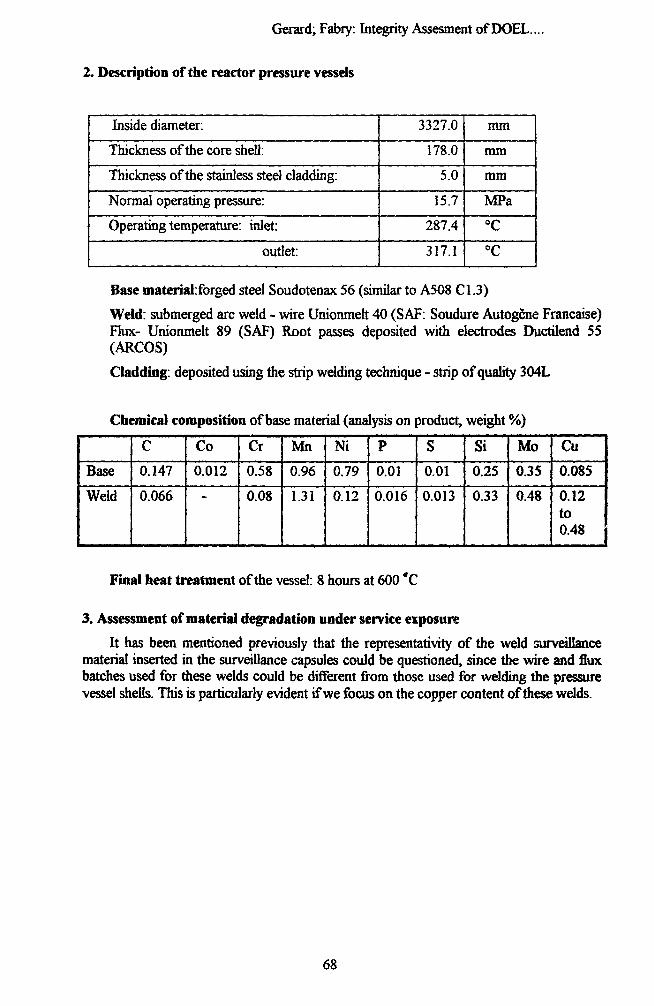
Gerard; Fabry: Integrity Assesment of DOEL.
2. Description of the reactor pressure vessels
Inside diameter:
Thickness of the core shell:
Thickness of the stainless steel cladding:
Normal operating pressure:
Operating temperature: inlet:
outlet:
3327.0
178.0
5.0
15.7
287.4
317.1
mm
mm
mm
MPa
°C
°C
Base material:forged steel Soudotenax 56 (similar to A5O8 C1.3)
Weld: submerged arc weld - wire Unionmelt 40 (SAF: Soudure Autogcne Francaise)Flux- Unionmelt 89 (SAF) Root passes deposited with electrodes Ductilend 55(ARCOS)
Cladding: deposited using the strip welding technique - strip of quality 304L
Chemical composition of base material (analysis on product, weight %)
Base
Weld
C
0.147
0.066
Co
0.012
Cr
0.58
0.08
Mn
0.96
1.31
Ni
0.79
0.12
P
0.01
0.016
S
0.01
0.013
Si
0.25
0.33
Mo
0.35
0.48
Cu0.085
0.12to0.48
Final heat treatment of the vessel: 8 hours at 600 "C
3. Assessment of material degradation under service exposure
It has been mentioned previously that the representativity of the weld surveillancematerial inserted in the surveillance capsules could be questioned, since the wire and fluxbatches used for these welds could be different from those used for welding the pressurevessel shells. This is particularly evident if we focus on the copper content of these welds.
68
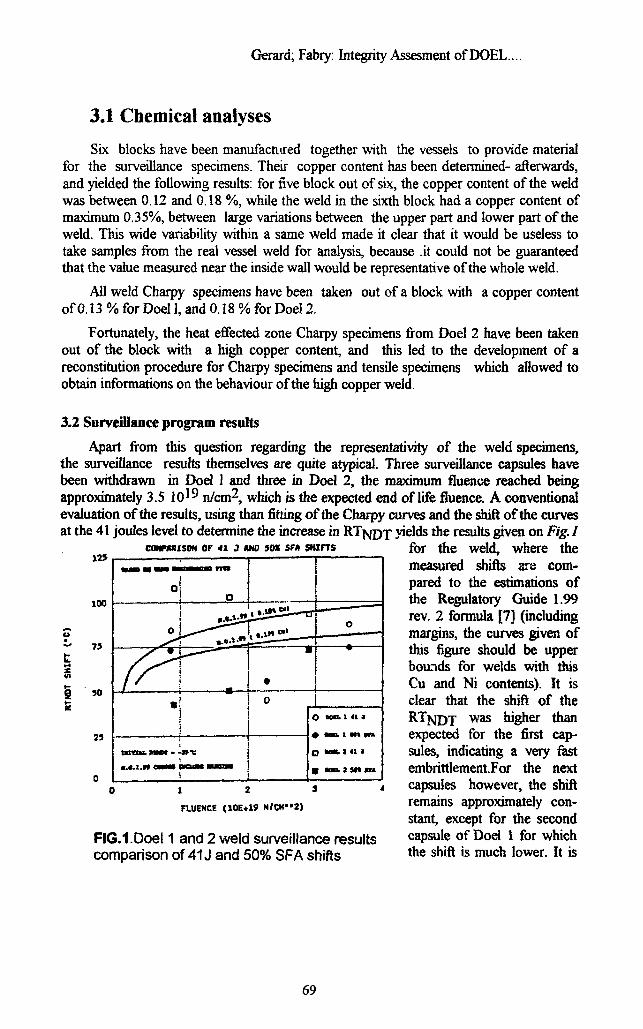
Gerard; Fabry: Integrity Assesment of DOEL....
3.1 Chemical analyses
Six blocks have been manufactured together with the vessels to provide materialfor the surveillance specimens. Their copper content has been determined- afterwards,and yielded the following results: for five block out of six, the copper content of the weldwas between 0.12 and 0.18 %, while the weld in the sixth block had a copper content ofmaximum 0.35%, between large variations between the upper part and lower part of theweld. This wide variability within a same weld made it clear that it would be useless totake samples from the real vessel weld for analysis, because .it could not be guaranteedthat the value measured near the inside wall would be representative of the whole weld.
All weld Charpy specimens have been taken out of a block with a copper contentof 0.13 % for Doel 1, and 0.18 % for Doel 2.
Fortunately, the heat effected zone Charpy specimens from Doel 2 have been takenout of the block with a high copper content, and this led to the development of areconstitution procedure for Charpy specimens and tensile specimens which allowed toobtain informations on the behaviour of the high copper weld.
3.2 Surveillance program results
Apart from this question regarding the representativity of the weld specimens,the surveillance results themselves are quite atypical. Three surveillance capsules havebeen withdrawn in Doel 1 and three in Doel 2, the maximum fluence reached beingapproximately 3.5 1 0 ^ n/cm^, which is the expected end of life fluence. A conventionalevaluation of the results, using than fitting of the Charpy curves and the shift of the curvesat the 41 joules level to determine the increase in RTJSJDX yields the results given on Fig. I
for the weld, where themeasured shifts are com-pared to the estimations ofthe Regulatory Guide 1.99rev. 2 formula [71 (includingmargins, the curves given ofthis figure should be upperbounds for welds with thisCu and Ni contents). It isclear that the shift of theRTJSJPT was higher thanexpected for the first cap-sules, indicating a very fastembrittlement.For the nextcapsules however, the shiftr e m « n s approximately con-stant, except for the secondcapsule of Doel 1 for whicht h e s h i f t i s m u c h l o w e r- lt «
or *i j wo so* snt SHIFTS
so
23
(IOE*» H/CH-2)
FIG.1 .Doel 1 and 2 weld surveillance resultscomparison of 41J and 50% SFA shifts
69
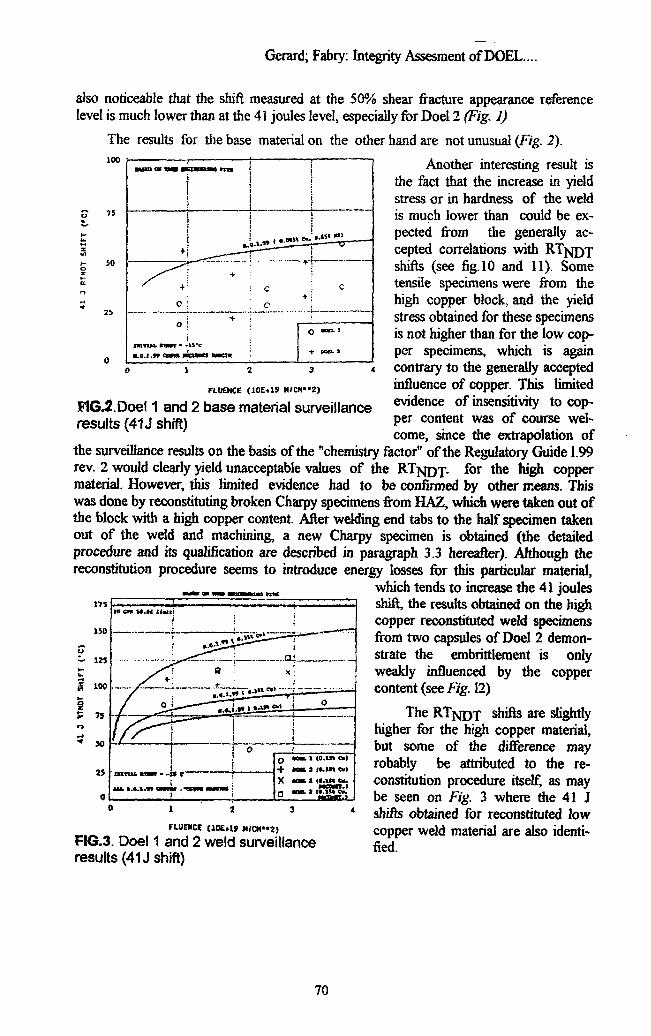
Gerard; Fabry: Integrity Assesment of DOEL....
also noticeable that the shift measured at the 50% shear fracture appearance referencelevel is much lower than at the 41 joules level, especially for Doel 2 (Fig. 1)
The results for the base material on the other hand are not unusual (Fig. I).100
75
50
ac-
FLUENCE 19 N/CN"2)
FIG J.Doe! 1 and 2 base material surveillanceresults (41J shift)
Another interesting result isthe fact that the increase in yieldstress or in hardness of the weldis much lower than could be ex-pected from the generallycepted correlations withshifts (see fig. 10 and 11). Sometensile specimens were from thehigh copper block, and the yieldstress obtained for these specimensis not higher than for the low cop-per specimens, which is againcontrary to the generally acceptedinfluence of copper. This limitedevidence of insensitivity to cop-per content was of course wel-come, since the extrapolation of
the surveillance results on the basis of the "chemistry factor" of the Regulatory Guide 1.99rev. 2 would clearly yield unacceptable values of the R T N D J . for the high coppermaterial. However, this limited evidence had to be confirmed by other means. Thiswas done by reconstituting broken Charpy specimens from HAZ, which were taken out ofthe block with a high copper content. After welding end tabs to the half specimen takenout of the weld and machining, a new Charpy specimen is obtained (the detailedprocedure and its qualification are described in paragraph 3.3 hereafter). Although thereconstitution procedure seems to introduce energy losses for this particular material,
which tends to increase the 41 joulesshift, the results obtained on the highcopper reconstituted weld specimensfrom two capsules of Doel 2 demon-strate the embrittlement is onlyweakly influenced by the coppercontent (see Fig. 12)
The R T N D T shifts are slightlyhigher for the high copper material,but some of the difference mayrobably be attributed to the re-constitution procedure itself, as maybe seen on Fig. 3 where the 41 Jshifts obtained for reconstituted low
•-»* » rv •.. rLB?? <10Er1J *"""Zi copper weld material are also identi-FIG.3. Doel 1 and 2 weld surveillance f:eHresults (41J shift)
m
15D
S
i
70
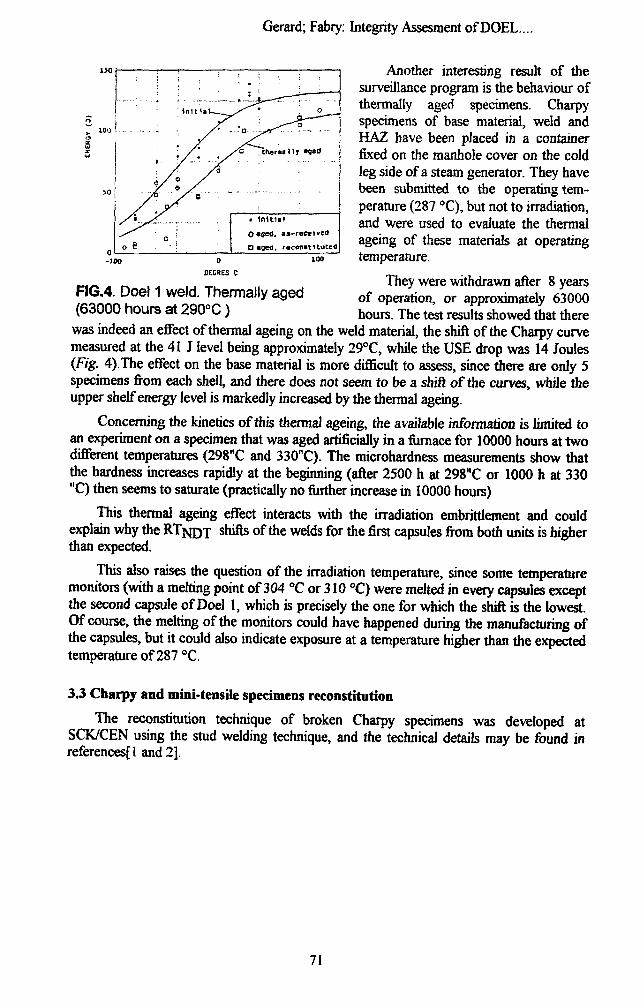
Gerard;Fabry: Integrity Assesmentof DOEL ....
ISO Another interesting result of thesurveillance program is the behaviour ofthermally aged specimens. Charpyspecimens of base material, weld andHAZ have been placed in a containerfixed on the manhole cover on the coldleg side of a steam generator. They havebeen submitted to the operating tem-perature (287 °C), but not to irradiation,and were used to evaluate the thermalageing of these materials at operatingtemperature.
They were withdrawn after 8 yearsof operation, or approximately 63000hours. The test results showed that there
FIG.4. Doel 1 weld. Thermally aged(63000 hours at 290°C)
was indeed an effect of thermal ageing on the weld material, the shift of the Charpy curvemeasured at the 41 J level being approximately 29°C, while the USE drop was 14 Joules(Fig. 4).The effect on the base material is more difficult to assess, since there are only 5specimens from each shell, and there does not seem to be a shift of the curves, while theupper shelf energy level is markedly increased by the thermal ageing.
Concerning the kinetics of this thermal ageing, the available information is limited toan experiment on a specimen that was aged artificially in a furnace for 10000 hours at twodifferent temperatures (298"C and 330"C). The microhardness measurements show thatthe hardness increases rapidly at the beginning (after 2500 h at 298"C or 1000 h at 330"C) then seems to saturate (practically no further increase in 10000 hours)
This thermal ageing effect interacts with the irradiation embrittlement and couldexplain why the RTJSJDX
srufts of the welds for the first capsules from both units is higherthan expected.
This also raises the question of the irradiation temperature, since some temperaturemonitors (with a melting point of 304 °C or 310 °C) were melted in every capsules exceptthe second capsule of Doel 1, which is precisely the one for which the shift is the lowest.Of course, the melting of the monitors could have happened during the manufacturing ofthe capsules, but it could also indicate exposure at a temperature higher than the expectedtemperature of 287 °C.
3.3 Charpy and mini-tensile specimens reconstitution
The reconstitution technique of broken Charpy specimens was developed atSCK/CEN using the stud welding technique, and the technical details may be found inreferencesfl and 2].
71
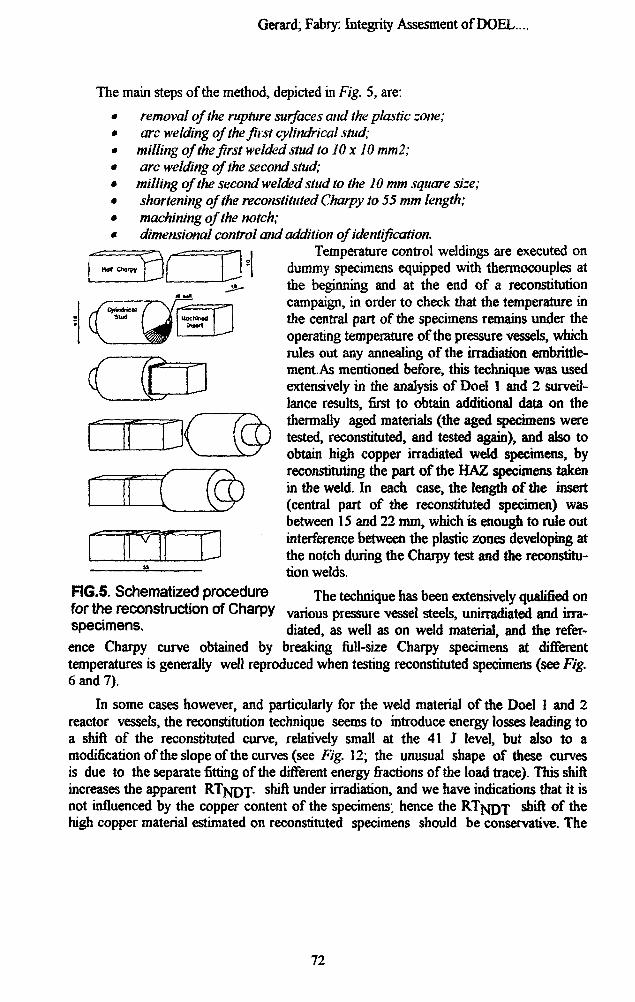
Gerard; Fabry: Integrity Assesment of DOEL....
The main steps of the method, depicted in Fig. 5, are:
removal of the rupture surfaces and the plastic zone;arc welding of the first cylindrical stud;
milling of the first welded stud to 10 x 10 mm2;arc welding of the second stud;
milling of the second welded stud to the 10 mm square size;shortening of the reconstituted Charpy to 55 mm length;machining of the notch;dimensional control and addition of identification.
Temperature control weldings are executed ondummy specimens equipped with thermocouples atthe beginning and at the end of a reconstitutioncampaign, in order to check that the temperature inthe central part of the specimens remains under theoperating temperature of the pressure vessels, whichrules out any annealing of the irradiation embrittle-ment.As mentioned before, this technique was usedextensively in the analysis of Doel 1 and 2 surveil-lance results, first to obtain additional data on thethermally aged materials (the aged specimens weretested, reconstituted, and tested again), and also toobtain high copper irradiated weld specimens, byreconstituting the part of the HAZ specimens takenin the weld. In each case, the length of the insert(central part of the reconstituted specimen) wasbetween 15 and 22 mm, which is enough to rule outinterference between the plastic zones developing atthe notch during the Charpy test and the reconstitu-tion welds.
JF1G.5. Schematized procedure T h e technique has been extensively qualified onfor the reconstruction of Charpy v a r i o u 3 pressure vessel steels, unirradiated and irra-specimens. diated, as well as on weld material, and the refer-ence Charpy curve obtained by breaking full-size Charpy specimens at differenttemperatures is generally well reproduced when testing reconstituted specimens (see Fig.6 and 7).
In some cases however, and particularly for the weld material of the Doel 1 and 2reactor vessels, the reconstitution technique seems to introduce energy losses leading toa shift of the reconstituted curve, relatively small at the 41 J level, but also to amodification of the slope of the curves (see Fig. 12; the unusual shape of these curvesis due to the separate fitting of the different energy fractions of the load trace). This shiftincreases the apparent R T ^ Q J . shift under irradiation, and we have indications that it isnot influenced by the copper content of the specimens, hence the RTjsjpx shift of thehigh copper material estimated on reconstituted specimens should be conservative. The
72
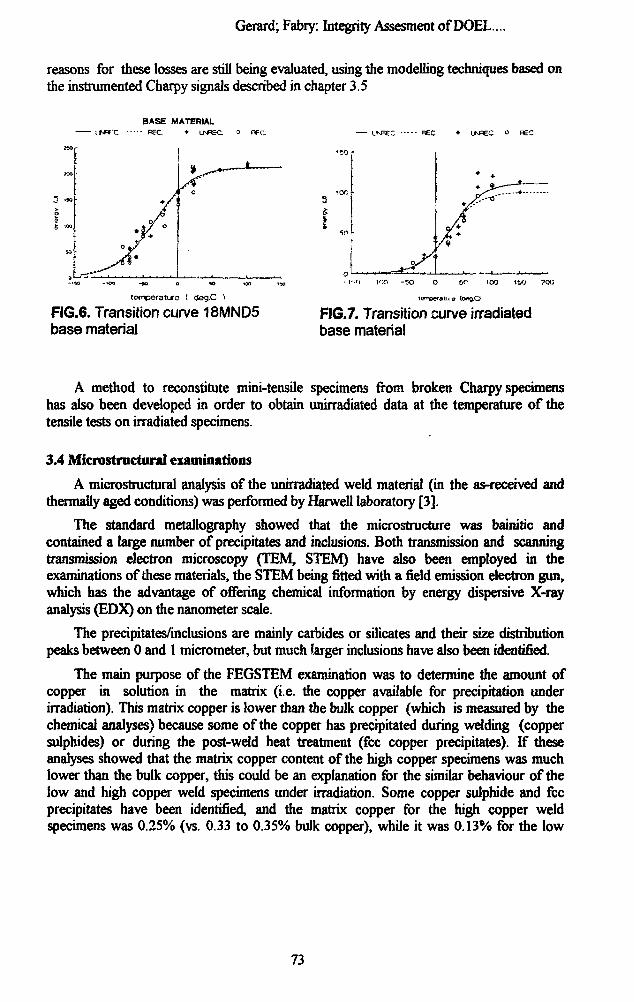
Gerard; Fabry: Integrity Assesment of DOEL....
reasons for these losses are still being evaluated, using the modelling techniques based onthe instrumented Charpy signals described in chapter 3.5
BASE MATERIALl »» "C REC • LWEC o BFC
3 «o
1 0
-'*> -KM - »
temperature ( aeg.C 1
FIG.6. Transition curve 18MND5base material
EC REC •
• I 'O ion -SO O
FIG.7. Transition curve irradiatedbase material
A method to reconstitute mini-tensile specimens from broken Charpy specimenshas also been developed in order to obtain unirradiated data at the temperature of thetensile tests on irradiated specimens.
3.4 Microstractund examinations
A microstructural analysis of the unirradiated weld material (in the as-received andthermally aged conditions) was performed by Harwell laboratory [3].
The standard metallography showed that the microstructure was bainitic andcontained a large number of precipitates and inclusions. Both transmission and scanningtransmission electron microscopy (TEM, STEM) have also been employed in theexaminations of these materials, the STEM being fitted with a field emission electron gun,which has the advantage of offering chemical information by energy dispersive X-rayanalysis (EDX) on the nanometer scale.
The precipitates/inclusions are mainly carbides or silicates and their size distributionpeaks between 0 and 1 micrometer, but much larger inclusions have also been identified.
The main purpose of the FEGSTEM examination was to determine the amount ofcopper in solution in the matrix (i.e. the copper available for precipitation underirradiation). This matrix copper is lower than the bulk copper (which is measured by thechemical analyses) because some of the copper has precipitated during welding (coppersulphides) or during the post-weld heat treatment (fee copper precipitates). If theseanalyses showed that the matrix copper content of the high copper specimens was muchlower than the bulk copper, this could be an explanation for the similar behaviour of thelow and high copper weld specimens under irradiation. Some copper sulphide and feeprecipitates have been identified, and the matrix copper for the high copper weldspecimens was 0.25% (vs. 0.33 to 0.35% bulk copper), while it was 0.13% for the low
73
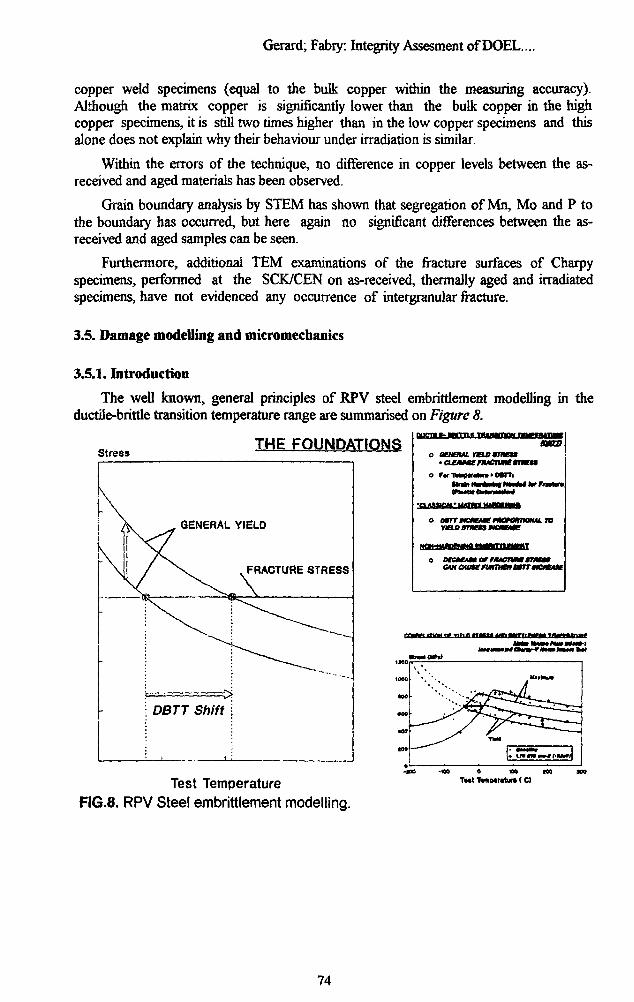
Gerard; Fabry: Integrity Assesment of DOEL....
copper weld specimens (equal to the bulk copper within the measuring accuracy).Although the matrix copper is significantly lower than the bulk copper in the highcopper specimens, it is still two times higher than in the low copper specimens and thisalone does not explain why their behaviour under irradiation is similar.
Within the errors of the technique, no difference in copper levels between the as-received and aged materials has been observed.
Grain boundary analysis by STEM has shown that segregation of Mn, Mo and P tothe boundary has occurred, but here again no significant differences between the as-received and aged samples can be seen.
Furthermore, additional TEM examinations of the fracture surfaces of Charpyspecimens, performed at the SCK/CEN on as-received, thermally aged and irradiatedspecimens, have not evidenced any occurrence of intergranular fracture.
3.5. Damage modelling and micromechanics
3.5.1. Introduction
The well known, general principles of RPV steel embrittlement modelling in theductile-brittle transition temperature range are summarised on Figure 8.
Stress THE FOUNDATIONS
\
\
-
\GENERAL YIELD
/ >v FRACTURE STRESS
1
\ .
DBTT Shift
o
o
o
o
ACMEAAI neLD$meu
F«r VMtpwaM » OtTh
(PtoBtOihriHlnJ
VtTT MCMSAVMMffTNV1ELO STIKtS WCMfMC*
MCMuarornuCTuwjcw ctmtttmiHtmwn
SI
Mu.ro
nwMHCUC
»"—«"""•• ttr Tiir ITP"T f r r r " * - " — " • • *
Test TemperatureFIG.8. RPV Steel embrittlement modelling.
74
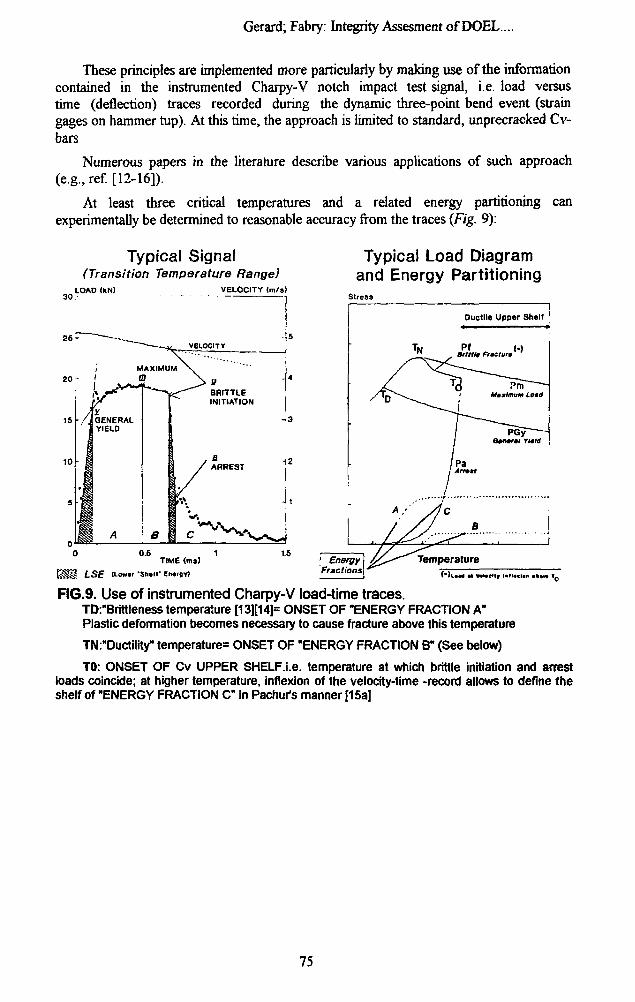
Gerard; Fabry: Integrity Assesment of DOEL....
These principles are implemented more particularly by making use of the informationcontained in the instrumented Charpy-V notch impact test signal, i.e. load versustime (deflection) traces recorded during the dynamic three-point bend event (straingages on hammer tup). At this time, the approach is limited to standard, unprecracked Cv-bars
Numerous papers in the literature describe various applications of such approach(e.g., ref. [12-16]).
At least three critical temperatures and a related energy partitioning canexperimentally be determined to reasonable accuracy from the traces (Fig. 9):
Typical Signal(Transition Temperature Range)
LOAD IkN) VELOCITY (m/s)
Typical Load Diagramand Energy Partitioning
Stress
LSE (Lowtf •
0.6 1TIME <ms)
»• EMrgy)
FIG.9. Use of instrumented Charpy-V load-time traces.TD:"Brittleness temperature [13][14]= ONSET OF "ENERGY FRACTION A"Plastic deformation becomes necessary to cause fracture above this temperature
TN:"Ductility" temperature= ONSET OF "ENERGY FRACTION B" (See below)
TO: ONSET OF Cv UPPER SHELF.i.e. temperature at which brittle initiation and arrestloads coincide; at higher temperature, inflexion of the velocity-time -record allows to define theshelf of "ENERGY FRACTION C" in Pachur's manner [15a]
75
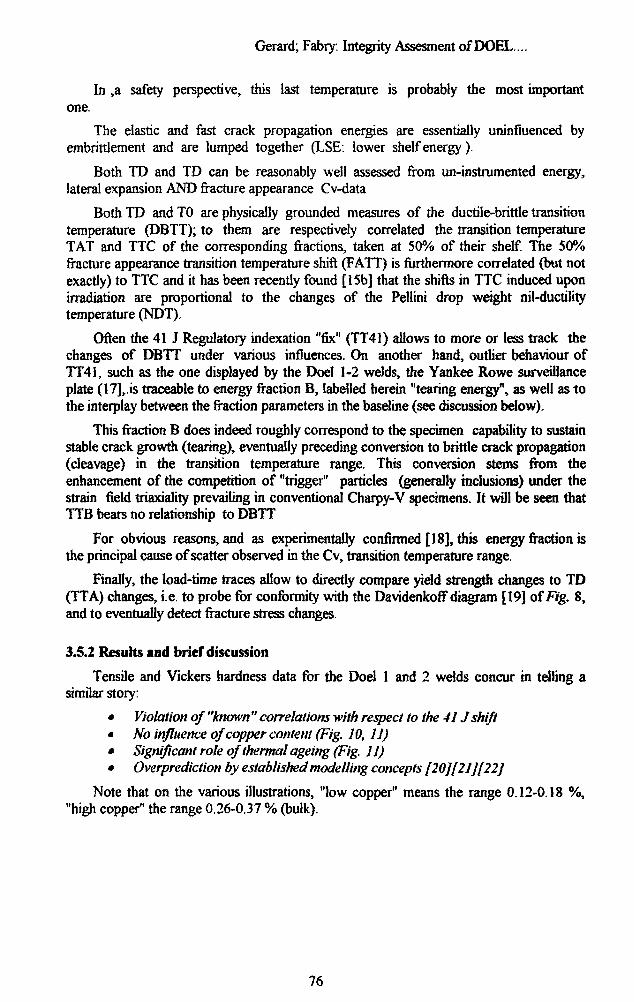
Gerard;Fabry: IntegrityAssesmentof DOEL....
In 5a safety perspective, this last temperature is probably the most importantone.
The elastic and fast crack propagation energies are essentially uninfluenced byembrittlement and are lumped together (LSE: lower shelf energy ).
Both TD and TD can be reasonably well assessed from un-instrumented energy,lateral expansion AND fracture appearance Cv-data
Both TD and TO are physically grounded measures of the ductile-brittle transitiontemperature (DBTT); to them are respectively correlated the transition temperatureTAT and TTC of the corresponding fractions, taken at 50% of their shelf. The 50%fracture appearance transition temperature shift (FATT) is furthermore correlated (but notexactly) to TTC and it has been recently found [15b] that the shifts in TTC induced uponirradiation are proportional to the changes of the Pellini drop weight nil-ductilitytemperature (NDT).
Often the 41 J Regulatory indexation "fix" (TT41) allows to more or less track thechanges of DBTT under various influences. On another hand, outlier behaviour ofTT41, such as the one displayed by the Doel 1-2 welds, the Yankee Rowe surveillanceplate (17],.is traceable to energy fraction B, labelled herein "tearing energy", as well as tothe interplay between the fraction parameters in the baseline (see discussion below).
This fraction B does indeed roughly correspond to the specimen capability to sustainstable crack growth (tearing), eventually preceding conversion to brittle crack propagation(cleavage) in the transition temperature range. This conversion stems from theenhancement of the competition of "trigger" particles (generally inclusions) under thestrain field triaxiality prevailing in conventional Charpy-V specimens. It will be seen thatTTB bears no relationship to DBTT
For obvious reasons, and as experimentally confirmed [18], this energy fraction isthe principal cause of scatter observed in the Cv, transition temperature range.
Finally, the load-time traces allow to directly compare yield strength changes to TD(TTA) changes, i.e. to probe for conformity with the Davidenkoff diagram [19] of Fig. 8,and to eventually detect fracture stress changes.
3.5.2 Results and brier discussion
Tensile and Vickers hardness data for the Doel 1 and 2 welds concur in telling asimilar story:
• Violation of "known" correlations with respect to the 41J shift• No influence of copper content (Fig. 10, 11)• Significant role of thermal ageing (Fig. 11)• Overprediction by established modelling concepts [20][21][22]
Note that on the various illustrations, "low copper" means the range 0.12-0.18 %,"high copper" the range 0.26-0.37 % (bulk).
76
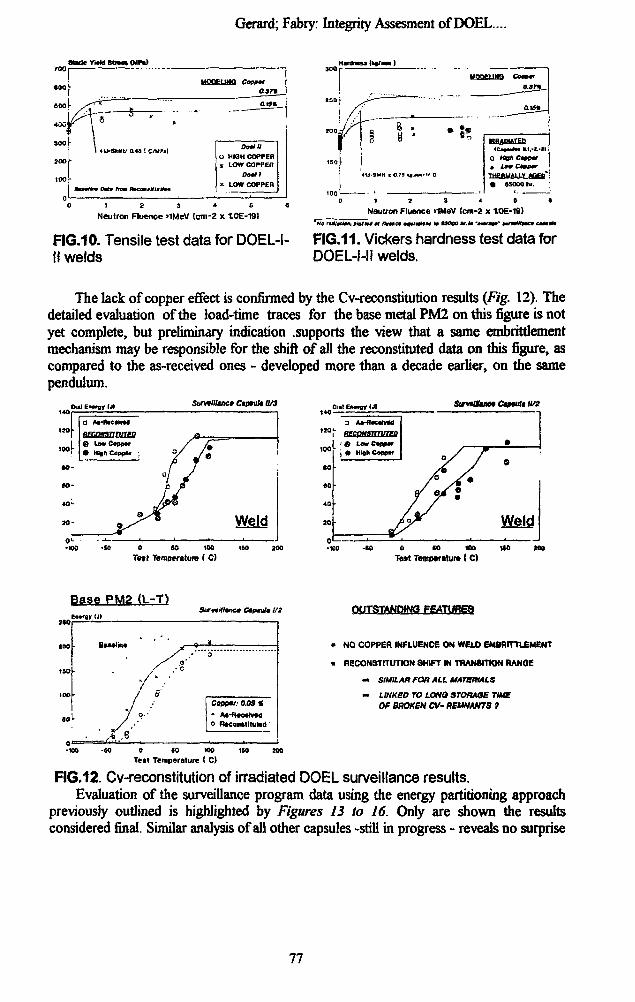
Static YMI SUM* MPa)
Gerard;Fabry: IntegrityAssesmentof DOEL....
Neutron Fkience >1MeV {om-2 x tOE-19)
1 2 3 * t •
Neutron Fluence >1MeV (cm-2 x IOE-19)HotH4 »t ArMCff •4VJWMM I * tSOOO WM •••!•• w§u~ •
FIG.10. Tensile test data for DOEL-l- FIG.11. Vickers hardness test data forII welds DOEL-I-II welds.
The lack of copper effect is confirmed by the Cv-reconstitution results (Fig. 12). Thedetailed evaluation of the load-time traces for the base metal PM2 on this figure is notyet complete, but preliminary indication .supports the view that a same embrittlementmechanism may be responsible for the shift of all the reconstituted data on this figure, ascompared to the as-received ones - developed more than a decade earlier, on the samependulum.
SmvtHUnc* Ctp*tit* 0/3
o to 100T«tt Temperature I C)
tU/1
0 (0 100Teat Temp«rttui» ( C )
Base PM2 (L-T)SuntHlmncs Ctpnlt 1/2
BM*lin«
•A
yS
o'-0
4
3
Copptr: 0.09 S
* At-R*oa<vM0 RteoMIIIUWl) '
Tett Temperoture ( C)
OUTSTANDING FEATURES
* NO COPPER INFLUENCE ON WELD EMSRITTLEMENT
* flECONSTITUTIOK 9HIFT IN TRANMTKm RANGE
- SIMILAR rOtt ALL MATERIALS
- LINKED TO LONQ STORAGE TIMEOf BROKEN CV- REMNANTS ?
FIG.12. Cv-reconstitution of irradiated DOEL surveillance results.Evaluation of the surveillance program data using the energy partitioning approach
previously outlined is highlighted by Figures 13 to 16. Only are shown the resultsconsidered final. Similar analysis of all other capsules -still in progress - reveals no surprise
77
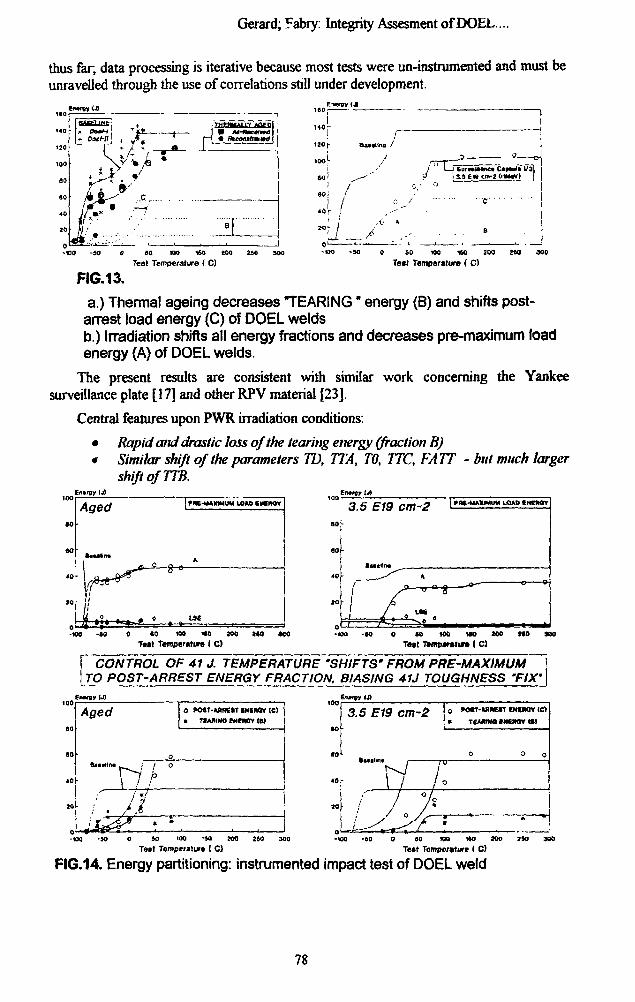
Gerard; Fabry: Integrity Assesment of DOEL....
thus far, data processing is iterative because most teste were un-instrumented and must beunravelled through the use of correlations still under development.
120 f
100
ao
- I -. fi
SO W> 160 tOO SSO 300Teat Temperature ( C)
0 50 100 160 200 J«J
Text Temperature ( C)
HG.13.
a.) Thermal ageing decreases "TEARING" energy (B) and shifts post-arrest load energy (C) of DOEL weldsb.) Irradiation shifts all energy fractions and decreases pre-maximum loadenergy (A) of DOEL welds.
The present results are consistent with similar work concerning the Yankeesurveillance plate [17] and other RPV material [23].
Central features upon PWR irradiation conditions:
• Rapid and drastic loss of the tearing energy (fraction B)• Similar shift of the parameters TD, TTA, TO, TTC, FATT - but much larger
shift of TW.E/rarsy IJ)
Aged f HE-MAXIMUM LOAD f M f K n 3.5 E19 cm-2 pat-MMMUM LOAD CNCMY
o <o ioo wo aoo M O *coT u t Tefliperiture I C)
o »o IOO no loo M O woTatt Thmt»rahra ( C)
CONTROL OF 41J. TEMPERATURE 'SHIFTS' FROM PRE-MAXIMUM \TO POST-ARREST ENERGY FRACTION. BIASING 41J TOUGHNESS 'FIX'
Aged a POST-*P«»T iNiMrr(c)• TXMIM0 Dinar IB)
I 'nJ
3.5 E19 cm-2 o »om-vn<OT CNCMY IC)
« TEAHMa intmn i»>
r ^ TW h
i.Jl50 100 ' M MX) 150 300
Toil Temperature I C)0 »0 10O 1«O 300 ISO MO
Te«t Temperature ( C)
FIG.14. Energy partitioning: instrumented impact test of DOEL weld
78
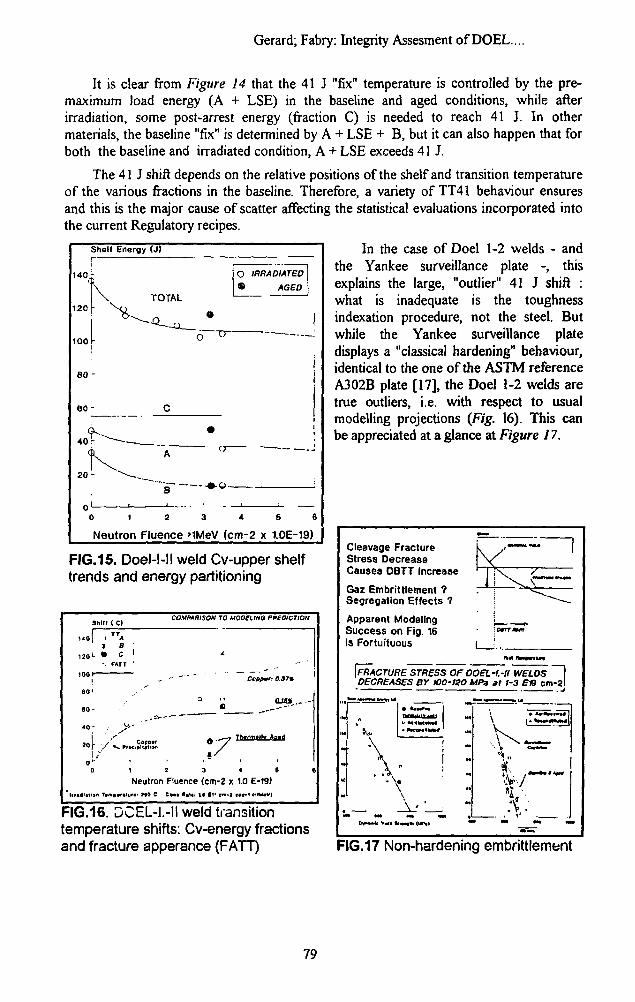
Gerard; Fabry: Integrity Assesment of DOEL..
It is clear from Figure 14 that the 41 J "fix" temperature is controlled by the pre-maximum load energy (A + LSE) in the baseline and aged conditions, while afterirradiation, some post-arrest energy (fraction C) is needed to reach 41 J. In othermaterials, the baseline "fix" is determined by A + LSE + B, but it can also happen that forboth the baseline and irradiated condition, A + LSE exceeds 41 J.
The 41 J shift depends on the relative positions of the shelf and transition temperatureof the various fractions in the baseline. Therefore, a variety of TT41 behaviour ensuresand this is the major cause of scatter affecting the statistical evaluations incorporated intothe current Regulatory recipes.
In the case of Doel 1-2 welds - andthe Yankee surveillance plate -, thisexplains the large, "outlier" 41 J shift :what is inadequate is the toughnessindexation procedure, not the steel. Butwhile the Yankee surveillance platedisplays a "classical hardening" behaviour,identical to the one of the ASTM referenceA302B plate [17], the Doel 1-2 welds aretrue outliers, i.e. with respect to usualmodelling projections (Fig. 16). This canbe appreciated at a glance at Figure 17.
140,
120
100
eo
60
Shell Energy (Jl
•
40 r
120
0()
TOTAL
C
A
- - -B
f ,
1 2
Neutron Fluence
o
6 r
•
3
>1MeV
O IRRADIATED \
•
y •
4
(cm-2
AGED i
' .--_—
j
5 3
x 1.0E-19)
FIG.15. Doel-MI weld Cv-upper shelftrends and energy partitioning
COMPARISON TO MOOeiMQ PREDICTION
Copper: 0.37%
" QJSt _ -
2 3 4 6
Neutron Fluence <cm-2 x 1.0 E-19)
FIG.16. DCEL-I.-II weld transitiontemperature shifts: Cv-energy fractionsand fracture apperance (FATT)
Cleavage FractureStress DecreaseCauses OBTT Increase
Gaz Embrittlement ?Segregation Effects ?
Apparent ModelingSuccess on Fig. 16is Fortuitous
\FRACTURE STRESS OFOOEl-L-U WELOSDECREASES BY fOO-KO MPa at 1-3 En cm-2
FIG.17 Non-hardening embrittlemfent
79
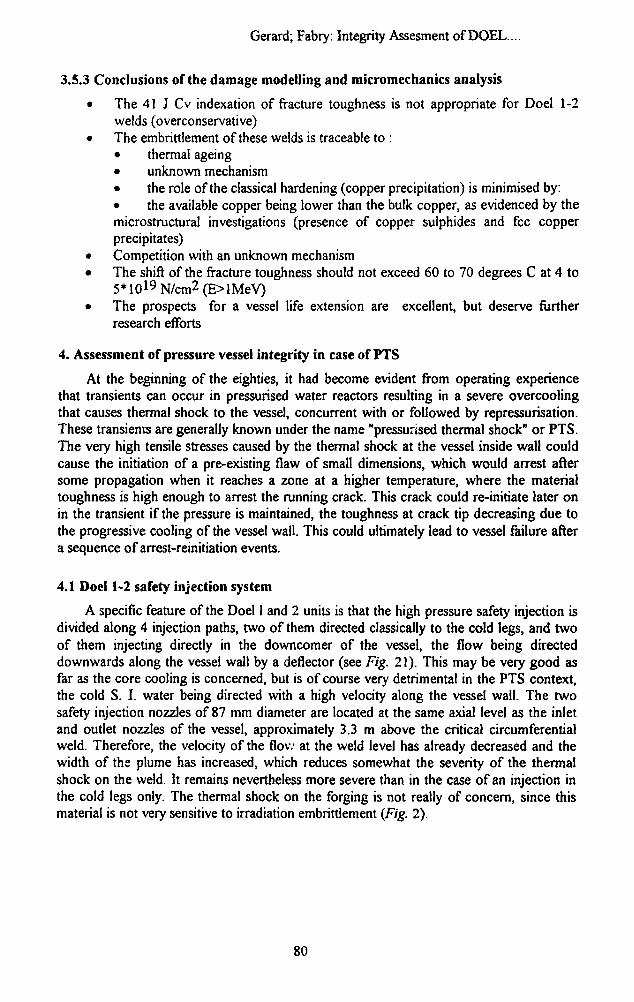
Gerard; Fabry: Integrity Assesment of DOEL....
3.5.3 Conclusions of the damage modelling and micromechanics analysis
• The 41 J Cv indexation of fracture toughness is not appropriate for Doel 1-2welds (overconservative)
• The embrittlement of these welds is traceable to :• thermal ageing• unknown mechanism• the role of the classical hardening (copper precipitation) is minimised by:• the available copper being lower than the bulk copper, as evidenced by themicrostructural investigations (presence of copper sulphides and fee copperprecipitates)
• Competition with an unknown mechanism• The shift of the fracture toughness should not exceed 60 to 70 degrees C at 4 to
5*1019N/cm2(E>lMeV)• The prospects for a vessel life extension are excellent, but deserve further
research efforts
4. Assessment of pressure vessel integrity in case of PTS
At the beginning of the eighties, it had become evident from operating experiencethat transients can occur in pressurised water reactors resulting in a severe overcoolingthat causes thermal shock to the vessel, concurrent with or followed by repressurisation.These transient are generally known under the name "pressurised thermal shock" or PTS.The very high tensile stresses caused by the thermal shock at the vessel inside wall couldcause the initiation of a pre-existing flaw of small dimensions, which would arrest aftersome propagation when it reaches a zone at a higher temperature, where the materialtoughness is high enough to arrest the running crack. This crack could re-initiate later onin the transient if the pressure is maintained, the toughness at crack tip decreasing due tothe progressive cooling of the vessel wall. This could ultimately lead to vessel failure aftera sequence of arrest-reinitiation events.
4.1 Doel 1-2 safety injection system
A specific feature of the Doel I and 2 units is that the high pressure safety injection isdivided along 4 injection paths, two of them directed classically to the cold legs, and twoof them injecting directly in the downcomer of the vessel, the flow being directeddownwards along the vessel wall by a deflector (see Fig. 21). This may be very good asfar as the core cooling is concerned, but is of course very detrimental in the PTS context,the cold S. I. water being directed with a high velocity along the vessel wall. The twosafety injection nozzles of 87 mm diameter are located at the same axial level as the inletand outlet nozzles of the vessel, approximately 3.3 m above the critical circumferentialweld. Therefore, the velocity of the flow at the weld level has already decreased and thewidth of the plume has increased, which reduces somewhat the severity of the thermalshock on the weld. It remains nevertheless more severe than in the case of an injection inthe cold legs only. The thermal shock on the forging is not really of concern, since thismaterial is not very sensitive to irradiation embrittlement (Fig. 2).
80
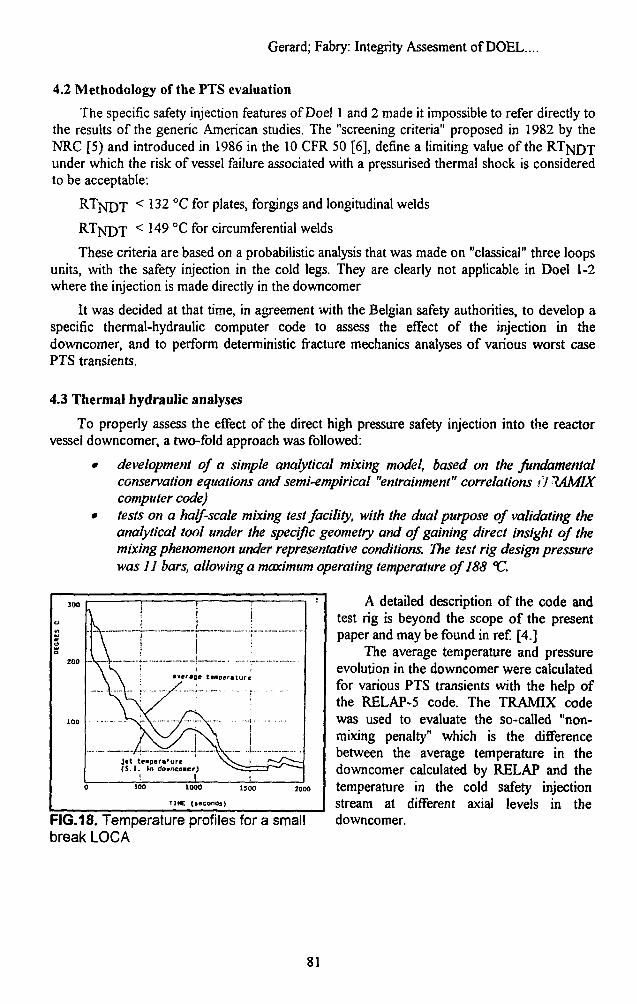
Gerard; Fabry: Integrity Assesment of DOEL....
4.2 Methodology of the PTS evaluation
The specific safety injection features of Doel 1 and 2 made it impossible to refer directly tothe results of the generic American studies. The "screening criteria" proposed in 1982 by theNRC [5) and introduced in 1986 in the 10 CFR 50 [6], define a limiting value of the RT^DTunder which the risk of vessel failure associated with a pressurised thermal shock is consideredto be acceptable".
< 132 °C for plates, forgings and longitudinal welds
< 149 °C for circumferential welds
These criteria are based on a probabilistic analysis that was made on "classical" three loopsunits, with the safety injection in the cold legs. They are clearly not applicable in Doel 1-2where the injection is made directly in the downcomer
It was decided at that time, in agreement with the Belgian safety authorities, to develop aspecific thermal-hydraulic computer code to assess the effect of the injection in thedowncomer, and to perform deterministic fracture mechanics analyses of various worst casePTS transients.
4.3 Thermal hydraulic analyses
To properly assess the effect of the direct high pressure safety injection into the reactorvessel downcomer, a two-fold approach was followed:
• development of a simple analytical mixing model, based on the fundamentalconservation equations and semi-empirical "entrainment" correlations i'l 1AMIXcomputer code)
• tests on a half-scale mixing test facility, with the dual purpose of validating theanalytical tool under the specific geometry and of gaining direct insight of themixing phenomenon under representative conditions. The test rig design pressurewas 11 bars, allowing a maximum operating temperature of188 °C.
Jet teapera'ure($.I. In downcoaer)
I I1000
TIME (seconds)
FIG. 18. Temperature profiles for a smallbreak LOCA
A detailed description of the code andtest rig is beyond the scope of the presentpaper and may be found in ref. [4.]
The average temperature and pressureevolution in the downcomer were calculatedfor various PTS transients with the help ofthe RELAP-5 code. The TRAMIX codewas used to evaluate the so-called "non-mixing penalty" which is the differencebetween the average temperature in thedowncomer calculated by RELAP and thetemperature in the cold safety injectionstream at different axial levels in thedowncomer.
81
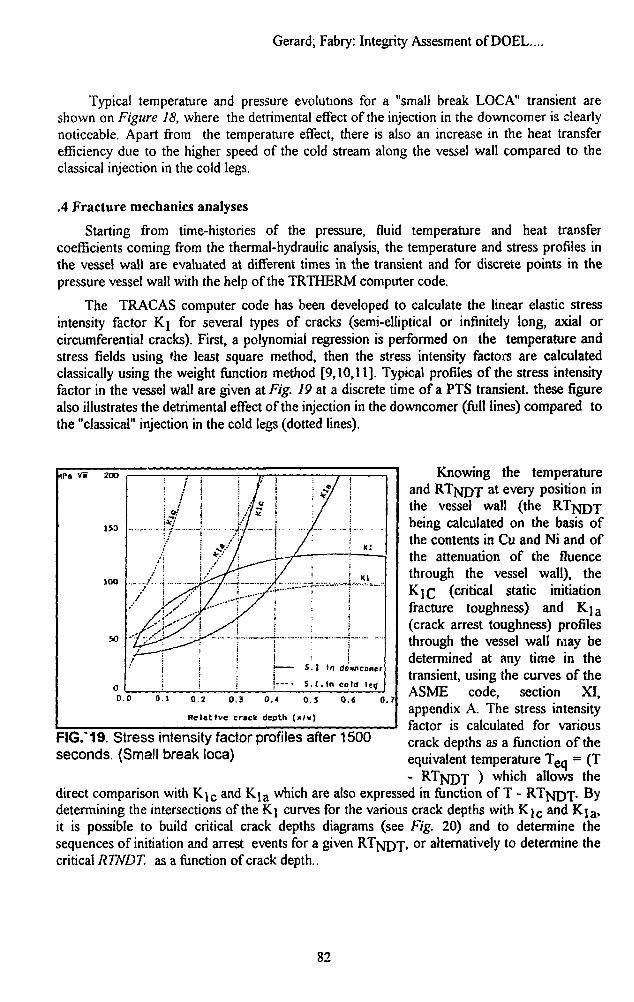
Gerard; Fabry: Integrity Assesment of DOEL....
Typical temperature and pressure evolutions for a "small break LOCA" transient areshown on Figure 18, where the detrimental effect of the injection in the downcomer is clearlynoticeable. Apart from the temperature effect, there is also an increase in the heat transferefficiency due to the higher speed of the cold stream along the vessel wall compared to theclassical injection in the cold legs.
.4 Fracture mechanics analyses
Starting from time-histories of the pressure, fluid temperature and heat transfercoefficients coming from the thermal-hydraulic analysis, the temperature and stress profiles inthe vessel wall are evaluated at different times in the transient and for discrete points in thepressure vessel wall with the help of the TRTHERM computer code.
The TRACAS computer code has been developed to calculate the linear elastic stressintensity factor Ki for several types of cracks (semi-elliptical or infinitely long, axial orcircumferential cracks). First, a polynomial regression is performed on the temperature andstress fields using the least square method, then the stress intensity factors are calculatedclassically using the weight function method [9,10,11], Typical profiles of the stress intensityfactor in the vessel wall are given at Fig. 19 at a discrete time of a PTS transient, these figurealso illustrates the detrimental effect of the injection in the downcomer (full lines) compared tothe "classical" injection in the cold legs (dotted lines).
IPs Vm 200
150
100
50
Knowing the temperatureand R T J J D T at every position inthe vessel wall (the RTJNJDJ
being calculated on the basis ofthe contents in Cu and Ni and ofthe attenuation of the fluencethrough the vessel wall), theK]£ (critical static initiationfracture toughness) and K j a
(crack arrest toughness) profilesthrough the vessel wall may bedetermined at any time in thetransient, using the curves of theASME code, section XI,appendix A. The stress intensityfactor is calculated for variouscrack depths as a function of theequivalent temperature Teq = (T- RTjsJDT ) which allows the
direct comparison with K i c and Ki a which are also expressed in function of T - R T N D J . Bydetermining the intersections of the K\ curves for the various crack depths with K j c and Kj a ,it is possible to build critical crack depths diagrams (see Fig. 20) and to determine thesequences of initiation and arrest events for a given RTjyfDj, or alternatively to determine thecritical RTNDT. as a function of crack depth..
/
!
I
11
4/^i
f
/ / ^
• £,••••.
/ - -
• / / * •
,7/
j
j /
/ '
'.
s.— - s.
t/
I
r.
/
in
In
t
K:
KL
1
downconer
cold ?«9
0 .0 0 .1 0.2 0.3 0.4 0.5
Relative cr«ck depth (x/u)
0 .6 0.7
FIG/19. Stress intensity factor profiles after 1500seconds. (Small break loca)
82
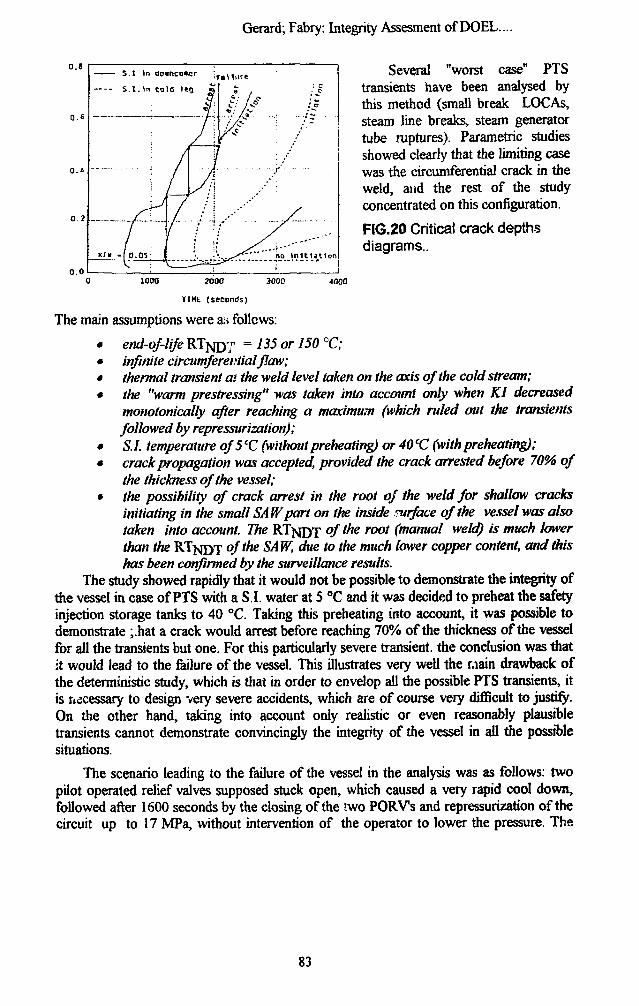
Gerard;Fabry: IntegrityAssesmentofDOEL...
o.s
0.6
0 . *
0 .2
0.0
S.I In
S.I . In
x/» -1 0.05
dovnconcr
cola leg •
/
;;
T
>
/
• Hure*. : C
... J./i1. ...: - .. ..*£ ... .
Several "worst case" PTStransients have been analysed bythis method (small break LOCAs,steam line breaks, steam generatortube ruptures). Parametric studiesshowed clearly that the limiting casewas the circumferential crack in theweld, and the rest of the studyconcentrated on this configuration.
FIG.20 Critical crack depthsdiagrams..
1000 7000
TIME (seconds)
3000 4000
The main assumptions were as follows:
• end-of-life R T N T J ; = 135 or 150 °C;• infinite circumferential flaw;• thermal transient at the weld level taken on the axis of the cold stream;• the "warm prestressing" was taken into account only when Kl decreased
monotonically after reaching a maximum (which ruled out the transientsfollowed by repressurization);
• S.I. temperature of5cC(withoutpreheating) or 40X1 (withpreheating);• crack propagation was accepted, provided the crack arrested before 70% of
the thickness of the vessel;• the possibility of crack arrest in the root of the weld for shallow cracks
initiating in the small SAW part on the inside surface of the vessel was alsotaken into account. The R T ^ J D J of the root (manual weld) is much lowerthan the R T N D T °/the SAW> ^ t o the much ^awer coPPer content, and thishas been confirmed by the surveillance results.
The study showed rapidly that it would not be possible to demonstrate the integrity ofthe vessel in case of PTS with a S.I. water at 5 °C and it was decided to preheat the safetyinjection storage tanks to 40 °C. Taking this preheating into account, it was possible todemonstrate ;.hat a crack would arrest before reaching 70% of the thickness of the vesselfor all the transients but one. For this particularly severe transient, the conclusion was thatit would lead to the failure of the vessel. This illustrates very well the raain drawback ofthe deterministic study, which is that in order to envelop all the possible PTS transients, itis necessary to design very severe accidents, which are of course very difficult to justify.On the other hand, taking into account only realistic or even reasonably plausibletransients cannot demonstrate convincingly the integrity of the vessel in all the possiblesituations.
The scenario leading to the failure of the vessel in the analysis was as follows: twopilot operated relief valves supposed stuck open, which caused a very rapid cool down,followed after 1600 seconds by the closing of the two PORVs and repressurization of thecircuit up to 17 MPa, without intervention of the operator to lower the pressure. The
83
Gerard; Fabry: Integrity Assesment of DOEL....
probability of occurrence of such an accident is negligibly small and its contribution to thetotal risk of vessel failure in a probabilistic analysis would certainly be very low, but ofcourse this type of argument may not be used in a deterministic analysis. It is also worthpointing out that such a transient would also lead to the failure of a "classical" vesselsatisfying the screening criterion of the 10 CFR50.61. Although the fact that only thistransient among all the transients analysed would lead to the vessel failure was not a badresult, it remains that the integrity of Doel 1 and 2 reactor pressure vessels in case of PTScould not be demonstrated using this methodology, so the alternative was as follows:
• either perform a probabilistic analysis, as described in the RegulatoryGuide 1.154 [8];
• or implement a major hardware modification to eliminate the injection in thedowncomer, which would make it possible to use the generic Americanstudies and to justify the integrity of the vessel by demonstrating that the end-of-life RTNDT. is lower than the limiting value of the screening criterion.
This second possibility, which reduces physically the severity of the thermal shock bya hardware modification, was preferred to the first one, which was only a "paper"justification.
5. Hardware modifications
As already mentioned hereabove, a first modification that was implemented relativelyeasily was the preheating of the SI water tanks to 40 °C, which reduces markedly theseverity of the thermal shock on the vessel wall while remaining compatible with the SIrequirements for core cooling. This was implemented in 1990 but was nevertheless notsufficient to allow to demonstrate the vessel integrity for the worst case transient andconservative assumptions used in the PTS analysis.
It was therefore decided to implement a more radical hardware modification, whichconsist of restoring the Upper Plenum Injection (UPI).
In this configuration, the injection in no longer done in the downcomer, but directlyin the upper plenum above the core, through a hole in the internals. This was in fact theinitial design of these units, which was modified very late (the internals were already beingmanufactured) as a consequence of NRC questions regarding the efficiency of the corecooling with this configuration. The thermal-hydraulic codes available at that time did notallow to demonstrate that this concept would guarantee sufficient margins, and hence itwas abandoned.
The progress in thermal-hydraulic codes now makes it possible to demonstrate thatthe required margins are obtained, and the modification will be carried out during the nextoutage of the units (summer 1992). Fig. 21 illustrates the principle of the modification,which consists of machining a hole in the internals by electric discharge machining whilethey rest on their stand in the reactor pool. A sleeve is then inserted in the existingdeflector and fixed by mechanical expansion to close the injection path towards thedowncomer and direct the S.I. flow in the upper plenum. The whole operation has alreadybeen qualified under representative conditions on a mock-up.
84
Gerard; Fabry: Integrity Assesment of DOEL....
The singularity of the units being eliminated by this modification, it is now possible touse the American regulations (10CFR50.61) to assess •the risk of vessel failure in case ofpressurised thermal shock. Since May 1991, the R T N D T to be compared to the screeningcriteria must be evaluated by the formula of the Regulatory Guide 1.99 rev. 2, which yieldsfor Doel 1-2, assuming the most unfavourable chemical composition measured onsurveillance specimens (0.35% Cu and 0.125% Ni) and for the end-of-life fluence of3.5*1019n/cm2(E>lMeV): RTJVDT = 126 °C
This value being well under the 149 °C allowed in the 1OCFR50.61 for acircumferential weld, this demonstrates satisfactorily the integrity of the pressure vessel incase of pressurised thermal shock.
6. Conclusions
The embrittlement behaviour of the Doel 1 and 2 reactor pressure vessels is ratheratypical, particularly for the circumferential weld assembling the two core shells:
• accelerated embrittlement for low fluence, followed by apparent saturation;• increase in yield strength or hardness much lower than could be expected
according to the generally accepted correlations with the Charpy shift ("uon-hardening embrittlement");
• almost no sensitivity to the copper content;• possibility of thermal ageing at service temperature.
The safety evaluation has been performed strictly on the basis of the existingregulations, based on the evaluation of the R T N D T by the shift of the Charpy energycurves measured at the 41 joules level. A more sophisticated evaluation based on thedifferent energy fractions of the instrumented Charpy signal allows a better understandingof the complex phenomena of in-service degradation and may cast some doubts on thegeneral validity of the 41 joules indexation procedure. This procedure is probablyoverconservative in the specific case of the Doel 1 and 2 welds, and the shift of thefracture toughness should be smaller than the shift of the Charpy curves at the 41 J level.
The reconstitution of Charpy specimens allowed to gain valuable information on thebehaviour of the high-copper weld material, that was not represented in the initialsurveillance program. As expected from the results of high copper tensile specimens, theCharpy tests confirmed that the embrittlement of this particular material is only weaklysensitive to the copper content. These results demonstrate the existence of additionalmargins compared to the predictions of the R.G.1.99 rev.2
Although a deterministic PTS analysis based on worst case transients and on veryconservative assumptions concerning the R T N D T
c o u id n o t demonstrate the integrity ofthe vessels in case of PTS for all the transients evaluated, the results obtained on the highcopper weld material indicate that the RTJSJDT values used in the analysis were probablyexceedingly conservative. However, since we do not have informations on theembrittlement of this material for the end-of-life fluence (but they should be available in1993), a hardware modification will be implemented which will eliminate the safelyinjection in the downcomer. This will make it possible to use the American regulations (10CFR50.61) to assess the risk of vessel failure in case of pressurised thermal shock.
85
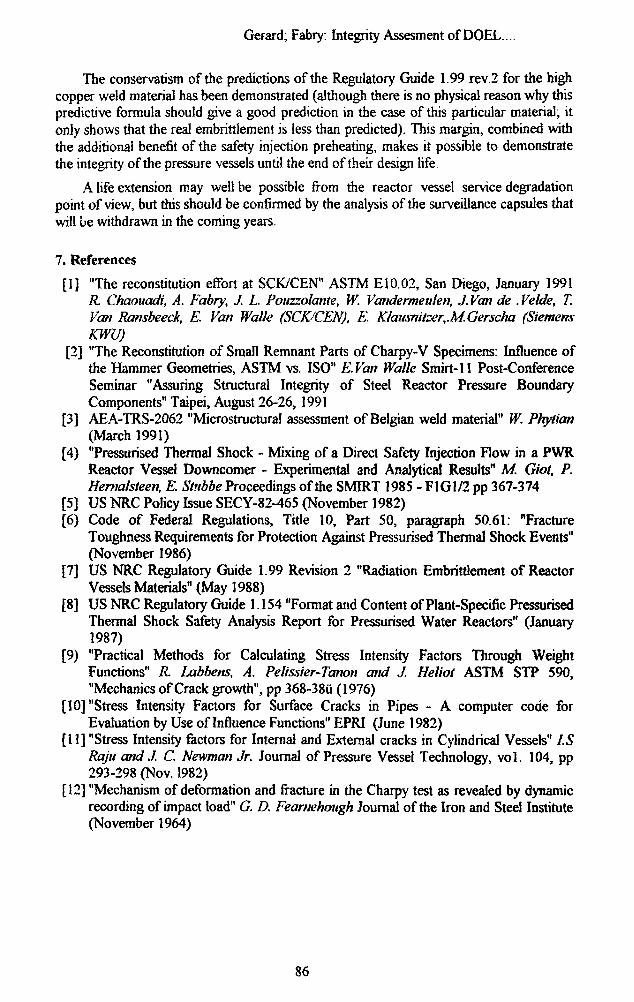
Gerard; Fabry: Integrity Assesment of DOEL....
The conservatism of the predictions of the Regulatory Guide 1.99 rev.2 for the highcopper weld material has been demonstrated (although there is no physical reason why thispredictive formula should give a good prediction in the case of this particular material, itonly shows that the real embrittlement is less than predicted). This margin, combined withthe additional benefit of the safety injection preheating, makes it possible to demonstratethe integrity of the pressure vessels until the end of their design life.
A life extension may well be possible from the reactor vessel service degradationpoint of view, but this should be confirmed by the analysis of the surveillance capsules thatwill be withdrawn in the coming years.
7. References
[I] "The reconstirution effort at SCK/CEN11 ASTM El0.02, San Diego, January 1991R. Chaouadi, A. Fabry, J. L Pouzzoiante, W. Vandermeukn, J. Van de . Velde, T.Van Ransbeeck, E. Van Walk (SCK/CEN), E. Klausnitzer,MGerscha (SiemensKWU)
[2] "The Reconstitution of Small Remnant Parts of Charpy-V Specimens: Influence ofthe Hammer Geometries, ASTM vs. ISO" EVan Walk Smirt-11 Post-ConferenceSeminar "Assuring Structural Integrity of Steel Reactor Pressure BoundaryComponents" Taipei, August 26-26, 1991
[3] AEA-TRS-2062 "Microstructural assessment of Belgian weld material" W. Phyiian(March 1991)
[4) "Pressurised Thermal Shock - Mixing of a Direct Safety Injection Flow in a PWRReactor Vessel Downcomer - Experimental and Analytical Results" M. Giot, P.Hernalsteen, E. Stttbbe Proceedings of the SMIRT 1985 - F1G1/2 pp 367-374
[5] US NRC Policy Issue SECY-82-465 (November 1982)[6) Code of Federal Regulations, Title 10, Part 50, paragraph 50.61: "Fracture
Toughness Requirements for Protection Against Pressurised Thermal Shock Events"(November 1986)
[7] US NRC Regulatory Guide 1.99 Revision 2 "Radiation Embrittlement of ReactorVessels Materials" (May 1988)
[8] US NRC Regulatory Guide 1.154 "Format and Content of Plant-Specific PressurisedThermal Shock Safety Analysis Report for Pressurised Water Reactors" (January1987)
[9) "Practical Methods for Calculating Stress Intensity Factors Through WeightFunctions" R. Labbens, A. Pelissier-Tcmon and J. Heliot ASTM STP 590,"Mechanics of Crack growth", pp 368-38Q (1976)
[10] "Stress Intensity Factors for Surface Cracks in Pipes - A computer code forEvaluation by Use of Influence Functions" EPRI (June 1982)
II1] "Stress Intensity factors for Internal and External cracks in Cylindrical Vessels" I.SRaju and J. C. Newman Jr. Journal of Pressure Vessel Technology, vol. 104, pp293-298 (Nov. 1982)
[12] "Mechanism of deformation and fracture in the Charpy test as revealed by dynamicrecording of impact load" G. D. Fearnehotigh Journal of the Iron and Steel Institute(November 1964)
86
Gerard, Fabry: Integrity Assesment of DOEL ...
[13] "Radiation effects on the Metallurgical Fracture parameters and fracture toughnessof Pressure Vessel Steels" Wullaert R. A. , Ireland D. R. ant Tetelman A. S. ASTMSTP 484 (1970), PP 20-39
[14] "Fracture of Structural Materials" Tetelman A. S. and Me Evily A. J., John Wiley &Sons Inc.
[15a] "Influence of Radiation Damage Mechanisms on the Load Signal and on theTransition Curve of Instrumented Impact Testing" D. Pachur J. Nucl. Materials 160.(1988), pp 24-33
[15b] "Comparison of Drop-Weight and Instrumented Charpy Impact Test Results" D.Pachur Private Communication, April 15, 1991, to be published (ASTMSymposium, .Denver 1992)
[16] "A Generalised Methodology for Obtaining Quantitative Charpy Data from TestsSpecimens of Nonstandard Dimensions" Manahan M. P. and Charles C. Nucl.Techn., Vol. 90 (1990), pp. 245-259
[17] Joint SCK/CEN/Yankee Atomic Electric Co. Research to Understand theEmbriitlement Behaviour of the Yankee Surveillance Plate" Fabry A., BiemillerR,Van de Velde J., Carter R. G. To be published
[18] "Use of Charpy Impact Load-time Trace to quantify RPV Steel Embrittlement FabryA., Vande Velde J., Puzzolante J. L, Noels Th., Van Walk E., Thomas G., PetrovaT. Instrumented Impact Testing of Metallic Materials, National Physical Laboratory,Teddington UK,( Nov. 14-15, 1991)
[19] "Mechanical Metallurgy", Second Edition Dieter G. £., Me Graw Hill Book Co.,New York (1976)
[20] "A Model for PWR Pressure Vessel Embrittlement" Fisher S. B. and Buswell J. T.Int. J. Pressure Vessels and Piping, 27 (1987), pp 91-135
[21] "On the Dominant Mechanism of Irradiation Embrittlement of Reactor PressureVessel Steels" Odette G. R, Scripta Metallurgies, 17 (1983), pp. 1183-1188.
[22] "Embrittlement and Annealing Mechanisms of LWR Pressure Vessel Steels" FabryA., and Van de Velde J. IAEA Specialists' Meeting "Radiation Embrittlement ofReactor Pressure Vessel Steels", Balatonfured, Hungary, Sept. 25-28,1990
[23] "Re-embrittlement of PWR Pressure vessel A533B Plate after 343 °C Anneal" FabryA. and Petrova T. To be published, based on "Rapport de Fin de Stage" by T.Petrova
87
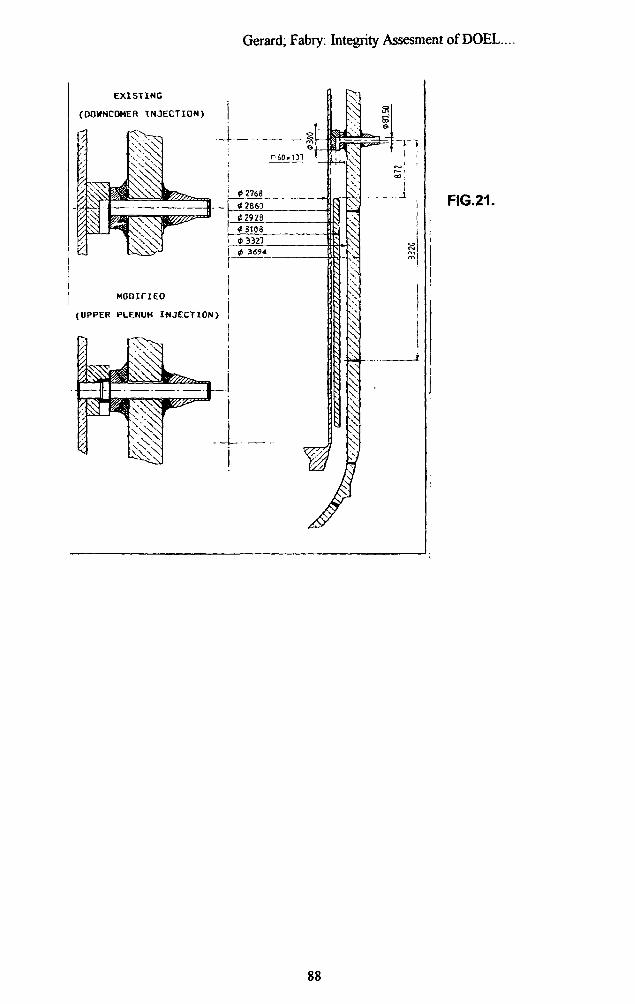
Gerard; Fabry: Integrity Assesment of DOEL.
EXISTING
(D0WNCW4ER INJECTION)
MOOIFIEO
(UPPER PLENUM INJECTZON)
FIG.21.
88
G Hugot Evaluation of..
EVALUATION OF IN-SERVICE AGEING OF HEAVYPWR COMPONENTS
G. HUGOT
FRAMATOME,
Tour FIA T, Paris IM Defense)
ABSTRACT
The main degradation processes of PWR NSSS are presented with some examples ofthe actions undertaken in France to evaluate and monitor these degradations, in order toallow for plant operation with acceptable safety and reliability conditions.
During operation, PWR components are mainly submitted to mechanical and thermalloadings, and to chemical and nuclear effects, the action of which can result in damages.
These damages can be of different origins. The most important of ,them can beclassified in three main categories according to the damage mechanism :
• Generalised damages lead to a general thinning of walls which can lower themargins with respect to plastic instability. This type of damage can be dueeither to wear, to generalised corrosion, or to erosion corrosion.
• IAHXII damages are related to the initiation of defects and or to thepropagation of existing defects. This type of damage can be caused either bystress corrosion or by fatigue.
• The evolution of mechanical properties of materials during plant operation.The most significant of them being caused either by thermal ageing or byirradiation embrittlement.
As much as possible, theses effects are taken into account at the early design stage ofcomponents since the proof of their safe mechanical behaviour is required by the regulationand by the construction codes. In the case of a change of the operating conditions duringplant life the early justification has to be updated by a new analysis
During the operation stage, in service inspection and survey shall therefore have twopurposes :
First, to ensure that the operating conditions fulfil the requirements of design Themain parameters to survey include :
• the chemistry of primary and secotuiary fluid, which is a very importantparameter for the corrosion of materials with the associated possibility ofactivation of corrosion products.
• the operation transients (pressure, temperature, flow rates) ; this surveillancehas to ensure that transients taken into account at the design stage areconservative : another important point is their counting.
• the evolution of material properties such as irradiation embrittlementsurveillance of pressure vessel steel.
89
G. Hugot. Evaluation of...
Second, to ensure that no defect harmful for safe and reliable operation appearswhatever its cause
In addition with the conventional tools used for the survey (instrumentation, nondestructive examination) specific tools and methods are developed or improved , they relymainly on the analysis of operation feedback and on predictions. Some examples of theseapplications are given in this paper.
1. GENERAL
During operation, PWR components are mainly submitted to mechanical and thermalloadings, and to chemical and nuclear effects, the action of which can obviously result indamages increasing with time.
2. FACTORS LIMITING HEAVY COMPONENTS LIFE DURATION
Among the different possible damage mechanisms, we shall limit ourselves to the mostsignificant ones in what follows : those which are capable to have a limiting effect on thelife duration of heavy components of PWR NSSS.
Some of these damages appear to be inescapable and are therefore taken into accountsince the early stage of design. For this class of damages the object of the surveillance is toensure that the effect of their appearance was not underestimated.
Some other damages can also appear though unexpected. The object of correctiveactions is to ensure that they will be avoided in other locations of the plant and also tosurvey their evolution where they eventually appear.
In what follows we will successively deal with generalised damages, local damages andthe in service evolution of material properties.
2.1 Generalised damages
These damages result in the thinning of walls affecting the margins with respect tofailure due to plastic instability. The involved mechanism include wear, generalisedcorrosion and erosion-corrosion
• Wear phenomena generally appear at the level of pieces into contact whichundergo relative motion.
• For heavy PWR components main concerned areas are for example, controlrods and their guide tubes, steam generator bundle at the level of tube supportplates and at the location of ami vibration bars.
• Generalised corrosion phenomena are taken into account since the early-design stage, in terms of corrosion thickness allowance. This allowance is onlysignificant on the secondary circuit with its uncladded ferritic steelcomponents. On the primary circuit a stainless steel cladding on all ferriticcomponents limits the amount of corrosion products prone to activation underirradiation and therefore makes generalised corrosion negligible.
• Erosion-corrosion phenomena are basically chemical since they concerncarbon steel components submitted to circulating water or humid steam.
90

G Hugot: Evaluation of...
• Erosion-corrosion generally appears on the secondary circuit for instance onthe steam generators feedwater distribution torus and its J-tubes.
• Local damages• These damages are related to mechanisms who induce the creation or the
propagation of cracks in localised zones. Major current encountered problemsdeal either with stress corrosion phenomena or with fatigue crack initiation inhighly solicited areas.
• In what concerns stress corrosion, a typical exempla is related to steamgenerators tubes.
• The problem is of major importance since it determines the life duration of theexchanger. This subject could be the subject of an another paper by itself...
• The other well known phenomena concerns fatigue cracking. The mechanismdevelops in two stages:* the initiation of a crack in a highly solicited area,* the propagation of this crack which can lead to leak or to fast fractureaccording to the circumstances.
These stages of initiation and propagation can be encountered not only in a soundstructure but also in structures affected by pre-existing defects originated during fabricationoperations such as welding.
The involved phenomena are generally of mechanical and thermal origin.
2.3 Evolution of material properties
The appearance of damages can also be due to the evolution of mechanical propertiesof materials during plant operation. The most significant of these damages can be causedeither by thermal ageing or by irradiation embrittlement.
In what concerns thermal ageing. PWR operating temperatures are rather low andtherefore short term ageing of materials should not be a major problem. It is not the samewhen considering ageing over a long period, say over 40 years.
The other problem is the embrittlement of materials under fast neutron irradiation. Itmainly concerns the part of the reactor pressure vessel surrounding the reactor core, the«core beltline». The changes in properties include increased ultimate and yieldstrengths, increased transition reference temperature and therefore decreased notch ductilityreducing the margin with respect to failure by fast fracture.
2.4 Consumption of margins and incidence on life duration
The effects of the various damage mechanisms and of their possible combination areto:
• reduce the available margins,• reduce the available life duration, the criteria of acceptability of this margin
being determined,• modify the operating conditions, when the actual ones do not satisfy airy
longer the safety requirements.
91
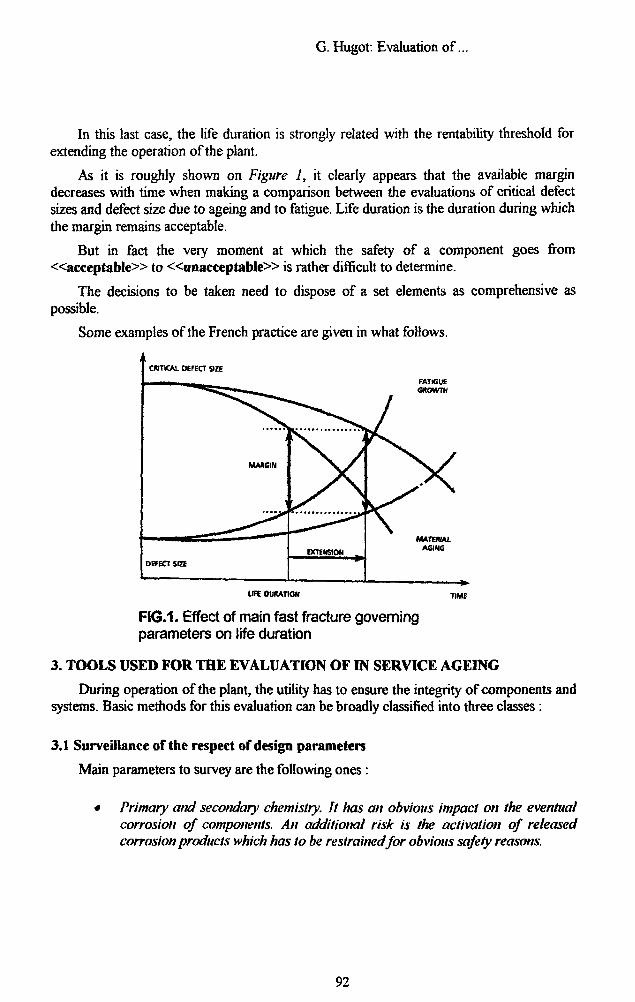
G. Hugot: Evaluation of...
In this last case, the life duration is strongly related with the rentability threshold forextending the operation of the plant.
As it is roughly shown on Figure 1, it clearly appears that the available margindecreases with time when making a comparison between the evaluations of critical defectsizes and defect size due to ageing and to fatigue. Life duration is the duration during whichthe margin remains acceptable.
But in fact the very moment at which the safety of a component goes from«acceptable» to «unacceptable» is rather difficult to determine.
The decisions to be taken need to dispose of a set elements as comprehensive aspossible.
Some examples of the French practice are given in what follows.
FATIGUEGROWTH
LIFE DURATION TIME
FIG.1. Effect of main fast fracture governingparameters on life duration
3. TOOLS USED FOR THE EVALUATION OF IN SERVICE AGEING
During operation of the plant, the utility has to ensure the integrity of components andsystems. Basic methods for this evaluation can be broadly classified into three classes :
3.1 Surveillance of the respect of design parameters
Main parameters to survey are the following ones :
• Primary and secondary chemistry. It has an obvious impact on the eventualcorrosion of components. An additional risk is the activation of releasedcorrosion products which has to be restrained for obvious safety reasons.
92
G. Hugot: Evaluation of...
• Transients during operation (pressure, temperature, flow rate, ) . Thesurveillance of these transients allows to verify that the actual operatingloadings are those who -were predicted since the design stage. In fact thesedesign loading generally appear to be overestimated since design data areconservative ones.
• This conservatism allows to hope for a potential extension of life duration.This verification is made possible by the «counting of transients duringoperation». In addition the continuous surveillance of operating conditionsprovides for real time evaluations of the fatigue of materials.
• This surveillance of loadings «seen» by the components can also beensured by means of local instrumentations. Sensors such as thermocouples orstrain gauges for instance can be installed in sensible areas, this method isonly applicable where local damages due to specific loadings are expected,such as vibrations for instance.
• The evolution of mechanical properties of materials during plant operations.The control generally consists of destructive testing on samples submitted toloadings representative of those the component was actually submitted to. Thissurveillance has therefore to be foreseen before plant operation.
3.2 Non destructive examination
Non destructive examination tests are for the most part performed during plant outageand especially during regulatory pressure test for pressure vessels, which are submitted to apre established time schedule.
The object of these controls is first to ensure that no defect harmful for safe andreliable operation appears whatever its cause, then to ensure that defects that were judgedacceptable during the past examinations remain still acceptable.
On a technical point of view, the tradition is to focus primarily on welded assemblies.The controls can be surface controls or volumetric controls. A great deal of Research andDevelopment is currently being performed to enhance the possibilities of "classicalmethods" and to develop new ones.
3.3 Experience feedback analysis and prediction tools
This subject should have been the first one to appear in this paper since as a generalrule it is the experience feedback which is the basis for the definition of surveillance andmaintenance programs.
The statistical exploitation of available data is of great value since it contributes toimprove the probabilistic forecasting models of behaviour of components and systems.
The use of all of the results can be somewhat different according to the purposes :
• - components can be replaced. The lessons then mainly consist inoptimisation of maintenance programs : replace the component not too early,not too late.
• - components cannot be replaced. In that case they impose their life durationto the whole of the plant: the re-evaluation of margins is of prime importance.
93
G. Hugot: Evaluation of...
4. SOME FRENCH EXAMPLES OF TOOLS FOR THE EVALUATION OF INSERVICE AGEING
4.1 Surveillance of the reactor pressure vessel embrittlement under irradiation
The wide internationally recognised practice is that the control of the effects of fastneutrons on reactor vessel materials relies on destructive tests. These tests are carried outon specimens of the actual material submitted to conditions representative of those whichthe vessel actually experienced, i.e., neighbouring temperatures, neutron fluxes and spectra.In fact the specimens are located inside the vessel along the core barrel of the reactorinternals. All of this is well known.
It is also of general practice that these data are used in setting heat-up and cool-downprocedures as well as pressure-temperature limits for hydrostatic and leak test. They arealso collected to update the stress concentration intensity curves in order to evaluate thebehaviour of the vessel under pressurised thermal shock.
These evaluations rely on assumptions of reference defects sizes which appears in theconstruction Codes.
Some illustration of the French practice in this field are given in appendix A, whichintroduces a new approach in the field of prediction of radiation embrittlement of pressurevessel materials.
4.2 Operating transients monitoring system
It is widely known that many of plant operators or manufacturers have, or are stillgoing on developing, software systems in order to evaluate the margins relative to fatiguedamage under actual operation transients. This, in the general frame of optimisation ofequipment life management: surveillance schedule, repair, replacement...
For this purpose FRAMATOME developed an original tool with its Operatingtransient Monitoring System, OTMS, known in French as «Fatiguemeter».
This tool automatically ensures :
• a real lime recording of the plant operating parameters,• a count of the transients < <seen » by the NSSS• a real lime monitoring of potential damages of structures by calculation of
stresses and usage factorsThe achieved purpose is to :
• identify the equipments sensible areas,• determine transfer functions between instrumentation available data and their
results in terms of stresses into the component itself,• analyse stresses in sensible areas, and then to compute the fatigue damage
either by detailed analysis or by simplified transfer functions.This is summarised on figure 2.
94
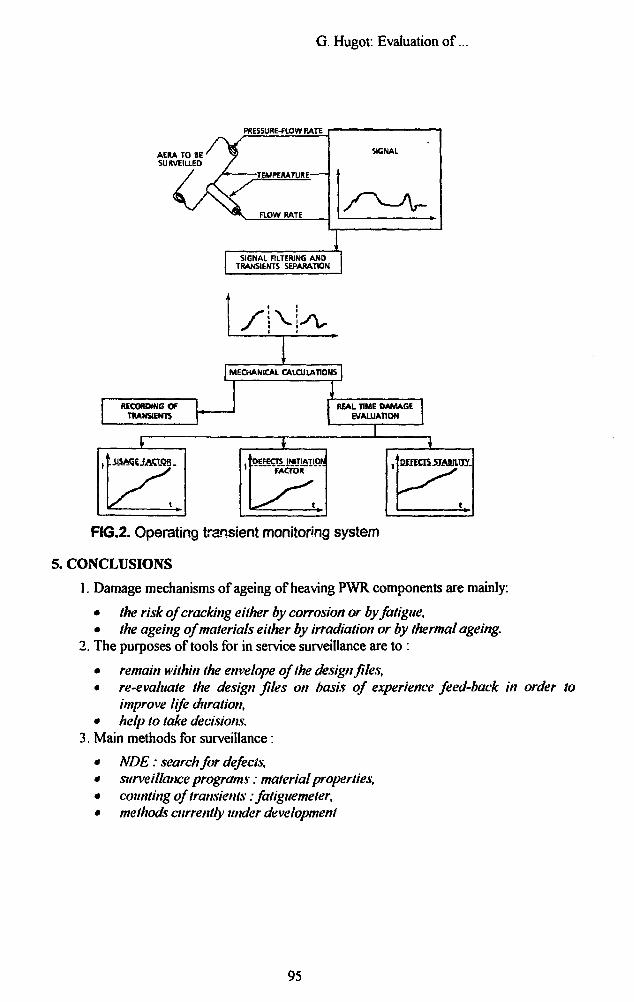
G. Hugot: Evaluation of.
PRESSURE-FLOW RATE
• TEMPERATUB E
^ ^ FLOW RATE
SIGNAL
1
SIGNAL FILTERING ANDTRANSIENTS SEPARATION
I MECHANICAL CALCULATIONS
RECORDING OFTRANSIENTS
REAL TIME DAMAGEEVALUATION
FIG.2. Operating transient monitoring system
5. CONCLUSIONS
1. Damage mechanisms of ageing of heaving PWR components are mainly:
• the risk of cracking either by corrosion or by fatigue,• the ageing of materials either by irradiation or by thermal ageing.
2. The purposes of tools for in service surveillance are to :
• remain within the envelope of the design files,• re-evaluate the design files on basis of experience feed-back in order to
improve life duration,• help to lake decisions.
3. Main methods for surveillance :
• NDE: search for defects,• surveillance programs: material properties,• counting of transients: fatiguemeter,• methods currently under development
95

APPENDIX 1
RPV RADIATION EMBRITTLEMENT FRENCH PRACTICEAl
PREDICTION OF IRRADIATION EMBRITTLEMENT
ASSESSMENT OF REGULATORY GUIDE 1.99 Rev.2 FORMULA
• RG 1.99 Rev. 2 is over conservative for low residuals welds and may beunconservative for base metals
• Detrimental Effect of Phosphorus not taken into account• More Appropriate Predictive Formulae are Available for Modern Materials
RG 1.99 Rev. 2 Formula
ARTNDT=(CF) x F(0.28 - 0.10 log F)
with CF function of Cu and Ni contents.
ALTERNATIVE FORMULAE FOR IRRADIATION EMBRITTLEMENTPREDICTION DATA BASEIrradiation Embrittlement Results coming from:
Surveillance ProgramsTest Reactor ExperimentsBase Metal (Forging - 16MND5 material with Cu < 13%)Weld Metal (mainly SA welds - with Cu <20%)Irradiation Temperature = 288 CCCVN Transition Shift measured at 68 J level.
METHODOLOGY• Statistical Analysis• Significant variables = Cu, P, Ni, Fluence
FORMULAE• FIMgives mean value ofCharpy V-notch transition temperature shift• F1S gives upper bound value
COMMENTS
IRRADIATION EMBRITTLEMENT SENSITIVITY OF RPV MATERIALS ISNOW REDUCED DUE TO THE FOLLOWING MANUFACTURING PRACTICES:
• Specify low residual elements:Base Metal Cu < 0.08%-P < 0.008%Weld Metal Cu < 0.07%-P s 0.010%
• Avoid segregation on the inner side by the use of plates, or better, of coreshells forged from hollow ingots
SOME UNCERTAINTIES REMAIN REGARDING FOR EXAMPLE DOSE RATEAND NEUTRON ENERGY SPECTRUM EFFECTS - RESEARCH STUDIES AREIN PROGRESS IN THE FIELDS CONCERNED.
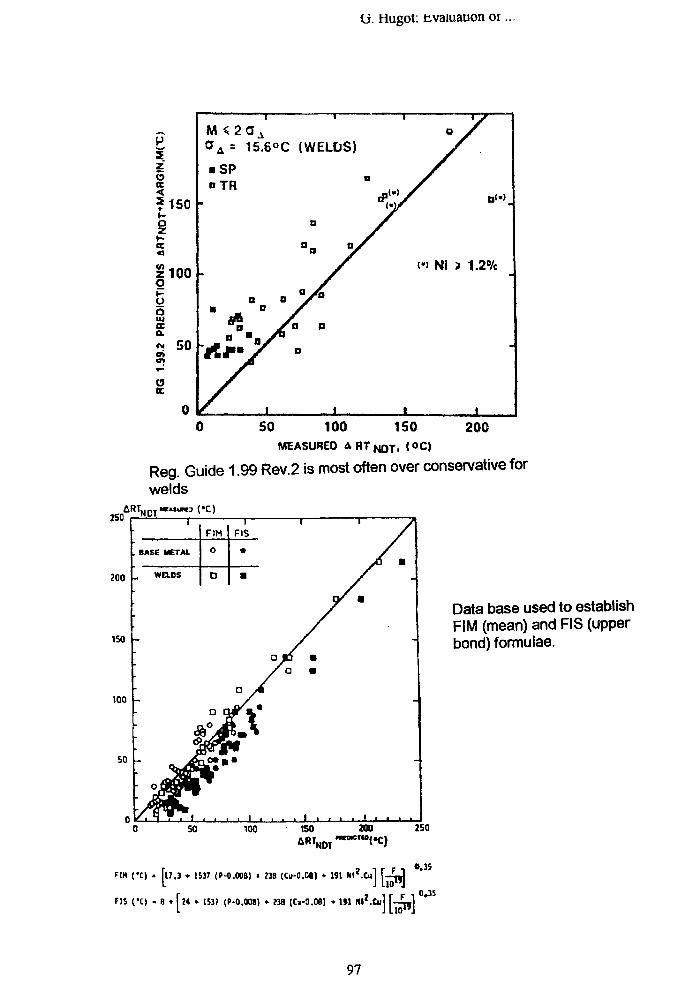
U. Hugot: ^valuation 01
z5sf 150o
K
$100oooUJKa.«* 50o><naoc
0
| l
M « 2 a A
CJA = 15.6°C (WELDS)
• SPDTR " (<
a o V»
/ "
'/.
it Ni > 1.2%
i i
0 50 100 150 200MEASURED A H T N 0 T , (OC)
Reg. Guide 1.99 Rev.2 is most often over conservative forwelds
fiRT,
Data base used to establishFIM (mean) and FIS (upperbond) formulae.
50 -
F1H (•[) • fl7.3 • 1537 (H1.00B) • 238 (Ctf-a.M| • 191 Hi'.Cul T-!jJ
fIS CC) . 8 • \l* * 1537 (C-0,008) • ?3B (C«-0.08) • 1M MZ.tul \-LL J LlO1
O.3S
0J5
97
Zuzo on Regulatory Requirements.
Regulatory Requirements Point of View Integrity ofPressure Components of Reactor Systems.
byMr. MILO$ ZUZO,CZECHOSLOVAK A TOMIC ENERGY COMMISSION120 29 PRAGUE 2 -Vinohrady, Slezskd 9,
ABSTRACT
This report contains regulatory requirements, solutions and experiences about assuringintegrity of pressure components of Reactor Systems. The report is dealing with NPP V-lin Jaslovske Bohunice. It is one of older NPP in Czech and Slovak Federal Republic(CSFR) with two reactors type 230.
The report consists of three parts.
• The first part shortly describe NPP V-l history in Jaslovske Bohunice withmain project defects, number of international missions and their conclusionsfrom point of view of the integrity of pressurized components of reactorsystems.
• The second part describes regulatory requirements for near futureoperation and conditions for next five years. The base of the new regulatoryrequirements is the European level of operational safety. To prevent NPPBohunice from decommission improvements are proposed Realisation of thenew requirements are planned for 1995.
• The third part contains a full size reconstruction, the completion of theprimary circuit by diagnostic and warning systems, and further developmentoflSI for improvement the reliability of pressurized components.
In conclusion the report summarizes the results of safety assessments, thenowadays technical upgrading works, and the new regulatory requirements.
Keywords: PWR, regulatory requirements, primary circuit, integrity of pressurizedcomponents, reconstruction, diagnostic systems,
HISTORY OF THE PLANT IN Jaslovske Bohunice
1972 Start of operation NPPA-11977 Shut down NPPA-11978 Start of operation V-l unit 1.1980 Start of operation V-l unit 2.
1984 Start of operation V-2 unit 11985 Start of operation V-2 unit 2
98
Zuzo on Regulatory Requirements..
SAFETY REVIEW GROUPS
Independent foreign experts were invited to perform safety analysis of NPP V-l Themain participants are selected as it follows:
• SIEMENS (current status, proposal for safety improvement program)• Austrian Government Committee (operational safety evaluation)• ASSET mission (Assessment of Safety Significant Events Team - IAEA)• WESTINGHOUSE (evaluation of approach to seizmic questions)• FFM (Fact Finding Mission - IAEA)• SAFETY REVIEW MISSION (IAEA)• SAFETY REVIEW MISSION Follow - up• Complex operational safety evaluation also performed by Czechoslovak
Government experts groups. They task were to inform the CSFR Governmentabout the current status of reliability of NPP V-l.
Result of foreign experts missions, except Austrian Government Committee, waspositive. Practically all groups of experts agreed with continuing the plant operation, anddeclared that instant shut-down of V-l reactors is not necessary. On the base of theirevaluation each group elaborated a the list of recommended measures, which should beperformed for safety improvement.
REGULATORY SAFETY REQUIREMENTS
DECREE No 5/91 - 81 measurementsOn the base of foreign and domestic expert's recommendations, the Czecho-
slovak Government issued "Decision" about future operation of V-l Power Plant.
CSKAE prepared Decree No 5/91. Decree No 5/91 of CSKAE according toDecision of CSFRT Government from 10 January 1991 is the list of 81 requirements,which must be realized in a very short time, to improve operation safety.
Measures are concerning of following fields:
REACTOR PRESSURE VESSELSSTEAM GENERA TORS AND PRESSURIZERMAIN CIRCULATING TUBESreactor protection systemspray systemhermetic zonesafety injection
I&Celectric systemfire protectionseizmic reinforcement of technology equipmentsecondary circuit equipmentpersonnel trainingoperation instructions and regulationsradioactive wastesspecial regime
99
SPECIAL REGIME & RECONSTRUCTION
According to the Decree No 5/91 of CSKAE all the 81 requirements must be realizeduntil the end of 1992 to get licence for further operation of V-l Power Plant. This is firstphase is called "small reconstruction". Many Czecho-Slovak and foreign firm are workingon the project.
If all requirements will be fulfilled in time, NPP V-l can get further operationlicence, up to end of 1995.
In 1992 the CSFR Government will take decision about the second phase, so called"large reconstruction". During this phase Power Plant must be fully reconstructed bythe end of 1995, to comply with valid European standards.
New Operational Manual elaborated for NPP V-l. It is called "special regime".Thisdocument concerns of many field in operating process, i.e.:
• operation regime, operating instructions• troubleshooting, material tests• equipment modification• revisions, repairs• operation planning• personnel
V-l units are operated under the conditions of "special regime" since 1. 4. 1989. Thereason of its implementation is to reduce the risk of over design limit accidents i.e.LOCA with diameter more than 100mm.
General principles of "special regime":
priority of nuclear safety requirementshigh quality of operation managementhigh quality of maintenancepermanent knowledge about equipment technical statusmaximum quality of revisions, tests, repairshigh professional and psychological level of personnel
permanent utilization ofbackfitting and experiences from another WER unitsfast realization of safety improvementsstrict technological discipline and fulfilling of all operation instructions.Conditions of special regime are permanently u/xJated and supplemented withnew safety measures.
100
DIAGNOSTIC SYSTEMS
• ALES (Akustisches leek Oberwachung system - SIEMENS)
• DAKEL -(Acoustic Emission System-made in CSFR)
• AE -(Acoustic Emission System - SKODA)
• MCP monitoring vibration - (VoJE-Tmava)
• SCS D-(Schwingung Oberwachung systeme - SIEMENS)
• Engine rotated measuring - (VUJE-Trnava)
• Loose Parts Observation System -(VUJE-Trnava)
• Humidity monitoring - (VUEZ-Tlmaae)
• Integrity Lifetime Monitoring - (EGU-Bratislava)
• Neutron Noise Measurement - (VUJE-Trnava)
• Main Circulating Pump Console Measurement (VUJE-Trnava)
SAFETY ANALYSES
• LBB (UJV-Rez, VUJE-Trnava, SKODA, JE-EBO)
• SEIZMIC LOADING - (UJV-Rez, SKODA, AVUT-Praha, EGP-Praha, SVOT-Bratislava)
• REACTOR PRESSURE VESSEL SPECIMENS - (UJV-Rez, VUJE-Trnava,SKODA)
• SG BOLT ANALYSES- (UAM-Vitkovice)
• PRESSURE PULZATION - (VUJE-Trnava)
• SG EXPERIMENTAL CAP - (UAM-Vitkovice, VUEZ-Brno)
101
j . /xiareK, L. recinKa, r . jxau^ivu. ^~~.*
Leak Before Break Concept Application for the WER440/230
./. ZJarek, /,. Pecinka, P. KadeckaNuclear Research Institute, Rez, Czechoslovakia
ABSTRACT
The Leak Before Break concept is now applied for the VVER 440/230 plants inCzechoslovakia. Programm supported by large scale experiments is about 70 percentcomplete. Results obtained will be discussed. Part of the programme is the assessment ofdynamic stresses due to seismic events. Evaluation of additional anti seismic measures isdiscussed with suggestions for simplification.
Overview of Available WWER 440 type 230 Data
Czechoslovak programm
The application of LBB generally covers the primary circuit piping and components.The assessment of these structures is crucial from the point of view of safety of the plant.For WWER 440/230 type plant consideration also has to be given to the steam andfeedwater lines. In a Seismic Margin Review assessment the High Confidence of LowProbability of Failure /HCLPF/ coefficients for these lines show lower safety margins /lower HCLPF values / than for the primary piping. In addition to this a main steam linebreak in a WWER 440/230 type unit could have implications on a core melt accident eventhough that probabilistic fault tree assessment is not available for such a case. It is thereforenecessary to apply the LBB concept approach or integrity assessment to steam andfeedwater lines as well to primary piping and components. Preliminary results ofassessments provide an indications of the critical sections on which non destructive testinghas to be concentrated. On completion of full integrity assessments the critical sections willbe more closely defined.
Main circulating piping
WWER 440 type 230 primary circuit and ECCS was not designed according to DEGBprinciple and the containment does not meet "western" requirements. Stations wereintended to be constructed exclusively on low-seismicity sites in accordance with formerSoviet regulations. The safety concept of these reactors was based on accident preventionthrough design in the late sixties, high quality fabrication and control with only limitedDBA scope and accident mitigation measures.
The primary circuit with inner diameter 500 mm consists of 6 loops. Each loop has amain isolation valve. The loop is longer compared to western design with several bends andelbows. The austenitic steel type OX18N10T and OX18N12T is used ( Ti stabilised, 18%Cr, 10 and 12 % Ni). All piping components were forged except cast main valve gate andmain circulating pump body. The elbows were longitudinally welded with thickness much
102
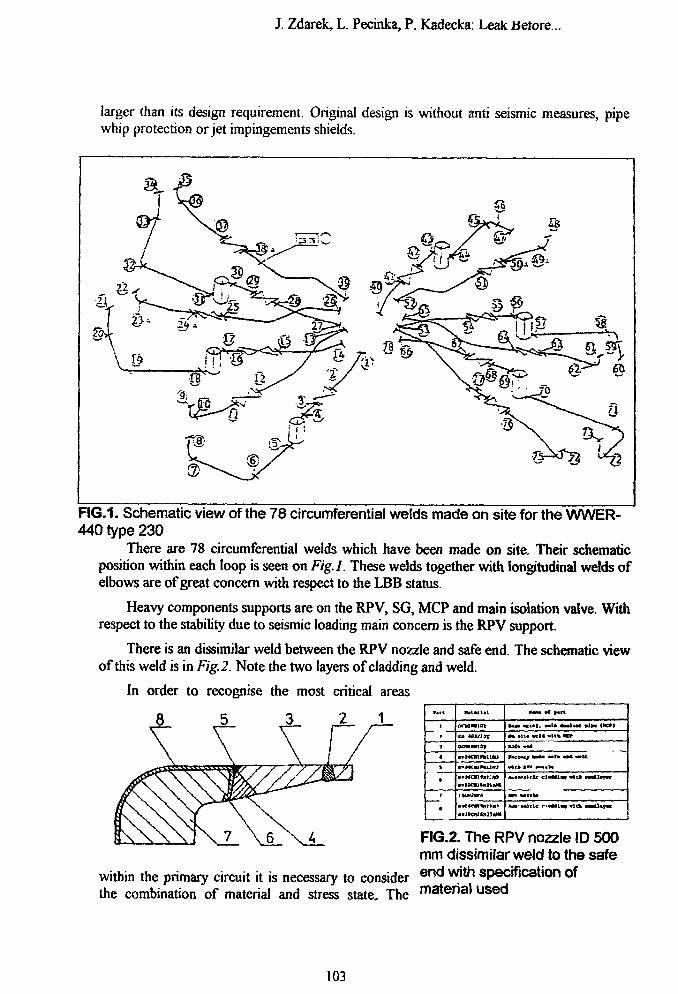
J. Zdarek, L. Pecinka, P. Kadecka: Leak JSetore...
larger than its design requirement. Original design is without anti seismic measures, pipewhip protection or jet impingements shields.
FIG.1. Schematic view of the 78 circumferential welds made on site for the WWER-440 type 230
There are 78 circumferential welds which have been made on site. Their schematicposition within each loop is seen on Fig.l. These welds together with longitudinal welds ofelbows are of great concern with respect to the LBB status.
Heavy components supports are on the RPV, SG, MCP and main isolation valve. Withrespect to the stability due to seismic loading main concern is the RPV support.
There is an dissimilar weld between the RPV nozzle and safe end. The schematic viewof this weld is in Fig.2. Note the two layers of cladding and weld.
In order to recognise the most critical areas
....
•t
•
« MV/lttoonwmat
MMCIlMUM
itoln
•w. «LU»I. M i i M i u t » I M Men
•M »ii« M U vi«k MET
Wmctmtf m*» ••<• • • * «»»«.
*,.•..!.« =l-ll« ««. M t a
FIG.2. The RPV nozzle ID 500mm dissimilar weld to the safe
within the primary circuit it is necessary to consider e w(l*n Specification Ofthe combination of material and stress state. The m a ^ e n a ' u s e a #
103
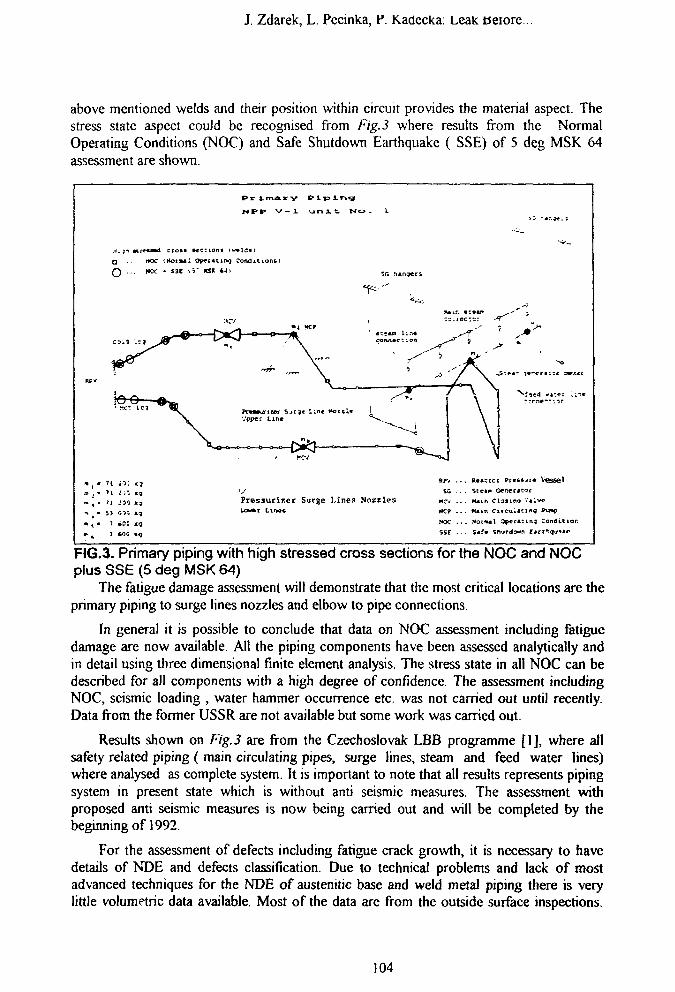
J. Zdarek, L. Pecinka, P. Kadecka: Leak ueiore..
above mentioned welds and their position within circuit provides the material aspect. Thestress state aspect could be recognised from Fig.3 where results from the NormalOperating Conditions (NOC) and Safe Shutdown Earthquake ( SSE) of 5 deg MSK 64assessment are shown.
PrlmAry Piping
Q
QHOCHOC
(HotiMl Opec«tin*j Condit ions t
• SSI l i - KSH *Ji
Re*=;ci ? i*e* jr« Vessel
SO
Presaurtrer Surge Lines NozzlesLOW*r IATMC
7 »0t ,
7 40Q '
HCP . . . Main CtrcuUCin? <*w>i(>
HOC . . . f*oi*m«l 0per*;i.n7 ConSi.ti.or.
FIG.3. Primary piping with high stressed cross sections for the NOC and NOCplus SSE (5 deg MSK 64)
The fatigue damage assessment will demonstrate that the most critical locations are theprimary piping to surge lines nozzles and elbow to pipe connections.
In general it is possible to conclude that data on NOC assessment including fatiguedamage are now available. All the piping components have been assessed analytically andin detail using three dimensional finite element analysis. The stress state in all NOC can bedescribed for all components with a high degree of confidence. The assessment includingNOC, seismic loading , water hammer occurrence etc. was not carried out until recently.Data from the former USSR are not available but some work was carried out.
Results shown on Fig.3 are from the Czechoslovak LBB programme [1], where allsafety related piping ( main circulating pipes, surge lines, steam and feed water lines)where analysed as complete system. It is important to note that all results represents pipingsystem in present state which is without anti seismic measures. The assessment withproposed anti seismic measures is now being carried out and will be completed by thebeginning of 1992.
For the assessment of defects including fatigue crack growth, it is necessary to havedetails of NDE and defects classification. Due to technical problems and lack of mostadvanced techniques for the NDE of austenitic base and weld metal piping there is verylittle volumetric data available. Most of the data are from the outside surface inspections.
104

J. Zdarek, L. Pecinka, P. Kadecka: LeaK oeiore...
Only recently modified inspections techniques are used to inspect internal surfaces ofcritical sections. No systematic database is available from the inside surface and 100 %volumetric control. The database of all defects left in circumferential welds made on site (all of them under allowable limit) will be available for J. Bohunice plant and used for theLBB assessment as well.
Pressurizer surge lines
There are three pressurizer surge lines, two of them are connected to the bottom sideof the pressurizer, third line goes on the top. The layout and dimensions are seen in Fig.4,material is again austenitic steel 08X18N10T. The maximum design parameters are insidepressure 14 MPa and 335 deg C temperature and the principal dimensions of the pipe is245 mm x 18 mm. All piping components were manufactured in the former USSR and,there is very little information on wall thickness tolerances, out of roundness etc. Thecalculations performed used the maximum code allowable values. The former USSR dataon assessment of these lines are not available. Most comprehensive data available is fromthe Czechoslovak LBB programme. There is an attempt to prepare a database of defectsleft in on site made welds and defects found by ISI.
.-.cbreviatior.s
p . . . pressuiizcr
Symbols P top
® high stressedcross - sections(welds)
pipe
FIG.4. Schematic view of the pressurizer surge lines layoutSection of the pressurizer surge lines could be influenced by temperature stratification.
Data from Loviisa NPP and other WWER type plants have been collected and aconservative assessment method will be used to include available results in any LBBassessment.
105
J. Zdarek, L. Pecinka, P. Kadecka: Leak tJetore...
There is also a dissimilar weld between the pressurizer nozzle made of 22K steel andaustenitic safe end. The assessment of this weld is also part of the Czechoslovak LBBprogramme.
Main steam line
The design parameters are pressure 5.9 MPa and 258 deg C temperature. Thedimension of the pipe is 456 x 16 mm. The negative tolerance in wall thickness is 15%,minimum wall thickness of bends and elbows is 10 mm and permissible out of roundness8%. The material used is ST 20.
For the defect assessment a similar database will be prepared as for the pressurisersurge lines.
Feed water line
The design parameters are pressure 6.7 MPa and 226 deg C temperature. Thedimension of the pipe is 273 x 16 mm. The negative tolerance is 12.5 %, minimum wallthickness of bends and elbows is 10 mm and permissible out of roundness is 8 %.
The material used is ST 20 or CSN 12022.1. Inside the hermetic zone only the NOCfeed water line is located, the emergency feed water system is outside the hermetic zoneand is connected directly to NOC feed water line.
For the defect assessment, a similar database will be prepared as for the other pipelines.
The Czechoslovak LBB Programm
The Czechoslovak Atomic Energy Commission issued a legislative procedure [2]based on the US NRC Regulatory Procedures [3,4,5]. In order to be able to apply the leak-before-break concept in full, several requirements have to be met. Firstly it has to be shownthat fatigue damage is low. The original assessment of the plant based on Soviet as well asASME codes was finished in 1979. A fatigue damage assessment was recently carried outwith more detailed analysis and also using the actual loading regimes and numbers ofcycles. The condition for low fatigue damage was shown to have been met.
The second requirement deals with the demonstration of the absence of corrosiondamage. There is no indication of corrosion damage in the plant piping. However, althoughthis condition has been met a corrosion damage database is being prepared as part of thecurrent programme and results are now becoming available.
The third requirement concerns water hammer and associated damage assessments.There has been no experience of water hammer to date in the plant. The very unlikely caseof sudden main circulating pump shaft failure has been analysed. The resulting reaction onthe RPV nozzle and the Steam Generator (SG) elbow has been assessed and the stressesshown to be very low.
106
J. Zdarek, L. Pecinka, P. Kadecka: Leak Before...
Seismic Margin Assessment
In recent years, starting by 1988, it has become necessary to assess the capability ofNPP Jaslovske Bohunice to withstand earthquakes exceeding their original design bases 5 °MSK 64 because of the following situations
• the perception of seismic hazard in the plant vicinity has changed since designof the plant
• the criticism of units with reactors WWER 230 type startedIn such a situation, a seismic margin study [6] may need to be performed to give
realistic seismic capacity of the plant with a high degree of confidence. They are twopossible ways: the seismic probabilistic risk assessment or the seismic margin review (SMR)study. In following we concentrated on the second one. The advantage of this approach isthat the analysis is focused only on few components and systems whose failure could leadto severe core damage or prevent safe shutdown of the plant. The output of the SMRwould be an estimate of the plant seismic capacity expressed with a high degree ofconfidence and an identification of plant seismic vulnerabilities.
The procedures have been developed somewhat independently in two researchprograms (Lawrence Livermore National Laboratory and Electric Power ResearchInstitute).These two methodologies are different in details, but they are similar in one keyaspect in how "seismic margin" is defined in terms of the "HCLPF capacity value". TheHigh Confidence of Low Probability of Failure (HCLPF), is a conservative representationof capacity and corresponds to the earthquake level at which it is extremely unlikely thatloss of shutdown capability or core damage will occur. From the mathematical point ofview it may be defined as the mean peak ground acceleration value for which there is 5%probability of failure at 95% confidence.
The SMR is performed using a series of screening procedures. A review earthquakelevel, which is typically much larger than the plant SSE is selected. The first level ofscreening in the LLNL methodology is done by focusing only on the plant system functionsof reactor subcriticality and early core cooling. In the EPRI methodology the most viablesuccess path for safe shutdown of the plant following an earthquake is identified and allsystems and components that are needed for this path are included in the marginevaluation.
The second level of screening is done by sorting the components in the above systemsinto two classes: those with HCLPF capacities generally higher than the review earthquakelevel and those whose HCLPF cannot be stated to be higher than the review earthquakelevel without further examination.For screening and margin review at least two plant walkdowns are needed. The components that require further margin evaluation, called the"screened-in" components are identified during the plant review and the two plant walkdowns.
The next step in the EPRI methodology is the estimation of the HCLPF capacities ofthe components in the chosen success path and the plant is considered to have a seismiccapacity equal to the lowest of those component capacities. The LLNL approach differsfrom the pervious one by the development of the event trees and fault trees Booleanexpressions for the seismic induced core damage accident sequences . The HCLPF capacity
107
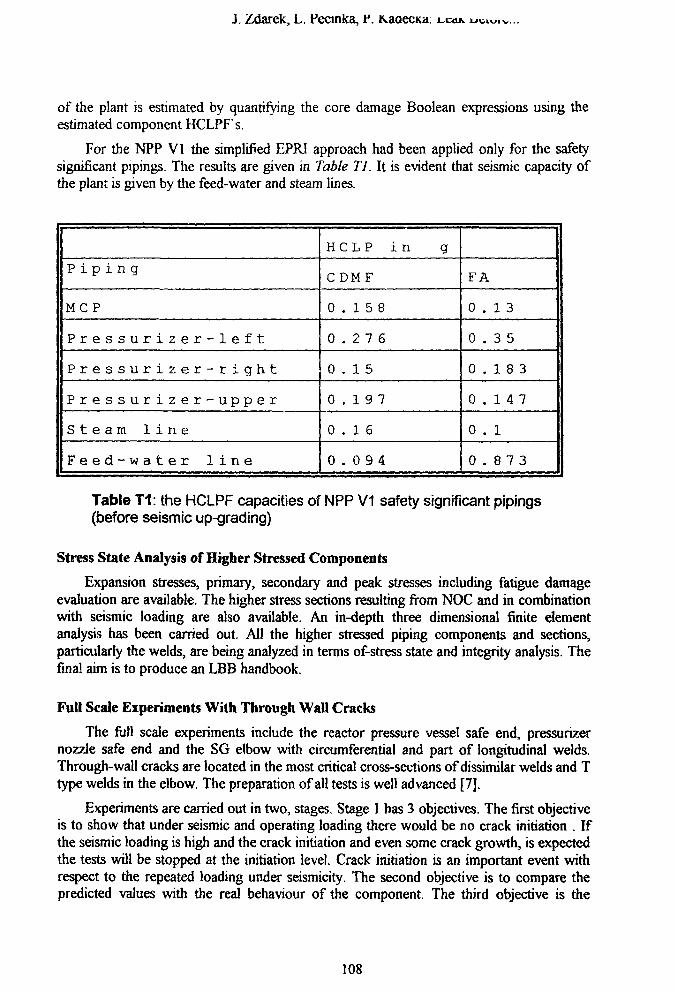
J. Zdarek, L. Fecinka, V. KaaecKa.
of the plant is estimated by quantifying the core damage Boolean expressions using theestimated component HCLPFs.
For the NPP VI the simplified EPRI approach had been applied only for the safetysignificant pipings. The results are given in Table TJ. It is evident that seismic capacity ofthe plant is given by the feed-water and steam lines.
Piping
MCP
Pressurizer-left
Pressurizer-right
Pressurizer-upper
Steam line
Feed-water line
HCLP in g
CDMF
0.158
0.276
0.15
0.197
0.16
0.094
FA
0.13
0.35
0.183
0.147
0 . 1
0.873
Table T1: the HCLPF capacities of NPP V1 safety significant pipings(before seismic up-grading)
Stress State Analysis of Higher Stressed Components
Expansion stresses, primary, secondary and peak stresses including fatigue damageevaluation are available. The higher stress sections resulting from NOC and in combinationwith seismic loading are also available. An in-depth three dimensional finite elementanalysis has been carried out. All the higher stressed piping components and sections,particularly the welds, are being analyzed in terms of-stress state and integrity analysis. Thefinal aim is to produce an LBB handbook.
Full Scale Experiments With Through Wall Cracks
The full scale experiments include the reactor pressure vessel safe end, pressurizernozzle safe end and the SG elbow with circumferential and part of longitudinal welds.Through-wall cracks are located in the most critical cross-sections of dissimilar welds and Ttype welds in the elbow. The preparation of all tests is well advanced [7].
Experiments are carried out in two, stages. Stage 1 has 3 objectives. The first objectiveis to show that under seismic and operating loading there would be no crack initiation . Ifthe seismic loading is high and the crack initiation and even some crack growth, is expectedthe tests will be stopped at the initiation level. Crack initiation is an important event withrespect to the repeated loading under seismicity. The second objective is to compare thepredicted values with the real behaviour of the component. The third objective is the
108

J. Zdarek, L. Pecinka, P. Kadecka: Leak Before...
measurement of COD to improve the leak rate computations. Each test consists of the»following steps using a model which is identical to the component from the power plant.
A through-wall crack of a length related to the leak rate criteria is machined into thecritical section. This through-wall crack is sealed to prevent leakage when internallypressurized. The component is heated to the operating temperature and loaded to operatingpressure. The bending moment, is increased in small steps. The increase of the appliedmoment is stopped either if crack initiation is recognized by acoustic emission or if the totalload is equivalent to the superimposed seismic load, but no more than 0.5 of the limit load.
The objective of the stage 2 tests is to prove that the margins predicted from the J-resistance curve are in agreement with the component behaviour. The initial crack lengthchosen is about 2 cm in order to check the validity of the J- resistance curve of largecomponents.
Leak Rate Tests
Scope of these tests is to show that the predicted leak rate is representative ofcomponent behaviour. For this purposes the experimental set-up in steam water loop isused. The main features can be characterized as follows [8]:
• the thermodynamical parameters of fluid are 12.5 MPa, 280 deg C• tested are the small diameter pipe (OD 89 mm) and the full scale pressuriser
surge-line pipe (OD 246 mm) with the same t/R ratio• through-wall circumferential cracks of various length are introduced and
sharpened by fatigue loading in one type of dissimilar weld• the tested pipes are loaded by bending momentsf three different values) to
provide crack openings• the leak rate is measured by various methods. Predictions will be compared
with measured values.The LBB concept requires the installation of three independent leak diagnostic
systems, the baseline calibration of background noise induced by fluid flow is mandatory onthis set-up for all acoustic emission systems which will be installed on the primary piping.
Fracture and Corrosion Database
The fracture and corrosion database will include specific J-R curves and sigma-epsiloncurves for different specified temperatures. Where archive material is available three J-Rand sigma-epsilon curves at room temperature and maximum temperature will be obtained.In cases where archive material is not available, material representative of the plantspecification will be used. In this latter case three heats and two samples at eachtemperature will be tested.
In the case of the NPP Jaslovske Bohunice some archive material is available. Forcomponents and welds where such material is not available 3 representative type materialswill be tested, there will be additional support from tests on service exposed material andthese Will be evaluated to provide conservative lower bound curves.
109
J. Zdarek, L. PecinJca, r.
The initial requireraents on the level of corrosion damage has been mentioned already.It is necessary to prove that corrosion mechanism, mainly SCC and combined corrosionfatigue damage are not dominant mechanism.
Demonstration that there is no corrosion cracking can be carried out by theexamination of plant components and by supporting experimental work utilizing the knownplant history conditions of water chemistry etc. The present work is aimed at extending thedatabase in this context. Further work is also underway to extend the water chemistryconditions to establish the margin that exists between no corrosion cracking and theconditions which could lead to such cracking.
Conclusions
• The Leak Before Break (LBB) status provides input for safety assessment ofnuclear plant. For older plants, where it is necessary to re assess safety margins,LBB can provide the basis for the safety philosophy as well as means for a backfit assessment with significant economic benefits and lowering of man-remexposures.
• For the WWER 440 type 230 NPPs comprehensive analysis and fracturemechanics data base will be available after completion of the CzechoslovakLBB programm.
• The programm covers all the safety related piping (main circulating pipes, surgelines, steam and feed water lines). Stress analysis includes dynamic analysis dueto seismic loading and water hammer. The fracture mechanics database onsmall samples is backed up by extensive large scale tests on critical componentswith through wall cracks loaded with NOC and quasi static seismic loading. Animportant of the programm is leak rate measurement to check computer coderesults and to provide for means of calibration of acoustic emissions leak rateand localization diagnostic systems.
References
[1] J. Zdarek, et. al.. Leak Before Break Project.
Application on the Primary Piping of the WWER Type Nuclear Power Plants. NuclearResearch Institute. Internal Report, May 1991.
[2] Pozadavky pro sestaveni a obsah bezpecnostnich zprav a jejich dodatku. Postup prostanoveni prukazu " unik pred roztrzenim". Detekcni systemy uniku z tlakovehochladiciho okruhu reaktoru. Ustav Jademych Informaci c. 1,1991
[3] Modification of General Design Criterion 4 Requirements for Protection AgainstDynamic Effects of Postulated Pipe Ruptures. Federal Register, Vol. 51, No. 70,published by the Office of the Federal Register, Washington, DC, 11 April 1986, pp.12502-5.
[4] Modification of General Design Criterion 4 Requirements for Protection AgainstDynamic Effects of Postulated Pipe Ruptures. Federal Register, Vol. 52, No. 207,published by the Office of the Federal Register, Washington, DC, 27 October 1987,pp. 41288-95.
110

J. Zdarek, L. Pecuika, f. Kaaecica: ueax. neiorc...
[5] Standard Review Plan; Public Comment Solicited. Federal Register, Vol. 52, No.167, published by the Office of the- Federal Register, Washington, DC, 28 August1987, pp. 32626-33.
[6] J. Zdarek et.al.. Leak Before Break Application on the Primary piping of the WWERType Nuclear Power Plants. 17-th MPR Seminar, 10-11 October, 1991.
[7] J. Zdarek, L Pecinka,: Full Scale Experiments to Support Czechoslovak LBBProgramm of the WWER NPPs. Nuclear Research Institute Internal Report No. 9541T, December 1991.
[8] J. Zdarek, et. al.. Leak Before Break Project. Application on the Primary Piping ofthe WWER Type Nuclear Power Plants. Nuclear Research Institute. Internal Report,May 1991.
Ill
G. Bartholome, R. Wellein: Leak-Before-Break...
LEAK-BEFORE-BREAK BEHAVIOUR OF NUCLEARPIPING SYSTEMS
Giinther Bartholome, Robert WelleinSiemens (KWU, D-8520 Erlangen, Hammerbacherstr. 12-14)Germany
ABSTRACT
The general concept for break preclusion of nuclear piping systems in the FRGconsists of two main prerequisites:
• Basis safety• Independent redundancies.
The leak-before-break behaviour is one of these redundancies and will be verified byfracture mechanics. The following items have to be evaluated:
• The growth of detected and postulated defects must be negligible in one lifetime of the plant.
• The growth behaviour beyond design (i.e. multiple load collectives are takeninto account) leads to a stable leak.
• This leakage of the piping must be detected by an adequate leak detectionsystem long before the critical defect size is reached.
The fracture mechanics calculations concerning growth and instability of the relevantdefects and corresponding leakage areas are described in more detail.
The leak-before break behaviour is shown for two examples of nuclear piping systemsin pressurised water reactors:
• main coolant line of SIEMENS-PWR 1300 MW (ferriiic material, diameter800 mm)
• surge line of Russian WWER 440 (austenitic material, diameter 250 mm)The main results are given taking into account the relevant leak detection possibilities.
Keywords: Leak-before-break, fracture mechanics
1. General Concept for Break Preclusion
In the FRG the general concept for the break preclusion of nuclear piping systemsconsists of two main prerequisites [1], see Fig. 1.
• Basic Safety• Independent Redundancies.
The main aspects for Basic Safety are:
selection of materialsmechanical designcalculationmanufacture and inspectionquality assurance
112
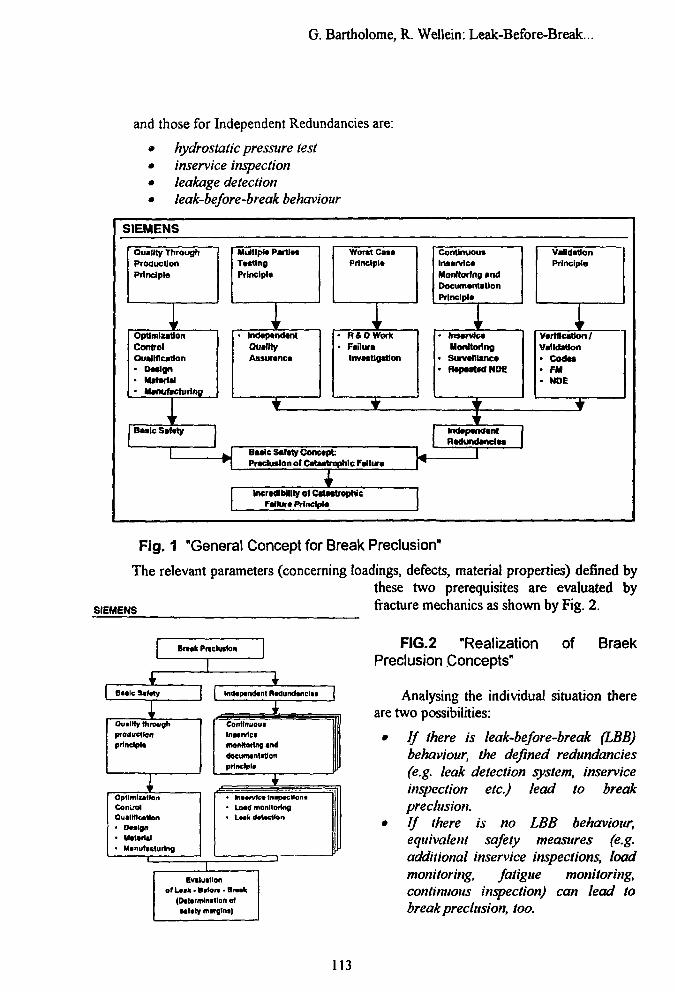
G. Bartholome, R. Wellein: Leak-Before-Break...
and those for Independent Redundancies are:
• hydrostatic pressure test• inservice inspection• leakage detection• leak-before-break behaviour
SIEMENS
Quality ThroughProductionPrinciple
rOptimizationControlOtwIMcatlon• Design• Material• Manufacturing
, 1Basic Safety
L
MulUpla PartlMTestingPrinciple
r
• IndependentQu»!ttyAssurance
Wor»t CasePrinciple
r• R&OWork• Failure
Investigation
Bulc Safety ConctptPreclusion of Cataairaphlc Failure
Incredibility of CatastrophicFalkir* Principle
ContinuousInaervtcaMonitoring andDocumentationPrinciple
r• Inservlce
Monitoring• Survalllinc*• Repeated NDE
•IIndependentRedundandea
1
ValidationPrinciple
f
Verification/Validation• Coda*
• m• NDE
r
SIEMENS
Fig. 1 "General Concept for Break Preclusion"
The relevant parameters (concerning loadings, defects, material properties) defined bythese two prerequisites are evaluated byfracture mechanics as shown by Fig. 2.
Bnek Preclusion
Stele Selety Independent Redundenclas
Qoilrty throughproductionprinciple
ContinuousIfwervlctiMnMarlnfl enddocumtntitlonprinciple
OptimizationConirolOuelHIceMsn• Oeelgo• Metertal• Menufecturlng
Inaftrvlc* InapvctlonaLoad monlloringLead <Mae)lon
Eviluatlonof Leah - Bafora • Braak
(Selarmlnatlon otselaty marglnt)
FIG.2 "Realization of BraekPreclusion Concepts"
Analysing the individual situation thereare two possibilities:
• If there is leak-be/ore-break (LBB)behaviour, the defined redundancies(e.g. leak detection system, inserviceinspection etc.) lead to breakpreclusion.
• If there is no LBB behaviour,equivalent safety measures (e.g.additional inservice inspections, loadmonitoring, fatigue monitoring,continuous inspection) can lead tobreak preclusion, loo.
113
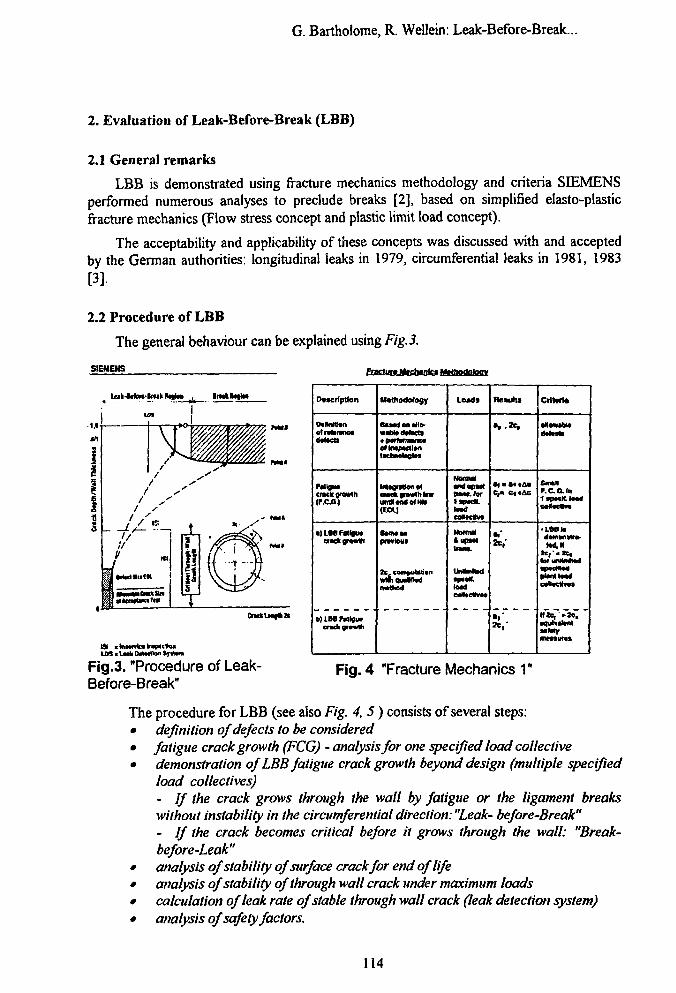
G. Bartholome, R. Wellein: Leak-Before-Break...
2. Evaluation of Leak-Before-Break (LBB)
2.1 General remarks
LBB is demonstrated using fracture mechanics methodology and criteria SIEMENSperformed numerous analyses to preclude breaks [2], based on simplified elasto-plasticfracture mechanics (Flow stress concept and plastic limit load concept).
The acceptability and applicability of these concepts was discussed with and acceptedby the German authorities: longitudinal leaks in 1979, circumferential leaks in 1981, 1983[3].
2.2 Procedure of LBB
The general behaviour can be explained using Fig. 3.
SIEMENS f n d i w «teeh«nlei Mrthodoloov
CncklMfftlc
IDS s Lwk DMCtlon JyiUm
Fig.3. "Procedure of Leak-Before-Break1'
OvKripMen
Oaimnltnstratwanc*
crack growth
tyLBR Fatlgu*crack gr«Mh
Uattodology
fUMd on allo-
Hehnotofllw
IntagmionMmcktnKilhlmunmmtttm(SOI)
tanwwpnvIMM
wtfiquaMMrMthed
Load*
NormalandutiMtnm.(or
taMlCOHClVt
Iran.
•cart.(Otct
•r
Crlttrl*
a«a«a«M
SlMIIF.cain1 ip.cn. «*(
• IMk
Mftj, »lo,
mmm)
Fig. 4 "Fracture Mechanics 1*
The procedure for LBB (see also Fig. 4,5) consists of several steps:• definition of defects to be considered• fatigue crack growth (FCG) - analysis for one specified load collective• demonstration of LBB fatigue crack growth beyond design (multiple specified
load collectives)- If the crack grows through the wall by fatigue or the ligament breakswithout instability in the circumferential direction: "Leak- before-Break"- If the crack becomes critical before it grows through the wall: "Break-before-Leak"analysis of stability of surface crack for end of lifeanalysis of stability of through wall crack under maximum loadscalculation of leak rale of stable through wall crack (leak detection system)analysis of safety factors.
114
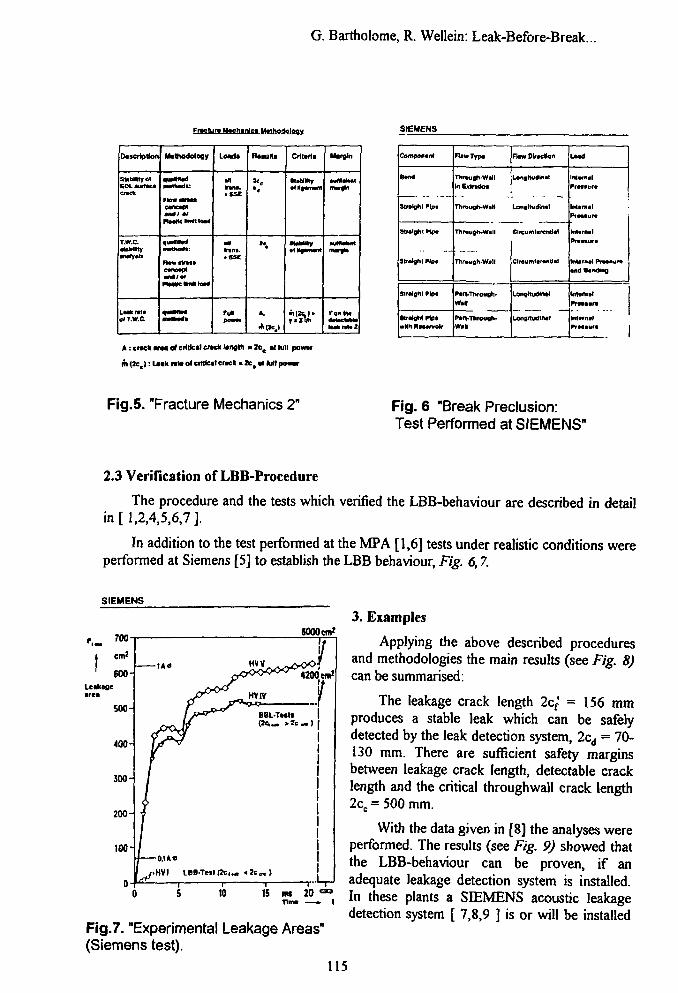
G. Bartholome, R. Wellein: Leak-Before-Break...
Fr»clur» ttochlnlc. LUlhoi-nlogy
Doeriptlon
SMNMyetEOluttH
T.W.C.• •Wl l tyMt«
of T.W.C
Malhoddxy
*>IM•attiadi:
MM**
nvwtmu
xdlw
<—ai»«MMl
LoarJa
•ntnnm.• CSE
•NVint.. SS£
Ft«
Raaulla
?"
A.
Crllarla
•iHfnan
«t»Miay
«iiavl>Mil*
Margin
•uAWMrtmwatn
MMMt
SShA: cnek MM of critical crack tonelh • 2cc « hill pmrar
m (2ce): Lnk raw o) critical crack • tct« kill po»f
SIEMENS
Compotant
9tral^it Pip*
Siralghl npt
MrMoMPtp*with If Mtrvolr
T1ir*ugh-WdltnEirtrttfot
TTirouett*Will
TT)r»weh-W«)l
ParvTTtrouo^*W H
Pan-T1wowgh-Wan
PlwvDlr*e«an
Lonflhidln«l
eireumlcimUal
Clreum<tr«nt(«l
Lonottudtntl
Lonortud'nai
Lotd
PrMftvr*]
Inttmtl
bMfrnat
(nUrnal Prw*ur*and tending
imtmtifrnivre
M H N IFr*«*ura
Fig.5. "Fracture Mechanics 2" Fig. 6 "Break Preclusion:Test Performed at SIEMENS"
2.3 Verification of LBB-Procedure
The procedure and the tests which verified the LBB-behaviour are described in detailin[ 1,2,4,5,6,7].
In addition to the test performed at the MPA [1,6] tests under realistic conditions wereperformed at Siemens [5] to establish the LBB behaviour, Fig. 6,7.
SIEMENS
Fig.7. "Experimental Leakage Areas"(Siemens test).
3. Examples
Applying the above described proceduresand methodologies the main results (see Fig. 8)can be summarised:
The leakage crack length 2cf' = 156 mmproduces a stable leak which can be safelydetected by the leak detection system, 2cd = 70-130 mm. There are sufficient safety marginsbetween leakage crack length, detectable cracklength and the critical throughwall crack length2ce = 500 mm.
With the data given in [8] the analyses wereperformed. The results (see Fig. 9) showed thatthe LBB-behaviour can be proven, if anadequate leakage detection system is installed.In these plants a SIEMENS acoustic leakagedetection system [ 7,8,9 ] is or will be installed
115
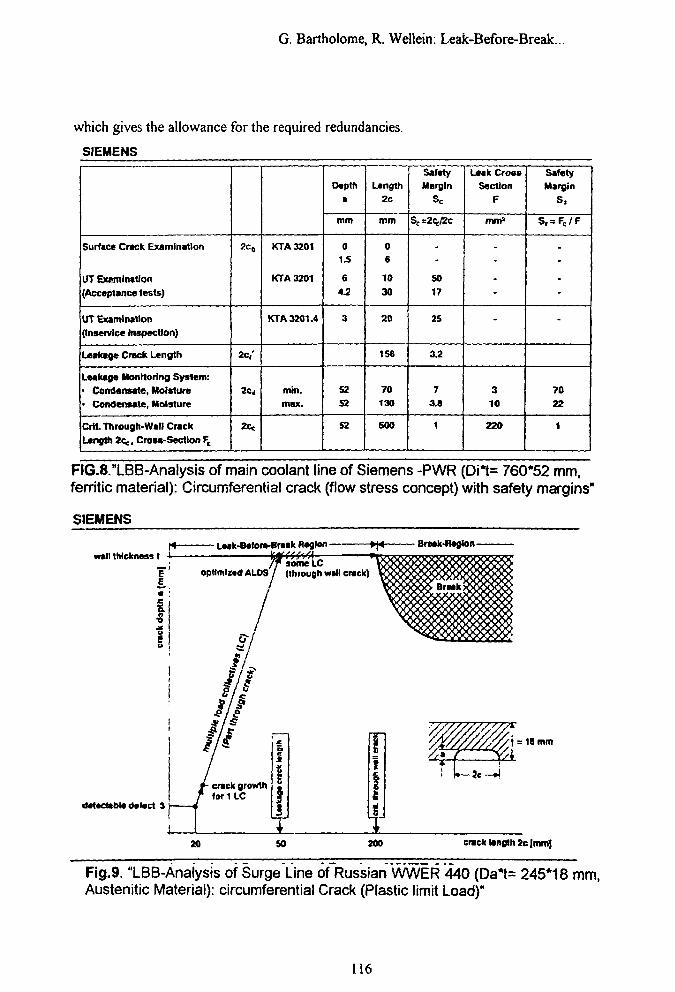
G. Bartholome, R. Wellein: Leak-Before-Break...
which gives the allowance for the required redundancies.
SIEMENS
Surface Crack Examination
UT Examination
(Acceptance tests)
UT Examination(Inservlce Inspection)
Leakage Crack Length
Leakage Monitoring System:• Condensate, Moisture• Condensate, Moisture
Crit Through-Wall CrackLength 2Cc, Cross-Section Ft
2c,
2Cf'
2C<
2C;
KTA3201
KTA3201
KTA3201.4
min.max.
Deptha
mm
01.5
6
4.2
3
5252
52
Length2c
mm
06
10
30
20
156
70130
500
SafetyMargin
Sc
Sc=2iy2c
$017
25
3.2
73.8
1
Leak CrossSection
F
nvn3
-
-
310
220
SafetyMargin
s,
S,= FC/F
-
-
7022
1
FIG.8."LBB-Analysis of main coolant line of Siemens -PWR (Di*t= 760*52 mm,ferritic material): Circumferential crack (flow stress concept) with safety margins"
SIEMENS
wall thickness t A- Leak-B«iora-Break Region — - Break-Region-
7f»omeLCoptlmlred ALOS / (through writ crack)
detectable delect 3
IF t = 18 mm
20 50 200 crack length 2c (mm]
Fig.9. "LBB-Analysis of Surge Line of Russian WWER 440 (Da*t= 245*18 mm,Austenitic Material): circumferential Crack (Plastic limit Load)"
116
G. Bartholome, R. Wellein: Leak-Before-Break..
4. Conclusions
Using the described methods the potential of LBB can be analysed and evaluated.
If the safety margins concerning leakage crack length, critical crack length anddetectable crack length are fulfilled LBB-behaviour can be proven (using an appropriateleak detection system).
5. Literature
[1] K. KuPmaul; "German Basic Safety Concept Rules out Possibility ofCatastrophic Failure" Nucl. Eng. Int., Dec. 1984, pp. 41-46
[2] G. Bartholome, R. Steinbuch, R. Wellein "Preclusion of Double-endedCircumferential Rupture of the Main Coolant Line" 7th MPA-Seminar, 1981,paper 9, pp. 1-26 and NEAD, 72 (1), 1982, pp. 97 -105
[3] RSK-Guidelines for Pressurised Water Reactors 2nd Edition, January 24,1979, incl. Appendices to Sec. 4.2 3rd Edition, October 14,1981 later changesof RSK-Guidelines 21.1 and 21.2, 1983 (Gesellschaft fiir Reaktorsicherheit,GRS, Koln)
[4] H.J. Golembiewski, G. Vasoukis "Ductility Minimum for Application of PlasticLimit Load Concept to Failure Analysis of Structures with Imperfections" Int. J.Pres. Ves. and Piping 24 (1986), pp. 27-36
[5] G. Bartholome, W. Kastner, E. Keim, R. Wellein "Ruling out of Fracture inPressure Boundary Piping, Part 2: Application to the Primary Coolant Piping."Int. Sympo. Reliability of Reactor Pressure Components, Stuttgart, 21-25March 1983, Int. Atomic Energy Agency, Vienna 1983, pp. 237 -254.
[6] E. Roos, K.-H. Herter, G. Bartholome, G. Senski "Assessment of Large ScalePipe Tests by Fracture Mechanics Approximation Procedures with Regard toLeak-Before-Break" Nuclear Engineering and Design 112 (1989), pp. 183-195
[7] G. Bartholome, W. Kastner, E. Keim, Dr.G.Preusser, Dr.G.Schulze"Calibration of Leakage Detection System by Thermohydraulic and FractureMechanics Analyses" 17. MPA-Seminar, Paper 24, pp. 24.1-24.20 Stuttgart,10-11. October 1991
[8] G. Bartholome, W. Kastner, E. Keim "Calculation of Leakage Area andLeakage Rate for the Design of Leakage Detection Systems" SMIRT 11, PaperG22/2, Tokio 18/23.08.1991, pp. 159-164
[9] G. Bartholome, W. Kastner "Requirements on an Acoustic Leak MonitoringSystem to NPPs with Respect to Mechanical and Thermohydraulic Analysis"European Working Group Acoustic Emission, 19th EWGAE Meeting,Erlangen 3/5.10.1990, pp. 1-17
117
I. Cincura, P Hermansky, M. Hrazsky, M. Mikus: Life-Time...
Life-time Evaluation of Bohunice VI NPP Primary LoopComponents
by: I. CINCURA, P. HERMANSKY, M. HRAZSKY, M. MIKUSNUCLEAR POWER PLANTS RESEARCH INSTITUTE (NPPRI)917 000 Trnava, Okruznd 5, CSFR
ABSTRACT
Great attention has been paid to safety and reliability problems of W E R 440 NPPwith V-230 reactor recently. In NPPRI broad activity has been developed to contribute tothis effort. During last three years, but also with respect to earlier results, life-time analysesdevoted to main primary loop components (including piping systems) have been carriedout. The thorough stress and deformation analysis of all important components wasperformed by means of FEM computer programmes for all unnegligible operational states.Fatigue cumulative damage was calculated on the basis of stress analysis in all criticalcomponents parts with the use of actual components loading history.
Above mentioned calculations has shown that the fatigue usage of all componentscritical points has been reasonably low up to now. Therefore fatigue damage seems not tobe the decisive damage mechanism in this case. These results and conclusions have beenutilised as supporting arguments in Bohunice VI NPP primary piping LBB program(finishing in this year) managed by NPPRI and solved by the substantional participation ofNRIRez.
1. INTRODUCTION
The staff of NPP lifetime evaluation section of NPPRI Trnava has dealt with problemsof VI NPP Bohunice components since the beginning of its operation. In the first stage,finishing approximately in 1990, almost all primary circuit pressure components (exceptreactor vessel) and selected primary piping parts had been analysed for the sake of stressstate [4] and fatigue damage determination [1], [2], [5] with respect to all importantloading effects arising in operation. Calculations had been carried out in accordance withpossibilities of that time by means of available software and hardware equipment andtherefore these facts along with insufficient input data availability and quality hadinfluenced results accuracy in some cases.
Problems connected with input data availability for VI components analyses, i.e. withdata describing loading history, physical and mechanical properties of applied materials,component geometry and in-service inspection results, were solved in this period partiallysuccessfully [3], [10], [11].
The second stage of VI component life-time evaluation has been initiated by VIreconstruction project plans and has to involve the verification of existing results and theelaboration of new calculation analyses by means of more accurate models, algorithms andcomputer codes. The most important research program corresponding to such effort is theprogram verifying possibility of the leak-before-break concept implementation on primary
118
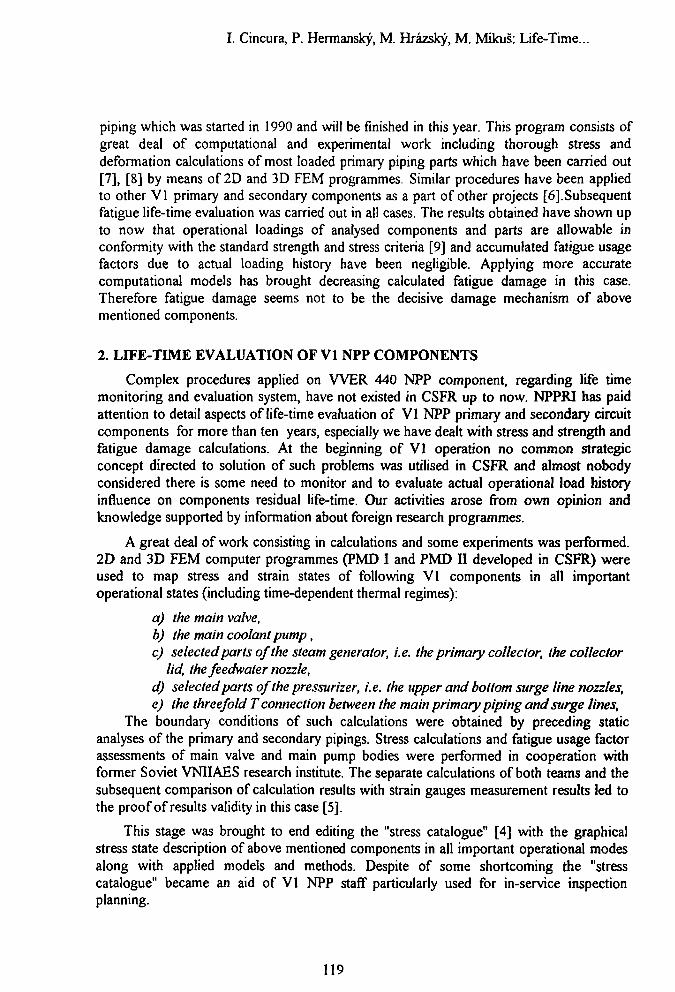
I. Cincura, P. Hermansky, M. Hrazsky, M. Mikus: Life-Time...
piping which was started in 1990 and will be finished in this year. This program consists ofgreat deal of computational and experimental work including thorough stress anddeformation calculations of most loaded primary piping parts which have been carried out17], [8] by means of 2D and 3D FEM programmes. Similar procedures have been appliedto other VI primary and secondary components as a part of other projects [6].Subsequentfatigue life-time evaluation was carried out in all cases. The results obtained have shown upto now that operational loadings of analysed components and parts are allowable inconformity with the standard strength and stress criteria [9] and accumulated fatigue usagefactors due to actual loading history have been negligible. Applying more accuratecomputational models has brought decreasing calculated fatigue damage in this case.Therefore fatigue damage seems not to be the decisive damage mechanism of abovementioned components.
2. LIFE-TIME EVALUATION OF VI NPP COMPONENTS
Complex procedures applied on W E R 440 NPP component, regarding life timemonitoring and evaluation system, have not existed in CSFR up to now. NPPRI has paidattention to detail aspects of life-time evaluation of VI NPP primary and secondary circuitcomponents for more than ten years, especially we have dealt with stress and strength andfatigue damage calculations. At the beginning of VI operation no common strategicconcept directed to solution of such problems was utilised in CSFR and almost nobodyconsidered there is some need to monitor and to evaluate actual operational load historyinfluence on components residual life-time. Our activities arose from own opinion andknowledge supported by information about foreign research programmes.
A great deal of work consisting in calculations and some experiments was performed.2D and 3D FEM computer programmes (PMD I and PMD II developed in CSFR) wereused to map stress and strain states of following VI components in all importantoperational states (including time-dependent thermal regimes):
a) the main valve,b) the main coolant pump,c) selected parts of the steam generator, i.e. the primary collector, the collector
lid, thefeedwater nozzle,d) selected parts of the pressurizer, i.e. the upper and bottom surge line nozzles,e) the threefold T connection between the main primary piping and surge lines,
The boundary conditions of such calculations were obtained by preceding staticanalyses of the primary and secondary pipings. Stress calculations and fatigue usage factorassessments of main valve and main pump bodies were performed in cooperation withformer Soviet VNIIAES research institute. The separate calculations of both teams and thesubsequent comparison of calculation results with strain gauges measurement results led tothe proof of results validity in this case [5].
This stage was brought to end editing the "stress catalogue" [4] with the graphicalstress state description of above mentioned components in all important operational modesalong with applied models and methods. Despite of some shortcoming the "stresscatalogue" became an aid of VI NPP staff particularly used for in-service inspectionplanning.
119
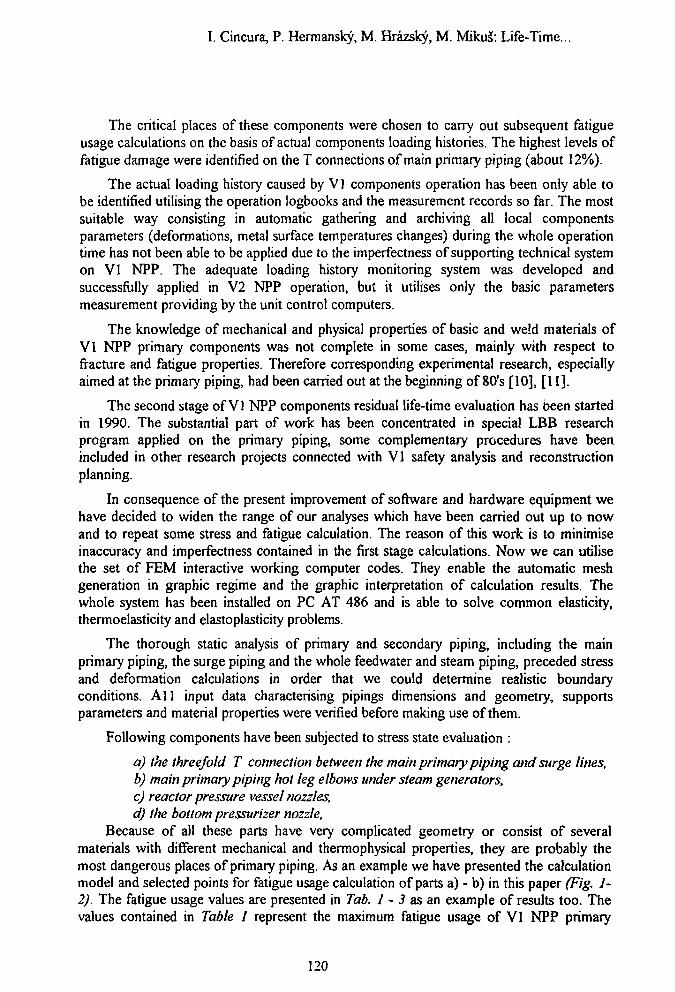
I. Cincura, P. Hermansky, M. Hrazsky, M. Mikus: Life-Time...
The critical places of these components were chosen to carry out subsequent fatigueusage calculations on the basis of actual components loading histories. The highest levels offatigue damage were identified on the T connections of main primary piping (about 12%).
The actual loading history caused by VI components operation has been only able tobe identified utilising the operation logbooks and the measurement records so far. The mostsuitable way consisting in automatic gathering and archiving all local componentsparameters (deformations, metal surface temperatures changes) during the whole operationtime has not been able to be applied due to the imperfectness of supporting technical systemon VI NPP. The adequate loading history monitoring system was developed andsuccessfully applied in V2 NPP operation, but it utilises only the basic parametersmeasurement providing by the unit control computers.
The knowledge of mechanical and physical properties of basic and weld materials ofVI NPP primary components was not complete in some cases, mainly with respect tofracture and fatigue properties. Therefore corresponding experimental research, especiallyaimed at the primary piping, had been carried out at the beginning of 80's [10], [11].
The second stage of VI NPP components residual life-time evaluation has been startedin 1990. The substantial part of work has been concentrated in special LBB researchprogram applied on the primary piping, some complementary procedures have beenincluded in other research projects connected with VI safety analysis and reconstructionplanning.
In consequence of the present improvement of software and hardware equipment wehave decided to widen the range of our analyses which have been carried out up to nowand to repeat some stress and fatigue calculation. The reason of this work is to minimiseinaccuracy and imperfectness contained in the first stage calculations. Now we can utilisethe set of FEM interactive working computer codes. They enable the automatic meshgeneration in graphic regime and the graphic interpretation of calculation results. Thewhole system has been installed on PC AT 486 and is able to solve common elasticity,thermoelasticity and elastoplasticity problems.
The thorough static analysis of primary and secondary piping, including the mainprimary piping, the surge piping and the whole feedwater and steam piping, preceded stressand deformation calculations in order that we could determine realistic boundaryconditions. Al 1 input data characterising pipings dimensions and geometry, supportsparameters and material properties were verified before making use of them.
Following components have been subjected to stress state evaluation :
a) the threefold T connection between the main primary piping and surge lines,b) main primary piping hot leg elbows under steam generators,c) reactor pressure vessel nozzles,d) the bottom pressurizer nozzle,
Because of all these parts have very complicated geometry or consist of severalmaterials with different mechanical and thermophysical properties, they are probably themost dangerous places of primary piping. As an example we have presented the calculationmodel and selected points for fatigue usage calculation of parts a) - b) in this paper (Fig. 1-2). The fatigue usage values are presented in Tab. I - 3 as an example of results too. Thevalues contained in Table 1 represent the maximum fatigue usage of VI NPP primary
120
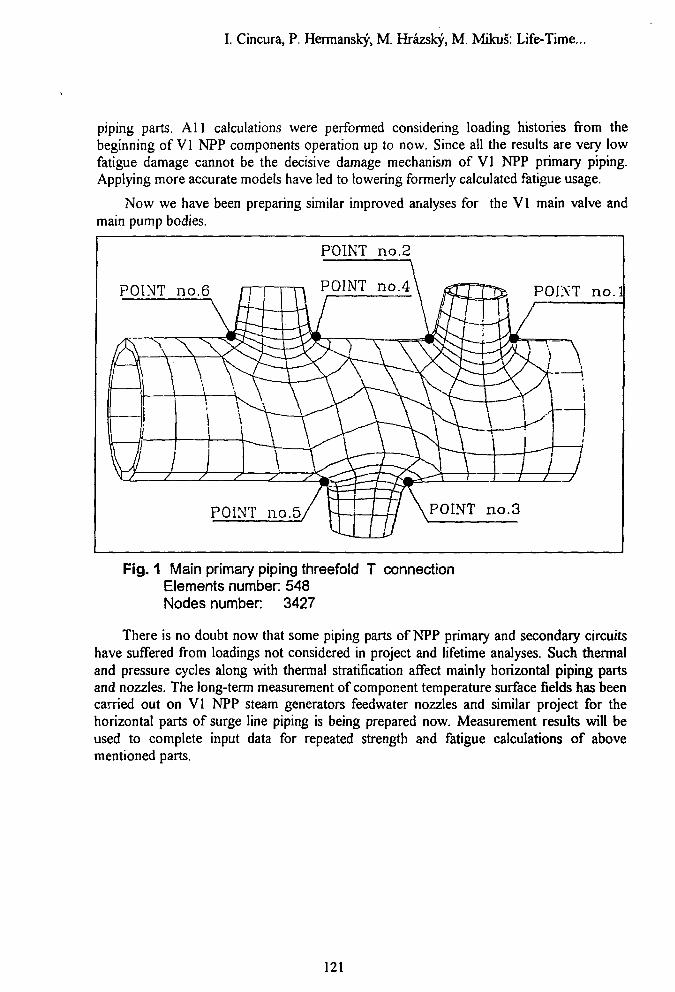
I. Cincura, P. Hermansky, M. Hrazsky, M. Mikus: Life-Time...
piping parts. All calculations were performed considering loading histories from thebeginning of VI NPP components operation up to now. Since all the results are very lowfatigue damage cannot be the decisive damage mechanism of VI NPP primary piping.Applying more accurate models have led to lowering formerly calculated fatigue usage.
Now we have been preparing similar improved analyses for the VI main valve andmain pump bodies.
POINT no .2
POINT no .6 POINT n o . l
POINT n o . 3
Fig. 1 Main primary piping threefold T connectionElements number: 548Nodes number: 3427
There is no doubt now that some piping parts of NPP primary and secondary circuitshave suffered from loadings not considered in project and lifetime analyses. Such thermaland pressure cycles along with thermal stratification affect mainly horizontal piping partsand nozzles. The long-term measurement of component temperature surface fields has beencarried out on VI NPP steam generators feedwater nozzles and similar project for thehorizontal parts of surge line piping is being prepared now. Measurement results will beused to complete input data for repeated strength and fatigue calculations of abovementioned parts.
121
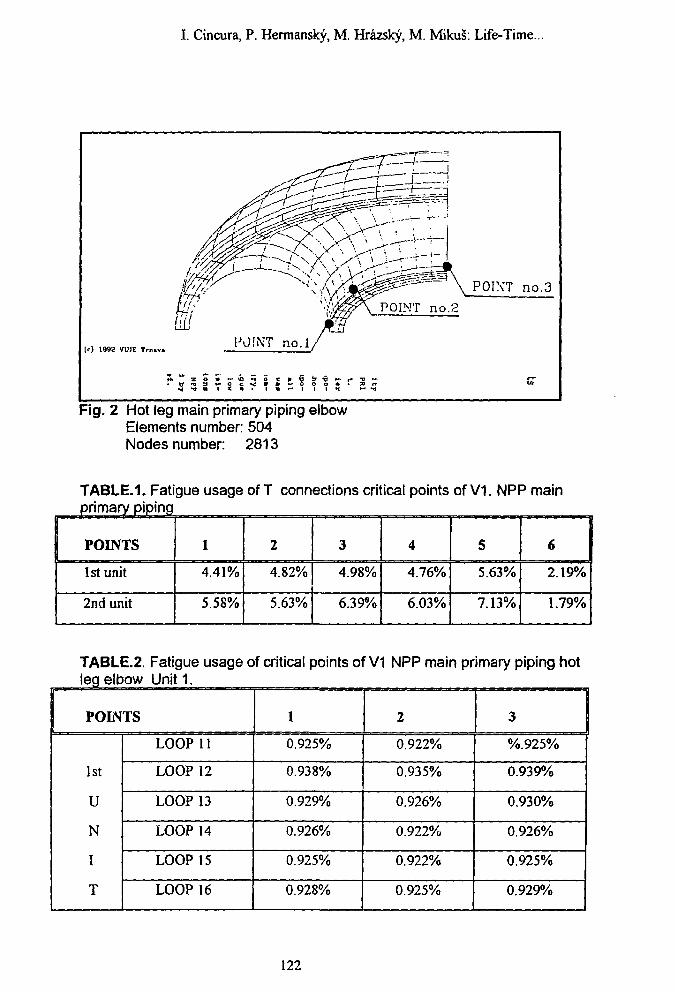
I. Cincura, P. Hermansky, M. Hrazsky, M. Mikus: Life-Time...
I/-'
[<•) 1992 VUJE Trn.v POfNT no. l
POINT no.3
POINT no.2
T S S f» 6 i 6
« — I I i *t
Fig. 2 Hot leg main primary piping elbowElements number: 504Nodes number: 2813
TABLE.1. Fatigue usage of T connections critical points of V1. NPP mainprimary piping
POINTS
1st unit
2nd unit
1
4.41%
5.58%
2
4.82%
5.63%
3
4.98%
6.39%
4
4.76%
6.03%
5
5.63%
7.13%
6
2.19%
1.79%
TABLE.2. Fatigue usage of critical points of V1 NPP main primary piping hotleg elbow Unit 1.
POINTS
1st
U
N
I
T
LOOP 11
LOOP 12
LOOP 13
LOOP 14
LOOP 15
LOOP 16
1
0.925%
0.938%
0.929%
0.926%
0.925%
0.928%
2
0.922%
0.935%
0.926%
0.922%
0.922%
0.925%
3
%.925%
0.939%
0.930%
0.926%
0.925%
0.929%
122
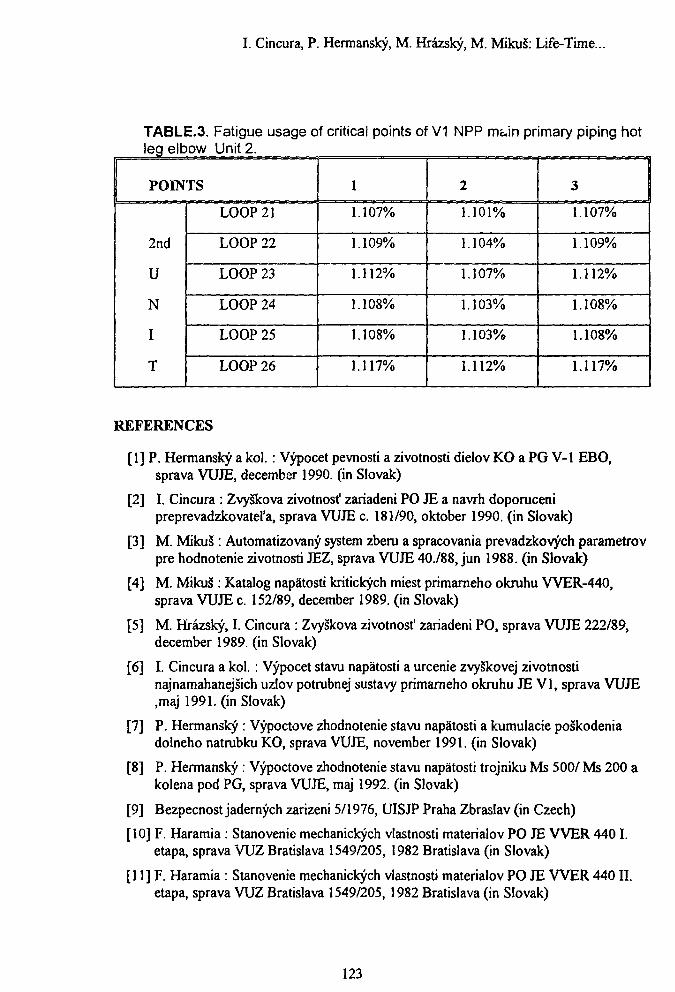
I. Cincura, P. Hermansky, M. Hrazsky, M. Miku§: Life-Time...
TABLE.3. Fatigue usage of critical points of V1 NPP main primary piping hotleg elbow Unit 2.
POINTS
2nd
U
N
I
T
LOOP 21
LOOP 22
LOOP 23
LOOP 24
LOOP 25
LOOP 26
1
1.107%
1.109%
1.112%
1.108%
1.108%
1.117%
2
1.101%
1.104%
1.107%
1.103%
1.103%
1.112%
3
1.107%
1.109%
1.112%
1.108%
1.108%
1.117%
REFERENCES
[I] P. Hermansky a kol. : Vypocet pevnosti a zivotnosti dielov KO a PG V-l EBO,sprava VUJE, december 1990. (in Slovak)
[2] I. Cincura : Zvyskova zivotnost1 zariadeni PO JE a navrh doporucenipreprevadzkovatel'a, sprava VUJE c. 181/90, oktober 1990. (in Slovak)
[3] M. Mikuä : Automatizovany system zberu a spracovania prevadzkovych parametrovpre hodnotenie zivotnosti JEZ, sprava VUJE 40./88, jun 1988. (in Slovak)
[4] M. Mikus : Katalog napätosti kritickych miest primarneho okruhu WER-440,sprava VUJE c. 152/89, december 1989. (in Slovak)
[5] M. Hrâzsky, I. Cincura : Zvyskova zivotnost1 zariadeni PO, sprava VUJE 222/89,december 1989. (in Slovak)
[6] I. Cincura a kol. : Vypocet stavu napätosti a urcenie zvyskovej zivotnostinajnamahanejsich uzlov potrubnej sustavy primarneho okruhu JE VI, sprava VUJE,maj 1991. (in Slovak)
[7] P. Hermansky : Vypoctove zhodnotenie stavu napätosti a kumulacie poskodeniadolneho natrubku KO, sprava VUJE, november 1991. (in Slovak)
[8] P. Hermansky : Vypoctove zhodnotenie stavu napätosti trojniku Ms 500/ Ms 200 akolena pod PG, sprava VUJE, maj 1992. (in Slovak)
[9] Bezpecnost jadernych zarizeni 5/1976, UISJP Praha Zbraslav (in Czech)
[10] F. Haramia : Stanovenie mechanickych vlastnosti materialov PO JE W E R 440 I.etapa, sprava VUZ Bratislava 1549/205, 1982 Bratislava (in Slovak)
II1] F. Haramia : Stanovenie mechanickych vlastnosti materialov PO JE W E R 440II.etapa, sprava VUZ Bratislava 1549/205, 1982 Bratislava (in Slovak)
123
Integrity assesment; Chainnen's report
Integrity assessment of pressurized components
Chairmen's Reports
Session 1.
Chairman: K. KohashiCo-Chairman: F. Gillemot
Mr Blauel presented a paper on An Updated andExtended Safety Analysis for the Reactor Pressure Vesselof the Nuclear Power Plant Stade (KSS) dealing with atypi'.al safety analysis case performed on RPV Stade.Fracture initiation and arrest under strip type emergencycore cooling conditions and safety margins againstductile failure from deep cracks as postulated by therules was presented too.
Credit for the warm prestressing effect in theanalysis and extension of underclaa crack at theinterface being loaded by the thermal shock treatmentwere discussed. To evaluate the safety level at differenttheoretical defects and loads a multibarrier safetyanalysis system have been developed.
Mr. Brumovsky-s presentation dealt with: "WWERReactor Pressure Vessel Integrity Assessment", comparisonand experimental verification, a very basic topic i.e.,comparison of the Soviet and US Codes used for theevaluation of PWR integrity. Similarities and differenceswere shown, widely discussed and some numericalcomparison for a typical vessel and operating conditionwere also given. The comparison shows, that requirementsare different, but they resulting about the same safetylevel.
124
Integrity assesment; Chairmen's report
Session 2
Chairman: M. BrumovskyCo-Chairman: Gy. Mucskay
Mr. Trampus (Hungary) in his paper summarized theHungarian approach to reactor pressure vessel integrityassessment in the NPP Paks, which has 4 units of WWER-440type 213 reactors. He described experimental andcomputational activities supporting this approach. Inincluded calculations of temperature-stress fields in theRPV in operational regimes (LOCA, PTS), includingfracture mechanics applications. An important parts ofthe approach is ISI, carried out from inner as well asfrom outer surfaces using different ultrasonic devices.Finally, the Regulatory side of the approach wasmentioned.
Mr. Gerard (Belgium) described the approach used todemonstrate the integrity of the RPVs of DOEL 1 and 2units. Activities have been directed towards theassessment of materials degradation under serviceexposure, particularly the effect of neutron irradiationand thermal ageing which were found as an importantfactor, too. For these tests a method of specimenreconstitution was applied. Detailed analysis ofinstrumented Charpy load traces provided someexplanations for the outlier behaviour of this material.These experimental data were used as an input into anintegrity assessment. This assessment contained thermo-hydraulics and fracture mechanics analyses mainly duringPTS. As a result, corrective actions (mitigatingmeasures) were applied to each necessary level of safetyand resistance against fracture.
Mr. Hugot (France) showed the French approach to theevaluation of in-service ageing of PWR heavy components.This procedure contains three main steps - assessment ofgeneralized damage, local damage and changes ofmechanical properties of materials. For this purposeresearch before operation and mainly ISI as well assurveillance programmes of design requirements duringreactor operation are of the highest importance. As asupplement, the French approach to the RPV irradiationembrittlement assessment was presented and differenceswith respect to Reg. Guide 1.99, Rev. 2. were stated.Publications for the behaviour of modern materials wasgiven.
Mr. Zuzo (CSFR) described the regulatoryrequirements on integrity of components of reactorsystems in the CSFR, mainly with application to WWER-440type 230 units (NPP V-l) . He described, in detail, thedecree of the CSKAE on necessary measures for improvingsafety as well as the integrity assessment level of theseunits within this so-called "small reconstruction". Inaddition, he gave a list of all diagnostic systems,installed and/or being used in these units, as well asall safety analyses, carried out for reactor safetyassessment.
125
Integrity assesment; Chairmen's report
Session 2 cont.
Chairman: G. EnglCo-Chairman: I. Havas
The major part of the section covered Leak BeforeBreak (LBB)-concept with 2 papers directly addressingLBB--investigations in both theoretical and experimentalaspects.
Mr. Zdarek presented the most recent result of theproject which leads to implementation of LBB approvalstatus for primary piping of WWER-440/230. The projectat present has reached a 75 % status of completion andwill be finished by the end of 1992. The project isdivided into four major tasks: static and dynamicanalysis, material properties, large scale experimentsand leak rate measurements. With the ongoing upgradingprogramme for EBO VI, a satisfactory status will havebeen achieved when the project results are beingimplemented.
Mr. Wellein presented the LBB-concept as part of theBreak Preclusion Concept valid for German plants. The LBBconcept was accepted by the German authorities in 1979and 1983. The concept was presented and demonstrated bythe results oi two applications: Primary piping of aSiemens PWR and a WWER 440 surge line. Consequences foran appropriate leak detection system were derived.
Mr. Hrazsky summarized plant specific results ofstatic stress analysis and fatigue damage assessment workfor critical sections and components of the primarycircuit of WWER 440 reactors VI-NPP..
The discussion clarified some details covered by thepapers and concentrated on the necessity of an overallsystem approach to the LBB concept including dynamicloads and fatigue analysis.
The results achieved in the papers can be utilizedfor other plants of the same type provided that plantspecifics are taken into account.
The discussion emphasized the unresolved safetyissue, concerning the assessment of the effect of thenegative moment on leakage crack size calculations andleak rate. Some ideas for solving this problem have beentouched upon.
126
IAEA Specialist's Meeting onThe Integrity of Pressure Components of Reactor Systems
Paks, Hungary, 27 May, 1992
Integrity assessment methods
Session 3
Chairman: K. WichmanCo-chairman: F. Oswald
Papers:14. Rosinski, S. T.: (USA) Nuclear Reactor Pressure Vessel-Specific FlawDistribution Development
15. Puts, M. P.: (Canada) Fitness-for- Service Assessment of PressureTubes in CANDU Nuclear Generating Stations
16. Briceno, G.; Hernandez, L;Castano Matin, L: (Spain)Spanish Research Activities on Steam Generator Tube Degradation
17. Cizelj, L.; Mavko, B.: (Slovenia) On the Risk-based Steam GeneratorLife Time Optimisation
Session 3 (cont.)
Chairman: T. DuroyCo-chairman: I. Arfinger
Papers:18. Kohashi, K: (Japan) Recent Progress in NPP Life ExtensionTechnology Development
19. Wilam, M ; Cermakova, I: (CSFR) The Evaluation of Integrity ofthe W E R Steam Generator Tubes
20. Zsidi, Z; Balogh, L. et al: (Hungary) Finite Element Methods forAnalysing of some Pressurized Components of the Reactor in Paks
21. Pammer, Z; Szabolcs, G.: (Hungary) Analysis of Nozzle zone ofPaks RPV during Tranzient Load
127
Rosinski on Flaw Distribution
Nuclear Reactor Pressure Vessel-Specific Flaw DistributionDevelopment*
byStanley T. RosinskiSandia National Laboratories, Albuquerque, New Mexico, 87185-5800, USA
Abstract
Previous efforts by the U.S. Department of Energy have shown that the vessel integritypredictions performed through fracture mechanics analysis of a pressurized thermal shock evenlare significantly sensitive to the overall flaw distribution input and that modern vessel inserviceinspection (ISI) results could be used for development of vessel flaw distribution(s) morerepresentative of U.S. vessels. This paper describes the development and application of amethodology to analyze ISI data for the purpose of flaw distribution determination. The resultantmethodology considers detection reliability, flaw sizing accuracy and flaw detection threshold inits application. Application of the methodology was then demonstrated using four recentljacquired U.S. PWR vessel inspection data sets. Throughout the program original insight wasobtained into several key inspection performance and vessel integrity prediction practice issuesthat will impact future vessel integrity evaluation. For example, the potential application of avessel-specific flaw distribution now provides at least one method by which a vessel-specificreference flaw size applicable to pressure-temperature limit curves determination can be estimated.This paper will discuss the development and application of the methodology and the impact tcfuture vessel integrity analyses.
This work was supported by the United States Department of Energy, Contract DEAC04-76DP00789.
Key Words: Reactor Vessel Integrity, Flaw Distribution, Pressurized Thermal Shock,Ultrasonic Inspection, Fracture Mechanics.
Introduction
The fracture mechanics-based analyses utilized in nuclear reactor pressure vessel integrifprediction can be performed deterministically or probabilistically. A deterministic analysis us<fixed values for specified input variables whereas a probabilistic analysis utilizes a probabilidistribution on these variables in order to account for potential uncertainty in these values. Tlprobabilistic analyses of vessel integrity requires computing the risk of vessel failure as a result <growth of any of several flaws postulated in the vessel. Two important parameters in this analy;are the size distribution (probability distribution of flaw size, given the flaw) and the rate of flaoccurrence per unit vessel dimension or volume (flaw density). These two elements togethconstitute the total vessel flaw distribution as shown schematically in Figure 1. Such a descriptii
128
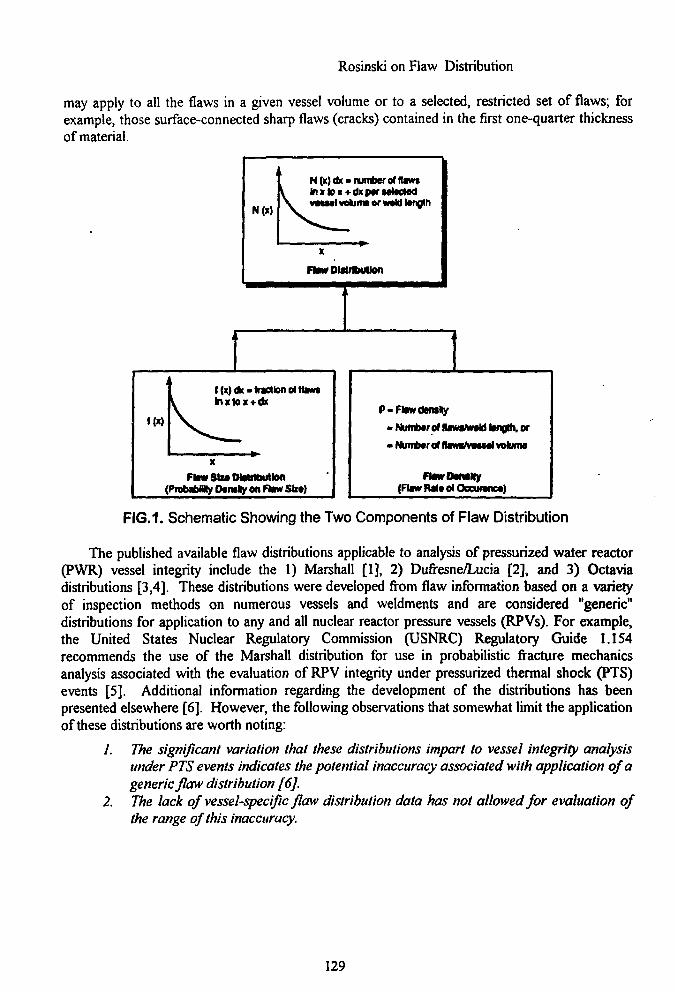
Rosinski on Flaw Distribution
may apply to all the flaws in a given vessel volume or to a selected, restricted set of flaws; forexample, those surface-connected sharp flaws (cracks) contained in the first one-quarter thicknessof material.
N (x) oh - number of llawtIn x to » + dx p#f MttdodV M M I vekime or wtkJ Itnglh
Flaw Distributor)
I (x)dx- traction of flawsInxtox + CBf
FlawSluMaMbutton(PtobaMMy Ptrnfr on flaw Stn)
P-Ftowdmfty
• Number of lawsftwld tongltt. or
- Number o( (UWS/VMM) wlume
RnrOmKy(Flaw Rat* ol Occuranoa)
FIG.1. Schematic Showing the Two Components of Flaw Distribution
The published available flaw distributions applicable to analysis of pressurized water reactor(PWR) vessel integrity include the 1) Marshall [1], 2) Dufresne/Lucia [2], and 3) Octaviadistributions [3,4]. These distributions were developed from flaw information based on a varietyof inspection methods on numerous vessels and weldments and are considered "generic"distributions for application to any and all nuclear reactor pressure vessels (RPVs). For example,the United States Nuclear Regulatory Commission (USNRC) Regulatory Guide 1.154recommends the use of the Marshall distribution for use in probabilistic fracture mechanicsanalysis associated with the evaluation of RPV integrity under pressurized thermal shock (PTS)events [5]. Additional information regarding the development of the distributions has beenpresented elsewhere [6]. However, the following observations that somewhat limit the applicationof these distributions are worth noting:
1. The significant variation that these distributions impart to vessel integrity analysisunder PTS events indicates the potential inaccuracy associated with application of ageneric flaw distribution [6].
2. The lack of vessel-specific flaw distribution data has not allowed for evaluation ofthe range of this inaccuracy.
129
Rosinski on Flaw Distribution
3. The previous generic flaw distributions are not based on vessel inservice inspection(ISI) results and were not developed with current advanced vessel inspectiontechniques.
In order to help resolve the issues described above the US Department of Energy (USDOE)funded the development of a methodology that utilizes vessel ISI data in the determination of avessel flaw distribution. This methodology can be applied on a vessel-specific basis and hasbeneficial implications to the integrity analysis of US commercial RPVs. his paper describes thedeveloped methodology and its application to RPV integrity analyses.
Flaw Distribution Methodology Development
Previous attempts to develop flaw distributions for use in the structural integrity evaluation ofPWR vessels have aimed at the estimation of a "generic" distribution applicable to all vessels. Theapplication of such a generic flaw distribution to the integrity analysis of any particular vessel maylead to potential inaccuracy, the nature of which can vary from conservative to non-conservative.The acceptability of using a generic flaw distribution to describe the condition of any given vesselhinges on an assessment of this inaccuracy and of the vessel-to-vessel variability in the flawdistribution. In order to develop such an assessment, inspection data from individual vessels wereobtained and analyzed. The analysis of individual data sets, however, necessitated thedevelopment of a new approach to analyzing the ISI data. The traditional histogram-basedapproach (a simple count of the number of flaws in a selected size range) could not be reliablyused on a vessel-specific basis primarily due to the limited number of indications and the narrowrange of flaw sizes typically observed in a typical ISI on a single vessel. Thus, a new analysismethodology was developed to be applied on a vessel-specific basis. This new methodologyessentially involves the fitting of an appropriate probability distribution density function to theobserved flaw size data without having to construct a histogram. This approach is advantageousin the case of data sets with a relatively small number of flaws for which a useful histogram cannotbe constructed, as is generally the situation when considering the analysis of an individual vessel.The methodology also considers several inspection system performance parameters, includingflaw detection reliability, flaw sizing accuracy and flaw detection threshold. The fitted functionthen describes the flaw size distribution (probability distribution on flaw size). The flaw rate ofoccurrence (flaw density) is subsequently determined from the observed number of flaws and thefraction of total flaws as predicted from the flaw size distribution in the observed size range.
Flaw Size Distribution Function. In order to develop a distribution that would be easy to usecomputationally, as well as provide a reasonable amount of flexibility in at least the twocharacteristics of scale and shape, the Weibull distribution was chosen to describe the flaw size.The Weibull has been previously shown to provide a reasonable approximation to the distributionof a population that is exponentially or log-normally distributed [7]. A detailed discussion of thederivation and development of the flaw size distribution model (Weibull), including the effects ofthe inspection-related parameters on the model has been presented elsewhere [6,8]. In order tomaintain continuity, however, a brief description of the model will be presented here.
130
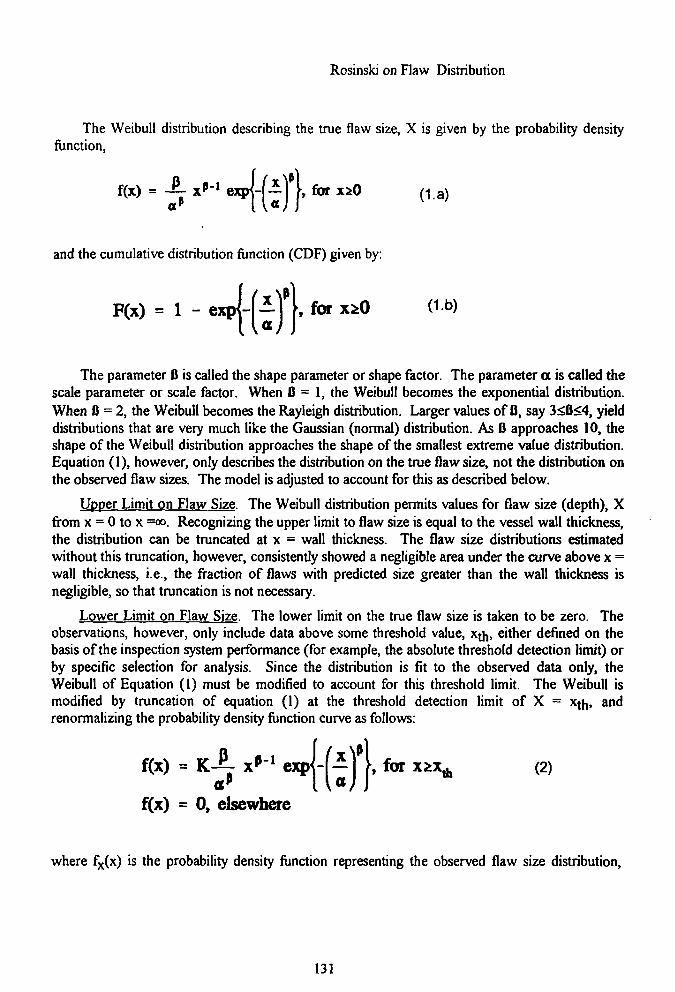
Rosinski on Flaw Distribution
The Weibull distribution describing the true flaw size, X is given by the probability densityfunction,
f(x) = -2- x M expj-f— \"\, for
and the cumulative distribution function (CDF) given by:
F(x) = 1 - -tefi, for xiO 0-b)
The parameter 0 is called the shape parameter or shape factor. The parameter a is called thescale parameter or scale factor. When fi = 1, the Weibull becomes the exponential distribution.When fl = 2, the Weibull becomes the Rayleigh distribution. Larger values of fl, say 3<B<4, yielddistributions that are very much like the Gaussian (normal) distribution. As 0 approaches 10, theshape of the Weibull distribution approaches the shape of the smallest extreme value distribution.Equation (1), however, only describes the distribution on the true flaw size, not the distribution onthe observed flaw sizes. The model is adjusted to account for this as described below.
Upper Limit on Flaw Size. The Weibull distribution permits values for flaw size (depth), Xfrom x = 0 to x =oo. Recognizing the upper limit to flaw size is equal to the vessel wall thickness,the distribution can be truncated at x = wall thickness. The flaw size distributions estimatedwithout this truncation, however, consistently showed a negligible area under the curve above x =wall thickness, i.e., the fraction of flaws with predicted size greater than the wall thickness isnegligible, so that truncation is not necessary.
Lower Limit on Flaw Size. The lower limit on the true flaw size is taken to be zero. Theobservations, however, only include data above some threshold value, xm , either defined on thebasis of the inspection system performance (for example, the absolute threshold detection limit) orby specific selection for analysis. Since the distribution is fit to the observed data only, theWeibull of Equation (1) must be modified to account for this threshold limit. The Weibull ismodified by truncation of equation (1) at the threshold detection limit of X = x t n , andrenormalizing the probability density function curve as follows:
, for x*xA (2)f(x) = K-^Cm
f(x) = 0, elsewhere
where fx(x) is the probability density function representing the observed flaw size distribution,
131
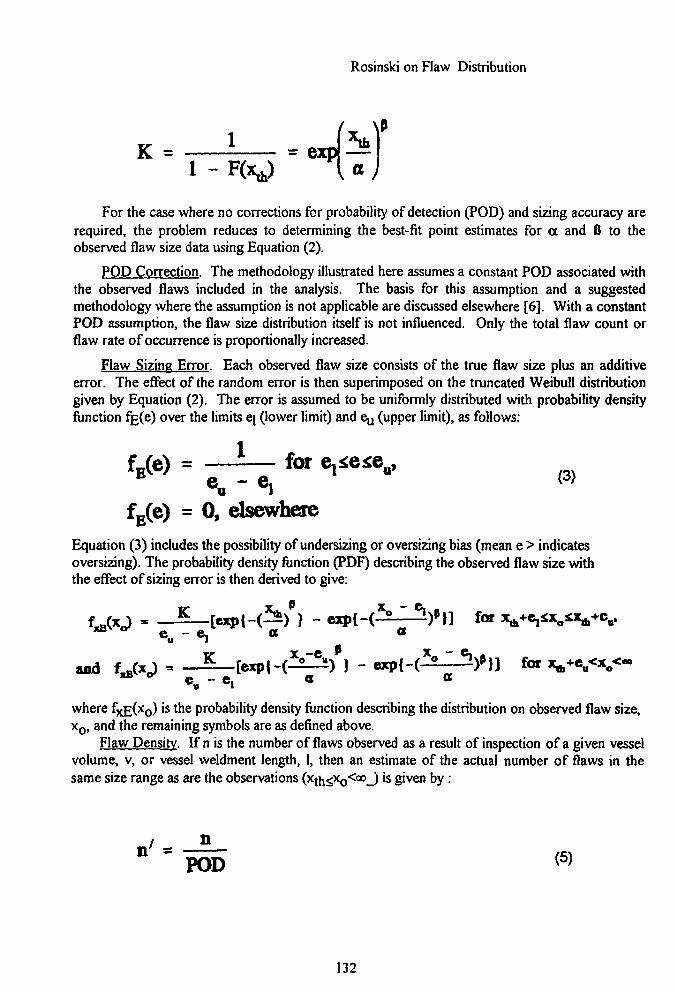
Rosinski on Flaw Distribution
K = - = expa
For the case where no corrections for probability of detection (POD) and sizing accuracy arerequired, the problem reduces to determining the best-fit point estimates for a and B to theobserved flaw size data using Equation (2).
POD Correction. The methodology illustrated here assumes a constant POD associated withthe observed flaws included in the analysis. The basis for this assumption and a suggestedmethodology where the assumption is not applicable are discussed elsewhere [6]. With a constantPOD assumption, the flaw size distribution itself is not influenced. Only the total flaw count orflaw rate of occurrence is proportionally increased.
Flaw Sizing Error. Each observed flaw size consists of the true flaw size plus an additiveerror. The effect of the random error is then superimposed on the truncated Weibull distributiongiven by Equation (2). The error is assumed to be uniformly distributed with probability densityfunction %(e) over the limits ej (lower limit) and eu (upper limit), as follows:
= ^ h ; f o rfE(e) = 0, elsewherefE
Equation (3) includes the possibility of undersizing or oversizing bias (mean e > indicatesoversizing). The probability density function (PDF) describing the observed flaw size withthe effect of sizing error is then derived to give:
J L - ( ^ ) } - cxpl-(^p)11)] far
u
for
where f"xE(xo) ' s t n e probability density function describing the distribution on observed flaw size,x0, and the remaining symbols are as defined above.
Flaw Density. If n is the number of flaws observed as a result of inspection of a given vesselvolume, v, or vessel weldment length, 1, then an estimate of the actual number of flaws in thesame size range as are the observations (xth<xo<QO_) ' s g 'v e n by:
(5)
132
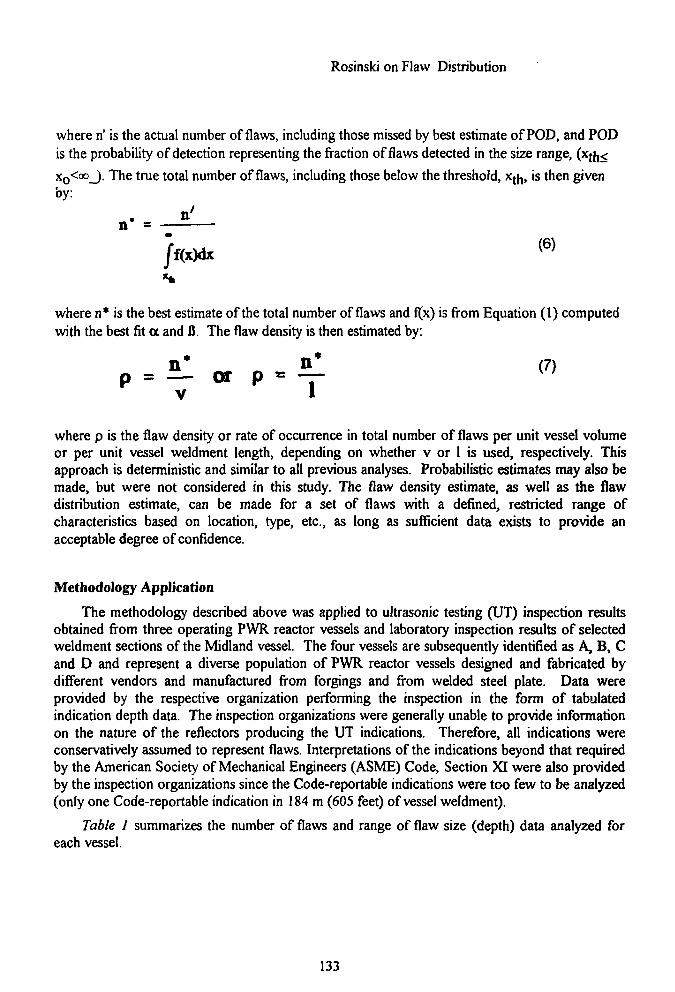
Rosinski on Flaw Distribution
where n' is the actual number of flaws, including those missed by best estimate of POD, and PODis the probability of detection representing the fraction of flaws detected in the size range, (xjn<
XO<QO_). The true total number of flaws, including those below the threshold, x tn, is then givenby:
where n* is the best estimate of the total number of flaws and fl(x) is from Equation (1) computedwith the best fit a and B. The flaw density is then estimated by:
n* n* (7)P = — or p « — K>
v 1where p is the flaw density or rate of occurrence in total number of flaws per unit vessel volumeor per unit vessel weldment length, depending on whether v or 1 is used, respectively. Thisapproach is deterministic and similar to all previous analyses. Probabilistic estimates may also bemade, but were not considered in this study. The flaw density estimate, as well as the flawdistribution estimate, can be made for a set of flaws with a defined, restricted range ofcharacteristics based on location, type, etc., as long as sufficient data exists to provide anacceptable degree of confidence.
Methodology Application
The methodology described above was applied to ultrasonic testing (UT) inspection resultsobtained from three operating PWR reactor vessels and laboratory inspection results of selectedweldment sections of the Midland vessel. The four vessels are subsequently identified as A, B, Cand D and represent a diverse population of PWR reactor vessels designed and fabricated bydifferent vendors and manufactured from forgings and from welded steel plate. Data wereprovided by the respective organization performing the inspection in the form of tabulatedindication depth data. The inspection organizations were generally unable to provide informationon the nature of the reflectors producing the UT indications. Therefore, all indications wereconservatively assumed to represent flaws. Interpretations of the indications beyond that requiredby the American Society of Mechanical Engineers (ASME) Code, Section XI were also providedby the inspection organizations since the Code-reportable indications were too few to be analyzed(only one Code-reportable indication in 184 m (605 feet) of vessel weldment).
Table 1 summarizes the number of flaws and range of flaw size (depth) data analyzed foreach vessel.
133
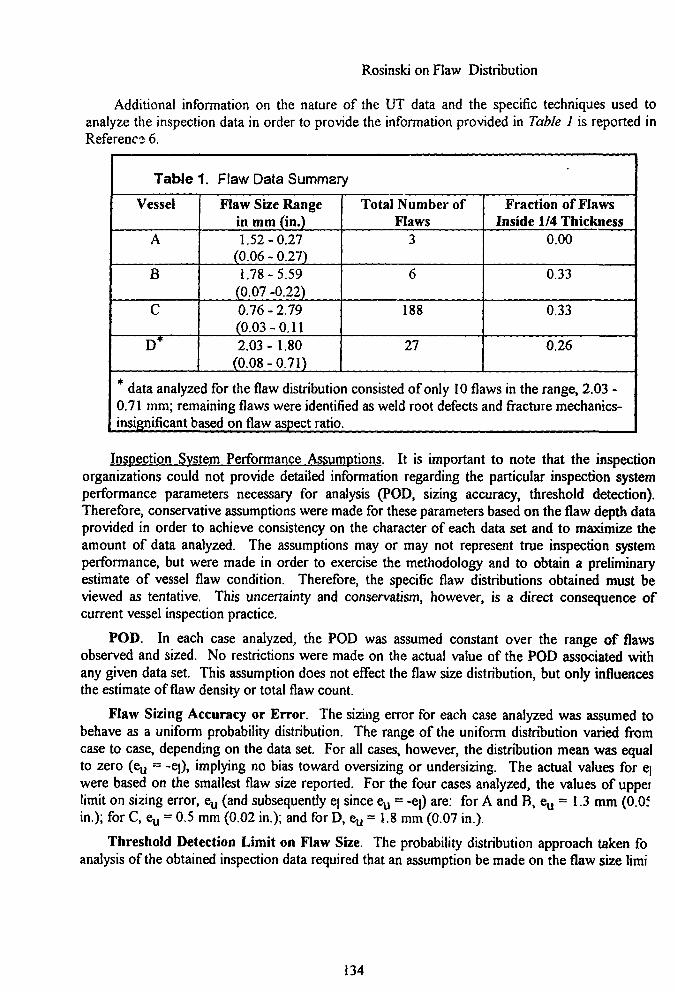
Rosinski on Flaw Distribution
Additional information on the nature of the UT data and the specific techniques used toanalyze the inspection data in order to provide the information provided in Table 1 is reported inReference 6.
Table 1. Flaw Data Summary
Vessel
A
B
C
D*
Flaw Size Rangein mm (in.)1.52-0.27
(0.06 - 0.27)1.78-5.59
(0.07 -0.22)0.76 - 2.79(0.03-0.112.03-1.80
(0.08 - 0.71)
Total Number ofFlaws
3
6
188
27
Fraction of FlawsInside 1/4 Thickness
0.00
0.33
0.33
0.26
data analyzed for the flaw distribution consisted of only 10 flaws in the range, 2.03 -0.71 mm; remaining flaws were identified as weld root defects and fracture mechanics-insignificant based on flaw aspect ratio.
Inspection System Performance Assumptions. It is important to note that the inspectionorganizations could not provide detailed information regarding the particular inspection systemperformance parameters necessary for analysis (POD, sizing accuracy, threshold detection).Therefore, conservative assumptions were made for these parameters based on the flaw depth dataprovided in order to achieve consistency on the character of each data set and to maximize theamount of data analyzed. The assumptions may or may not represent true inspection systemperformance, but were made in order to exercise the methodology and to obtain a preliminaryestimate of vessel flaw condition. Therefore, the specific flaw distributions obtained must beviewed as tentative. This uncertainty and conservatism, however, is a direct consequence ofcurrent vessel inspection practice.
POD. In each case analyzed, the POD was assumed constant over the range of flawsobserved and sized. No restrictions were made on the actual value of the POD associated withany given data set. This assumption does not effect the flaw size distribution, but only influencesthe estimate of flaw density or total flaw count.
Flaw Sizing Accuracy or Error. The sizing error for each case analyzed was assumed tobehave as a uniform probability distribution. The range of the uniform distribution varied fromcase to case, depending on the data set. For all cases, however, the distribution mean was equalto zero (eu = -e]), implying no bias toward oversizing or undersizing. The actual values for ejwere based on the smallest flaw size reported. For the four cases analyzed, the values of uppeilimit on sizing error, e , (and subsequently ej since ^ = -e|) are: for A and B, eu = 1.3 mm (0.05in.); for C, eu = 0.5 mm (0.02 in.); and for D, ^ = 1.8 mm (0.07 in.).
Threshold Detection Limit on Flaw Size. The probability distribution approach taken foanalysis of the obtained inspection data required that an assumption be made on the flaw size limi
134
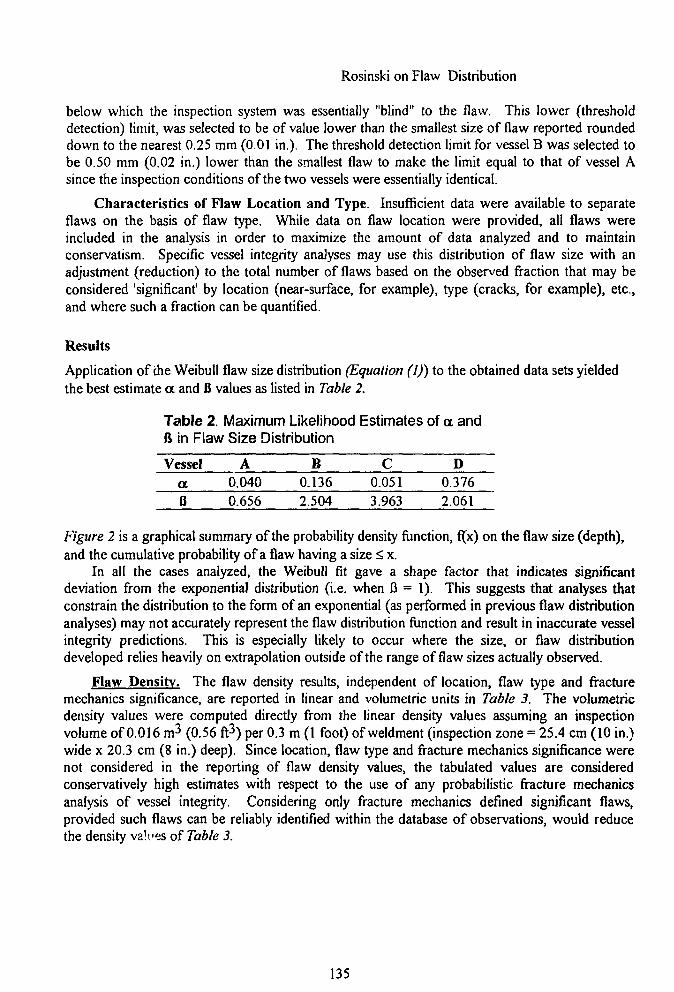
Rosinski on Flaw Distribution
below which the inspection system was essentially "blind" to the flaw. This lower (thresholddetection) limit, was selected to be of value lower than the smallest size of flaw reported roundeddown to the nearest 0.25 mm (0.01 in.). The threshold detection limit for vessel B was selected tobe 0.50 mm (0.02 in.) lower than the smallest flaw to make the limit equal to that of vessel Asince the inspection conditions of the two vessels were essentially identical.
Characteristics of Flaw Location and Type. Insufficient data were available to separateflaws on the basis of flaw type. While data on flaw location were provided, all flaws wereincluded in the analysis in order to maximize the amount of data analyzed and to maintainconservatism. Specific vessel integrity analyses may use this distribution of flaw size with anadjustment (reduction) to the total number of flaws based on the observed fraction that may beconsidered 'significant' by location (near-surface, for example), type (cracks, for example), etc.,and where such a fraction can be quantified.
Results
Application of me Weibull flaw size distribution (Equation (1)) to the obtained data sets yieldedthe best estimate a and B values as listed in Table 2.
Table 2. Maximum Likelihood Estimates of a andB in Flaw Size Distribution
Vesselaa
A0.0400.656
B0.1362.504
C0.0513.963
D0.3762.061
Figure 2 is a graphical summary of the probability density function, f(x) on the flaw size (depth),and the cumulative probability of a flaw having a size < x.
In all the cases analyzed, the Weibull fit gave a shape factor that indicates significantdeviation from the exponential distribution (i.e. when fl = 1). This suggests that analyses thatconstrain the distribution to the form of an exponential (as performed in previous flaw distributionanalyses) may not accurately represent the flaw distribution function and result in inaccurate vesselintegrity predictions. This is especially likely to occur where the size, or flaw distributiondeveloped relies heavily on extrapolation outside of the range of flaw sizes actually observed.
Flaw Density. The flaw density results, independent of location, flaw type and fracturemechanics significance, are reported in linear and volumetric units in Table 3. The volumetricdensity values were computed directly from the linear density values assuming an inspectionvolume of 0.016 m-* (0.56 ft3) per 0.3 m (1 foot) of weldment (inspection zone = 25.4 cm (10 in.)wide x 20.3 cm (8 in.) deep). Since location, flaw type and fracture mechanics significance werenot considered in the reporting of flaw density values, the tabulated values are consideredconservatively high estimates with respect to the use of any probabilistic fracture mechanicsanalysis of vessel integrity. Considering only fracture mechanics defined significant flaws,provided such flaws can be reliably identified within the database of observations, would reducethe density values of Table 3.
135
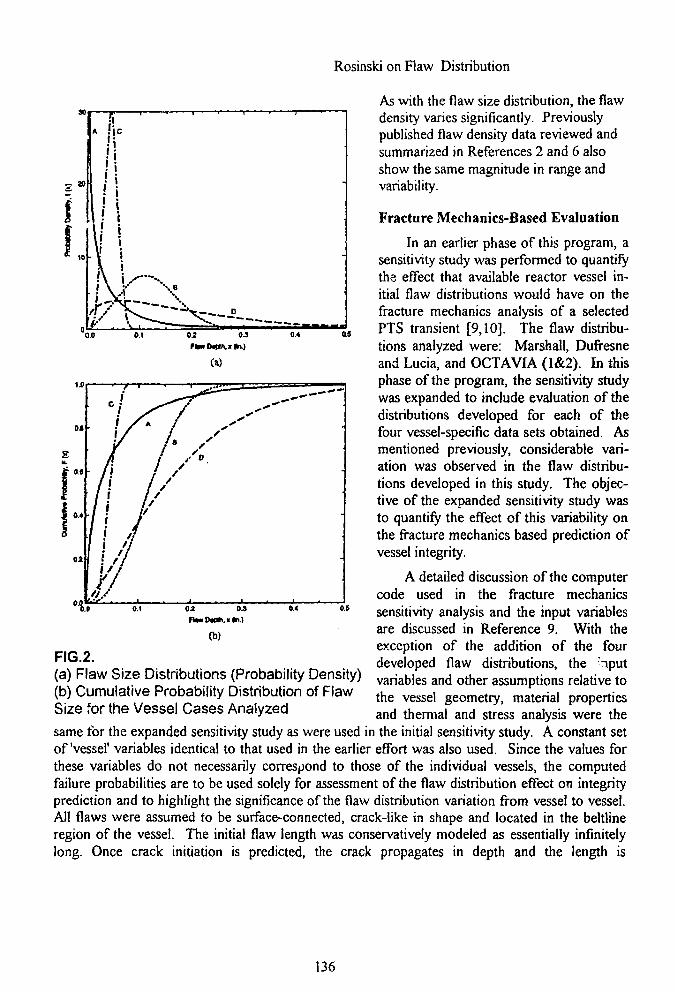
Rosinski on Flaw Distribution
05
(b)
As with the flaw size distribution, the flawdensity varies significantly. Previouslypublished flaw density data reviewed andsummarized in References 2 and 6 alsoshow the same magnitude in range andvariability.
Fracture Mechanics-Based Evaluation
In an earlier phase of this program, asensitivity study was performed to quantifythe effect that available reactor vessel in-itial flaw distributions would have on thefracture mechanics analysis of a selectedPTS transient [9,10]. The flaw distribu-tions analyzed were: Marshall, Dufresneand Lucia, and OCTAVIA (1&2). In thisphase of the program, the sensitivity studywas expanded to include evaluation of thedistributions developed for each of thefour vessel-specific data sets obtained. Asmentioned previously, considerable vari-ation was observed in the flaw distribu-tions developed in this study. The objec-tive of the expanded sensitivity study wasto quantify the effect of this variability onthe fracture mechanics based prediction ofvessel integrity.
A detailed discussion of the computercode used in the fracture mechanicssensitivity analysis and the input variablesare discussed in Reference 9. With theexception of the addition of the fourdeveloped flaw distributions, the nputvariables and other assumptions relative tothe vessel geometry, material propertiesand thermal and stress analysis were the
FIG.2.(a) Flaw Size Distributions (Probability Density)(b) Cumulative Probability Distribution of FlawSize for the Vessel Cases Analyzed
same for the expanded sensitivity study as were used in the initial sensitivity study. A constant setof'vessel' variables identical to that used in the earlier effort was also used. Since the values forthese variables do not necessarily correspond to those of the individual vessels, the computedfailure probabilities are to be used solely for assessment of the flaw distribution effect on integrityprediction and to highlight the significance of the flaw distribution variation from vessel to vessel.All flaws were assumed to be surface-connected, crack-like in shape and located in the beltlineregion of the vessel. The initial flaw length was conservatively modeled as essentially infinitelylong. Once crack initiation is predicted, the crack propagates in depth and the length is
136
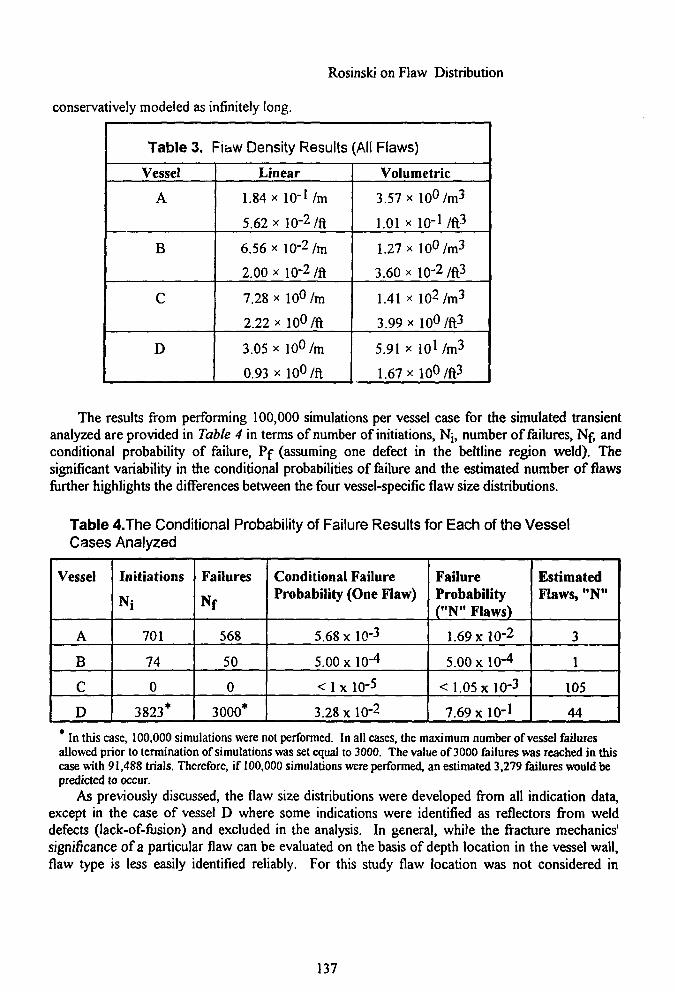
Rosinski on Flaw Distribution
conservatively modeled as infinitely long.
Table 3. Fiaw Density Results (All Flaws)
Vessel
A
B
C
D
Linear
1.84 x 10⁻¹ /m
5.62 x 10⁻² /ft
6.56 x 10⁻² / m
2.00 x 10⁻² /ft
7.28 x ioO /m
2.22 x 10°/ft
3.05 x ioO /m
0.93 x IQO /ft
Volumetric
3.57 x 10°/m3
1.01 x 10⁻¹ /ft3
1.27 x 10°/m3
3.60 x 10⁻²/ft3
1.41 x 10²/m3
3.99 x 1OO /ft3
5.91 x I01 /m3
1.67 x 10°/ft3
The results from performing 100,000 simulations per vessel case for the simulated transientanalyzed are provided in Table 4 in terms of number of initiations, Nj, number of failures, Nf, andconditional probability of failure, Pf (assuming one defect in the beltline region weld). Thesignificant variability in the conditional probabilities of failure and the estimated number of flawsfurther highlights the differences between the four vessel-specific flaw size distributions.
Table 4.The Conditional Probability of Failure Results for Each of the VesselCases Analyzed
Vessel
A
B
C
D
Initiations
Nj
701
74
0
3823*
Failures
N f
568
50
0
3000*
Conditional FailureProbability (One Flaw)
5.68 x lO"3
5.00 xlO'4
< 1x 10"5
3.28 x 10⁻²
FailureProbability("N" Flaws)
1.69x10⁻²
5.00 x 10"4
< l.O5xlO-3
7.69 x 10⁻¹
EstimatedFlaws, "N"
3
1
105
44
In this case, 100,000 simulations were not performed. In all cases, the maximum number of vessel failuresallowed prior to termination of simulations was set equal to 3000. The value of 3000 failures was reached in thiscase with 91,488 trials. Therefore, if 100,000 simulations were performed, an estimated 3,279 failures would bepredicted to occur.
As previously discussed, the flaw size distributions were developed from all indication data,except in the case of vessel D where some indications were identified as reflectors from welddefects (lack-of-fusion) and excluded in the analysis. In general, while the fracture mechanics'significance of a particular flaw can be evaluated on the basis of depth location in the vessel wall,flaw type is less easily identified reliably. For this study flaw location was not considered in
137
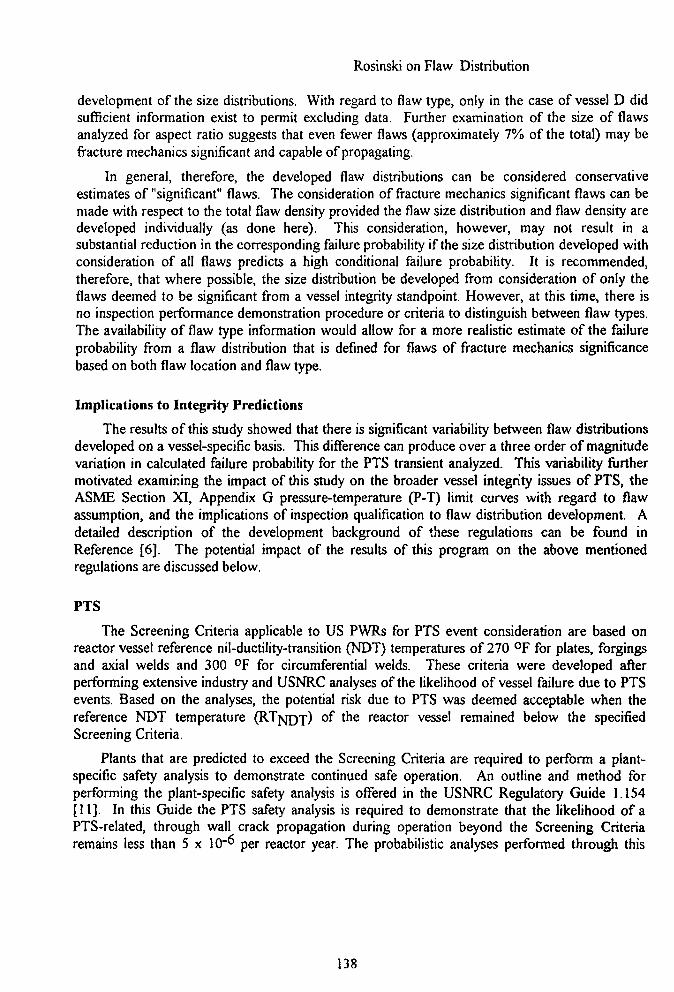
Rosinski on Flaw Distribution
development of the size distributions. With regard to flaw type, only in the case of vessel D didsufficient information exist to permit excluding data. Further examination of the size of flawsanalyzed for aspect ratio suggests that even fewer flaws (approximately 7% of the total) may befracture mechanics significant and capable of propagating.
In general, therefore, the developed flaw distributions can be considered conservativeestimates of "significant" flaws. The consideration of fracture mechanics significant flaws can bemade with respect to the total flaw density provided the flaw size distribution and flaw density aredeveloped individually (as done here). This consideration, however, may not result in asubstantial reduction in the corresponding failure probability if the size distribution developed withconsideration of all flaws predicts a high conditional failure probability. It is recommended,therefore, that where possible, the size distribution be developed from consideration of only theflaws deemed to be significant from a vessel integrity standpoint. However, at this time, there isno inspection performance demonstration procedure or criteria to distinguish between flaw types.The availability of flaw type information would allow for a more realistic estimate of the failureprobability from a flaw distribution that is defined for flaws of fracture mechanics significancebased on both flaw location and flaw type.
Implications to Integrity Predictions
The results of this study showed that there is significant variability between flaw distributionsdeveloped on a vessel-specific basis. This difference can produce over a three order of magnitudevariation in calculated failure probability for the PTS transient analyzed. This variability furthermotivated examining the impact of this study on the broader vessel integrity issues of PTS, theASME Section XI, Appendix G pressure-temperature (P-T) limit curves with regard to flawassumption, and the implications of inspection qualification to flaw distribution development. Adetailed description of the development background of these regulations can be found inReference [6]. The potential impact of the results of this program on the above mentionedregulations are discussed below.
PTS
The Screening Criteria applicable to US PWRs for PTS event consideration are based onreactor vessel reference nil-ductility-transition (NDT) temperatures of 270 °F for plates, forgingsand axial welds and 300 °F for circumferential welds. These criteria were developed afterperforming extensive industry and USNRC analyses of the likelihood of vessel failure due to PTSevents. Based on the analyses, the potential risk due to PTS was deemed acceptable when thereference NDT temperature (RTJVJDJ) of the reactor vessel remained below the specifiedScreening Criteria.
Plants that are predicted to exceed the Screening Criteria are required to perform a plant-specific safety analysis to demonstrate continued safe operation. An outline and method forperforming the plant-specific safety analysis is offered in the USNRC Regulatory Guide 1.154[11]. In this Guide the PTS safety analysis is required to demonstrate that the likelihood of aPTS-related, through wall crack propagation during operation beyond the Screening Criteriaremains less than 5 x 10"^ per reactor year. The probabilistic analyses performed through this
138
Rosinski on Flaw Distribution
method assumes a generic flaw distribution. As discussed above, a generic flaw distribution maynot accurately represent the flaw condition of any individual vessel. The Regulatory Guide,however, also appears to allow for assuming a vessel-specific flaw density in the PTS probabilisticfracture mechanics analysis. However, it does not discuss modifications to the generic flaw sizedistribution. Given the variability in flaw density and flaw size distribution found for the fourvessel cases analyzed in this study, it is obvious that overly conservative and unrealistic flawdistributions can be defined when combining incompatible flaw data (for example, combining flawdensity from vessel C with the flaw size distribution from vessel D). The nature of the fourdistributions analyzed in this study also suggests that significantly different predictions areobtainable with a vessel-specific flaw distribution than with the NRC recommended distribution.
The methodology presented in this study can be used to develop a vessel-specific flaw sizedistribution and flaw density for the PTS safety analysis provided inspection system performanceparameters can be quantified or estimated. This further indicates the necessity of integrating ISIrequirements and results into plant-specific safety evaluations for PTS. This will be discussed later.
P-T Limit Curves
The Code of Federal Regulations, 10 CFR Part 50, Appendix G [127 requires thedevelopment of P-T limit curves for the prevention of nonductile failure of the reactor vesselduring plant heatup and cooldown. This requirement refers to the ASME Code, Section III,Appendix G [13] as the guiding document for calculation of the P-T limits. The determination ofP-T limits involves a deterministic evaluation assuming a surface-connected flaw with a depthequal to 1/4 of the thickness of the vessel (1/4T) and a length equal to six times the depth.
Radiation exposure of the vessel wall must be considered when performing P-T limitcalculations. To account for irradiation, the R T J ^ D J
v a l u e s a r e shifted using surveillance data andpreviously developed trend procedures. This resultant shift in the RTJSJDJ values effectivelyreduces the allowable pressure at any given temperature under which a plant may operate duringheatup or cooldown conditions, i.e., the operating "window" is reduced as radiation exposureincreases. At low temperature, low pressure operation another concern is warranted. Because ofthe lower limit on pressure for maintaining a net positive suction head on pumps to preventcavitation and damage to the pump impellers, a large shift in RTJSJDJ (determined either throughsurveillance data or conservative caLulations) can lead to overly restrictive operation during plantheatup and cooldown.
A significant reduction in the P-T operating window at low pressures has significanteconomic and safety implications. As a result, the heatup and cooldown time periods for the plantare increased. Also, depending on the predicted irradiation damage, the operating window couldbecome so restrictive that operation would not be possible. A narrow operating window alsoincreases the probability of an inadvertent relief valve activation.
One possible approach in the resolution of this issue is through the reduction of the reference1/4T flaw size presently required in the analysis of P-T limit curves when considering the effectsof irradiation. Presently, however, no guidance is provided in the ASME Code on how to justifya smaller reference flaw.
139
Rosinski on Flaw Distribution
The flaw distribution methodology discussed here provides one basis for selection of anAppendix G flaw size that would be plant-specific, and potentially less than the presently requiredvalue of 1/4T in depth. To accomplish this, however, specific information would be requiredincluding 1) an estimate of the flaw size distribution, 2) an estimate of the flaw density from thedeveloped flaw size distribution, 3) the number of observed flaws above a threshold size, and 4)inspection system performance (POD) of a flaw of a given size. With this information, a definedlevel of acceptable risk can then be used to estimate the maximum flaw size that would beassociated with that level of risk. This flaw size would then represent the maximum flaw size forthat vessel and would be considered a conservative vessel-specific flaw for vessel integrity analysis(specifically, P-T limit curve determination).
Vessel Inspection Practice
Significant vessel-to-vessel variation in flaw distribution was observed in this study. Thisvariation suggests that the development of vessel-specific distributions from vessel ISI data maybetter represent the vessel condition than the use of potentially inaccurate "generic" distributions.At a minimum, the applicability of "generic" distributions should be further explored throughcontinued vessel-specific analyses.
The development of vessel-specific flaw distributions may also require an improvement ininspection requirements. Typically, very few Code-reportable flaws are found during normal ISIprocedures (only one flaw found in the four data sets analyzed in this study). The reliance on onlyCode-reportable flaws for flaw distribution development appears inadequate. The small number ofCode-reportable flaws typically found is insufficient to develop any reliable flaw distribution. Theimplication is that flaws need to be detected and sized well-beyond what is presently required bythe ASME Code, Section XI.
The improved detection and sizing of flaws during ISI will also benefit subsequent vesselintegrity analyses. The conservatism associated with using all flaws for developing the distributioncan be beneficially reduced by qualified identification of only fracture mechanics-significant flawsbased on flaw type and location. This is evidenced by the results on Vessel D, where, as few as,two flaws or seven percent of the total may be considered to be fracture mechanics-significantflaws based on flaw location and flaw aspect ratio.
Conclusions
The following conclusions are made from this study.
• A new flaw distribution development methodology, statistically incorporating theeffects of inspection system performance, and capable of accepting very few datapoints, was developed and successfully exercised on a vessel-specific basis.
• The observed variability between the results of the analyses of the four data sets (flawsize distribution, flaw density, fracture mechanics evaluations) suggests the preferreduse of a vessel-specific flaw distribution versus presently used "generic" distributions.
140
Rosinski on Flaw Distribution
• Although not specifically intended to facilitate development of a flaw distribution,existing inspection requirements may be found inadequate for the purpose. Animprovement in flaw detection and flaw sizing beyond present requirements isrecommended.
• Flaw location and flaw type were not considered in the development of the flaw sizedistributions discussed in this study. It is recognized that the inclusion of midwalldefects and volumetric/laminar flaws in the data set can produce very conservativeestimates of the size distributions. Thus, a need is identified for qualified separation offlaws on the basis of flaw type. This will permit partial elimination of flaws in the dataset considered to be insignificant from a fracture mechanics standpoint. It isrecommended that through-wall location not be considered in the development of asize distribution, but only for the estimate of flaw density.
• The use of a vessel-specific flaw distribution may affect the flaw distribution input tothe probabilistic fracture mechanics analysis for prediction of vessel integrity underPTS. The discussed methodology can now provide a more accurate assessment ofvessel integrity under PTS. Where a vessel-specific flaw distribution cannot be directlydeveloped from ISI data, any default assumptions of flaw size distribution and flawdensity should be checked for compatibility against the actual ISI observations.
• The vessel-specific flaw distribution provides, for the first time, a quantitative basis forestimating a reference flaw size (in preference to the conventional assumption of a1/4T size) applicable to P-T Limit curve determination under the ASME Code SectionIII, Appendix G. This can be performed by the choice of a specific flaw size so thatthe risk of having flaws of size greater than the identified flaw is less than somespecified risk value. The reference flaw can then be estimated by use of an appropriatefactor of safety multiplier on the identified flaw.
Acknowledgement
The following individuals and organizations are acknowledged for their participation in theproject; E. L. Kennedy, J. R. Foulds and D. D. Dedhia (Failure Analysis Associates), S. L. Basin(Joyce and Associates), J. R. Quinn (Dynacon Systems, Inc.), G. L. Lagleder and H. Diaz(Southwest Research Institute), and E. K. Kietzman, F. L. Becker and F. V. Ammirato (JAJones/EPRI NDE Center). The owners of the three operating vessels, who will remainanonymous, are also thanked for granting permission to use their vessel inspection results.
References
[1]. W. Marshall, "An Assessment of the Integrity of PWR Pressure Vessels, SummaryReport," United Kingdom Atomic Energy Authority, June 1982.
[2]. J. Dufresne et al, "Probabilistic Study of the Fracture of PWR Vessels," Framatome ReportEEflTDC0052, 1985.
[3]. W. E. Veseley, E. K. Lynn, and F. F. Goldberg, "The OCTAVIA Computer Code: PWRReactor Pressure Vessel Failure Probabilities Due to Operationally Caused PressureTransients," U.S. NRC, NUREG-0258, March 1978.
141
Rosinski on Flaw Distribution
[4]. F. A. Simonen et al, "VISA-II - A Computer Code for Predicting the Probability ofReactor Pressure Vessel Failure," NUREG/CR-4486, U.S. Nuclear RegulatoryCommission, Washington, DC, March 1986.
[5], "Format and Content of Plant-Specific Pressurized Thermal Shock Safety Analysis forPressurized Thermal Shock Safety Analysis for Pressurized Water Reactors," U.S.Nuclear Regulatory Commission, Washington, D.C., 1987.
[6]. E. L. Kennedy, J. R. Foulds and S. L. Basin, "Nuclear Reactor Pressure Vessel FlawDistribution Development Phase II - Methodology and Application," SAND91-7073,Sandia National Laboratories, Albuquerque, NM, December 1991.
[7]. E. H. Lehman, Jr., IEEE Transactions on Reliability, September 1963.[8]. J. R. Foulds, E. L. Kennedy, S. L. Basin and S. T. Rosinski, "Flaw Distribution
Development From Vessel ISI Data," presented at 1 lth International NDE Conference,Albuquerque, NM, April 29 - May 2, 1992.
[9]. E. L. Kennedy and J. R. Foulds, "Nuclear Reactor Pressure Vessel Flaw DistributionDevelopment Phase I - NDE Capability and Sensitivity Analyses," SAND89-7148, SandiaNational Laboratories, Albuquerque, NM, May 1990.
[10]. S. T. Rosinski, E, L. Kennedy and J. R. Foulds, "Feasibility for Development of a NuclearReactor Pressure Vessel Flaw Distribution - Sensitivity Analysis and NDE Capability,"Proceedings of the IAEA Specialists Meeting on Nuclear Power Plant Lifetime AssuranceStockholm, Sweden, December 1990.
[11]. Regulatory Guide 1.154, "Format and Content of Plant-Specific Pressurized ThermalShock Safety Analysis for Pressurized Water Reactors," U.S. Nuclear RegulatoryCommission, January 1987.
[12]. Code of Federal Regulations, 10 CFR Part 50, Appendix G, "Fracture ToughnessRequirements for Light-Water Nuclear Power Reactors."
[13]. ASME Boiler and Pressure Vessel Code Section III, Appendix G, "Protection AgainstNonductile Failure," 1986 Edition.
142
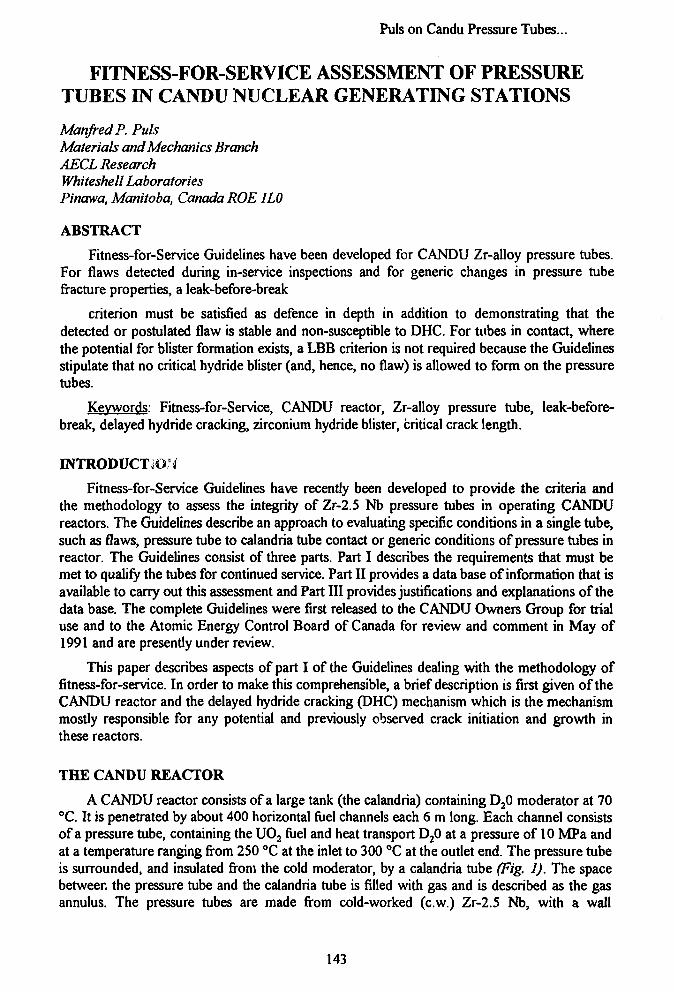
Puls on Candu Pressure Tubes...
FITNESS-FOR-SERVICE ASSESSMENT OF PRESSURETUBES IN CANDU NUCLEAR GENERATING STATIONS
Manfred P. PulsMaterials and Mechanics BranchAECL ResearchWhiteshell LaboratoriesPinawa, Manitoba, Canada ROE 1L0
ABSTRACT
Fitness-for-Service Guidelines have been developed for CANDU Zr-alloy pressure tubes.For flaws detected during in-service inspections and for generic changes in pressure tubefracture properties, a leak-before-break
criterion must be satisfied as defence in depth in addition to demonstrating that thedetected or postulated flaw is stable and non-susceptible to DHC. For tubes in contact, wherethe potential for blister formation exists, a LBB criterion is not required because the Guidelinesstipulate that no critical hydride blister (and, hence, no flaw) is allowed to form on the pressuretubes.
Keywords: Fitness-for-Service, CANDU reactor, Zr-alloy pressure tube, leak-before-break, delayed hydride cracking, zirconium hydride blister, critical crack length.
INTRODUCTION
Fitness-for-Service Guidelines have recently been developed to provide the criteria andthe methodology to assess the integrity of Zr-2.5 Nb pressure tubes in operating CANDUreactors. The Guidelines describe an approach to evaluating specific conditions in a single tube,such as flaws, pressure tube to calandria tube contact or generic conditions of pressure tubes inreactor. The Guidelines consist of three parts. Part I describes the requirements that must bemet to qualify the tubes for continued service. Part II provides a data base of information that isavailable to carry out this assessment and Part III provides justifications and explanations of thedata base. The complete Guidelines were first released to the CANDU Owners Group for trialuse and to the Atomic Energy Control Board of Canada for review and comment in May of1991 and are presently under review.
This paper describes aspects of part I of the Guidelines dealing with the methodology offitness-for-service. In order to make this comprehensible, a brief description is first given of theCANDU reactor and the delayed hydride cracking (DHC) mechanism which is the mechanismmostly responsible for any potential and previously observed crack initiation and growth inthese reactors.
THE CANDU REACTOR
A CANDU reactor consists of a large tank (the calandria) containing D20 moderator at 70°C. It is penetrated by about 400 horizontal fuel channels each 6 m long. Each channel consistsof a pressure tube, containing the UO2 fuel and heat transport D20 at a pressure of 10 MPa andat a temperature ranging from 250 °C at the inlet to 300 °C at the outlet end. The pressure tubeis surrounded, and insulated from the cold moderator, by a calandria tube (Fig. 1). The spacebetween the pressure tube and the calandria tube is filled with gas and is described as the gasannulus. The pressure tubes are made from cold-worked (c.w.) Zr-2.5 Nb, with a wall
143
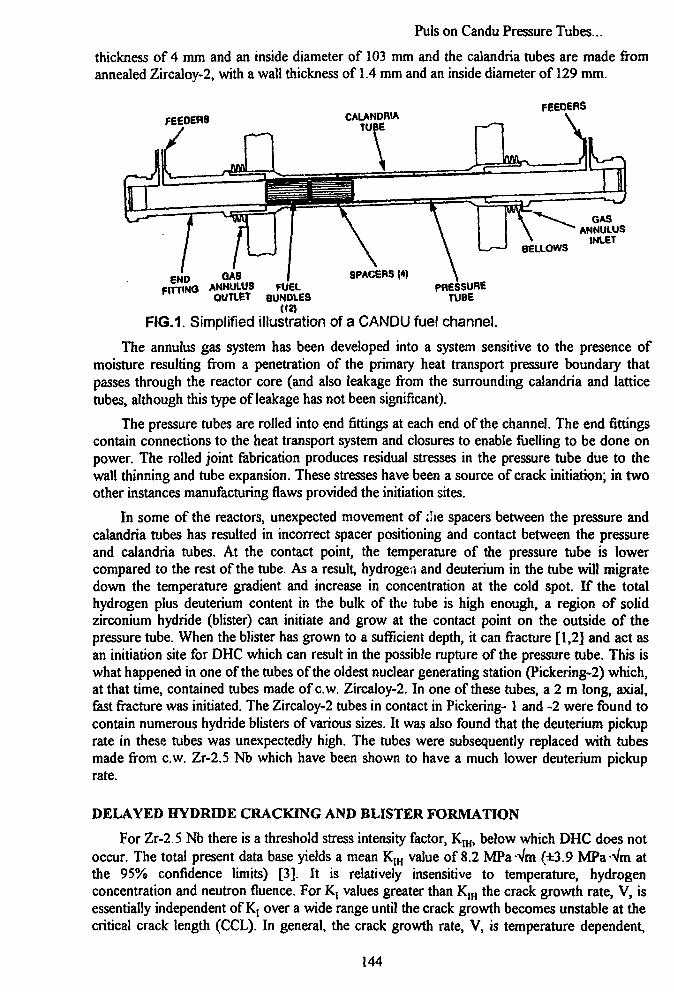
Puls on Candu Pressure Tubes...
thickness of 4 mm and an inside diameter of 103 mm and the calandria tubes are made fromannealed Zircaloy-2, with a wall thickness of 1.4 mm and an inside diameter of 129 mm.
FEEDERS CALANDR1ATUB
FEEOERS
BELLOWS
GASANNULUS
INLET
ENDFITTING
SPACERS {*)FUEL
BUNDLES(12)
FIG.1. Simplified illustration of a CANDU fuel channel.
GASANNULUSOUTLET
PRESSURETUBE
The annulus gas system has been developed into a system sensitive to the presence ofmoisture resulting from a penetration of the primary heat transport pressure boundary thatpasses through the reactor core (and also leakage from the surrounding calandria and latticetubes, although this type of leakage has not been significant).
The pressure tubes are rolled into end fittings at each end of the channel. The end fittingscontain connections to the heat transport system and closures to enable fuelling to be done onpower. The rolled joint fabrication produces residual stresses in the pressure tube due to thewall thinning and tube expansion. These stresses have been a source of crack initiation; in twoother instances manufacturing flaws provided the initiation sites.
In some of the reactors, unexpected movement of ;!»e spacers between the pressure andcalandria tubes has resulted in incorrect spacer positioning and contact between the pressureand calandria tubes. At the contact point, the temperature of the pressure tube is lowercompared to the rest of the tube. As a result, hydrogen and deuterium in the tube will migratedown the temperature gradient and increase in concentration at the cold spot. If the totalhydrogen plus deuterium content in the bulk of the tube is high enough, a region of solidzirconium hydride (blister) can initiate and grow at the contact point on the outside of thepressure tube. When the blister has grown to a sufficient depth, it can fracture [1,2] and act asan initiation site for DHC which can result in the possible rupture of the pressure tube. This iswhat happened in one of the tubes of the oldest nuclear generating station (Pickering-2) which,at that time, contained tubes made of c.w. Zircaloy-2. In one of these tubes, a 2 m long, axial,fast fracture was initiated. The Zircaloy-2 tubes in contact in Pickering- 1 and -2 were found tocontain numerous hydride blisters of various sizes. It was also found that the deuterium pickuprate in these tubes was unexpectedly high. The tubes were subsequently replaced with tubesmade from c.w. Zr-2.5 Nb which have been shown to have a much lower deuterium pickuprate.
DELAYED HYDRIDE CRACKING AND BLISTER FORMATION
For Zr-2.5 Nb there is a threshold stress intensity factor, KIH, below which DHC does notoccur. The total present data base yields a mean K,H value of 8.2 MPaVm (±3.9 MPaVm atthe 95% confidence limits) [3]. It is relatively insensitive to temperature, hydrogenconcentration and neutron fluence. For Kj values greater than K,H the crack growth rate, V, isessentially independent of K, over a wide range until the crack growth becomes unstable at thecritical crack length (CCL). In general, the crack growth rate, V, is temperature dependent,
144
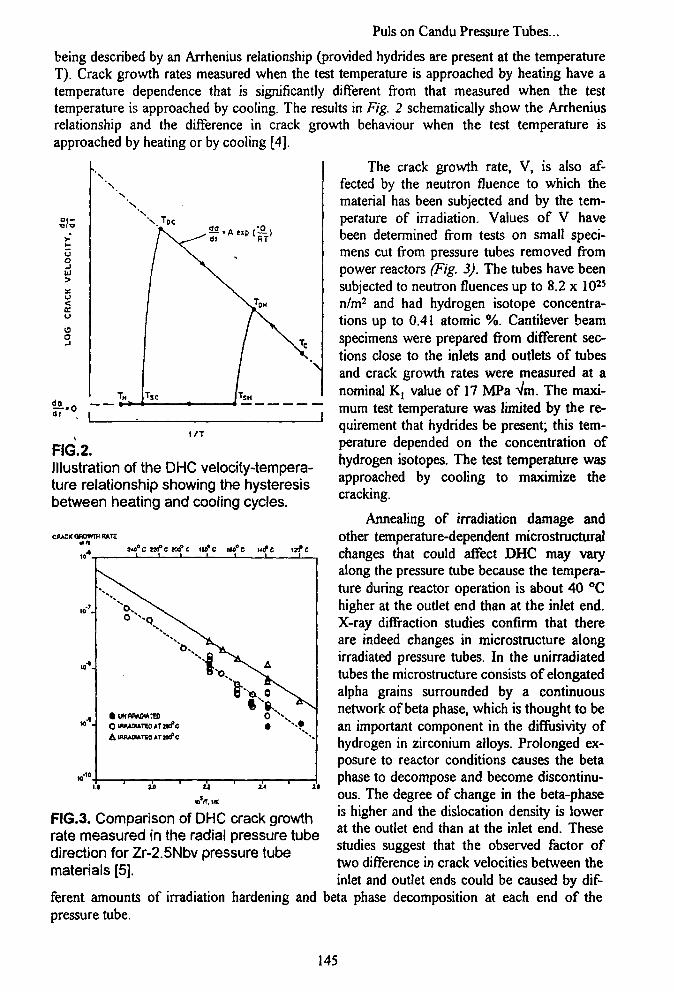
Puls on Candu Pressure Tubes...
VE
LO
C
<uoo_l
dl II /T
being described by an Arrhenius relationship (provided hydrides are present at the temperatureT). Crack growth rates measured when the test temperature is approached by heating have atemperature dependence that is significantly different from that measured when the testtemperature is approached by cooling. The results in Fig. 2 schematically show the Arrheniusrelationship and the difference in crack growth behaviour when the test temperature isapproached by heating or by cooling [4].
The crack growth rate, V, is also af-fected by the neutron fluence to which thematerial has been subjected and by the tem-perature of irradiation. Values of V havebeen determined from tests on small speci-mens cut from pressure tubes removed frompower reactors (Fig. 3). The tubes have beensubjected to neutron fluences up to 8.2 x 10²S
n/m2 and had hydrogen isotope concentra-tions up to 0.41 atomic %. Cantilever beamspecimens were prepared from different sec-tions close to the inlets and outlets of tubesand crack growth rates were measured at anominal Kt value of 17 MPa Vm. The maxi-mum test temperature was limited by the re-quirement that hydrides be present; this tem-perature depended on the concentration ofhydrogen isotopes. The test temperature wasapproached by cooling to maximize thecracking.
Annealing of irradiation damage andother temperature-dependent microstructuralchanges that could affect DHC may varyalong the pressure tube because the tempera-ture during reactor operation is about 40 °Chigher at the outlet end than at the inlet end.X-ray diffraction studies confirm that thereare indeed changes in microstructure alongirradiated pressure tubes. In the unirradiatedtubes the microstructure consists of elongatedalpha grains surrounded by a continuousnetwork of beta phase, which is thought to bean important component in the diffusivity ofhydrogen in zirconium alloys. Prolonged ex-posure to reactor conditions causes the betaphase to decompose and become discontinu-ous. The degree of change in the beta-phaseis higher and the dislocation density is lowerat the outlet end than at the inlet end. Thesestudies suggest that the observed factor oftwo difference in crack velocities between theinlet and outlet ends could be caused by dif-
FIG.2.Illustration of the DHC velocity-tempera-ture relationship showing the hysteresisbetween heating and cooling cycles.
COACKOnOWTHHATH
iio'e i«cc wfc irfc
• UHIRRMWCH)
0 UVUOATIO Ktvfc
A IflBAOIATfO AT TStf C
»'/T, I/K
FIG.3. Comparison of DHC crack growthrate measured in the radial pressure tubedirection for Zr-2.5Nbv pressure tubematerials [5],
ferent amounts of irradiation hardening and beta phase decomposition at each end of thepressure tube.
145
Puls on Candu Pressure Tubes...
After the pressure tube rupture in 1983 of a Zircaloy-2 pressure tube in Pickering-2, anextensive experimental and theoretical program was launched to determine, for tubes incontact, the conditions for blister formation and subsequent crack initiation and propagation.The results of the study on crack initiation from blisters have shown that there is a roughlylinear relationship between blister depth and the stress required to fracture it. Thus for a givenapplied stress, there is a critical blister size (depth) at which the blister will fracture and act as apotential DHC initiation site [2].
FITNESS-FOR-SERVICE ASSESSMENT
The overall purpose of the Guidelines is to provide a uniform procedure for the evaluationof pressure tubes having:
1) flaws exceeding limits of Canadian Standards Association CSA N285.4 [6] (bothsharp, crack like and blunt);
2) calandria tube contact (potential for blister formation);3) generic material degradation. The rationale is that a low probability of pressure tube
rupture must be assured.The philosophy of the procedures outlined in the Guidelines are as follows:
a) For the evaluation of pressure lubes containing detected sharp or crack-like flaws,analytical procedures are defined for calculating the amount of sub-critical crackgrowth that could occur during the evaluation period. Acceptance criteria have beendeveloped to ensure that there is adequate protection against failure by unstablefracture, plastic collapse and delayed hydride cracking. The evaluation period maybe any specified time period such as to the next scheduled inspection or until the endof the design life.
b) For the evaluation of pressure tubes containing blunt flaws, analytical proceduresand acceptance criteria have been developed to ensure that there is adequateprotection against failure by fatigue, plastic collapse and delayed hydride cracking.The evaluation period may be any specified time period such as to the next scheduledinspection or until the end of the design life.
c) For the evaluation of pressure tubes in contact with their calandria tubes, analyticalprocedures and acceptance criteria have been developed to ensure that criticalhydride blisters will not be present in the pressure lubes during the evaluationperiod.
d) For the evaluation of the generic change in fracture properties, analyticalprocedures and acceptance criteria have been developed to ensure that there isadequate protection against unstable fracture. These criteria address two specificconditions. The first condition addressed is the acceptability of the material fractureproperties if hydrides are not present during nominal full power conditions. For thiscondition the changes in the material properties will be primarily due to the fastneutron fluence. The second condition addressed is the acceptability of the materialfracture properties if hydrides are present at nominal fidl power reactor operatingconditions. The effects of increased hydride concentrations and neutron fluence onthe material fracture properties are then considered.
Figs. 4 to 6 summarize the methodology used to evaluate cases a) to c). Development of adifferent evaluation procedure for sharp and blunt flaws was deemed necessary, because themethodology based on assuming all flaws are sharp and using a lowerbound threshold stressintensity factor KIH for DHC initiation, would be too conservative.
146
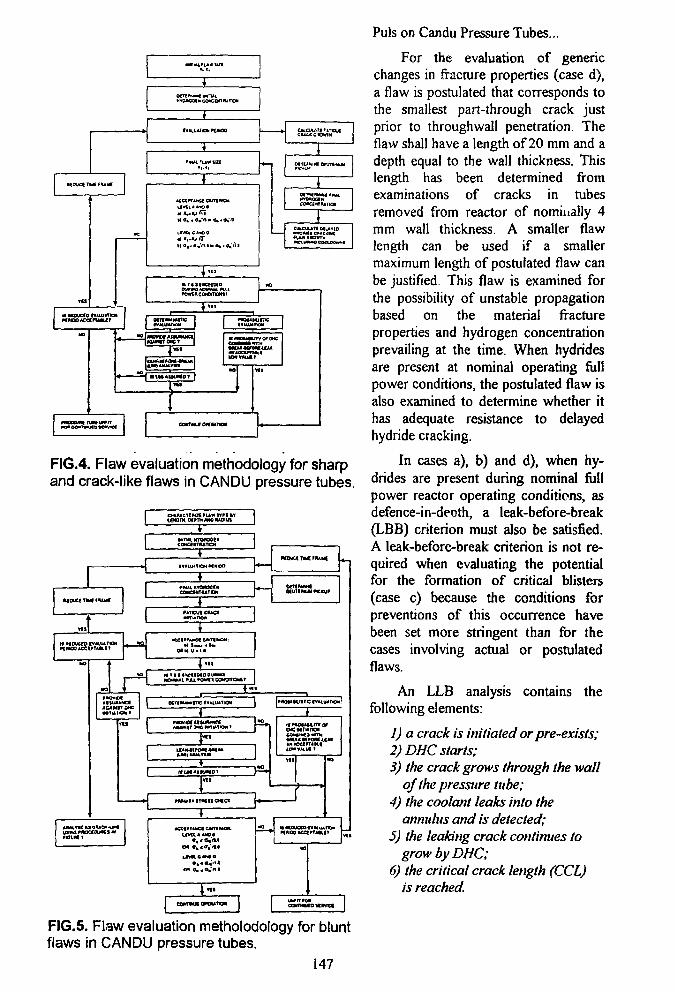
Puls on Candu Pressure Tubes...
FIG.4. Flaw evaluation methodology for sharpand crack-like flaws in CANDU pressure tubes.
UNOIH, Of rm mo MOWI
RCDUCt TB« f WUC
NOWCC T«< PHAUf
IS MOUUD EVJLbtTIn woo »cctf TA«.fr
IL
*CCI»tMC< CMT1MOM.
# , < ft,'**
K wDueco CVHU* roM
CtMTMUCOWMCS JFIG.5. Flaw evaluation metholodology for bluntflaws in CANDU pressure tubes.
147
For the evaluation of genericchanges in fracture properties (case d),a flaw is postulated that corresponds tothe smallest part-through crack justprior to throughwall penetration. Theflaw shall have a length of 20 mm and adepth equal to the wall thickness. Thislength has been determined fromexaminations of cracks in tubesremoved from reactor of nominally 4mm wall thickness. A smaller flawlength can be used if a smallermaximum length of postulated flaw canbe justified. This flaw is examined forthe possibility of unstable propagationbased on the material fractureproperties and hydrogen concentrationprevailing at the time. When hydridesare present at nominal operating foilpower conditions, the postulated flaw isalso examined to determine whether ithas adequate resistance to delayedhydride cracking.
In cases a), b) and d), when hy-drides are present during nominal fullpower reactor operating conditions, asdefence-in-deoth, a Ieak-before-break(LBB) criterion must also be satisfied.A Ieak-before-break criterion is not re-quired when evaluating the potentialfor the formation of critical blisters(case c) because the conditions forpreventions of this occurrence havebeen set more stringent than for thecases involving actual or postulatedflaws.
An LLB analysis contains thefollowing elements:
J) a crack is initiated or pre-exists;2) DHC starts;3) the crack grows through the wall
of the pressure tube;4) the coolant leaks into the
annulus and is detected;5) the leaking crack continues to
grow by DHC;6) the critical crack length (CCL)
is reached.
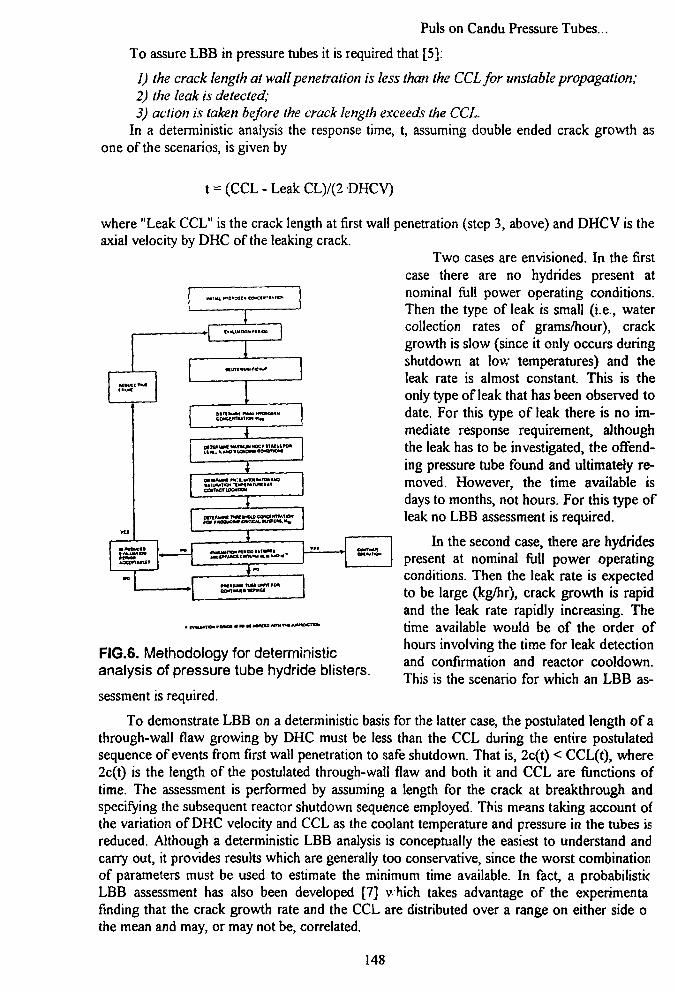
Puls on Candu Pressure Tubes...
To assure LBB in pressure tubes it is required that [5]:
1) the crack length at wall penetration is less than the CCL for unstable propagation;2) the leak is detected;3) action is taken before the crack length exceeds the CCL.
In a deterministic analysis the response time, t, assuming double ended crack growth asone of the scenarios, is given by
t = (CCL - Leak CL)/(2 DHCV)
where "Leak CCL" is the crack length at first wall penetration (step 3, above) and DHCV is theaxial velocity by DHC of the leaking crack.
Two cases are envisioned. In the firstcase there are no hydrides present atnominal full power operating conditions.Then the type of leak is small (i.e., watercollection rates of grams/hour), crackgrowth is slow (since it only occurs duringshutdown at low temperatures) and theleak rate is almost constant. This is theonly type of leak that has been observed todate. For this type of leak there is no im-mediate response requirement, althoughthe leak has to be investigated, the offend-ing pressure tube found and ultimately re-moved. However, the time available isdays to months, not hours. For this type ofleak no LBB assessment is required.
In the second case, there are hydridespresent at nominal full power operatingconditions. Then the leak rate is expectedto be large (kg/hr), crack growth is rapidand the leak rate rapidly increasing. Thetime available would be of the order ofhours involving the time for leak detectionand confirmation and reactor cooldown.This is the scenario for which an LBB as-
MftUCtituC
m
WACO
ftMftCCt*
•o
(T1M«
i
+DC If *UM WI1UU «CP ITMM W»[*•». « M I U M O M COOTIOM
IJ U I W I VHTLHODiMnM »M0
CfMTlCnOCAnON
*
1 . 1Wll1 ^ • •'
.
1 -
***
• IMUITDI rtnoa « n
FIG.6. Methodology for deterministicanalysis of pressure tube hydride blisters.
sessment is required.
To demonstrate LBB on a deterministic basis for the latter case, the postulated length of athrough-wall flaw growing by DHC must be less than the CCL during the entire postulatedsequence of events from first wall penetration to safe shutdown. That is, 2c(t) < CCL(t), where2c(t) is the length of the postulated through-wall flaw and both it and CCL are functions oftime. The assessment is performed by assuming a length for the crack at breakthrough andspecifying the subsequent reactor shutdown sequence employed. This means taking account ofthe variation of DHC velocity and CCL as the coolant temperature and pressure in the tubes isreduced. Although a deterministic LBB analysis is conceptually the easiest to understand andcarry out, it provides results which are generally too conservative, since the worst combinationof parameters must be used to estimate the minimum time available. In fact, a probabilisticLBB assessment has also been developed [7] v hich takes advantage of the experimentafinding that the crack growth rate and the CCL are distributed over a range on either side othe mean and may, or may not be, correlated.
148
Puls on Candu Pressure Tubes...
CONCLUSIONS
A methodology based on assessing crack initiation and growth behaviour, combined withthe ability to detect a leaking crack, has been developed for Zr-alloy pressure tubes in CANDUreactors and is available for trial use by operators of CANDU nuclear generating stations. Themethodology is contained in the Fitness-for-Service Guidelines which consists of three parts.Part I describes the requirements that must be met to qualify the tubes for continued service.Part II provides a data base of information that is available to carry out this assessment and PartIII provides justifications and explanations of the data base. The complete Guidelines arecurrently under review by the Atomic Energy Control Board of Canada.
ACKNOWLEDGEMENTS
The results presented here have been developed over a number of years by a large numberof workers at AECL Research, AECL-CANDU and Ontario Hydro and funded under CANDUOwners Group through Working Parties 22 and 31 in the Fuel Channel Program.
REFERENCES
[1] Puls, M. P. (1988): "Determination of Fracture Initiation in Hydride Blisters usingAcoustic Emission", Metall. Trans. A, Vol. 19A, pp. 2247-2257.
[2] Leger, M., Moan, G. D., Wallace, A. C. and Watson, J. J. (1989): "Growth, Fractureand Non-Destructive Evaluation of Hydride Blisters in Zr-2.5wt%Nb PressureTubes", Zirconium in the Nuclear Industry: Eighth International Symposium, ASTMSTP 1023, pp. 50-65.
[3] Puls, M. P., Sagat, S., Rodgers, D. K., Scarth, D. A. and Lee, W. K. (1992):"Initiation of Delayed Hydride Cracking in Pressure Tubes: Review of Progress andPrograms", Atomic Energy of Canada Limited Report, COG-91-259.
[4] Puls, M. P. (1989): "On the Consequences of Hydrogen Supersaturation Effects inZr-Alloys to Hydrogen Ingress and Delayed Hydride Cracking", J. of Nucl. Mat., Vol.165, pp. 128-141.
[5] Moan, G. D., Coleman, C. E., Price, E.G., Rodgers, D. K. and Sagat, S. (1990):"Leak-Before-Break in the Pressure Tubes of CANDU Reactors" Int. J. Pres. Ves.and Piping, Vol. 43, pp. 1-21.
[6]. Canadian Standard Association CAN3-N285.4-M83 (1983): "Periodic Inspection ofCANDU Nuclear Power Plant Components".
[7] Walker, J. R. (1990): "A Probabilistic Approach to Leak-Before-Break in CANDUPressure Tubes", Int. J. Pres. Ves. and Piping, Vol. 43, p. 229-239.
149
Briceno; Hernandez; and Marin on Steam Generator Tube Degradation
SPANISH RESEARCH ACTIVITIES ON STEAMGENERATOR TUBE DEGRADATION
D. Gomez Briceno* A.M3-. Lancha Hernandez* MQ-.L. xCastano Marin**CIEMAT, 28040MADRID, Av. COMPLUTENSE-22, SPAIN
ABSTRACT
Inconel 600 MA steam generator tubes have undergone s severe degradation in Spanishnuclear power plants during the last years. This degradation can have important implicationsfor the availability of the plant. This paper presents the activities of the Spanish Research andDevelopment Project on Steam generators relating to steam generator tubing materialsdegradation. These activities are carried out in two complementary forms. On the one hand,the behaviour of Inconel 600 MA, Inconel 690 TT and Incoloy 800 has been studied underprimary and secondary simulated conditions, and on the other hand, the destructiveexamination of steam generators tubes from commercial plants was carried out.
Keywords: Steam generators; Tubing materials; Nickel alloys; Stress corrosion cracking;Tube examination.
1. INTRODUCTION
Inconel 600 MA steam generator tubes have undergone a severe degradation in Spanishnuclear power plants during the last years. This degradation can have important implicationsfor the plant availability. New defect types, such as OD and ID circumferential cracks, havebeen found and also, new secondary environment, non alkaline environments, have begun tobe considered.
Furthermore, the effect of boric acid as an inhibitor of intergranular attack (IGA) andintergranular stress corrosion cracking of alloy 600 is not clear.
This paper presents the activities of the Spanish Research and Development Project onSteam generators related to the steam generator tubing materials degradation. These activitiesare carried out in two complementary forms. On the one hand, the behaviour of Inconel 600MA, Inconel 690 TT and Incoloy 800 has been studied under primary and secondary simulatedconditions and the other hand, the destructive examination of steam generators tubes fromcomercial plants was carried out.
2. SCOPE
This experimental work aims to obtain a better understanding of the behaviour of Inconel600 MA steam generator, tubing and other nickel alloys such as Inconel 690 TT and Incoloy800.
The effects of changes in primary water chemistry on the primary water stress corrosioncracking (PWSCC) of steam generator tube materials have been studied.
Comparative tests of Inconel 690 TT and Incoloy 800 are being carried out in caustic oracidic environments with S, Pb and Cu. Furthermore, steam generator tubes from Spanishnuclear power plant have been examined destructively.
150
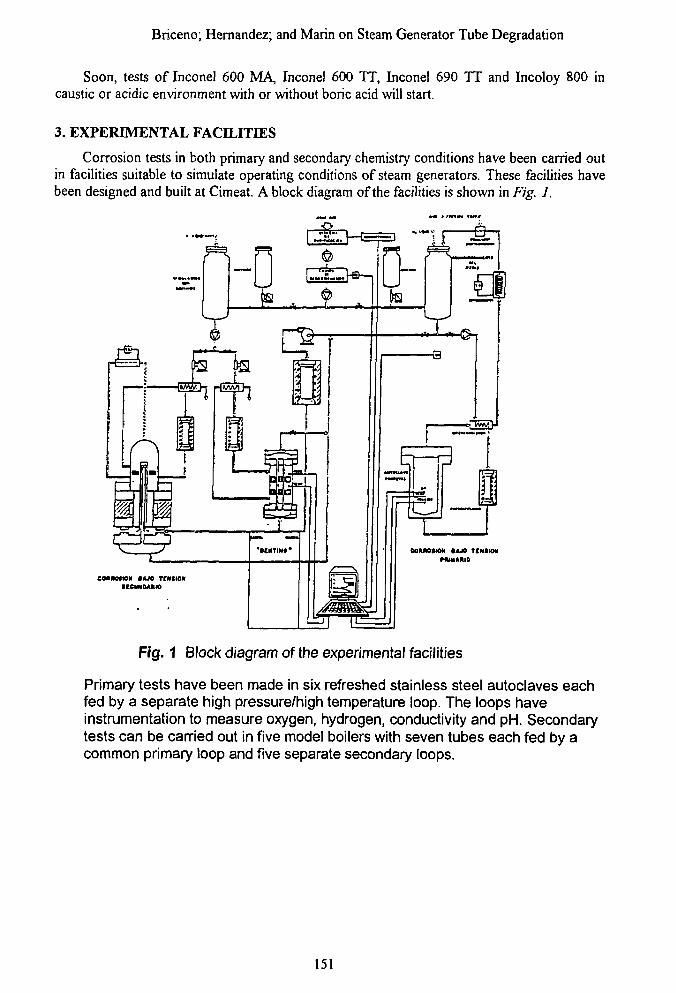
Briceno; Hernandez; and Marin on Steam Generator Tube Degradation
Soon, tests of Inconel 600 MA, Inconel 600 TT, Inconel 690 TT and Incoloy 800 incaustic or acidic environment with or without boric acid will start.
3. EXPERIMENTAL FACILITIES
Corrosion tests in both primary and secondary chemistry conditions have been carried outin facilities suitable to simulate operating conditions of steam generators. These facilities havebeen designed and built at Cimeat. A block diagram of the facilities is shown in Fig. 1.
C0HKM10K »AJ0 TCMHM| [ C W M I »
Fig. 1 Block diagram of the experimental facilities
Primary tests have been made in six refreshed stainless steel autoclaves eachfed by a separate high pressure/high temperature loop. The loops haveinstrumentation to measure oxygen, hydrogen, conductivity and pH. Secondarytests can be carried out in five model boilers with seven tubes each fed by acommon primary loop and five separate secondary loops.
151
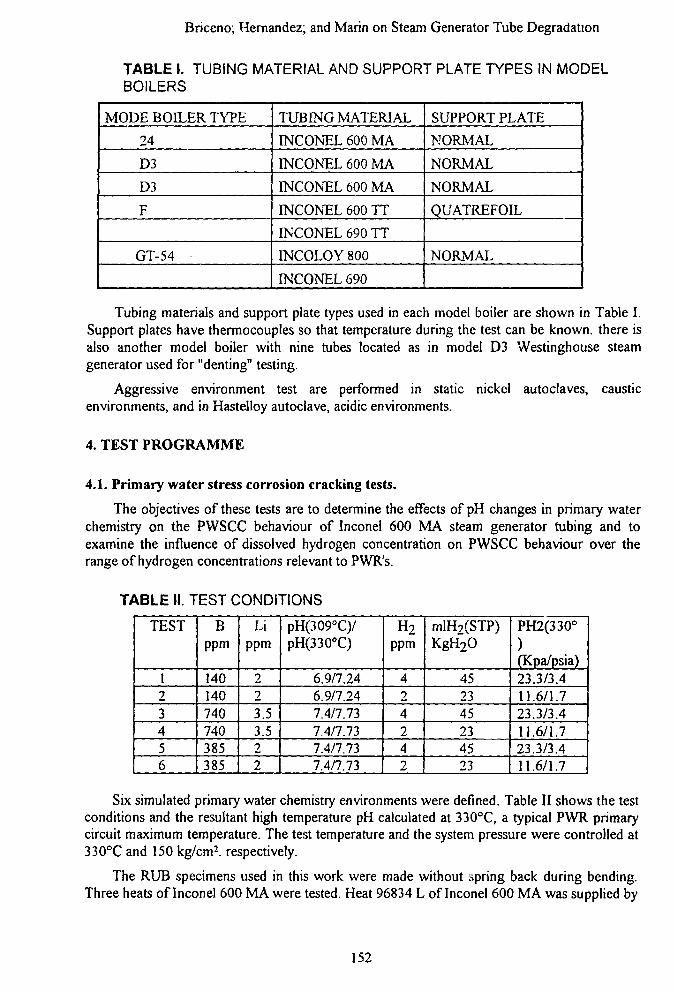
Briceno; Hernandez; and Marin on Steam Generator Tube Degradation
TABLE I. TUBING MATERIAL AND SUPPORT PLATE TYPES IN MODELBOILERS
MODE BOILER TYPE
24
D3
D3
F
GT-54
TUBING MATERIAL
INCONEL 600 MA
INCONEL 600 MA
INCONEL 600 MA
INCONEL 600 TT
INCONEL 690 TT
INCOLOY 800
INCONEL 690
SUPPORT PLATE
NORMAL
NORMAL
NORMAL
QUATREFOIL
NORMAL
Tubing materials and support plate types used in each model boiler are shown in Table I.Support plates have thermocouples so that temperature during the test can be known, there isalso another model boiler with nine tubes located as in model D3 Westinghouse steamgenerator used for "denting" testing.
Aggressive environment test are performed in static nickel autoclaves, causticenvironments, and in Hastelloy autoclave, acidic environments.
4. TEST PROGRAMME
4.1. Primary water stress corrosion cracking tests.
The objectives of these tests are to determine the effects of pH changes in primary waterchemistry on the PWSCC behaviour of Inconel 600 MA steam generator tubing and toexamine the influence of dissolved hydrogen concentration on PWSCC behaviour over therange of hydrogen concentrations relevant to PWR's.
TABLE II. TEST CONDITIONS
TEST
123456
Bppm
140140740740385385
Lippm
223.53.522
pH(309°C)/pH(330°C)
6.9/7.246.9/7.247.4/7.737.4/7.737.4/7.737.4/7.73
H2ppm
424242
mlH2(STP)KgH2O
452345234523
PH2(330°)(Kpa/psia)23.3/3.411.6/1.723.3/3.411.6/1.723.3/3.411.6/1.7
Six simulated primary water chemistry environments were defined. Table II shows the testconditions and the resultant high temperature pH calculated at 33O°C, a typical PWR primarycircuit maximum temperature. The test temperature and the system pressure were controlled at33O°C and 150 kg/cm2, respectively.
The RUB specimens used in this work were made without spring back during bending.Three heats of Inconel 600 MA were tested. Heat 96834 L of Inconel 600 MA was supplied by
152
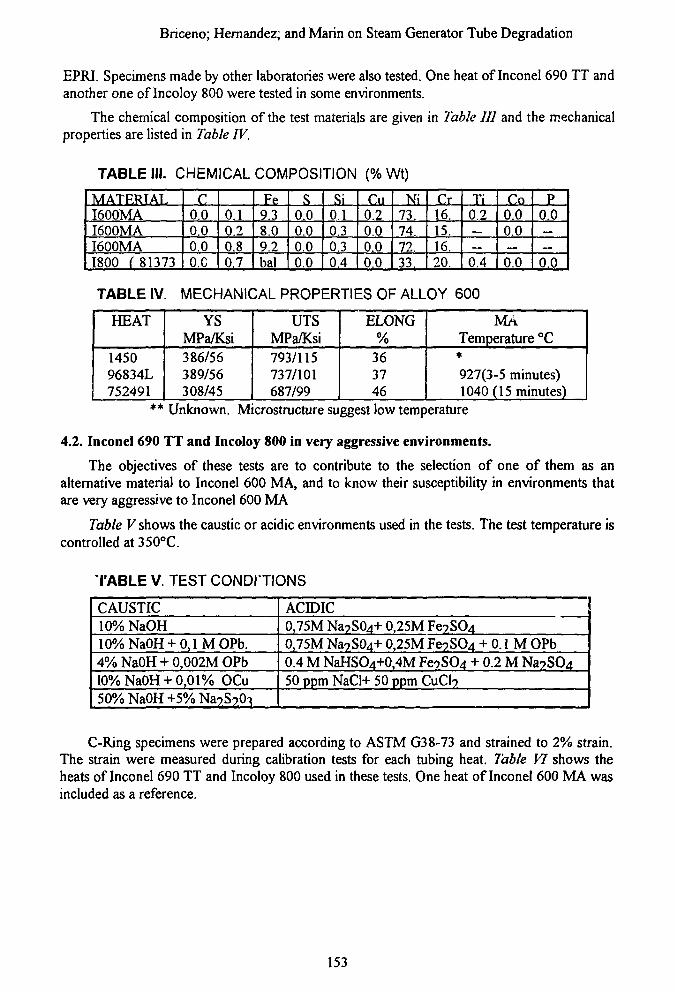
Briceno; Hernandez; and Marin on Steam Generator Tube Degradation
EPRI. Specimens made by other laboratories were also tested. One heat of Inconel 690 TT andanother one of Incoloy 800 were tested in some environments.
The chemical composition of the test materials are given in Table III and the mechanicalproperties are listed in Table IV.
TABLE III CHEMICAL
MATRRTALI600MAI600MAI600MA1800 { 81373
c0 00.00.0
o.c
010.20.80.7
COMPOSITION
Fe9.38.09.2bal
s000.00.00.0
Si010.30.30.4
(% Wt)
CM0.20.00.00.0
Ni7374.72.33.
Cr16.15.16.20.
Ti0 2—
0.4
Co0 00.0—0.0
p0 0——0.0
TABLE IV. MECHANICAL PROPERTIES OF ALLOY 600
HEAT
145096834L752491
YSMPa/Ksi386/56389/56308/45
UTSMPa/Ksi793/115737/101687/99
ELONG%
363746
MATemperature °C
927(3-5 minutes)1040 (15 minutes)
** Unknown. Microstructure suggest low temperature
4.2. Inconel 690 TT and Incoloy 800 in very aggressive environments.
The objectives of these tests are to contribute to the selection of one of them as analternative material to Inconel 600 MA, and to know their susceptibility in environments thatare very aggressive to Inconel 600 MA
Table V shows the caustic or acidic environments used in the tests. The test temperature iscontrolled at 350°C.
TABLE V. TEST CONDITIONS
CAUSTIC10% NaOH10%Na0H + 0,lMOPb.4%NaOH + 0,002MOPb10% NaOH + 0,01% OCu50% NaOH +5% Na?S?0^
ACIDIC0,75M Na?S04+ 0,25M Fe?SO4
0,75M Na?S04+ 0,25M Fe?SO4 + 0.1 M OPb0.4 M NaHSO4+0,4M Fe?SO4 + 0.2 M Na?S04
50 ppm NaCl+ 50 ppm CuCI?
C-Ring specimens were prepared according to ASTM G38-73 and strained to 2% strain.The strain were measured during calibration tests for each tubing heat. Table VI shows theheats of Inconel 690 TT and Incoloy 800 used in these tests. One heat of Inconel 600 MA wasincluded as a reference.
153
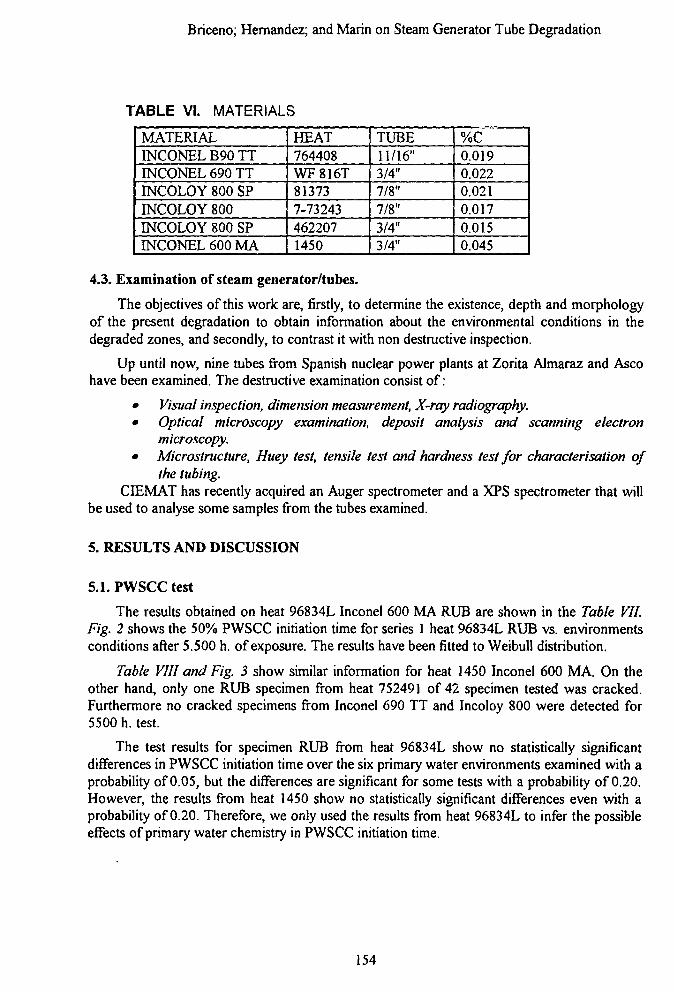
Briceno; Hernandez; and Marin on Steam Generator Tube Degradation
TABLE VI. MATERIALS
MATERIALINCONEL B90 TTINCONEL 690 TTINCOLOY 800 SPINCOLOY 800INCOLOY 800 SPINCONEL 600 MA
HEAT764408WF816T813737-732434622071450
TUBE11/16"3/4"7/8"7/8"3/4"3/4"
%C0.0190.0220.0210.0170.0150.045
4.3, Examination of steam generator/tubes.
The objectives of this work are, firstly, to determine the existence, depth and morphologyof the present degradation to obtain information about the environmental conditions in thedegraded zones, and secondly, to contrast it with non destructive inspection.
Up until now, nine tubes from Spanish nuclear power plants at Zorita Almaraz and Ascohave been examined. The destructive examination consist of:
• Visual inspection, dimension measurement, X-ray radiography.• Optical microscopy examination, deposit analysis and scanning electron
microscopy.• Microstructure, Huey test, tensile test and hardness test for characterisation of
the tubing.CIEMAT has recently acquired an Auger spectrometer and a XPS spectrometer that will
be used to analyse some samples from the tubes examined.
5. RESULTS AND DISCUSSION
5.1. PWSCC test
The results obtained on heat 96834L Inconel 600 MA RUB are shown in the Table VII.Fig. 2 shows the 50% PWSCC initiation time for series 1 heat 96834L RUB vs. environmentsconditions after 5.500 h. of exposure. The results have been fitted to Weibull distribution.
Table VIII and Fig. 3 show similar information for heat 1450 Inconel 600 MA. On theother hand, only one RUB specimen from heat 752491 of 42 specimen tested was cracked.Furthermore no cracked specimens from Inconel 690 TT and Incoloy 800 were detected for5500 h. test.
The test results for specimen RUB from heat 96834L show no statistically significantdifferences in PWSCC initiation time over the six primary water environments examined with aprobability of 0.05, but the differences are significant for some tests with a probability of 0.20.However, the results from heat 1450 show no statistically significant differences even with aprobability of 0.20. Therefore, we only used the results from heat 96834L to infer the possibleeffects of primary water chemistry in PWSCC initiation time.
154
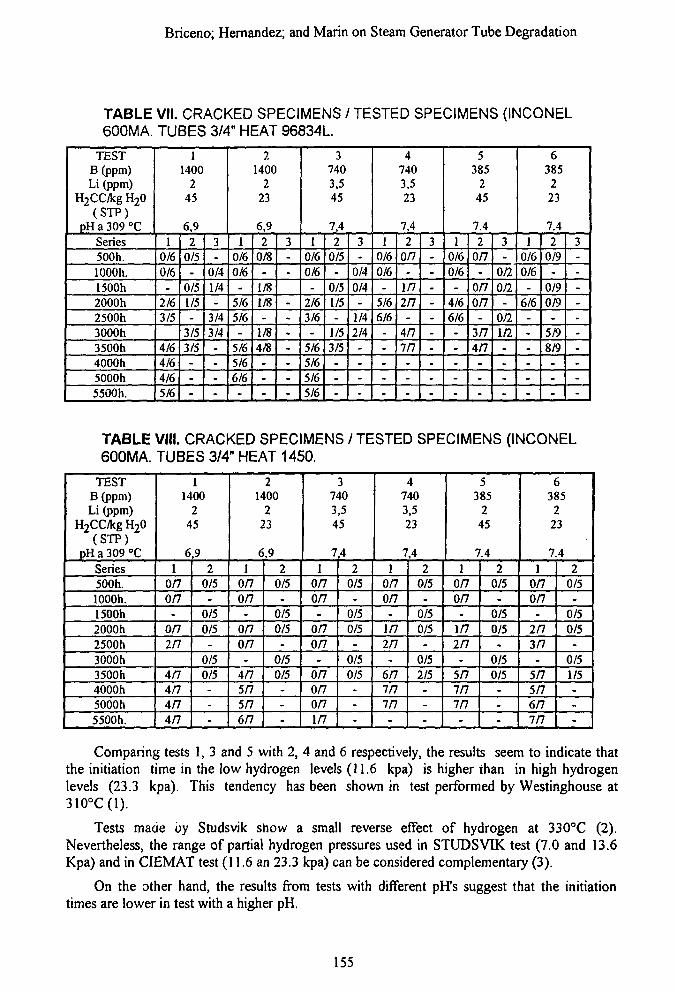
Briceno; Hernandez; and Marin on Steam Generator Tube Degradation
TABLE VII. CRACKED SPECIMENS / TESTED SPECIMENS (INCONEL600MA. TUBES 3/4" HEAT 96834L.
TESTB(ppm)Li (ppm)
H2CC/kg H20(STP)
pH a 309 °CSeries500h.lOOOh.1500h2000h2500h3000h3500h4000h5000h5500h.
11400
245
6,91
0/60/6
-2/63/5
4/64/64/65/6
20/5-
0/51/5-
3/53/5---
3-
0/41/4-
3/43/4----
21400
223
6,91
0/60/6-
5/65/6-
5/65/66/6-
20/8-
1/81/8-
1/84/8---
3--
--
--•-
37403,545
7,41
0/60/6-
2/63/6-
5/65/65/65/6
20/5•
0/51/5-
1/53/5
3-
0/40/4-
1/42/4-
47403,523
7,41
0/60/6-
5/66/6
--
20/7-
1/72/7-
4/77/7
3-------
5385
245
7.41
0/60/6-
4/66/6--
20/7-
0/70/7-
3/74/7
3-
0/20/2
-0/21/2-
6385
223
7.41
0/60/6-
6/6---
20/9
-0/90/9
-5/98/9
3-------
TABLE VIII. CRACKED SPECIMENS/TESTED SPECIMENS (INCONEL600MA. TUBES 3/4" HEAT 1450.
TESTB(ppm)Li (ppm)
H2CC/kg H20(STP)
pH a 309 °CSeries500h.lOOOh.1500h2000h2500h3000h3500h4000h5000h5500h.
11400
245
6,91
0/70/7
-0/7
in
4/74/74/74/7
20/5-
0/50/5
-
0/50/5---
21400
223
6,91
0/70/7
-0/70/7-
4/75/75/76/7
20/5•
0/50/5-
0/50/5---
37403,545
7,41
0/70/7
-0/70/7-
0/70/70/71/7
20/5-
0/50/5
-0/50/5---
47403,523
7,41
0/70/7•
1/72/7-
en7/77/7-
20/5
-0/50/5-
0/52/5
•
-
-
5385
245
7.41
0/70/7-
1/7
in-
5/77/77/7-
20/5-
0/50/5.
0/50/5
--
6385223
7.41
0/70/7
-2/73/7-
5/75/76/77/7
20/5-
0/50/5-
0/51/5---
Comparing tests 1, 3 and 5 with 2, 4 and 6 respectively, the results seem to indicate thatthe initiation time in the low hydrogen levels (11.6 kpa) is higher than in high hydrogenlevels (23.3 kpa). This tendency has been shown in test performed by Westinghouse at
Tests made oy Studsvik show a small reverse effect of hydrogen at 33O°C (2).Nevertheless, the range of partial hydrogen pressures used in STUDSVIK test (7.0 and 13.6Kpa) and in CIEMAT test (11.6 an 23.3 kpa) can be considered complementary (3).
On the other hand, the results from tests with different pH"s suggest that the initiationtimes are lower in test with a higher pH.
155
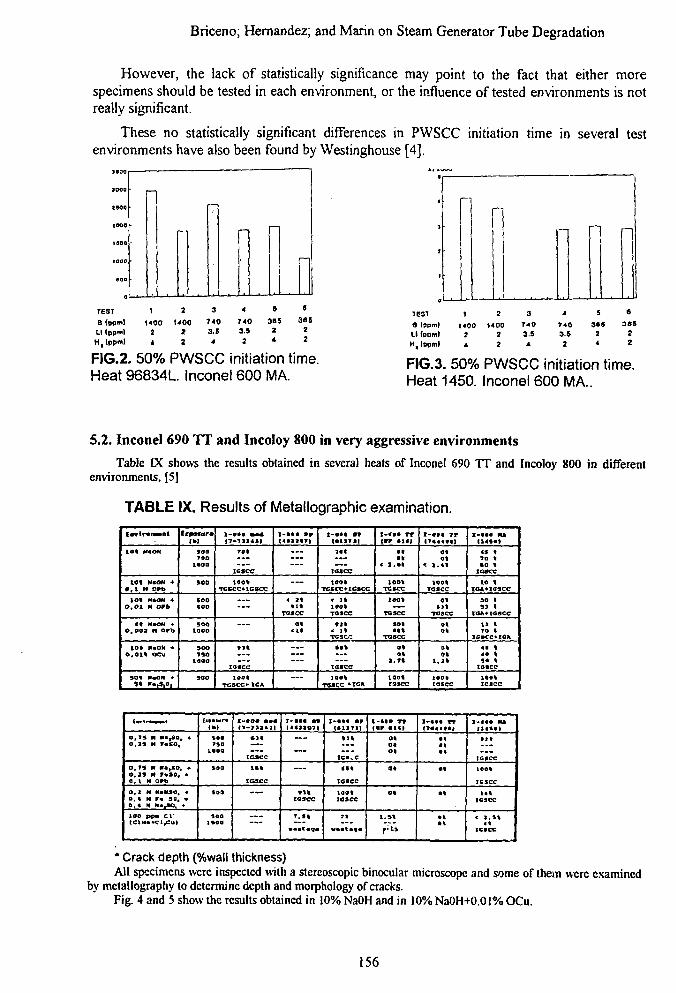
Briceno; Hernandez; and Marin on Steam Generator Tube Degradation
However, the lack of statistically significance may point to the fact that either morespecimens should be tested in each environment, or the influence of tested environments is notreally significant.
These no statistically significant differences in PWSCC initiation time in several testenvironments have also been found by Westinghouse [4].
1100
3000
1300
1OQQ
1500
1000
etsa
- • r —r~
TEST
B (ppm)
LI (ppmlH,(ppm)
1
14002I
2
uoo2
2
3
7 4 0
3.$4
4
7 4 03.9
2
S
30524
8
3as22
FIG.2. 50% PWSCC initiation time.Heat 96834L Inconel 600 MA.
—- I ~l - I
TEST
B (ppmlLi fopmlH, (ppml
1
14002
4
2
14002
2
3
7 4 0
a.s4
4
7 4 03.5
2
S
3»S24
6
3 8 5
22
FIG.3. 50% PWSCC initiation time.Heat 1450. Inconel 600 MA..
5.2. Inconel 690 TT and Incoloy 800 in very aggressive environments
Table IX shows the results obtained in several heats of Inconel 690 TT and Incoloy 800 in differentenvironments, [5]
TABLE IX. Results of Metallographic examination.
E*vtr*mn1
tO t M«OH
tOt ¥»Ott +9 , 1 M Opt)
IO* f»OK *O,Ql H OPb
4 t NaOH *
101 M*OH *O.Ql t OOJ
30« i«OH *•9% *•&<*,
Cxpocur*
soo790
soo
too«00
soo
SOOISO
IOOO
soo
TCI
ICSCC
100*TCECCMG9CC
: : :
xo«cc
lootTCACC*- tCA
" I
—
« It*1*
ro*cc<t\
<lt
—
IOSCC
tootTCCCCt-ICftCC
« 3ft190*TOSCC
• I *« It
TG3CG
• •%
xecce10«t
rcacc *tc»
•t«t
< i.»t
100%TC«CC
l o o t
TCSCC
SO*••%
TT3OCC
0%0%
a.M
tootrcscc
0%ot
* 1.41
100*1GSCC
Ot* ) %
TOSCC
Ot0%
okot
loottcscc
* 9 y70 1•a i
iaaec
to 1ICA+tC
30 193 \
ra*+i<
12TO
ictcc
414«1«
toac1 « *TCIC
»cc
BCC
tOK
O.T4 H HBt0Ok 4-O,1S M F*SO,
O, »4 H M«tS0, *o, j » H r*sg, *a , i N orb
0 , 1 H *t»H3Ot *0 , 4 M r « 3 0 , *0 . 4 N H«,SO, •
1OO pp« C l
4»0TSO
SOO
sao
9OO1*00
* 3 t
ICSCC
1««
ICSCC
- —
: : :
—
—
C«3CC
T . S t
lit
ICS.Cii*
IC1CC
tootlascc
? •
0*otot
a t
o t
l*3t
*tt%
« *
• t
• t
• 2%
ICSCC
loot
IC9CC
14tICSCC
< s, * *
ICSCC
* Crack depth (%wall thickness)All specimens were inspected with a stereoscopic binocular microscope and some of thein were examined
by metallography to determine depth and morphology of cracks.Fig. 4 and 5 show the results obtained in 10% NaOH and in 10% NaOH+0.01% OCu.
156
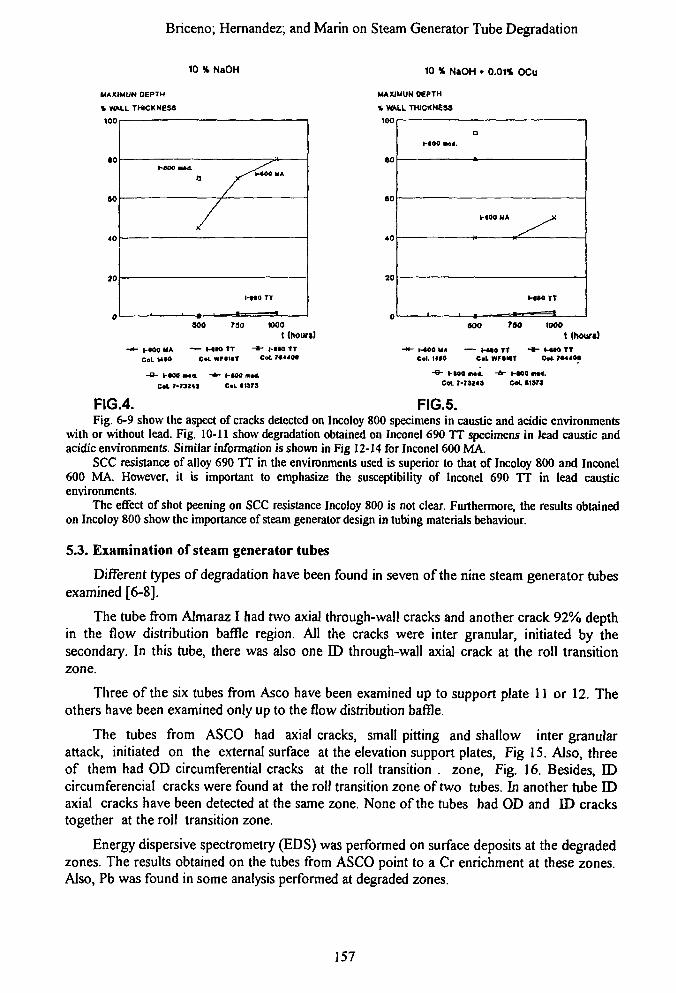
Briceno; Hernandez; and Marin on Steam Generator Tube Degradation
10 % NaOH 10 % NaOH • 0.01% OCu
MAXIMUN DEPTH MAXIMUN DEPTH
% WALL THICKNESS % WM.L THICKNESS
100
•0
to
40
20
0
t-000 • *& ^ ^ ^
/
/
/
i-no TT
• i
lvO
eo
60
4 0
ao
SOO 750 WOO
C (hour*)
-*- MOO MA — M M TT -*" M M TTCoL U»0 CM. KMIlT Col 7«4«»
-9- M0« • •« . - * • 1-tOO « 1C*L 7-T31t> C«L <IS73
ot-<00 met.
H00 MA Jt
MI0TT
i , . . |
SOO TOO 1000
t(hou
-» - 1-400 UA H I D TT - • - M M TTCol. !4tO C.t WFINT CW. 7«440t
-^- IMO «•«. -A- MOO •»«.Cm 7-73143 CaL I1373
FIG.4. FIG.5.Fig. 6-9 show the aspect of cracks detected on Incoloy 800 specimens in caustic and acidic environments
with or without lead. Fig. 10-11 show degradation obtained on Inconel 690 TT specimens in lead caustic andacidic environments. Similar information is shown in Fig 12-14 for Inconel 600 MA.
SCC resistance of alloy 690 TT in the environments used is superior to that of Incoloy 800 and Inconel600 MA. However, it is important to emphasize the susceptibility of Inconel 690 TT in lead causticenvironments.
The effect of shot peening on SCC resistance Incoloy 800 is not clear. Furthermore, the results obtainedon Incoloy 800 show the importance of steam generator design in tubing materials behaviour.
5.3. Examination of steam generator tubes
Different types of degradation have been found in seven of the nine steam generator tubesexamined [6-8].
The tube from Almaraz I had two axial through-wall cracks and another crack 92% depthin the flow distribution baffle region. All the cracks were inter granular, initiated by thesecondary. In this rube, there was also one ID through-wall axial crack at the roll transitionzone.
Three of the six tubes from Asco have been examined up to support plate 11 or 12. Theothers have been examined only up to the flow distribution baffle.
The tubes from ASCO had axial cracks, small pitting and shallow inter granularattack, initiated on the external surface at the elevation support plates, Fig 15. Also, threeof them had OD circumferential cracks at the roll transition . zone, Fig. 16. Besides, IDcircumferencial cracks were found at the roll transition zone of two tubes. In another tube IDaxial cracks have been detected at the same zone. None of the tubes had OD and ID crackstogether at the roll transition zone.
Energy dispersive spectrometry (EDS) was performed on surface deposits at the degradedzones. The results obtained on the tubes from ASCO point to a Cr enrichment at these zones.Also, Pb was found in some analysis performed at degraded zones.
157
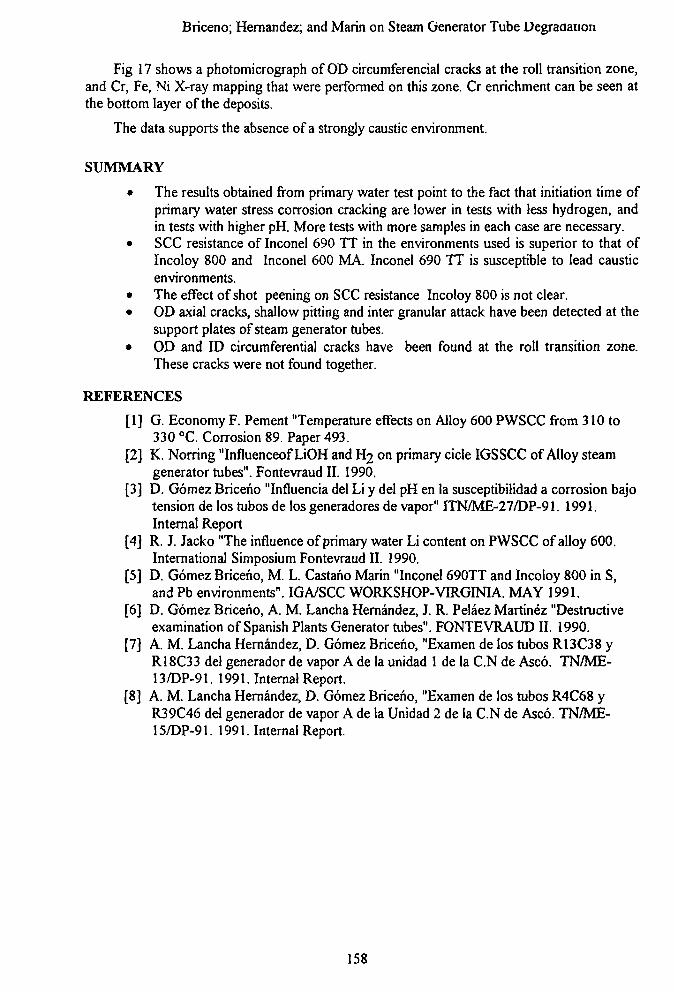
Briceno; Hernandez; and Marin on Steam Generator Tube Degradation
Fig 17 shows a photomicrograph of OD circumferential cracks at the roll transition zone,and Cr, Fe, Ni X-ray mapping that were performed on this zone. Cr enrichment can be seen atthe bottom layer of the deposits.
The data supports the absence of a strongly caustic environment.
SUMMARY
The results obtained from primary water test point to the fact that initiation time ofprimary water stress corrosion cracking are lower in tests with less hydrogen, andin tests with higher pH. More tests with more samples in each case are necessary.SCC resistance of Inconel 690 TT in the environments used is superior to that ofIncoloy 800 and Inconel 600 MA. Inconel 690 TT is susceptible to lead causticenvironments.The effect of shot peening on SCC resistance Incoloy 800 is not clear.OD axial cracks, shallow pitting and inter granular attack have been detected at thesupport plates of steam generator tubes.OD and ED circumferential cracks have been found at the roll transition zone.These cracks were not found together.
REFERENCES
[1] G. Economy F. Pement "Temperature effects on Alloy 600 PWSCC from 310 to330 CC. Corrosion 89. Paper 493.
[2] K. Norring "Influenceof LiOH and H2 on primary cicle IGSSCC of Alloy steamgenerator tubes". Fontevraud II. 1990.
[3] D. Gomez Briceno "Influencia del Li y del pH en la susceptibilidad a corrosion bajotension de los tubos de los generadores de vapor" ITN/ME-27/DP-91. 1991.Internal Report
[4] R. J. Jacko "The influence of primary water Li content on PWSCC of alloy 600.International Simposium Fontevraud II. 1990.
[5] D. Gomez Briceno, M. L. Castano Marin "Inconel 690TT and Incoloy 800 in S,and Pb environments". IGA/SCC WORKSHOP-VIRGINIA. MAY 1991.
[6] D. Gomez Briceno, A. M. Lancha Hernandez, J. R. Pelaez Martinez "Destructiveexamination of Spanish Plants Generator tubes". FONTEVRAUD II. 1990.
[7] A. M. Lancha Hernandez, D. Gomez Briceno, "Examen de los tubos R13C38 yR18C33 del generador de vapor A de la unidad 1 de la C.N de Asco. TN/ME-13/DP-91. 1991. Internal Report.
[8] A. M. Lancha Hernandez, D. Gomez Briceno, "Examen de los tubos R4C68 yR39C46 del generador de vapor A de la Unidad 2 de la C.N de Asco. TN/ME-15/DP-91. 1991. Internal Report.
158
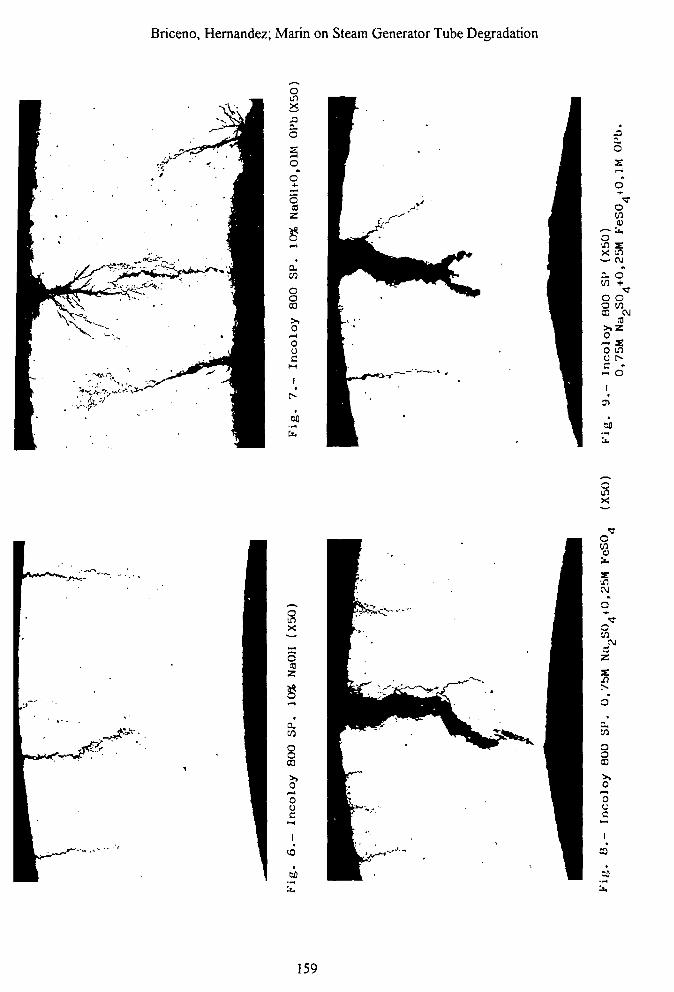
Briceno, Hernandez; Marin on Steam Generator Tube Degradation
so
oo"
oca
z
CO
o
ou
5s
X !fl
— ow +o oo w
10
SIIT)0
uw O
I
ci
5
ooCO
3c
I
S3
159
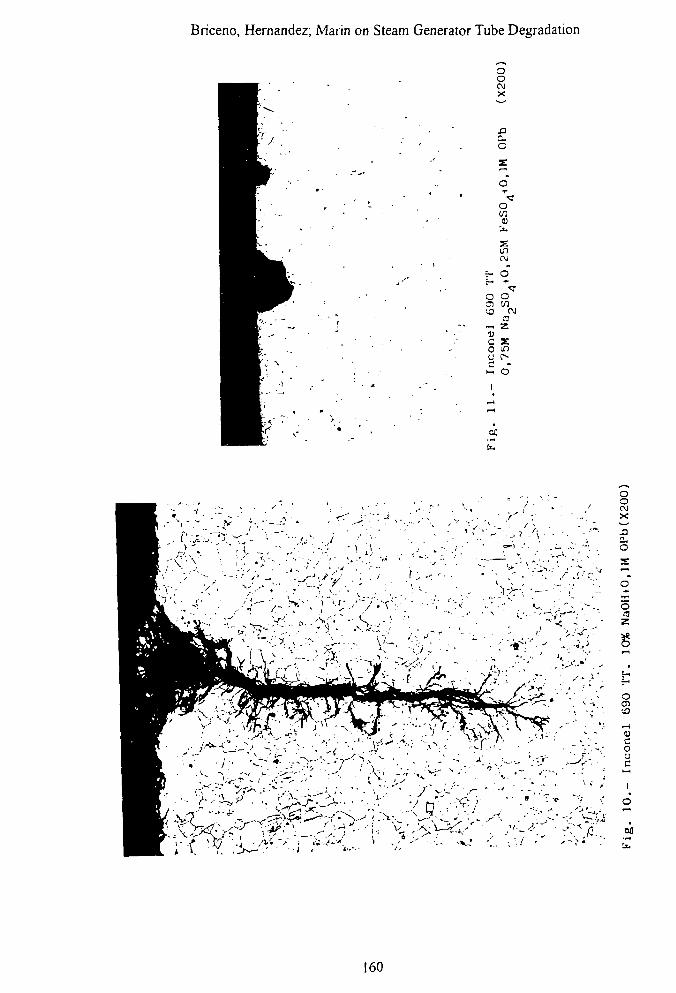
Briceno, Hernandez; Marin on Steam Generator Tube Degradation
ooCMX
S
O
~ O~» -t-
o oen en1 0 CMa—i 2DC £0 ific c»c -i-. O
I
oo
a.o
o
o3
ouc
160
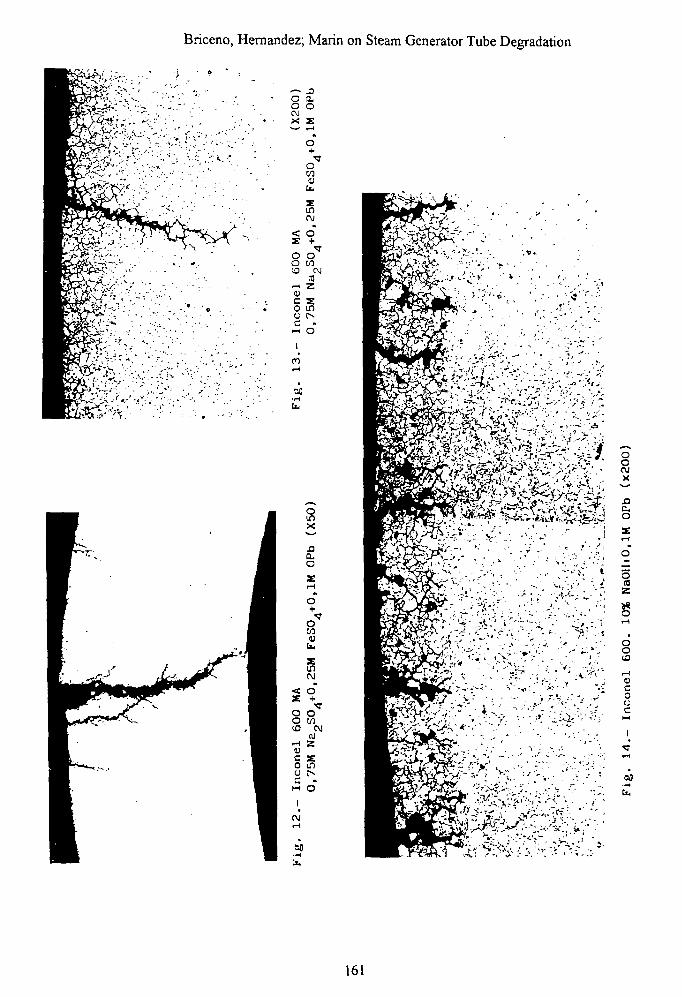
Briceno, Hernandez; Marin on Steam Generator Tube Degradation
• >
o a.o oCM
sCM< O
O Oo en
jrH 2tt)0 lO
d"
ad
sX
a.o
oCO
o ooCM
CJ
-H 2
S3y p»M o"
iCM
ooC\J
O
Z
o0]
oo
0)co
I
Ex.
161
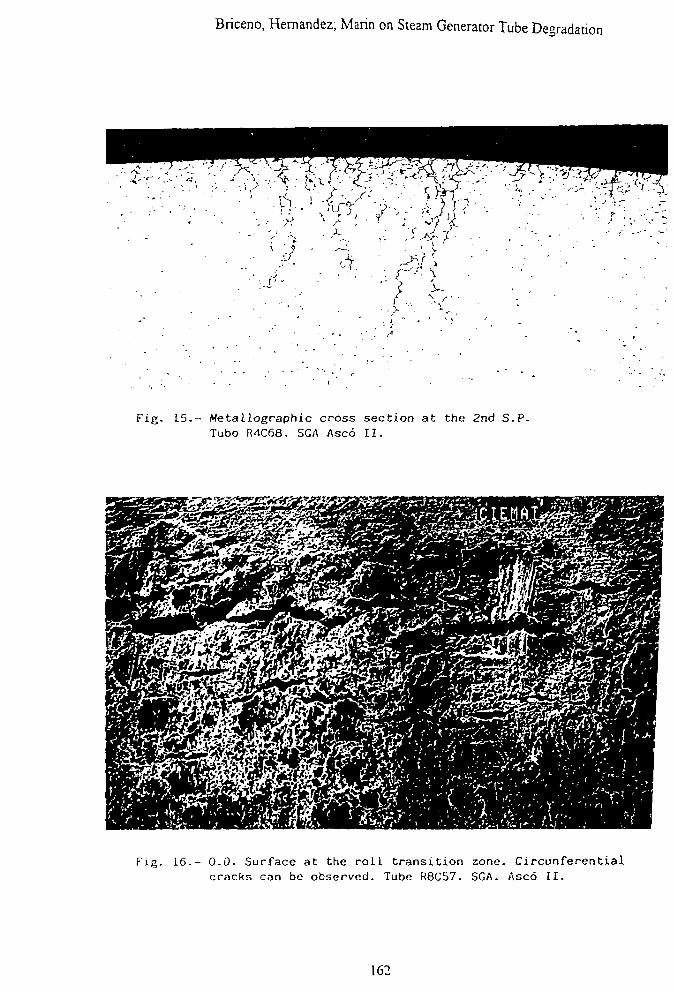
Bnceno, Hernandez; Marin on Steam Generator Tube Degradation
Fig. 15.- Metallographic cross section at the 2nd S.P.Tube- R4C68. SGA Asco II.
Fig. 16.- O.D. Surface at the roil transition zone. Circunferentialcracks can be observed. Tube R8C57. SGA. Asco II.
162
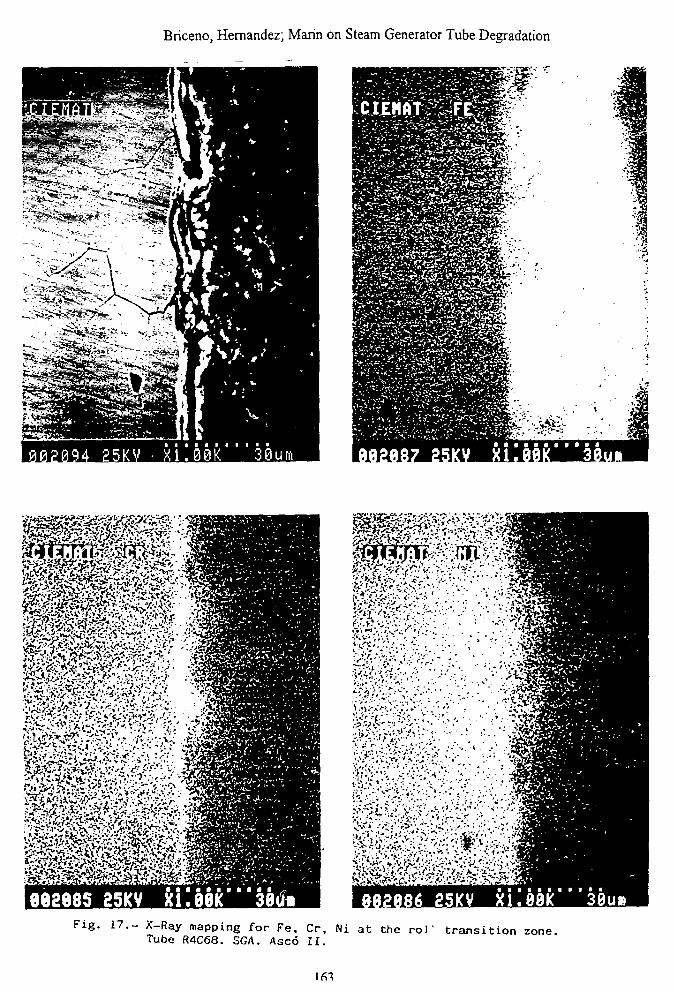
Briceno, Hernandez; Marin on Steam Generator Tube Degradation
Fig. 17.- X-Ray mapping for Fe, Cr,Tube R4C68. SGA. Asco II.
Ni at the roJ' transition zone.
L. Cizelj, B. Mavko: On the Risk-Based...
On the Risk-Based Steam Generator Life Time Optimisation
Leon Cizelj, Borut MavkoReactor Engineering Division, "Jozef Stefan" InstituteP.O.B. 100, 61111 Ljubljana, Slovenia
ABSTRACT
A probabilistic fracture mechanics model is employed to estimate the failure probability ofaxially cracked steam generator tubes. The model estimates the failure probability from therandom changes of the influencing parameters such as tube and crack geometry, materialproperties and non-destructive examination results, reliability and sizing accuracy and stablecrack propagation. The performance of the model is illustrated by n numerical example. Asteam generator tubing severely affected by the stress corrosion cracking is studied during mostunfavourable accidental conditions. Two different plugging approaches are analysed and thequality is compared, showing the superior performance of crack length oriented approach overtube wall thickness reduction both in terms of SG failure probability and extent of plugging.Thus, apart from setting the acceptable SG failure probability, all elements for the risk-basedSG life-time optimisation are provided on the example of stress corrosion cracking in tubeexpansion transition zone.
Keywords: steam generator, stress corrosion cracking, probabilistic fracture mechanics,sampling inspection schemes.
164
L. Cizelj, B. Mavko: On the Risk-Based...
1. INTRODUCTION
Steam generator (SG) tubes made of Inconel 600 are experiencing severe degradationprocesses. In particular, stress corrosion cracking (SCC) in the tube expansion transition zoneseems presently to be the leading degradation cause [1]. It results in deep, often throughthe tube wall, mostly axially oriented cracks [2]. Steam generator tubes represent asubstantial part of the second fission product barrier in a PWR nuclear power plant. Decreaseof structural reliability of affected tubes therefore implies reduced plant availability andsafety.
A variety of maintenance activities have been developed and employed to control the steamgenerator and plant safety [3]. In most cases, tubes are examined by non-destructiveexamination (NDE) methods. The tubes with NDE indications exceeding certain allowableextent are then plugged (or sleeved in some cases). The allowable extent of the NDEindication of degradation is usually called plugging criterion. Generally, two approaches todefine the plugging criteria have been accepted. Traditionally, the approach developed inUnited States (US) is employed. Thus, the acceptable defect magnitude equals 40% of thetube wall thickness reduction [4]. The defect sizing relies on bobbin coil (BC) eddycurrent technique (ECT) regardless of the defect type or morphology characteristics.Examination of a random sample of tubes may satisfy the regulatory requirements completely[5].
Recently, some European countries developed defect specific plugging criterion for stresscorrosion cracks in tube expansion transition region. In particular, Belgian approach [6]is considered in this paper. Following Belgian approach, axial cracks up to a certain lengthmay remain in operation. More effective motorized pancake coil (MRPC) ECT is applied inthis case to enable sufficiently accurate crack length determination [7]. A routineinspection of 100% of SG tubes is performed. We should note here that tubes which aredeclared operable using Belgian approach may be plugged when using US 40% criterion.This may lead to excessive tube plugging and early SG retirement.
The purpose of the present paper is to investigate the influence of the maintenance strategyon the SG failure probability. A two step analysis has been performed in this context. In thefirst step, the failure probability of axially cracked steam generator tubes has been estimated.A suitable probabilistic fracture mechanics model has already been proposed by Mavko andCizelj [8], following the Belgian plugging approach [6]. In the second step, theperformance of the traditional (40% tube wall thickness reduction) plugging strategy togetherwith the bobbin coil ECT is assessed on the same defect distribution, following the work ofCizelj and Mavko [9], In this way, reasonable comparison of both technologies has beenperformed by the me-yis of a numerical example. A Slovenian KrSko nuclear power plantsteam generator is considered during the most unfavourable conditions (hypothetical feed-linebreak accident). Recent NDE results from KrSko NPP have been used in the analysis.
By defining an acceptable SG failure probability, such maintenance strategy can be chosen,which minimizes the extent of plugging. However, our intention is to develop suitable failureprobability estimation models rather than setting acceptable values.
165
L. Cizelj, B. Mavko: On the Risk-Based...
2. STEAM GENERATOR FAILURE PROBABILITY
Steam generator failure is defined as the onset of unstable crack propagation in at least oneof the cracked tubes. This is in fact a tube rupture accident. All cracks are assumed to bethrough wall, which is a conservative assumption [10]. Further, no credit has been givento the means available for leak detection.
2.1 Failure probability considerations
Probabilistic fracture mechanics deals with the determination of failure probabilities Pf ofcrack containing structural components from the scatter of the applied loads and structuralresistance properties. The failure behaviour of the structure is described by a failure functiong(x), depending on basic random variables x=(xu ..., xj which denote applied loads andstructural resistance parameters such as dimensions and material properties. By definition,g(x) < 0 implies failure, whereas no failure occurs for g(x) > 0. The failure probability Pf canbe calculated as the probability content of the failure domain g(x)<0:
... /„(*„) dxt ... dxn (1)
where f{(x) represent the probability densities of respective basic variables xit which are forthe sake of simplicity assumed to be stochastically independent. Eq. (1) is sometimes referredto as failure integral, which can be solved for example by direct Monte Carlo simulation[11].
2.2 Failure function
Extensive research work has been performed to determine the conditions governing the tubefailure (see for example [12] and [10]). The plastic limit load model has been chosen toadequately describe the failure [13]. Thus, the failure function may be written as:
g(a.,R,t,K,b,<sv + ow) = Of - mo (2)
The factor m accounts for the crack bulging due to the internal pressure in the tube [14]:
a,
m = 0.614 + 0.386<A ^ I + 0.866
i(3)
a,, R and t being crack length at the end of inspection cycle, tube mean radius and tube wallthickness, respectively. Flow stress af is defined by the means of yield stress aY and ultimatetensile strength aM and adjusted for the operating temperature conditions by factor 8 whereappropriate:
of = K(oY + au)b (4)
The membrane stress perpendicular to the crack direction a is pressure difference (p) inducedtube hoop stress:
a - pi* - I ) (5)
166
L. Cizelj, B. Mavko: On the Risk-Based...
2.3 Crack length distribution
In the operating steam generator, the vast majority of the influencing parameters and theirrespective probability distributions are already known prior to the operation. We will assumehere that the only change affecting the structural reliability is the development of axialcracks. Therefore, the state of the steam generator tubing under investigation is defined bythe number of cracks and distribution of crack lengths. Furthermore, all maintenanceactivities will affect only the number and distribution of the cracks and their respectivelengths. This is in perfect agreement with maintenance strategies in field use (see for example[6]).
The non-destructive in-service inspection is performed to detect and size the cracks in steamgenerator tubing. The number and length distribution of cracks is estimated based on the in-service inspection results. The tubes containing cracks exceeding specified allowable lengthcalled plugging limit (PL) are then removed from service (e.g., plugged). However, a certainamount of cracks exceeding PL may be missed during the inspection process. This fractionis governed by the detection reliability function [PJaJ), which is generally a function ofcrack length. We may summarize this behaviour in:
% = 1
an + ae, am + ae < PL
0 othervise
a0 is a random variable representing the crack length obtained after the end of themaintenance process, while am and ae represent the as measured crack length andmeasurement error, respectively, f stands for uniformly distributed random variable.
2.3.1 Detection reliability
Unfortunately, the information about the detection reliability available in the literature islimited to sentences like "All cracks in excess of 3 mm were detected" [7]. To allow for theprobabilistic assessment of this important parameter, the following assumption has beenapplied [15]:
Pd(a) = 1 - exp(- 0.45a) (7)
2.4 Stable crack propagation
A fraction of cracks is propagating in a stable manner during the period between twoconsecutive inspections. A simple stochastic combination of stochastic propagation lawproposed in [2] and measured crack length is applied at the moment to yield end ofinspection cycle crack length a,:
a, = a0 + ag (8)
2.5 Tube failure probability
By solving eq. (1), the failed fraction of the given population of tubes is estimated. In orderto predict the probability of having n out of N cracked tubes ruptured, the binomial
167
L. Cizelj, B. Mavko: On the Risk-Based...
distribution can be applied:
P = ^ P; (i _ pW-n) (9)" n\ (N -n)\ ' f
Asymptotically, the probability of having one or more tubes failed within the population ofN cracked tubes follows Poisson distribution [11]:
P =
3 BOBBIN COIL INSPECTION EFFICIENCY
(10)
The uncertainties of the BC inspection procedures have been well defined and extensivelydiscussed by Bowen at al. [16]. However, the sampling plans analyzed did not includethe US NRC Reg. Guide 1.83 [5] sampling inspection scheme. This has however beeninvestigated by Cizelj and Mavko [9]. The main assumption in this investigation has been thatthere is no information about the past defect distributions in steam generator underinvestigation. This conservatively allowed for random choice of tubes to be inspected. Ashort review of the concept and results is given below.
3.1 US NRC Regulatory guide 1.83 inspection scheme
The tubes with BC indications are described as either degraded (with damage below theplugging limit PL) or defective, where the tube is affected beyond the PL. We shall assumethat the fractions of defective and degraded tubes in the steam generator are px and p2,respectively. The probability of finding kx defective and k2 degraded tubes in n random singletube inspections is then given by:
pkP^ppS'krk2 (11)
To calculate the probability that the steam generator is declared operable (accepted) in thefirst inspection step we only have to sum the probabilities of all possible states which areacceptable according to the procedure defined in [5]. Allowing for D, defective and dx
degraded tubes in a random sample of n} tubes (see Table I) will yield the total probabilityof accepting the steam generator in the first inspection step:
p =TTp. <12>
If the first inspection step indicates rejection, additional sample of n2-nl should be inspected.The acceptance probability is therefore conditional, because only certain outcomes of the firststep (P(lf*2)) will trigger and at the same time enable the acceptable outcome of the secondstep (P(211,-2)):
P2 = £i>(lr2)-/>(2|lr2) (13)i
When analysing the third inspection step the analogous approach should be used.Additionally, the possibility of bypassing the second step should be taken into account. Thismay happen if the allowable values for the second step are exceeded during the first step, butthe outcome still enables acceptance of the third step. Summing over all appropriate outcomes
168
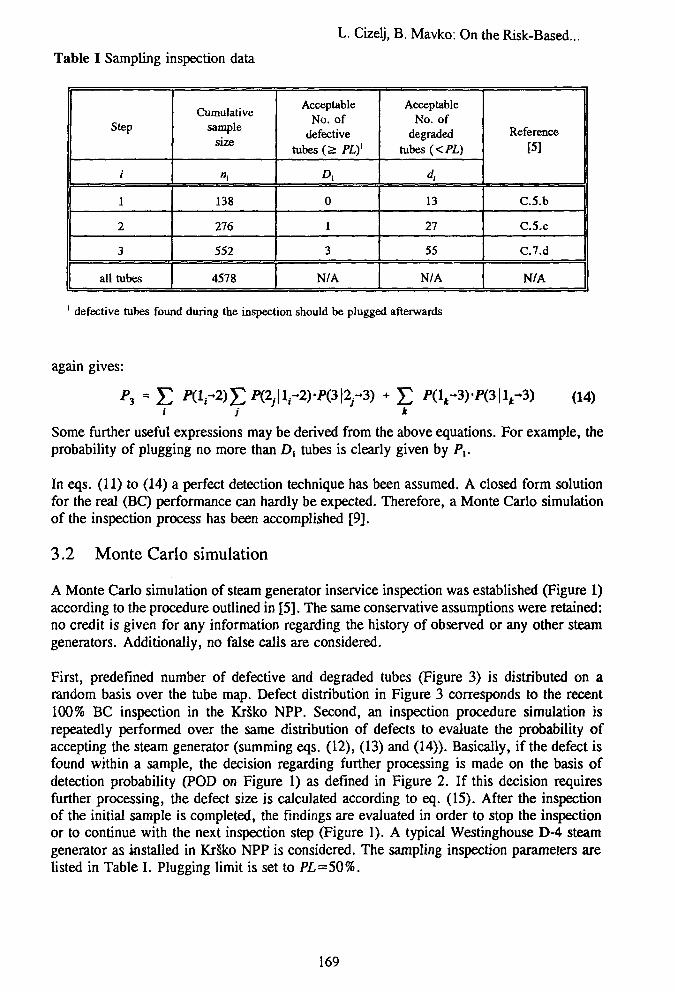
L. Cizelj, B. Mavko: On the Risk-Based.
Table I Sampling inspection data
Step
i
1
2
3
all tubes
Cumulativesample
size
138
276
552
4578
AcceptableNo. of
defectivetubes O PL)1
A
0
1
3
N/A
AcceptableNo. of
degradedtubes (<PL)
d,
13
27
55
N/A
Reference[5]
C.5.b
C.5.C
C.7.d
N/A
1 defective tubes found during the inspection should be plugged afterwards
again gives:
= £Some further useful expressions may be derived from the above equations. For example, theprobability of plugging no more than D, tubes is clearly given by />,.
In eqs. (11) to (14) a perfect detection technique has been assumed. A closed form solutionfor the real (BC) performance can hardly be expected. Therefore, a Monte Carlo simulationof the inspection process has been accomplished [9].
3.2 Monte Carlo simulation
A Monte Carlo simulation of steam generator inservice inspection was established (Figure 1)according to the procedure outlined in [5]. The same conservative assumptions were retained:no credit is given for any information regarding the history of observed or any other steamgenerators. Additionally, no false calls are considered.
First, predefined number of defective and degraded tubes (Figure 3) is distributed on arandom basis over the tube map. Defect distribution in Figure 3 corresponds to the recent100% BC inspection in the KrSko NPP. Second, an inspection procedure simulation isrepeatedly performed over the same distribution of defects to evaluate the probability ofaccepting the steam generator (summing eqs. (12), (13) and (14)). Basically, if the defect isfound within a sample, the decision regarding further processing is made on the basis ofdetection probability (POD on Figure 1) as defined in Figure 2. If this decision requiresfurther processing, the defect size is calculated according to eq. (15). After the inspectionof the initial sample is completed, the findings are evaluated in order to stop the inspectionor to continue with the next inspection step (Figure 1). A typical Westinghouse D-4 steamgenerator as installed in KrSko NPP is considered. The sampling inspection parameters arelisted in Table I. Plugging limit is set to PL=50%.
169
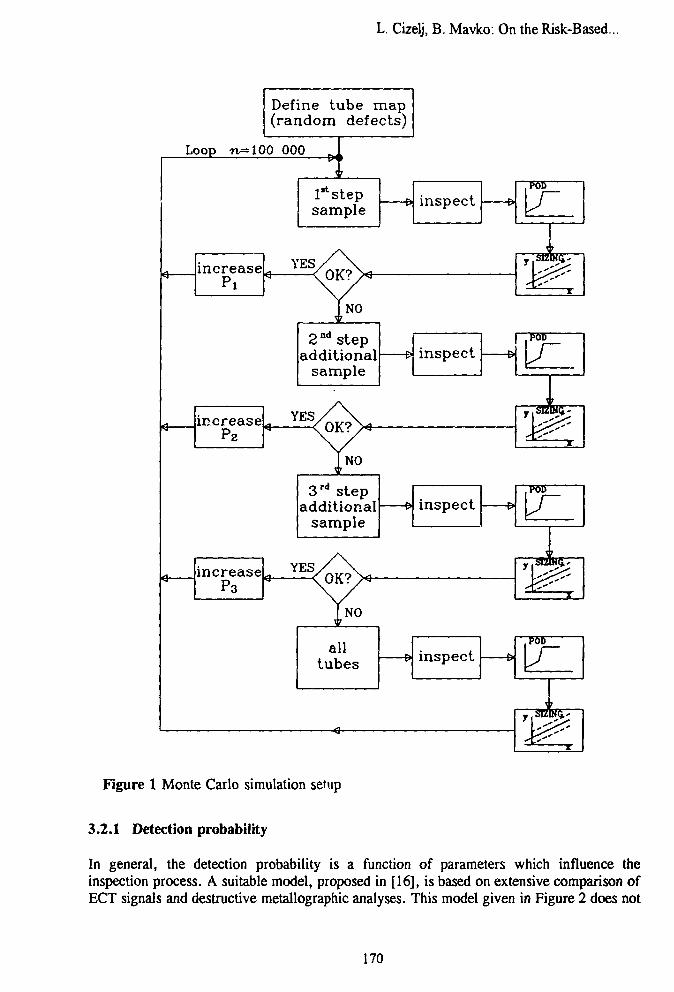
L. Cizelj, B. Mavko. On the Risk-Based...
Define tube map(random defects)
Loop rv=100 000
increase
increaseP2
increaseP3
lBtstepsample
YES0K?>-
NO
2 nd stepadditional
sample
YES
N0
YES
NO
inspect
inspect
ZWt-
3 rd s tepadditional
sampleinspect
1
alltubes inspect
1
Figure 1 Monte Carlo simulation setup
3.2.1 Detection probability
In general, the detection probability is a function of parameters which influence theinspection process. A suitable model, proposed in [16], is based on extensive comparison ofECT signals and destructive metallographic analyses. This model given in Figure 2 does not
170
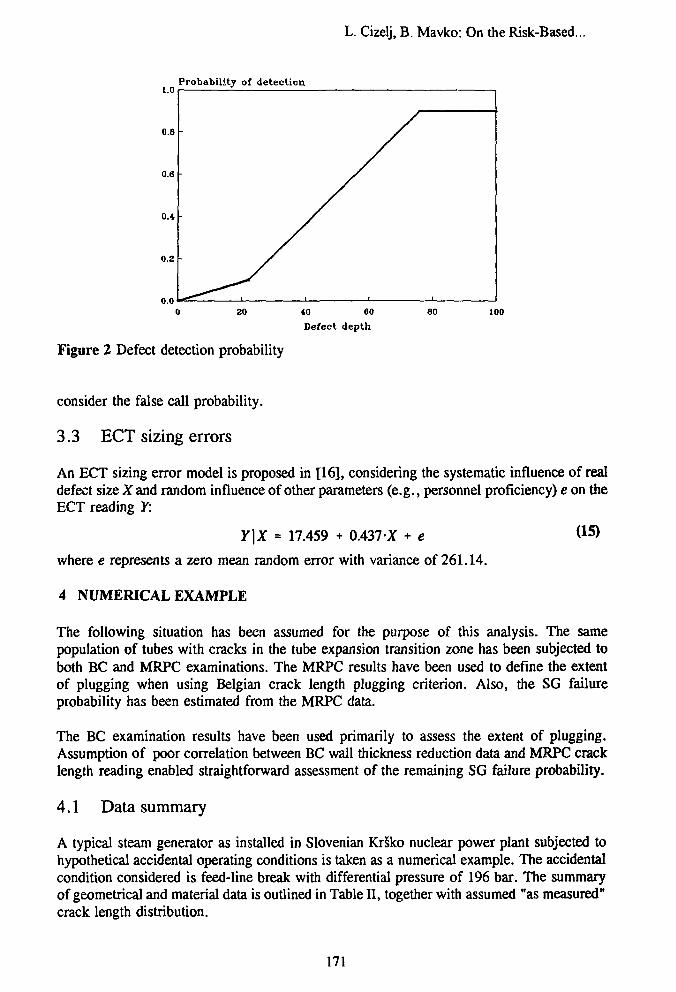
L. Cizelj, B. Mavko: On the Risk-Based...
1.0
0.8
0.6
0.4
O.Z
n n
Probability
-
-
-
of detection
/
/
/
/
20 40 60Defect depth
80 100
Figure 2 Defect detection probability
consider the false call probability.
3.3 ECT sizing errors
An ECT sizing error model is proposed in [16], considering the systematic influence of realdefect size X and random influence of other parameters (e.g., personnel proficiency) e on theECT reading Y:
Y\X = 17.459 + 0.437 X + e <15>
where e represents a zero mean random error with variance of 261.14.
4 NUMERICAL EXAMPLE
The following situation has been assumed for the purpose of this analysis. The samepopulation of tubes with cracks in the tube expansion transition zone has been subjected toboth BC and MRPC examinations. The MRPC results have been used to define the extentof plugging when using Belgian crack length plugging criterion. Also, the SG failureprobability has been estimated from the MRPC data.
The BC examination results have been used primarily to assess the extent of plugging.Assumption of poor correlation between BC wall thickness reduction data and MRPC cracklength reading enabled straightforward assessment of the remaining SG failure probability.
4.1 Data summary
A typical steam generator as installed in Slovenian KrSko nuclear power plant subjected tohypothetical accidental operating conditions is taken as a numerical example. The accidentalcondition considered is feed-line break with differential pressure of 196 bar. The summaryof geometrical and material data is outlined in Table II, together with assumed "as measured"crack length distribution.
171
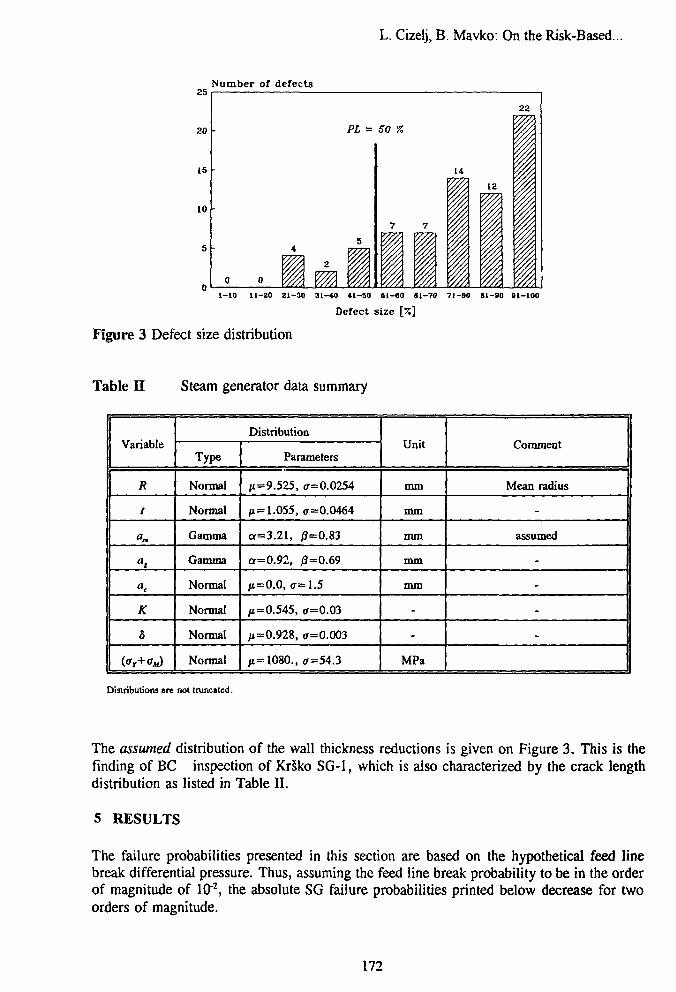
L. Cizelj, B. Mavko: On the Risk-Based.
25Number of defects
15
10
22
PL = 50 %
0 0
14
7 7
Ii1i
1-10 11-20 21-30 31-40 41-30 6l-«0 41-70 71-80 81-80 81-100
Defect size [%]
Figure 3 Defect size distribution
Table II Steam generator data summary
Variable
R
t
an
a,
at
K
b
Distribution
Type
Normal
Normal
Gamma
Gamma
Normal
Normal
Normal
Normal
Parameters
H=9.525, (r=0.0254
jt= 1.055, ff=0.0464
a=3.21, 0=0.83
0=0.92, 0=0.69
,1=0.0,^=1.5
,1=0.545, ff=0.03
jt=0.928, a=0.003
,4=1080., <r=54.3
Unit
mm
mm
mm
mm
mm
-
-
MPa
Comment
Mean radius
-
assumed
-
-
-
-
Distributions are not truncated.
The assumed distribution of the wall thickness reductions is given on Figure 3. This is thefinding of BC inspection of KrSko SG-1, which is also characterized by the crack lengthdistribution as listed in Table II.
5 RESULTS
The failure probabilities presented in this section are based on the hypothetical feed linebreak differential pressure. Thus, assuming the feed line break probability to be in the orderof magnitude of 10"2, the absolute SG failure probabilities printed below decrease for twoorders of magnitude.
172
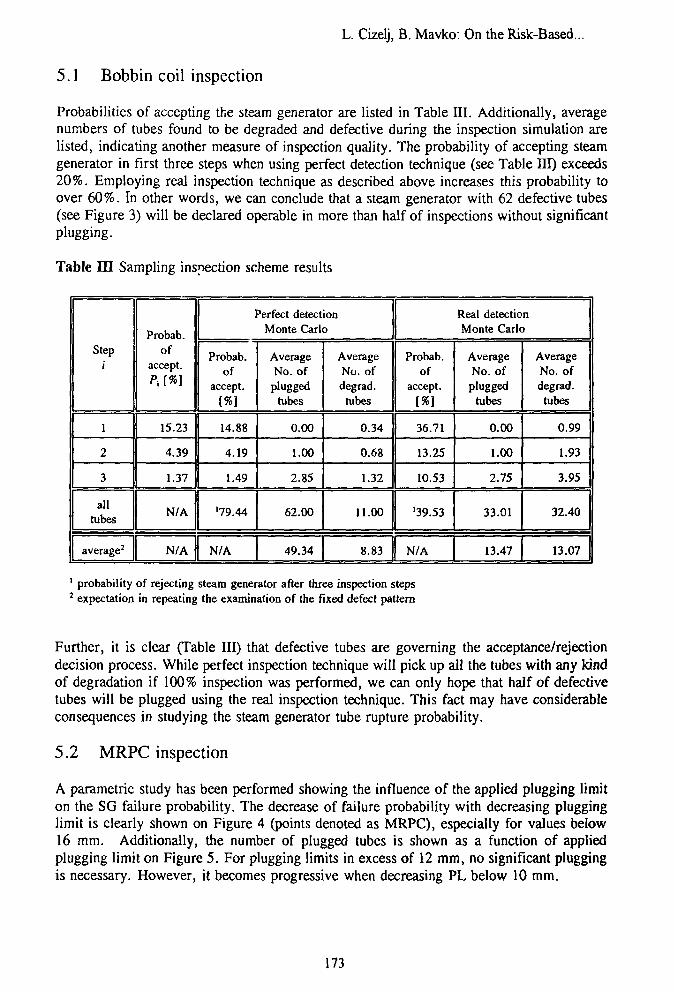
L. Cizelj, B. Mavko: On the Risk-Based...
5.1 Bobbin coil inspection
Probabilities of accepting the steam generator are listed in Table III. Additionally, averagenumbers of tubes found to be degraded and defective during the inspection simulation arelisted, indicating another measure of inspection quality. The probability of accepting steamgenerator in first three steps when using perfect detection technique (see Table III) exceeds20%. Employing real inspection technique as described above increases this probability toover 60%. In other words, we can conclude that a steam generator with 62 defective tubes(see Figure 3) will be declared operable in more than half of inspections without significantplugging.
Table III Sampling inspection scheme results
Step/
1
2
3
Probab.of
accept.P, [*]
15.23
4.39
1.37
ut 1 N/Atubes II
Perfect detectionMonte Carlo
Probab.of
accept.[«]
14.88
4.19
1.49
'79.44
average2 N/A N/A
AverageNo. of
pluggedtubes
0.00
1.00
2.85
62.00
49.34
AverageNo. ofdegrad.tubes
0.34
0.68
1.32
11.00
Real detectionMonte Carlo
Probab.of
accept.[%]
36.71
13.25
10.53
'39.53
8.83 N/A
AverageNo. of
pluggedtubes
0.00
1.00
2.75
33.01
13.47
AverageNo. ofdegrad.
tubes
0.99
1.93
3.95
32.40
13.07
1 probability of rejecting steam generator after three inspection steps2 expectation in repeating the examination of the fixed defect pattern
Further, it is clear (Table III) that defective tubes are governing the acceptance/rejectiondecision process. While perfect inspection technique will pick up all the tubes with any kindof degradation if 100% inspection was performed, we can only hope that half of defectivetubes will be plugged using the real inspection technique. This fact may have considerableconsequences in studying the steam generator tube rupture probability.
5.2 MRPC inspection
A parametric study has been performed showing the influence of the applied plugging limiton the SG failure probability. The decrease of failure probability with decreasing plugginglimit is clearly shown on Figure 4 (points denoted as MRPC), especially for values below16 mm. Additionally, the number of plugged tubes is shown as a function of appliedplugging limit on Figure 5. For plugging limits in excess of 12 mm, no significant pluggingis necessary. However, it becomes progressive when decreasing PL below 10 mm.
173
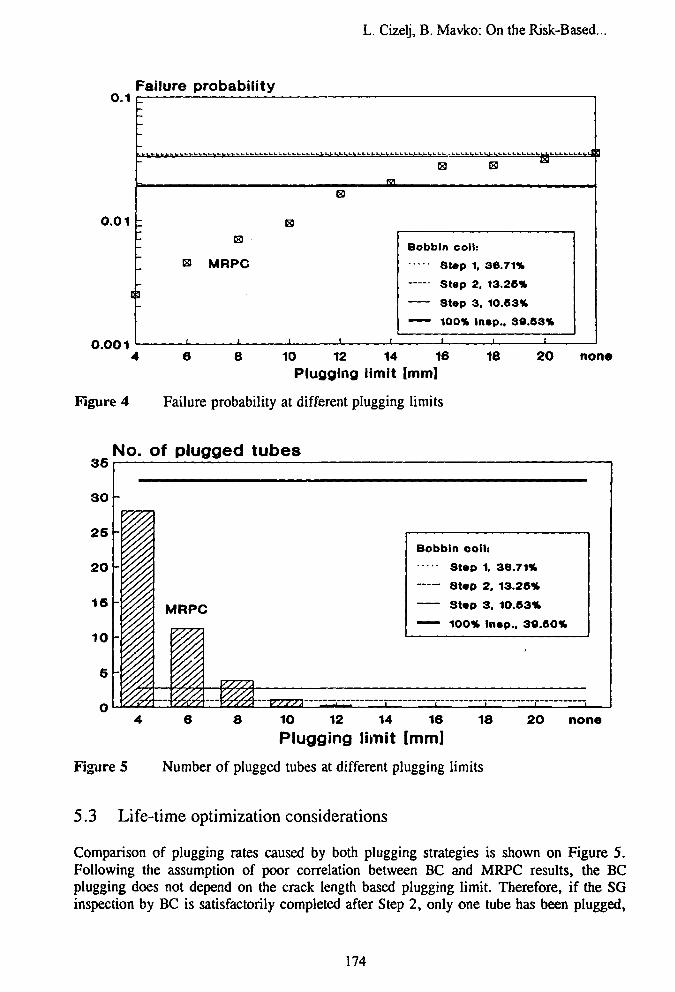
L. Cizelj, B. Mavko: On the Risk-Based...
U . I
0.01
t
r\rn
Failure
-
_
i
probability
13
MRPC
E)
i
. . . . . . . . . . . . . . . . . . . . . . . . . . . . . . . . . . . l .^ tULLL^^,.^^Lrt^UU^J 1
Bobbin coll:
Stop 1, 36.71%
Step 2, 13.26%
Stop 3, 10.63%
—— 100% ln»p.. 39.53%
t 1 1 i
6 8 10 12 14 16Plugging limit [mm]
18 20
Figure 4 Failure probability at different plugging limits
none
36
30
25
20
16
10
5
0
No. of plugged tubes
Bobbin ooil:
Stop
Stop
Stop
100%
1.
2 .
3.
36.71%
13.26%
10.63%
Inop.. 30.60%
6 8 10 12 14 16Plugging limit [mm]
18 20 none
Figure 5 Number of plugged tubes at different plugging limits
5.3 Life-time optimization considerations
Comparison of plugging rates caused by both plugging strategies is shown on Figure 5.Following the assumption of poor correlation between BC and MRPC results, the BCplugging does not depend on the crack length based plugging limit. Therefore, if the SGinspection by BC is satisfactorily completed after Step 2, only one tube has been plugged,
174
L. Cizelj, B. Mavko:On the Risk-Based...
as shown in Figure 5 and Table III. Recalling Table III, the probability of having this caseis 13.25%. If the 100% inspection by BC has been performed, 32 tubes have been plugged.It is obvious, that on the given defect distribution, Belgian plugging strategy performs better.Even at technically minimal plugging limit of 4 mm (MRPC reliable detection threshold isabout 3 mm), it will not exceed the number of tubes plugged following traditional USapproach.
The situation is very similar when considering SG failure probabilities. When the SG isdeclared operable after the Step 1, which has the probability of 36.71%, all cracked tubeswill remain in operation (Figure 4 and Table III). This situation is effectively the same asno plugging at all in terms of Belgian approach. Even for the 100% inspection, thetraditional plugging can not perform better than Belgian with plugging limit set to 14 mm(Figure 4).
Comparing Figure 5 and Figure 4, the space constrained by plugging limits of 8 and 14 mmseems to be optimal from the viewpoint of the number of plugged tubes, when using Belgianplugging approach. The SG failure probability can be adjusted by a factor of 2 in this range.However, if lower SG failure probability is required, it can be achieved on expense ofreduced SG performance.
6 CONCLUSIONS
A complete methodology for assessing the steam generator plugging strategy has beenproposed for the case of axial stress corrosion cracking in tube expansion transition zone. Itconsists of a probabilistic fracture mechanics model and a Monte Carlo simulation setupdesigned to assess the bobbin coil inspection uncertainties. Also, the random samplinginspection scheme contribution to the overall inspection uncertainty has been considered.
This methodology enables the comparison of different plugging strategies such as US NRCwall thickness reduction and Belgian crack length plugging criterion together with appropriateinservice inspection concepts. Steam generator failure probability and number of pluggedtubes are proposed as a measure of efficiency.
A numerical example considering the KrSko NPP steam generator has been presented. Thefailure probability of steam generator tubing, severely affected by stress corrosion cracking,has been calculated. Further, by comparing the efficiency of both plugging approachesstudied, the Belgian approach is recognized to be superior both in extent of plugging andsteam generator failure probability.
For a given numerical example, the optimal plugging limit in terms of allowable crack lengthis derived. It minimizes the extent of plugging at given steam generator failure probability,thus extends the steam generator life time. However, no attempts have been made to definethe acceptable steam generator failure probability.
175
L. Cizelj, B. Mavko:On the Risk-Based...
7 REFERENCES
[1 Berge, P., P. Saint Paul (1990): An Overview of R and D Support of PWR SteamGenerators, Steam Generator and Heat Exchanger Conference, Toronto.
[2] Hernalsteen, P. (1991): Prediction Models for the PWSCC degradation Process inTube Roll Transitions, NEA-CSNI-UNIPEDE Specialist Meeting on Operating Experiencewith Steam Generators, Brussels, Belgium.
[3 Clark, R.A. , RJ.Kurtz (1988): Compendium and Comparison of Intemarional Practicefor Plugging, Repair and Inspection of Steam Generator Tubing, NUREG/CR-5016.
[4] US Nuclear Regulatory Commission (1976): Bases for Plugging Degraded PWRSteam Generator Tubes, Regulatory Guide 1.121.
[5] US Nuclear Regulatory Commission (1975): Inservice Inspection of Pressurized WaterReactor Steam Generator Tubes, Regulatory Guide 1.83, Rev. 1.
[6] Vyve, J. van, P.Hernalsteen, J.Mathonet (1991): Steam Generator Tube PluggingCriteria,Trans. of the 1 st Int. Conf. on Engineering Support to NPP Operation.
[7] Dobbeni, D. (1991): Eddy Current Inspection Methodology, NEA-CSNI-UNIPEDESpecialist Meeting on Operating Experience with Steam Generators, Brussels, Belgium.
[8] Mavko, B . , L. Cizelj ( 1992): Failure Probability of Axially Cracked Steam GeneratorTubes: A Probabilistic Fracture Mechanics Model, Nuclear Technology, Vol. 98, No. 2, pp.173-180.
[9] Cizelj, L., P Mavko (1991): Sampling Inspection Schemes and Steam Generator TubeRupture Probability, CSNI/UNIPEDE Specialist Meeting on Operating Experience with SteamGenerators, Brussels, Belgium.
[10] Flesch, B., B. Cochet (1990): Leak-Before-Break in Steam Generator Tubes, Int JPress Ves & Piping, Vol. 43, pp. 165-179.
[11] Brueckner, A. (1987): Numerical Methods in Probabilistic Fracture Mechanics, in:J.W. Provan, ed(s).: Probabilistic Fracture Mechanics and Reliability, Martinus NijhofFPublishers, pp. 351-386.
[12] Azodi, D., H.Schulz, R.Arenz (1987): On the Integrity of Steam Generator Tubesand Plugging Assessment, in: F. H. Wittmann, ed(s).: Experience with Structures andComponents in Operating Reactors, Trans of 9th Int Conf on SMiRT, Laussane, Switzerland,Vol. D, pp. 383-393.
[13] Frederick, G., J. Mathonet, P. Hernalsteen, D. Dobbeni (1989): Development andJustification of New Plugging Criteria Applicable to the Cracking Phenomena in the Tubing ofSteam Generators, Belgatom, Brussels.
[14] Erdogan, F. (1976): Ductile Fracture Theories for Pressurized Pipes and Containers,Int J Press V & Piping, Vol. 4, pp. 253-283.
[15] Dobbeni, D. (1991): Eddy Current Inspection Methodology, NEA-CSNI-UNIPEDESpecialist Meeting on Operating Experience with Steam Generators, Brussels, Belgium.
[16] Mavko, B., L. Cizelj, G. Roussel (1991): Steam Generator Tube Rupture ProbabilityEstimation - Study of the Axially Cracked Tubes Case, CSNI/UNIPEDE Specialist Meeting orOperating Experience with Steam Generators, Brussels, Belgium.
[17] Bowen, W. M., P. G. Heasler, R. B. White (1989): Evaluation of Sampling Plans foIn-Service Inspection of Steam Generator Tubes, NUREG/CR-5161, Vol. 1.
176

Kohashi on Recent Progress in PLEX
RECENT PROGRESS IN NUCLEAR POWER PLANT LIFEEXTENSION TECHNOLOGY DEVELOPMENT
KAZUYUKl KOHASHIJapan Power Engineering and Inspection Corporation, 5-11; Akasaka I-Chome; Minato-ku;Tokyo 107; Japan
ABSTRACT
In Japan, Plant Life Extension technology development project to evaluate the integrity ofplant components during an 80 year operating life is implemented. In this project, thermalaging condition for low alloy steels and stainless steels equivalent to an 80 year operating lifewas determined, and fatigue strength and fatigue crack propagation tests of thermall) agedmaterials based on determined thermal aging condition, fracture toughness test of irradiatedstainless steels that are obtained from the actual reactor internals and development ofprediction mcdel of irradiation assisted stress corrosion cracking were performed.
This paper presents the test results of fatigue strength of thermally aged low alloy steelsand fracture toughness of irradiated stainless steels.
1. INTRODUCTION
In Japan, it is expected that nuclear power will continue to play an important role inelectric power supply. Since it is expected that the fast breeder reactor (FBR) will beintroduced sometime during the first half of the 21st century, light water reactors(LWRs) willcontinue to play a key role for some 30 to 50 years to come. For this reason, technologydevelopment projects are being implemented to further enhance LWR technology and therebyimprove the reliability of LWRs.
The Plant Life Extension (PLEX) technology development project is an 11-year planwhich started in fiscal year 1985. The objectives of this project are to extend the service livesof existing LWRs to increase the energy generated by these plants during their lifetime and toreduce the lifetime generating cost. The Japan Power Engineering and Inspection Corporation(JAPEIC) has been assigned this project by the Ministry of International Trade and Industry(MITI) and is currently implementing this technology development project.
This paper presents recent activities with respect to the effects of thermal aging on lowalloy steels and fracture toughness of irradiated stainless steels among verification tests on plantcomponent materials that are implemented under this project.
2. PROJECT OUTLINE OF PLANT LIFE EXTENSION TECHNOLOGYDEVELOPMENT
Technology development related to PLEX is implemented under a framework as shown inFig. 1 and consists of the development of life prediction technology, monitoring technologyand repair, replacement and refurbishment technology. The schedule is shown in Fig. 2. Themonitoring technology is being developed under separate project.
This PLEX project is divided into three Phases, as shown in Fig. 2.
The feasibility study of Phase 1 was completed during fiscal year 1986. The importantcomponents and structures that are likely to govern the lives of nuclear power plants wereselected and preliminary life prediction was conducted for these important components for a
177
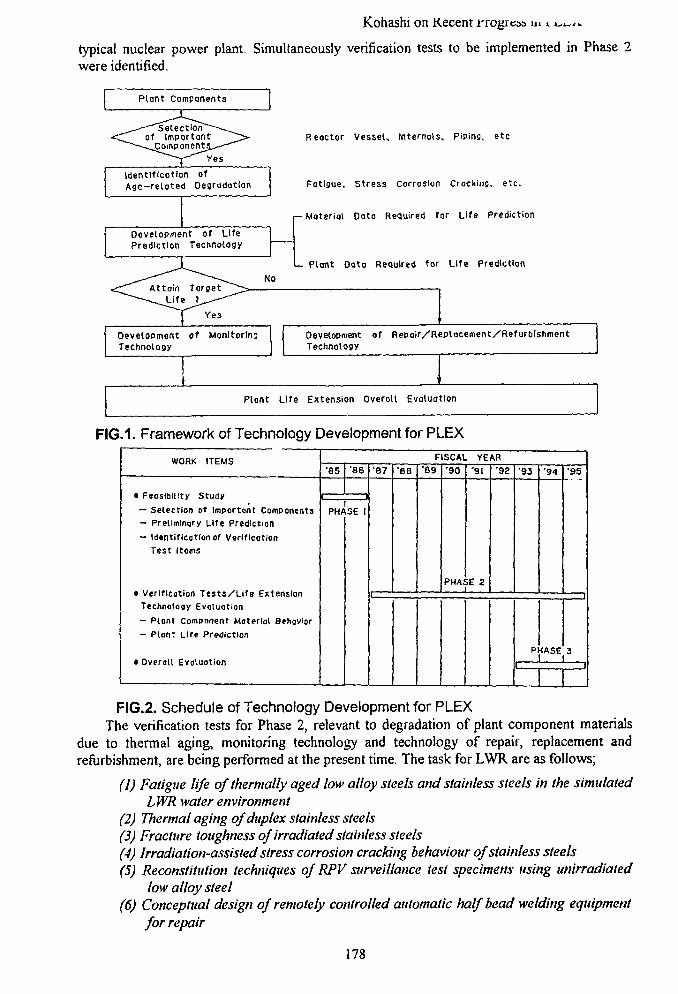
Kohashi on Kecent rrogrcsa m •. ^^^
typical nuclear power plant. Simultaneously verification tests to be implemented in Phase 2were identified.
Plant Components
Selectionof Important^Componentj
Yes
Identification ofAge— reloted Degradation
Development of LifePrediction Technology
Reactor Vessel, Internals. Piping etc
Fotlgue. Stress Corrosion Cracking, etc.
— Material Data Required for Life Prediction
- Plant Data Required for Life Prediction
<T" Attain^~"^*^Uft
DevelopmentTechnology
Target _^>
Yes
of Monitor In:
Plant Life
DevelopmentTechnology
Extension
of Repoir/Replacement/Refurbishment
Overall Evaluation
FIG.1. Framework of Technology Development for PLEX
WORK ITEMS
• Feasibility Study— Selection of Important Components— Preliminary Life Prediction- Identification of Verification
Test Items
» Verification Tests /L i fe ExtensionTechnology Evaluation— Plont Component Material Behavior- Plant Life Prediction
• Overall Evaluation
FISCAL YEAR'85
PH/
•86
SE I
'87
I '
'88 '89 '90
PHA:
'91
IE 2
'92 '93
P:
'94
HASE
i
'95
3
i
FIG.2. Schedule of Technology Development for PLEXThe verification tests for Phase 2, relevant to degradation of plant component materials
due to thermal aging, monitoring technology and technology of repair, replacement andrefurbishment, are being performed at the present time. The task for LWR are as follows;
(1) Fatigue life of thermally aged low alloy steels and stainless steels in the simulatedLWR water environment
(2) Thermal aging of duplex stainless steels(3) Fracture toughness of irradiated stainless steels(4) Irradiation-assisted stress corrosion cracking behaviour of stainless steels(5) Reconstitution techniques of RPV surveillance test specimens using unirradiated
low alloy steel(6) Conceptual design of remotely controlled automatic half bead welding equipment
for repair
178
Kohashi on Recent Progress in PLfcX
The studies of task (5) and (6) were completed by fiscal year 1989 and presented at thespecialist meeting in Madrid, Spain, Sept. 1991. Although tasks (1) to (4) are still in progress,this paper presents the recent activities of these tasks.
In the overall evaluation of Phase 3, the age-related degradation data regarding the plantcomponent materials will be compiled, and the life extension scenario of nuclear power plantswill be developed.
3. FATIGUE LIFE OF THERMALLY AGED LOW ALLOY STEELS IN THESIMULATED LWR WATER ENVIRONMENT
Reactor pressure vessel and primary coolant pipings are made of low alloy steels andaustenitic stainless steels, respectively. Although the operating temperature of LWRs isrelatively low, degradation such as temper embrittlement in low alloy steels and grain boundaryprecipitation of chromium carbides in stainless steels are supposed to occur owing to thermalaging during plant operation, and it is available to clarify the effects of thermal ??:ng on fatiguestrength for the assessment of the integrity of reactor components. Therefore, the effects ofthermal aging on fatigue strength and fatigue crack propagation rate in air and simulated LWRwater environment, using thermally aged materials, were evaluated in this task. Othermechanical properties were also evaluated.
The tests were divided into two steps. The first step is a preliminary test and the secondstep is a fatigue test using simulated LWR water environment.
This paper presents the results for the BWR but the similar results were obtained for thePWR.
3.1 Preliminary Test
Preliminary test was performed to determine the thermal aging condition equivalent to an80 year operating life and to evaluate the degradation tendency of materials due to thermalaging. An 80 year operating life was determined in consideration of margin.
3.1.1 Test Materials
Test materials are low alloy steels, SA508 CI.2 and SA533 Gr.B Cl.l, for reactor vesselthat are used for BWR. Chemical compositions and mechanical properties of these materialswere simulated the materials that were supplied the early domestic BWR plants as we can.
3.1. 2 Thermal Aging Condition
Test materials were thermally aged at 300, 350, 400 and 450 °C for 100 to 10,000 hr"s.
3.1.3 Tests Procedure
Microstructure, hardness, tensile and Charpy impact tests were performed.
Tensile tests were carried out at room temperature and 289 °C in air according to JISZ2241 and JIS GO567, respectively. Charpy impact tests were carried out using a temperaturerange of-150 to 100 °C in air according to JIS Z2242.
3.1.4 Progress up to Date
No significant changes due to thermal aging were observed in the microstructure,hardness and tensile properties. Only significant changes were observed on the transitiontemperature in Charpy impact tests. Transition temperatures (vTr50) that are obtained from
179
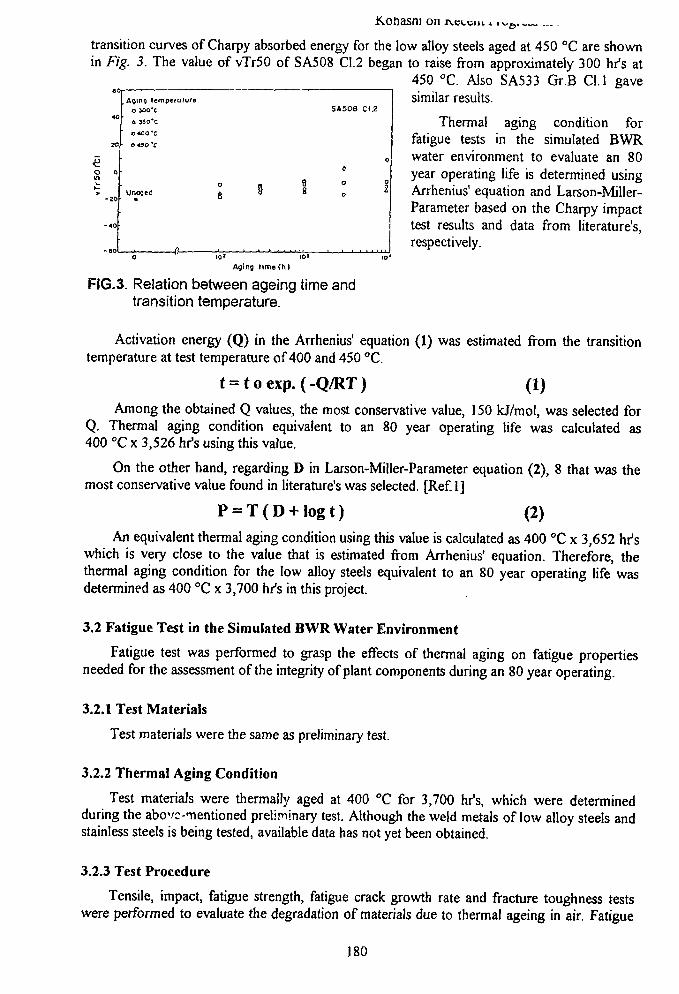
Konasni on
transition curves of Charpy absorbed energy for the low alloy steels aged at 450 °C are shownin Fig. 3. The value of vTr50 of SA5O8 C1.2 began to raise from approximately 300 hr's at
450 °C. Also SA533 Gr.B Cl.l gavesimilar results.
Thermal aging condition forfatigue tests in the simulated BWRwater environment to evaluate an 80year operating life is determined usingArrhenius' equation and Larson-Miller-Parameter based on the Charpy impacttest results and data from literature's,respectively.
AQinQ temperatureo soo'c SA5O8 CI2
owo'C
O 430 'C
10 »
Aging lime (hi
FIG.3. Relation between ageing time andtransition temperature.
Activation energy (Q) in the Arrhenius1 equation (1) was estimated from the transitiontemperature at test temperature of 400 and 450 °C.
t = t o exp. (-Q/RT) (1)Among the obtained Q values, the most conservative value, 150 kJ/mol, was selected for
Q. Thermal aging condition equivalent to an 80 year operating life was calculated as400 °C x 3,526 hr's using this value.
On the other hand, regarding D in Larson-Miller-Parameter equation (2), 8 that was themost conservative value found in literature's was selected. [Ref. 1]
P = T ( D + logt) (2)An equivalent thermal aging condition using this value is calculated as 400 °C x 3,652 hr's
which is very close to the value that is estimated from Arrhenius' equation. Therefore, thethermal aging condition for the low alloy steels equivalent to an 80 year operating life wasdetermined as 400 °C x 3,700 hr's in this project.
3.2 Fatigue Test in the Simulated BWR Water Environment
Fatigue test was performed to grasp the effects of thermal aging on fatigue propertiesneeded for the assessment of the integrity of plant components during an 80 year operating.
3.2.1 Test Materials
Test materials were the same as preliminary test.
3.2.2 Thermal Aging Condition
Test materials were thermally aged at 400 °C for 3,700 hr's, which were determinedduring the above-mentioned preliminary test. Although the weld metals of low alloy steels andstainless steels is being tested, available data has not yet been obtained.
3.2.3 Test Procedure
Tensile, impact, fatigue strength, fatigue crack growth rate and fracture toughness testswere performed to evaluate the degradation of materials due to thermal ageing in air. Fatigue
180
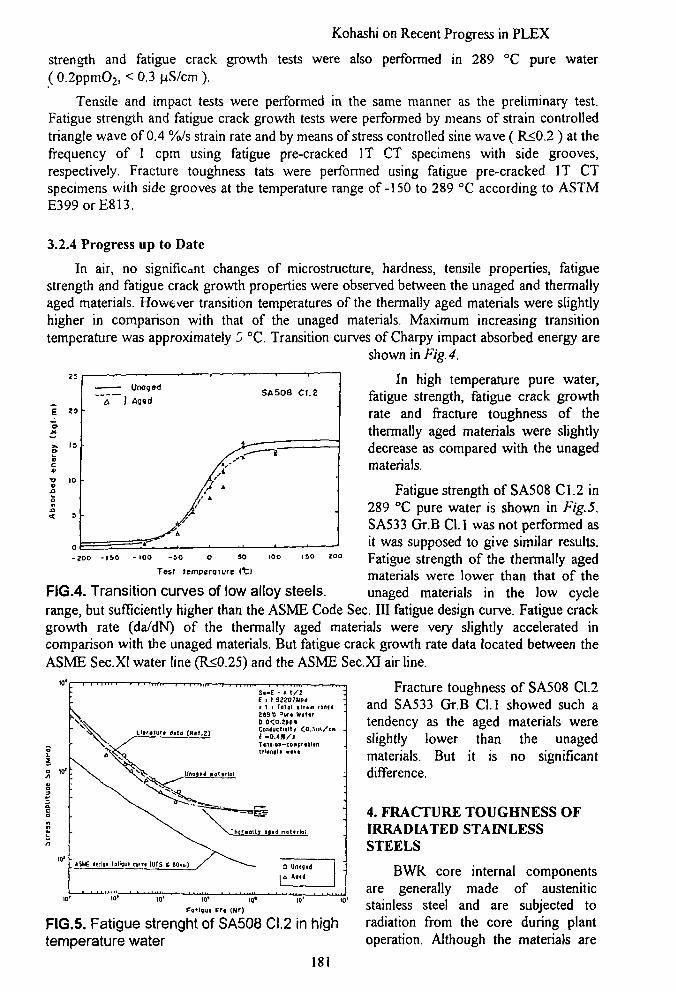
Kohashi on Recent Progress in PLEX
strength and fatigue crack growth tests were also performed in 289 °C pure water( 0.2ppmO2, < 0.3 nS/cm ).
Tensile and impact tests were performed in the same manner as the preliminary test.Fatigue strength and fatigue crack growth tests were performed by means of strain controlledtriangle wave of 0.4 %/s strain rate and by means of stress controlled sine wave ( R<0.2 ) at thefrequency of 1 cpm using fatigue pre-cracked IT CT specimens with side grooves,respectively. Fracture toughness tats were performed using fatigue pre-cracked IT CTspecimens with side grooves at the temperature range of-150 to 289 °C according to ASTME399orE813.
3.2.4 Progress up to Date
In air, no significant changes of microstructure, hardness, tensile properties, fatiguestrength and fatigue crack growth properties were observed between the unaged and thermallyaged materials. However transition temperatures of the thermally aged materials were slightlyhigher in comparison with that of the unaged materials. Maximum increasing transitiontemperature was approximately 5 °C. Transition curves of Charpy impact absorbed energy are
shown in Fig. 4.
In high temperature pure water,fatigue strength, fatigue crack growthrate and fracture toughness of thethermally aged materials were slightlydecrease as compared with the unagedmaterials.
Fatigue strength of SA508 Cl.2 in289 °C pure water is shown in Fig. 5.SA533 Gr.B Cl.l was not performed asit was supposed to give similar results.
200 Fatigue strength of the thermally agedmaterials were lower than that of the
FIG.4. Transition curves of low alloy steels. unaged materials in the low cyclerange, but sufficiently higher than the ASME Code Sec. Ill fatigue design curve. Fatigue crackgrowth rate (da/dN) of the thermally aged materials were very slightly accelerated incomparison with the unaged materials. But fatigue crack growth rate data located between theASME Sec.XI water line (R<0.25) and the ASME Sec.XI air line.
Fracture toughness of SA508 Cl.2and SA533 Gr.B Cl.l showed such atendency as the aged materials wereslightly lower than the unagedmaterials. But it is no significantdifference.
- 2O0 - 1 5 0 - 100 -SO O SO
Tesr remperoiure <t\
S«-E • < t / 2£ I I SH07UPHI 1 t Total itrun ranit289*0 atxa Watar
4. FRACTURE TOUGHNESS OFIRRADIATED STAINLESSSTEELS
BWR core internal componentsare generally made of austenitic
to' i * I I J L * x J *
stainless steel and are subjected toFIG.5. Fatigue strenght of SA508 Cl.2 in high radiation from the core during planttemperature water operation. Although the materials are
181
10"
wo
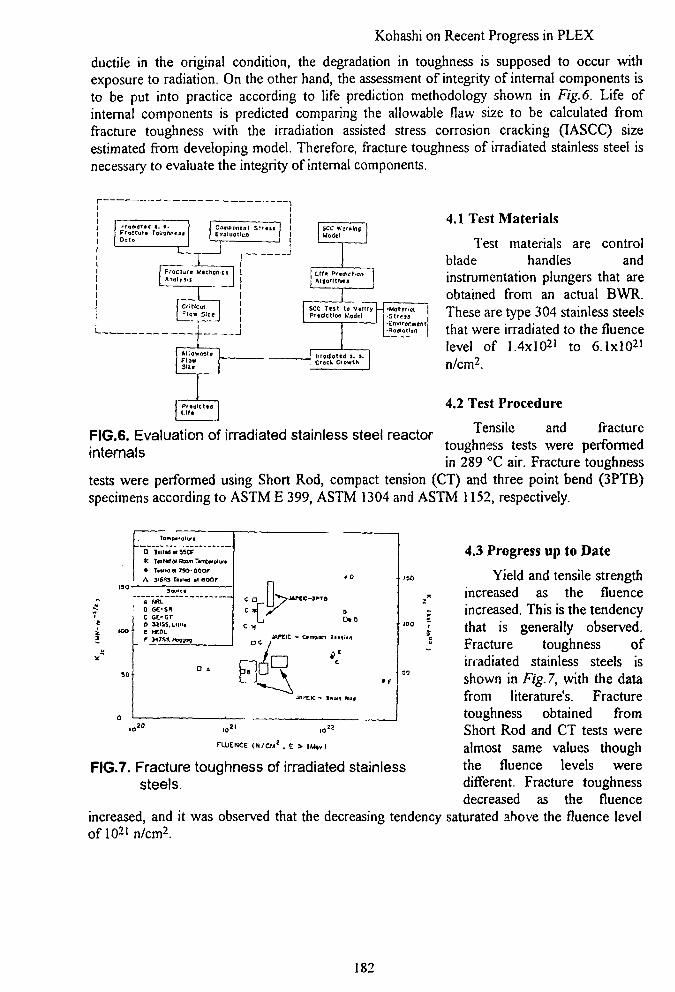
Kohashi on Recent Progress in PLEX
ductile in the original condition, the degradation in toughness is supposed to occur withexposure to radiation. On the other hand, the assessment of integrity of internal components isto be put into practice according to life prediction methodology shown in Fig.6. Life ofinternal components is predicted comparing the allowable flaw size to be calculated fromfracture toughness with the irradiation assisted stress corrosion cracking (IASCC) sizeestimated from developing model. Therefore, fracture toughness of irradiated stainless steel isnecessary to evaluate the integrity of internal components.
4.1 Test Materials
Test materials are controlblade handles andinstrumentation plungers that areobtained from an actual BWR.These are type 304 stainless steelsthat were irradiated to the fluencelevel of 1.4xlO21 to 6.1xlO21
n/cm2.
4.2 Test Procedure
FIG.6. Evaluation of irradiated stainless steel reactor Tensile and fractureinternals toughness tests were performed
in 289 °C air. Fracture toughnesstests were performed using Short Rod, compact tension (CT) and three point bend (3PTB)specimens according to ASTM E 399, ASTM 1304 and ASTM 1152, respectively.
D*
A
Till
M S
UtrSSOFH4tR»fl lT
Souica
ifflOwctura
floor
i HftLo G£-snc OE-crO 13ISS.U1
C X 0 L
c ac •c
JftrtlC - C*mpoci Tint!.
4.3 Progress up to Date
Yield and tensile strengthincreased as the fluenceincreased. This is the tendencythat is generally observed.Fracture toughness ofirradiated stainless steels isshown in Fig. 7, with the datafrom literature's. Fracturetoughness obtained fromShort Rod and CT tests werealmost same values thoughthe fluence levels weredifferent. Fracture toughnessdecreased as the fluence
increased, and it was observed that the decreasing tendency saturated above the fluence levelof 1021 n/cm2.
ruJENCE IN/CU2 . £ > IMtvl
FIG.7. Fracture toughness of irradiated stainlesssteels.
182
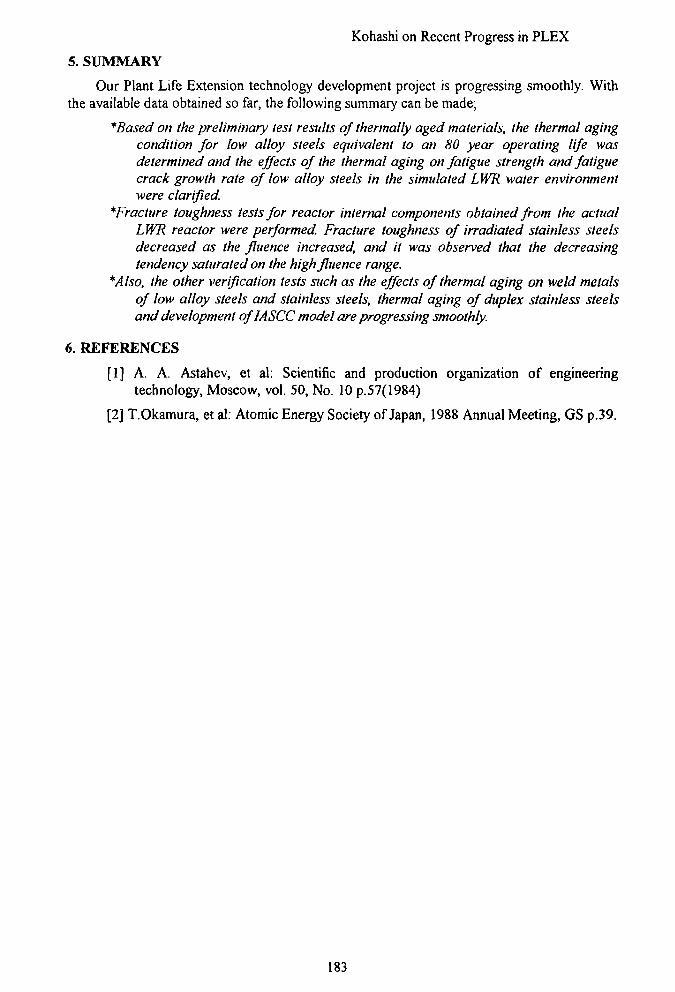
Kohashi on Recent Progress in PLEX
5. SUMMARY
Our Plant Life Extension technology development project is progressing smoothly. Withthe available data obtained so far, the following summary can be made;
*Based on the preliminary test results of thermally aged materials, the thermal agingcondition for low alloy steels equivalent to an 80 year operating life wasdetermined and the effects of the thermal aging on fatigue strength and fatiguecrack growth rate of low alloy steels in the simulated LWR water environmentwere clarified.
*Fracture toughness tests for reactor internal components obtained from the actualLWR reactor were performed. Fracture toughness of irradiated stainless steelsdecreased as the fluence increased, and it was observed that the decreasingtendency saturated on the high fluence range.
*Also, the other verification tests such as the effects of thermal aging on weld metalsof low alloy steels and stainless steels, thermal aging of duplex stainless steelsand development oflASCC model are progressing smoothly.
6. REFERENCES
[1] A. A. Astahev, et al: Scientific and production organization of engineeringtechnology, Moscow, vol. 50, No. 10 p.57(1984)
[2] T.Okamura, et al: Atomic Energy Society of Japan, 1988 Annual Meeting, GS p.39.
183
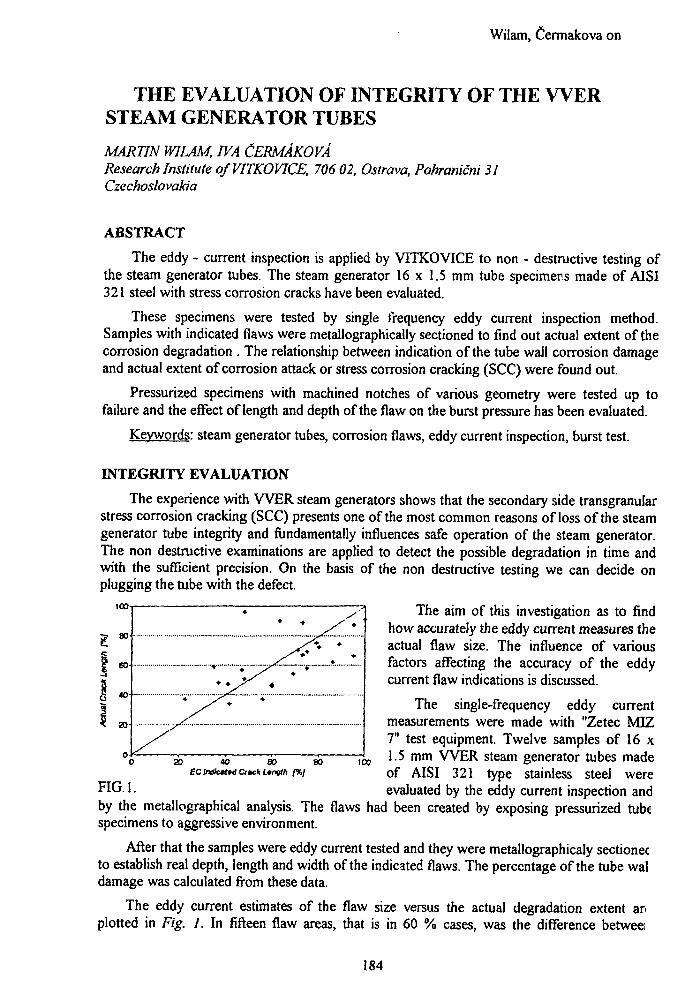
Wilam, Cermakova on
THE EVALUATION OF INTEGRITY OF THE W E RSTEAM GENERATOR TUBES
MARTIN WILAM, IVA CERMAKOVAResearch Institute qfVITKOVICE, 706 02, Ostrava, Pohranicni 31Czechoslovakia
ABSTRACT
The eddy - current inspection is applied by VITKOVICE to non - destructive testing ofthe steam generator tubes. The steam generator 16 x 1.5 mm tube specimens made of AISI321 steel with stress corrosion cracks have been evaluated.
These specimens were tested by single frequency eddy current inspection method.Samples with indicated flaws were metallographically sectioned to find out actual extent of thecorrosion degradation . The relationship between indication of the tube wall corrosion damageand actual extent of corrosion attack or stress corrosion cracking (SCC) were found out.
Pressurized specimens with machined notches of various geometry were tested up tofailure and the effect of length and depth of the flaw on the burst pressure has been evaluated.
Keywords: steam generator tubes, corrosion flaws, eddy current inspection, burst test.
INTEGRITY EVALUATION
The experience with W E R steam generators shows that the secondary side transgranularstress corrosion cracking (SCC) presents one of the most common reasons of loss of the steamgenerator tube integrity and fundamentally influences safe operation of the steam generator.The non destructive examinations are applied to detect the possible degradation in time andwith the sufficient precision. On the basis of the non destructive testing we can decide onplugging the tube with the defect.
The aim of this investigation as to findhow accurately the eddy current measures the
100
80
60
20-
actual flaw size. The influence of variousfactors affecting the accuracy of the eddycurrent flaw indications is discussed.
The single-frequency eddy currentmeasurements were made with "Zetec MIZ7" test equipment. Twelve samples of 16 x
2, 4(, e,, go 100 1.5 mm VVER steam generator tubes madeectn»ct*d crick Ltngth i%l of AISI 321 type stainless steel were
'• * • evaluated by the eddy current inspection andby the metallographical analysis. The flaws had been created by exposing pressurized tubespecimens to aggressive environment.
After that the samples were eddy current tested and they were metallographicaly sectionecto establish real depth, length and width of the indicated flaws. The percentage of the tube waldamage was calculated from these data.
The eddy current estimates of the flaw size versus the actual degradation extent arplotted in Fig. 1. In fifteen flaw areas, that is in 60 % cases, was the difference betweei
184
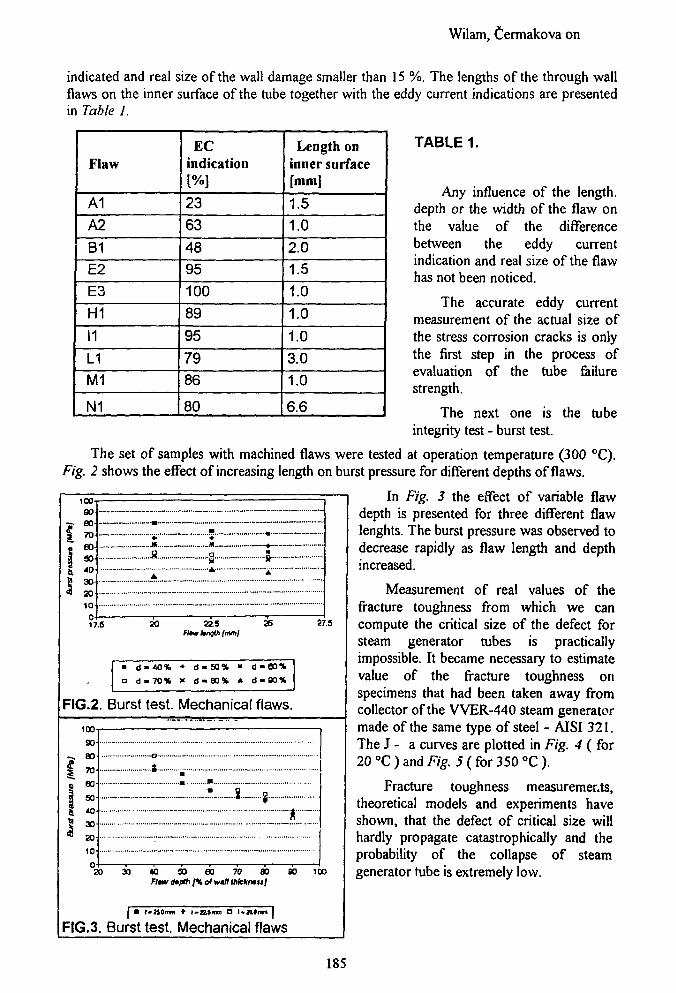
Wilam, termakova on
indicated and real size of the wall damage smaller than 15 %. The lengths of the through wallflaws on the inner surface of the tube together with the eddy current indications are presentedin Table 1.
TABLE 1.
Any influence of the length,depth or the width of the flaw onthe value of the differencebetween the eddy currentindication and real size of the flawhas not been noticed.
The accurate eddy currentmeasurement of the actual size ofthe stress corrosion cracks is onlythe first step in the process ofevaluation of the tube failurestrength.
The next one is the tubeintegrity test - burst test.
The set of samples with machined flaws were tested at operation temperature (300 °C).Fig. 2 shows the effect of increasing length on burst pressure for different depths of flaws.
In Fig. 3 the effect of variable flawdepth is presented for three different flawlenghts. The burst pressure was observed todecrease rapidly as flaw length and depthincreased.
Flaw
A1A2
B1E2E3
H1
11
L1M1
N1
ECindication[%]
2363
4895
100
89
95
79
86
80
Length oninner surface[mm]
1.51.02.0
1.5
1.0
1.0
1.0
3.0
1.0
6.6
10090
TO
eoso*°2010
8..
17.6 20 S2Sft** hnQttt [mm]
27.5
• d-40% * d«50% • d«80%
• d»70% x d»B0% * d-00%
FIG.2. Burst test. Mechanical flaws.
2 O 3 0 4 O 5 O e 0 7 O 8 O 8 O 1 0 OFlmv dtpth 1% of wtB <Mc*/wi j /
| • t-Htim * )-aitm a I-20.1m* I
FIG.3. Burst test. Mechanical flaws
Measurement of real values of thefracture toughness from which we cancompute the critical size of the defect forsteam generator tubes is practicallyimpossible. It became necessary to estimatevalue of the fracture toughness onspecimens that had been taken away fromcollector of the VVER-440 steam generatormade of the same type of steel - AISI 321.The J - a curves are plotted in Fig. 4 ( for20 °C ) and Fig. 5 ( for 350 °C ).
Fracture toughness measurements,theoretical models and experiments haveshown, that the defect of critical size willhardly propagate catastrophically and theprobability of the collapse of steamgenerator tube is extremely low.
185
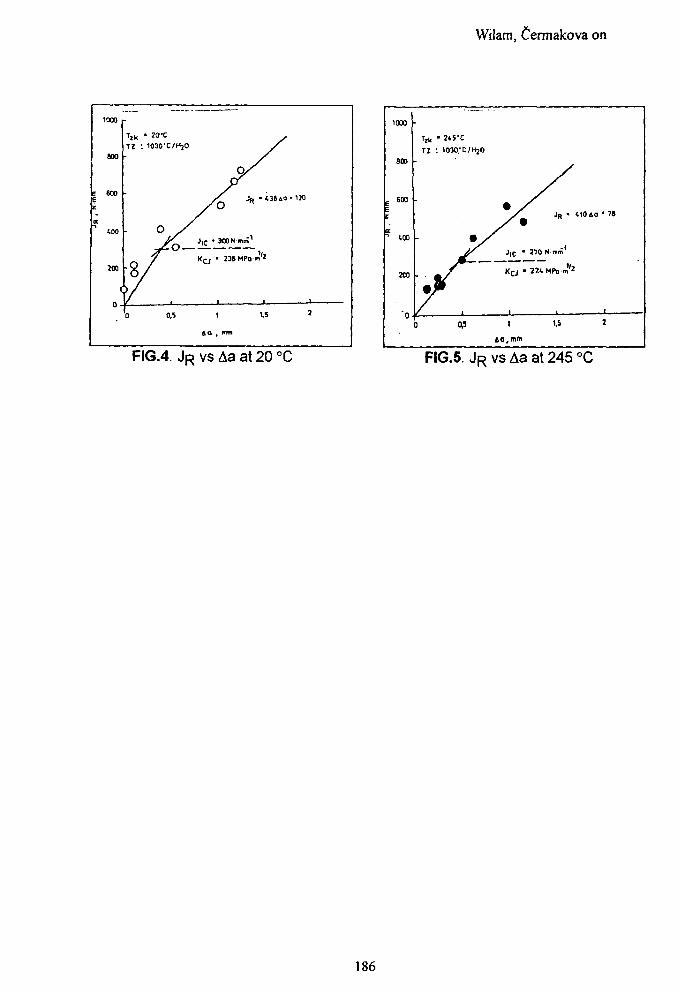
Wilam, Cermakova on
Jf, • 43840-1M
A a t flim
1000
800
E 600
? too
XD
'o
Tik '
TZ :
• • •
V/o
•
0
K C J "
,
1
40, mm
/
/
JR "
J70 N'lii'
i
1,5
M0«a * 7»
2
FIG.4. J R vs Aa at 20 °C FIG.5. J R vs Aa at 245 °C
186
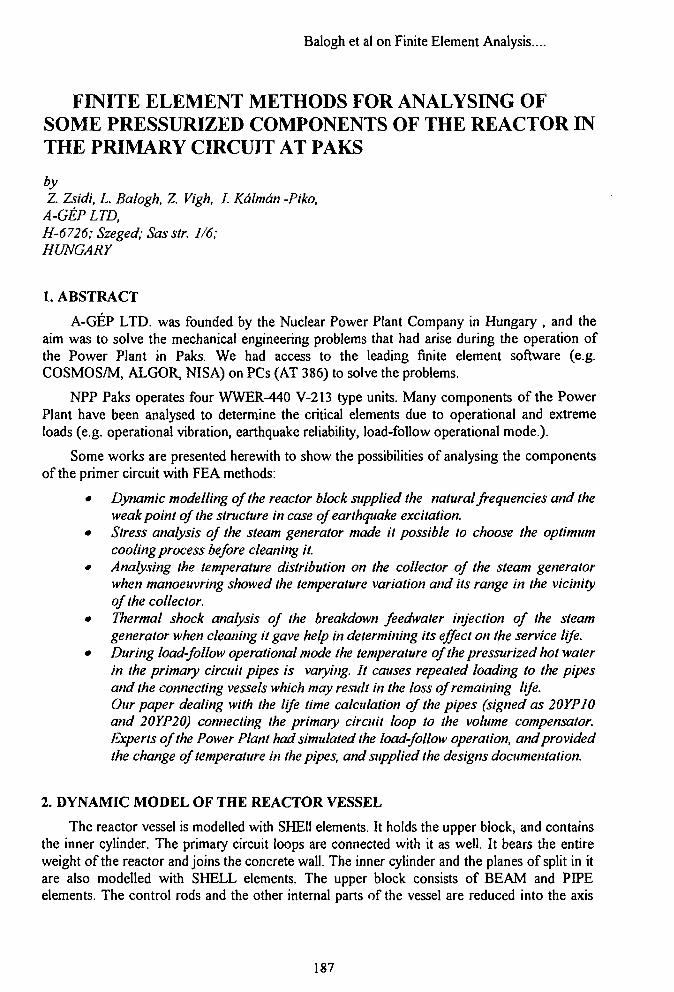
Balogh et al on Finite Element Analysis....
FINITE ELEMENT METHODS FOR ANALYSING OFSOME PRESSURIZED COMPONENTS OF THE REACTOR INTHE PRIMARY CIRCUIT AT PAKS
byZ. Zsidi, L Balogh, Z. Vigh, I. Kdlman -Piko,
A-GEPLTD,H-6726; Szeged; Sasstr. 1/6;HUNGARY
1. ABSTRACT
A-GEP LTD. was founded by the Nuclear Power Plant Company in Hungary , and theaim was to solve the mechanical engineering problems that had arise during the operation ofthe Power Plant in Paks. We had access to the leading finite element software (e.g.COSMOS/M, ALGOR, NISA) on PCs (AT 386) to solve the problems.
NPP Paks operates four WWER-440 V-213 type units. Many components of the PowerPlant have been analysed to determine the critical elements due to operational and extremeloads (e.g. operational vibration, earthquake reliability, load-follow operational mode.).
Some works are presented herewith to show the possibilities of analysing the componentsof the primer circuit with FEA methods:
• Dynamic modelling of the reactor block supplied the natural frequencies and theweak point of the structure in case of earthquake excitation.
• Stress analysis of the steam generator made it possible to choose the optimumcooling process before cleaning it.
• Analysing the temperature distribution on the collector of the steam generator•when manoeuvring showed the temperature variation and its range in the vicinityof the collector.
• Thermal shock analysis of the breakdown feedwater injection of the steamgenerator when cleaning it gave help in determining its effect on the service life.
• During load-follow operational mode the temperature of the pressurized hot waterin the primary circuit pipes is varying. It causes repeated loading to the pipesand the connecting vessels which may result in the loss of remaining life.Our paper dealing with the life time calculation of the pipes (signed as 20YPI0and 20YP20) connecting the primary circuit loop to the volume compensator.Experts of the Power Plant had simulated the load-follow operation, and providedthe change of temperature in the pipes, and supplied the designs documentation.
2. DYNAMIC MODEL OF THE REACTOR VESSEL
The reactor vessel is modelled with SHE1I elements. It holds the upper block, and containsthe inner cylinder. The primary circuit loops are connected with it as well. It bears the entireweight of the reactor and joins the concrete wall. The inner cylinder and the planes of split in itare also modelled with SHELL elements. The upper block consists of BEAM and PIPEelements. The control rods and the other internal parts of the vessel are reduced into the axis
187
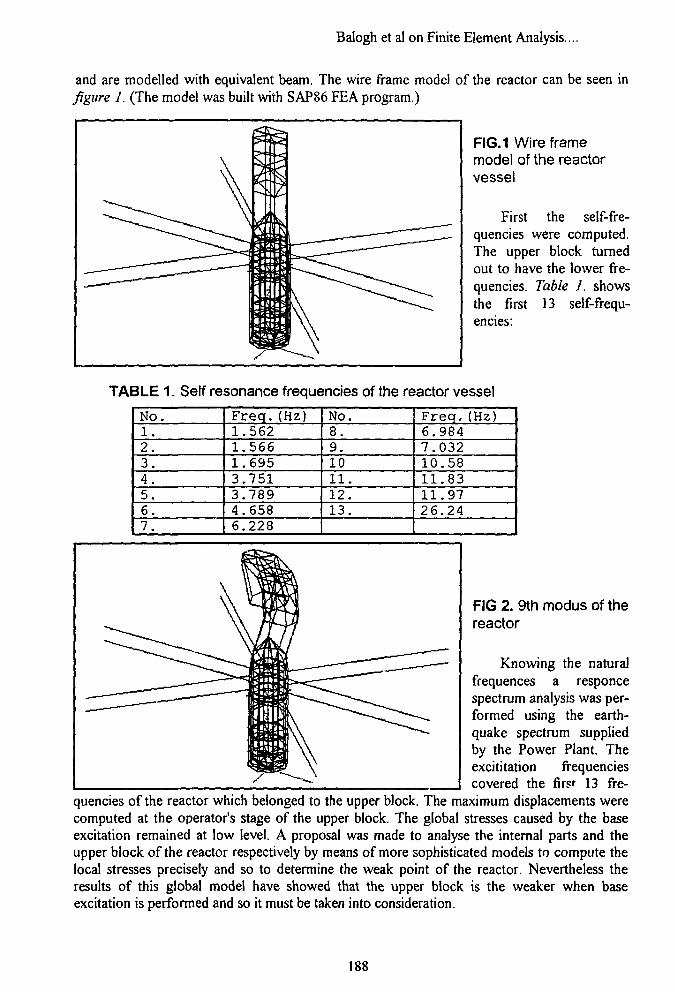
Balogh et al on Finite Element Analysis...
and are modelled with equivalent beam. The wire frame model of the reactor can be seen infigure 1. (The model was built with SAP86 FEA program.)
FIG.1 Wire framemodel of the reactorvessel
First the self-fre-quencies were computed.The upper block turnedout to have the lower fre-quencies. Table I. showsthe first 13 self-frequ-encies:
TABLE 1. Self resonance frequencies of the reactor vessel
No.1 .2 .3 .4 .5 .6 .7 .
Freq.(Hz)1.5621.5661.6953.7513.7894.6586.228
No.8.9.101 1 .12.1 3 .
Freq.(Hz)6.9847.03210.5811.8311.9726.24
FIG 2. 9th modus of thereactor
Knowing the naturalfrequences a responcespectrum analysis was per-formed using the earth-quake spectrum suppliedby the Power Plant. Theexcititation frequenciescovered the firs* 13 fre-
quencies of the reactor which belonged to the upper block. The maximum displacements werecomputed at the operator's stage of the upper block. The global stresses caused by the baseexcitation remained at low level. A proposal was made to analyse the internal parts and theupper block of the reactor respectively by means of more sophisticated models to compute thelocal stresses precisely and so to determine the weak point of the reactor. Nevertheless theresults of this global model have showed that the upper block is the weaker when baseexcitation is performed and so it must be taken into consideration.
188
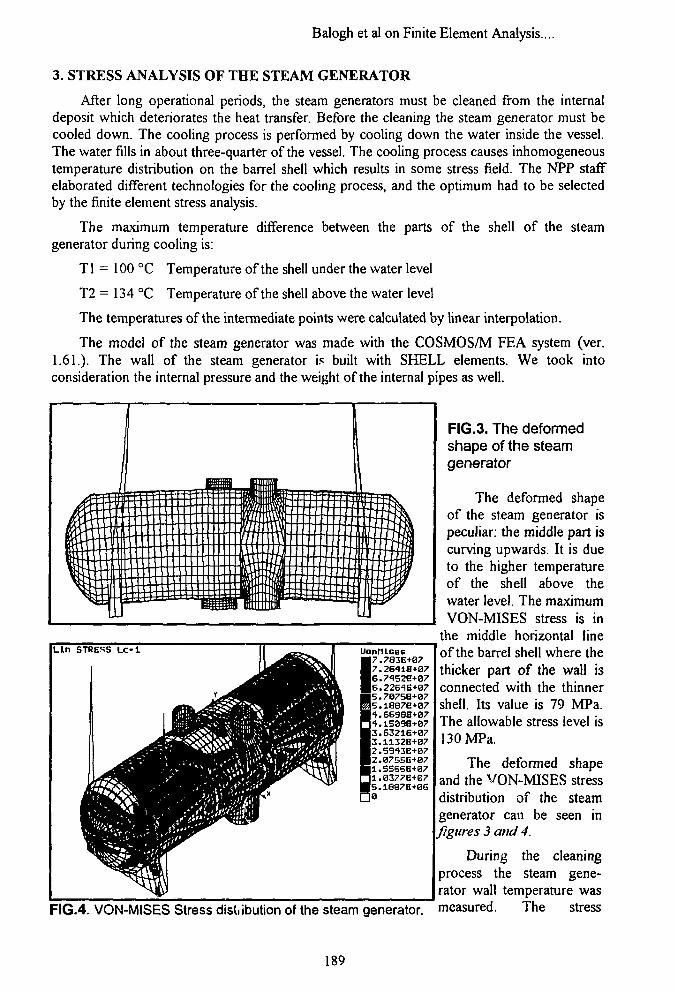
Balogh et al on Finite Element Analysis....
3. STRESS ANALYSIS OF THE STEAM GENERATOR
After long operational periods, the steam generators must be cleaned from the internaldeposit which deteriorates the heat transfer. Before the cleaning the steam generator must becooled down. The cooling process is performed by cooling down the water inside the vessel.The water fills in about three-quarter of the vessel. The cooling process causes inhomogeneoustemperature distribution on the barrel shell which results in some stress field. The NPP staffelaborated different technologies for the cooling process, and the optimum had to be selectedby the finite element stress analysis.
The maximum temperature difference between the parts of the shell of the steamgenerator during cooling is:
Tl = 100 °C Temperature of the shell under the water level
T2 = 134 °C Temperature of the shell above the water level
The temperatures of the intermediate points were calculated by linear interpolation.
The model of the steam generator was made with the COSMOS/M FEA system (ver.1.61.). The wall of the steam generator is built with SHELL elements. We took intoconsideration the internal pressure and the weight of the internal pipes as well.
FIG.3. The deformedshape of the steamgenerator
The deformed shapeof the steam generator ispeculiar: the middle part iscurving upwards. It is dueto the higher temperatureof the shell above thewater level. The maximumVON-MISES stress is in
the middle horizontal lineof the barrel shell where thethicker part of the wall isconnected with the thinnershell. Its value is 79 MPa.The allowable stress level is130 MPa.
The deformed shapeand the VON-MISES stressdistribution of the steamgenerator can be seen infigtires 3 and 4.
During the cleaningprocess the steam gene-rator wall temperature wasmeasured. The stress
Lin STRESS Lc-1 II ^ _ ^ 1 UonfUsuB^ki •7.783B+07Q ^ •6'.7^52E+07
M A •5.'7075B+07(Bra ^5.18870+07M i l •'?.669eB+07M>7 y3.6321E-t07R»f B3.1132H+07gff •2.59'»3E+07I n •2.0755E+07AAMI Hli0377B+e7^ ^ •S.1887B+8G
FIG.4. VON-MISES Stress distiibution of the steam generator.
189
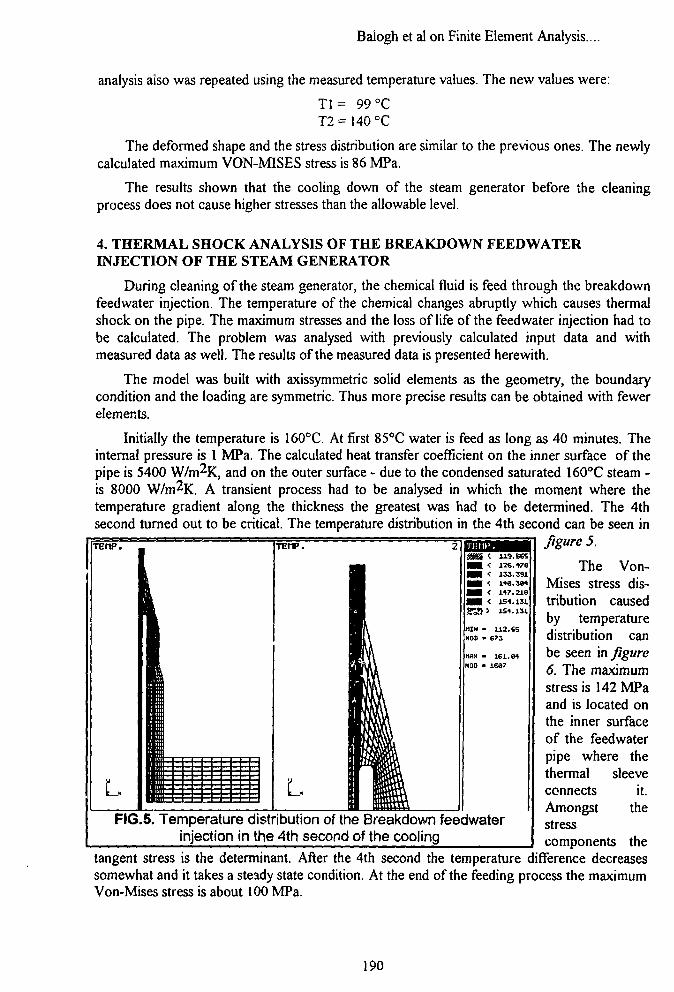
Baiogh et al on Finite Element Analysis...
analysis also was repeated using the measured temperature values. The new values were:
Tl = 99 °CT2 =140 °C
The deformed shape and the stress distribution are similar to the previous ones. The newlycalculated maximum VON-MISES stress is 86 MPa.
The results shown that the cooling down of the steam generator before the cleaningprocess does not cause higher stresses than the allowable level.
Tenp. TEfiP.
4. THERMAL SHOCK ANALYSIS OF THE BREAKDOWN FEEDWATERINJECTION OF THE STEAM GENERATOR
During cleaning of the steam generator, the chemical fluid is feed through the breakdownfeedwater injection. The temperature of the chemical changes abruptly which causes thermalshock on the pipe. The maximum stresses and the loss of life of the feedwater injection had tobe calculated. The problem was analysed with previously calculated input data and withmeasured data as well. The results of the measured data is presented herewith.
The model was built with axissymmetric solid elements as the geometry, the boundarycondition and the loading are symmetric. Thus more precise results can be obtained with fewerelements.
Initially the temperature is 160°C. At first 85°C water is feed as long as 40 minutes. Theinternal pressure is 1 MPa. The calculated heat transfer coefficient on the inner surface of thepipe is 5400 W/m^K, and on the outer surface - due to the condensed saturated 160°C steam -is 8000 W/m^K. A transient process had to be analysed in which the moment where thetemperature gradient along the thickness the greatest was had to be determined. The 4thsecond turned out to be critical. The temperature distribution in the 4th second can be seen in
figure 5.
The Von-Mises stress dis-tribution causedby temperaturedistribution canbe seen in figure6. The maximumstress is 142 MPaand is located onthe inner surfaceof the feedwaterpipe where thethermal sleeveconnects it.
Amongst thestresscomponents the
tangent stress is the determinant. After the 4th second the temperature difference decreasessomewhat and it takes a steady state condition. At the end of the feeding process the maximumVon-Mises stress is about 100 MPa.
L L
• n <sra>
117.219
154.131
1S1.131
MIH - 112.65NOD » 673
NOD '
1S1.64
16B?
FIG.5. Temperature distribution of the Breakdown feedwaterinjection in the 4th second of the cooling
190
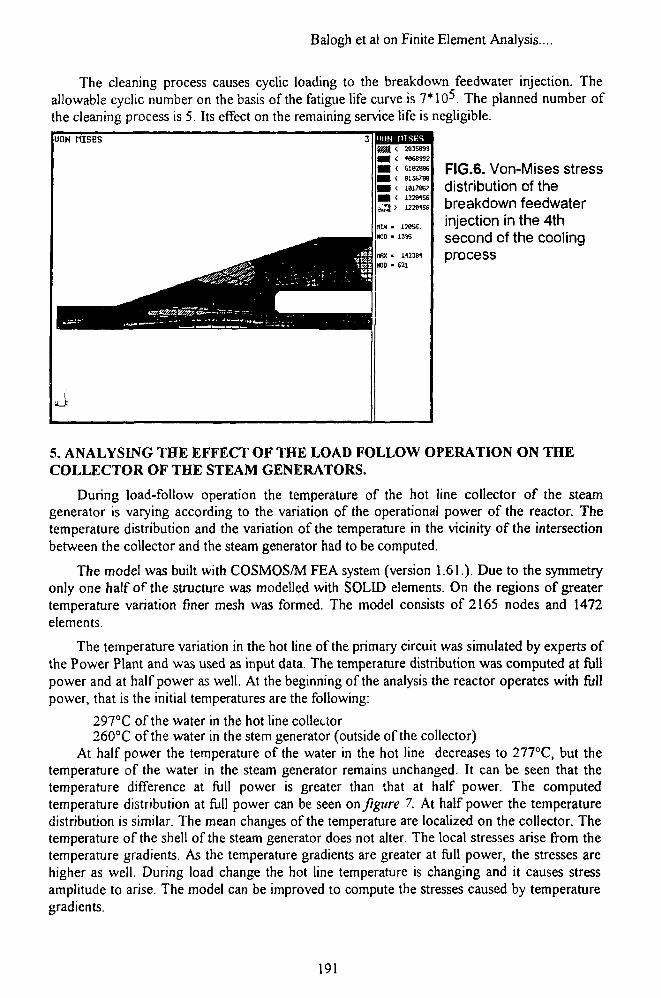
Balogh et al on Finite Element Analysis....
The cleaning process causes cyclic loading to the breakdown feedwater injection. Theallowable cyclic number on the basis of the fatigue life curve is 7*105. The planned number ofthe cleaning process is 5. Its effect on the remaining service life is negligible.
UON niSESS5899I2835899
•W689S26162886913CW1817967
1228156
FIG.6. Von-Mises stressdistribution of thebreakdown feedwaterinjection in the 4thsecond of the coolingprocess
5. ANALYSING THE EFFECT OF THE LOAD FOLLOW OPERATION ON THECOLLECTOR OF THE STEAM GENERATORS.
During load-follow operation the temperature of the hot line collector of the steamgenerator is varying according to the variation of the operational power of the reactor. Thetemperature distribution and the variation of the temperature in the vicinity of the intersectionbetween the collector and the steam generator had to be computed.
The model was built with COSMOS/M FEA system (version 1.61.). Due to the symmetryonly one half of the structure was modelled with SOLID elements. On the regions of greatertemperature variation finer mesh was formed. The model consists of 2165 nodes and 1472elements.
The temperature variation in the hot line of the primary circuit was simulated by experts ofthe Power Plant and was used as input data. The temperature distribution was computed at fullpower and at half power as well. At the beginning of the analysis the reactor operates with fullpower, that is the initial temperatures are the following:
297°C of the water in the hot line collector260°C of the water in the stem generator (outside of the collector)
At half power the temperature of the water in the hot line decreases to 277°C, but thetemperature of the water in the steam generator remains unchanged. It can be seen that thetemperature difference at full power is greater than that at half power. The computedtemperature distribution at full power can be seen on figure 7. At half power the temperaturedistribution is similar. The mean changes of the temperature are localized on the collector. Thetemperature of the shell of the steam generator does not alter. The local stresses arise from thetemperature gradients. As the temperature gradients are greater at full power, the stresses arehigher as well. During load change the hot line temperature is changing and it causes stressamplitude to arise. The model can be improved to compute the stresses caused by temperaturegradients.
191
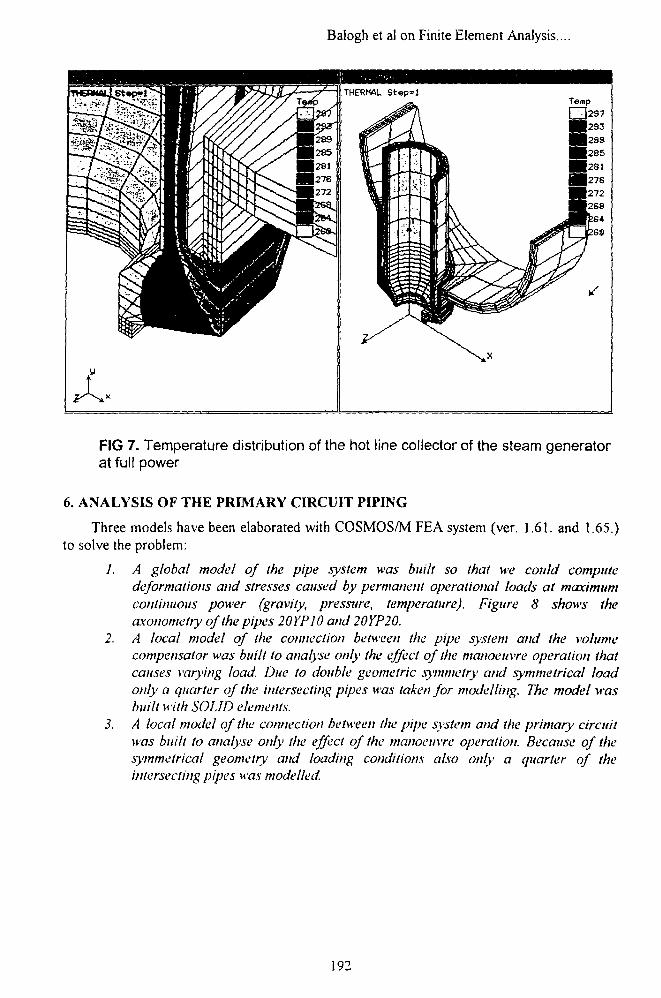
Balogh et al on Finite Element Analysis....
FIG 7. Temperature distribution of the hot line collector of the steam generatorat full power
6. ANALYSIS OF THE PRIMARY CIRCUIT PIPING
Three models have been elaborated with COSMOS/M FEA system (ver. 1.61. and 1.65.)to solve the problem:
/. A global model of the pipe system was built so that we could computedeformations and stresses caused by permanent operational loads at maximumcontinuous power (gravity, pressure, temperature). Figure 8 shows theaxonometry of the pipes 20YP10 and 20YP20.
2. A local model of (he connection betH'een the pipe system and the volumecompensator was built to analyse only the effect of the manoeuvre operation thatcauses varying load. Due to double geometric symmetry and symmetrical loadonly a quarter of the intersecting pipes was taken for modelling. The model wasbuilt with SOLID elements.
3. A local model of the connection between the pipe system and the primary circuitwas built to analyse only the effect of the manoeuvre operation. Because of thesymmetrical geometry and loading conditions also only a quarter of theintersecting pipes was modelled.
192
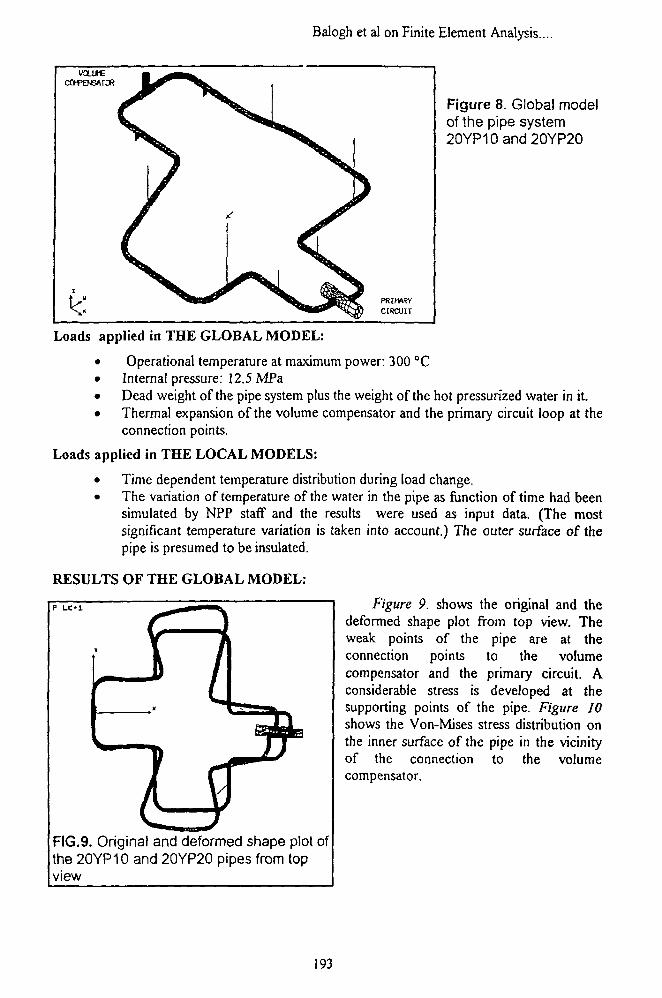
Balogh et al on Finite Element Analysis....
CIRCUIT
Figure 8. Global modelof the pipe system20YP10and20YP20
Loads applied in THE GLOBAL MODEL:
• Operational temperature at maximum power: 300 °C• Internal pressure: 12.5 MPa• Dead weight of the pipe system plus the weight of the hot pressurized water in it.• Thermal expansion of the volume compensator and the primary circuit loop at the
connection points.
Loads applied in THE LOCAL MODELS:
• Time dependent temperature distribution during load change.• The variation of temperature of the water in the pipe as function of time had been
simulated by NPP staff and the results were used as input data. (The mostsignificant temperature variation is taken into account.) The outer surface of thepipe is presumed to be insulated.
RESULTS OF THE GLOBAL MODEL:
P L C - l
FIG.9. Original and deformed shape plot ofthe 20YP10 and 20YP20 pipes from topview
Figure 9. shows the original and thedeformed shape plot from top view. Theweak points of the pipe are at theconnection points to the volumecompensator and the primary circuit. Aconsiderable stress is developed at thesupporting points of the pipe. Figure 10shows the Von-Mises stress distribution onthe inner surface of the pipe in the vicinityof the connection to the volumecompensator.
193
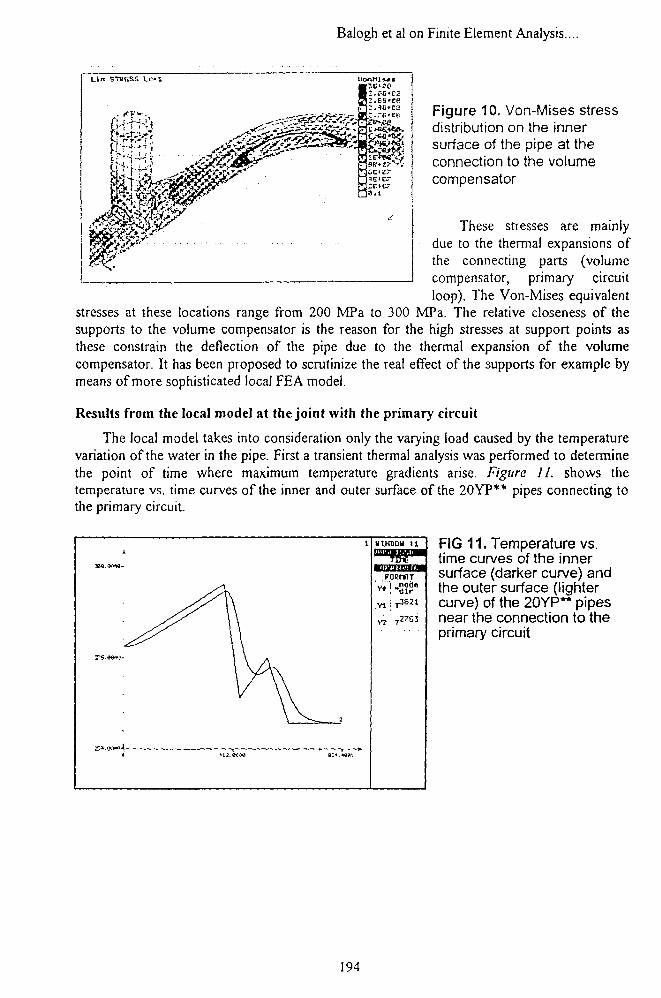
Balogh et al on Finite Element Analysis....
Lin STHHSS Lc-i
fcpJ>iFigure 10. Von-Mises stressdistribution on the innersurface of the pipe at theconnection to the volumecompensator
These stresses are mainlydue to the thermal expansions ofthe connecting parts (volumecompensator, primary circuitloop). The Von-Mises equivalent
stresses at these locations range from 200 MPa to 300 MPa. The relative closeness of thesupports to the volume compensator is the reason for the high stresses at support points asthese constrain the deflection of the pipe due to the thermal expansion of the volumecompensator. It has been proposed to scrutinize the real effect of the supports for example bymeans of more sophisticated local FEA model.
Results from the local model at the joint with the primary circuit
The local model takes into consideration only the varying load caused by the temperaturevariation of the water in the pipe. First a transient thermal analysis was performed to determinethe point of time where maximum temperature gradients arise. Figure II. shows thetemperature vs. time curves of the inner and outer surface of the 20YP** pipes connecting tothe primary circuit.
WINDOW 11
FORHflT
!
FIG 11. Temperature vs.time curves of the innersurface (darker curve) andthe outer surface (lightercurve) of the 20YP** pipesnear the connection to theprimary circuit
194
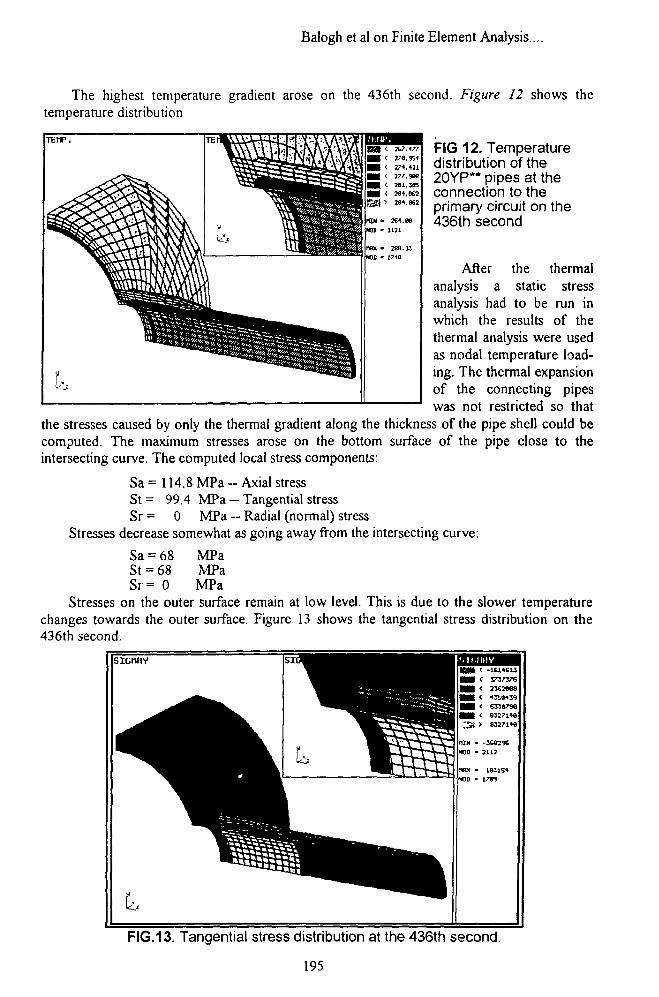
Balogh et al on Finite Element Analysis....
The highest temperature gradient arose on the 436th second. Figure 12 shows thetemperature distribution
TEHP.
1
VVV\\
V^ N S S H B M M I M I
uSmmMm•ii0MM^
ZSH < 2E7.477M l < V*. 9S4M l < 274.431H I < 277. weH I < 201.38SMl < 294.ee?• g S i 281.962
ntw > 2Si.eeKID ' 1121
nRX • 288.53MOD • 17*8
FIG 12. Temperaturedistribution of the20YP** pipes at theconnection to theprimary circuit on the436th second
After the thermalanalysis a static stressanalysis had to be run inwhich the results of thethermal analysis were usedas nodal temperature load-ing. The thermal expansionof the connecting pipeswas not restricted so that
the stresses caused by only the thermal gradient along the thickness of the pipe shell could becomputed. The maximum stresses arose on the bottom surface of the pipe close to theintersecting curve. The computed local stress components:
Sa = 114.8 MPa - Axial stressSt = 99.4 MPa — Tangential stressSr = 0 MPa — Radial (normal) stress
Stresses decrease somewhat as going away from the intersecting curve:
Sa = 68 MPaSt = 68 MPaSr= 0 MPa
Stresses on the outer surface remain at low level. This is due to the slower temperaturechanges towards the outer surface. Figure 13 shows the tangential stress distribution on the436th second.
SIGfiHV
^ - ^ ^ ^ ^ ^ ^^ ^ ^ ^ ^ ^ ^
" ^ ^ ^ ^ ^ ^ ^
^ ^ ^ ^ ^ ^ ^ ^ ^ ^ ^ ^ ^ ^ ^ ^ ^ ^ ^ ^ ^ ^ ^ ^ ^ ^ • I H H I ^ 3737376
VMWMH^KSAVAMU1 1^ ' """*>M S ^ M B M B S ^ H E 8 9 ! S H MH < «K*>39W B ^ l B l ^ ^ H < E33H7W
^ V B H M | I H < B327148"5i > 8327148
TON - -16*296NOD - 2112
t«W • 1831S4MOD • ITW
FIG. 13. Tangential stress distribution at the 436th second.
195
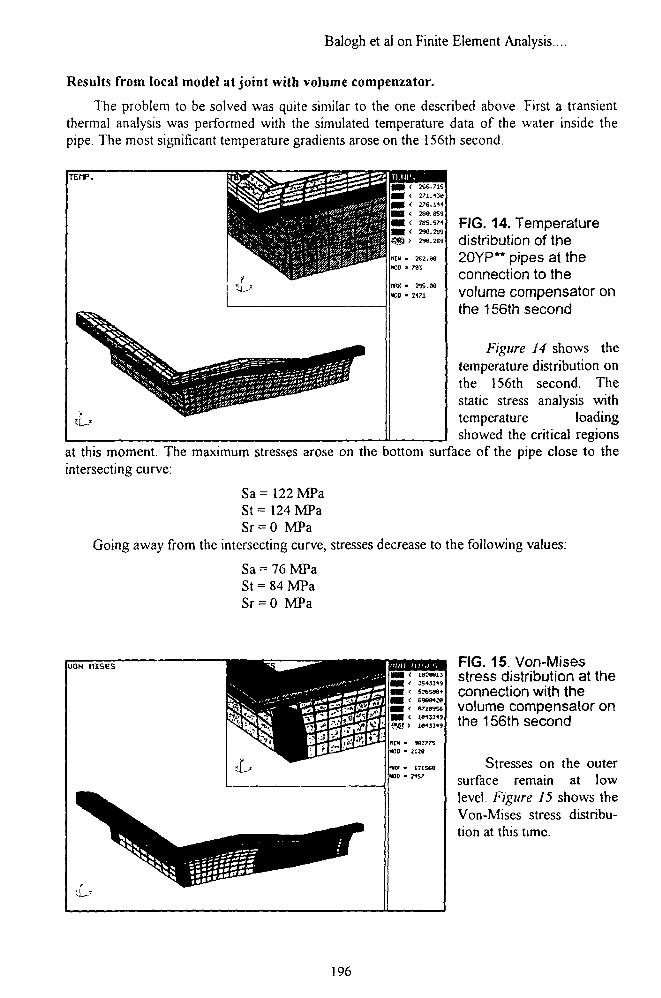
Balogh et al on Finite Element Analysis....
Results from local model at joint with volume compenzator.
The problem to be solved was quite similar to the one described above. First a transientthermal analysis was performed with the simulated temperature data of the water inside thepipe. The most significant temperature gradients arose on the 156th second.
FIG. 14. Temperaturedistribution of the20YP** pipes at theconnection to thevolume compensator onthe 156th second
Figure 14 shows thetemperature distribution onthe 156th second. Thestatic stress analysis withtemperature loadingshowed the critical regions
at this moment. The maximum stresses arose on the bottom surface of the pipe close to theintersecting curve:
Sa= 122 MPaSt= 124 MPaSr = O MPa
Going away from the intersecting curve, stresses decrease to the following values:
Sa = 76 MPaSt = 84 MPaSr = O MPa
UON M S EG
• • < £9994^9• • < 8719956
HIM • 99277SNOD - J1W
rv« • i?iseeNOD - T iV
FIG. 15. Von-Misesstress distribution at theconnection with thevolume compensator onthe 156th second
Stresses on the outersurface remain at lowlevel. Figure 15 shows theVon-Mises stress distribu-tion at this time.
196
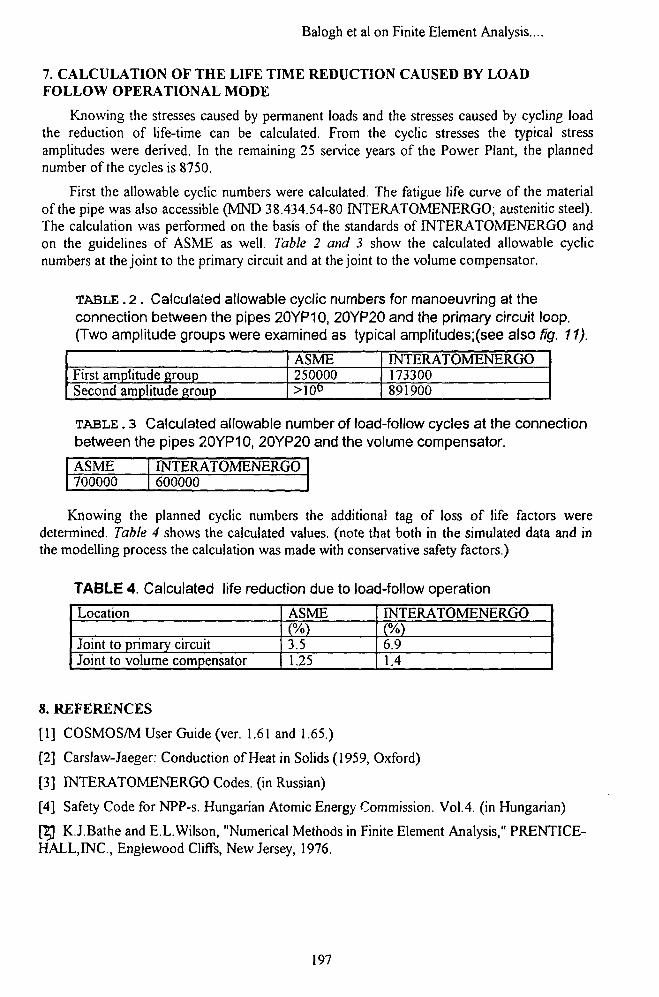
Balogh et al on Finite Element Analysis....
7. CALCULATION OF THE LIFE TIME REDUCTION CAUSED BY LOADFOLLOW OPERATIONAL MODE
Knowing the stresses caused by permanent loads and the stresses caused by cycling loadthe reduction of life-time can be calculated. From the cyclic stresses the typical stressamplitudes were derived. In the remaining 25 service years of the Power Plant, the plannednumber of the cycles is 8750.
First the allowable cyclic numbers were calculated. The fatigue life curve of the materialof the pipe was also accessible (MND 38.434.54-80 INTERATOMENERGO; austenitic steel).The calculation was performed on the basis of the standards of INTERATOMENERGO andon the guidelines of ASME as well. Table 2 and 3 show the calculated allowable cyclicnumbers at the joint to the primary circuit and at the joint to the volume compensator.
TABLE . 2 . Calculated allowable cyclic numbers for manoeuvring at theconnection between the pipes 20YP10, 20YP20 and the primary circuit loop.(Two amplitude groups were examined as typical amplitudes;(see also fig. 11).
First amplitude groupSecond amplitude group
ASME250000>io°
INTERATOMENERGO173300891900
TABLE . 3 Calculated allowable number of load-follow cycles at the connectionbetween the pipes 20YP10, 20YP20 and the volume compensator.
ASME700000
INTERATOMENERGO600000
Knowing the planned cyclic numbers the additional tag of loss of life factors weredetermined. Table 4 shows the calculated values, (note that both in the simulated data and inthe modelling process the calculation was made with conservative safety factors.)
TABLE 4. Calculated life reduction due to load-follow operation
Location
Joint to_primary circuitJoint to volume compensator
ASME(%)3.51.25
INTERATOMENERGO(%)6.91.4
8. REFERENCES
[1] COSMOS/M User Guide (ver. 1.61 and 1.65.)
[2] Carslaw-Jaeger: Conduction of Heat in Solids (1959, Oxford)
[3] INTERATOMENERGO Codes, (in Russian)
[4] Safety Code for NPP-s. Hungarian Atomic Energy Commission. Vol.4, (in Hungarian)
fjg K.J.Bathe and E.L.Wilson, "Numerical Methods in Finite Element Analysis," PRENTICE-HALL.INC, Englewood Cliffs, New Jersey, 1976.
197
Pammer on Nozzle Analysis....
Analysis of reactor pressure vessel nozzle cracks subjected tocyclic pressure and transient thermal stress loads using the p-extended finite element system PEXFE-3D
ZOLTANPAMMER, GABOR SZABOLCSPaB Company Ltd.H- 1115 Budapest, Somogyi u. 28/A
ABSTRACT
This paper presents a WWER 440 reactor vessel nozzle crack analysis. The main purposeof the analysis was to estimate the safety against two different failure modes as a function ofthe postulated crack depth: 1) brittle fracture; 2) fatigue crack growth. Besides internalpressure load, the structure was subjected to transient thermal effect due to prevention of thehigh pressure emergency cooling system.
The problem was solved using a p-extended finite element software called PEXFE-3Dspecially designed to the requirements in reliability for the analysis of nuclear power plantcomponents. All computed quantities (heat flux, temperatures, stresses, strain energy, stressintensity factors, etc.) are validated by error estimations.
Keywords
Reactor nozzle cracks, heat transfer, fracture mechanics, finite element method, p-version,stress analysis
1. INTRODUCTION
The cold inlet nozzle (ID 500 mm) to the WWER-440 reactor pressure vessel is one ofthe most important part that can influence the lifetime of the primary cooling system. Besidescomparatively high stress concentration under internal pressure load, the prevention of the highpressure emergency cooling system can generate considerable thermal stresses.
A recent finite element analysis [1] aimed to determine the stress field in the nozzle-to-vessel intersection area due to hydrostatic test pressure load. Comparison of the computedpeak stress data to experimental results showed good agreement (3 % difference only).
A test problem 'Surface crack in a cladded steel brick subjected to thermal shockconditions' was also solved to compare the finite element solution to the analytical result [2].The difference was within 1 % in the stress intensity factor computation.
The above-mentioned results were obtained by the p-extended finite element softwarePEXFE-3D. Special technology, called 'p-extension' provides this system the capability toestimate the modelling and approximation error in those usual cases, when there are no othersources to compare the results with. Reference [3] provides more details about p-extension.This paper presents a nozzle crack propagation analysis due to cyclic pressure load and due tothe transient effect of the high pressure emergency cooling system, using PEXFE-3D. Thecrack is postulated at the inner fillet of the vessel-nozzle junction.
198
.Pammer on Nozzle Analysis....
2. THERMAL CONDITIONS DURING THE TRANSIENT PERIOD
The effect of the high pressure emergency cooling system (HPCS) injects cold water(30 °C) to the cold leg of the primary circuit that was initially at the temperature of 265°C.The injection to the main pipe (ED 500 mm) is located approx. at a distance of 3 m from thepressure vessel nozzle. The cold water, flowing to the vessel nozzle, suddenly cools down thisregion.
Fluid flow conditions could be considerably different, first of all, because of differentratios of mass flows. Mass flow rate of the cold high pressure injection (HPI) water isapproximately 10 kg/s. However, mass flow rate in the cold leg of the primary circuit can bedifferent when the HPCS is activated. Therefore we distinguished two extreme conditions.
2.1. Stagnant loop flow (JET SEPARATION)
The stagnant loop flow condition is the limiting case for overcooling transient in a PWRsince it gives the highest rate of overcooling. When the primary loop flow is at (or nearly at) astagnant condition, the cold HPI water settles down to the bottom of the cold leg forming astratified layer. For this process, we evaluated the temperature distribution of the fluiddiscussed in the report of B. K. H. Sun et al. [4], which is based on existing data from mixingtests at EPRI/CREARE and EPRI/SAI facilities. The most important governing parameters forthe phenomena are the HPI jet Froude number and the Froude number for the cold legchannel.
2.2. Perfect mixing (MIXED JET)
The primary mass flow rate in the cold leg amounts to 20 kg/s. The temperature of themixed flow near to the nozzle is determined by the ratio of loop flow to HPI flow. Theevaluated mixed - mean temperature is 187 °C in good agreement with the measured value.
3. POSTULATED CRACK PROPAGATION
3.1. The crack is initiated at the inner fillet of the nozzle, where the internal pressurecauses the highest stress concentration.
3. 2. The shape of the crack is nearly semi-elliptic (surface crack), the ratio of theminor/major axis:
3.3. The crack propagation path was designed to hold the following conditions :
3.3.1. The crack should propagate towards to the most intensively cooled area.
3.3.2. The crack assumed to reach the stage marked by 'Max.* in Figure I. which is thesmallest flaw that causes leakage and satisfies the previous conditions as well.
The crack is assumed to go through the stages denoted by A, B and C in Fig. 1. Threefinite element geometrical models were built to include one of the crack stages in the nozzleintersection area. These geometrical models are simply identified by the letters A, B and C inthe following text.
199
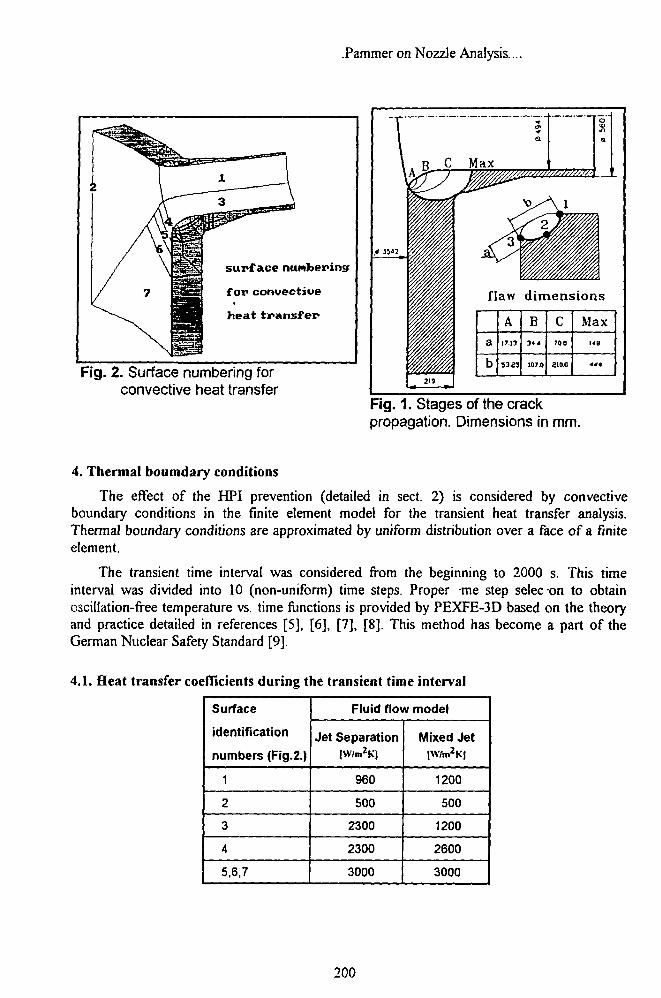
.Pammer on Nozzle Analysis....
•
A/ 7
^ H surface numbering
JJScg| for convective
JB9 heat transfer
Fig. 2. Surface numbering forconvective heat transfer
flaw dimensions
a
b
A1713
5325
B34 4
107.0
c700
2100
Max148
Fig. 1. Stages of the crackpropagation. Dimensions in mm.
4. Thermal boumdary conditions
The effect of the HPI prevention (detailed in sect. 2) is considered by convectiveboundary conditions in the finite element model for the transient heat transfer analysis.Thermal boundary conditions are approximated by uniform distribution over a face of a finiteelement.
The transient time interval was considered from the beginning to 2000 s. This timeinterval was divided into 10 (non-uniform) time steps. Proper me step selecon to obtainoscillation-free temperature vs. time functions is provided by PEXFE-3D based on the theoryand practice detailed in references [5], [6], [7], [8]. This method has become a part of theGerman Nuclear Safety Standard [9].
4.1. Heat transfer coefficients during the transient time interval
Surface
identification
numbers (Fig.2.)
1
2
3
4
5,6,7
Fluid flow model
Jet Separation|\V/ni2K)
960
500
2300
2300
3000
Mixed Jetrtt7m2K|
1200
500
1200
2600
3000
200
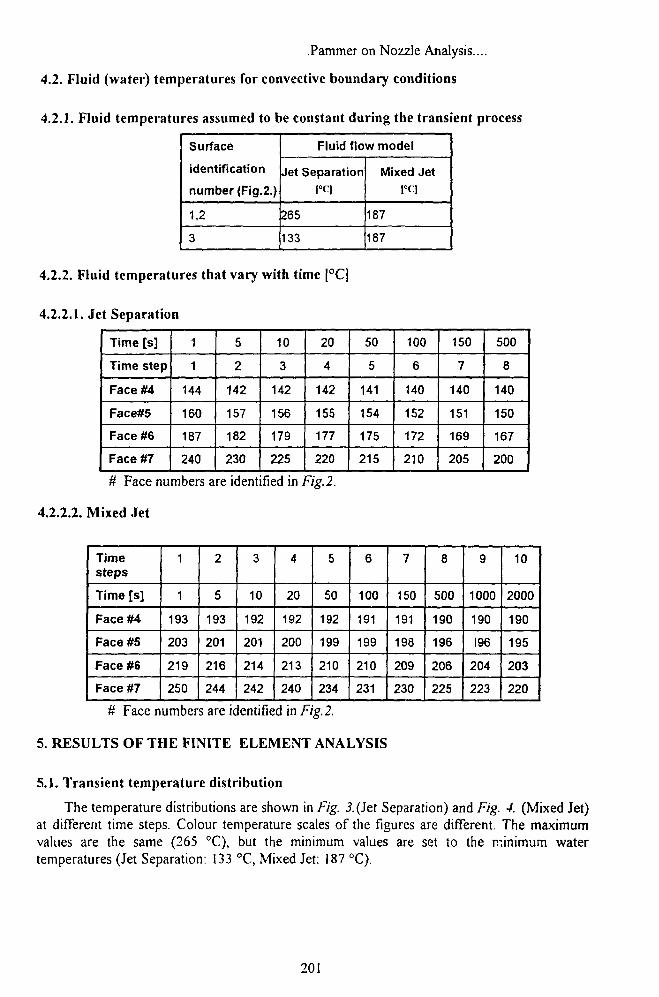
.Pammer on Nozzle Analysis....
4.2. Fluid (water) temperatures for convective boundary conditions
4.2.1. Fluid temperatures assumed to be constant during the transient process
Surface
identification
number (Fig.2.)
1,2
3
Fluid flow model
Jet SeparationI°C)
265
133
Mixed Jet
187
187
4.2.2. Fluid temperatures that vary with time [°C]
4.2.2.1. Jet Separation
Time [s]
Time step
Face U
Face#5
Face #6
Face #7
1
1
144
160
187
240
5
2
142
157
182
230
10
3
142
156
179
225
20
4
142
155
177
220
50
5
141
154
175
215
100
6
140
152
172
210
150
7
140
151
169
205
500
8
140
150
167
200
# Face numbers are identified in Fig.2.
4.2.2.2. Mixed Jet
Timesteps
Time [s]
Face #4
Face #5
Face #6
Face #7
1
1
193
203
219
250
2
5
193
201
216
244
3
10
192
201
214
242
4
20
192
200
213
240
5
50
192
199
210
234
6
100
191
199
210
231
7
150
191
198
209
230
8
500
190
196
206
225
9
1000
190
I96
204
223
10
2000
190
195
203
220
# Face numbers are identified in Fig.2.
5. RESULTS OF THE FINITE ELEMENT ANALYSIS
5.1. Transient temperature distribution
The temperature distributions are shown in Fig. i.(Jet Separation) and Fig. -/. (Mixed Jet)at different time steps. Colour temperature scales of the figures are different. The maximumvalues are the same (265 °C), but the minimum values are set to the minimum watertemperatures (Jet Separation: 133 °C, Mixed Jet: 187 °C).
201
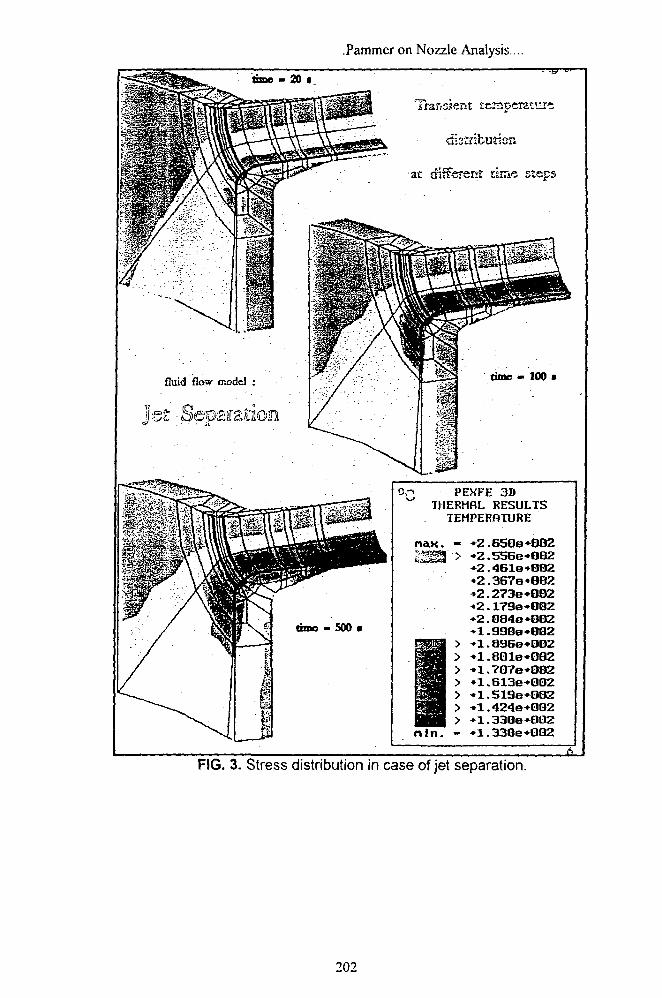
.Pammer on Nozzle Analysis...
tone • 20 •
Transient Jeir
distribution
at different tinve steps
time - 100 •
or- PEXFE 3D*"* TMERMflL RESULTS
TEMPERATURE
n a x . —
HHH >
I^^B >i^sl >IHB nln. -
• 2 . 6 5 0 B * 0 B 2•2.556e*OQ2+2.461e*O02•2.367e*802*2.273e*002
+2.084e*G02* 1 . 9 9 0 B * 0 Q 2+1.896e*OD2•1.8Qle*002•1.7O7e*OO2•1.613e*002•»1.519e*OO2•1.424e*0Q2*1.330e*802*1.330e*0Q2
FIG. 3. Stress distribution in case of jet separation.
202
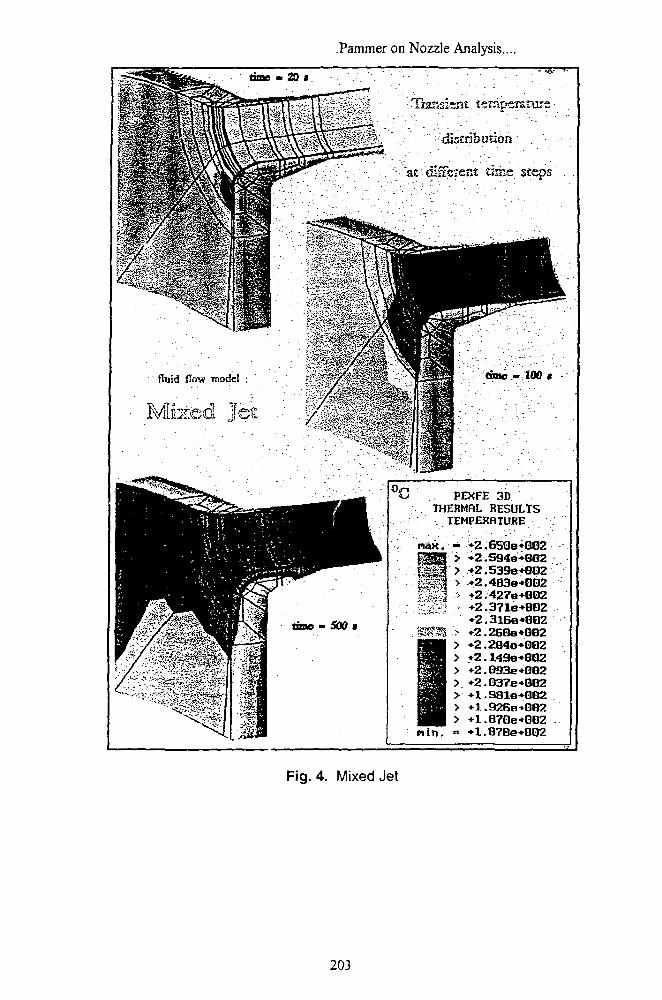
.Pammer on Nozzle Analysis....
time - 20 *
snt temperature
• • ' • • d i s m b u t i o n ' '. •"•
ac :• different thse steps
fluid flow model :
Mixed Jet
Of* PEXFE 3DTHERMAL RESULTS
TEMPEKflTURE
nax. - •Z.6S0e/»OO2> •2.594e*802> +2.539e*8O2> *2.483e*002•2.427e*Q02•2.371e*802+2.3lBe+0Q2
1 ^ .\'iS-i^- •'
nin.
+2.284e*0Q2*2.l49e*8Q2•2.Q93e+002•2.037e*B02•1.981e*002•1.926B+QO2•1.87Qe*G02+1.87Qe*002
Fig. 4. Mixed Jet
203
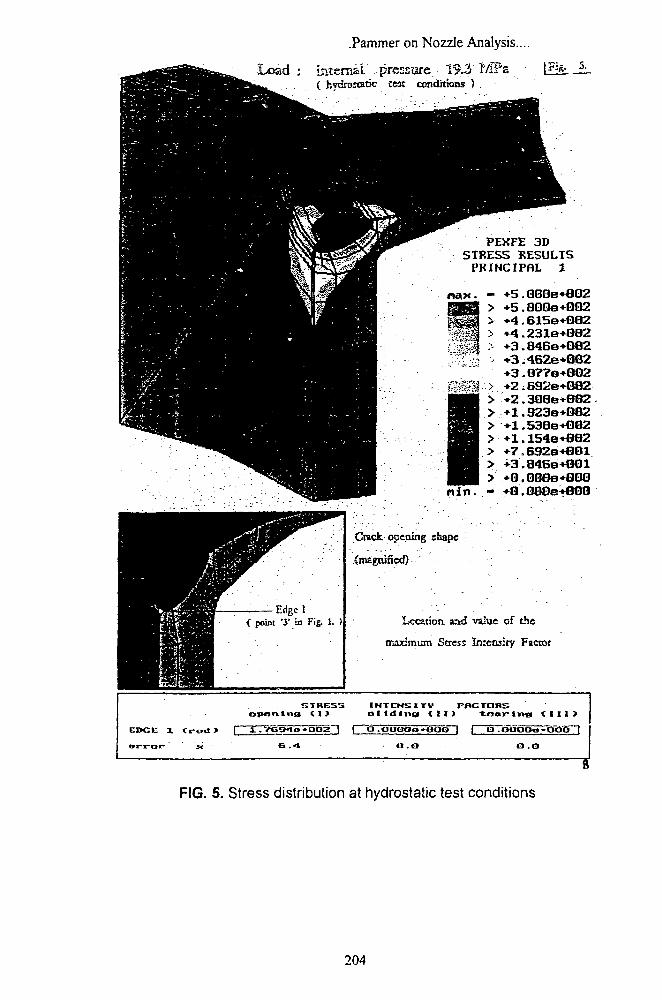
.Pammer on Nozzle Analysis.
Load : internal -pressure 19,3 MPs( hydrostatic jest conditions )
PEXFE 3DSTRESS JRESULTSPRINCIPflL 1
- •5.QQGe*002•5.808e*882•4.615e*8B2•4.231e*8B2•3.846e+Q82•3.462e*882
•2.692e+082•2.308e+O02•1.923e*082+1.53Be+882
> *1.154e*082>?.692e+8Bl
^ ^ •8.888o*B88nin. - •8.000e+B8Q
Crack opening shape
{magnified)
Lccation aad value of the
maximum Sacss Intensity Factor
openingSTRESS
(UIMTCNSITV PACTnilSo l l d l n a t i l l t n a r l n o ( 1 1 1 )
EDGE X <r-o<l> | O • CBUOo »OOO~1
a .o
FIG. 5. Stress distribution at hydrostatic test conditions
204
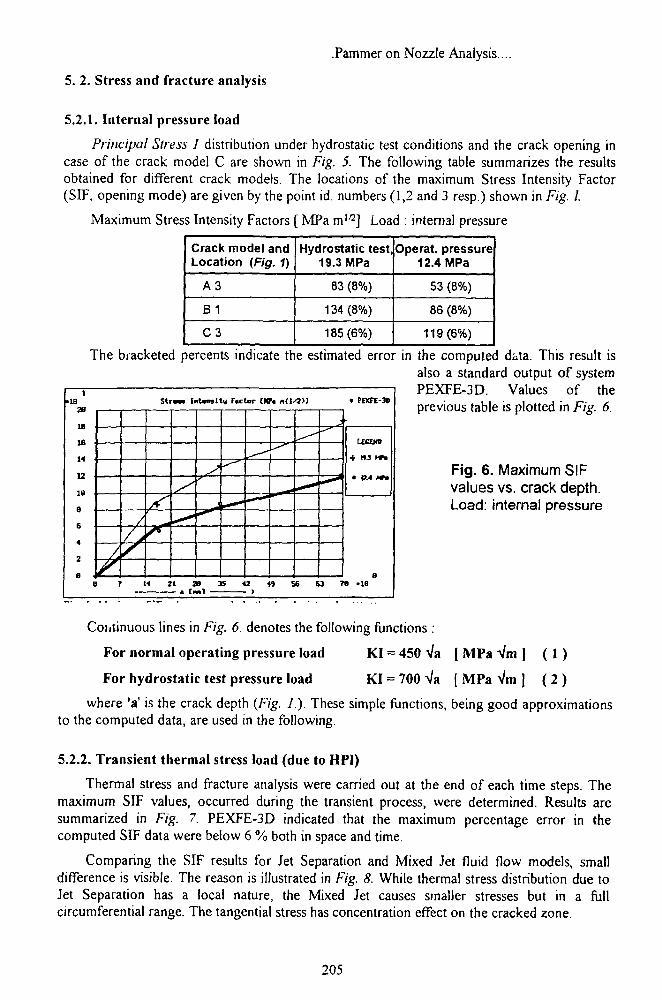
.Pammer on Nozzle Analysis.
5. 2. Stress and fracture analysis
5.2.1. Internal pressure load
Principal Stress 1 distribution under hydrostatic test conditions and the crack opening incase of the crack model C are shown in Fig. 5. The following table summarizes the resultsobtained for different crack models. The locations of the maximum Stress Intensity Factor(SIF, opening mode) are given by the point id. numbers (1,2 and 3 resp.) shown in Fig. I.
Maximum Stress Intensity Factors [ MPa min] Load : internal pressure
Crack model andLocation (Fig. 1)
A 3
B1
C 3
Hydrostatic test,19.3 MPa
83 (8%)
134(8%)
185(6%)
Operat. pressure12.4 MPa
53 (8%)
86 (8%)
119(6%)
The bracketed percents indicate the estimated error in the computed data. This result isalso a standard output of systemPEXFE-3D. Values of theprevious table is plotted in Fig. 6.
Fig. 6. Maximum SIFvalues vs. crack depth.Load: internal pressure
1•la
is
18
14
12
IS
e6
4
2
8
Straai tnUmlty Factor CKN ntl/2H
A
/
A+**
i S ^"
.—-
* PEXFI-3D
UCENB
+ »3 MTa
< B.4 HP*
7 14 21 3B 35 42 49 S6 S3 TS >18_ f *M|1 J
Coiitinuous lines in Fig. 6. denotes the following functions :
For normal operating pressure load KI = 450 Va [ MPa Vm ] ( 1 )
For hydrostatic test pressure load KI = 700 Va [ MPa Vm 1 ( 2 )
where 'a' is the crack depth (Fig. J.). These simple functions, being good approximationsto the computed data, are used in the following.
5.2.2. Transient thermal stress load (due to HPI)
Thermal stress and fracture analysis were carried out at the end of each time steps. Themaximum SIF values, occurred during the transient process, were determined. Results aresummarized in Fig. 7. PEXFE-3D indicated that the maximum percentage error in thecomputed SIF data were below 6 % both in space and time.
Comparing the SIF results for Jet Separation and Mixed Jet fluid flow models, smalldifference is visible. The reason is illustrated in Fig. 8. While thermal stress distribution due toJet Separation has a local nature, the Mixed Jet causes smaller stresses but in a fullcircumferential range. The tangential stress has concentration effect on the cracked zone.
205
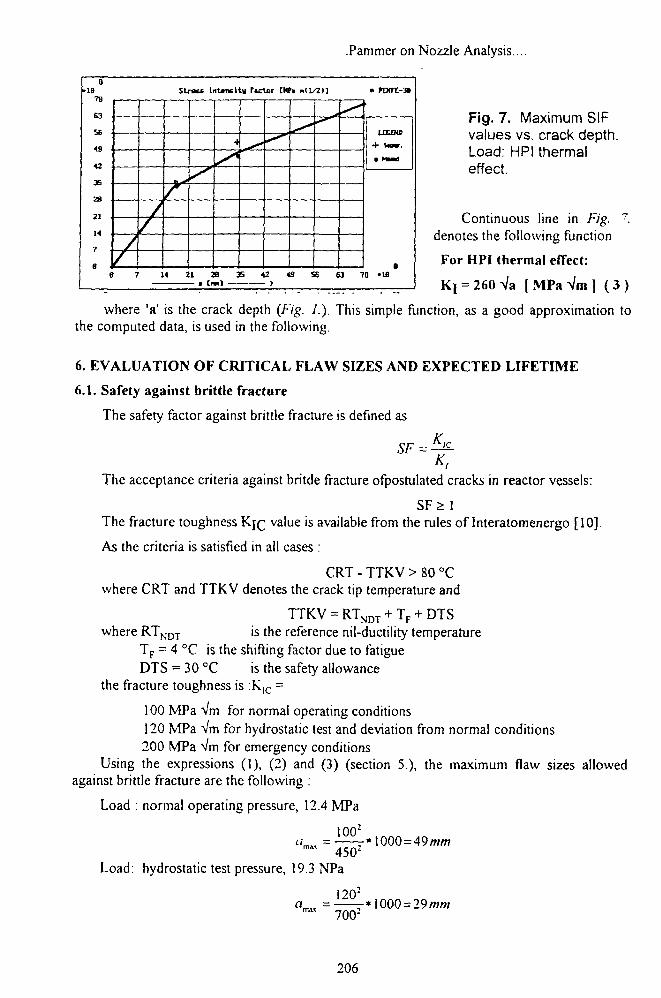
.Pammer on Nozzle Analysis...
s• 18
TO
63
SE
49
42
36
29
21
8 •e
Struct lirtawitu Tkdm CMPi n<l/2)]
7
LZ
14 21 28 35 A>2 43 S6 6J 7
LECOtS
+ MHT.
a HMd
Fig. 7. Maximum SIFvalues vs. crack depth.Load: HPI thermaleffect.
Continuous line in Fig. ~.denotes the following function
For HPI thermal effect:
Kt = 260 Va ( MPa Vm ] ( 3 )
where 'a' is the crack depth (Fig. L). This simple function, as a good approximation tothe computed data, is used in the following.
6. EVALUATION OF CRITICAL FLAW SIZES AND EXPECTED LIFETIME
6.1. Safety against brittle fracture
The safety factor against brittle fracture is defined as
The acceptance criteria against britde fracture ofpostulated cracks in reactor vessels:
SF> 1The fracture toughness Kjrj value is available from the rules of Interatomenergo [10],
As the criteria is satisfied in all cases :
CRT - TTKV > 80 °Cwhere CRT and TTKV denotes the crack tip temperature and
TTKV = RTNDT + TF + DTSwhere RTNDT is the reference nil-ductility temperature
TF = 4 °C is the shifting factor due to fatigueDTS = 30°C is the safety allowance
the fracture toughness is :K,C =
100 MPa Vm for normal operating conditions120 MPa Vm for hydrostatic test and deviation from normal conditions200 MPa Vm for emergency conditions
Using the expressions (1), (2) and (3) (section 5.), the maximum flaw sizes allowedagainst brittle fracture are the following :
Load : normal operating pressure, 12.4 MPa
1003
™ 450!
Load: hydrostatic test pressure, 19.3 NPa
_ 120-a™ " 7002
206
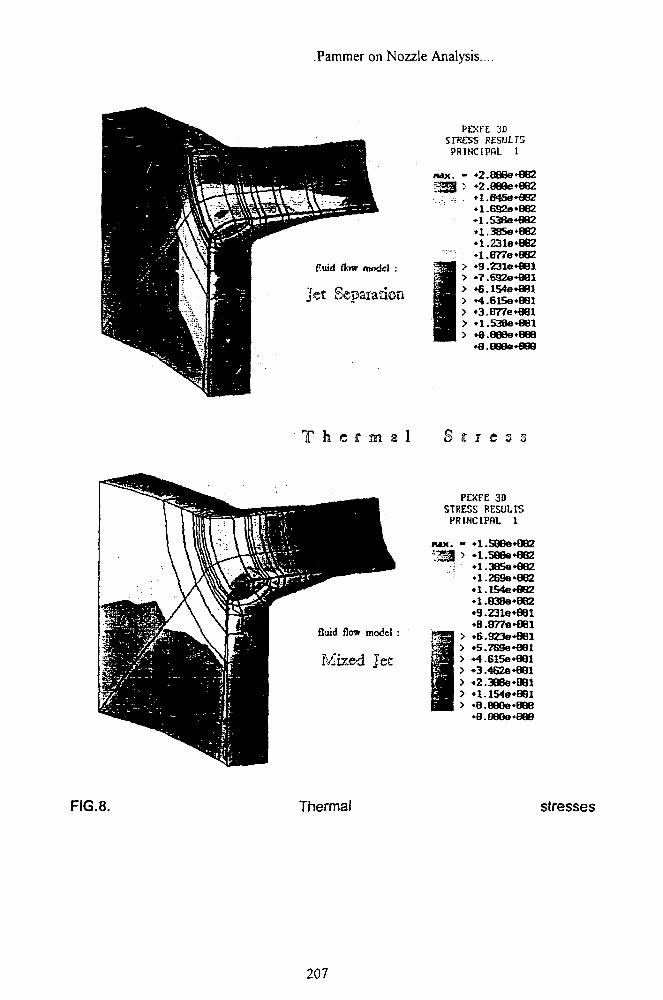
.Pammer on Nozzle Analysis...
3DSTRESS RESULTSPRINCIFfil 1
no*. - •2.888e««2•2.880e*982
Euid fknr model :
jet Sepaiation
•1.692e»B62•1.538e*882•1.38Se»862•1.2318*862•1.877e*9B2•9.231e*881
•4.615e»BBl•3.BV7e*981•l.S38e*a81
T h c f sn a ! S
PEXFE 30STRESS RESULTS
FRINClFfU. 1
MX. - •l.S06e*082" ^ 5 •1.5808*882
: •1.38So*862
fluid flow model :
Mked Jet
FIG.8. Thermal stresses
207
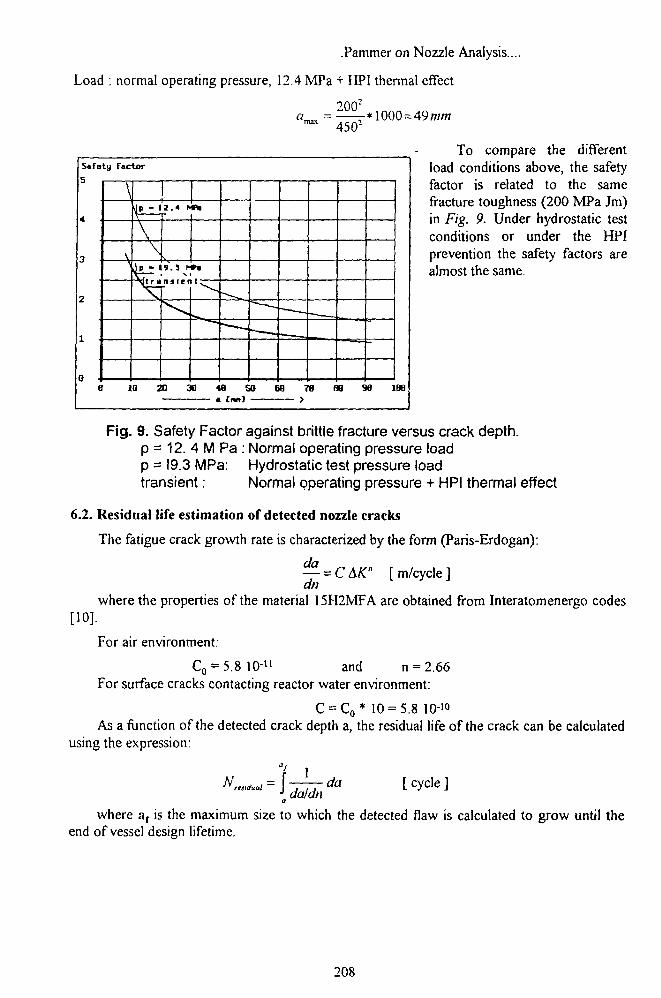
.Pammer on Nozzle Analysis...
Load : normal operating pressure, 12.4 MPa + HPI thermal effect
200"o_._ = r* 1000 = 49 mm
4502
Safety Factor5
\
Jp - 1
\
2.4 t>
Jp - 19. 3 MN
* —
- — -
• —
— - — .
;
ia 2 0 3 0 * 9 5 0 6 8 7 8« [ m l >
0 6 9 8
To compare the differentload conditions above, the safetyfactor is related to the samefracture toughness (200 MPa Jm)in Fig. 9. Under hydrostatic testconditions or under the HPIprevention the safety factors arealmost the same.
Fig. 9. Safety Factor against brittle fracture versus crack depth,p = 12. 4 M Pa : Normal operating pressure loadp = I9.3 MPa: Hydrostatic test pressure loadtransient: Normal operating pressure + HPI thermal effect
6.2. Residual life estimation of detected nozzle cracks
The fatigue crack growth rate is characterized by the form (Paris-Erdogan):
da
dn= CAK" [m/cycle]
where the properties of the material 15H2MFA are obtained from Interatomenergo codes
[10].
For air environment:
C0 = 5.8 10-" and n = 2.66For surface cracks contacting reactor water environment:
C = C0* 10 = 5.8 10-10
As a function of the detected crack depth a, the residual life of the crack can be calculatedusing the expression:
N Ji
fJ daldn
da [ cycle ]
where ar is the maximum size to which the detected flaw is calculated to grow until theend of vessel design lifetime.
208
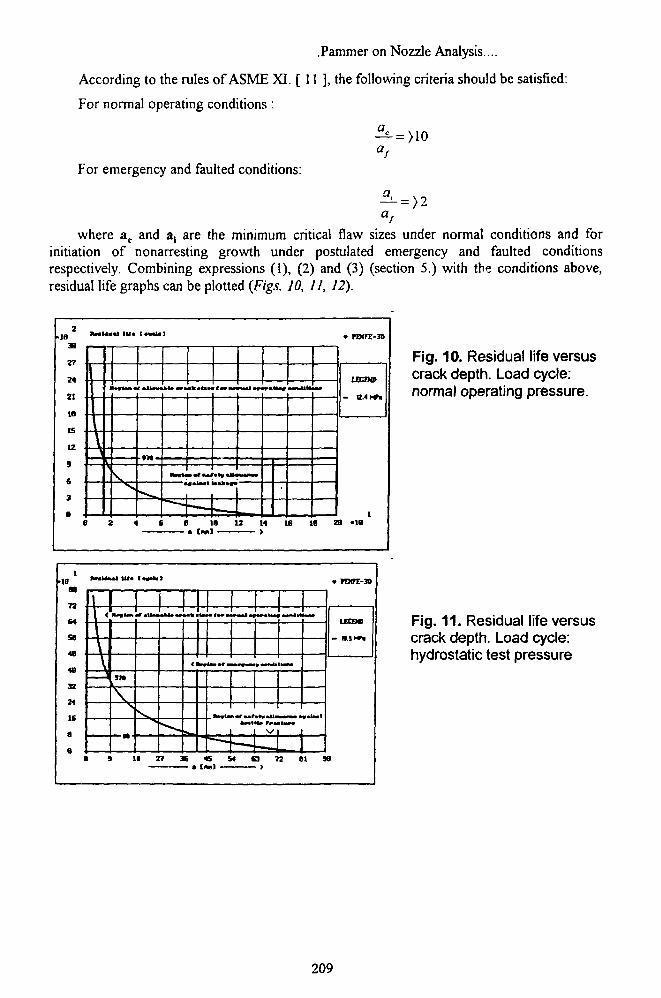
.Pammer on Nozzle Analysis...
According to the rules of ASME XI. [ 11 ], the following criteria should be satisfied:
For normal operating conditions :
For emergency and faulted conditions:
a ,where ac and a, are the minimum critical flaw sizes under normal conditions and for
initiation of nonarresting growth under postulated emergency and faulted conditionsrespectively. Combining expressions (1), (2) and (3) (section 5.) with the conditions above,residual life graphs can be plotted (Figs. JO, II, 12).
Fig. 10. Residual life versuscrack depth. Load cycle:normal operating pressure.
2 4 6 B IS 12 H 16 18 23 -IB
Fig. 11. Residual life versuscrack depth. Load cycle:hydrostatic test pressure
209
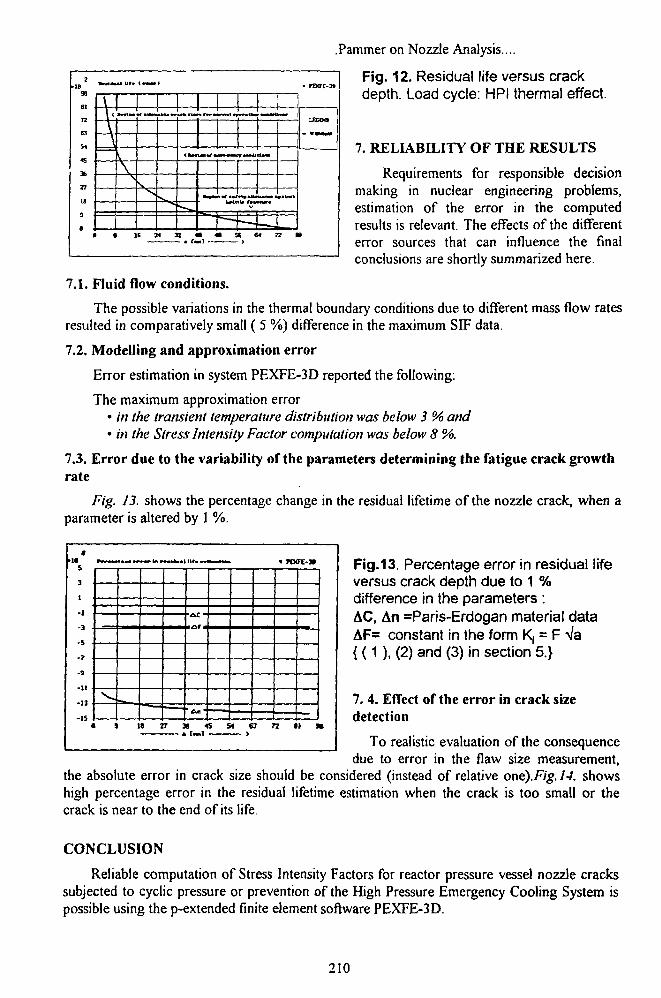
I'10
90
61na
54
36
1
•MI4M1 Uf« t MM I
A\
• it W 3
<l>IUi
•HMI
bd=JS 64 7
•2 a
• mrc-3.
LCCCH*
D
.Pammer on Nozzle Analysis....
Fig. 12. Residual life versus crackdepth. Load cycle: HPI thermal effect.
7. RELIABILITY OF THE RESULTS
Requirements for responsible decisionmaking in nuclear engineering problems,estimation of the error in the computedresults is relevant. The effects of the differenterror sources that can influence the finalconclusions are shortly summarized here.
7.1. Fluid flow conditions.
The possible variations in the thermal boundary conditions due to different mass flow ratesresulted in comparatively small ( 5 %) difference in the maximum SIF data.
7.2. Modelling and approximation error
Error estimation in system PEXFE-3D reported the following:
The maximum approximation error• in the transient temperature distribution was below 3 % and• in the Stress Intensity Factor computation was below 8 %.
7.3. Error due to the variability of the parameters determining the fatigue crack growthrate
Fig. 13. shows the percentage change in the residual lifetime of the nozzle crack, when aparameter is altered by 1 %.
-11
-II
-15«5 S4 S3
Fig.13. Percentage error in residual lifeversus crack depth due to 1 %difference in the parameters :AC, An =Paris-Erdogan material dataAF= constant in the form K, = F Va{ ( 1 ), (2) and (3) in section 5.}
7. 4. Effect of the error in crack sizedetection
To realistic evaluation of the consequencedue to error in the flaw size measurement,
the absolute error in crack size should be considered (instead of relative one).Fig. 14. showshigh percentage error in the residual lifetime estimation when the crack is too small or thecrack is near to the end of its life.
CONCLUSION
Reliable computation of Stress Intensity Factors for reactor pressure vessel nozzle crackssubjected to cyclic pressure or prevention of the High Pressure Emergency Cooling System ispossible using the p-extended finite element software PEXFE-3D.
210
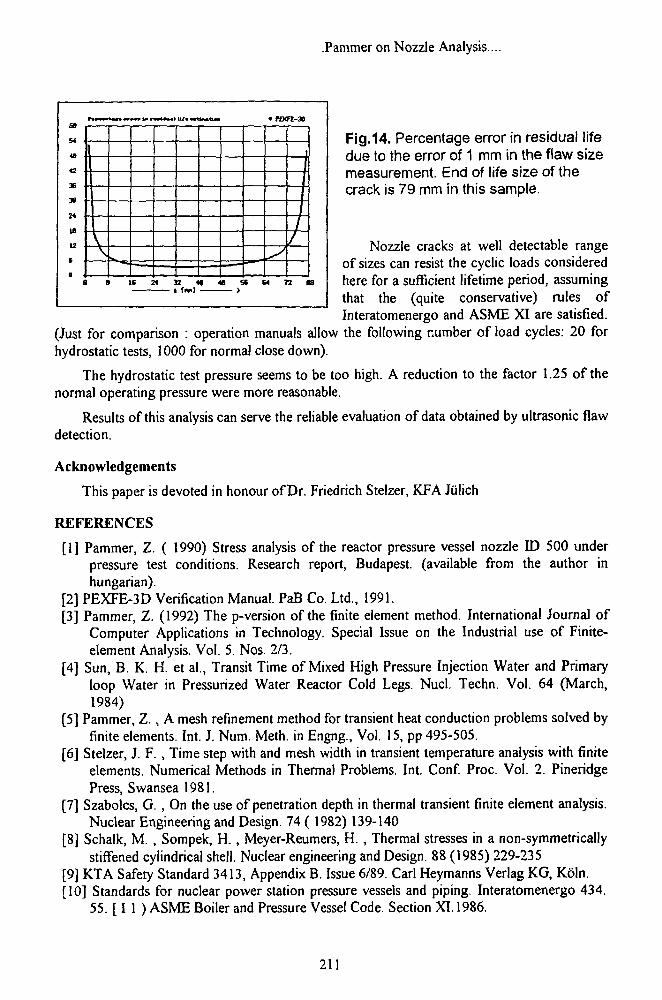
.Pammer on Nozzle Analysis....
Fig.14. Percentage error in residual lifedue to the error of 1 mm in the flaw sizemeasurement. End of life size of thecrack is 79 mm in this sample.
Nozzle cracks at well detectable rangeof sizes can resist the cyclic loads consideredhere for a sufficient lifetime period, assumingthat the (quite conservative) rules ofInteratomenergo and ASME XI are satisfied.
(Just for comparison : operation manuals allow the following number of load cycles: 20 forhydrostatic tests, 1000 for normal close down).
The hydrostatic test pressure seems to be too high. A reduction to the factor 1.25 of thenormal operating pressure were more reasonable.
Results of this analysis can serve the reliable evaluation of data obtained by ultrasonic flawdetection.
Acknowledgements
This paper is devoted in honour of Dr. Friedrich Stelzer, KFA Jiilich
REFERENCES
[1] Pammer, Z. ( 1990) Stress analysis of the reactor pressure vessel nozzle ID 500 underpressure test conditions. Research report, Budapest, (available from the author inhungarian).
[2] PEXFE-3D Verification Manual. PaB Co. Ltd., 1991.[3] Pammer, Z. (1992) The p-version of the finite element method. International Journal of
Computer Applications in Technology. Special Issue on the Industrial use of Finite-element Analysis. Vol. 5. Nos. 2/3.
[4] Sun, B. K. H. et al., Transit Time of Mixed High Pressure Injection Water and Primaryloop Water in Pressurized Water Reactor Cold Legs. Nucl. Techn. Vol. 64 (March,1984)
[5] Pammer, Z. , A mesh refinement method for transient heat conduction problems solved byfinite elements. Int. J. Num. Meth. in Engng., Vol. 15, pp 495-505.
[6] Stelzer, J. F. , Time step with and mesh width in transient temperature analysis with finiteelements. Numerical Methods in Thermal Problems. Int. Conf. Proc. Vol. 2. PineridgePress, Swansea 1981.
[7] Szabolcs, G. , On the use of penetration depth in thermal transient finite element analysis.Nuclear Engineering and Design. 74 ( 1982) 139-140
[8] Schalk, M. , Sompek, H. , Meyer-Reumers, H. , Thermal stresses in a non-symmetricallystiffened cylindrical shell. Nuclear engineering and Design. 88 (1985) 229-235
[9] KTA Safety Standard 3413, Appendix B. Issue 6/89. Carl Heymanns Verlag KG, Koln.[10] Standards for nuclear power station pressure vessels and piping. Interatomenergo 434.
55. [ I 1 ) ASME Boiler and Pressure Vessel Code. Section XI. 1986.
211
Chairman' report. Session 3
Integrity assessment methods
Session 3.
Chairman: K. WichmanCo-Chairman: F. Oswald
Mr. Rosinski's (USA) paper entitled: "Nuclear ReactorPressure Vessel - Specific Flaw Distribution Developments"This paper described the development and application of amethodology to analyse ISI data for the purpose of flawdistribution determination which is important in reactorvessel integrity analyses. Application of the methodology wasdemonstrated using four recently acquired US. PWR vesselinspection data sets. An important result is that themethodology is capable of accepting a database of very fewflaws typical of vessel specific ISI and can incorporate flawdetection reliability, flaw sizing accuracy and flaw detectionthreshold into the analysis. However, it is recommended thatthis methodology be disseminated internationally so that itcan be used to analyse plant specific ISI data.
Mr Puls (Canada) dealt with the "Fitness-for- ServiceAssessment of Pressure Tubes in CANDU Nuclear GeneratingStations". This paper describes fitness-for-service guidelinesrecently developed to assess the integrity of Zr-2.5 Nbpressure tubes in CANDU reactors. The guidelines address theevaluation of various types of flaws, flaw growth andprotection against unstable fracture, plastic collapse,delayed hydride. cracking and other potential failuremechanisms. The guidelines were released to the CANDU OwnersGroup (Canada) for trial use and to the AECB for review andcomment in May of 1991.
Mr. Briceno et al (Spain) presented the Spanish ResearchActivities on Steam Generator Tube Degradation. This paperpresented the program one of the Spanish Research andDevelopment Project on Steam Generators (SG) to investigate SGtube materials degradation. Inconel 600 MA SG tubes have beensubjected to severe inservice degradation of various formse.g., SCC, IGA and denting. The behaviour of 1-600 MA, 1-690TT and Incoloy 800 was studied under simulated primary andsecondary conditions. In addition destructive examination ofSG tubes from Spanish plants was performed. A significantresult was that SCC resistance of 1-690 TT in the severeenvironments simulated is superior to that of Incoloy 800 and1-600 MA. Also, Inconel 690 TT is susceptible to lead causticenvironments.
212

Chairman' report. Session 3
Mr Mavko (Slovenia) dealt with the "On the Risk-basedSteam Generator Life Time Optimization". This paper describesthe development of a probabilistic fracture mechanics model toestimated the failure probability of axially cracked steamgenerator tubes due to SCC. The model estimates the failureprobability from random changes in important parameters suchas tube and crack geometry material properties and NDEresults, reliability and sizing accuracy and stable crackpropagation. The significant conclusion is that after analysisof two plugging approaches (crack depth vs crack length) usingthis model the crack length approach proved superior both interms of SG tube failure probability and extent of plugging.
213
Chairman' report. Session 3
Integrity assessment methods
3rd Session, 2nd Section
Chairman: Th. DuroyCo-Chairman: I. Artinger.
Mr. Kohashi (Japan) presented tne recent results of theirPlant Life Extension Technology development programme withrespect to the effects of thermal ageing on low alloy steelsand fracture toughness of irradiated stainless steels. Themain preliminary results were:
• clarification of the effects of the thermal ageing onfatigue properties of low alloy steels equivalent to an80 year operating life in a simulated BWR waterenvironment,
• observation of the decrease of fracture toughness ofirradiated stainless steels as the fluence increases witha saturation on the high fluence range.
Mr. Wilam, (CSFR) indicated that a material analysis andsome experiments had shown that under WWER steam generatoroperating conditions defect of critical size would hardlypropagate catastrophically and the probability of suddenfailure of a steam generator tube was extremely low.
Then, two papers from Hungary dealt with the use of finiteelement methods for the analysis of pressurized components ofthe reactor.
Mr. Balogh and Vigh (Hungary)aim was• to determine time dependent stress fields of some parts
of steam generator and pipes caused by transient heatdistribution field during the operational and transientcleaning processes.
• to predict the vibration parameters of the reactor blockfor earthquake analysis and vibrating systems.
Mr. Pammer's (Hungary) main purpose was to perform asafety assessment of WWER-44o V-213 nozzles consideringbrittle fracture and fatigue crack growth. He used an ASMEtype postulated crack.
214
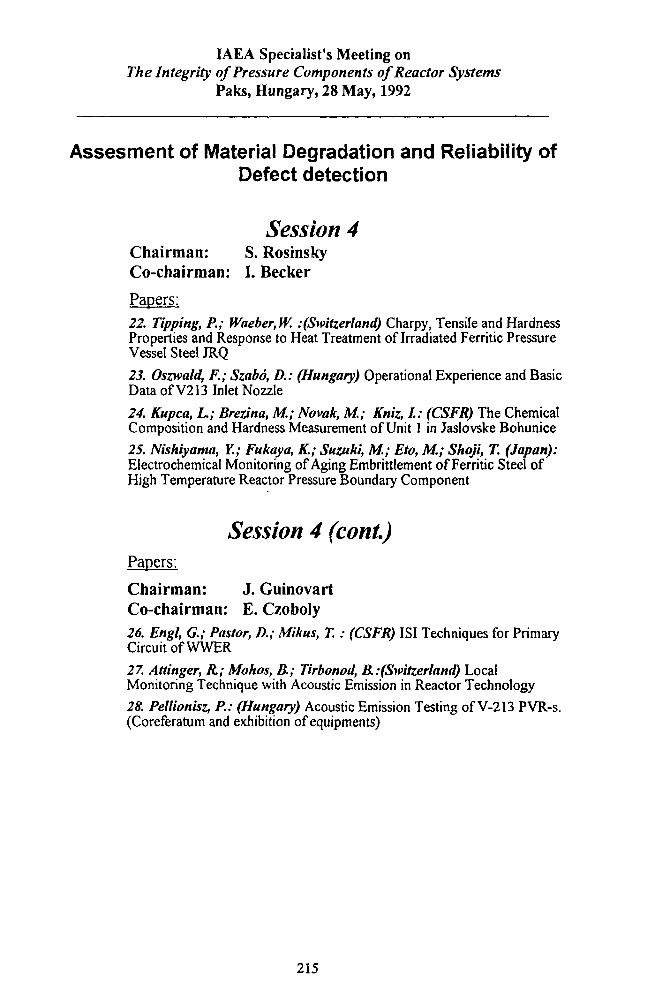
IAEA Specialist's Meeting onThe Integrity of Pressure Components of Reactor Systems
Paks, Hungary, 28 May, 1992
Assesment of Material Degradation and Reliability ofDefect detection
Session 4Chairman: S. RosinskyCo-chairman: I. Becker
Papers:22. Tipping, P.; Waeber,W. .-(Switzerland) Charpy, Tensile and HardnessProperties and Response to Heat Treatment of Irradiated Ferritic PressureVessel Steel JRQ
23. Oszwald, F.; Szabo, D.: (Hungary) Operational Experience and BasicData of V2I3 Inlet Nozzle
24. Kupca, L.; Brezina, M.; Novak, M.; Kniz, I: (CSFR) The ChemicalComposition and Hardness Measurement of Unit 1 in Jaslovske Bohunice
25. Nishiyama, Y.; Fukaya, K.; Suzuki, M ; Eto, M ; Shoji, T. (Japan):Electrochemical Monitoring of Aging Embrittlement of Ferritic Steel ofHigh Temperature Reactor Pressure Boundary Component
Session 4 (cont.)Papers:
Chairman: J. GuinovartCo-chairman: E. Czoboly26. Engl, G.; Pastor, D.; Mikus, T. : (CSFR) ISI Techniques for PrimaryCircuit of WWER
27. Attinger, R.; Mohos, B.; Tirbonod, R:(Switzerland) LocalMonitoring Technique with Acoustic Emission in Reactor Technology
28. Pellionisz, P.: (Hungary) Acoustic Emission Testing of V-213 PVR-s.(Coreferatum and exhibition of equipments)
215
Tipping on Irradiation Results....
Charpy, Tensile and Hardness Properties and Response toHeat Treatment of Irradiated Reference Pressure Vessel Steel - AContribution to an IAEA Joint Research Programme
PHILIP TIPPING and WALDEMAR WAEBERPaul Scherrer Institute (PSI); Wurlingen and Villigen, CH-5232 Villigen PSI, Switzerland.
ABSTRACT
The following work is a contribution to a joint effort on the IAEA coordinated researchprogramme (CRP) on "Optimising of Reactor Pressure Vessel Surveillance Programmes andtheir Analyses".
A pressure vessel (PV) steel has been irradiated to various fast neutron fluences in amaterials test reactor. In addition to standard Charpy toughness, tensile and hardness propertieshave also been determined in the unirradiated (U), irradiated (I) and annealed plus reirradiatedconditions (IAR). The application of a heat treatment of 460 °C x 18 h at 50% of the targetfluence holds promise as a means for mitigating neutron irradiation embrittlement. It has beenshown that the tensile properties in particular were partly restored and it was indicated that therate of reembrittlement after annealing and reirradiating to the target fluence was no faster thanwhen no intermediate anneal had been performed. The Charpy toughness parameters alsobenefited from the annealing, showing the potential of the method for accomplishing plant lifeextension (PLEX) goals.
Keywords: Neutron Irradiation, Pressure Vessel Steel, Mechanical Properties, Annealing,Plant Life Extension.
1 GENERAL BACKGROUND AND INTRODUCTION
The influence of neutron irradiation embrittlement effects on nuclear PV steels andweldments is important because of its impact on safety issues. Much progress about theunderstanding of the phenomenon has been made and this has resulted in better control of thealloy chemical composition, for example the limitation of copper to a maximum of 0.10 weightpercent. As nuclear power plants (NPP) age and accumulate neutron fluence it is increasinglynecessary to monitor them and to seek for methods to ensure continued safe exploitation of thefacility. One way which appears viable for effective PLEX is to dry anneal the entire PV (afterremoval of all internals) in order to restore certain mechanical properties and the followingwork in the frame of the IAEA-CRP contributes some further data and information on thebehaviour of a typical irradiated and annealed PV steel.
The International Atomic Energy Agency (IAEA) correlation material, coded as JRQ, wasmade available to different laboratories and institutions all over the world. This was used as areference material in the coordinated research programme on "Optimizing of Reactor PressureVessel Surveillance Programmes and their Analyses". Under a joint cooperation agreement,PSI (Switzerland) and VTT (Finland) have now completed certain aspects concerned with theIAEA work whereby the PSI performed the planning, the specimen fabrication, irradiation andannealing. The standard Charpy toughness, tensile and hardness tests were also carried out atPSI whilst VTT contributed to the testing of the precracked Charpy specimens with a speciallyinstrumented inverse impact hammer; see for example [1].
216
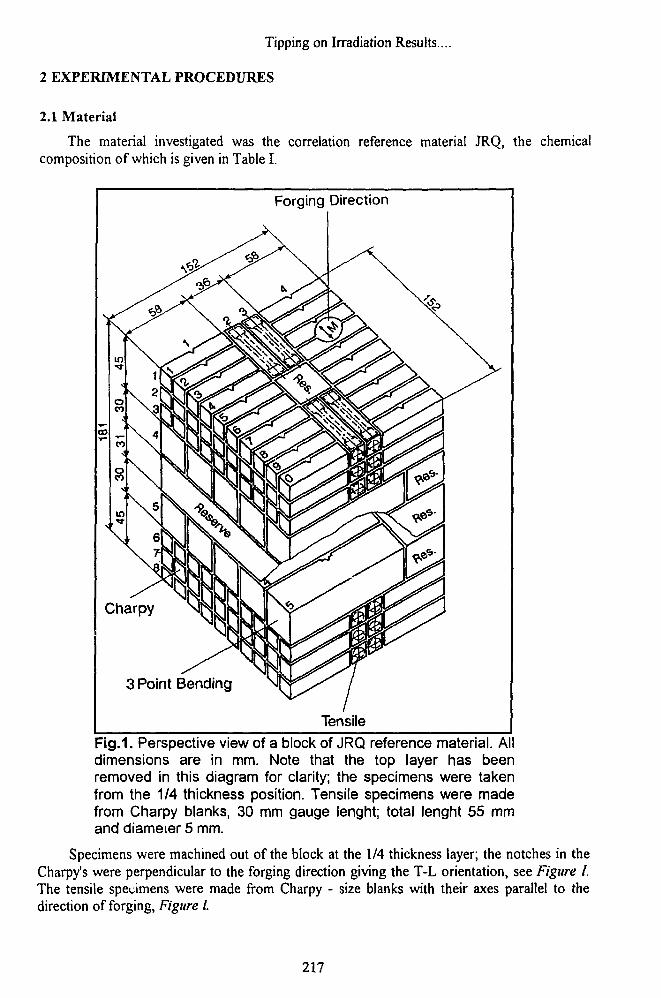
Tipping on Irradiation Results....
2 EXPERIMENTAL PROCEDURES
2,1 Material
The material investigated was the correlation reference material JRQ, the chemicalcomposition of which is given in Table I.
Forging Direction
Charpy
3 Point Bending
Tensile
Fig.1. Perspective view of a block of JRQ reference material. Alldimensions are in mm. Note that the top layer has beenremoved in this diagram for clarity; the specimens were takenfrom the 1/4 thickness position. Tensile specimens were madefrom Charpy blanks, 30 mm gauge lenght; total lenght 55 mmand diameter 5 mm.
Specimens were machined out of the block at the 1/4 thickness layer; the notches in theCharpy's were perpendicular to the forging direction giving the T-L orientation, see Figure I.The tensile specimens were made from Charpy - size blanks with their axes parallel to thedirection of forging, Figure I.
217
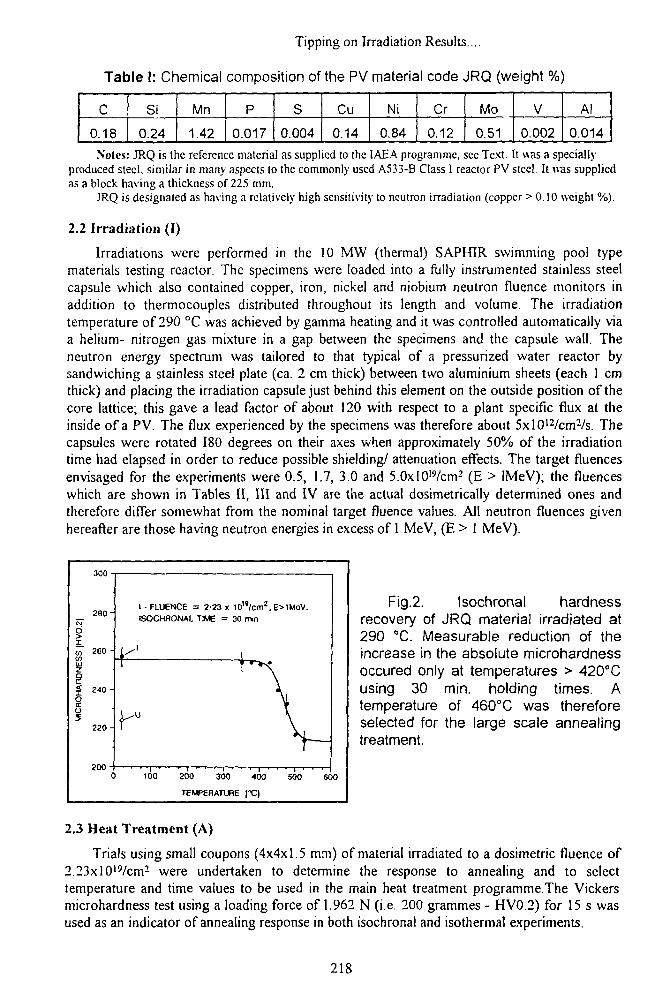
Tipping on Irradiation Results...
0
Table
C
.18 0
I: Chemical
Si
.24
Mn
1.42
composition of
P
0.017
S
0.004
thePV
Cu
0.14
material
Ni
0.84
code
Cr
0.12
JRQ (weight %'
Mo
0.51
V
0.002
>
0
Al
.014
Notes: JRQ is the reference material as supplied to the IAEA programme, see Text. It was a speciallyproduced steel, similar in many aspects to the commonly used A533-B Class I reactor PV steel. It was suppliedas a block having a thickness of 225 mm.
JRQ is designated as having a relatively high sensitivity to neutron irradiation (copper > 0.10 weight %).
2.2 Irradiation (I)
Irradiations were performed in the 10 MW (thermal) SAPHIR swimming pool typematerials testing reactor. The specimens were loaded into a fully instrumented stainless steelcapsule which also contained copper, iron, nickel and niobium neutron fluence monitors inaddition to thermocouples distributed throughout its length and volume. The irradiationtemperature of 290 °C was achieved by gamma heating and it was controlled automatically viaa helium- nitrogen gas mixture in a gap between the specimens and the capsule wall. Theneutron energy spectrum was tailored to that typical of a pressurized water reactor bysandwiching a stainless steel plate (ca. 2 cm thick) between two aluminium sheets (each 1 cmthick) and placing the irradiation capsule just behind this element on the outside position of thecore lattice; this gave a lead factor of about 120 with respect to a plant specific flux at theinside of a PV. The flux experienced by the specimens was therefore about 5xl012/cm2/s. Thecapsules were rotated 180 degrees on their axes when approximately 50% of the irradiationtime had elapsed in order to reduce possible shielding/ attenuation effects. The target fluencesenvisaged for the experiments were 0.5, 1.7, 3.0 and 5.0xl019/cm2 (E > lMeV); the fluenceswhich are shown in Tables II, III and IV are the actual dosimetrically determined ones andtherefore differ somewhat from the nominal target fluence values. All neutron fluences givenhereafter are those having neutron energies in excess of 1 MeV, (E > 1 MeV).
2 8 0 -
2G0 -
240 -
2 2 0 -
«>00 40
1 - FLU6NCE =ISOCHRONAL
1 • ' i ' • • i100 200
= 2'23 XTIME =
300
1O'W.30 mm
•400
E>1MBV.
\
\
' • I I
500
I—
60.
TEMPERATURE ["C)
Fig.2. Isochronal hardnessrecovery of JRQ material irradiated at290 °C. Measurable reduction of theincrease in the absolute microhardnessoccured only at temperatures > 420cCusing 30 min. holding times. Atemperature of 460°C was thereforeselected for the large scale annealingtreatment.
2.3 Heat Treatment (A)
Trials using small coupons (4x4x1.5 mm) of material irradiated to a dosimetric fluence of2.23x10l9/cm2 were undertaken to determine the response to annealing and to selecttemperature and time values to be used in the main heat treatment programme.The Vickersmicrohardness test using a loading force of 1.962 N (i.e. 200 grammes - HV0.2) for 15 s wasused as an indicator of annealing response in both isochronal and isothermal experiments.
218
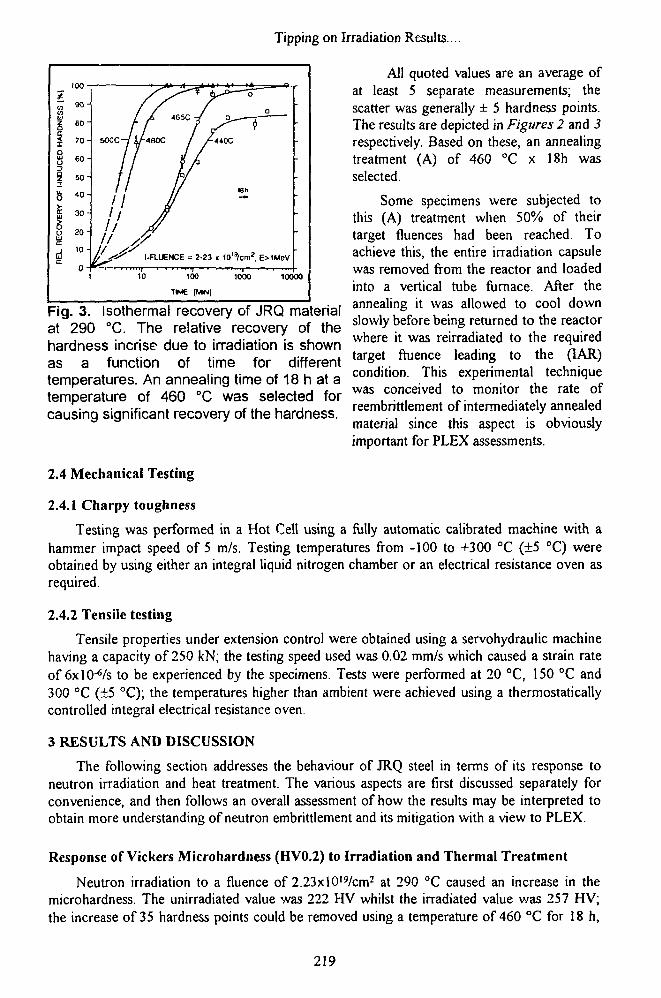
Tipping on Irradiation Results....
7</)UJ
1 80"£ 70-o
s 6 ° -1 50 -
fe 40 -
O 20"
4 10-
'1 I ..] '
/ / / °/ A 465C-/ n__ ;
500C-/i/«80C / ^4400
/ / / /
/ / / /
/ / y7/ ' / / en
jl J11 jy
/ j - * - ' I-FLUENCE = 2-23 « io"/cm2, E>1MeV
-
1 10 100 1000 10000
TIME [MN]
Fig. 3. Isothermal recovery of JRQ materialat 290 °C. The relative recovery of thehardness incrise due to irradiation is shownas a function of time for differenttemperatures. An annealing time of 18 h at atemperature of 460 °C was selected forcausing significant recovery of the hardness.
2.4 Mechanical Testing
All quoted values are an average ofat least 5 separate measurements; thescatter was generally ± 5 hardness points.The results are depicted in Figures 2 and 3respectively. Based on these, an annealingtreatment (A) of 460 °C x 18h wasselected.
Some specimens were subjected tothis (A) treatment when 50% of theirtarget fluences had been reached. Toachieve this, the entire irradiation capsulewas removed from the reactor and loadedinto a vertical tube furnace. After theannealing it was allowed to cool downslowly before being returned to the reactorwhere it was reirradiated to the requiredtarget ftuence leading to the (IAR)condition. This experimental techniquewas conceived to monitor the rate ofreembrittlement of intermediately annealedmaterial since this aspect is obviouslyimportant for PLEX assessments.
2.4.1 Charpy toughness
Testing was performed in a Hot Cell using a fully automatic calibrated machine with ahammer impact speed of 5 m/s. Testing temperatures from -100 to +300 °C (±5 °C) wereobtained by using either an integral liquid nitrogen chamber or an electrical resistance oven asrequired.
2.4.2 Tensile testing
Tensile properties under extension control were obtained using a servohydraulic machinehaving a capacity of 250 kN; the testing speed used was 0.02 mm/s which caused a strain rateof 6xI06/s to be experienced by the specimens. Tests were performed at 20 °C, 150 °C and300 °C (±5 °C); the temperatures higher than ambient were achieved using a thermostaticallycontrolled integral electrical resistance oven.
3 RESULTS AND DISCUSSION
The following section addresses the behaviour of JRQ steel in terms of its response toneutron irradiation and heat treatment. The various aspects are first discussed separately forconvenience, and then follows an overall assessment of how the results may be interpreted toobtain more understanding of neutron embrittlement and its mitigation with a view to PLEX.
Response of Vickers Microhardness (HV0.2) to Irradiation and Thermal Treatment
Neutron irradiation to a fluence of 2.23x10l9/cm2 at 290 °C caused an increase in themicrohardness. The unirradiated value was 222 HV whilst the irradiated value was 257 HV;the increase of 35 hardness points could be removed using a temperature of 460 °C for 18 h,
219
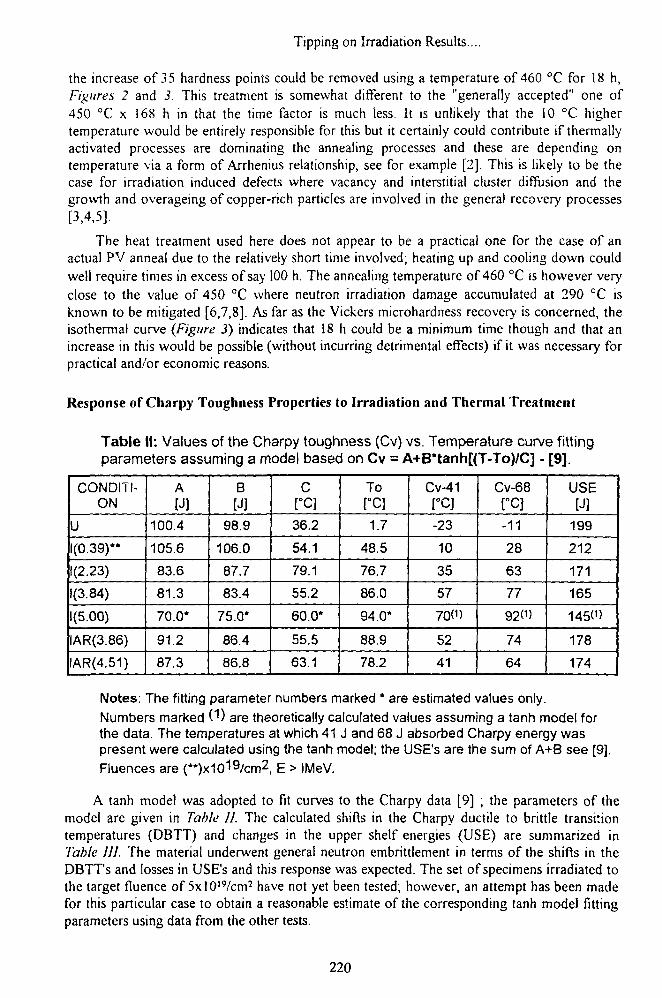
Tipping on Irradiation Results....
the increase of 35 hardness points could be removed using a temperature of 460 °C for 18 h,Figures 2 and 3. This treatment is somewhat different to the "generally accepted" one of450 °C x 168 h in that the time factor is much less. It is unlikely that the 10 °C highertemperature would be entirely responsible for this but it certainly could contribute if thermallyactivated processes are dominating the annealing processes and these are depending ontemperature via a form of Arrhenius relationship, see for example [2]. This is likely to be thecase for irradiation induced defects where vacancy and interstitial cluster diffusion and thegrowth and overageing of copper-rich particles are involved in the general recovery processes[3,4,5].
The heat treatment used here does not appear to be a practical one for the case of anactual PV anneal due to the relatively short time involved; heating up and cooling down couldwell require times in excess of say 100 h. The annealing temperature of 460 °C is however veryclose to the value of 450 °C where neutron irradiation damage accumulated at 290 °C isknown to be mitigated [6,7,8]. As far as the Vickers microhardness recovery is concerned, theisothermal curve (Figure 3) indicates that 18 h could be a minimum time though and that anincrease in this would be possible (without incurring detrimental effects) if it was necessary forpractical and/or economic reasons.
Response of Charpy Toughness Properties to Irradiation and Thermal Treatment
Table II: Values of the Charpy toughness (Cv) vs. Temperature curve fittingparameters assuming a model based on Cv = A+B*tanh[(T-To)/C] - [9].
CONDITI-ON
U
1(0.39)"
1(2.23)
1(3.84)
1(5.00)
IAR(3.86)
IAR(4.51)
AfJ]
100.4
105.6
83.6
81.3
70.0*
91.2
87.3
B[J]
98.9
106.0
87.7
83.4
75.0*
86.4
86.8
C[°C]
36.2
54.1
79.1
55.2
60.0*
55.5
63.1
To[°C]
1.7
48.5
76.7
86.0
94.0*
88.9
78.2
Cv-41rcj-23
10
35
57
700)
52
41
Cv-68[°C]
-11
28
63
77
920)
74
64
USE[J]
199
212
171
165
145O
178
174
Notes: The fitting parameter numbers marked * are estimated values only.
Numbers marked 0 ) are theoretically calculated values assuming a tanh model forthe data. The temperatures at which 41 J and 68 J absorbed Charpy energy waspresent were calculated using the tanh model; the USE's are the sum of A+B see [9].
Fluences are (**)x1019/cm2, E > IMeV.
A tanh model was adopted to fit curves to the Charpy data [9] ; the parameters of themodel are given in Table II. The calculated shifts in the Charpy ductile to brittle transitiontemperatures (DBTT) and changes in the upper shelf energies (USE) are summarized inTable III. The material underwent general neutron embrittlement in terms of the shifts in theDBTT's and losses in USE's and this response was expected. The set of specimens irradiated tothe target fluence of 5xlOl9/cm2 have not yet been tested; however, an attempt has been madefor this particular case to obtain a reasonable estimate of the corresponding tanh model fittingparameters using data from the other tests.
220
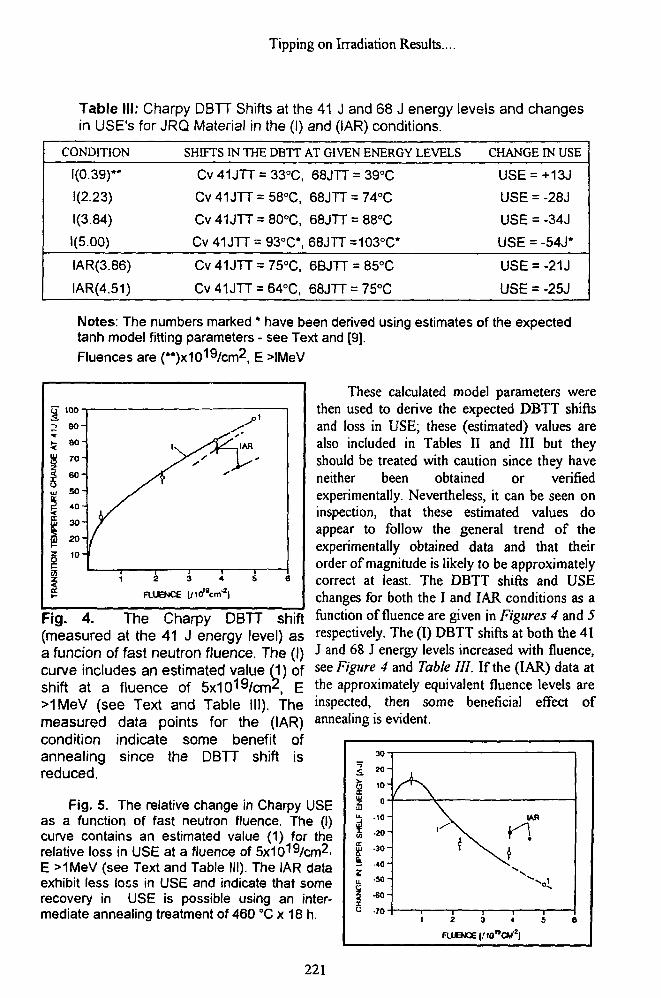
Tipping on Irradiation Results....
Table III: Charpy DBTT Shifts at the 41 J and 68 J energy levels and changesin USE'S for JRQ Material in the (I) and (iAR) conditions.
CONDITION
1(0.39)**
1(2.23)
1(3.84)
1(5.00)
IAR(3.86)
IAR(4.51)
SHIFTS IN THE DBTT
Cv41JTT = 33°C
Cv41JTT = 58°C.
Cv 41JTT = 80°C,
Cv41JTT = 93°C*
Cv 41JTT = 75°C,
Cv 41JTT = 64°C,
AT GIVEN ENERGY LEVELS
68JTT = 39°C
68JTT = 74°C
68JTT = 88°C
68JTT=103°C*
6BJTT = 85°C
68JTT = 75°C
CHANGE IN USE
USE = +13J
USE = -28J
USE = -34J
USE = -54J*
USE = -21J
USE = -25J
Notes: The numbers marked * have been derived using estimates of the expectedtanh model fitting parameters - see Text and [9].
Fluences are (**)x1019/cm2, E >IMeV
aIW
£
rz
100-
9 0 -
80-
70-
60 -
50 -
40 -
3 0 -
20-
1 0 -(
1 2 3 4 5 6
FLUENCE |/10t8c<nJ)
Fig. 4. The Charpy DBTT shift(measured at the 41 J energy level) asa funcion of fast neutron fluence. The (I)curve includes an estimated value M) ofshift at a fluence of SxiC^/cm^, E>1MeV (see Text and Table III). Themeasured data points for the (IAR)condition indicate some benefit ofannealing since the DBTT shift isreduced.
Fig. 5. The relative change in Charpy USEas a function of fast neutron fluence. The (I)curve contains an estimated value (1) for therelative loss in USE at a fluence of 5x10¹⁹/cm2>E >1MeV (see Text and Table III). The IAR dataexhibit less loss in USE and indicate that somerecovery in USE is possible using an inter-mediate annealing treatment of 460 °C x 18 h.
These calculated model parameters werethen used to derive the expected DBTT shiftsand loss in USE; these (estimated) values arealso included in Tables II and III but theyshould be treated with caution since they haveneither been obtained or verifiedexperimentally. Nevertheless, it can be seen oninspection, that these estimated values doappear to follow the general trend of theexperimentally obtained data and that theirorder of magnitude is likely to be approximatelycorrect at least. The DBTT shifts and USEchanges for both the I and IAR conditions as afunction of fluence are given in Figures 4 and 5respectively. The (I) DBTT shifts at both the 41J and 68 J energy levels increased with fluence,see Figure 4 and Table III. If the (IAR) data atthe approximately equivalent fluence levels areinspected, then some beneficial effect ofannealing is evident.
221
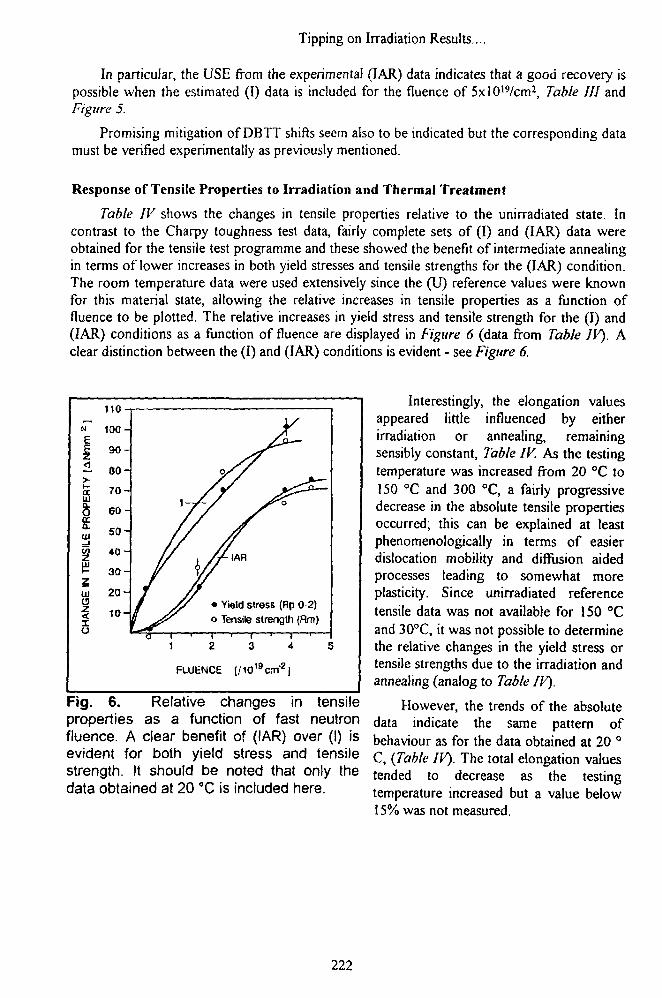
Tipping on Irradiation Results...
In particular, the USE from the experimental (IAR) data indicates that a good recovery ispossible when the estimated (I) data is included for the fluence of 5xlO19/cm2, Table HI andFigure 5.
Promising mitigation of DBTT shifts seem also to be indicated but the corresponding datamust be verified experimentally as previously mentioned.
Response of Tensile Properties to Irradiation and Thermal Treatment
Table IV shows the changes in tensile properties relative to the unirradiated state. Incontrast to the Charpy toughness test data, fairly complete sets of (I) and (IAR) data wereobtained for the tensile test programme and these showed the benefit of intermediate annealingin terms of lower increases in both yield stresses and tensile strengths for the (IAR) condition.The room temperature data were used extensively since the (U) reference values were knownfor this material state, allowing the relative increases in tensile properties as a function offluence to be plotted. The relative increases in yield stress and tensile strength for the (I) and(IAR) conditions as a function of fluence are displayed in Figure 6 (data from Table IV). Aclear distinction between the (I) and (IAR) conditions is evident - see Figure 6.
iaUJ
i
C3
<• Yield stress (Rp 0 2)o Tensile strength (Rrn)
FLUENCE t/iO1Bcnrrj
Fig. 6. Relative changes in tensileproperties as a function of fast neutronfluence. A clear benefit of (IAR) over (I) isevident for both yield stress and tensilestrength. It should be noted that only thedata obtained at 20 °C is included here.
Interestingly, the elongation valuesappeared little influenced by eitherirradiation or annealing, remainingsensibly constant, Table IV. As the testingtemperature was increased from 20 °C to150 °C and 300 °C, a fairly progressivedecrease in the absolute tensile propertiesoccurred; this can be explained at leastphenomenologically in terms of easierdislocation mobility and diffusion aidedprocesses leading to somewhat moreplasticity. Since unirradiated referencetensile data was not available for 150 °Cand 30°C, it was not possible to determinethe relative changes in the yield stress ortensile strengths due to the irradiation andannealing (analog to Table IV).
However, the trends of the absolutedata indicate the same pattern ofbehaviour as for the data obtained at 20 °C, {Table IV). The total elongation valuestended to decrease as the testingtemperature increased but a value below15% was not measured.
222
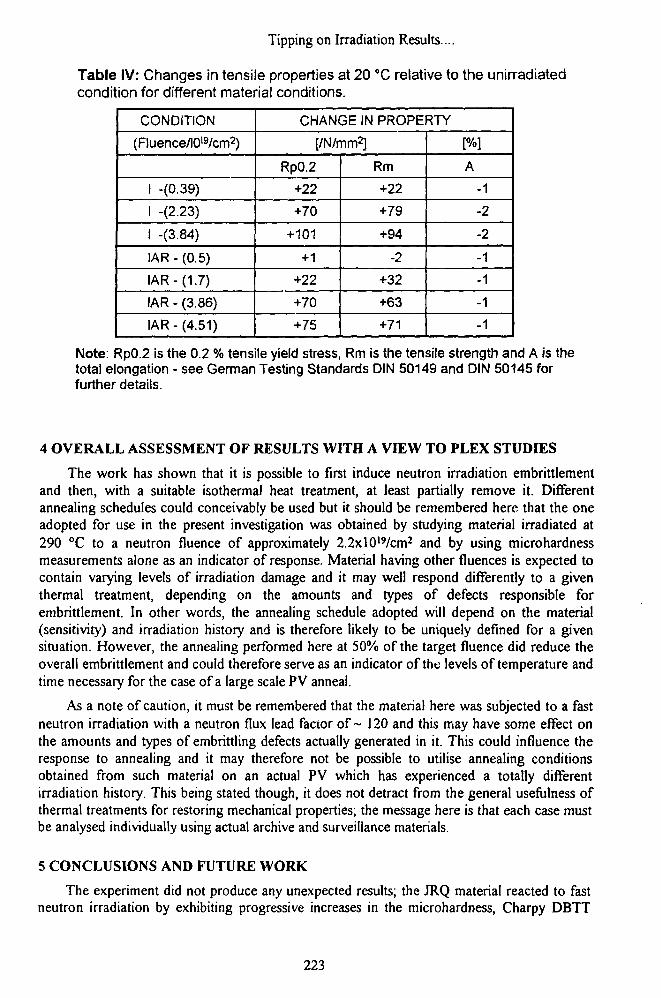
Tipping on Irradiation Results...
Table IV: Changes in tensile properties at 20 °C relative to the unirradiatedcondition for different material conditions.
CONDITION
(Fluence/1019/cm2)
1 -(0.39)
1 -(2.23)
1 -(3.84)
IAR - (0.5)
IAR-(1.7)
IAR - (3.86)
IAR-(4.51)
CHANGE IN PROPERTY
[/N/mm2]
Rp0.2
+22
+70
+101
+1
+22
+70
+75
Rm
+22
+79
+94
-2
+32
+63
+71
[%]
A
-1
-2
-2
-1
-1
-1
-1
Note: Rp0.2 is the 0.2 % tensile yield stress, Rm is the tensile strength and A is thetotal elongation - see German Testing Standards DIN 50149 and DIN 50145 forfurther details.
4 OVERALL ASSESSMENT OF RESULTS WITH A VIEW TO PLEX STUDIES
The work has shown that it is possible to first induce neutron irradiation embrittlementand then, with a suitable isothermal heat treatment, at least partially remove it. Differentannealing schedules could conceivably be used but it should be remembered here that the oneadopted for use in the present investigation was obtained by studying material irradiated at290 °C to a neutron fluence of approximately 2.2xlO19/cm2 and by using microhardnessmeasurements alone as an indicator of response. Material having other fluences is expected tocontain varying levels of irradiation damage and it may well respond differently to a giventhermal treatment, depending on the amounts and types of defects responsible forembrittlement. In other words, the annealing schedule adopted will depend on the material(sensitivity) and irradiation history and is therefore likely to be uniquely defined for a givensituation. However, the annealing performed here at 50% of the target fluence did reduce theoverall embrittlement and could therefore serve as an indicator of the levels of temperature andtime necessary for the case of a large scale PV anneal.
As a note of caution, it must be remembered that the material here was subjected to a fastneutron irradiation with a neutron flux lead factor of ~ 120 and this may have some effect onthe amounts and types of embrittling defects actually generated in it. This could influence theresponse to annealing and it may therefore not be possible to utilise annealing conditionsobtained from such material on an actual PV which has experienced a totally differentirradiation history. This being stated though, it does not detract from the general usefulness ofthermal treatments for restoring mechanical properties; the message here is that each case mustbe analysed individually using actual archive and surveillance materials.
5 CONCLUSIONS AND FUTURE WORK
The experiment did not produce any unexpected results; the JRQ material reacted to fastneutron irradiation by exhibiting progressive increases in the microhardness, Charpy DBTT
223
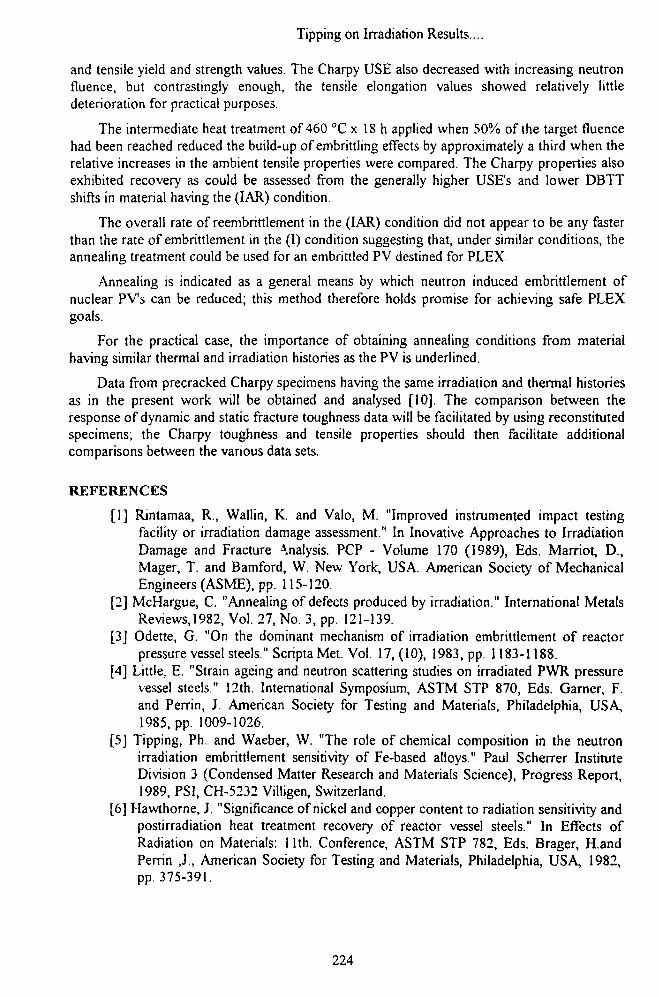
Tipping on Irradiation Results...
and tensile yield and strength values. The Charpy USE also decreased with increasing neutronfluence, but contrastingly enough, the tensile elongation values showed relatively littledeterioration for practical purposes.
The intermediate heat treatment of 460 °C x 18 h applied when 50% of the target fluencehad been reached reduced the build-up of embrittling effects by approximately a third when therelative increases in the ambient tensile properties were compared. The Charpy properties alsoexhibited recovery as could be assessed from the generally higher USE's and lower DBTTshifts in material having the (IAR) condition.
The overall rate of reembrittlement in the (IAR) condition did not appear to be any fasterthan the rate of embrittlement in the (I) condition suggesting that, under similar conditions, theannealing treatment could be used for an embrittled PV destined for PLEX.
Annealing is indicated as a general means by which neutron induced embrittlement ofnuclear PVs can be reduced; this method therefore holds promise for achieving safe PLEXgoals.
For the practical case, the importance of obtaining annealing conditions from materialhaving similar thermal and irradiation histories as the PV is underlined.
Data from precracked Charpy specimens having the same irradiation and thermal historiesas in the present work will be obtained and analysed [10]. The comparison between theresponse of dynamic and static fracture toughness data will be facilitated by using reconstitutedspecimens; the Charpy toughness and tensile properties should then facilitate additionalcomparisons between the various data sets.
REFERENCES
[1] Rintamaa, R., Wallin, K. and Valo, M. "Improved instrumented impact testingfacility or irradiation damage assessment." In Inovative Approaches to IrradiationDamage and Fracture Analysis. PCP - Volume 170 (1989), Eds. Marriot, D.,Mager, T. and Bamford, W. New York, USA. American Society of MechanicalEngineers (ASME), pp. 115-120.
[2] McHargue, C. "Annealing of defects produced by irradiation." International MetalsReviews, 1982, Vol. 27, No. 3, pp. 121-139.
[3] Odette, G. "On the dominant mechanism of irradiation embrittlement of reactorpressure vessel steels." Scripta Met. Vol. 17, (10), 1983, pp. 1183-1188.
[4] Little, E. "Strain ageing and neutron scattering studies on irradiated PWR pressurevessel steels." 12th. International Symposium, ASTM STP 870, Eds. Garner, F.and Perrin, J. American Society for Testing and Materials, Philadelphia, USA,1985, pp. 1009-1026.
[5] Tipping, Ph. and Waeber, W. "The role of chemical composition in the neutronirradiation embrittlement sensitivity of Fe-based alloys." Paul Scherrer InstituteDivision 3 (Condensed Matter Research and Materials Science), Progress Report,1989, PSI, CH-5232 Viiligen, Switzerland.
[6] Hawthorne, J. "Significance of nickel and copper content to radiation sensitivity andpostirradiation heat treatment recovery of reactor vessel steels." In Effects ofRadiation on Materials: 1 lth. Conference, ASTM STP 782, Eds. Brager, H.andPerrin , 1 , American Society for Testing and Materials, Philadelphia, USA, 1982,pp. 375-391.
224

Tipping on Irradiation Results....
[7] Tipping, Ph., Waeber, W. and Mercier, O. "Study of a possible plant life extensionby intermediate annealing of the reactor pressure vessel, II confirmation by furtherannealing studies." NEA/CSNI - UNIPEDE Specialist Meeting on Regulatory andLife Limiting Aspects of Core Internals and Pressure Vessels. Stockholm, 1988,CSNI Report No. 146, Vol. 2, pp. 473-488.
[8] Tipping, Ph., Waeber, W. and Mecier, 0. "A study of the mechanical propertychanges of embrittled pressure vessel steels and their response to annealingtreatments". Trans. 9th. International Conference on Structural Mechanics inReactor Technology (SMIRT), Ed. Wittman, F., Lausanne, Switzerland, 1987,vol. G., pp. 115-127.
[9] Wullaert, R., Oldfield, W. and Server, W. "Reference fracture toughness curves forirradiated pressure vessel steels." Journal of Engineering and Technology, Trans.ASME, January 1980, Vol. 102, pp. 102-106.
[10] Nevalainen, M., Rintamaa, R., Valo, M., Kaki, A., Waeber, W. and Tipping, Ph.Results to be presented at the IAEA-CRP Meeting, September 29 to October 2,Balatonfured, Hungary, 1992.
225
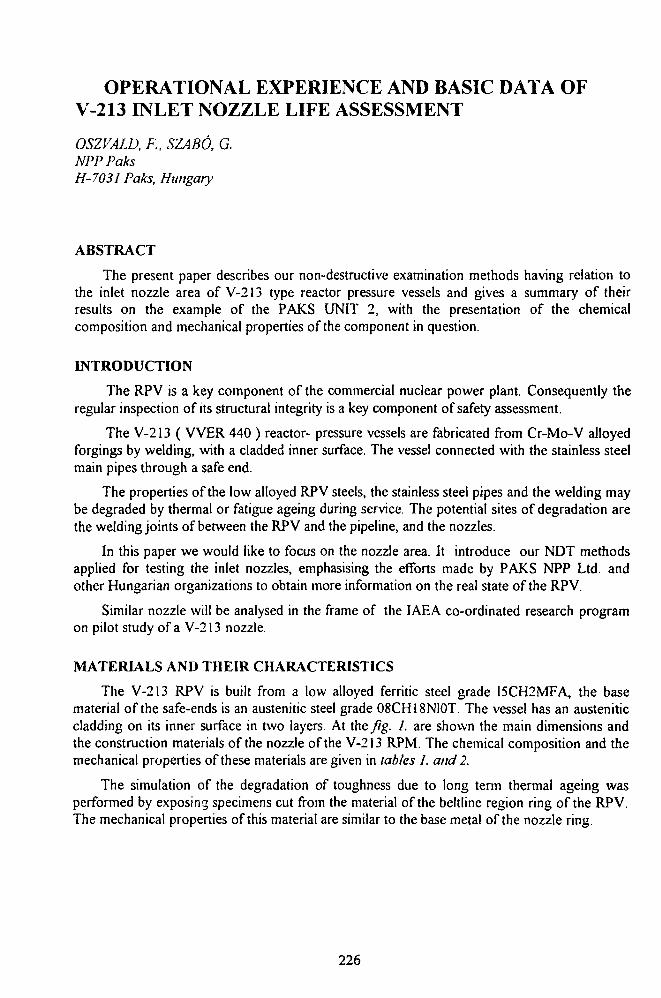
OPERATIONAL EXPERIENCE AND BASIC DATA OFV-213 INLET NOZZLE LIFE ASSESSMENT
OSZVALD, F, SZABO, G.NPPPaksH-7031 Paks, Hungary
ABSTRACT
The present paper describes our non-destructive examination methods having relation tothe inlet nozzle area of V-213 type reactor pressure vessels and gives a summary of theirresults on the example of the PAKS UNIT 2, with the presentation of the chemicalcomposition and mechanical properties of the component in question.
INTRODUCTION
The RPV is a key component of the commercial nuclear power plant. Consequently theregular inspection of its structural integrity is a key component of safety assessment.
The V-213 ( VVER 440 ) reactor- pressure vessels are fabricated from Cr-Mo-V alloyedforgings by welding, with a cladded inner surface. The vessel connected with the stainless steelmain pipes through a safe end.
The properties of the low alloyed RPV steels, the stainless steel pipes and the welding maybe degraded by thermal or fatigue ageing during service. The potential sites of degradation arethe welding joints of between the RPV and the pipeline, and the nozzles.
In this paper we would like to focus on the nozzle area. It introduce our NDT methodsapplied for testing the inlet nozzles, emphasising the efforts made by PAKS NPP Ltd. andother Hungarian organizations to obtain more information on the real state of the RPV.
Similar nozzle will be analysed in the frame of the IAEA co-ordinated research programon pilot study of a V-213 nozzle.
MATERIALS AND THEIR CHARACTERISTICS
The V-213 RPV is built from a low alloyed ferritic steel grade 15CH2MFA, the basematerial of the safe-ends is an austenitic steel grade O8CH18N1OT. The vessel has an austeniticcladding on its inner surface in two layers At ihefig. I. are shown the main dimensions andthe construction materials of the nozzle of the V-213 RPM. The chemical composition and themechanical properties of these materials are given in tables I. and 2.
The simulation of the degradation of toughness due to long term thermal ageing wasperformed by exposing specimens cut from the material of the beltline region ring of the RPV.The mechanical properties of this material are similar to the base metal of the nozzle ring
226
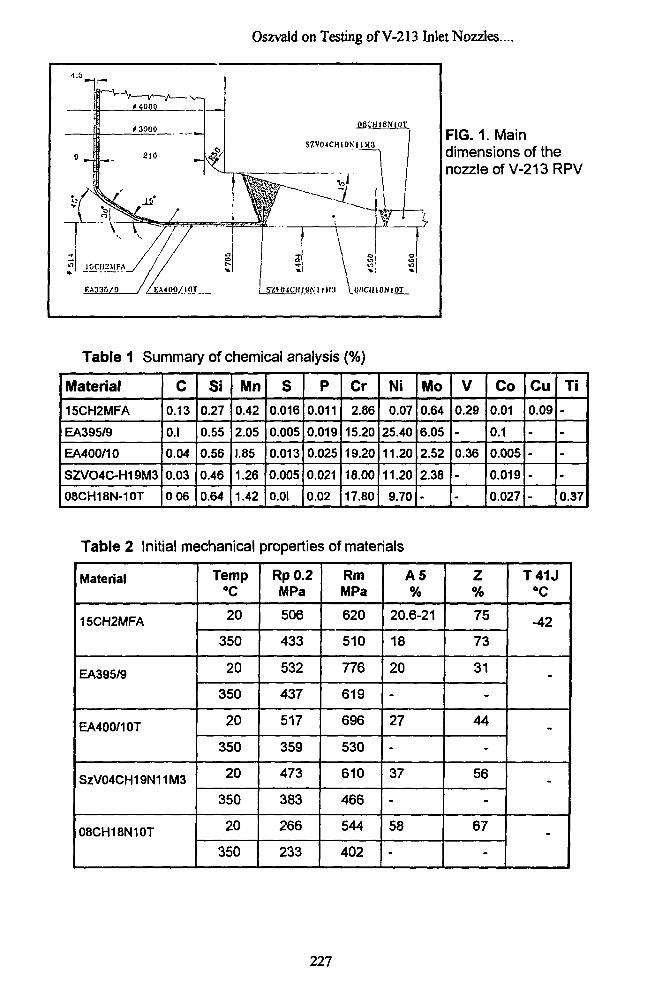
Oszvald on Testing of V-213 Inlet Nozzles....
-ir
J-\
<4000
EA335/9
210
06CHI6MOT
SZV04CHI0NIIM3
:l \u»CIUON10T
FIG. 1. Maindimensions of thenozzleofV-213RPV
Table 1 Summary of chemical analysis
Material
15CH2MFA
EA395/9
EA400/10
SZVO4C-H19M3
08CH18N-10T
c0.13
O.I
0.04
0.03
006
Si
0.27
0.55
0.56
0.46
0.64
Mn
0.42
2.05
1.85
1.26
1.42
s0.016
0.005
0.013
0.005
0.0I
P
0.011
0.019
0.025
0.021
0.02
Cr
2.86
15.20
19.20
18.00
17.80
Ni
0.07
25.40
11.20
11.20
9.70
Mo
0.64
6.05
2.52
2.38
-
V
0.29
-
0.36
-
-
Co
0.01
0.1
0.005
0.019
0.027
Cu
0.09
-
-
-
-
Ti
----0.37
Table 2 Initial mechanical
Material
15CH2MFA
EA395/9
EA400/10T
SzV04CH19N11M3
08CH18N10T
Temp°C
20
350
20
350
20
350
20
350
20
350
properties of materials
Rp0.2MPa
506
433
532
437
517
359
473
383
266
233
RmMPa
620
510
776
619
696
530
610
466
544
402
A5%
20.6-21
18
20
-
27
-
37
-
58
-
Z%
75
73
31
-
44
-
56
-
67
-
T41J°C
-42
-
-
-
-
227
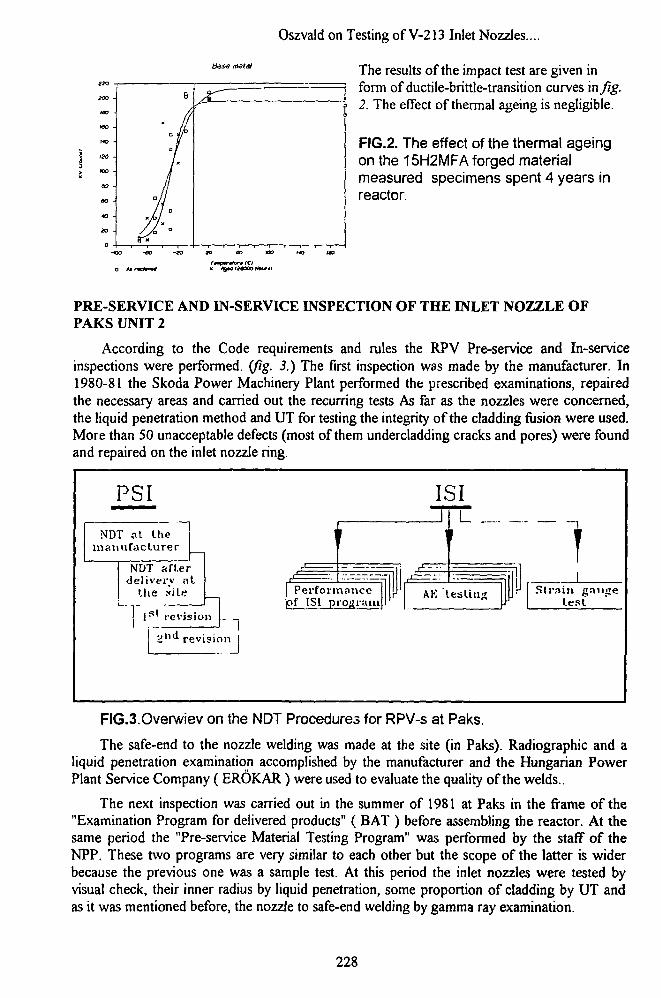
zoo -
HO -
too ~<
no -
no •
* > •
ao -
40 -
so -
0 -
9
/
7r
Ia/J/ 7 D
Oszvald on Testing of V-213 Inlet Nozzles....
The results of the impact test are given inform of ductile-brittle-transition curves in fig.2. The effect of thermal ageing is negligible.
FIG.2. The effect of the thermal ageingon the 15H2MFA forged materialmeasured specimens spent 4 years inreactor.
PRE-SERVICE AND IN-SERVICE INSPECTION OF THE INLET NOZZLE OFPAKS UNIT 2
According to the Code requirements and rules the RPV Pre-service and In-serviceinspections were performed, (jig. 3.) The first inspection was made by the manufacturer. In1980-81 the Skoda Power Machinery Plant performed the prescribed examinations, repairedthe necessary areas and carried out the recurring tests As far as the nozzles were concerned,the liquid penetration method and UT for testing the integrity of the cladding fusion were used.More than 50 unacceptable defects (most of them undercladding cracks and pores) were foundand repaired on the inlet nozzle ring.
PSI
NDT at themanufacturer
NOT afl.erdelivery >'tt
the
i s ' revision L
Performanceof ISI program!
Strain glest
ision I
FIG.3.0verwiev on the NDT Procedures for RPV-s at Paks.
The safe-end to the nozzle welding was made at the site (in Paks). Radiographic and aliquid penetration examination accomplished by the manufacturer and the Hungarian PowerPlant Service Company ( EROKAR) were used to evaluate the quality of the welds..
The next inspection was carried out in the summer of 1981 at Paks in the frame of the"Examination Program for delivered products" ( BAT ) before assembling the reactor. At thesame period the "Pre-service Material Testing Program" was performed by the staff of theNPP. These two programs are very similar to each other but the scope of the latter is widerbecause the previous one was a sample test. At this period the inlet nozzles were tested byvisual check, their inner radius by liquid penetration, some proportion of cladding by UT andas it was mentioned before, the nozzle to safe-end welding by gamma ray examination.
228
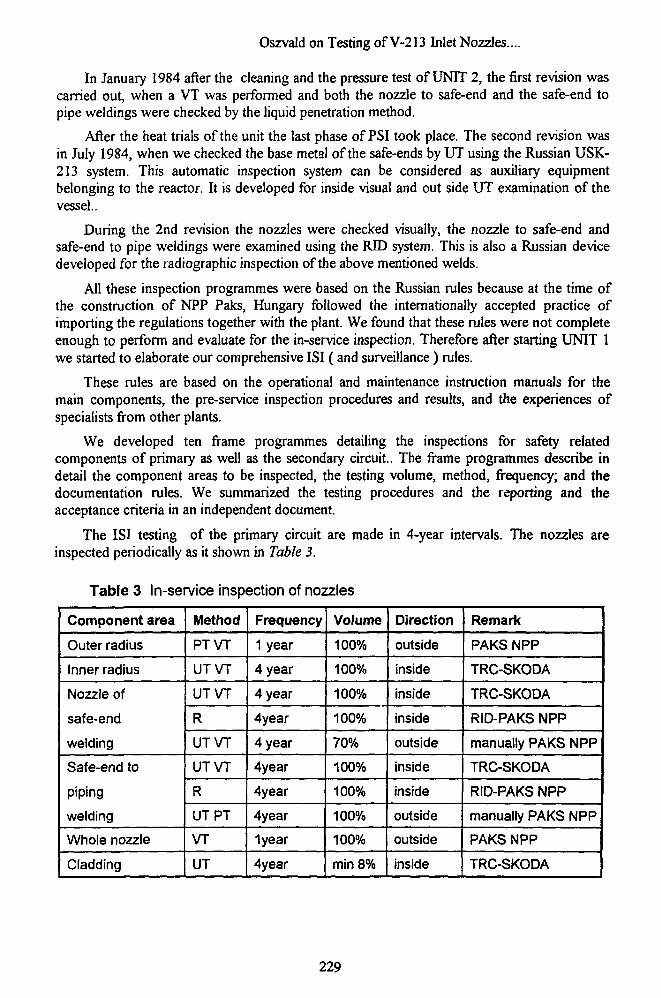
Oszvald on Testing of V-213 Inlet Nozzles....
In January 1984 after the cleaning and the pressure test of UNIT 2, the first revision wascarried out, when a VT was performed and both the nozzle to safe-end and the safe-end topipe weldings were checked by the liquid penetration method.
After the heat trials of the unit the last phase of PSI took place. The second revision wasin July 1984, when we checked the base metal of the safe-ends by UT using the Russian USK-213 system. This automatic inspection system can be considered as auxiliary equipmentbelonging to the reactor. It is developed for inside visual and out side UT examination of thevessel..
During the 2nd revision the nozzles were checked visually, the nozzle to safe-end andsafe-end to pipe weldings were examined using the RID system. This is also a Russian devicedeveloped for the radiographic inspection of the above mentioned welds.
All these inspection programmes were based on the Russian rules because at the time ofthe construction of NPP Paks, Hungary followed the internationally accepted practice ofimporting the regulations together with the plant. We found that these rules were not completeenough to perform and evaluate for the in-service inspection. Therefore after starting UNIT 1we started to elaborate our comprehensive ISI (and surveillance ) rules.
These rules are based on the operational and maintenance instruction manuals for themain components, the pre-service inspection procedures and results, and the experiences ofspecialists from other plants.
We developed ten frame programmes detailing the inspections for safety relatedcomponents of primary as well as the secondary circuit.. The frame programmes describe indetail the component areas to be inspected, the testing volume, method, frequency; and thedocumentation rules. We summarized the testing procedures and the reporting and theacceptance criteria in an independent document.
The ISI testing of the primary circuit are made in 4-year intervals. The nozzles areinspected periodically as it shown in Table 3.
Table 3 In-service inspection of nozzles
Component area
Outer radius
Inner radius
Nozzle of
safe-end
welding
Safe-end to
piping
welding
Whole nozzle
Cladding
Method
PTVT
UTVT
UTVT
R
UTVT
UTVT
R
UTPT
VT
UT
Frequency
1 year
4 year
4 year
4year
4 year
4year
4year
4year
1year
4year
Volume
100%
100%
100%
100%
70%
100%
100%
100%
100%
min 8%
Direction
outside
inside
inside
inside
outside
inside
inside
outside
outside
inside
Remark
PAKS NPP
TRC-SKODA
TRC-SKODA
RID-PAKS NPP
manually PAKS NPP
TRC-SKODA
RID-PAKS NPP
manually PAKS NPP
PAKS NPP
TRC-SKODA
229
Oszvald on Testing of V-213 Inlet Nozzles...
It should be noted, that we cancelled the automatic UT inspection of the base metal of thesafe-end by the USK-213 system. This was decided because on the one hand we did not findany defects, and on the other hand we tested approximately 50 % of this area during manualUT of dissimilar welds.
Russian rules has no criteria for the ultrasonic inspection of austenitic and dissimilar weldjoints. However the international ISI practice shows that for volumetric examination of theabove mentioned welds UT is used.
Our specialists developed an ultrasonic technology for inspection of nozzle to safe-endand safe end to pipe welds. These was used during the 2nd revision and now the upgradedtechnology is included into the ISI frame programme.
Further development in progress to mechanize these UT inspections and to extend thescope for the inner radius area. The work is going within a project aimed at modernizing theUSK system. This project is supported by the IAEA with contributions from Spanish andHungarian institutions.
The results of NDT inspections of the cold leg nozzles of PAKS-2 shown thatunacceptable defects have not been discovered.
Indications exceeding the reporting level of UT were observed during the 0 levelinspection. During the recurring inspections the same indications were found. The resultsshown that no significant change of defect size occurred.
OPTIONAL TESTING
During the hydrotest in 1988 acoustic emission and deformation measurement by straingauges were performed as optional testing
Acoustic emission measurement was prepared and performed by the staff of the AtomicEnergy Research Institute (AEKI), together with the Power Plant Service Company (EROKAR ) and specialists of the Material Testing Department of the NPP.
In the nozzle area 12 acoustic emission transducers were put on the vessel and 3additional ones on the primary circuit tubes attached by magnetic holders placed manually.
A 16 channel acoustic emission instrument (Defectophone) was applied
The maximum pressure during the hydrotest was 191.2 bars ( 55 % overpressure ) withduration a 10 minutes.
After the hydrotest the acoustic emission data stored in the memory of the Defectophonedevice were transferred to a PC and evaluated by data processing software.
During the acoustic emission test no critically active source (propagating defect) wasfound.
The measurement of the actual stresses in a nozzle of UNIT 2 was accomplished by theIron and Steel Research Institute ( VASKUT ).
26 strain gauges were positioned on a hot leg nozzle in axial and tangential directions inorder to determine the stress condition of this area during the hydrotest. The data were storedin a computer.
The results shown that the stresses in the nozzle surface followed the Hook's law,consequently residual deformation did not arise.
230
Oszvald on Testing of V-213 Inlet Nozzles....
SUMMARY
The main goal of this brief overview was to introduce the material and ISI testingtechnology of the inlet nozzle of the PAKS UNIT 2. The authors would like to highlight thatthe results obtained from the above-mentioned tests and measurements could serve as a goodbasis for the IAEA pilot study on nozzles and can be used during prediction of the WER-440type reactors.
REFERENCES
[ij Trampus, P., Material testing and evaluation from the point of view of nuclearpower plant safety.The Proceedings of the 10th Congress on Material Testing,Volume I., GTE, Budapest, 1991, pp. 30-46
[2] Pellionisz, P. at. al., Monitoring acoustic emission at in-service inspection hydrotestin Nuclear Power Plant Paks. Experience and further improvement of in-serviceinspection methods and programmes of NPP-s with particular emphasis on on-linetechniques. Nuclear Information Centre, Prague, 1989, pp. 173-187
[3] Material testing and strain measurement of unit 2 at NPP Paks during hydrotest.Testing report.(in Hungarian). VASKUT, Budapest, 1989.
[4] ISI program. Reactor vessel and sealings. (in Hungarian) PA Rt. NUIG AGVO,PAKS 1992.
[5] Komplekt oborudovanija reaktornoj ustanovki. V-213 cs. SKODA Plzen.
231
Kupca et al. on The Chemical Composition Determination ...
THE CHEMICAL COMPOSITION DETERMINATIONAND HARDNESS MEASUREMENT ACROSS THE WELD #4OF THE REACTOR PRESSURE VESSEL UNIT-1 INJASLOVSKE BOHUHICE
LUDOV1TKUPCA, MARTIN BREZINA, MARKO NOVAK, IVANKNIZ*Nuclear Power Plant Research Institute (VUJE)Okruzna 5, 91864 Trnava, Czech and Slovak Federal Republic* Nuclear Power Plant Jaslovske Bohunice (EBO)91931 Jaslovske Bohunice, Czech and Slovak Federal Republic
ABSTRACT
In March 1992, the samples from the base material and critical circumferential weld joint#4 of the reactor pressure vessel V-230 type in Jaslovske Bohunice Unit-1 by means of thespecial equipment for the analysis of the chemical composition in Nuclear Power PlantsResearch Institute (VUJE) laboratories were prepared. Except results achieved from analysis ofthe irradiated samples are presented the results of the hardness measurements of reactorpressure vessel material across the weld #4 too. All this results will serve as input data for theirradiation embrittlement evaluation of he RPV Unit-1 NPP V-l in Jaslovske Bohunice.
Keywords:
WWER, reactor, 15CH2MFA steel, annealing, irradiation embrittlement recovery,chemical analysis, hardness measurement,
INTRODUCTION
This paper is closely connected to the "Regulation Act #5" of the Czechoslovak AtomicEnergy Commission (CSKAE) issued in 1990, concerning to the reliability and safe operationof the PWR WWER-440 type with Reactor Pressure Vessels (RPV) V-230 type. On the baseof this decision were performed:
• the sampling of the RPV material Unit-1 from the weld #4, and from the basematerial above and below this weld
• the hardness measurement across the weld 84, on the external surface of this RPV,using the special SKODA-made apparatus in the narrow gap between the RPVand biological shielding vessel.
This activity is wide supported by the World Association of Nuclear Operators (WANO)program concerning the WWER-440 V-230 type too.
The samples prepared by milling were used for the chemical analysis, both the weld andbase metal, to achieve more precise and reliable informations are available in originaldocumentation. The hardness measurement using the ball indentor through the stripe from Ni-foil was performed to identify the real position of the weld #4, and to compare these resultswith the measurements on the Unit #2 performed in autumn 1989 [1].
232
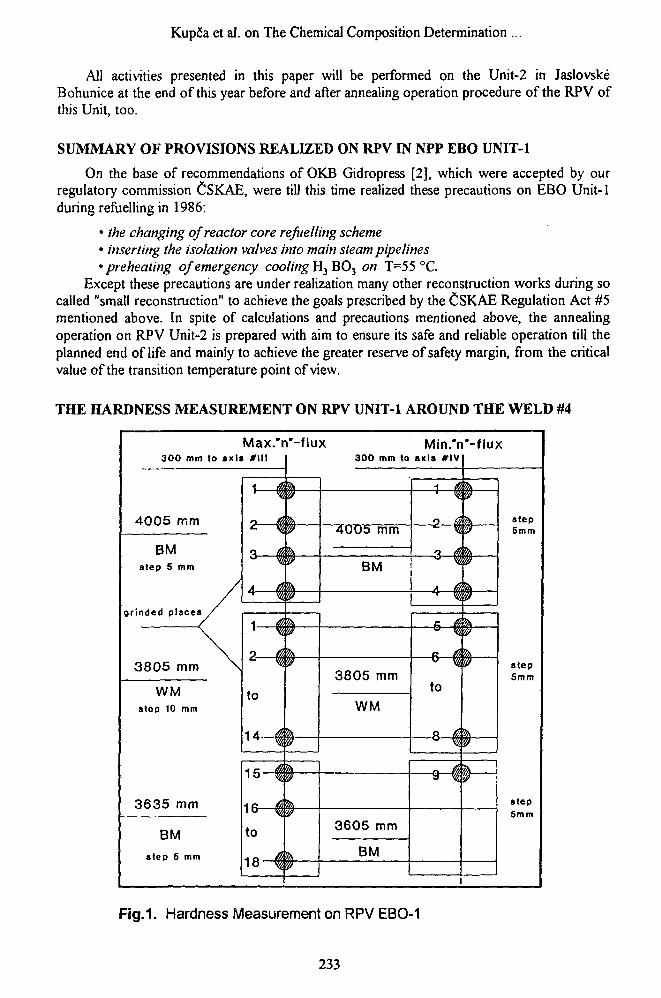
Kupca et al. on The Chemical Composition Determination ...
All activities presented in this paper will be performed on the Unit-2 in JaslovskeBohunice at the end of this year before and after annealing operation procedure of the RPV ofthis Unit, too.
SUMMARY OF PROVISIONS REALIZED ON RPV IN NPP EBO UNIT-1
On the base of recommendations of OKB Gidropress [2], which were accepted by ourregulatory commission CSKAE, were till this time realized these precautions on EBO Unit-1during refuelling in 1986:
• the changing of reactor core refuelling scheme• inserting the isolation valves into main steam pipelines'preheating of emergency cooling H3 B03 on T=55 °C.
Except these precautions are under realization many other reconstruction works during socalled "small reconstruction" to achieve the goals prescribed by the CSKAE Regulation Act #5mentioned above. In spite of calculations and precautions mentioned above, the annealingoperation on RPV Unit-2 is prepared with aim to ensure its safe and reliable operation till theplanned end of life and mainly to achieve the greater reserve of safety margin, from the criticalvalue of the transition temperature point of view.
THE HARDNESS MEASUREMENT ON RPV UNIT-1 AROUND THE WELD #4
Max."n"-flux300 mm to axis #111
4005 mm
BMstep 5 mm
grinded places
3805 mm
WMstep 10 mm
3635 mm
BMstep 5 mm
1-
to
14--*
15-4
16-
to
18-
Min.'n'-flux300 mm to axis #IV
4UUb mm
BM
3805 mm
WM
to
3605 mm
BM
step6mm
stepSmm
stepSmm
Fig.1. Hardness Measurement on RPV EBO-1
233
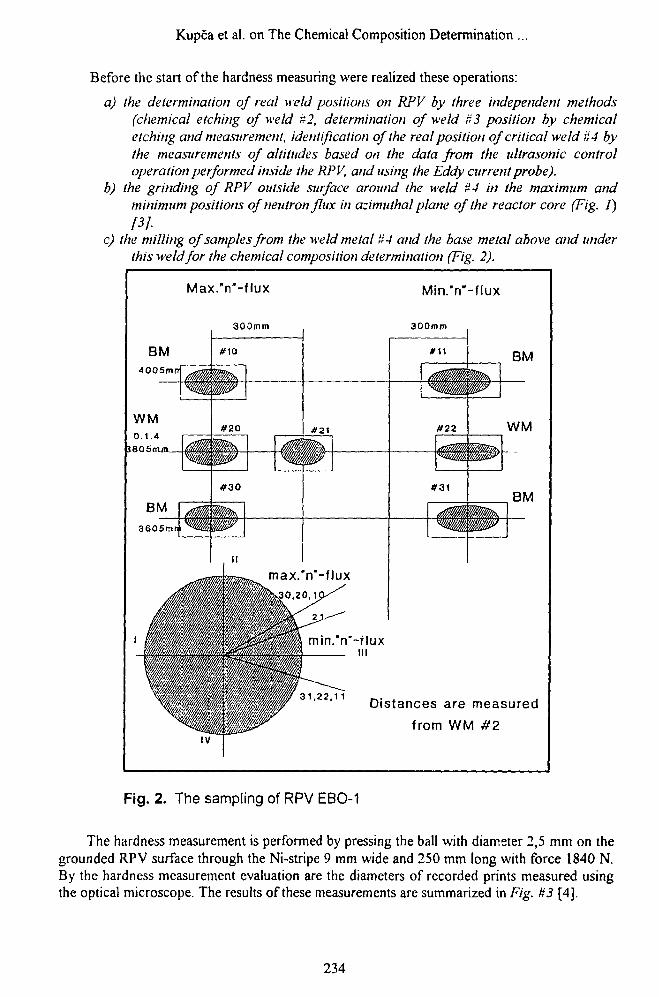
Kupca et al. on The Chemical Composition Determination ...
Before the start of the hardness measuring were realized these operations:
a) the determination of real weld positions on RPV by three independent methods(chemical etching of weld it 2, determination of weld it 3 position by chemicaletching and measurement, identification of the real position of critical weld U4 bythe measurements of altitudes based on the data from the ultrasonic controloperation performed inside the RPV, and using the Eddy current probe).
b) the grinding of RPV outside surface around the weld #4 in the maximum andminimum positions of neutron flux in azimuthal plane of the reactor core (Fig. 1)
c) the milling of samples from the weld metal if 4 and the base metal above and underthis weld for the chemical composition determination (Fig. 2).
WM0.1.4
38O5nun_
Max."n"-flux
300mm
Min.'n'-flux
BM4005mrr
3605m
#10
# 2 0
300mm
#21
# 3 0
#11
# 2 2
#31
BM
WM
BM
min.'n'-fluxHI
1.22.1 1 Distances are measured
from WM #2IV
Fig. 2. The sampling of RPV EBO-1
The hardness measurement is performed by pressing the ball with diameter 2,5 mm on thegrounded RPV surface through the Ni-stripe 9 mm wide and 250 mm long with force 1840 N.By the hardness measurement evaluation are the diameters of recorded prints measured usingthe optical microscope. The results of these measurements are summarized in Fig. #3 [4].
234
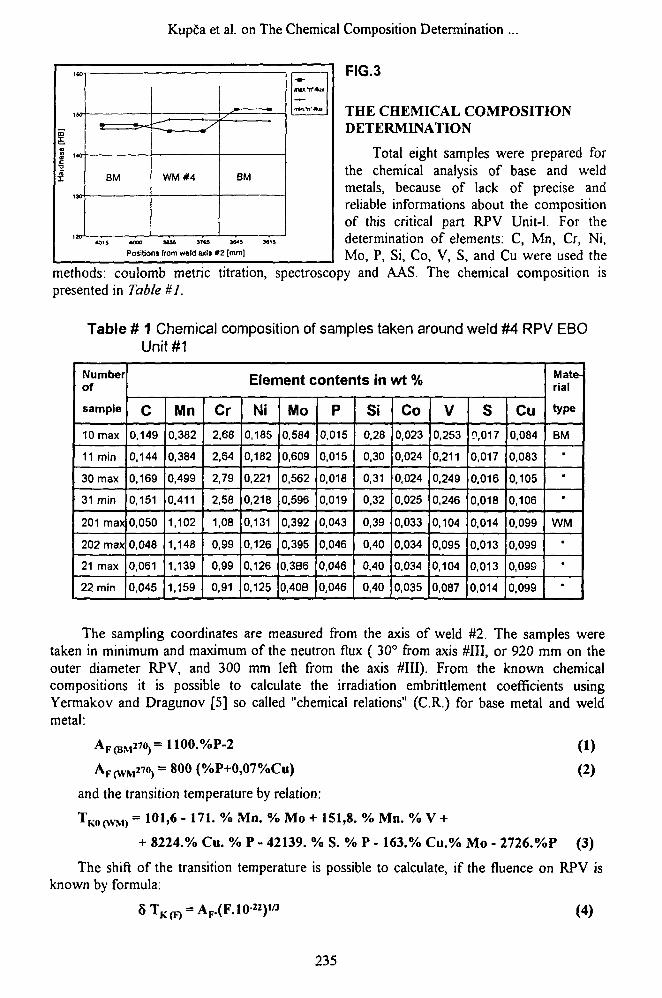
Kupca et al. on The Chemical Composition Determination ...
BM WM#4 BM
FIG.3
THE CHEMICAL COMPOSITIONDETERMINATION
Total eight samples were prepared forthe chemical analysis of base and weldmetals, because of lack of precise andreliable informations about the compositionof this critical part RPV Unit-1. For thedetermination of elements: C, Mn, Cr, Ni,Mo, P, Si, Co, V, S, and Cu were used the
methods: coulomb metric titration, spectroscopy and AAS. The chemical composition ispresented in Table #1.
Table # 1 Chemical composition of samples taken around weld #4 RPV EBOUnit #1
4000 MM 3?«3 364*
Positions from weld axis #2 [mm]
Numberof
sample
10 max
11 min
30 max
31 min
201 max
202 max
21 max
22 min
Element contents in wt %
C
0,149
0,144
0,169
0,151
0,050
0,048
0,061
0,045
Mn0,382
0,384
0,499
0,411
1,102
1.148
1,139
1,159
Cr2.68
2,64
2,79
2,58
1,08
0,99
0,99
0,91
Ni0,185
0,182
0.221
0,218
0.131
0,126
0,126
0,125
Mo0,584
0,609
0,562
0.596
0,392
0,395
0.3B6
0.40B
P0,015
0,015
0,018
0,019
0,043
0,046
0,046
0.046
Si0,28
0,30
0,31
0,32
0,39
0,40
0,40
0,40
Co0,023
0,024
0,024
0,025
0,033
0,034
0.034
0,035
V0,253
0,211
0,249
0,246
0.104
0,095
0,104
0,087
s0,017
0,017
0.016
0,018
0,014
0,013
0,013
0,014
Cu0,084
0,083
0,105
0,106
0,099
0,099
0,098
0,099
Mate-rial
type
BM
•
•
•
WM•
•
The sampling coordinates are measured from the axis of weld #2. The samples weretaken in minimum and maximum of the neutron flux ( 30° from axis #111, or 920 mm on theouter diameter RPV, and 300 mm left from the axis #111). From the known chemicalcompositions it is possible to calculate the irradiation embrittlement coefficients usingYermakov and Dragunov [5] so called "chemical relations" (C.R.) for base metal and weldmetal:
AF(BM27o)=1100.%P-2
AF(^,270) = 800 (%P+0,07%Cu)
and the transition temperature by relation:
(1)
(2)
M ° M n -TK0(WM) = 1 0 1 > 6 - 1 7 L
+ 8224.% Cu. % P - 42139. % S. % P - 163.% Cu.% Mo - 2726.%P (3)
The shift of the transition temperature is possible to calculate, if the fluence on RPV isknown by formula:
235
Kupca et at. on The Chemical Composition Determination ...
THE RESULTS OF ANALYSIS
1) By the analysis of prints on Ni-foil stripes we found that the most of prints ongrounded surface have not the regular shape. This fact was observed by the firsthardness measurement on the RPV Unit-2 too, and brought us the measuringinterpretation problems.
2) As we stated in our first published results [I], the measurement in heavy conditionsusing method mentioned above, give us informative results only.
3) The real position of weld #4 was identified 3805 mm above the axis of weld #2 asitfollows from the contents of elements C, Mn, Cr, P and Cu in samples #201max., #202 max., #21 max. and #22 min (see Table #. 1).
4) The chemical composition of samples #10 max., and till min, correspond to the basemetal of RPV (forging #431762 above weld #4) samples #30 max, and #31 min,correspond to the base metal of RPV (forging #431198 under weld #4).
5) The results of calculations irradiation embrittlement coefficients using theYermakov-Dragunov "C. R." are.- AF(BSf) - 14,5 for the base metal above the weld #4,
AF(BSn = 18,9 for the base metal under the weld #4- AF(Wft{) - 41,5 for the weld metal- the value of transition temperature of weld metal #4 before irradiation
- the shift of the transition temperature of weld metal #4 caused by irradiation
- the calculations of the critical value of the transition temperature of weld metal#4 after 12 years of operation using the neutron fluence measurements(E >0,5 MeV) [6], give us :
- TK(F, K\Q =+l2l°c for the inner RPV surface- TK(K mo = +62 °C in 1/3 depth of the RPV wall.
6) Comparing the results of the chemical analysis and calculations with theconservative assumptions given in expertises of both EBO Units [7), bring usmuch more optimistic data for revaluation the irradiation embrittlement of thisUnit.
REFERENCES
[1) Kupca L.,Bfezina M.: The results of hardness measurements in the weld #4 regionRPV EBO Unit #2, Report VUJE #3140/44/89
[2] GKAE-OKB GIDROPRES: The provisions for higher operational safety of theRPV WWER-440 type for PWR in CSSR till the planned EOL, USSR, 1984.
[3) Kniz I.Repka M.: The sampling of the RPV EBO NPP V-l Unit #1, Report EBO,April 1992
[4) Kupca E. et al.: The results of hardness measurements in the weld #4 region,chemical analysis and dosimetry of the samples taken from RPV EBO Unit # 1,Report VUJE #360/15/92, to be published
[5] Yermakov N. I., Dragunov J. G.: Some RPV material WWER-440 type parameters.Proceedings of Interatomenergo Conference, Plzen, May 1983.
[6] Adamovsky V.: The fluence measurement in asimuthal and axis directions of theRPV EBO Unit #1, Report EBO, 18. 3. 1992.
[7] Stepanek S. et al.: The evaluation of RPV and primary pipes of the NPP V-l,Report of CS-experts Commision, November 1990
236
Nishiyama et al. Electrochemical Monitoring of ...
Electrochemical Monitoring of Ageing Embrittlement ofFerritic Steel for High Temperature Reactor Pressure BoundaryComponent
NISHIYAMA, Y * FUKAYA, K. * SUZUKI, M *, ETO, M. * andSHOJI, T. *** Japan Atomic Energy Reseaich Institute, Shirakata, Tokai-Mura, Ibaraki-Ken,
319-11 Japan** Tohoku University, Aramaki, Sendai-shi, 980 Japan
ABSTRACT:
Electrochemical method was studied to apply it for the nondestructive evaluation ofageing embrittlement of 2 V4Cr-lMo steel for the reactor pressure vessel of the hightemperature gas-cooled reactor (HTGR) which is under construction in Japan. Isothermalageing were conducted at temperatures from 400 °C to 500 °C for up to 50000 h for thisstudy. Electrochemical test specimens with dimensions of 10x10x5 (mm) were taken from theundamaged portion of Charpy V-notch impact bars. In the anodic polarisation curvesmeasured in 55% Ca (NO3)2 solution, the embrittled materials show the higher secondary peakof the current density in the passive potential region. This characteristic increase in the currentdensity corresponds to intergranular segregation of phosphorus which prevents the Formationof passive layer at grain boundaries, and the degree of the increment can be correlated with theshift of Charpy ductile to brittle transition temperature (DBTT). It is also suggested from thecomparison of materials isothermally aged with and without applied stress that theenhancement of phosphorus segregation due to an applied stress is only recognised after 3000h ageing and is diminished with increasing ageing time.
Keywords:
2 V4Cr-lMo steel, reactor pressure vessel, electrochemical method polarisation, ageingembrittlement, phosphorus segregation, carbide, nondestructive examination
INTRODUCTION
Nondestructive test techniques which can evaluate the material degradation directly frompressure boundary components or from specimens with relatively small volume possess apromising potential to improve a reliability of remaining life estimation of a reactor pressurevessel (RPV). Recent studies have demonstrated that the electrochemical technique provides awide range of applicability to the nondestructive detection of several kinds of ageing damagesin high temperature components. This technique makes use of the preferential dissolution ofsome specific microstructure, such as carbides or segregated impurity atoms which have a closerelation with the material degradation [1] [2]. Thus, electrochemical parameters forcharacterising the material degradation can be determined based on a certainphenomenological background.
In this study, the electrochemical method was applied to the nondestructive evaluation ofageing embrittlement of normalised and tempered (NT) 2 V4Cr-lMo steels for the reactorpressure vessel of the high temperature gas-cooled reactor which is under construction inJapan (HTTR, High Temperature Engineering Test Reactor). It is well known that low alloyferritic steels become brittle due to intergranular segregation of impurity atoms such as
237
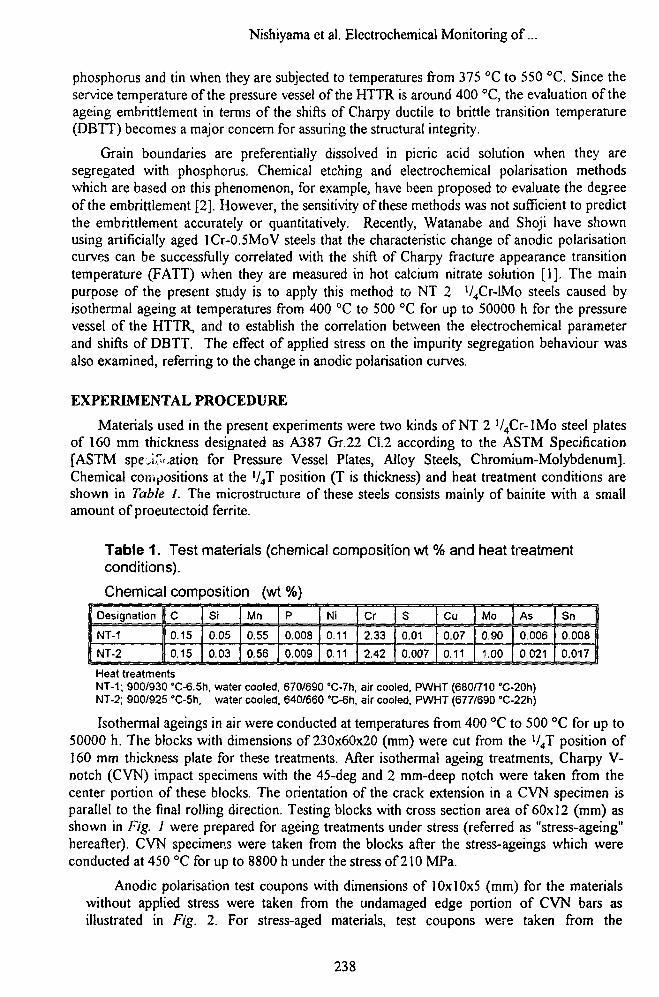
Nishiyama et al. Electrochemical Monitoring of...
phosphorus and tin when they are subjected to temperatures from 375 °C to 550 °C. Since theservice temperature of the pressure vessel of the HTTR is around 400 °C, the evaluation of theageing embrittlement in terms of the shifts of Charpy ductile to brittle transition temperature(DBTT) becomes a major concern for assuring the structural integrity.
Grain boundaries are preferentially dissolved in picric acid solution when they aresegregated with phosphorus. Chemical etching and electrochemical polarisation methodswhich are based on this phenomenon, for example, have been proposed to evaluate the degreeof the embrittlement [2]. However, the sensitivity of these methods was not sufficient to predictthe embrittlement accurately or quantitatively. Recently, Watanabe and Shoji have shownusing artificially aged lCr-0.5MoV steels that the characteristic change of anodic polarisationcurves can be successfully correlated with the shift of Charpy fracture appearance transitiontemperature (FATT) when they are measured in hot calcium nitrate solution [1]. The mainpurpose of the present study is to apply this method to NT 2 V4Cr-lMo steels caused byisothermal ageing at temperatures from 400 °C to 500 °C for up to 50000 h for the pressurevessel of the HTTR, and to establish the correlation between the electrochemical parameterand shifts of DBTT. The effect of applied stress on the impurity segregation behaviour wasalso examined, referring to the change in anodic polarisation curves.
EXPERIMENTAL PROCEDURE
Materials used in the present experiments were two kinds of NT 2 ^Cr-lMo steel platesof 160 mm thickness designated as A387 Gr.22 CI.2 according to the ASTM Specification[ASTM speJ£<.ation for Pressure Vessel Plates, Alloy Steels, Chromium-Molybdenum].Chemical compositions at the '/4T position (T is thickness) and heat treatment conditions areshown in Table I. The microstructure of these steels consists mainly of bainite with a smallamount of proeutectoid ferrite.
Table 1. Test materials (chemical composition wt % and heat treatmentconditions).
Chemical composition (wt %)
Designation || C
NT-1
NT-2
0.15
0.15
Si
0.05
0.03
Mn
0.55
0.56
P
0.008
0.009
Ni
0.11
0.11
Cr
2.33
2.42
S
0.01
0.007
Cu
0.07
0.11
Mo
0.90
1.00
As
0.006
0.021
Fin0.008
0.017
Heat treatmentsNT-1; 900/930 °C-6.5h, water cooled, 670/690 °C-7h, air cooled, PWHT (680/710 °C-20h)NT-2; 900/925 °C-5h, water cooled, 640/660 °C-6h, air cooled, PWHT (677/690 °C-22h)
Isothermal ageings in air were conducted at temperatures from 400 °C to 500 °C for up to50000 h. The blocks with dimensions of 230x60x20 (mm) were cut from the V4T position of160 mm thickness plate for these treatments. After isothermal ageing treatments, Charpy V-notch (CVN) impact specimens with the 45-deg and 2 mm-deep notch were taken from thecenter portion of these blocks. The orientation of the crack extension in a CVN specimen isparallel to the final rolling direction. Testing blocks with cross section area of 60x12 (mm) asshown in Fig. J were prepared for ageing treatments under stress (referred as "stress-ageing"hereafter). CVN specimens were taken from the blocks after the stress-ageings which wereconducted at 450 °C for up to 8800 h under the stress of 210 MPa.
Anodic polarisation test coupons with dimensions of 10x10x5 (mm) for the materialswithout applied stress were taken from the undamaged edge portion of CVN bars asillustrated in Fig. 2. For stress-aged materials, test coupons were taken from the
238
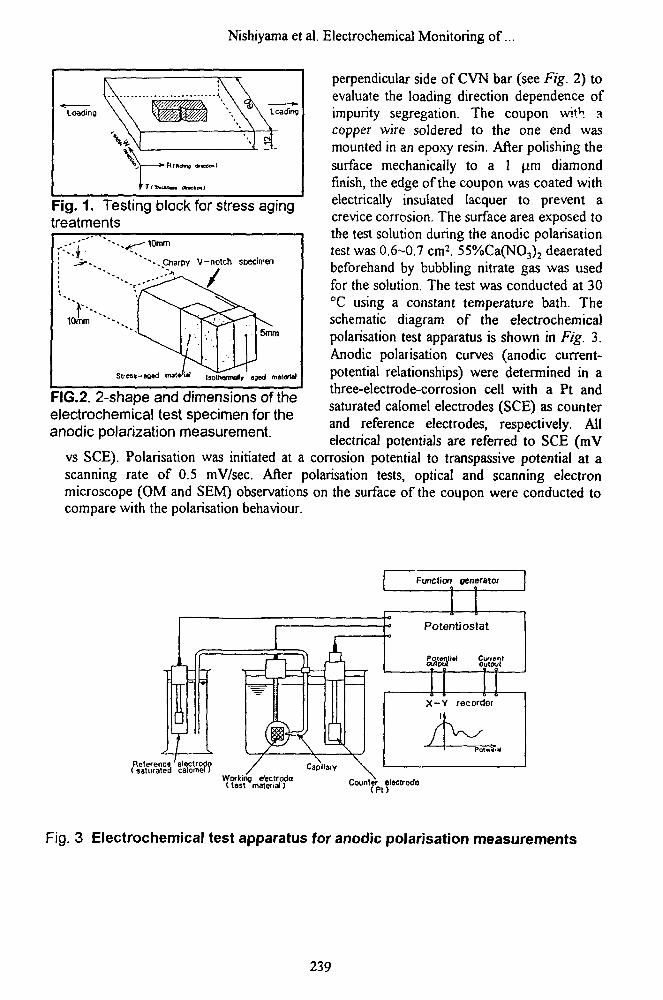
Nishiyama et al. Electrochemical Monitoring of...
Fig. 1. Testing block for stress agingtreatments
•'10mm
""..Charpv V-notch SDecirrten
10mm
Strea»-og»d
5mm
| j0Uwn™l» ajed material
FIG.2. 2-shape and dimensions of theelectrochemical test specimen for theanodic polarization measurement.
perpendicular side of C VN bar (see Fig. 2) toevaluate the loading direction dependence ofimpurity segregation. The coupon with acopper wire soldered to the one end wasmounted in an epoxy resin. After polishing thesurface mechanically to a 1 (im diamondfinish, the edge of the coupon was coated withelectrically insulated lacquer to prevent acrevice corrosion. The surface area exposed tothe test solution during the anodic polarisationtest was 0.6-0.7 cm2. 55%Ca(NO3)2 deaeratedbeforehand by bubbling nitrate gas was usedfor the solution. The test was conducted at 30°C using a constant temperature bath. Theschematic diagram of the electrochemicalpolarisation test apparatus is shown in Fig. 3.Anodic polarisation curves (anodic current-potential relationships) were determined in athree-electrode-corrosion cell with a Pt andsaturated calomel electrodes (SCE) as counterand reference electrodes, respectively. Allelectrical potentials are referred to SCE (mV
vs SCE). Polarisation was initiated at a corrosion potential to transpassive potential at ascanning rate of 0.5 mV/sec. After polarisation tests, optical and scanning electronmicroscope (OM and SEM) observations on the surface of the coupon were conducted tocompare with the polarisation behaviour.
Function Generator
o
Potentiostat
Potential CurrentOutput Output
Rofefencs electrode(saturated calomel) Capillary
X-Y recorder
Working etectrodo(tssl material) Counter electrode
( P t )
Fig. 3 Electrochemical test apparatus for anodic polarisation measurements
239
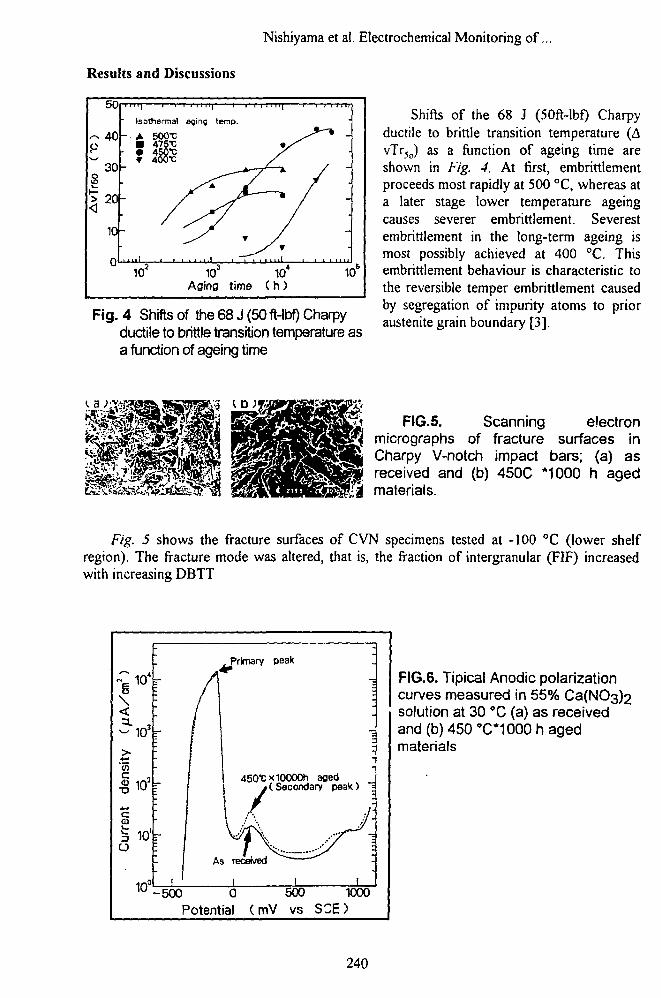
Nishiyama et al. Electrochemical Monitoring of...
Results and Discussions
50
isothermal afling temp.
p40
Fig. 4 Shifts of the 68 J (50 ft-lbf) Charpyductile to brittle transition temperature asa function of ageing time
Shifts of the 68 J (50ft-lbf) Charpyductile to brittle transition temperature (AvTr5o) as a function of ageing time areshown in Fig. 4. At first, embrittlementproceeds most rapidly at 500 °C, whereas ata later stage lower temperature ageingcauses severer embrittlement. Severestembrittlement in the long-term ageing ismost possibly achieved at 400 °C. Thisembrittlement behaviour is characteristic tothe reversible temper embrittlement causedby segregation of impurity atoms to prioraustenite grain boundary [3].
FIG.5. Scanning electronmicrographs of fracture surfaces inCharpy V-notch impact bars; (a) asreceived and (b) 450C *1000 h agedmaterials.
Fig. 5 shows the fracture surfaces of CVN specimens tested at -100 °C (lower shelfregion). The fracture mode was altered, that is, the fraction of intergranular (FIF) increasedwith increasing DBTT
ex
\
a.
>'enc"O
§t:
d
104
103
in*
10
10'
10°
: p
r / Ii /h /
1 Illl
[
1
j
-
:-
1
I
rimary peak
450"Cxi0000h
:
-:j
\
agedy(Secondary peak) ;
'/A \./ >!••-
As reoewed ~~
1-500 0
Potential
i500
(mV vs
jl -
-
I1000
SCE)
FIG.6. Tipical Anodic polarizationcurves measured in 55% Ca(NC>3)2solution at 30 °C (a) as receivedand (b) 450 °C*1000h agedmaterials
240
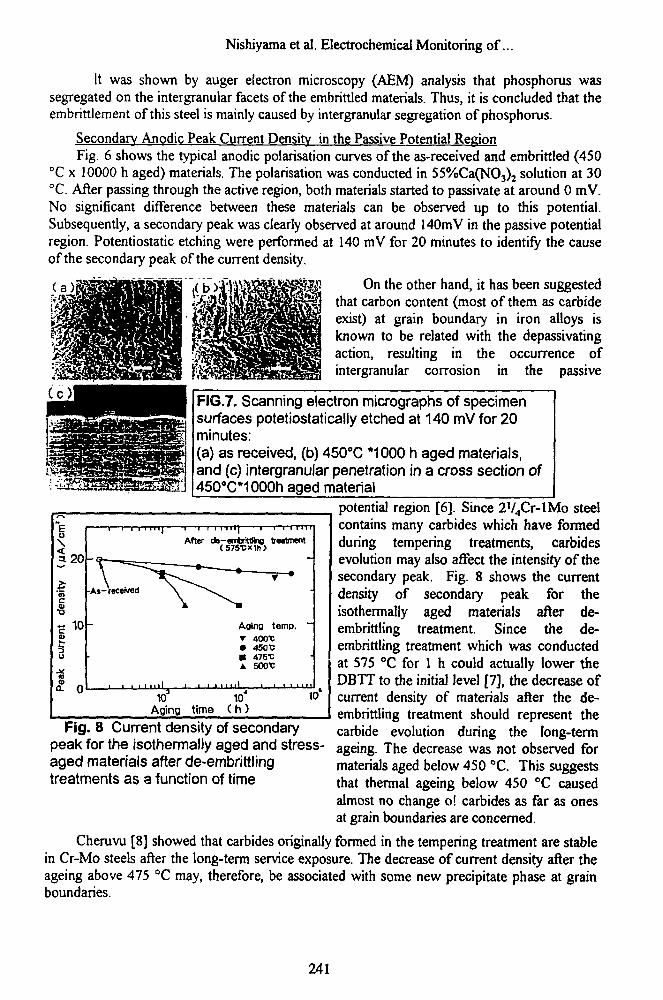
Nishiyama et al. Electrochemical Monitoring of...
It was shown by auger electron microscopy (AEM) analysis that phosphorus wassegregated on the intergranular facets of the embrittled materials. Thus, it is concluded that theembrittlement of this steel is mainly caused by intergranular segregation of phosphorus.
Secondary Anodic Peak Current Density in the Passive Potential RegionFig. 6 shows the typical anodic polarisation curves of the as-received and embrittled (450
°C x 10000 h aged) materials. The polarisation was conducted in 55%Ca(NO3)2 solution at 30°C. After passing through the active region, both materials started to passivate at around 0 mV.No significant difference between these materials can be observed up to this potential.Subsequently, a secondary peak was clearly observed at around 140mV in the passive potentialregion. Potentiostatic etching were performed at 140 mV for 20 minutes to identify the causeof the secondary peak of the current density.
On the other hand, it has been suggestedthat carbon content (most of them as carbideexist) at grain boundary in iron alloys isknown to be related with the depassivatingaction, resulting in the occurrence ofintergranular corrosion in the passive
c) FIG.7. Scanning electron micrographs of specimensurfaces potetiostatically etched at 140 mV for 20minutes:(a) as received, (b) 450°C *1000 h aged materials,and (c) intergranular penetration in a cross section of450"C*1000haged material
o- 0
T 1 I I I I I I) I
After dQ"~6fflfcrittfino(575-Cxih)
Aging temp,r 40CTC• 450T• 075-CA 500T
potential region [6]. Since 2V4Cr-lMo steelcontains many carbides which have formedduring tempering treatments, carbidesevolution may also affect the intensity of thesecondary peak. Fig. 8 shows the currentdensity of secondary peak for theisothermally aged materials after de-embrittling treatment. Since the de-embrittling treatment which was conductedat 575 °C for 1 h could actually lower theDBTT to the initial level [7], the decrease ofcurrent density of materials after the de-embrittling treatment should represent thecarbide evolution during the long-termageing. The decrease was not observed formaterials aged below 450 °C. This suggeststhat thermal ageing below 450 °C causedalmost no change o! carbides as far as onesat grain boundaries are concerned.
Cheruvu [8] showed that carbides originally formed in the tempering treatment are stablein Cr-Mo steels after the long-term service exposure. The decrease of current density after theageing above 475 °C may, therefore, be associated with some new precipitate phase at grainboundaries.
10 10Aging time ( h )
10"
Fig. 8 Current density of secondarypeak for the isothermally aged and stress-aged materials after de-embrittlingtreatments as a function of time
241
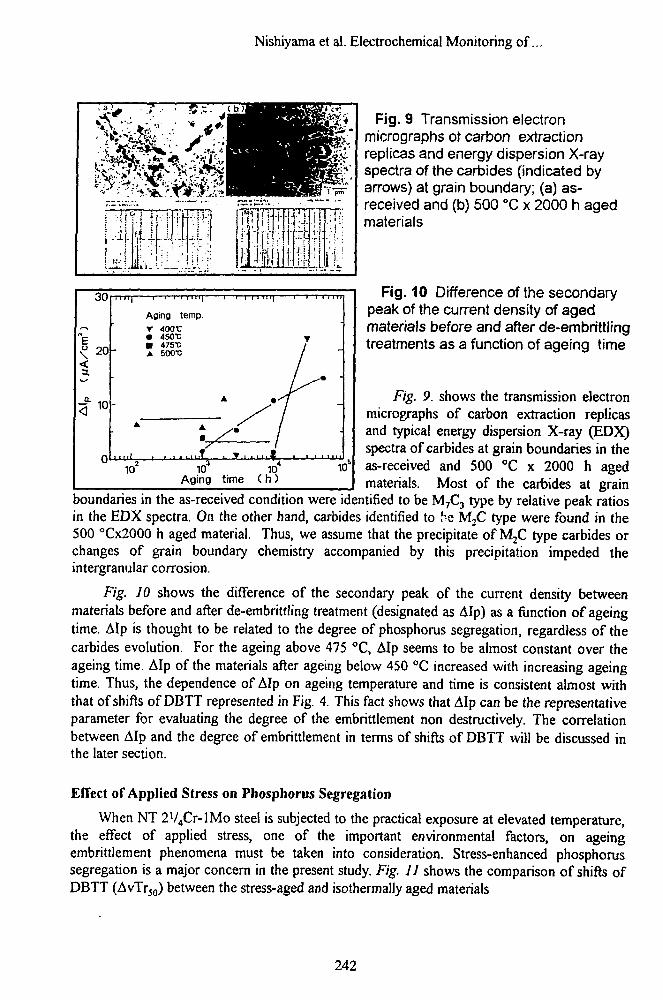
Nishiyama et al. Electrochemical Monitoring of...
30
20
I M l | 1 1—I I I Mlj 1 1—I t 1 I !
Aging temp.r -KWC• 450-c• 475-c> 50O-C
J X l i - • • • • • • < !
.10'Aging time 10"
Fig. 9 Transmission electronmicrographs ot carbon extractionreplicas and energy dispersion X-rayspectra of the carbides (indicated byarrows) at grain boundary; (a) as-received and (b) 500 °C x 2000 h agedmaterials
Fig. 10 Difference of the secondarypeak of the current density of agedmaterials before and after de-embrittlingtreatments as a function of ageing time
Fig. 9. shows the transmission electronmicrographs of carbon extraction replicasand typical energy dispersion X-ray (EDX)spectra of carbides at grain boundaries in theas-received and 500 °C x 2000 h agedmaterials. Most of the carbides at grain
boundaries in the as-received condition were identified to be M7C3 type by relative peak ratiosin the EDX spectra. On the other hand, carbides identified to be M2C type were found in the500 oCx2000 h aged material. Thus, we assume that the precipitate of MjC type carbides orchanges of grain boundary chemistry accompanied by this precipitation impeded theintergranular corrosion.
Fig. 10 shows the difference of the secondary peak of the current density betweenmaterials before and after de-embrittling treatment (designated as Alp) as a function of ageingtime. Alp is thought to be related to the degree of phosphorus segregation, regardless of thecarbides evolution. For the ageing above 475 °C, Alp seems to be almost constant over theageing time. Alp of the materials after ageing below 450 °C increased with increasing ageingtime. Thus, the dependence of Alp on ageing temperature and time is consistent almost withthat of shifts of DBTT represented in Fig. 4. This fact shows that Alp can be the representativeparameter for evaluating the degree of the embrittlement non destructively. The correlationbetween Alp and the degree of embrittlement in terms of shifts of DBTT will be discussed inthe later section.
Effect of Applied Stress on Phosphorus Segregation
When NT 2V4Cr-lMo steel is subjected to the practical exposure at elevated temperature,the effect of applied stress, one of the important environmental factors, on ageingembrittlement phenomena must be taken into consideration. Stress-enhanced phosphorussegregation is a major concern in the present study. Fig. 11 shows the comparison of shifts ofDBTT (AvTrJ0) between the stress-aged and isothermally aged materials
242
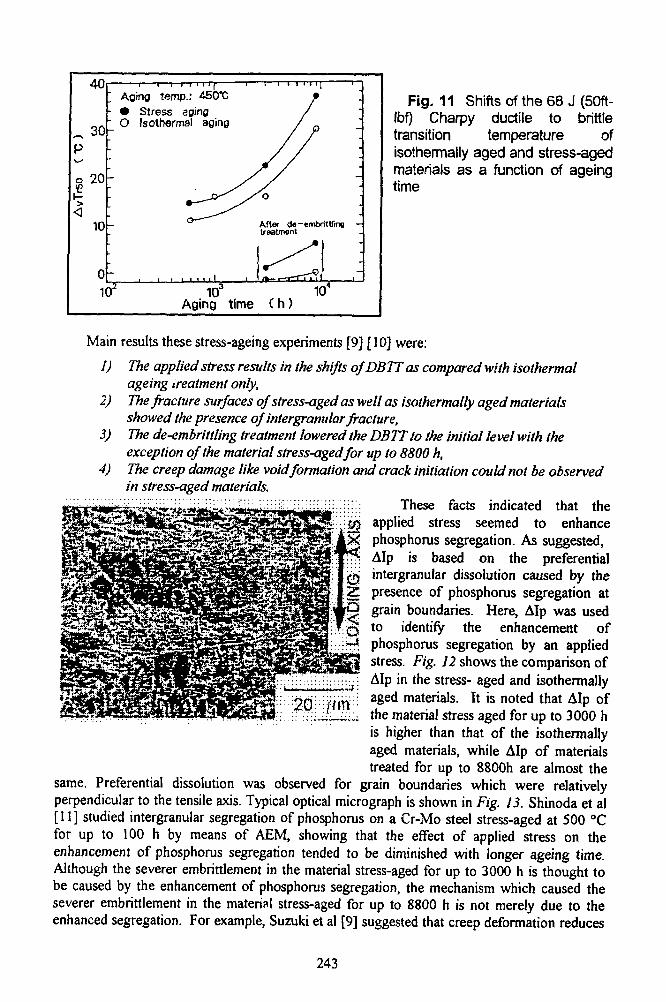
40
30
o 20
10
o-10*
1 1—I—I I I I 11
Aging temp.: 450*C• Stress aging
" O Isothermal aging
After d«-embritttinstreatment
10"Aging time ( h )
Fig. 11 Shifts of the 68 J (50ft-Ibf) Charpy ductile to brittletransition temperature ofisothermally aged and stress-agedmaterials as a function of ageingtime
Main results these stress-ageing experiments [9] [10] were:
1) The applied stress results in the shifts ofDBTTas compared with isothermal
2)
3)
ageing treatment only,The fracture surfaces of stress-aged as well as isothermally aged materialsshowed the presence of intergranular fracture,The de-embrittling treatment lowered the DBTTto the initial level with theexception of the material stress-aged for up to 8800 h,The creep damage like void formation and crack initiation could not be observedin stress-aged materials.
These facts indicated that theapplied stress seemed to enhancephosphorus segregation. As suggested,Alp is based on the preferentialintergranular dissolution caused by thepresence of phosphorus segregation atgrain boundaries. Here, Alp was usedto identify the enhancement ofphosphorus segregation by an appliedstress. Fig. 12 shows the comparison ofAlp in the stress- aged and isothermallyaged materials. It is noted that Alp ofthe material stress aged for up to 3000 his higher than that of the isothermallyaged materials, while Alp of materialstreated for up to 8800h are almost the
same. Preferential dissolution was observed for grain boundaries which were relativelyperpendicular to the tensile axis. Typical optical micrograph is shown in Fig. 13. Shinoda et al[11] studied intergranular segregation of phosphorus on a Cr-Mo steel stress-aged at 500 °Cfor up to 100 h by means of AEM, showing that the effect of applied stress on theenhancement of phosphorus segregation tended to be diminished with longer ageing time.Although the severer embrittlement in the material stress-aged for up to 3000 h is thought tobe caused by the enhancement of phosphorus segregation, the mechanism which caused theseverer embrittlement in the material stress-aged for up to 8800 h is not merely due to theenhanced segregation. For example, Suzuki et al [9] suggested that creep deformation reduces
243
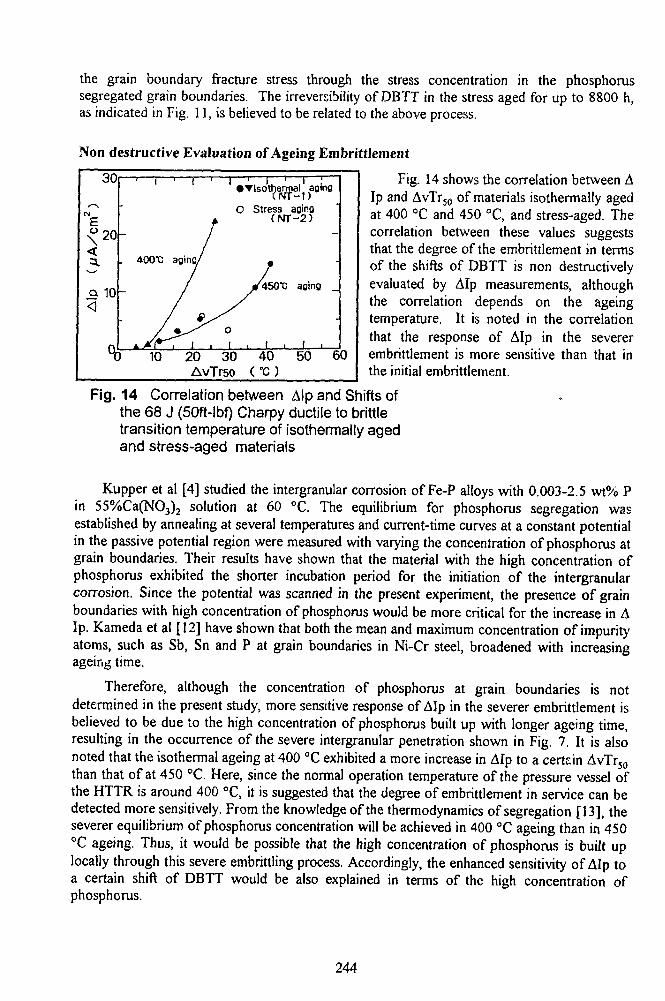
the grain boundary fracture stress through the stress concentration in the phosphorussegregated grain boundaries. The irreversibility of DBTT in the stress aged for up to 8800 h,as indicated in Fig. 11, is believed to be related to the above process.
Non destructive Evaluation of Ageing Embrittlement
o\
a.
_a
30
20
10
•
. 400*C
-
) 10
1 i •
/aging/
/
. 1 .
•Tlsothernial aging
O Stress aginop. ( M T - 2 )
y0
120 30AvTrso
•f 450"C aging
. I . I .
40 50 60
Fig. 14 shows the correlation between AIp and AvTr30 of materials isothermally agedat 400 °C and 450 °C, and stress-aged. Thecorrelation between these values suggeststhat the degree of the embrittlement in termsof the shifts of DBTT is non destructivelyevaluated by Alp measurements, althoughthe correlation depends on the ageingtemperature. It is noted in the correlationthat the response of Alp in the severerembrittlement is more sensitive than that inthe initial embrittlement.
Fig. 14 Correlation between Alp and Shifts ofthe 68 J (50ft-lbf) Charpy ductile to brittletransition temperature of isothermally agedand stress-aged materials
Kupper et al [4] studied the intergranular corrosion of Fe-P alloys with 0.003-2.5 wt% Pin 55%Ca(NO3)2 solution at 60 °C. The equilibrium for phosphorus segregation wasestablished by annealing at several temperatures and current-time curves at a constant potentialin the passive potential region were measured with varying the concentration of phosphorus atgrain boundaries. Their results have shown that the material with the high concentration ofphosphorus exhibited the shorter incubation period for the initiation of the intergranularcorrosion. Since the potential was scanned in the present experiment, the presence of grainboundaries with high concentration of phosphorus would be more critical for the increase in AIp. Kameda et al [12] have shown that both the mean and maximum concentration of impurityatoms, such as Sb, Sn and P at grain boundaries in Ni-Cr steel, broadened with increasingageing time.
Therefore, although the concentration of phosphorus at grain boundaries is notdetermined in the present study, more sensitive response of Alp in the severer embrittlement isbelieved to be due to the high concentration of phosphorus built up with longer ageing time,resulting in the occurrence of the severe intergranular penetration shown in Fig. 7. It is alsonoted that the isothermal ageing at 400 °C exhibited a more increase in Alp to a certain AvTr50
than that of at 450 °C. Here, since the normal operation temperature of the pressure vessel ofthe HTTR is around 400 °C, it is suggested that the degree of embrittlement in service can bedetected more sensitively. From the knowledge of the thermodynamics of segregation [13], theseverer equilibrium of phosphorus concentration will be achieved in 400 °C ageing than in 450°C ageing. Thus, it would be possible that the high concentration of phosphorus is built uplocally through this severe embrittling process. Accordingly, the enhanced sensitivity of Alp toa certain shift of DBTT would be also explained in terms of the high concentration ofphosphorus.
244
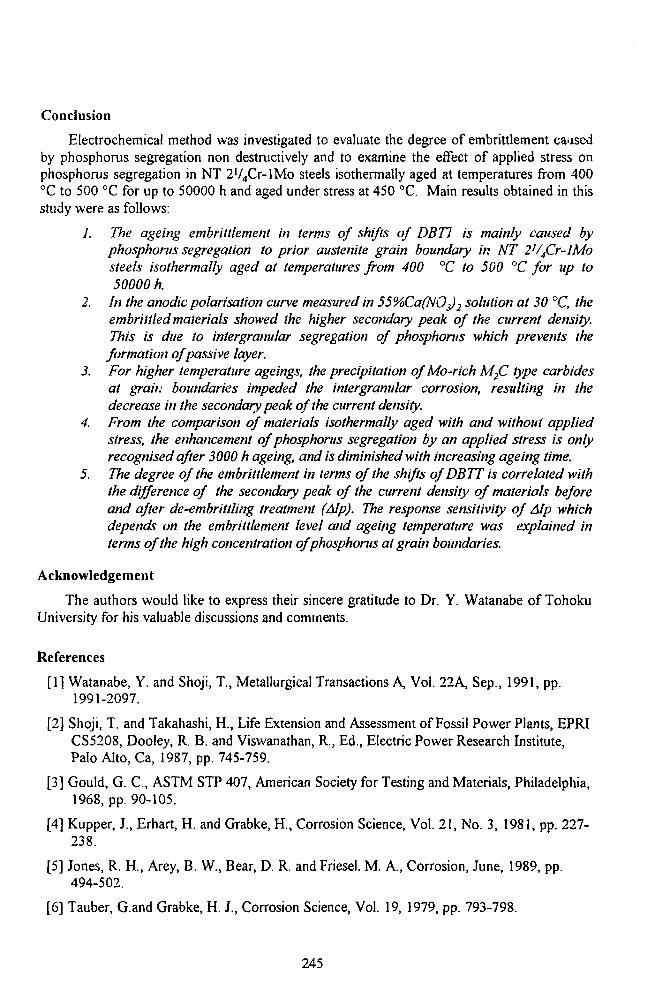
Conclusion
Electrochemical method was investigated to evaluate the degree of embrittlement causedby phosphorus segregation non destructively and to examine the effect of applied stress onphosphorus segregation in NT 2V4Cr-lMo steels isothermally aged at temperatures from 400°C to 500 °C for up to 50000 h and aged under stress at 450 °C. Main results obtained in thisstudy were as follows:
1. The ageing embrittlement in terms of shifts of DBT1 is mainly caused byphosphorus segregation to prior austenite grain boundary in NT 2J/4Cr-lMosteels isothermally aged at temperatures from 400 °C to 500 °C for tip to50000h
2. In the anodic polarisation curve measured in 55%Ca(NOs)2 solution at 30 °C, theembrittled materials showed the higher secondary peak of the current density.This is due to intergranular segregation of phosphorus which prevents the
formation of passive layer.3. For higher temperature ageings, the precipitation of Mo-rich M2C type carbides
at grain boundaries impeded the intergranular corrosion, resulting in thedecrease in the secondary peak of the current density.
4. From the comparison of materials isothermally aged with and without appliedstress, the enhancement of phosphorus segregation by an applied stress is onlyrecognised after 3000 h ageing, and is diminished with increasing ageing time.
5. The degree of the embrittlement in terms of the shifts of DBTT is correlated withthe difference of the secondary peak of the current density of materials beforeand after de-embrittling treatment (Alp). The response sensitivity of Alp whichdepends on the embrittlement level and ageing temperature was explained interms of the high concentration of phosphorus at grain boundaries.
Acknowledgement
The authors would like to express their sincere gratitude to Dr. Y. Watanabe of TohokuUniversity for his valuable discussions and comments.
References
[1] Watanabe, Y. and Shoji, T., Metallurgical Transactions A, Vol. 22A, Sep., 1991, pp.1991-2097.
[2] Shoji, T. and Takahashi, H., Life Extension and Assessment of Fossil Power Plants, EPRICS5208, Dooley, R. B. and Viswanathan, R., Ed., Electric Power Research Institute,Palo Alto, Ca, 1987, pp. 745-759.
[3] Gould, G. C, ASTM STP 407, American Society for Testing and Materials, Philadelphia,1968, pp. 90-105.
[4] Kupper, J., Erhart, H. and Grabke, H., Corrosion Science, Vol. 21, No. 3, 1981, pp. 227-238.
[5] Jones, R. H.( Arey, B. W., Bear, D. R. and Friesel. M. A., Corrosion, June, 1989, pp.494-502.
[6] Tauber, G.and Grabke, H. J., Corrosion Science, Vol. 19, 1979, pp. 793-798.
245

[7] Oku, T., Kodaira, K., Fukaya, K, Suzuki, M., Tanaka, Y., Iwadate, T., Suzuki, K.andSato, L.Nuclear Engineering and Design, Vol. 119, 1990, pp. 177-186.
[8] Cheruvu, N. S., Metallurgical Transactions A, Vol. 20A, Jan., 1989, pp. 494-502.
[9] Suzuki, M., Fukaya, K. and Oku, T., Transactions of the Iron and Steel Institute ofJapan, Vol. 22, 1982, pp. 862-868.
[10] Suzuki, M., Fukaya, K. and Oku, T., Transactions of the Iron and Steel Institute ofJapan, Vol. 23, 1983, pp. 842-845.
[11] Shinoda, T. and Nakamura, T., Acta Metallurgica, Vol. 29, 1981, pp. 1631-1636.
[12] Kameda, J. and McMahon, Jr, C. J., Metallurgical Transactions A, Vol. 12A, Jan.1981, pp. 31-37.
[13] McLean, D., Grain Boundaries in Metals, Oxford, 1957.
246

Engl et al. on Inservice Inspection Techniques ...
Inservice Inspection Techniques for Primary Circuit ofWWER-Reactors
G. ENGL*, D. PASTOR**, T. MIKUS****Siemens-KWU, Erlangen**Siemens-KWU, Lubmin***Reakiortest, Trnava
INTRODUCTION
Periodic Nondestructive Inservice Inspections provide most relevant criteria for theassessment of the integrity of primary circuit pressure components.
The task is to reliably detect defects and realistically size and characterize them, therebyallowing for discontinuously monitoring of eventual defect initiation or growth.
The scope of these examinations is concentrating on areas selected by criteria like materialproperties and fabrication (e. g. weld areas) or operational considerations (like higher stressese. g. at nozzle inner radii)
For reasons of limited access, of minimizing radiation exposure to examination personnel,of reproducibility and of consistence of the NDE data obtained, these examinations areperformed by use of mechanized equipment.
In the following equipment and techniques for and experience with some of mostimportant examination areas are presented.
REACTOR PRESSURE VESSEL EXAMINATION
The ISI-scope includes all shell, flange and nozzle welds, as well as the nozzle inner radiiand selected areas, where surface examination is required (Fig. J).
Based on past experience, and recent discussions the cladding as well as the claddinginterface are included into the wall thickness to be examined. Nozzle to pipe welds are beingintegrated into the scope as well.
In the light of the recent discussions about allowable defect size under operation andtransient load conditions as well as with regard to potential material degradation (e.g.embrittlement), a highly sensitive, reliable inspection technique with realistic sizing andcharacterization capabilities is of most importance.
Under these prerequisites, the inspection from the inner surface must be regarded as thebest solution, allowing even for the application of eddy current examination as complementarytechnique for cladding examination.
The ultrasonic examination in contact technique, as developed according to the stringentrequirements of the German Code, has proven to be reliable an effective, also in theinternational ISI-scenario.
Central Mast Manipulator
This concept is supported by an efficient manipulator concept. The Central MastManipulator (Fig. 2) has been proven as a flexible tool specifically for the inspection of
247
Engl et al. on Inservice Inspection Techniques ...
WWER pressure vessels of different sizes and has been applied successfully in the NPPGreifswald over several years. The principle of modularity has been consequently realized asfar as assembly of different probe systems for different areas is concerned, therefore allowingto maximize the amount of coverage by specifically adapted probe system arrangements.
The change of probe systems or probe arrangements is performed within several minutes.This flexibility means no sacrifice of stability or positioning accuracy or the capability to carryheavy modules as would be required for repair or sample removal.
Examination Techniques
In order to achieve the necessary defect detection capability, multiple probe systems areutilized, combining diiTerent techniques respectively angles of incidence.
The cladding as well as the interface together with the adjacent base metal layer isinspected with 70° longitudinal dual element probes with an experience of almost 20 years ofapplication. The eddy current technique is also integrate into the probe system ascomplementary approach for the examination of the claddding. The remaining major part ofthe wall thickness is examined with a combination of 45° and tandem technique or of 45° and60° techniques. If only single probe techniques are employed, specific attention has to bedirected to achieve maximum sensitivity with a high signal significance by discriminationcapability. This means a very thorough optimization of the ultrasonic parameters such asfrequency, transducer size, focusing etc.
These considerations have to be supported by an adapted concept of data acquisition andprocessing. As a principle, all available ultrasonic signals are stored (as raw data) andprocessed with no respect to recording level. Additionally, time of flight criteria are employedquasi on line for discrimination. Basically, two data acquisition and processing techniques arebeing applied, TIMLOK and ALOK; TIMLOK is based on a gated 32 channel system,collecting the maximum signal with its time of flight for each channel, whereas ALOK iscollecting all relevant signals of the Ascan in one channel per probe.
Both methods provide the mapping of indications (TIMLOK: C-scan per gate., (Fig. 4)ALOK C-, B- and D scan (Fig. 5) as well as defect reconstruction based on time of flightinformation (Fig. 6).
Experience
Utilizing this ISI-technique as described, a complete examination of a KWU-Konvoi 1300MW Reactor Pressure Vessel can be performed within ca. 7 days (Fig. 7). Experience withRPV examinations in NPP Greifswald and Bohunice shows that RPV ISI can be performed inan interval of ca. 10-13 days, dependent on scope and additional techniques employed.
This duration includes the fully mechanized examination of the complete longitudinal weldin the bottom head. For the first time in a WWER Pressure Vessel, this task was successfullycompleted in the recent examination of the Bohunice 1 Reactor Pressure Vessel.
A large emphasis, is placed on the quality of the inspection. For assuring defect detectionprobability as well as reliability of defect evaluation the techniques as described have beenapplied and investigated in international programs such as PISC I and II as well as within largenational verification programs. Recently, this work has been continued within the frameworkof PISC III as well as within the Full Size Vessel Program of MPA Stuttgart (Fig. 8).
248
Engl et al. on Inservice Inspection Techniques ...
The result of the TIMLOK technique applied within the Full Scale Vessel Program wasthat all defects larger than 2 mm were detected. The sizing capability was giving slightlyconservative results consistently (between 0 % and 50 % conservatism).
All these investigations proved the effectiveness of this ISI-approach. One representativeresult out of PISC II is presented in Fig. 9, the German ISI-technique is included in "SpecialProcedures".
MAIN COOLANT LINE
Safety and availability considerations make it highly desirable to have redundancy in formof a reliable information about the eventual presence of defects before they grow to a leak.This is also the case for the stainless steel main coolant lines of WWER-reactors, where theleak before break criterion has been established and a highly sensitive leak detection system isnecessary.
Geometry (weld preparation, shrinkage and weld crown), material (coarse grain withstrong acoustic anisotropy) as well as restricted access pose severe difficulties for theseinspections.
Through the past years considerable experience with the inspection of stainless steelpiping has been achieved, specifically in BWR-plants with unstabilized stainless steelsusceptible to intergranular stress corrosion cracking. The involvement in this difficultexaminations has strongly contributed to the development or adaption of appropriatetechniques. Further impact can be expected out of the PISC III program. These experienceshelp with the selection of probes and techniques.
In principle the techniques to be employed have to be adapted and optimized to eachspecific inspection problem. This means that a testblock realistically simulating the inspectionconditions, should be available. Generally, the wall thickness is subdivided into several layers.Each layer is inspected with at least one specific technique. Mostly low frequency, longitudinaldual element probes are utilized. Transducer sizes arrangements (linear " focussing") as well asthe angles of incidence are adapted to each wall thickness layer.
Recently, phased array systems (partially with EMAT principle) have been introduced.
Mechanized examination is able to add spatial criteria to the data, thus generating a moreconsistent data base allowing direct correlation between signals from differentprobes/techniques. A large number of manipulators has been developed, all easily operable,some allowing modularity as for carrying inspection systems, as well as milling, cutting andwelding tools etc.(Fig. 10),
Within a national German program a Round Robin test with a WWER pipe weld samplehas been performed where all the above mentioned techniques have been employed. After theNDE results had been submitted, destructive examination has started and was completed mostrecently.
Final results with thorough comparison of nondestructive and destructive examinationscan be expected by the end of the year.
COLLECTOR
The welds of the stainless steel collectors of WWER Steam Generators pose a specificproblem to perform an effective ultrasonic examination: The relatively large wall thickness
249
Engl et al. on Inservice Inspection Techniques ...
together with the nonparallel cross sectional geometry add to the difficulties known inconjunction with the coarse grain weld material.
Extensive experimental investigations at 1:1 testblocks resulted in an approach withspecific ultrasonic techniques, which could demonstrate good correlation with the results ofradiographic examination. For this problem, again longitudinal wave probes with differentangles of incidence, partially focussed, were the solution for the detection phase. For sizing,linear holography has been employed, utilizing the signals of different probes matched ed intoone reconstruction, thus synthesizing a larger aperture in spite of narrow beams with eachsingle probe.
Based upon the development in the area of imaging techniques within the past years, anew sizing method has been implemented, the so called Linear Synthetic Aperture FocussingTechnique (L-SAFT) respectively its physical equivalent, the Broadband Holography (HOLO3000). These techniques proved to achieve results superior to those of the Linear Holography.
It is obvious that these sizing and characteristization techniques are also available forresolving indications in the main coolant line as well as other (also ferritic) components.
For this inspection a special manipulator has been developed (Fig. 11). This manipulatoris also designed for carrying other modules like for ET examination of the trebing, for tubeplugging, etc..
CONCLUSION
The technical approach for an effective ISI technology is based on a large effort ofcontinuos R & D work and implementation into practical application on the site. Theexperience gained provided considerable feedback for the subsequent and continuosimprovement of the system.
The first generation of equipment and technology was oriented towards Siemens PWRand BWR plants. In an early stage already the ISI technology was adapted to application inreactors of other suppliers.
For examination of WWER primary circuit this adaption resulted in modular technologye.g. manipulators, ultrasonic instruments, computerized data acquisition and processing.
The basic technical approach is following the same philosophy with regard to the solutionsfor the various components: Techniques with high detection sensitivity, realistic sizing andcharacterization; multichannel UT-instrument for versatile utilization; data acquisition andprocessing with problem-adapted data display; modular manipulator design for examinationand repair.
This technology allows for reliable inspections to be performed in a minimum of time.This efficiency is paired with effectiveness which has been proven in international and nationalverification programs.
250
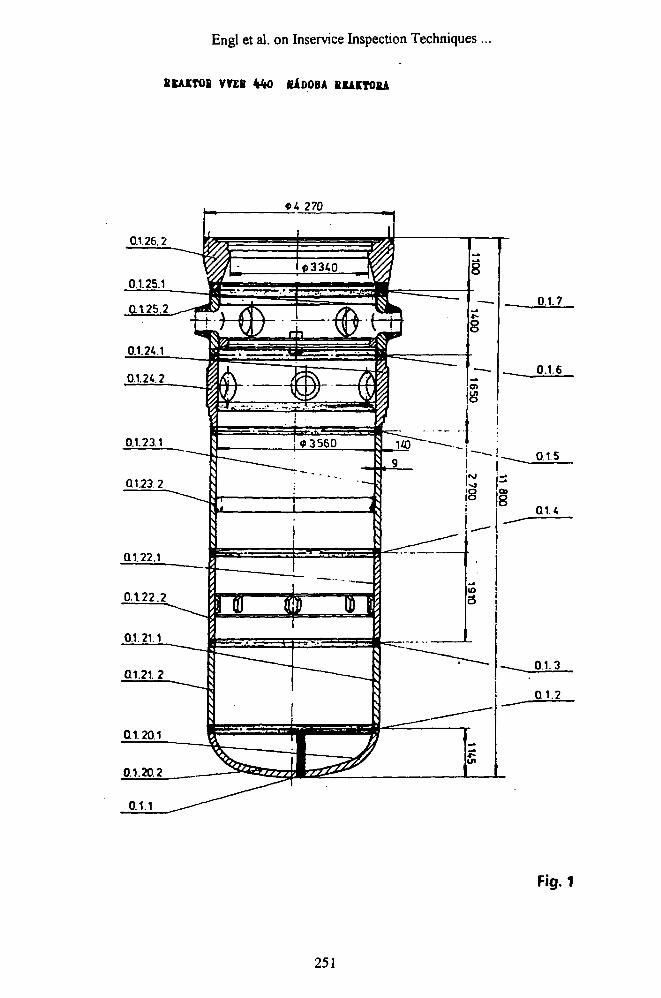
Engl et al. on Inservice Inspection Techniques ..
SKAXTOI VFER 4 4 0 1ADOBA EIAKTOBA
0.1.26.2
270
0.1.7
0.1.6
0.15
0.1.4
0.1.3
01.2
Fig. 1
251
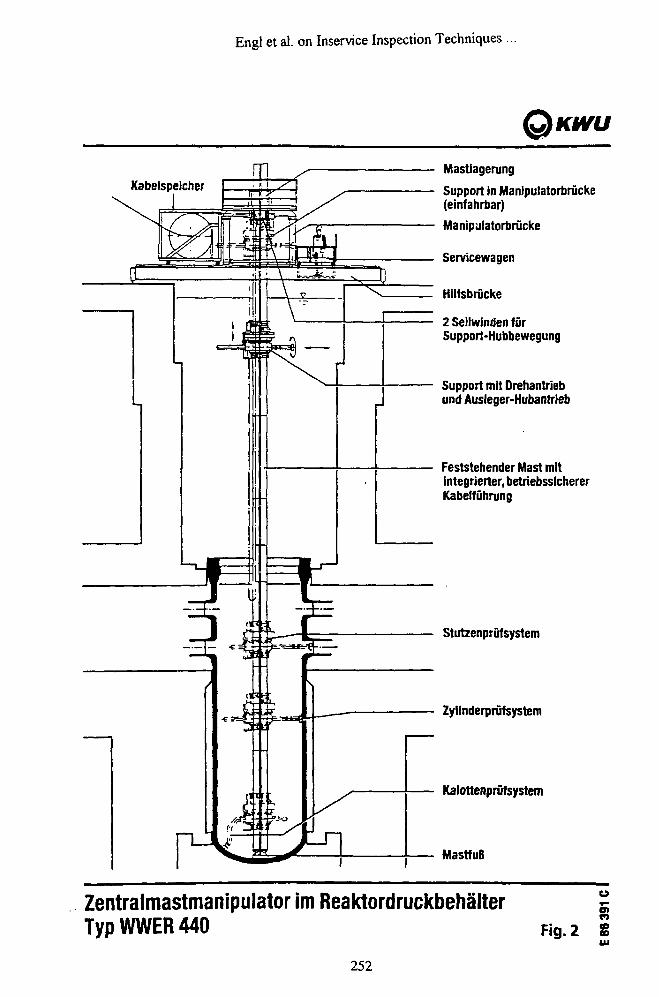
Engl et al. on Inservice Inspection Techniques ...
UJKkVU
KabelspeicherMastiagerung
Support in Manipulatortorucke(einfahrbar)
Manipulatorbrucke
Servicewagen
Hilfsbrucke
2 Seilwinden furSupport-Hubbewegung
Support tnit Drehantriebund Ausleger-Hubantrieb
Feststehender Mast mltintegrierter, betriebssichererKabelfuhrung
Stutzenprufsystem
- Zylinderprutsystem
Kalottenpriifsystem
MastfuB
Zentralmastmanipulator im ReaktordruckbehalterTyp WWER 440
3Fig. 2 S
252
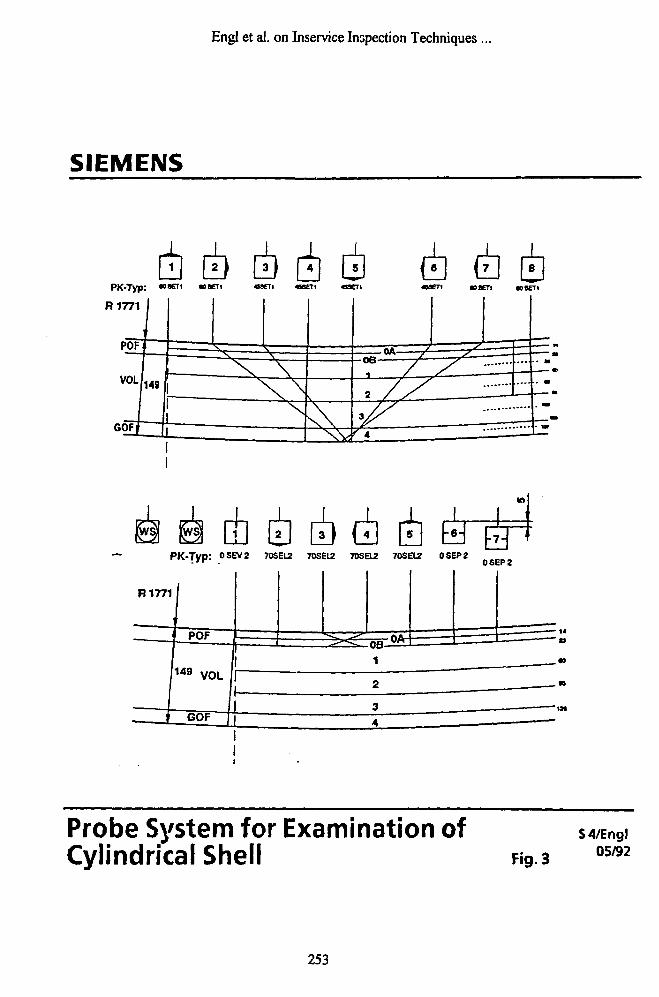
SIEMENS
Engl et al. on Inservice Inspection Techniques ...
3) r h n~i • 1 «X.
PK-Typ: 0SEV2 7OSEL2 70SE12 7OSEL2 70SEL2 0SEP20SEP2
B1771
Probe System for Examination ofCylindrical Shell Fig.3
S4/Engl05/92
253
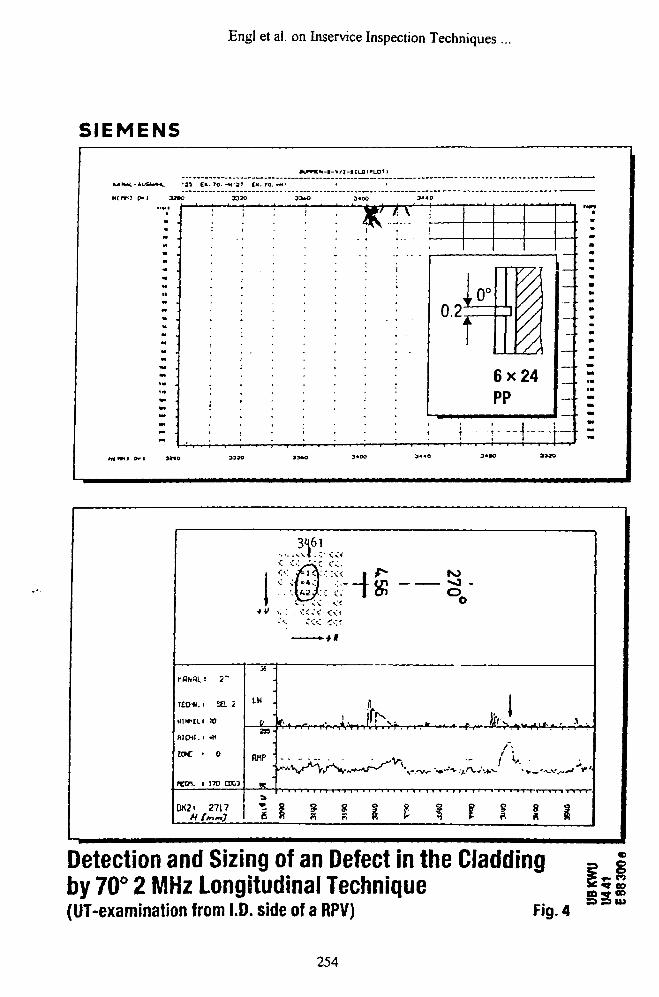
Engl et al. on Inservice Inspection Techniques ...
SIEMENS
'M CK.70- -t<>37 CK. TO. »**•
H [ m ) p»l 3TB0 3330 33*0
i
)£> i7 " "•
n?
; j - -.;
6xPP
—
24
—
-
—
3««o asao
TEO-*.>
UIWUI
W M . i
2 -
sa i
JO
0
0K2> 2717H fm~O
. . . . .
• ' - ;
54 -
LH .
2 S -
RHP " ;;,
1 I
3461
kfx..-
o
:« 1 t
m
i
i iff
3190
•
33U
0 -
vf- 1-"
V-v.-
K>
°O
° 9
/ i
I 8 S« A
Detection and Sizing of an Defect in the Cladding = |by 70° 2 MHz Longitudinal Technique | | |(UT-examination from I.D. side of a RPV) Fig. 4
254
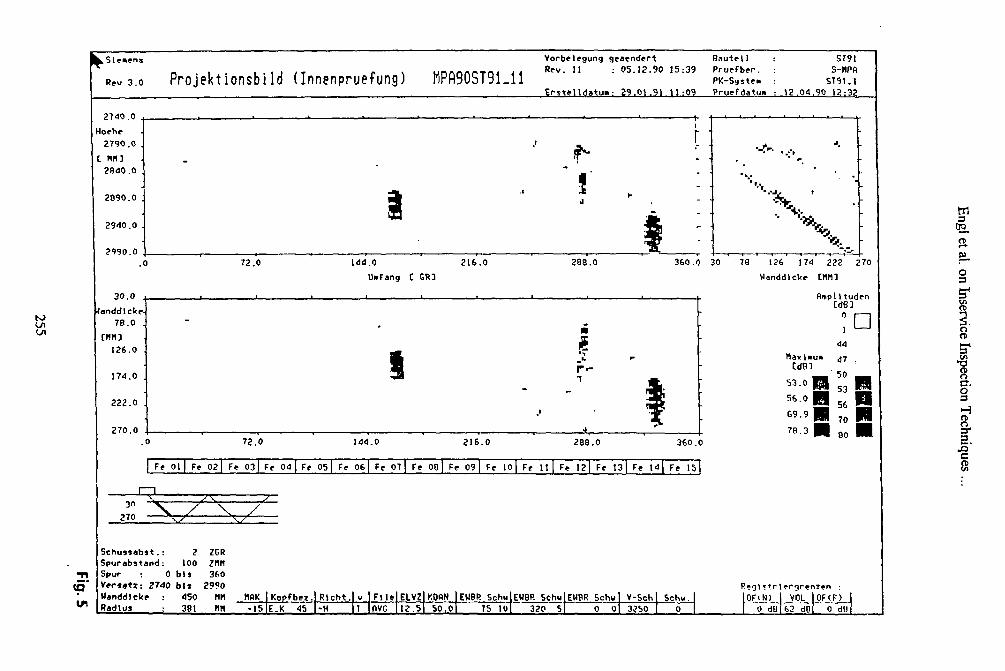
m02.
o
n'
Iis'
i
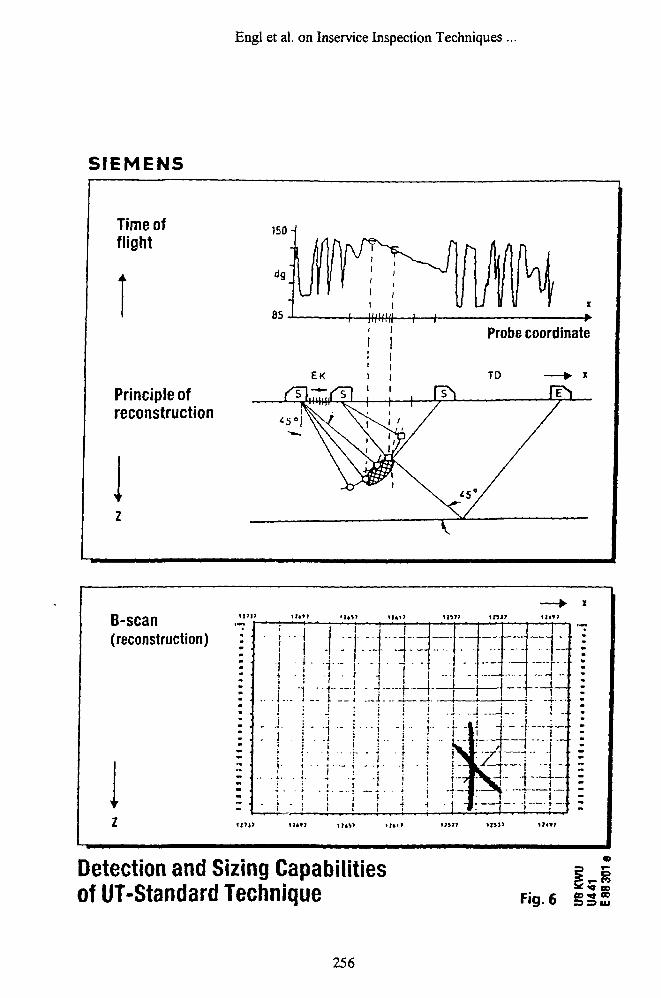
Engl et al. on Inservice Inspection Techniques ...
SIEMENS
Time offlight
Principle ofreconstruction
I
Probe coordinate
X
B-scan(reconstruction)
<!'|) W*»T
I
W177 t»J? 1J*tJ
. . .
-
i
i
•-
! ;
* l I
i
• " T"1 -t j
i i ij i i. .
- - i
- . ! • | -
- ! • <
1 i :1 1 l
i i ! :
t -f H •
" 7
-
t
i
:--1
—
—
1~Ti
r i. . i i ..
IZ—:
* T
.._ (_.
i- " -J—-f—
Detection and Sizing Capabilitiesof UT-Standard Technique Fig.6
Ei
256
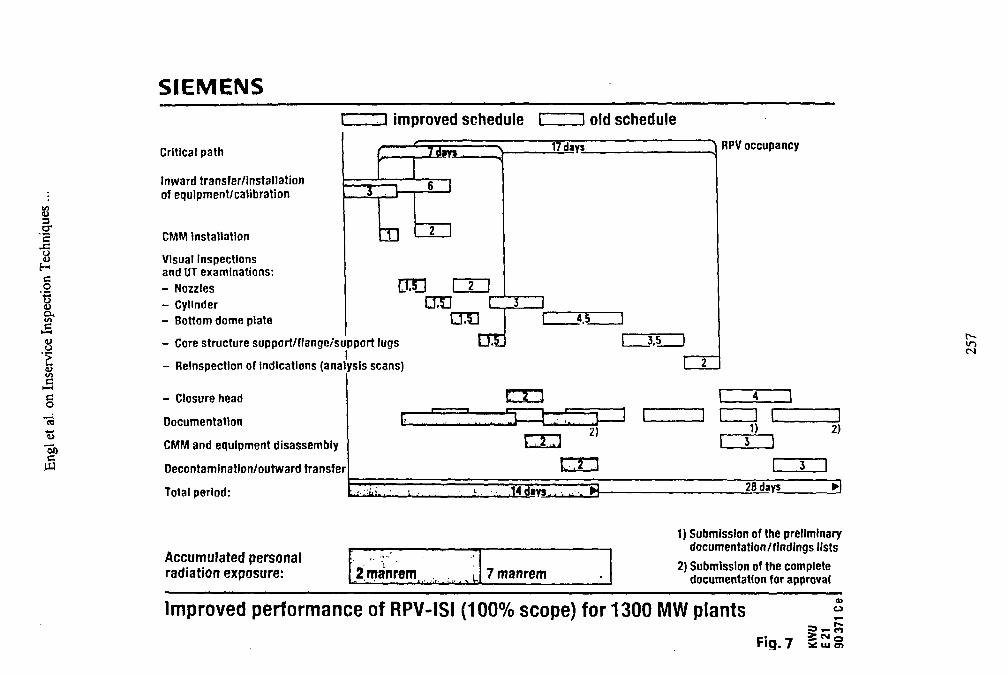
i1o
ex
Io
SIEMENSimproved schedule old schedule
Critical path
Inward transfer/installationof equipment/calibration
CMM installation
Visual Inspectionsand UT examinations:
- Nozzles
- Cylinder
- Bottom dome plate
- Core structure support/flange/support lugsI
- Relnspection of indications (analysis scans)
- Closure head
Documentation
CMM and equipment disassembly
Decontamination/outward transfer
Total period:
•33
17 day*
J.L
RPV occupancy
D C2) 2)
28 days
Accumulated personalradiation exposure: 2manrem . ;..•• . > U 7 manrem
1) Submission of the preliminarydocumentation/findings lists
2) Submission of the completedocumentation for approval
Improved performance of RPV-ISI (100% scope) for 1300 MW plantstoo
Fig. 7 : ui i
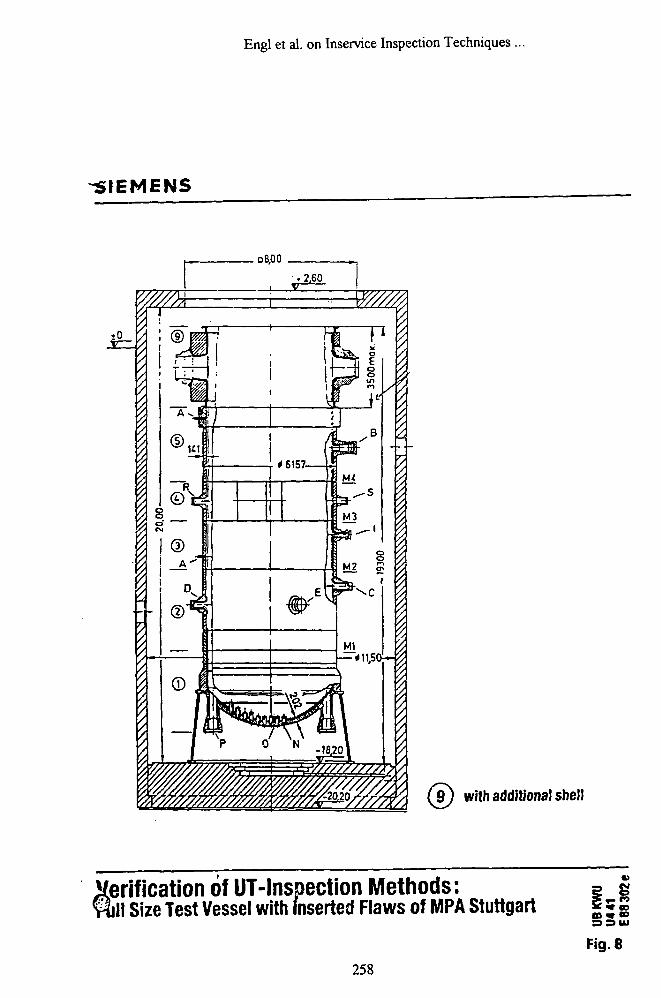
Engl et al. on Inservice Inspection Techniques ...
-SIEMENS
. DB,00
D_
8
* 6157-
M3
M2
with additional shell
Verification of UT-lnspection Methods:II Size Test Vessel with inserted Flaws of MPA Stuttgart
Fig. 8
258
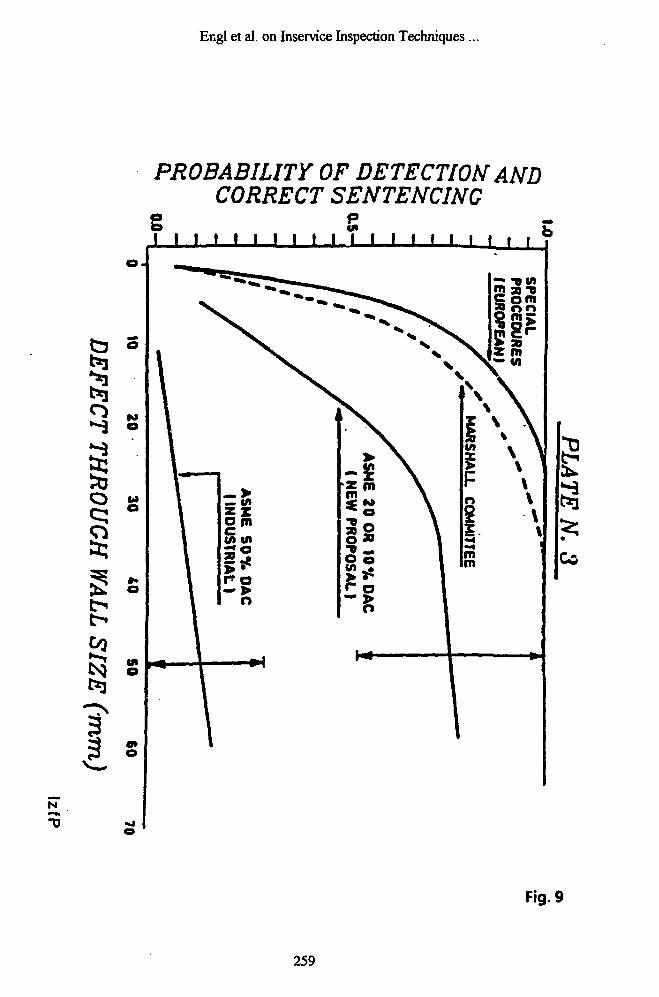
Engl et al. on Inservice Inspection Techniques ...
PROBABILITY OF DETECTION ANDCORRECT SENTENCING
\ i i i i i i i i i i » t t t t r i i
N
Fig. 9
259
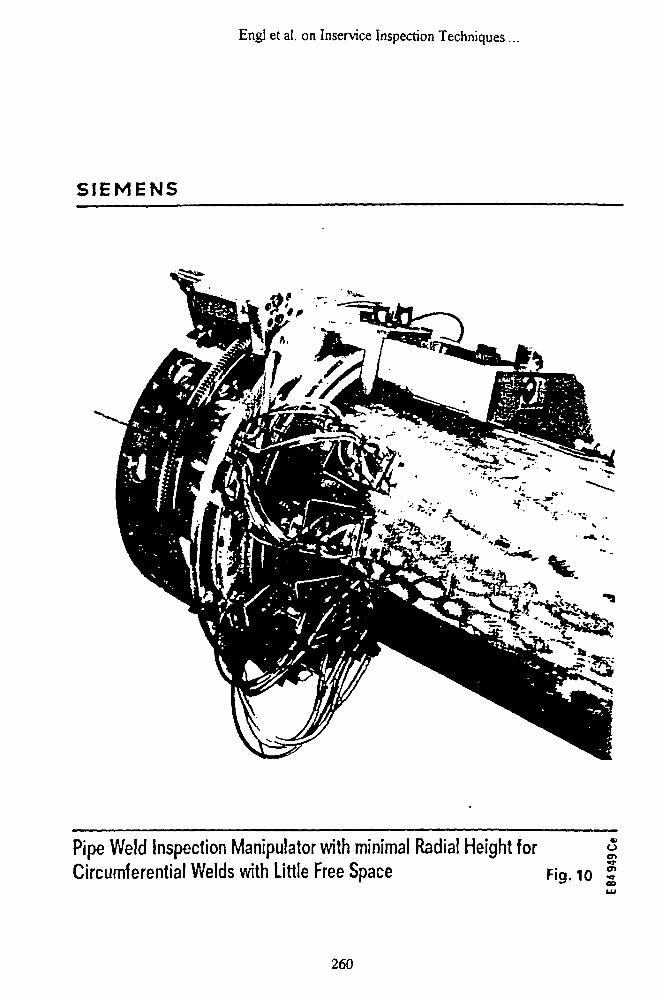
Engl et al. on Inservice Inspection Techniques.
SIEMENS
Pipe Weld Inspection Manipulator with minima! Radial Height forCircumferential Welds with Little Free Space Fig. 10
• 1
oex.
260
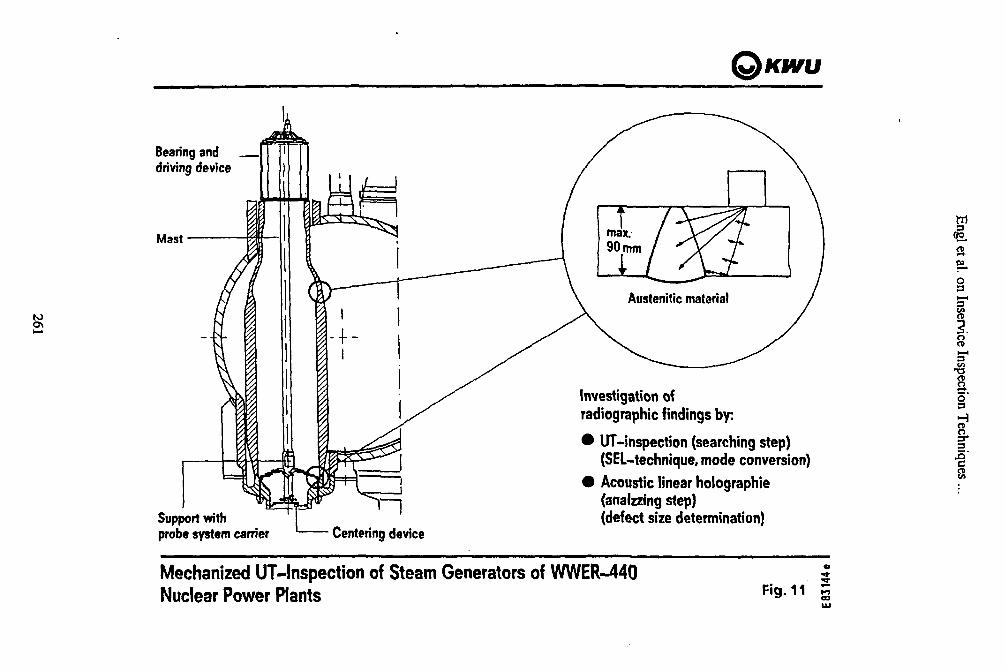
Bearing and Jdriving device
Mast
to
Support withprobe system carrier Centering device
Investigation ofradiographic findings by.
• UT-inspection (searching step)(SEUtechnique, mode conversion)
# Acoustic linear holographie(anafzang step)(defect size determination)
a
oI-*
I§
sIa
Mechanized UT-lnspection of Steam Generators of WWER-440Nuclear Power Plants
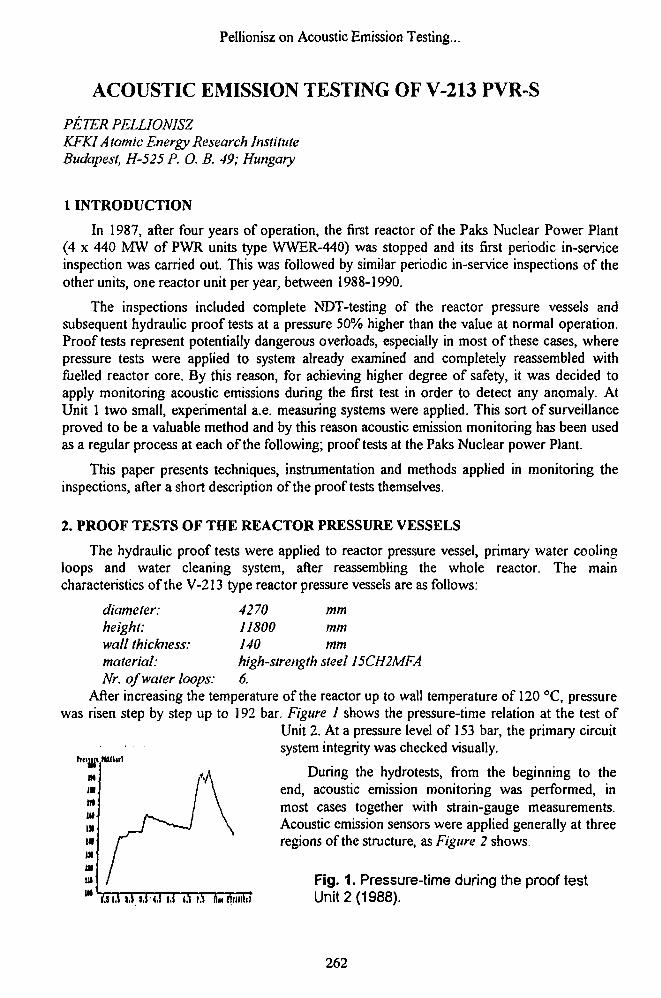
Pellionisz on Acoustic Emission Testing...
ACOUSTIC EMISSION TESTING OF V-213 PVR-S
PETER PELLIONISZKFKI Atomic Energy Research InstituteBudapest, H-525 P. O. B. 49; Hungary
1 INTRODUCTION
In 1987, after four years of operation, the first reactor of the Paks Nuclear Power Plant(4 x 440 MW of PWR units type WWER-440) was stopped and its first periodic in-serviceinspection was carried out. This was followed by similar periodic in-service inspections of theother units, one reactor unit per year, between 1988-1990.
The inspections included complete NDT-testing of the reactor pressure vessels andsubsequent hydraulic proof tests at a pressure 50% higher than the value at normal operation.Proof tests represent potentially dangerous overloads, especially in most of these cases, wherepressure tests were applied to system already examined and completely reassembled withfuelled reactor core. By this reason, for achieving higher degree of safety, it was decided toapply monitoring acoustic emissions during the first test in order to detect any anomaly. AtUnit 1 two small, experimental a.e. measuring systems were applied. This sort of surveillanceproved to be a valuable method and by this reason acoustic emission monitoring has been usedas a regular process at each of the following; proof tests at the Paks Nuclear power Plant.
This paper presents techniques, instrumentation and methods applied in monitoring theinspections, after a short description of the proof tests themselves.
2. PROOF TESTS OF THE REACTOR PRESSURE VESSELS
The hydraulic proof tests were applied to reactor pressure vessel, primary water coolingloops and water cleaning system, after reassembling the whole reactor. The maincharacteristics of the V-213 type reactor pressure vessels are as follows:
diameter: 4270 mmheight: 11800 mmwall thickness: 140 mmmaterial: high-strength steel 15CH2MFANr. of water loops: 6.
After increasing the temperature of the reactor up to wall temperature of 120 °C, pressurewas risen step by step up to 192 bar. Figure 1 shows the pressure-time relation at the test of
Unit 2. At a pressure level of 153 bar, the primary circuitsystem integrity was checked visually.
tnimt nuikirl
During the hydrotests, from the beginning to theend, acoustic emission monitoring was performed, inmost cases together with strain-gauge measurements.Acoustic emission sensors were applied generally at three
».> I,J u i.i o r.i furmiii.i Unit 2 (1988).
262
regions of the structure, as Figure 2 shows.
Fig. 1. Pressure-time during the proof test
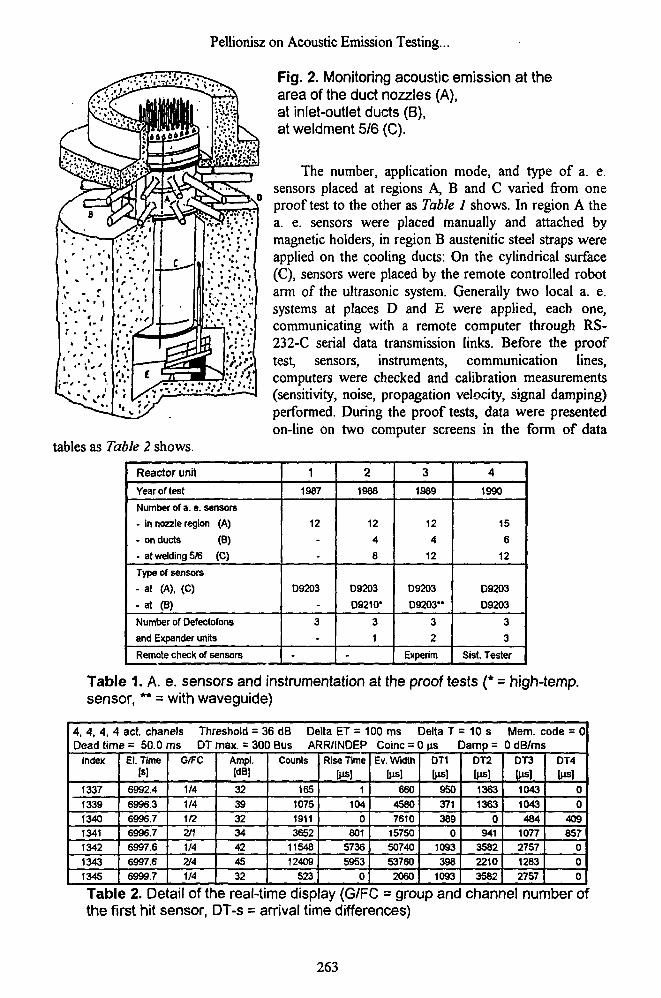
tables as Table 2 shows.
Pellionisz on Acoustic Emission Testing...
Fig. 2. Monitoring acoustic emission at thearea of the duct nozzles (A),at inlet-outlet ducts (B),at weldment 5/6 (C).
The number, application mode, and type of a. esensors placed at regions A, B and C varied from oneproof test to the other as Table 1 shows. In region A thea. e. sensors were placed manually and attached bymagnetic holders, in region B austenitic steel straps wereapplied on the cooling ducts: On the cylindrical surface(C), sensors were placed by the remote controlled robotarm of the ultrasonic system. Generally two local a. e.systems at places D and E were applied, each one,communicating with a remote computer through RS-232-C serial data transmission links. Before the prooftest, sensors, instruments, communication lines,computers were checked and calibration measurements(sensitivity, noise, propagation velocity, signal damping)performed. During the proof tests, data were presentedon-line on two computer screens in the form of data
Reactor unit
Year of test
Number of a. e. sensors
- in nozzle region (A)
- on ducts (B)
- at welding 5/6 (C)
Type of sensors
- at (A), (C)
- at (B)
Number of Oefectofons
and Expander units
Remote check of sensors
1
1987
12
09203
3
-
2
1988
12
4
8
D9203
D9210*
31
-
3
1989
12
4
12
D9203
D9203"
3
2
Experim
4
1990
15
6
12
09203
09203
3
3
Sist. Tester
Table 1. A. e. sensors and instrumentation at the proof tests (* = high-temp,sensor, ** = with waveguide)
4, 4, 4, 4 act. chanels Threshold = 36 dB Delta ET = 100 ms Delta T = 10 s Mem. code = 0Dead time = 50.0 ms DT max. = 300 Bus ARR/INDEP Coinc = 0 us Damp = 0 dB/ms
Index
1337133913401341134213431345
El. Time
6992.46996.36996.76996.76997.66997.66999.7
G/FC
1/41/41/22/11/42/41/4
Ampl.[dB]
32393234424532
Counts
165107519113652
1154812409
523
Rise Time
IN1
1040
80157365953
0
Ev. Width
IN660
45807610
157505074053760
2060
DT1
IN950371389
01093398
1093
DT2IMS]13631363
0941
358222103582
DT3IMS]10431043484
1077275712832757
DT4IMS]
00
409857
000
Table 2. Detail of the real-time display (G/FC = group and channel number ofthe first hit sensor, DT-s = arrival time differences)
263
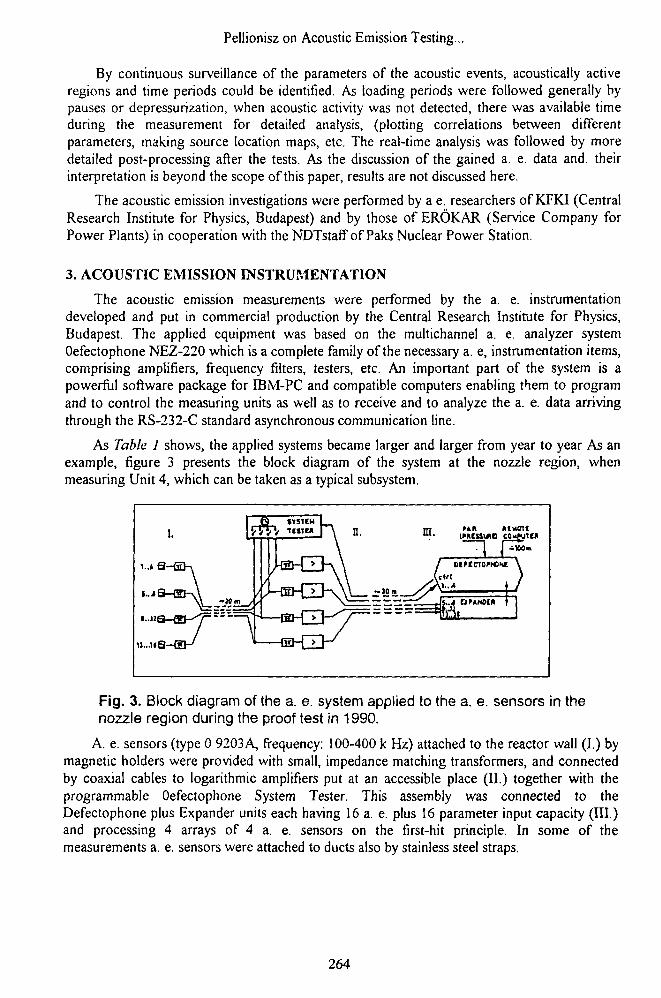
Pellionisz on Acoustic Emission Testing...
By continuous surveillance of the parameters of the acoustic events, acoustically activeregions and time periods could be identified. As loading periods were followed generally bypauses or depressurization, when acoustic activity was not detected, there was available timeduring the measurement for detailed analysis, (plotting correlations between differentparameters, making source location maps, etc. The real-time analysis was followed by moredetailed post-processing after the tests. As the discussion of the gained a. e. data and. theirinterpretation is beyond the scope of this paper, results are not discussed here.
The acoustic emission investigations were performed by a e. researchers of KFKI (CentralResearch Institute for Physics, Budapest) and by those of EROKAR (Service Company forPower Plants) in cooperation with the NDTstaff of Paks Nuclear Power Station.
3. ACOUSTIC EMISSION INSTRUMENTATION
The acoustic emission measurements were performed by the a. e. instrumentationdeveloped and put in commercial production by the Central Research Institute for Physics,Budapest. The applied equipment was based on the multichannel a. e. analyzer systemOefectophone NEZ-220 which is a complete family of the necessary a. e, instrumentation items,comprising amplifiers, frequency filters, testers, etc. An important part of the system is apowerful software package for IBM-PC and compatible computers enabling them to programand to control the measuring units as well as to receive and to analyze the a. e. data arrivingthrough the RS-232-C standard asynchronous communication line.
As Table I shows, the applied systems became larger and larger from year to year As anexample, figure 3 presents the block diagram of the system at the nozzle region, whenmeasuring Unit 4, which can be taken as a typical subsystem.
M« RtHfftt
- 1 0 m
Fig. 3. Block diagram of the a. e. system applied to the a. e. sensors in thenozzle region during the proof test in 1990.
A. e. sensors (type 0 9203A, frequency: 100-400 k Hz) attached to the reactor wall (I.) bymagnetic holders were provided with small, impedance matching transformers, and connectedby coaxial cables to logarithmic amplifiers put at an accessible place (II.) together with theprogrammable Oefectophone System Tester. This assembly was connected to theDefectophone plus Expander units each having 16 a. e. plus 16 parameter input capacity (III.)and processing 4 arrays of 4 a. e. sensors on the first-hit principle. In some of themeasurements a. e. sensors were attached to ducts also by stainless steel straps.
264
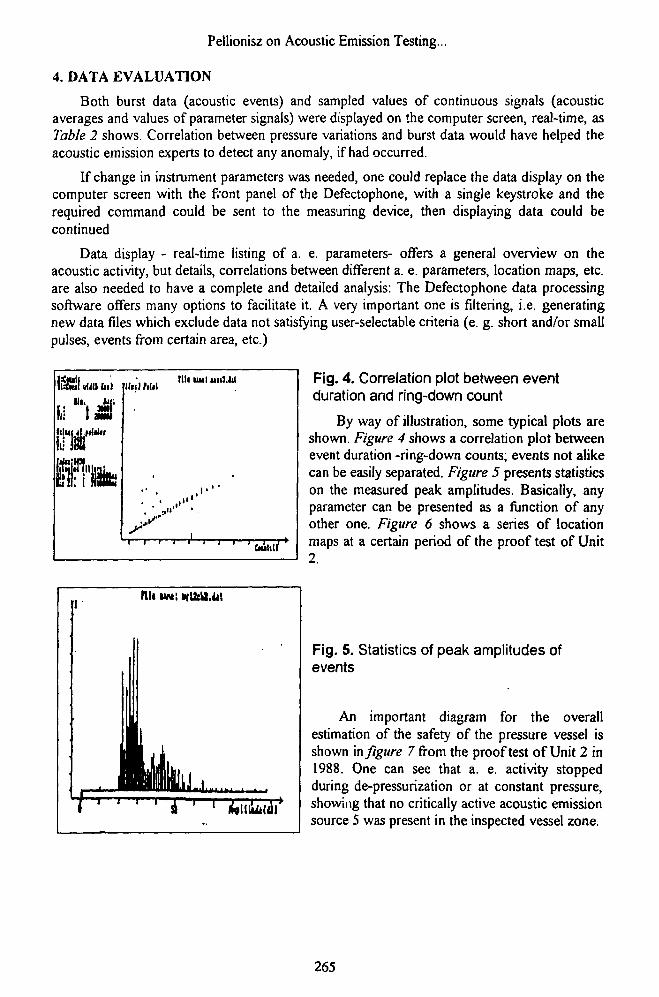
Pellionisz on Acoustic Emission Testing...
4. DATA EVALUATION
Both burst data (acoustic events) and sampled values of continuous signals (acousticaverages and values of parameter signals) were displayed on the computer screen, real-time, asTable 2 shows. Correlation between pressure variations and burst data would have helped theacoustic emission experts to detect any anomaly, if had occurred.
If change in instrument parameters was needed, one could replace the data display on thecomputer screen with the front panel of the Defectophone, with a single keystroke and therequired command could be sent to the measuring device, then displaying data could becontinued
Data display - real-time listing of a. e. parameters- offers a general overview on theacoustic activity, but details, correlations between different a. e. parameters, location maps, etc.are also needed to have a complete and detailed analysis: The Defectophone data processingsoftware offers many options to facilitate it. A very important one is filtering, i.e. generatingnew data files which exclude data not satisfying user-selectable criteria (e. g. short and/or smallpulses, events from certain area, etc.)
Fig. 4. Correlation plot between eventduration and ring-down count
By way of illustration, some typical plots areshown. Figure 4 shows a correlation plot betweenevent duration -ring-down counts; events not alikecan be easily separated. Figure 5 presents statisticson the measured peak amplitudes. Basically, anyparameter can be presented as a function of anyother one. Figure 6 shows a series of locationmaps at a certain period of the proof test of Unit2.
Fig. 5. Statistics of peak amplitudes ofevents
An important diagram for the overallestimation of the safety of the pressure vessel isshown in figure 7 from the proof test of Unit 2 in1988. One can see that a. e. activity stoppedduring de-pressurization or at constant pressure,showing that no critically active acoustic emissionsource 5 was present in the inspected vessel zone.
265
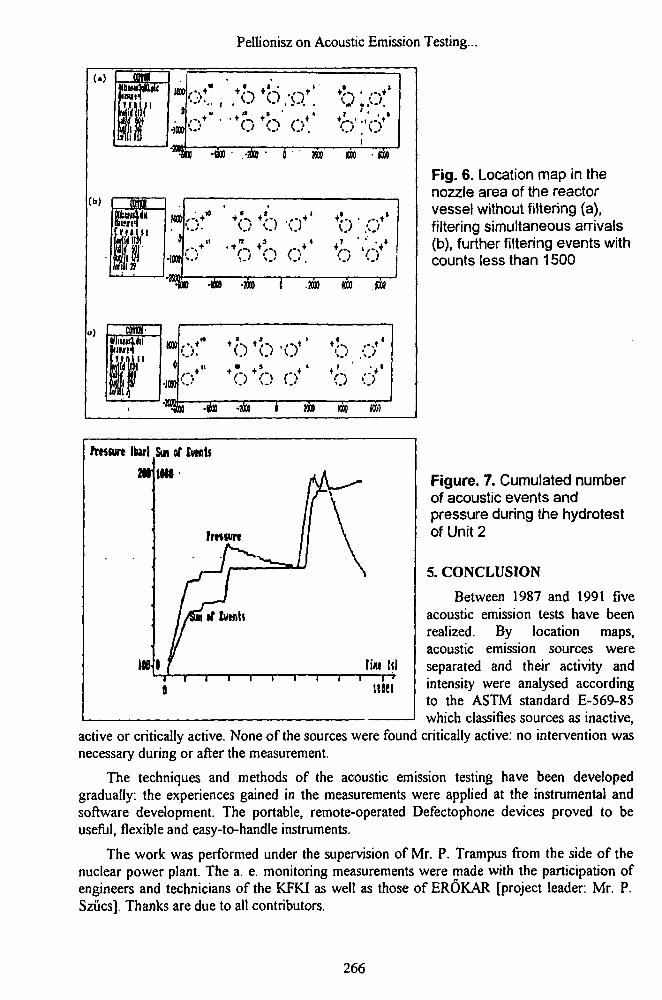
Pellionisz on Acoustic Emission Testing...
oi!., :h*o:&\' •b;.o:i
• W B ' -2019 " no few
tain
'.••in
fill
vat
•im
D Hili
V.-1 ' - . ) '
0 O <
•tin i
:.r' *b:)•" *6
•MO KOJ
•o*'
CBflF
+ " + " + ' + ' 4 ' ' • +O GO O O O
•in -m • JOT KDO
Fig. 6. Location map in thenozzle area of the reactorvessel without filtering (a),filtering simultaneous arrivals(b), further filtering events withcounts less than 1500
tmwrt Ibarl Sun of twits2Nm
Itnvm
Id
Figure. 7. Cumulated numberof acoustic events andpressure during the hydrotestof Unit 2
5. CONCLUSION
Between 1987 and 1991 fiveacoustic emission tests have beenrealized. By location maps,acoustic emission sources wereseparated and their activity andintensity were analysed accordingto the ASTM standard E-569-85which classifies sources as inactive,
active or critically active. None of the sources were found critically active: no intervention wasnecessary during or after the measurement.
The techniques and methods of the acoustic emission testing have been developedgradually: the experiences gained in the measurements were applied at the instrumental andsoftware development. The portable, remote-operated Defectophone devices proved to beuseful, flexible and easy-to-handle instruments.
The work was performed under the supervision of Mr. P. Trampus from the side of thenuclear power plant. The a. e. monitoring measurements were made with the participation ofengineers and technicians of the KFKI as well as those of EROKAR [project leader. Mr. P.Sziics]. Thanks are due to all contributors.
ueei
266
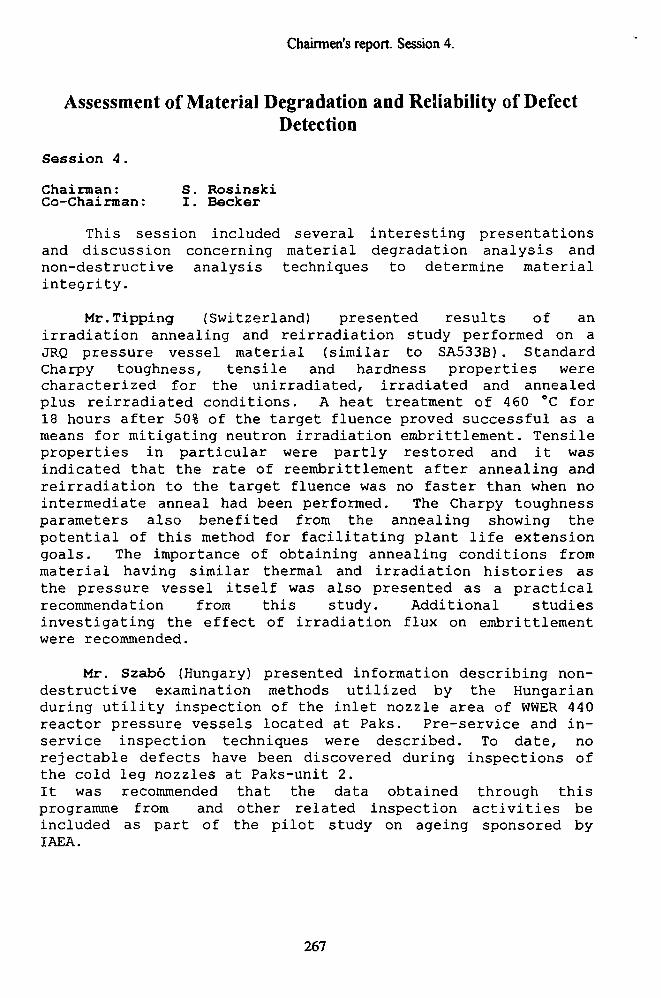
Chairmen's report. Session 4.
Assessment of Material Degradation and Reliability of DefectDetection
Session 4.
Chairman: S. RosinskiCc-Chairman: I. Becker
This session included several interesting presentationsand discussion concerning material degradation analysis andnon-destructive analysis techniques to determine materialintegrity.
Mr.Tipping (Switzerland) presented results of anirradiation annealing and reirradiation study performed on aJRQ pressure vessel material (similar to SA533B). StandardCharpy toughness, tensile and hardness properties werecharacterized for the unirradiated, irradiated and annealedplus reirradiated conditions. A heat treatment of 460 °C for18 hours after 50% of the target fluence proved successful as ameans for mitigating neutron irradiation embrittlenient. Tensileproperties in particular were partly restored and it wasindicated that the rate of reembrittlement after annealing andreirradiation to the target fluence was no faster than when nointermediate anneal had been performed. The Charpy toughnessparameters also benefited from the annealing showing thepotential of this method for facilitating plant life extensiongoals. The importance of obtaining annealing conditions frommaterial having similar thermal and irradiation histories asthe pressure vessel itself was also presented as a practicalrecommendation from this study. Additional studiesinvestigating the effect of irradiation flux on embrittlementwere recommended.
Mr. Szabo (Hungary) presented information describing non-destructive examination methods utilized by the Hungarianduring utility inspection of the inlet nozzle area of WWER 440reactor pressure vessels located at Paks. Pre-service and in-service inspection techniques were described. To date, norejectable defects have been discovered during inspections ofthe cold leg nozzles at Paks-unit 2.It was recommended that the data obtained through thisprogramme from and other related inspection activities beincluded as part of the pilot study on ageing sponsored byIAEA.
267
Chairmen's report. Session 4.
Mr. Kupca (SFR) summarized information regarding thechemical analysis of the reactor pressure vessel material fromthe weld region of the Jaslovske Bohunice Unit-1 WWER-44 0pressure vessel as well as hardness measurements taken acrossthe weld. The hardness measurements involved the use of a thinstrip of Ni foil and were performed within the gap between thevessel and the biological shield in order to identify the exactlocation of the weld. Prints on the Ni foil were measured togive a relative indication of hardness and to indicate weldlocation. Once the weld was identified boat samples wereremoved to determine chemistry. This procedure will also beutilized before and after the anticipated anneal of theBohunice-Unit 1 vessel.
Mr. Nishiyama (Japan) presented results of a unique non-destructive testing technique that utilized electrochemicalproperty determination to evaluate the thermal ageingembrittlement of a 2 l/4%Cr -l%Mo pressure vessel steel beingused in the high temperature gas-cooled reactor presently underconstruction in Japan. During the anodic polarization tests ina calcium nitrate solution the embrittled material exhibited ahigher secondary peak of the current density after initialpassivation. This change in the secondary peak was due to theintergranular segregation of phosphorus and can be successfullycorrelated with the shift of the ductile-to-brittle transitiontemperature. This electrochemical technique also possesses thepotential for application to the radiation embrittlementmonitoring of pressure vessel steels. Further studies in thisarea were recommended. Selecting a proper electrolyticsolution (to be chosen depending upon the mechanism ofradiation embrittlement) will be a key factor for applicationof this technique.
268
Chairmen's report. Session 4.
Assessment of Material Degradation and Reliability of DefectDetection
Chairman: J. GuinovartCo-Chairman: E.Czoboly
Mr. Engl (SFR) reported on the ISI techniques applied toprimary circuit pressure components ( pressure vessels, maincoolant lines, collectors) of WWER reactors. The RPV inspectionis being performed using central mast manipulator equipped withUT and ET probes. Highly sensitive UT methods are mostimportant and can be achieved resp. optimised by appropriateselection of the ultrasonic parameters e.g. beam angles,complete raw data acquisition and processing etc. Detectionand sizing of defects have been improved significantly by thesemeans. Remote controlled inspection techniques eliminatesubjective mistakes and provide of higher significance of data.Broad band holography was evaluated to improve imagingtechnique and consequently sizing of defects. Questions aboutthe smallest detectable defects as well as about theorientation were asked and answered by exemplary results fromperformance demonstration exercises.
Mr. Attinger (Switzerland) gave an overview of theprinciples of the acoustic emission local monitoring techniqueused in . Artificially induced cracks were employed and thecrack propagation due to alternative loading was investigated.Detection of microcracks and their location is possible withgreat accuracy. Application of the evaluated technique wasdemonstrated by a low-cycle fatigue test of a piping systemprovided with a circumferential artificial inner crack starter.
Mr. Pellionisz (Hungary) showed the possibilities ofpractical application of acoustic emission method with specialregard to the pressure vessels of NPP Paks. The instrumentused for this experiment was introduced and the results gainedduring pressure test of the vessel were given and analysed.The selection of criteria for this critical activity of anyregion of the vessel is given in ASTM 569.
After the presentation details of the measuring techniqueswere discussed. In general the actual status of AE technicsdoes not allow to asses the crack growth propagation directlyand the technique requires further development. However, theAE during pressure testing of RPV is a valuable complementarytesting method.
269
Recommendations
Recommendations
During plenary and subsequent 1-5 session several usefulrecommendations were made as follows:
Plenary Session
1. Further efforts on simplified methods for elastic-plastic fatigue analyses should be considered to fulfil gapsincurred in codes and standards. Furthermore, additionalefforts should be made directed to combine US methods forassessment of the characterization in transition weldments.
Session 1.
2.The multibarrier safety flow chart presented by Dr.Blauel could be included in the IAEA document for life timemanagement and ageing evaluation methodology.
3.Testing could be conducted on an international basisto obtain fracture toughness data -dynamic, K ^ and arrestK^a - for WWER reactor pressure vessel materials,
4. An international data base could be constructed forall fracture toughness data (static, dynamic, arrest)received on specimens with different thicknesses, differentmanufacturers different pressure vessel materials made tomeet the requirements of different codes.
5. Standard procedures for determining statisticallybased mean and lower bound fracture toughness curves aswell as the determination of realistic fracture toughnessdata distribution could be evaluated.
6. Calculational examples with a detailed comparison ofthe use of different codes for a typical WWER reactorpressure vessel, preferably of V-230 type could beconducted. This example could contain calculation ofresistance against brittle as well as fatigue resistance.
7. A calculation example similar to (4) could beconducted but using a probabilistic approaches.
270
Recommendations
Session 2.
8. The Czech and Slovak as well as the German LBBprogram was considered valuable and it should be continuedbeyond 1992 by extending the LBB concept to the secondaryside as far as possible- This step could be accompanied byfurther experimental work susceptibility to degradationmechanisms e.g., erosion, corrosion could be included inthis moment..
9. The results chould be carried over to other WWER440/230 type plants but for plant specific conditions. Asimilar programme for WWER 440/213 and WWER 1000 wasstrongly supported.
10. Participation in the IPIRG programme (InternationalPiping Integrity Research Group) was encouraged.
Session 3.
11. It is recommended that all available ISI data setsbe considered so that the analysis results arerepresentative and not biased by limited data. It isfurther recommended that the flaw distribution methodologybe disseminated internationally for potential use by nuclearreactor owners. Code and reactor type specific informationare major criteria for implementation.
12. It is recommended that the guide-lines presented byM. Puls also be made available to non-Canadian CANDU reactorowners when these guide-lines are finalized.
13. It is recommended that the details of the Spanishprogramme on steam generator materials be made available toall PWR owners internationally.
14. It is recommended that the paper on risk-based steamgenerator life time optimisation should receive broaddistribution internationally.
Session 4:
15. Further studies to investigate the effect ofirradiation flux on embrittlement were recommended. PVannealing can mitigate irradiation embrittlement.
16. It was recommended that the data obtained throughthis programme and other related inspection activities beincluded as part of the pilot study on non-destructiveinspection sponsored by IAEA.
271
Recommendations
17..The electrochemical technique for monitoring ageingof steels seemed to have potential for the radiationembrittlement monitoring of pressure vessel steels. Furtherstudies in this area were recommended. Selecting a properelectrolytic solution (to be chosen depending upon themechanism of radiation embrittlement} is likely to be a keyfactor for application of this technique.
Session 5.
18. The inspection programme of the WWRs has shown bythe presentation exhibited a larger number of items thanthose of Western PRV. Automatic inspection inside vessel wasstrongly recommended.
19. In general, the status of AE techniques do notallow the assessment of the crack growth propagation and thetechnique requires further development. However as used inpressure testing of RPV supports it is a valuablecomplementary NDT method.
272