The influence of the Maillard reaction on the immunogenic ...
179
The influence of the Maillard reaction on the immunogenic properties of food allergens Dissertation zur Erlangung des Doktorgrades der Naturwissenschaften vorgelegt beim Fachbereich Biochemie, Chemie und Pharmazie der Johann Wolfgang Goethe-Universität in Frankfurt am Main von Anne Ilchmann aus Dresden Frankfurt, 2010 (D 030)
-
Upload
khangminh22 -
Category
Documents
-
view
0 -
download
0
Transcript of The influence of the Maillard reaction on the immunogenic ...

The influence of the Maillard reaction on the immunogenic properties of food allergens
Dissertation zur Erlangung des Doktorgrades
der Naturwissenschaften
vorgelegt beim Fachbereich Biochemie, Chemie und Pharmazie
der Johann Wolfgang Goethe-Universität in Frankfurt am Main
von
Anne Ilchmann aus Dresden
Frankfurt, 2010 (D 030)

Vom Fachbereich Biochemie, Chemie und Pharmazie der Johann Wolfgang Goethe-Universität als Dissertation angenommen. Dekan: Prof. Dr. H. Steinhilber Gutachter: Prof. Dr. T. Dingermann Prof. Dr. S. Vieths Datum der Disputation: 23.04.2010

Meinen Eltern

i
Table of Contents 1 INTRODUCTION ........................................................................................................................... 1
1.1 Introduction to Allergy ........................................................................................................ 1 1.2 Mechanism of Type I Allergy ............................................................................................. 1
1.2.1 Allergens..................................................................................................................... 3 1.3 Food Allergy ....................................................................................................................... 3 1.4 Influence of thermal processing on food allergens ............................................................ 4 1.5 The Maillard reaction ......................................................................................................... 5
1.5.1 The Maillard reaction in food allergy .......................................................................... 6 1.5.2 Clinical relevance of the Maillard reaction .................................................................. 6 1.5.3 Influence of AGEs on DC function ............................................................................. 7
1.6 AGE binding receptors ....................................................................................................... 7 1.6.1 Macrophage scavenger receptors .............................................................................. 8
1.6.1.1 Class A Scavenger receptors ............................................................................. 8 1.6.1.1.1 Scavenger receptor class A type I and II ..................................................... 8
1.6.1.2 Class B Scavenger receptors ............................................................................. 9 1.6.2 Receptor for advanced glycation end products (RAGE) .......................................... 10 1.6.3 Galectin-3 ................................................................................................................. 10
1.7 Model allergens used in this study .................................................................................. 11 1.7.1 Chicken Ovalbumin, a major allergen of egg white .................................................. 11
1.7.1.1 The Mannose receptor ...................................................................................... 12 1.7.2 Ara h 2, a major allergen of peanut .......................................................................... 12
1.8 Dendritic cells .................................................................................................................. 13 1.8.1 DC subsets ............................................................................................................... 13
1.9 Antigen uptake by dendritic cells ..................................................................................... 14 1.9.1 Pinocytosis and phagocytosis .................................................................................. 14 1.9.2 Receptor mediated endocytosis and the endocytotic pathway ................................ 15
1.10 Antigen processing by antigen presenting cells ............................................................ 16 1.10.1 MHC class I restricted presentation ....................................................................... 16 1.10.2 MHC class II restricted presentation ...................................................................... 16
1.11 Maturation of DCs .......................................................................................................... 17 1.12 T cells............................................................................................................................. 18
1.12.1 Activation of naïve T cells ...................................................................................... 18 1.12.2 CD4+ T cells ........................................................................................................... 19
1.12.2.1 Th1 cells .......................................................................................................... 19 1.12.2.2 Th2 cells .......................................................................................................... 20 1.12.2.3 Th17 cells ........................................................................................................ 20 1.12.2.4 Regulatory T cells ........................................................................................... 21
1.12.3 CD8+ T cells ........................................................................................................... 21 1.13 B cells ............................................................................................................................ 22
2 AIMS OF THIS THESIS .............................................................................................................. 23 3 MATERIAL AND METHODS ...................................................................................................... 25
3.1 Material ............................................................................................................................ 25 3.1.1 Commonly used equipment...................................................................................... 25 3.1.2 Chemicals ............................................................................................................... 26 3.1.3 Buffers ...................................................................................................................... 26 3.1.4 Cell culture media and reagents .............................................................................. 26 3.1.5 Native and recombinant proteins ............................................................................. 27 3.1.6 Antibodies and reagents for immune detection ........................................................ 27 3.1.7 Mice .......................................................................................................................... 29 3.1.8 Oligonucleotides ....................................................................................................... 30 3.1.9 Software ................................................................................................................... 30
3.2 Methods ........................................................................................................................... 30

ii
3.2.1 Molecular biological methods ................................................................................... 30 3.2.1.1 Total RNA isolation ........................................................................................... 30 3.2.1.2 Reverse transcriptase (RT) reaction ................................................................. 31 3.2.1.3 Polymerase chain reaction (PCR)..................................................................... 31 3.2.1.4 Agarose gel electrophoresis ............................................................................. 32
3.2.2 Biochemical methods ............................................................................................... 33 3.2.2.1 Preparation of proteins modified with AGEs ..................................................... 33
3.2.2.1.1 Preparation of AGE-OVA and AGE-BSA .................................................. 33 3.2.2.1.2 Preparation of AGE-rAra h 2 ..................................................................... 34
3.2.2.2 Measurement of the protein concentration using bicinchoninic acid (BCA) ..... 34 3.2.2.3 SDS-polyacrylamid gel electrophoresis (SDS-PAGE) ...................................... 34 3.2.2.4 Coomasie Brilliant blue protein stain ................................................................ 36 3.2.2.5 Structural analysis by circular dichroism spectroscopy .................................... 36 3.2.2.6 Labelling of proteins with Fluorescein isothiocyanate ...................................... 37
3.2.3 Cell culture Methods ................................................................................................. 38 3.2.3.1 Working environment for cell cultures ............................................................... 38 3.2.3.2 Culture conditions ............................................................................................. 39 3.2.3.3 Counting of cells ............................................................................................... 39 3.2.3.4 Preparation of bone marrow derived myeloid dendritic cells (mDCs) ............... 39 3.2.3.5 Assessment of mDC maturation ....................................................................... 40 3.2.3.6 Assessment of antigen uptake by mDCs .......................................................... 40 3.2.3.7 Isolation of CD4+ and CD8+ T cells ................................................................... 41 3.2.3.8 Assessment of antigen specific CD4+ T cell activation by mDCs ..................... 42
3.2.3.8.1 Activation of antigen specific CD4+ T cells from naïve transgenic mice with OVA specific TCR ..................................................................................................... 42 3.2.3.8.2 Activation of antigen specific CD4+ T cells from mice after immunisation with OVA ................................................................................................................... 42
3.2.3.9 Activation of antigen specific CD8+ T cells from naïve transgenic mice with OVA-specific TCR ......................................................................................................... 43 3.2.3.10 Assessment of T cell proliferation using carboxyfluorescein succinimidyl ester ...................................................................................................................................... 43 3.2.3.11 Assessment of T cell proliferation using tritium [3H] labelled thymidine ......... 44
3.2.4 Immunological methods ........................................................................................... 45 3.2.4.1 Flow cytometry .................................................................................................. 45 3.2.4.2 Antibody staining of cells for flow cytometry ..................................................... 46
3.2.4.2.1 Direct staining of cell surface molecules for flow cytometric analysis ...... 46 3.2.4.2.2 Indirect staining of cell surface molecules for FACS analysis ................... 46
3.2.4.3 Cell analysis by confocal laser scanning microscopy (LSM) ............................ 47 3.2.4.3.1 Cell preparation for LSM ............................................................................ 47
3.2.4.4 Enzyme linked immunosorbent assay (ELISA) ................................................. 48 3.2.4.4.1 Indirect ELISA ............................................................................................ 48
3.2.4.4.1.1 Measurement of mouse serum Immunoglobulins .............................. 48 3.2.4.4.1.2 Detection of Maillard reaction products .............................................. 49 3.2.4.4.1.3 Verification of comparable FITC/protein ratio on labelled proteins .... 49
3.2.4.5.2 Sandwich ELISA ........................................................................................ 49 3.2.4.5.2.1 Sandwich ELISA for the detection of cell supernatant cytokines ....... 49
3.2.5 Animal experimental methods .................................................................................. 50 3.2.5.1 Housing of mice ................................................................................................ 50 3.2.5.2 Short term mouse anaesthesia ......................................................................... 51 3.2.5.3 Mouse euthanasia ............................................................................................. 51 3.2.5.4 Blood harvest from the tail vain......................................................................... 51 3.2.5.5 Immunisation ..................................................................................................... 51
3.2.5.5.1 Intraperitoneal immunisation ..................................................................... 51 3.2.5.5.2 Subcutaneous immunisation ..................................................................... 52
4 RESULTS .................................................................................................................................... 53
4.1 Analysis of glycated ovalbumin (AGE-OVA).................................................................... 53 4.2 Analysis of glycated bovine serum albumin (AGE-BSA) ................................................. 55
4.3.1 Activation of OVA specific CD4+ T cells in vitro by glycated OVA ........................... 56

iii
4.3.1.1 Comparing the T cell activation ability of AGE-OVA and the unglycated OVAs ...................................................................................................................................... 56
4.3.1.1.1 Verification of mDC involvement in CD4+ T cell activation by AGE-OVA .. 59 4.3.1.2 Assessment of T cell activation by selectively glycated OVA ........................... 59
4.3.2 Influence of AGE-OVA on the proliferation of OVA specific CD4+ T cells ............... 61 4.3.3 Cytokine production by AGE-OVA activated CD4+ T cells ....................................... 62 4.3.4 Influence of AGE-OVA on the activation of OVA specific CD8+ T cells ................... 63
4.4 Interaction of AGE-OVA with mDCs in vitro .................................................................... 64 4.4.1 Influence of AGE-OVA on the maturation of mDCs ..................................................... 64
4.4.2 Influence of glycation of OVA on the uptake of the allergen by mDCs .................... 65 4.4.2.1 Verifying the comparability of the FITC labelling of the different OVA forms ... 65 4.4.2.2 Analysis of the uptake of AGE-OVA by mDCs ................................................. 66
4.4.3 Receptors mediating the uptake of AGE-OVA by mDCs ......................................... 68 4.4.3.1 Detection of receptors expressed on bone marrow derived mDCs .................. 68 4.4.3.2 Non-involvement of RAGE in the uptake of AGE-OVA .................................... 69 4.4.3.3 Non-involvement of Galectin-3 in the uptake of AGE-OVA .............................. 70 4.4.3.4 Involvement of SR-AI/II in the uptake of AGE-OVA by mDCs .......................... 71 4.4.3.5 Involvement of the MR in the uptake of AGE-OVA by mDCs ........................... 71
4.4.4 Verification of interaction of AGEs with SR-AI/II ...................................................... 72 4.4.4.1 Uptake of native and AGE-BSA by Wt mDCs ................................................... 73 4.4.4.2 Inhibition of mDC uptake of AGE-OVA by AGE-BSA ....................................... 73 4.4.4.3 Excluding unspecific interaction of FITC with SR-AI/II ..................................... 74
4.4.5 Uptake of recombinant OVA by Wt mDCs and SR-AI/II deficient mDCs ................. 75 4.4.5 Role of SR-AI/II mediated OVA uptake by mDCs in the activation of OVA specific CD4+ T cells ....................................................................................................................... 76
4.4.5.1 Verification of antigen uptake and T cell stimulatory capacity of SR-AI/II deficient mDCs .............................................................................................................. 76 4.4.5.2 The role of SR-AI/II in the activation of OVA specific CD4+ T cells .................. 77
4.4.6 Localisation of internalised AGE-OVA in mDCs ...................................................... 79 4.7 Influence of glycation by the Maillard reaction on the T cell immunogenicity and antigenicity of OVA in vivo ..................................................................................................... 83
4.7.1 Assessment of the T cell immunogenicity of AGE-OVA by subcutaneous immunisation of mice ......................................................................................................... 83 4.7.2 Assessment of the T cell immunogenicity and antigenicity of AGE-OVA using intraperitoneal immunisation of mice ................................................................................. 84
4.7.2.1 Assessment of the T cell immunogenicity of AGE-OVA by ip immunisation of mice ............................................................................................................................... 85 4.7.2.2 Assessment of the antigenicity of AGE-OVA by intraperitoneal immunisation of mice ............................................................................................................................... 86
4.8 Analysis of AGE-rAra h 2 ................................................................................................. 91 4. 9 Influence of glycation by the Maillard reaction on the T cell immunogenicity and antigenicity of rAra h 2 ........................................................................................................... 93
4.9.1 Assessment of the T cell immunogenicity of AGE-rAra h 2 by ip immunisation of mice ................................................................................................................................... 93 4.9. 2 Cytokine production of CD4+ T cells from the mice after receiving ip immunisation with unprocessed, thermally processed or AGE-rAra h 2 ................................................. 94 4.9.3 Assessment of the T cell antigenicity of AGE-rAra h 2 by ip immunisation of mice . 97
5 DISCUSSION ............................................................................................................................ 101
5.1 Glycation of OVA enhances the CD4+ T cell immunogenicity of the allergen in vitro ... 101 5.1.1 Incubation of allergens with sugars efficiently induces modification by the Maillard reaction ............................................................................................................................ 101 5.1.2 AGE-OVA has a higher CD4+ T cell immunogenicity than unglycated OVA ......... 102
5.1.2.1 Increased CD4+ T cell activation does not result from an AGE-OVA induced enhanced maturation of mDCs ................................................................................... 102 5.1.2.2 Glycation of OVA by the Maillard reaction significantly enhances the uptake of the allergen by mDCs ................................................................................................. 103 5.1.2.3 SR-AI/II mediates the enhanced uptake of AGE-OVA by mDCs .................... 104
5.1.3 CEL and CML contribute to the enhanced CD4+ T cell activation by AGE-OVA ... 105

iv
5.1.4 SR-AI/II plays a critical role in the activation of CD4+ T cells by (AGE-)OVA ........ 106 5.1.5 SR-AI/II targets AGE-OVA to MHC class II loading pathway ................................. 107
5.2 Glycation of OVA by the Maillard reaction enhance the antigenicity and T cell immunogenicity of the allergen in vivo ................................................................................. 109
5.2.1 Antigenicity of AGE-OVA in intraperitoneal immunisation ..................................... 110 5.2.2 The influence of AGEs on CD4+ T cell differentiation ............................................ 111
5.3 Glycation reduces the allergenicity of rAra h 2 .............................................................. 112 5.3.1 Thermal incubation of rAra h 2 with carbohydrates leads to glycation and loss of secondary structure ......................................................................................................... 113 5.3.2 The glycation of rAra h 2 by the Maillard reaction reduces the CD4+ T cell immunogenicity of the allergen in vivo ............................................................................ 114 5.3.3 The glycation of rAra h 2 by the Maillard reaction reduces the antigenicity of the allergen in vivo................................................................................................................. 115
5.4 Differential effects of glycation on the T cell immunogenicity and antigenicity of OVA and rAra h 2 ................................................................................................................................ 117 5.5. Potential Allergenicity of AGEs of food allergens ......................................................... 118
6 SUMMARY ................................................................................................................................ 120 7 GERMAN SUMMARY ............................................................................................................... 122 8 ABBREVIATIONS ..................................................................................................................... 129 9 REFERENCES .......................................................................................................................... 133 10 LEBENSLAUF ........................................................................................................................ 169 11 PUBLIKATIONEN UND PRÄSENTATIONEN ....................................................................... 171
11.1 Publikationen ............................................................................................................... 171 11.2 Präsentationen ............................................................................................................. 171
12 DANKSAGUNG ...................................................................................................................... 172

Introduction
1
1 Introduction
1.1 Introduction to Allergy The term allergy was introduced by Clemens von Pirquet in order to differentiate between
protective immunity and hypersensitive reactions (von Pirquet, 1906). The World Allergy
Organisation now defines allergy as a “hypersensitive reaction initiated by specific immunologic
mechanisms” (Johansson et al., 2004). Allergic reactions result from an inappropriate reaction of
the immune system to a normally harmless, non-infectious substance, called allergen. Sources of
allergens may be grass or tree pollen, animal epithial cells or feathers, house dust mites, drugs,
insect venom or food.
The pathologic mechanisms of allergies have been divided into four types (Coombs and Gel
1963). Types I, II and III are antibody mediated and discerned by the antibodies and antigens
involved. Type I responses, immediate hypersensitivity reactions, are mediated by IgE antibodies.
Type II and III are both mediated by IgG antibodies but type II responses are directed against cell
surface or matrix antigens while type III responses are directed against soluble antigens. Type IV
is antibody independent and is mediated by T helper cells. In the focus of this thesis is food
allergy which is frequently associated with the IgE mediated type I immediate hypersensitivity
reaction. Therefore only this mechanism will be described in more detail.
1.2 Mechanism of Type I Allergy The Type I allergy may generally be divided into two phases, a sensitisation phase and an
elicitation phase. In the sensitisation phase the production of allergen specific IgE antibodies is
initiated but no symptoms are yet induced. In the elicitation phase repeated contact with the
allergen elicits allergic reactions.
During the sensitisation phase allergens enter the body by passing the mucosa, usually in small
amounts. The allergens are taken up by antigen presenting cells (APC) such as dendritic cells
(DCs) and macrophages. These cells process the allergen by proteolysis and peptide fragments
of the allergen are loaded onto MHC class II molecules (MHC II) (chapter 1.10.3). The complex of
the allergen peptide and MHC II is presented on the surface of the APCs. CD4+ T cells recognise
the complex by a T cell receptor (TCR). The binding of the TCR to the peptide-MHC II complex, in
conjunction with further co-stimulatory signals, results in the activation and differentiation of the T
cells (chapter 1.12.1). Naïve CD4+ T cells are known as Th0 cells and can differentiate into four
subsets; T helper 1 (Th1) cells, T helper 2 (Th2) cells, T helper 17 cells (Th17) and regulatory T
cells. In the onset and maintenance of allergic diseases Th2 cells play a critical role (chapter
1.13.1.2). The cytokines IL-4 and IL-13, which are typically secreted by Th2 cells, induce the
differentiation of B cells to IgE producing plasma cells (Poo et al., 1988). In contrast to other
antibodies which generally bind to Fc receptors only after they have bound to specific antigens,

Introduction
2
IgE antibodies are captured by high affinity Fcε receptors (FcεRI) in the absence of bound
antigen. Mast cells and basophils express FcεRI, therefore IgE antibodies are bound to the
surface of these cells (Murphy et al., 2008).
If the same allergen is reencountered after the sensitisation phase, an allergic reaction with
clinical symptoms occurs, this is the elicitation phase. The elicitation phase is divided into an early
phase and a late phase reaction. Crosslinking of the specific IgE antibodies by allergens induces
the release of inflammatory mediators such as histamine from these cells which induce allergic
symptoms such as diarrhoea, conjunctivitis and anaphylaxis. This process is the early phase
reaction. In order for cross linking of the IgE antibodies captured on the cell surface to occur, the
allergen needs to posses at least two different epitopes recognised by the antibodies.
First contact:
Sensitisation phase
Mast cell
IgE FceRI
Allergen
Antigen presenting cellT helper cell
TH2
IL-4,
IL-13
B cell
Differentiation
Class switch
IgE
Second contact:
Elicitation phase
Release of inflammatory mediators
Allergic reaction
Plasma cell
Fig. 1.1 Overview of the mechanism of type I allergy
After the first immediate allergic reaction, the late phase reaction may follow which takes up to 8
to 48 hours to develop. In the late phase reaction, mast cells and basophils are also pivotal
players as they are the major source of various cytokines and chemokines. These mediators drive
the Th2 immune responses and initiate the influx of leukocytes, for example eosinophils, to the
inflammatory sites. Eosinophils produce inflammatory mediators such as leukotrienes, which
cause vasodilatation, mucosal swelling and smooth muscle contraction. Symptoms associated
with the late phase reaction is a second phase of smooth muscle contraction, edema and swelling
due to hypertrophy (increase in cell size) and hyperplasia (increase in cell proliferation) (Murphy

Introduction
3
et al., 2008). The late phase reaction occurs in roughly 50% of the patients with an immediate
response (Meltzer 1997).
1.2.1 Allergens In order for a molecule to be defined as an allergen it must display specific properties. It must be
able to bind to IgE in order to elicit the clinical symptoms associated with allergy. The IgE
antibodies are generally specific for the particular allergen, however cross reactions can occur.
Such cross reactions are commonly observed in patients sensitised to the birch pollen allergen
Bet v 1. Homologues of this protein are found in fruits and vegetables such as cherries or carrots.
These elicit allergic reactions by binding to Bet v 1 specific IgE due to cross reactions. IgE
sensitisation to N-glycans (cross‐reactive carbohydrate determinants), as they are found on
some plant glycoproteins, can also be a cause of cross reactivity.
According to the prevalence of the IgE sensitisation in patients, allergens are divided into major
and minor allergens. In order to be classified as a major allergen, the allergen has to be
recognised by the serum IgE from more than 50% of the patients in a group of at least 5 allergic
patients. From 5-50% prevalence, the allergen is considered minor (Larsen et al., 1996). The
binding of allergens by IgE antibodies is dependent on the identification of so called B cell
epitopes; these can either be linear or conformational. Linear epitopes consist of a continuous
sequence of amino acids while conformational epitopes consist of amino acid sequences which
belong to different sections of a protein but have come to lie within close proximity to each other
due to the three dimensional structure of the protein. T helper cells recognise allergens only after
they have been processed by antigen presenting cells (APC) and are presented as MHC-peptide
complexes (chapters 1.9.2 and 1.10). Epitopes recognised by T cells are always linear.
1.3 Food Allergy For the prevalence of food allergy, only estimated figures exist. Studies claim that 3-7% of the
western population suffer from food allergies, some studies even present figures of up to 17%
(Rona et al., 2007). Furthermore, the prevalence of food allergy in the western countries has
experienced a significant increase in the recent decades (Sicherer 2002; Sampson 2003). Some
common allergies include egg (0.5 - 9%), milk (0.2 – 9%), shell fish (2.5%) and peanut (0,5-6%)
(Rona et al., 2007). The heterogeneity in the prevalence of food allegy in general and allergies to
a specific food stated in different studies is likely to be the result of the different populations being
studied and differences in study design or methodology.
The symptoms of food allergy can range from itchiness of the oral cavity and gastrointestinal
disorders such as diarrhoea to severe reactions such as dyspnoea or an anaphylactic shock

Introduction
4
which can be fatal. Seemingly unrelated symptoms such as itchiness of eyes and rhinitis or
contact dermatitis may also be seen in response to aerosolised food particles or handling food.
1.4 Influence of thermal processing on food allergens Heating makes food safe to eat by inactivating harmful bacteria or toxins. It also enhances the
texture, flavour and colour. The thermal processing of foods may decrease or enhance the
allergenicity of food allergens as a result of a heat induced change of protein conformation and
chemical modifications. The influence of thermal processing on the allergenicity of an allergen
depends on temperature, pH, time and on the cooking method. The surrounding food matrix
would also have a significant impact. So far, there are no universal rules predicting the
consequences of thermal processing on the allergenicity of proteins. A decrease of allergenicity
could be the result of the destruction of conformational epitopes by the denaturation of the protein,
leaving only linear epitopes available for antibody binding.
Thermal treatment is as likely to not affect or even to enhance the allergenicity of a food protein
as it is to reduce it, as has been shown in a considerable number of studies. One of the major
allergens of egg, ovomucuid, retains its immunogenicity after being heated to 100 °C (Hirose,
2004). The cherry allergen Pru v 3 remains IgE reactive in thermally processed foods (Scheurer et
al., 2004). Allergenicity may increase due to an increased resistance to digestive enzymes, newly
available IgE binding sites or better accessibility of these sites due to unfolding of the protein or
chemical modification. The latter two can lead to the formation of neoallergens. Neoallergen
formation is very likely to play a role in cases where patients react to processed but not to raw
food. Interestingly, the first reported case of allergy was a report of a patient who reacted to
proteins in cooked but not in raw fish (Prausnitz and Kustner, 1921). A variety of similar cases
have been published since then. For instance, it has been reported that a patient with pecan nut
allergy had antibodies exclusively to allergenic determinants found in pecan nuts only after longer
storage or heating (Malanin, 1995). Another case described a patient with allergic reactions
following the consumption of cooked shrimp but not raw shrimp (Rosen et al., 1994). These
findings suggest the development of neoallergen formation under the influence of heat.
Protein-sugar interactions occur during thermal processing; these result in the non-enzymatic
browning of food. The chemical modifications resulting from this interaction contribute to
neoallergen formation. The reaction describing this process is the Maillard reaction and it has
been found that the reaction products, in particular the end products of this multistep reaction,
may severely influence the immunologic properties of food allergens.

Introduction
5
1.5 The Maillard reaction The Maillard reaction is a major reaction occurring during the thermal processing and storage of
food. In 1912 Louis C. Maillard (Maillard 1912) first described systemic studies about the reaction
indicating that amino acids and reducing sugars undergo complex reactions during heating which
lead to the formation of brown substances. The “Maillard reaction” is a series of subsequent and
parallel reactions which can be divided into three stages.
In the early stage, condensation takes place between an amino group of a protein and a carbonyl
group of a reducing carbohydrate leading to the formation of a Schiff base. The condensation is
followed by an intramolecular rearrangement of the Schiff base, resulting in the first stable
reaction product, an aminoketose. The different aminoketoses which can be produced during the
first stage of the reaction are collectively called Amadori products (Fig. 1.1). The ε-amino group of
lysine represents the primary target for an attack by carbohydrates. Up to 70% of the lysine
residues of a protein can react to Amadori products, depending on the time and temperature
during heating or storage (Finot et al., 1981). Amadori products are fairly stable in foods with low
water activity but during severe heating or prolonged storage they can undergo degradation, this
marks the second stage of the Maillard reaction. The degradation reaction of the Amadori
products results in the formation of 1,2-dicarbonyls. These are prone for reactions with proteins;
this reactivity allows the final stage of the Maillard reaction to occur.
Advanced glycation end products (AGE)
N-e-carboxyethilysine(CEL)
N-e-carboxymethilysine(CML)
GA-pyridine
pyrraline
NHR
Amino compound
Reducing sugar
Amadori product
Fig. 1.2 Main steps of the Maillard reaction
The 1,2-dicarbonyls react with further lysine side chains, ones which have not already been
modified in the first stage of the reaction, or arginine of the protein to form stable peptide bound
amino acid derivatives (Henle, 2005). N-ε-cyrboxymethyllysine (CML), N-ε-cyrboxyethyllysine
(CEL), pyrraline, Glycolaldehyde-pyridine (GA-pyridine) and pentosidine are representative
structures of amino acid derivatives formed during the final stage of the reaction (Fig. 1.1). Some
of the “end products” of the Maillard reaction, namely peptides and proteins modified with these

Introduction
6
structures after the reaction are collectively called advanced glycation end products (AGEs). N-ε-
carboxymethyllysine (CML) was the first amino-acid derivative of the Maillard reaction detected in
food (Hartkopf and Ebersdobler, 1994). A pyrrole derivate of lysine, pyrraline, was quantified in
several foods like milk or bakery products (Henle and Klostermeyer 1993; Rufian-Henares et al.
2004). To distinguish the reaction mechanisms of the Maillard reaction from enzymatic
glycolsylation the term glycation was introduced (Ledl and Schleicher, 1990).
1.5.1 The Maillard reaction in food allergy The Maillard reaction may increase the allergenicity of food allergens in thermally processed
foods. The glycation structures present on proteins modified by the Maillard reaction could
contribute to the formation of new epitopes. When native Ara h 1 and Ara h 2 purified from
peanuts (of which they are the major allergens) or recombinant Ara h 2 were subjected to the
Maillard reaction by heating with carbohydrates or carbohydrate break down products, the binding
of these allergens to serum IgE from peanut allergic patients was increased (Maleki 2001, Gruber
2005). Chung et al showed that the amount of AGE adducts is twofold higher in roasted than in
raw peanuts (Chung et al., 2001). A further analysis then showed that mature peanuts, which
contain more sugar and protein than immature peanuts, have 20% higher levels of AGE adducts
after roasting than identically processed immature peanuts. This increased level of AGE
correlated with enhanced binding of IgE to the peanut extract (Chung et al., 2003). Scallop
tropmyosin was also found to have increased IgE binding ability after modification by the Maillard
reaction (Nakamura et al., 2005).
Another interesting study suggested the generation of neoallergens by the Maillard reaction. The
nonallergic protein lectin from peanuts was subjected to modifications by the Maillard reaction.
While lectin showed little or no reactivity to serum IgE antibodies from patients with peanut
anaphylaxis, the AGE-lectin did bind to the antibodies. Furthermore, AGE-lectin was able to inhibit
serum IgE binding to peanut allergens (Chung and Champagne, 1999). IgE is the immunoglobulin
isotype involved in the induction of allergic responses (chapter 1.13). The observations suggest
that the glycation by the Maillard reaction could enhance the allergenicity of food allergens.
1.5.2 Clinical relevance of the Maillard reaction Rhabar published in 1968 that the glycosylated part of haemoglobin, HbAIc, was increased in
patients with diabetes (Rhabar, 1968). HbAIc is glycated by the binding of glucose to a valine
residue in the form of an Amadori rearrangement (Koenig et al., 1977). These studies showed that
the Maillard reaction occurs in the body.
Recent studies have shown that various AGEs of endogenous proteins accumulate in the human
body during aging, especially in long lived tissues such as collagen, neural myelins or the lens
(Simm et al., 2008). The glycation process is dependent on the glucose concentration and is
accelerated in hyperglycaemia (a condition in which an excess amount of glucose circulates in the

Introduction
7
blood plasma) (Brownlee, 1992, Yamagishi et al. 2003, Yamagishi and Imaizumi, 2005). There is
increasing evidence that the accumulation of endogenous AGEs plays a crucial part in the onset
of diabetic complications and neurodegenerative disorders (Simm et al 2008; Takeuchi et a.,
2008; Gosh and Cooper 2008). A correlation of acute exacerbation of atopic dermatitis with the
urinary levels of the AGE pentosidine has also been observed (Tsukahara et al., 2003).
Interaction of AGEs with the signal-transducing receptor RAGE (receptor for advanced glycation
end products, chapter 1.6.2) appears to play a role in the onset and exacerbation of diabetic
complications and atopic dermatitis. RAGE mediated signalling induces the secretion of
inflammatory cytokines (i.e. IL-1α and tumour necrosis factor-α) and growth factors (i.e. vascular
endothelial growth factor and connective tissue growth factor) by epithelial cells, macrophages
and monocytes. These cyokines and growth factors induce inflammation and oxidative stress,
which could contribute to the pathological changes observed in the diabetic complications and
atopic dermatitis (Bucula and Vlassare, 1995; Suzuki and Miyata et al., 1999). These
observations suggest that AGEs could have an immunostimulatory effect.
Since the in vivo Maillard reaction is exceedingly complex, endogenous AGEs are very
heterogeneous. So far, only few AGEs generated under physiological conditions have been
characterised, such as CML and pentosidine. It is still not known whether the biological activity of
endogenous and food derived AGEs is different or not (Koschinsky 1997).
1.5.3 Influence of AGEs on DC function Studies examining the influence of AGEs on DCs have given conflicting data. AGEs derived from
bovine serum albumin (AGE-BSA) were able to induce the maturation of human monocyte
derived DCs and augmented their capacity to stimulate T cell proliferation as well as cytokine
secretion (Ge et al., 2005). In contrast, adrenocorticotrophic hormone derived AGEs were shown
to inhibit maturation and T cell stimulatory capacity of human DCs (Price et al., 2004). Together
these studies suggest that AGEs could have an influence on the maturation of DCs as well as on
the T cell immunogenicity of antigens. Maturation and antigen presentation in DCs and
subsequent activation of T cells are highly critical processes in the onset and maintenance of
allergy. Therefore, the glycation of food allergens by the Maillard reaction could contribute to the
pathology of food allergy.
1.6 AGE binding receptors Since it was found that AGEs contribute to the pathology of a variety of diseases, many
researchers have tried to identify receptors which mediate the interaction of cells with AGEs. So
far, the following receptors have been shown to bind to AGEs: the receptor for advanced glycation
end products (RAGE) (Schmidt et al., 1992; Neeper 1992), Galectin-3 (Vlassara et al., 1995) and
several receptors belonging to the heterogeneous scavenger receptor family; scavenger receptor

Introduction
8
class A type I and II (SR-AI/II) (Suzuki et al., 1997; Araki et al., 1999), scavenger receptor class B
type I (SR-BI) (Ohgami et al., 2001, a) and CD36 (Ohgami et al., 2001, b).
1.6.1 Macrophage scavenger receptors Macrophage scavenger receptors (SR) were originally defined as receptors which could bind to
low density lipoproteins (LDL) modified by acetylation (AcLDL) or oxidation (OxLDL) but not
unmodified LDLs (Goldstein et al., 1979). Since then, the family of scavenger receptors has vastly
expanded. The family is divided into eight classes (Class A, B, C, D, E, F, G and H) according to
their multidomain structure (Krieger, 1997). Due to the definition of the receptors, the SR family
consists of unrelated distinct gene products with considerable structural heterogeneity amongst
the different classes.
1.6.1.1 Class A Scavenger receptors The scavenger receptor class A has been identified in several species, including humans and
mice (Ashkenas et al., 1993; Matsumoto et al., 1990; Tomokiyo et al., 2002). It is highly
conserved among the species and is found in three isoforms, SR-AI, SR-AII (both collectively
called SR-AI/II) and SR-AIII, which result from alternative splicing of one gene. SR-AIII is non-
functional and remains trapped in the endoplasmatic reticulum (Matsumoto et al., 1990; Rohrer et
al., 1990; Gough et al., 1998). Further members of class A are the macrophage receptor with
collagenous structure (MARCO) (Elomaa et al., 1995), scavenger receptor class A 5 (SCARA-
5)(Jain et al., 2006) and scavenger receptor with a c-type lectin domain (SRCL-I/II)(Nakamura et
al., 2001). Those receptors have similar domain structures to SR-AI/II.
1.6.1.1.1 Scavenger receptor class A type I and II
SR-AI/II is a trimer consisting of three 80 kDa type II transmembrane proteins with an intracellular
N-terminus. It is made up of the transmembrane domain, a spacer region, a helical coiled coil
domain, a collagenous domain and a C-terminal cysteine rich domain. SR-AII has a shorter C-
terminus than SR-AI (Fig. 1.2). To this date, only the collagenous domain has been identified as a
ligand binding domain. SR-AI/II binds to a wide range of anionic ligands including natural
carbohydrates, oxLDL and acLDL and chemically modified proteins such as AGEs. The ligand
binding specificity of SR-AI and SR-AII is considered to be similar (Kodama et al., 1995; Gough et
al., 1998).
The expression of SR-AI/II is restricted to cells of the myeloid lineage (e.g. DCs and
macrophages) with the exception of monocytes (Hughes et al., 1995). SR-AI/II is expressed on
26% of splenic CD11c+ DCs (Becker et al., 2006). Expression of SR-AI/II was also found on bone
marrow derived murine DCs generated with granulocyte macrophage colony stimulating factor
(GM-CSF) where the expression of SR-AI/II was intrinsically correlated with the expression of
CD11c (Becker et al., 2006; Amiel et al., 2007).

Introduction
9
SR-AI/II mediates the clearance of LDLs and pathogens (Hughes et al., 1995; Platt and Gordon,
2001) and act as an adhesion molecule for macrophages (Santaiago-Garcia et al., 2003).
Furthermore, the receptors appear to play a role in antigen presentation. Previous studies have
demonstrated that the conversion of antigens to SR-AI/II ligands increased their T cell
immunogenicity. For example, maleylation of mouse serum albumin (Mal-MSA) targets the protein
for uptake by the scavenger receptors. Mal-MSA was able to induce T cell activation in mice,
while native MSA was not. Additionally, T cell activation by Mal-MSA was dependent on the
presence of SR-AI/II (Nicoletti et al., 1999). The results indicate that SR-AI/II play a role in the
antigen capture and subsequent antigen presentation by APCs.
Araki et al have shown that Chinese hamster ovary cells expressing SR-AI/II take up and degrade
AGE-BSA (Araki et al., 1995). Binding of AGE to SR-AI/II was confirmed in peritoneal
macrophages from SR-AI/II knock out mice, where degradation of AGE-BSA was considerably
reduced compared to that in WT macrophages (Suzuki et al., 1997). It has been demonstrated
that BSA modified with glycoaldehyde, which is an intermediate in the formation of CML, is
recognised by SR-AI/II (Nagai et al., 2000). However, the exact ligand structure of AGEs which
can bind to SR-AI/II remains unknown.
SR-AI SR-AII CD36 SR-BI
Class A Class B
Collagenous domainA-helical coil Cysteine rich domain Potential N-linked glycosylation
Key to Domains
Fig. 1.2 Domain architecture of class A and class B scavenger receptors. The receptors of one scavenger receptor class are structurally similar but the structures of different classes are very
heterogeneous. Figure adopted and modified from Plüddemann et al., 2007.
1.6.1.2 Class B Scavenger receptors The scavenger receptor class B has two members, CD36 and SR-BI. CD36 is a type II
transmembrane receptor consisting of two transmembrane domains, an extracellular loop with
glycosylation sites and two short intracellular tails (Greenwalt et al., 1992). The ligand binding site
was suggested to be in the central part of the extracellular domain (Fig. 1.2) (Puente et al., 1996).
CD36 is expressed on macrophages, platelets, adipocytes and some epithelial and endothelial
cells (Terpstra et al., 2000). SR-BI has a similar loop structure as CD36. The receptor exists as
two splice variants, SR-BI and SR-BII collectively referred to as SR-BI (Acton et al., 1994). SR-BI

Introduction
10
is expressed on monocytes, macrophages and DCs as well as on hepatocytes (Terpstra et al.,
2000).
Using Chinese hamster ovary cells expressing CD36, it was found that CD36 mediated the uptake
of AGE-BSA which then underwent lysosomal degradation (Ohgami et al., 2001b). SR-BI also
mediates the endocytosis of AGE-BSA. AGE-BSA binds to the same sites of SR-BI as AcLDL
and OxLDL (Ohgami et al., 2001a).
1.6.2 Receptor for advanced glycation end products (RAGE) Schmidt and colleagues found that endothelial cells bind to AGE-modified proteins by a lactoferrin
like protein (Schmidt et al., 1992). Using molecular cloning, it was shown that this protein was a
member of the immunoglobulin superfamily of receptors. The receptor was named the receptor for
advanced glycation end products (RAGE) (Neeper et al., 1992). RAGE has an N-terminal
extracellular domain, a V-region like and two C-region like domains, one transmembrane domain
and an intracellular C terminal domain. The V-region like domain is involved in ligand binding
whereas the C-terminus is important for signal transduction (Schmidt and Stern 2000; Neeper et
al., 1992; Hofmann et al., 1992; Huttunen et al., 1999).
RAGE expression is observed in various tissues including vascular epithelium, lung, liver and
neurons. Endothelial cells, DCs, macrophages, and monocytes are the main cells expressing the
receptor (Lin et al., 2009; Cataldegirmen et al., 2005). RAGE contributes to a number of
pathological processes in diabetes, atherosclerosis and neurodegenerative disorders (chapter
1.5.2). In addition to cell surface bound RAGE, a soluble secreted form of RAGE has also been
identified, so called endogenous secretory RAGE. This form of RAGE results from alternative
splicing and appears to protect from AGE-induced injury by capturing AGE ligands (Yonekura et
al., 2003). Apart from AGEs, several ligands for this receptor have been identified. One of the
ligands is the nuclear protein high-mobility group box 1 (HMGB-1). Stimulation of T cells with
HMGB-1 via RAGE was shown to be essential for activation of these cells (Moser et al., 2007).
1.6.3 Galectin-3 Lectins are proteins which can bind to both soluble carbohydrates and carbohydrate moieties
which are part of a glycoprotein. They have important functions in the innate and adaptive
immune system by sensing glycoconjugates derived from self or pathogens. Galectins are a
family of 15 lectins which have the specificity for lactose/galactose in common (Barondes et al.,
1995). Galectin-3 was originally described as a cell surface marker for activated macrophages
(Ho and Springer, 1982). Later, the receptor was also found on monocytes, eosinophils, natural
killer cells, activated T and B cells and DCs (Dumic et al., 2006; Sato and Nieminen, 2004).
Galectin-3 interacts with β-galactoside residues of matrix and cell surface proteins via the
carbohydrate recognition domain (Pricci et al., 2000). The receptor contributes to a variety of
cellular processes, such as phagocytosis by macrophages (Sano et al., 2003), proliferation and

Introduction
11
survival of T cells and monocytes (Demetriou et al., 2001; Morgan et al., 2004). It has been shown
that Galectin-3 has a high affinity for AGE-BSA (Vlassara 1995).
1.7 Model allergens used in this study
To examine the influence on the immunogenicity and antigenicity of food allergens in this study
two model allergens were chosen: chicken ovalbumin (OVA), a major allergen of egg white, and
Ara h 2, a major allergen of peanut (Arachis hypogaea).
1.7.1 Chicken Ovalbumin, a major allergen of egg white Egg white allergy is one of the most prevalent allergies in children (Sicherer and Sampson, 2006).
Some children become tolerant against egg by the time they reach school age (Wood, 2003).
However, the allergy persists in others (Savage et al., 2007) and allergic reactions to egg in those
patients are frequently severe. In some cases, onset of egg allergy has also been observed in
adults (Nogaard et al., 1992; Escudero et al., 2003). OVA and ovomucoid are the two major
allergens of egg white (Mine and Yang, 2008).
OVA is the most abundant protein in avian egg white (Mine and Zhang, 2002). It is a glycoptrotein
with a molecular weight of approximately 45 kDa and 386 amino acid residues (Nisbet et al.,
1981). The protein contains 3,5% of carbohydrate by weight. There is a single carbohydrate chain
attached to the aspargine (Asn) at position 293 which is composed of N-acetyl-glucoseamine
(GNac) and mannose (Fig. 1.3). The serine residues at positions 69 and 345 are potential
phosphorylation sites (Perlmann, 1952)
Purified OVA is commercially available in large quantities and is cost efficient. It has therefore
become a widely used model allergen for immunological analysis. Many immunological tools have
been established to study OVA, such as the transgenic mouse strains OT-1, OT-2 and DO11.10,
which have T cell receptors specifically recognising OVA peptides. For these reasons, OVA was
used as a model allergen in this study.
Fig. 1.3 Glycation structures of chicken ovalbumin The single carbohydrate chain of OVA is attached to Asn293 and is composed of N-acetyl-glucoseamine (GNAc) and
mannose (Man). Kiely et al., 1976

Introduction
12
1.7.1.1 The Mannose receptor As OVA has several mannose residues (Fig. 1.3), the allergen binds to the mannose receptor
(MR) (Huntington 2001 et al., Burgdorf 2006, Autenrith et al., 2007). The MR is a transmembrane
receptor of approximately 180 kDa. It is a c-type lectin. C-type lectins have a highly conserved
calcium dependent carbohydrate recognition domain (CRD) of around 120 amino acids. The MR
consists of an N-terminal cysteine rich domain, a fibronectin type II repeat domain, eight CRDs, a
transmembrane domain and a short intracellular region (Ezekowitz et al., 1990). The CRDs bind
to glycoproteins bearing terminal fucose, mannose or glucose, whereas the cysteine rich domain
binds sulphated sugar moieties (Largent et al., 1984). The MR is an endocytotic receptor. The
receptor also contributes to pathogen defence by the recognition of carbohydrate residues of
several microorganisms (McGreal et al., 2005). The MR is expressed by macrophages, DCs,
monocytes, dermal microvascular endothelial cells and liver endothelial cells (Harris et al., 1992;
Figdor et al.2002).
1.7.2 Ara h 2, a major allergen of peanut Peanuts (Arachis hypogaea) are highly allergenic and cause severe anaphylactic reactions more
often than other food known to cause allergic reactions (Yunginger et al., 1989; Sampson et al.,
1992). Peanut allergy tends to develop in childhood and often remains throughout life. The
prevalence of peanut allergy has risen over the past decade (Burks, 2008). Due to the widespread
use of peanut products and the lack of efficient therapies, patients have to accommodate
themselves with restrictions on quality of life. Accordingly, peanut allergy is a growing concern in
regard to food safety.
Peanuts contain many proteins with allergenic properties. So far, Ara h 1 to 9 have been isolated
from peanuts as allergens. Among these, Ara h 1 and Ara h 2 are considered as the major
allergens as they are recognised by serum IgE from more than 90% of the patients with peanut
allergy (Burks et al., 1992; Burks et al., 1995). The glycoprotein Ara h 2 belongs to the
prolamines, a superfamily whose members are frequently found in seeds as storage proteins and
amongst which plant food allergens are often found. In SDS-PAGE the protein runs as two bands
at approximately 16 kDa and 18 kDa representing the two isoforms, Ara h 2.01 and Ara h 2.02.
(Chatel et al., 2003). The amino acid sequence of the isoforms is 98,1% identical. Ara h 2.01 has
160 amino acids, whereas Ara h 2.02 contains an additional insertion of 12 amino acids. Ara h 2
is resistant to acidic conditions and digestion enzymes of the gastrointestinal tract (Astwood et al.,
1996, Lehmann et al., 2006), properties which could contribute to the high allergenicity of
peanuts. In general, peanuts are thermally treated in some form and Ara h 2 was shown to be
highly resistant to temperatures of up to 90°C (Lehmann et al., 2006). Therefore, the influence of
thermal processing on the allergenicity of peanut allergens is of great interest.

Introduction
13
1.8 Dendritic cells As professional antigen presenting cells (APCs), dendritic cells (DCs) would be the first immune
cells to capture allergens. DCs were first described by Paul Langerhans in 1868, who stained
these cells in human skin and mistakenly thought they were nerve cells due to their dendrites
(Langerhans 1868). DCs are key players of the immune system in both protection and tolerance.
They are widely distributed in most tissues, including non-lymphoid as well as lymphoid tissues
and also in the blood. DCs in tissues such as the intestine constantly sample environmental
antigens (e.g. food proteins) and migrate into the T cell areas of lymph nodes (LNs). The T cell
area is located in the cortex of the LNs and it is within these areas that T cells are found. Within
the T cell area the contact between DCs and T cells takes place. When T cell receptors of T cells
recognise the antigenic peptide presented by DCs, the T cell is activated (chapter 1.12.1). The
migration of DCs to the LNs is greatly enhanced once an inflammatory signal is encountered
(Randolph et al., 2008). However, self antigens should not induce an immune response. DCs are
able to tolerise T cells to self antigens in the thymus and in the periphery (Bancherau and
Steinman 1998). In allergy, DCs play a critical role in the sensitisation to allergens and the
induction of the Th2 response (Hammad et al., 2002; Graffi et al., 2002) as well as in antigen
presentation to previously primed Th2 cells. The pivotal role of DCs in food allergy was
demonstrated by the observation that the adoptive transfer of Payer’s patches derived DCs from
allergic mice was able to induce antigen-specific IgE responses in naïve mice even without prior
antigen challenge of the naïve mice (Chambers et al., 2004).
1.8.1 DC subsets Since the first description of DCs, it has become apparent that there are many different subtypes
of DCs. Each subtype has a particular location and function in the immune system (Shortman and
Liu, 2002). In the steady state, DCs can be divided into two major populations in both mice and
humans, conventional DCs (cDCs) and plasmacytoid DCs (pDCs). By flow cytometry, murine
cDCs can be characterised as CD11c+CD11b+B220- (Wick, 2007), pDCs can be identified by flow
cytometry as being CD11clow CD11b– B220+ (Brawand et al., 2003). During infection or
inflammation, further DCs can develop, such as monocyte derived DCs and tumour necrosis
factor (TNF) producing DCs.
cDCs can be further subdivided into migratory DCs and lymphoid tissue resident DCs. Migratory
cDCs act as sentinels in the peripheral tissue and migrate to the LN bearing antigens from the
periphery where subsequently activates T cells. Examples of migratory cDC would be the
Langerhans cells in the skin or the cDCs found in the intestine and airways. Lymphoid tissue
resident DCs collect and present antigens in the lymphoid organ itself. Lymphoid tissue resident
cDCs include most of the cDCs in the thymus and the spleen.
DCs are of haematopoietic origin. Haematopoietic stem cells are found in the bone marrow and
give rise to two lineages of progenitor cells, the myeloid and the lymphoid progenitor. All subtypes

Introduction
14
of DCs can develop from either the common lymphoid progenitor (CLP) or the common myeloid
progenitor (CMP) populations. Since myeloid precursors are more abundant in the bone marrow
than lymphoid precursors, it is assumed that in vivo most DCs are of myeloid origin.
pDCs have been mainly identified as important players in viral infections by secretion of large
amounts of Interferon (IFN) −α and β. Their potential to take up antigen and initiate T cell
responses is still unclear. On the other hand, cDCs are known to be highly sufficient in antigen
uptake and are highly potent activators of T cells. These characteristics make them critical players
also in allergy. In vitro generated bone marrow derived mouse myeloid dendritic cells (mDCs) are
regarded as a model for cDCs. Therefore, mDCs were chosen for the present study.
1.9 Antigen uptake by dendritic cells In most tissues, DCs are in an immature state. In this state they are unable to stimulate T cells but
are well equipped to capture antigens. Immature DCs are highly efficient in the uptake of self and
foreign antigens. The sampling of their environment by DCs is critical for the regulation of
tolerance and the induction of immunity. DCs employ a variety of mechanisms for the uptake,
namely pinocytosis, phagocytosis, and receptor-mediated endocytosis.
1.9.1 Pinocytosis and phagocytosis Pinocytosis describes an uptake mechanism by which fluids are introduced into the cell via the
invagination of the cell membrane resulting in the formation of vesicles within the cells.
Pinocytosed material is taken up into clathrin coated pits which have the protein chlathrin on the
inner side of the membrane which, together with other proteins, forms a basket. The pits are
pinched off from the cell membrane and enter the cell as clathrin coated vesicles and fuse with
early endosomes and are then processed in the endocytotic pathway (chapter 1.9.2). Pinocytosis
is a constitutive process in immature DCs. For the uptake of large particulates, DCs employ phagocytosis. The particles are usually
recognised by receptors on the cell surface. When binding to the particles, the receptors form so
called phagosomes by folding of the plasma membrane around the binding area. Within the cells,
the phagosome fuses with the lysosome, where the phagocytosed particles are degraded
(chapter 1.9.2). Bacteria (Rescigno, 2002), protozoans (Konecny et al., 1999) and yeast (d'Ostiani
et al., 2000), as wells as cell debris or whole dying cells are taken up by phagocytosis. DCs are
able to distinguish between necrotic and apoptotic cells and the presentation of cell related
antigens may play a role in the maintenance of tolerance (apoptotic cells) and for the triggering of
an immune response (necrotic cells) ( Steinman et al., 2000)

Introduction
15
1.9.2 Receptor mediated endocytosis and the endocytotic pathway To take up soluble exogenous antigens, DCs are equipped with a full array of specialised
receptors such as galectins, c-type lectin receptors, Fc receptors (Fanger, 1996; Ravetch, 2001)
and scavenger receptors (Becker et al., 2006; Amiel et al, 2007) on the cell surfaces. These
receptors bind to conserved structures such as carbohydrate moieties on antigens and pathogen-
associated molecular patterns in pathogenic microbes. The captured allergens and pathogenic
microbes are endocytosed and targeted into the endocytotic pathway, which consists of various
endosomal compartments. Concerning their pH and composition, the endosomal compartments
mature gradually along the track which makes it difficult to clearly distinguish them from each
other. However, three major compartments are commonly defined, the early endosomes, the late
endosomes and the lysosomes.
The membrane and the lumen of the early endosome are similar in design to the cell membrane
and the extracellular medium, respectively. In the late endosomes there is already a considerable
variety of proteases present which are only found in the endocytotic pathway and the interior is
mildly acidic (around pH 6). Late endosomes mature into lysosomes which are highly acidic, with
a pH of around 4 to 5 (Poole and Ohkuma, 1981) and have extensive proteolytic activity
(Villadangos, 2001). Lysosomes contain around 40 different types of acid hydrolases which
depend on the acidic environment of the lysosome for activation (Chapman, 1998). Hydrolases
found within the lysosome include proteases, lipases, glycosidases, phosphatases and
sulphatases; they are engaged in the antigen processing.
Evidence has accumulated that antigens internalised by receptor mediated endocytosis enter
either the MHC class I or the MHC class II loading pathway (chapters 1.10.1. and 1.10.2). The
separation of exogenous soluble antigens for MHC I from MHC II restricted presentation appears
to depent on the receptor mediating the uptake. Lakadamyali and colleagues have shown that
antigens taken up by different receptors are delivered to two different endosomal subsets. One
group of endosomes displayed a high mobility along microtubules and matured rapidly towards
late endosomes, while the other subset was static and matured much slower (Lakadamyali et al.,
2006). The content of the fast maturing endosomes is rapidly degraded in the course of
maturation. Ovalbumin (OVA) taken up by the mannose receptor (MR) by mouse DCs and
macrophages was delivered to stable endosomes from where it is released for degradation in the
cytosol to be processed only for MHC I presentation. In contrast, OVA which was pinocytosed or
taken up scavenger receptors (SR) was targeted to the lysosomes (possibly via the fast maturing
endosomes) and was exclusively presented on MHC class II (Burgdorf et al., 2007). Ligands of
DC-SIGN, dectin-1 and DEC-205 are also targeted to the lysosomes (Engering et al., 2002;
Carter et al., 2006; Dudziak et al., 2007)

Introduction
16
1.10 Antigen processing by antigen presenting cells In order for antigens to be made available for presentation to T cells, they have to be processed
into short peptides and loaded onto MHC molecules. This is a complex process involving different
steps in which mediators of proteolysis, protein sorting and transport, chaperons and other
components have to work together in a coordinated fashion. Exogenous and endogenous
antigens are presented on MHC I and II which are recognised by CD8+ and CD4+ T cells
respectively.
1.10.1 MHC class I restricted presentation MHC I is a transmembrane heterodimer consisting of an α-chain and a β2-micorgloblin. The α-
chain folds into three domains, α1, α2 and α3. The folding of the α1 and α2 domain creates a long
groove, which is the site of peptide binding. After assembly of the α chain with the β2-
microglobulin, MHC I is targeted to the peptide-loading complex in the endoplasmatic reticulum
(ER). The peptide-loading complex consists of many components, including the chaperon
calreticulin and TAP (transporter associated with antigen processing).
Endogenous proteins are degraded in the cytoplasm by the proteasome and other enzymes,
generating peptides. The proteasome is the major proteolytic complex and is found in the
cytoplasm and the nucleus of the cells. (Kloetzel, 2004; Rock et al., 2004; Shastri et al., 2002).
The antigen peptides are then transported into the lumen of the ER by TAP. The final trimming of
the peptides takes place in the ER. There, the peptide loading complex conducts the assembly of
MHC I with the peptides and the peptide-MHC I complexes are then transported to the cell
surface (Elliot and Williams, 2005).
In addition to endogenous antigens, exogenous antigens are also presented on MHC I by a
process termed cross presentation. Cross presentation was found to occur in DCs (Dudziak et al.,
2007; Pooley et al, 2001), certain macrophages (Burgdorf et al., 2007), B cells (Ke and Kapp,
1996) and, under special circumstances, liver endothelial cells (Limmer et al., 2000). Cross
presentation allows APCs to present antigens of viruses which do not infect APCs and antigens of
tumours which do not originate from APCs on MHC I. TAP dependent and independent
mechanisms have been proposed for the loading of exogenous protein derived peptides to MHC I.
In the case of OVA which is taken up via the MR, it was found that after processing of the antigen
in the cytosol, the peptides reenter the early endosome in a TAP dependent manner without
diversion to the ER, subsequently this would require a MHC class I loading machinery in the early
endosomes (Burgdorf et al., 2008).
1.10.2 MHC class II restricted presentation MHC II is constitutively expressed on professional APCs such as DCs, macrophages and B cells.
Cortical and medullary thymic epithelial cells also express the molecules. MHC II consists of two
glycoprotein chains, α and β. Both chains have two domains, α1, α2 and β1, β2 respectively. The

Introduction
17
α1 and β2 domains form the peptide binding cleft. The β-chain is polymorphic and is responsible
for the peptide binding specificity of each MHC class II molecule (Bell at al., 1985; Engelhard,
1994).
The αβ heterodimers of MHC II are assembled in the endoplasmatic reticulum (ER) together with
the invariant chain ( Ii ) which chaperons the folding of MHC II (Sant and Miller, 1994; Cresswell,
1996). Ii has a targeting motive in the cytoplasmic tail which targets the MHC II-Ii complex to the
endocytotic pathway. The compartment where antigen peptides are loaded to MHC II s is termed
MHC class II-containing compartment (MIIC).
There has been considerable debate in exactly defining MIIC. Loading of antigen peptide to
MHC II has been reported for every location of the endocytotic route. The majority of MHC II-Ii
complex is delivered to the transition between early and late endosomes (Geuze 1998; Wattes,
2001) and then enters the late endosomes. There, the MHCII-Ii complex is processed by cysteine
proteases. After this processing, only a small peptide remains on the peptide binding groove of
MHC II, the class-II associated variant chain peptide (CLIP), which prevents premature binding of
antigen peptides. Substitution of CLIP with antigen peptides is catalysed by an accessory
molecule, HLA-DM in human and H2-DM in mouse. In B cells, peptide loading is further catalysed
by HLA-DO and H2-O in human and mouse respectively (Brocke et al., 2002).
The second location for Ii processing and peptide loading is the early endosome (Villadangos,
2001). Some of the MHC II-Ii complex has been observed in this compartment (Brachet et al.,
1999; Pond and Watts, 1997). In the early endosomes, the removal of Ii from MHC II is
independent of cysteine proteases and H2-DM, how it is accomplished instead is still unknown.
Proteolytic activity in the early endosome is not high. It has been suggested that in the early
endosomes MHC II binds to peptides which do not survive the harsher conditions of the later
endosomal compartments and are only preserved as part of longer polypeptides. The complex of
MHC II and antigen polypeptide could then move to the late endosomes/lysosomes. In these,
unprotected regions of the polypeptide on MHC II are clipped off by proteases (Villadangos,
2001). Finally, the antigen peptide - MHC II complex is transferred to the cell surface.
1.11 Maturation of DCs Before antigen capture or activation by mediators secreted by other cells, DCs in most tissues are
immature and unable to stimulate T cells. For an efficient activation of T cells, MHC I or II and co-
stimulatory molecules play a pivotal role. Immature DCs express relatively low levels of MHC I
and II or co-stimulatory molecules (e.g. CD40 or CD86) on the cell surface. MHC II is synthesised
in fairly large amounts but is not transported to the cell surface, instead it is retained in the
endocytotic pathway (Pierre et al. 1997).
Maturation transforms DCs from antigen capturing cells into antigen presenting cells. Fully mature
cells then express nearly all of their MHC II on the cell surface (Pierre et al. 1997). In parallel, the

Introduction
18
cell surface expression of co-stimulatory molecules (e.g. CD40, CD80 or CD86), MHC I and T cell
adhesion molecules (e.g. CD48 and DC-SIGN) is upregulated. The morphology of the DCs also
changes. The cells lose their adhesive structure, reorganise the cytoskeleton and acquire high
cellular motility (Trombetta and Mellman 2005). Membrane folds develop to form long dendrites,
increasing the cell surface, thereby increasing the opportunities for T cell interaction. The
expression of receptors for antigen capture is significantly reduced. Instead, chemokine receptors
which facilitate the migration of the DCs to lymphoid organs are upregulated.
1.12 T cells Antigen stimulation is passed on to tissues by T cells which initiate tissue cells to increase
immune responses. Furthermore, T cells are required for the production of antibodies by B cells
(chapter 1.13). The nature of the response depends on the property of the involved T cells
(Schmidt-Weber et al., 2007). T cells can be divided into two large groups according to the co-
receptors expressed on the cell surface. One group expresses CD4 while the other carries CD8
which bind to MHC II and MHC I respectively. In order to be able to respond to the enormous
diversity of antigenic epitopes, an excessively large range of T cell receptors (TCR) must be
available for T cells. The antigen recognition domains are encoded by genes which are
assembled by somatic rearrangement (Murphy et al., 2008).
1.12.1 Activation of naïve T cells Naïve T cells are functionally immature. In the cortical region of the lymph nodes, they transiently
bind to every APC they encounter. This transient binding is important for the T cells to sample
many MHC molecules on the APCs for the presence of the specific antigen peptide their T cell
receptor (TCR) recognises. The encounter of a T cell with a peptide-MHC complex which is
recognised by the TCR results in the stabilisation of the association between APC and T cell
(Bromley et al., 2001). This can last for several days, during which the naïve T cells proliferate
and the daughter cells also adhere to the APC and differentiate into effector cells (Murphy et al.,
2008).
For the activation of naïve T cells two signals are required. The first signal is the interaction of the
TCR with a specific peptide-MHC complex presented on the cell surface of APCs. The second
signal required for efficient T cell activation is delivered by co-stimulatory molecules. Both the
antigen-specific signal and the co-stimulatory signal have to be delivered by the same cells.
Consequentially, only activated APCs, predominantly DCs, can induce T cell responses. This is
crucial to prevent responses to self antigens.
The most important co-stimulatory signals for efficient clonal expansion of naïve T cells are
provided by members of the B7 family, B7-1 (CD80) and B7-2 (CD86) which interact with CD28
on T cells. Naïve T cells divide and undergo apoptosis on an irregular basis. The binding to the

Introduction
19
MHC-peptide complex and CD28 co-stimulation directly trigger the progression through the G1
phase of the cell cycle (Appleman et al. 2000). CD28 co-stimulation also induces the synthesis of
IL-2 and the expression of the α-chain (CD25) of the IL-2 receptor (IL-2R). Naïve T cells express
an IL-2R made up of the β and γ chains only which has a low binding affinity for IL-2. The α-chain
associates with the βγ heterodimer to give rise to a high affinity IL-2R. Binding of IL-2 triggers the
entry into the S-phase of the cell cycle (Appleman et al. 2000). The T cells can then proliferate
two to three times per day for several days resulting in clonal expansion. IL-2 is an essential
survival factor for T cells and also promotes the differentiation into effector cells. Since activated T
cells synthesise IL-2, they promote their own growth in an autocrine fashion.
1.12.2 CD4+ T cells CD4+ T cells are key players of the adaptive immunity. Four main subsets of CD4+ T cells are
generally discerned. Namely these are the effector cells Th1, Th2 and Th17, which are opposed
by the fourth subset, the regulatory T cells (Tregs), whose function is to suppress effector T cell
activation in order to prevent excessive T cell responses and autoimmune diseases. T cell
differentiation is mainly determined by the cytokine milieu during the activation of naïve T cells.
In murine models based on artificial immunisation or infection, T cell differentiation is clear cut. In
humans, polarisation of CD4+ T cell responses is usually less clear (Romagnani, 1994). An
imbalance of the CD4+ subsets in humans is associated with the development of allergies and
autoimmune diseases (Farrar et al., 2002; Ho and Glimcher 2002; Neurath et al., 2002)
1.12.2.1 Th1 cells
Th1 cells are characterised by the production of IFN-γ and TNF-β (Mosmann et al 1986, Del Prete
et al., 1988). The development of Th1 is driven by IFN-γ, IL-12 and IL-27. IFN-γ and IL-27 activate
the transcription factor STAT1 (Signal Transducers and Activators of Transcription protein 1).
STAT1 activates T-bet, which is considered to be the key transcription factor in Th1 development,
and initiates IFN-γ production (Wilson et al, 2009). T-bet, in association with various co-factors,
also antagonises GATA-3, which is the transcription factor controlling Th2 differentiation, thereby
silencing the expression of the Th2 associated cytokines IL-4, IL-5 and IL-13 (Dijuretic et al.,
2007).
Th1 cells play a critical role in cell mediated immunity. They activate macrophages and control
intracellular pathogens such as viruses and certain bacteria, e.g. Listeria and Mycobacterium
tuberculosis (Holland et al., 2007). Th1 cells also stimulate antibody production against
extracellular pathogens via co-stimulation of B cells. In human, the antibody subclasses
associated with Th1 responses are IgG1 and IgG3, whereas in mouse they are IgG2a and IgG2b
(Murphy et al., 2008). The excessive production of Th1 cytokines has been linked with delayed
hypersensitivity reactions (Type IV allergies, Abbas et al., 1996).

Introduction
20
For Type I allergy it has been demonstrated that Th1 cytokines suppress Th2 responses (Iwamoto
et al. 1993; Dow et al. 1999). IFN-γ inhibits Th2 cytokine production and proliferation in vitro
(Gajewski et al., 1989; Fernandez-Botran et al., 1988). In vivo, IFN-γ is capable of reducing the
numbers of Th2 cells in the area of allergic inflammation as well as inhibiting the secretion of Th2
cytokines (Li et al., 1996; Iwamoto et al., 1993; Nakajima et al., 1993). Furthermore, IFN-γ can
block Th2 induced inflammatory pathways downstream of cytokine production. This effect may
occur by the action of the cytokine on inflammatory cells such as eosinophils (Cohn et al. 1999).
Subjects with intact oral tolerance to food proteins have reportedly higher levels of IFN-γ and
TNF-α than food allergic subjects (Turcanu et al., 2003; Andre et al., 1996). Furthermore,
resolution of allergy appears to be related with normalisation of IFN-γ levels (Smart et al. 2002),
showing the importance of Th1 cell contribution for a balanced immune response to
environmental antigens.
1.12.2.2 Th2 cells Th2 cells are characterised by the production of IL-4, IL-5, IL-6, IL-9, and IL-13. Th2 differentiation
is induced by IL-4. The cytokine activates the transcription factor STAT6, which activates GATA-3.
GATA-3 contributes to the expression of IL-4, IL-5 and IL-13 and also in silencing of IFN-
γ expression.
In allergic patients, a high frequency of allergen specific Th2 cells in the peripheral blood and
inflammatory tissues has been observed. The Th2 response to one or more environmental
allergen triggers the recruitment of other cell types, the secretion of a large number of soluble
factors and the expression of adhesion molecules. Th2 cytokines are required for the
differentiation, maturation, activation and tissue homing of inflammatory cells and the Th2 cells
themselves. For instance, IL-4 and IL-13 are required for the production of IgE antibodies by B
cells (de Vries et al., 1993, chapter 1.13). IL-5 induces the release of mature eosinophils as well
as immature eosinophils from the bone marrow and is important for the terminal maturation and
activation of these cells (Palframan et al.,1998). IL-4 induces expression of chemokines (i.e.
eotaxin) in epithelial cells and fibroblasts, which induce the migration of eosinophils and Th2 cells
into inflammatory sites. IL-4 and IL-9 promote the development and maturation of mast cells.
Together, activation of Th2 cells triggers an inflammatory cascade of great complexity which
promotes allergic inflammation and the manifestation of clinical symptoms.
1.12.2.3 Th17 cells Th17 cells are a more recently described subset of CD4+ T cells and are characterised by the
production of IL-17, IL-22 and IL-23. Th17 differentiation is induced by IL-6 and TGF-β. Th17
cells contribute to the host defence by acting on various immune and non-immune cells in
protecting against extracellular bacteria. However, they also play a critical role in autoimmune
diseases such as multiple sclerosis and rheumatoid arthritis. Experimental data suggests that IL-
17 coordinates tissue inflammation by inducing the secretion of proinflammatory cytokines such

Introduction
21
as IL-6, IL-8 and TNF-α. Involvement of Th17 cells in allergic diseases has also been shown. In
atopic contact dermatitis, the frequency of IL-17 producing CD4+ T cells correlated with the
severity of the disease (Koga et al., 2008). In asthmatic tissues, upregulation of IL-17 production
was found. It was suggested that the cytokine is involved in inflammation and airway remodelling
(Matsunaga et al., 2006; Molet et al., 2001; Hashimoto et al., 2007). In some patients suffering
from food allergy, enterocolitis (inflammation of the colon and small intestine) and accumulation of
neutrohphils in the intestinal tissues was observed. IL-17 seems to recruit neutrophils by inducing
IL-8 secretion or mast cell activation in these patients (Oboki et al., 2008), thereby promoting
allergic inflammation.
1.12.2.4 Regulatory T cells Tregs play a critical role in the maintenance of tolerance and suppression of potentially
destructive activities of effector T cells and inflammatory cells. Tregs have been classed into
naturally occurring Tregs which develop in the thymus (nTregs) and Tregs which emerge in the
periphery under various tolerogenic conditions (Sakaguchi et al., 2008), so called inducible Tregs
(iTregs). Most nTregs are differentiated in the presence of transforming growth factor - beta (TGF-
β), and are characterised by a high expression of CD25 and the co-expression of the forkhead
box P3 transcription factor (Foxp3) (Sakaguchi 2005). nTregs produce both TGF-β and IL-10. In
iTregs, there are several subsets such as Tr1 cells producing IL-10 and TGF-β producing Th3
cells (Vagnali et al., 2009; Roncarolo and Gregori, 2008). Both nTregs and iTregs reportedly play
an important role in suppression of allergic diseases (Akdis, 2009).
The inhibitory cytokines IL-10 and TGF-β produced by Tregs are crucial for their suppressive
functions. These cytokines inhibit proliferation and cytokine production of effector T cells. IL-10
also inhibits IgE production of B cells and activation of mast cells. In studies of food allergy,
children outgrowing a food allergy seem to have more Tregs than children with persistent allergy
(Karlsson et al., 2004). It has also been shown that Tr1 cells consistently represent the dominant
T cell subset specific for food allergens in healthy individuals; in contrast, there is a high
frequency of allergen specific IL-4 producing T cells in allergic individuals. A quantitative defect of
Treg could be involved in the pathogenesis of allergic diseases (Grindebacke H et al., 2004).
1.12.3 CD8+ T cells CD8+ T cells predominantly differentiate to cytotoxic T cells and play a central role in pathogen
defence. The cytotoxic T cells kill target cells which display antigen peptides on MHC I. MHC I is
expressed by most nucleated cells. This enables them to present antigens of intracellular
pathogens such as viruses to CD8+ T cells, facilitating the elimination of the infected cells and
thereby hindering the spreading of the pathogen. APCs can also activate CD8+ T cells with
exogenous derived antigens by cross presentation (chapter 1.10.2).

Introduction
22
1.13 B cells The chief function of B cells is the production of antibodies in response to antigens. In mammals,
five isotypes of antibodies have been identified; IgM, IgD, IgG, IgA and IgE. They differ from each
other in the structure of the constant region of their heavy chains. Mature naive B cells express
IgD and IgM on their surface which act as B cell receptors (BCR) and capture and internalise
antigens. The BCR have a vast range of antigen specificities, with each individual B cell producing
receptors of one specificity which is determined by the variable region of the immunoglobulin. The
first antibody isotype secreted upon activation is always IgM, later in the immune response the
same veriable region may be expressed in IgE, IgA or IgG antibodies. This process is known as
isotype switching and depends on the stimuli which the B cells receive.
For the production of IgE antibodies in response to an allergen, two steps are required. The B cell
must first be activated and then a class switch to IgE must be induced. The activation of B cells
can be T cell dependent or independent. Antibody production against protein antigens, including
allergens, requires antigen specific T cell help (Murphy et al., 2008). Naive B cells can bind
antigens (allergens) via their cell surface IgM and IgD. The antigen-Ig complexes are internalised
and processed by the B cells. The antigen derived peptides are then loaded onto MHC II and are
subsequently presented on the B cell surface. TCRs of activated CD4+ T cells recognising the
same antigen as the Ig of the B cells bind to the peptide-MHC II. In addition, the CD40 ligand
expressed on T cells interacts with CD40 on B cells, thereby supplying the co-stimulatory signal
required for B cell activation and class switching (Rivera et al., 2001). CD40 stimulation by
allergen specific T cells upregulates the expression of the co-stimulatory molecules CD80 and
CD86 by B cells, which in turn enhances CD40L expression on T cells and increases the
stimulation of B cells through the induction of IL-4 (Geha et al., 2003). Proliferating B cells form a
so called germinal centre which is present for about three to four weeks after the initial antigen
contact. Germinal centre B cells first differentiate into plasmablasts, these are cells which have
begun to secrete antibodies but are still dividing and can still interact with T cells. Some of the
plasmablasts differentiate further into plasma cells. These no longer express MHC II or CD40.
However, they efficiently produce large amounts of antibodies. Other germinal B cells differentiate
into memory B cells (Murphy et al., 2008).
In class switching to IgE, the Th2 cytokines IL-4 and IL-13 play a pivotal role. Through the
interaction of IL-4 and IL-13 with their receptors on the B cell surface a signal transduction
cascade is triggered which results in the transcription of the gene for the epsilon class of the
constant region (Cε) of the immunoglobulin heavy chain in B cells, resulting in the production of
class E antibodies (de Vries et al., 1993)

Aims
23
2 Aims of this thesis
The Maillard reaction is a chemical reaction between reducing sugars and amino acids which
generates protein derivatives modified with glycation structures, collectively called advanced
glycation end products (AGEs). The products are important for the brown colour and taste of
cooked foods. As the Maillard reaction occurs during storage and thermal processing of foods, a
possible involvement of AGEs in the pathology of food allergy is of great interest. The aim of this
thesis was to study the influence of the Maillard reaction on the T cell immunogenicity (the ability
to induce T cell responses), antigenicity (the ability to induce antibody responses) and the
potential allergenicity (an ability to induce allergic responses) of food allergens.
Maillard reaction products have been shown to influence the maturation and T cell activation
ability of dendritic cells (DCs). However, the impact of AGEs derived from food allergens on DC
function and/or the subsequent activation of allergen specific T cells had not been examined prior
to this study. Therefore, in the first part of the thesis, the T cell immunogenicity of the model
allergen ovalbumin (OVA) which had been modified by the Maillard reaction was to be examined
using in vitro murine cell cultures. For this purpose, OVA was to be glycated (AGE-OVA) by
thermal processing with glucose and the structural changes induced by this process analysed. For
all experiments, native OVA and OVA thermally processed without glucose were to be used as
controls. To examine the T cell immunogenicity of AGE-OVA, CD4+ or CD8+ T cells from
transgenic mice with OVA specific T cell receptors were to be used and co-cultured with bone
marrow derived myeloid DCs (mDCs). Allergen specific T cell activation is preceded by the uptake
of allergens by DCs, a process predominantly mediated by endocytotic receptors. In other studies,
receptors which can bind AGEs have been identified, e.g. the receptor for AGEs (RAGE), galectin-
3 or SR-AI/II (macrophage scavenger receptor class A type I and II). However, the receptor(s)
which mediate(s) the uptake of AGEs by mDCs was/were not known. A further aim was therefore
the identification of the receptor(s) involved in AGE-OVA uptake by mDCs.
In the second part of this thesis, the immunogenic properties of AGE-OVA in vivo were to be
examined. For this, mice were to be exposed to AGE-OVA by different immunisation routes. The
T cell immunogenicity of the glycated allergen was to be assessed by measuring the proliferation
of splenic and lymph node CD4+ T cells of immunised mice in response to in vitro re-stimulation
with the allergen. In addition, the level of allergen specific antibodies in the serum of immunised
mice was to be measured by ELISA in to order elucidate the antigenicity of AGE-OVA.
The prevalence of peanut allergy is increasing. Additionally, peanuts often induce life threatening
anaphylactic reactions. Peanuts generally undergo thermal processing (e.g. roasting or frying)
before consumption and since peanuts contain high amounts of reducing sugars, the Maillard
reaction would occur. Therefore, in the final part of this thesis, the influence of glycation by the
Maillard reaction on the immunogenic properties of the major peanut allergen Ara h 2 was to be
determined in vivo. For this study, recombinant Ara h 2 was used. The recombinant allergen was

Aims
24
to be subjected to glycation by thermal treatment in the presence of carbohydrates and analysed.
Unprocessed rAra h 2 and rAra h 2 thermally processed without carbohydrates were to be used
as controls for all experiments. T cell imunogenicity and antigenicity of AGE-rAra h 2 in vivo, was
to be evaluated in a similar way as for AGE-OVA.

Material and Methods
25
3 Material and Methods
3.1 Material
3.1.1 Commonly used equipment. Special equipment and materials needed for a certain method are listed in the relevant method description. Tab. 3.1 List of commonly used equipment Equipment Model and Company Magnetic stirrer IKAMAG® RCT basic (IKA , Staufen) pH meter SevenEasy (Mettler Toledo, Giessen) Power source PowerPacTM (Biorad, München) Thermo mixer Thermomixer Compact (Eppendorf, Hamburg) Heating block Digital Heatblock (WVR International, Darmstadt) Incubator cabinet Orbital incubator SI50 (Carl Stuart Ltd., Dublin, IRL) Water bath Grant GD100 (Grant Instruments Ltd., Cambridge, UK) Vortex Vortex-Genie 2 (Scientific Industries, New York USA) Weighing scales Explorer Pro, (Ohaus, Pin Brook, NJ, USA)
EK-300i ( AND, Abingdon, UK) Centrifuges Centrifuge 5417C/R (Eppendorf; Hamburg)
Multifuge 1S-R (Heraeus, Langenselbold) Sorvall SLA 3000 (Thermo Scientififc, Bonn)
Speed Vac SPD 111V (Savant, Ramsey, MN, USA) Seesaw shaker DUOMAX 1030 (Heidolph Instruments, Schwalbach) Orbital shaker KS 130 control (IKA, Staufen) Laminar flows Lamin Air HB2448 (Heraeus, Langenselbold)
Labotect SG-400 (Labotect, Göttingen)
Incubator (for cells) Hear cell 150 (Heraeus, Langenselbold) PCR thermocycler PCR System 2700 (Applied Biosystem, Weiterstadt) ELISA reader Spectra Max 340 PC (Molecular Devices, München) CD spectrometer J-810S (JASCO, Groß-Umstadt)

Material and Methods
26
3.1.2 Chemicals If not otherwise specified, all chemicals were obtained from Merck (Darmstadt), Sigma
(Steinheim) or Roth (Karlsruhe).
3.1.3 Buffers General buffers were obtained from the medium kitchen of the Paul-Ehrlich-Institut (PEI). Special
buffers and chemicals are described in the respective methods.
PBS: 1,5 mM KH2PO4
8 mM Na2HPO4
137 mM NaCl
3 mM KCl
pH 7.2
3.1.4 Cell culture media and reagents Tab. 3.2 Media, additives and reagents for culture of primary mouse cells Application Supplier RPMI 1640 All cells Gibco, Fisher Scientific,
Schwerte Glutamine with Penicillin and Streptomycin All cells Media kitchen, PEI Fetal calf serum (FCS), Lot S0115 mDC culture Biochrom Berlin FCS Proliferation
assays Gibco
C8H18N2O4S (HEPES), 1M mDC culture Media kitchen, PEI Recombinant mouse Granulocyte-macrophage colony-stimulating factor (GM-CSF)
mDC culture R&D Systems, Wiesbaden
Sodium pyruvate mDC culture Sigma, Steinheim 10 x lysis buffer Erythrocyte lysis BD Biosciences, Heidelberg

Material and Methods
27
3.1.5 Native and recombinant proteins Tab. 3.3 native and recombinant proteins used in this study Protein Supplier Ovalbumin from chicken egg white, grade V Sigma, Steinheim Recombinant OVA Section 5/4, PEI BSA Santa Cruz, Heidelberg BSA, cell culture tested Sigma Recombinant Ara h 2 Section 5/4, PEI Recombinant cytokines for ELISA Recombinant mouse IL-2 Biolegend, San Diego, CA Recombinant murine IL-4 Peprotech, Hamburg Recombinant mouse IL-10 BD Biosciences, Heidelberg Recombinant mouse IL-12 BD Biosciences Recombinant murine IFN-γ Peprotech
3.1.6 Antibodies and reagents for immune detection Tab. 3.4 Antibodies Antibody Application Company Primary antibodies APC Rat IgG2bκ anti-mouse CD4 Flow cytometry eBioscience, San Diego, CA FITC rat IgG2b anti-mouse CD4 Flow cytometry Miltenyi Biotech, Bergisch
Gladbach APC Rat IgG2bκ anti-mouse CD11b Flow cytometry eBioscience PE Rat IgG2bκ anti-mouse CD11b Flow cytometry eBioscience APC Hamster IgG anti-mouse CD11c Flow cytometry eBioscience PE-Cy5.5 Hamster IgG anti-mouse CD11c
Flow cytometry eBioscience
FITC Hamster IgMκ anti-mouse CD40 Flow cytometry eBioscience FITC Hamster IgG anti-mouse CD80 Flow cytometry eBioscience FITC Rat IgG2aκ anti-mouse CD86 Flow cytometry eBioscience

Material and Methods
28
Rabbit polyclonal IgG anti-EEA1 LSM Calbiochem, Merck, Darmstadt Mouse IgG2a anti-FITC ELISA Chemicon, Millipore,
Schwalbach Rat IgG2aκ anti-mouse Galectin-3 Flow cytometry eBioscience Rat IgG2bκ anti-mouse IL-2 ELISA Biolegend Rat IgG1κ anti-mouse IL-4 ELISA eBioscience Rat IgG2bκ anti-mouse IL-10 ELISA Biolegend Rat IgG2aκ anti-mouse IL12 p35/p70 ELISA eBioscience Rat IgG2aκ anti-mouse LAMP1 LSM eBioscience Rat IgG1κ anti-mouse IFN-γ ELISA eBioscience Rat IgG2aκ isotype control Flow cytometry eBioscience Rat IgG2b isotype control Flow cytometry eBioscience Rat IgG1κ anti-mouse IgE ELISA BD Biosciences, Heidelberg FITC rat IgG2b anti-mouse MHC class II Flow cytometry eBioscience Rat IgG2bκ anti-mouse MHC class II LSM BD Biosciences Rat IgG2a anti-mouse MR (CD206) Flow cytometry AbD Serotec, Düsseldorf Rabbit polyclonal IgG anti-mouse RAGE Flow cytometry Abcam, Cambridge Rat IgG2b anti-mouse SR-A type I (CD204)
Flow cytometry R&D Systems, Wiesbaden
Secondary antibodies Biotin rat IgG2bκ anti-mouse Il-2 ELISA Biolgend Biotin rat IgG1κ anti-mouse IL-4 ELISA eBioscience Biotin rat IgG1κ anti-mouse IFN-γ ELISA eBioscience Biotin rat IgG1κ anti-mouse IgE ELISA BD Biosciences HRP anti-mouse IgG ELISA GE Healthcare, München Cy 3 Goat F(ab’) fragment anti-rabbit IgG
LSM Jackson ImmunoResearch Europe Ltd., Suffolk, Uk
HRP anti-rabbit IgG ELISA Sigma HRP rabbit anti-mouse IgG1 ELISA Zymed, Invitrogen, Karlsruhe HRP rabbit-anti-mouse IgG2a ELISA Zymed

Material and Methods
29
Alexa Fluor 488 goat anti-rat IgG FACS, LSM Molecular Probes, Invitrogen,
Karlsruhe Alexa Fluor 568 goat anti-rat IgG LSM Molecular Probes Alexa Fluor 488 donkey anti-goat IgG LSM Molecular Probes
Reagents for immune detection: Sreptavidin-Horseradisch Peroxidase Conjugate (BD Biosciences)
Tetramethylbenzidine (TMB) substrate reagent set (BD Biosciences)
3.1.7 Mice Tab. 3.5 Mouse strains used in this study Genotype Genetic background Reference BALB/c (wild type) C57BL/6 (wild type) C3H/HeJ (wild type) C.Cg-Tg(DO11.10)10Dlo/J (DO11.10 ) BALB/c Murphy et al., 1990
C57BL/6-Tg(TcraTcrb)1100Mjb/J (OT-1) C57BL/6 Hogquist et al., 1994
C57BL/6-Tg(TcraTcrb)425Cbn/J (OT-2) C57BL/6 Barnden et al., 1998
RAGE-/- C57BL/6 Myint et al., 2006 B6.Cg-Msr1tm1Csk/J (SR-AI/II-/-) C57BL/6 Suzuki et al., 1997
C57BL/6 mice were purchased from Harlan-Winkelmann GmbH (Borchen). BALB/c and C3H/HeJ
mice were purchased from Charles River Laboratories (Sulzfeld). DO11.10, OT-1, OT-2 and SR-
AI/II-/- mice were purchased from Jackson Laboratories (Bar Harbour, ME, USA). RAGE-/- mice
were a kind gift from Dr. T. Shoji (Osaka Medical College, Japan). The genetically modified mice
were bred in the animal facility of the Paul-Ehrlich-Institut.

Material and Methods
30
3.1.8 Oligonucleotides Primers were obtained from Sigma Genosys, Sigma-Aldrich, Steinheim
Tab. 3.6 List of primers used
Name Sequence 5’ → 3’ Amplification of SR-A cDNA from mDCs SR-A (s) AGA ATT TCA GCA TGG CAA CTG SR-A (as) ACG GAC TCT GAC ATG CAG TG Amplification of SR-B1 cDNA from mDCs SR-B1 (s) CTC ATC AAG CAG CAG GTG CTC SR-B1 (as) GAG GAT TCG GGT GTCATG AA Amplification of SR-B1 cDNA from mDCs CD36 (s) GTG CTG ATC CTT TCA GAG TCT C CD36 (as) CTG AGG AAT GGA TCT TTG TAA CC
The sequence of the sense (s) and antisense (as) primers are given in the standard abbreviations for nucleic acids.
3.1.9 Software Tab. 3.7 Used EDV programmes Program Application FACS Diva 6.0 Flow cytometric data assimilation and analysis FlowJo 7.2.4 Data analysis flow cytometry SigmaPlot 11.0 Graphs Microsoft Office Text processing, Tables, Figures Zeiss LSM Image browser 4.2 Analysis of laser scanning microscopy data
3.2 Methods
3.2.1 Molecular biological methods 3.2.1.1 Total RNA isolation Total RNA was isolated from myeloid dendritic cells (mDCs, chapter 3.2.3.4) using Trizol reagent
according to the manufacturer’s instructions. mDCs (5-10x106 cells) were lysed with 1 ml of Trizol
reagent. The lysed sample was incubated at room temperature for 5 min and then 200 µl of
Chloroform was added per 1 ml of Trizol reagent. The sample was shaken vigorously, and
incubated at room temperature for 3 min. Subsequently the sample was centrifuged (10,000 rpm,
15 min, 4°C). After centrifugation, the aqueous phase, containing the RNA, was transferred into a

Material and Methods
31
new tube. To precipitate the RNA, 500 µl of Isopropyl alcohol (per 1 ml of Trizol originally added)
was added and the sample incubated for 10 min at room temperature. The sample was again
centrifuged (10,000 rpm, 10 min, 4°C) and the supernatant removed. To wash the RNA pellet, 1
ml of 75% Ethanol per 1 ml Trizol reagent was added and centrifuged (7,500 rpm, 10 min, 4°C).
The RNA pellet was air dried and dissolved with 50 µl of RNAse free water. To determine the
amount of isolated RNA, the RNA solution was diluted 1:100 and the OD measured at 230, 260
and 280 nm. The absorption at 230 and 280 nm is measured to calculate the contamination with
DNA and protein, respectively. At A260 = 1, the RNA concentration is 40 µg/ml.
Trizol reagent (Invitrogen)
Isopropyl alcohol
75% Ethanol (Roth)
RNAse free water (Invitrogen)
3.2.1.2 Reverse transcriptase (RT) reaction RNA isolated as described in chapter 3.2.1.1 was transcribed to cDNA for the PCR (chapter
3.2.1.3) using the enzyme reverse transcriptase. The reverse transcriptase catalyses the
transcription of RNA to DNA. First, RNAse free water, dNTPs, Oligonucleotides and the isolated
RNA (chapter 3.2.1.1) was gently mixed and incubated at 65°C for 5 min to break any double
stranded RNA sequences. The mixture was immediately placed on ice, where the reverse
transcriptase (RT) buffer and the reverse transcriptase were added. The reaction mixture was
then incubated at 42°C for 60 min, after which the reaction is stopped by heating to 90°C for 10
min.
Reaction mixture:
RNase free DW 11.0 µl
10 mM dNTP mixture (Invitrogen) 1.0 µl
Oligo(dT)12-18, 0.5 µg/ml (Invitrogen) 1.0 µl
RNA soln. 500 µg/ml 4.0 µl
RT Buffer 2.0 µl
Reverse Transcriptase (New England Biolabs) 1.0 µl
3.2.1.3 Polymerase chain reaction (PCR) The polymerase chain reaction (PCR) is an in vitro application to amplify defined nucleic acid
sequences of DNA, using DNA polymerase, which catalyses the polymerisation of
deoxyribonucleotides into a DNA strand. Taq polymerase was used, which has the advantage of
being heat stable. The PCR programme consists of denaturation, annealing and elongation
phases. First, the reaction mixture is heated to 94°C to denature double stranded DNA (denature

Material and Methods
32
phase). Lowering the temperature allows the hybridisation of the oligonucleotide primers to the
single stranded DNA templates (annealing phase). Subsequently the temperature is raised to
72°C, which is the optimal working temperature for the Taq DNA Polymerase. The enzyme
elongates the primers until the DNA is again double stranded (elongation phase). 35 of these
cycles were run, after which a final 8 min elongation phase was added. An aliquot of the reaction
mixture was then applied to an agarose gel to analyse the PCR products (chapter 3.2.1.4.)
For one reaction with a total volume of 20 µl the reaction composition below was used. The PCR
thermal cycler programmes used in this study are shown in Tab 3.8.
PCR Reaction:
10 x PCR Buffer (Invitrogen) 2.0 µl
50 mM MgCl2 (Invitrogen) 0.6 µl
10 mM dNTP Mix (Invitrogen) 0.4 µl
5-Primer (10 µM) 0.4 µl
3-Primer (10µM) 0.4 µl
Taq DNA Polymerase (Invitrogen) 0.1 µl
cDNA from First Strand Reaction 4.0 µl
DW 12.1 µl
Tab 3.8 PCR-cycler programme conditions for the qualitative analysis of mDC receptor expression Primer Cycler programmes
SR-B1 2 min 94°C + 35 cycles (1 min 95°C , 1 min 60°C, 1 min 72°C) + 8 min 72°C
CD36, SR-AI/II 2 min 94°C + 35 cycles (1 min 94°C , 1 min 55°C, 2 min 72°C) + 8 min 72°C
3.2.1.4 Agarose gel electrophoresis A molecule which posses a net charge will move in an electric field. This phenomenon,
electrophoresis, is a powerful tool for separating DNA and other macromolecules such as proteins
(SDS-PAGE, chapter 3.2.2.2.). The phosphate residues of DNA are negatively charged.
Therefore, DNA molecules move towards the positive anode when in an electric field. Compared
to larger DNA fragments, smaller ones can move through the gel matrix quicker, this physical
property is exploited for the separation.
In this study agarose gel electrophoresis was employed to detect PCR products (chapter 3.2.1.3).
Gels with a concentration of 1.5 % were used. The agarose was heated in 1x TAE buffer until fully
dissolved, then this was used to cast the gel. The sample from the PCR which was to be analysed
was prepared by adding 1 µl of loading buffer to 5 µl of the sample. The gel was run at 110 V in a
Mini Sub-Cell CT chamber (Biorad, München). After 1 h the gel was removed from the running
chamber and stained with ethidium bromide for 15 min. Ethidium bromide is an intercalating agent

Material and Methods
33
which is fluorescent under UV light (300 nm), it inserts itself between DNA base pairs making the
bands in the dyed agarose gel appear as glowing bands. Excess ethidium bromide was then
washed off with water and the gel photographed under UV light.
Agarose (PeqLab, Erlangen)
TAE buffer (20x): 800 mM Tris
2.28% (v/v) CH3COOH
25 mM EDTA
pH 8.5
Loading buffer (6x): 0,06 % Bromophenol Blue
30 % Glycerol
0.2 mM EDTA
Base pair standard: 100 bp DNA ladder (New England Biolabs, Frankfurt)) Ethidum bromide solution: 10 % Ethidium bromide (w/v) (Fluka, Sigma-Aldrich Steinheim)
3.2.2 Biochemical methods 3.2.2.1 Preparation of proteins modified with AGEs
3.2.2.1.1 Preparation of AGE-OVA and AGE-BSA Glycated Ovalbumin (AGE-OVA) and glycated bovine serum albumin (AGE-BSA) were produced
following a protocol by Gasic-Milenkovic (Gasic-Milenkovic et. al. 2003). 1 mM of OVA or BSA
(both from Sigma) was incubated with 1 M Glucose (Sigma) in 100 mM sodium phosphate buffer,
pH 7.4 for 6 weeks at 50°C. Excess glucose was removed by extensive dialysis with PBS. OVA or
BSA incubated under the same conditions, but without glucose (thermally processed OVA/BSA),
and native OVA/BSA were used as controls.
100 mM Sodium phosphate buffer, pH 7,4
Stock solution A: 200 mM monobasic sodium phosphate, monohydrate
27.6g NaH2PO4 · H2O / L
Stock solution B: 200 mM dibasic sodium phosphate
28.4 g Na2HPO4 / L
To receive a 100 mM phosphate buffer pH 7,4: mix 19 ml of solution A with 81 ml of solution B
and dilute to 200 ml.

Material and Methods
34
3.2.2.1.2 Preparation of AGE-rAra h 2
For the preparation of glycated recombinant Ara h 2 (AGE-rAra h 2) 500 µg/ml of the protein was
incubated with 0.1 M of a fructose, galatcose, glucose, lactose, mannose or maltose in PBS.
Incubation was for 2 hours at 120°C. Excess carbohydrates were removed by extensive dialysis
with PBS. As controls for all experiments, unprocessed recombinant rAra h 2 or rAra h 2 heated
for 2 h at 120°C without carbohydrates were used.
3.2.2.2 Measurement of the protein concentration using bicinchoninic acid (BCA) Protein concentrations in sample solutions were measured using a Bicinchoninic acid (BCA)
assay kit (Pierce, Bonn) according to the manufacturer’s protocol. The principle of the BCA assay
is based on the Biuret reaction. Proteins form complexes with Cu2+ when in an alkaline milieu.
The Cu2+ ions of these complexes are reduced to Cu1+ ions by cysteine, tyrosine and tryptophan
residues in the proteins. In the second step, BCA reacts with the Cu1+ ion. By chelation of two
molecules of BCA with one Cu1+ ion, a purple reaction product is formed. The BCA/copper
complex is water soluble and shows a linear absorbance at 562 nm with increasing protein
concentrations. The absorption at this wavelength was photometrically determined using the
ELISA reader (Tab. 3.1).
BSA (protein standard): 2 mg/ml bovine serum albumin (Pierce, Bonn)
Micro titre plate: 96 flat bottom well plate (Nunc, Langenselbold)
3.2.2.3 SDS-polyacrylamide gel electrophoresis (SDS-PAGE) Sodium dodecylsulfate polyacrylamide gel electrophoresis (SDS-PAGE) (modified after Laemmli,
1970) was used as a method to further analyse proteins after thermal treatment with or without
carbohydrates. SDS-PAGE allows the separation of proteins according to their apparent
molecular weight. The sample is heated to 95°C with SDS to destroy the secondary and tertiary
structures. The negative charge obtained by the protein upon SDS binding is usually much
greater than the charge of the native protein, thus the native charge is rendered insignificant.
Through the application of voltage, the negatively charged proteins migrate through the gel, the
speed depending exclusively on their size after denaturation and treatment with SDS.
In this study, the electrophoresis was performed using 12.5 % acrylamide gel at 100 V in a Mini
Protean Cell (Biorad, München). The proteins in the gel were then stained with Coomasie Brilliant
Blue (chapter 3.2.2.4).
Running buffer 25 mM Tris
250 mM Glycin
0.1 % (w/v) SDS

Material and Methods
35
2 xLoading buffer: 25 mM Tris
5 ml Beta-mercaptoethanol
1 % SDS (w/v)
10 % Glycerol (w/v)
0.001 % Bromphenol blue (w/v)
Stacking and separation gel are composed of the following solutions: Acrylamid: 30% Acrylamid, 0,8% Bisacrylamid (Roth, Karlsruhe)
Solution A : 1.5 M Tris
0.4 % SDS (w/v)
240 mM HCl
pH 8.8
Solution B: 1.5 M Tris
0.4 % SDS (w/v)
500 mM HCl
pH 6.8
APS: 10% Ammoniumpersulfat (Sigma, Steinheim)
TEMED: N,N,N’,N’-Tetramethylethylendiamin (Sigma, Steinheim)
12,5% Separation gel: 7.5 % Acrylamid
4.5 ml solution A
80 µl APS
15 µl TEMED
6 ml deionised water
4,5 % stacking gel: 0.9 ml Acrylamid
1.5 ml solution B
20 µl APS
15 µl TEMED
3.5 ml deionised water

Material and Methods
36
3.2.2.4 Coomasie Brilliant blue protein stain Coomasie brilliant blue (CBB) is a method to stain protein bands in a polyacrylamid gel. CBB
R250 is a dye which unspecificaly binds to proteins and can detect 0.5 µg proteins /cm2 in the gel
matrix. After electrophoresis (chapter 3.2.2.3) the gel was incubated in CBB staining solution for
30 min. Subsequently the gel was incubated in unstaining solution over night to make the blue
protein bands visible as unbound dye diffuses from the gel into solution.
Staining solution: 1% Coomasie brilliant blue R250 ( w/v) (Fluka. Sigma-Aldrich)
25 % Methanol (v/v)
7.5 % Acetic acid (v/v)
Unstaining solution: 25 % Methanol (v/v)
7.5 % Acetic acid (v/v)
3.2.2.5 Structural analysis by circular dichroism spectroscopy The secondary structure of a protein can be analysed by circular dichroism (CD)-spectroscopy.
The sample is irradiated with left and right circular polarised light. The difference of the absorption
between the two polarisation directions is measured, giving the CD spectrum of a sample. Using
this, the fractions of, for example, alpha helix conformations, beta sheet conformations or random
coils of a molecule can be estimated.
For the measurement the salt concentration was not allowed to be over 10 mM. Therefore, the
proteins were transferred into a 10 mM KH2PO4 buffer by dialysis using a dialysis tube (Float-A-
Lyzer, 1 ml volume, 3500-5000 MWCO, Spectra Por, Roth). For the analysis, a spectrum between
185 and 255 nm was measured at 50 nm/min. The resolution of the data points was 0.2 nm. The
sample was measured ten times and averaged. Additionally, the spectrum of the protein free
buffer was subtracted. The mean molar ellipticity per amino acid residue was calculated by using
the following formula:
Where:
[Θ]MRW is the average residual ellipticity
θ[mdeg] is the measured ellipticity in mdeg
c is the protein concentration
d is the path length of the cuvette
N is the number of the amino acids
Cuvette: quartz cuvettes, 1mm path length (Hellma, Mühlheim)
[Θ]MRW100 x θ[mdeg] c x d x N

Material and Methods
37
Potassium-Phosphate buffer: 10 mM KH2PO4, pH 7,4
Stock solution A: 100 mM Potassium phosphate monobasic, PH 4,5
13.6 g KH2PO4 / L
Stock solution B: 100 mM Potassium phosphate dibasic, pH9
28.4 g K2HPO4 / L
To receive a 100 mM phosphate buffer pH 7.4: mix 19.7 ml of solution A with 80.3 ml of solution B
and dilute to 1000 ml.
3.2.2.6 Labelling of proteins with Fluorescein isothiocyanate Labelling proteins with a florescent dye makes it possible to visualise the protein uptake by cells in
flow cytometry (chapter 3.4.2.1) or laser scanning microscopy (chapter 3.2.4.3). In this study,
native OVA, thermally processed OVA, AGE-OVA, native BSA and AGE-BSA were labelled with
Fluorescein isothiocyanate (FITC).
For the FITC labelling of the proteins, the FluoroTag FITC conjugation Kit (Sigma) was used.
FITC conjugation occurs through the free amino groups of proteins, primarily of lysine residues,
forming a stable thiourea bond. To accurately analyse the uptake of OVA or BSA samples by
mDCs (chapter 3.2.3.6), it was crucial that each sample was labelled with a comparable
FITC/protein (F/P) molar ratio.
To determine the amount of dye for the optimal and comparable labelling of all three OVAs or
BSA, the FITC conjugation was first performed on a small scale using different concentrations of
FITC. The proteins were diluted to 5 mg/ml in 0.1M carbonate-bicarbonate buffer, pH 9.0 provided
in the kit. One vial of FITC was reconstituted and diluted as shown in Table 3.8. 50 µl of the FITC
solution was added drop wise to 200 µl (1 mg) of protein while gently stirring. The reaction vials
were covered with aluminium foil to protect FITC from light during the 2 h of incubation at RT.
The labelled proteins were isolated from unreacted dye using a Sephadex G-25 M column A
(maximum sample volume 300 µl) provided in the kit. The column was equilibrated with 12 ml
PBS. The reaction mixture was applied to the top of the gel bed. The column was eluted with 2.5
ml of PBS, collecting ten 250 µl fractions. Two yellow bands were clearly visible during elution.
The lower band consists of the labelled protein, to upper band is the unbound dye. Of each
fraction the absorbance at 280 nm (A280, absorbance maximum of proteins) was measured.
Fractions with an A280 greater than 0.2 were pooled. The conjugate could be stored at 4°C for a
short time. For long term storage lypholisation of aliquots and storage at -80°C was most suitable.
After having determined the optimal FITC concentration for each protein, the labelling could be
performed on a larger scale. Here, 5 mg of protein was labelled. All other reagents were scaled up
accordingly. To isolate the labelled protein from unconjugated FITC, the larger Sephadex G-25 M
column B (maximum sample volume 1.5 ml) provided in the kit was used.

Material and Methods
38
Table 3.9 preparation of FITC solution of different concentrations Label 0,1 M sodium carbonate-bicarbonate buffer Reconstituted FITC
20:1 2.0 ml FITC vial
10:1 0.5 ml 0.5 ml of 20:1
5:1 0.75 ml 0.25 ml of 20:1
Determination of the FITC/Protein Molar ratio
The F/P ratio is defined as the ratio of moles FITC to the moles of protein in the conjugate. To
determine this ratio, the absorbance of the conjugate at 280 nm and 495 nm (absorbance
maximum of FITC) has to be determined.
The conjugates were diluted 1:5 or 1:10 with the same PBS as was used for the elution from the
column (this was also used to measure the blank value). The absorbance at 280 and 495 nm was
measured using a quartz cuvette with 1 cm path length. From the absorbance readings (A280 and
A495) of the conjugate sample, the F/P of the FITC-OVA/BSA conjugate was calculated according
to the following equation.
Molar F/P =
MW A495/195 A495 x C
389 A280 – [(0,35 x A495)]/E2800,1% A280 – (0,35 x A495)
Where: MW x E2800,1%
389 x 195
=
C =
x
MW is the molecular weight of the protein
389 is the molecular weight of FITC
195 is the absorption E2800,1% of bound FITC at 490 nm at pH 13
(0,35 x A495) is the correction factor due to the absorbance of FITC at 280 nm
E2800,1% is the absorption at 280 nm of protein at 1.0 mg/ml
3.2.3 Cell culture Methods
3.2.3.1 Working environment for cell cultures All work with cell cultures was performed under a sterile laminar air flow cabinet. The surface of all
used equipment was disinfected with Terralin Liquid (Schülke und Mayr, Norderstedt). Only sterile
disposable or autoclaved plastics and sterile media and buffers were used.

Material and Methods
39
3.2.3.2 Culture conditions All cells were cultured in CO2 incubators at 37°C with 5% CO2 and 95% relative humidity.
3.2.3.3 Counting of cells The cell number of a cell suspension was determined using a Neubauer counting chamber (LO
Laboroptik, Friedrichsdorf). To count only viable cells, trypan blue, a vital stain, is used to exclude
dead cells. Trypan blue only stains dead cells as these cells have an altered cell membrane
permeability. The cell suspension is given into the counting chamber and four large squares
consisting of 16 small squares are counted. The average number of cells counted in each large
square is used to calculate the cell number. As each large square has a volume of 0.004 µl, the
cell number is multiplied by 104 in addition to the dilution factor. The calculation of the cell number
is performed using the formula below:
C = N x D x 104
C = cells/ml
N = average of the counted cells
D = dilution factor
104 = chamber factor
3.2.3.4 Preparation of bone marrow derived myeloid dendritic cells (mDCs) For the preparation of bone marrow derived myeloid dendritic cells (mDCs) the bone marrow cells
of femur and tibia from mice were used.
The mouse was disinfected by bathing it in 70% ethanol. The skin and the muscle were removed
from the hind legs and the legs were carefully dislocated from the hip. Any remaining muscle was
removed from the bones and the bones disinfected in 70% ethanol. The end of the bones was cut
open and the cells were flushed out with 5 ml RPMI medium using a 5 ml syringe (Braun,
Melsungen) and a needle (gage 26, Braun). The cell suspension was transferred into a 15 ml
centrifugation tube and centrifuged (1,200 rpm, 4°C, 5 min). After discarding the supernatant, red
blood cells were lysed using red blood cell lysis buffer (BD Biosciences). The cells were then
washed with RPMI containing 10 % FCS three times.
After washing, the cell pellet was resuspended in DC medium and the cell number was
determined (chapter 3.2.3.3). The cells were seeded into cell culture flasks (Greiner,
Frickenhausen) at 1x10⁶ cell/ml and granular macrophages colony stimulatory factor (GM-CSF)
was added according to Tab. 3.10. The bone marrow cells were cultured for eight days. During
the culture period the medium was changed three times. The volume of medium changed for each
flask size is indicated in Tab 3.11. The last medium change took place 24 h before the cells were
used in an assay.

Material and Methods
40
DC medium: RPMI 1640 medium (Gibco)
+ 10% FCS (Biochrom, Lot. S0115)
+ 1 mM Sodium Pyruvate (Sigma)
+ 10 mM HEPES + 100 U/ml penicillin + 100 µg/ml streptomycin + Glutamine + 0.1 mM 2-Mercaptoethanol (3.5 µl 14 M in 500 ml medium) + 100 ng/ml GM-CSF (added freshly to culture)
Table 3.10 Seeding conditions for mDC Flask size Vol. medium Vol. GM-CSF Num. cells T25 5 ml 25 µl 0.5 x10⁷
T75 15 ml 75 µl 1.5x10⁷ Table 3.11 Volume of medium changed of mDC cultures Flask size Vol. medium which is changed Vol. GMSCF T25 4 ml 20 µl T75 10 ml 50 µl
3.2.3.5 Assessment of mDC maturation In order to asses whether AGE-OVA influences the maturation of mDCs, 1x10⁶ mDCs were
seeded into wells of a 24 well plate (Falcon, BD Bioscience) and stimulated with 10 µg/ml LPS or
20 µg/ml of either form of OVA for 18 hours. Following the incubation, the levels of IL-10 and IL-
12p70 in the culture supernatant were measured by ELISA (chapter 3.2.4.5.2.1). Additionally, the
cells were stained with PE conjugated anti-mouse CD11b and APC conjugated anti-mouse
CD11c mAbs to gate the mDC population. The expression of co-stimulatory molecules and MHC
II was assessed by staining with FITC conjugated monoclonal anti-mouse CD40, CD80, CD86 or
MHC II antibody (chapter 3.2.4.2.1). FITC intensity of CD11b+CD11c+ cells was measured by flow
cytometry (chapter 3.2.4.1).
3.2.3.6 Assessment of antigen uptake by mDCs To asses the uptake of different antigens, 5 x 10⁵ mDCs were seeded into wells of a 24 well plate
(Falcon, BD Bioscience). The cells were incubated for 15 min with different concentrations of
FITC conjugated antigen (3.2.2.5.1). As antigens, AGE-OVA or AGE-BSA and the corresponding
controls were used. One experiment was also performed with FITC conjugated human Transferrin
(Trf, Invitrogen). Following the incubation with the FITC conjugates, the cells were stained with
PE-conjugated anti-CD11b and APC conjugated anti-CD11c (3.2.4.2.1) antibodies and analysed
by flow cytometry (3.2.4.1).
To inhibit galectin-3 or mannose receptor (MR) mediated uptake, 150 mM lactose or 3 mg/ml
mannan were used respectively. These were given to the mDCs 30 min prior to the addition of

Material and Methods
41
AGE-OVA or the controls. To elucidate the involvement of the receptor for AGEs (RAGE) or the
scavenger receptor class A type I and II (SR-AI/II), mDCs derived from the mice deficient of the
respective receptor were used.
3.2.3.7 Isolation of CD4+ and CD8+ T cells CD4+ or CD8+ T cells were isolated from the spleen or lymph nodes (LN) of mice using the
magnetic cell sorting systems from Miltenyi Biotec (Bergisch Gladbach). For the isolation of T
cells, the spleen or LN were transferred into a Petri dish (Greiner) with RPMI 1640 medium
containing penicillin (100 U/ml), streptomycin (100 µg/ml) and β-mercaptoethanol (0.05 mM). The
back of a syringe plunger was used to mechanically remove the cells from the tissue. The cells
were passed through a cell strainer (70 µm mesh, BD Biosciences) into a 50 ml centrifugation
tube and centrifuged at 1,200 rpm at 4°C for 10 min. The supernatant was removed and the cells
transferred into a 15 ml centrifugation tube with 10 ml medium and centrifuged again. Lymph node
cells were washed two more times with the medium. In the case of splenocytes, red blood cells
were lysed by treatment with lysis buffer (BD Biosciences) for 1 min at room temperature.
Following lysis, the cells were washed twice with RPMI containing 5% FCS in addition to the
above additives. After washing, 10 ml of MACS buffer (see below) was added to the loosened cell
pellet and the cell number was determined (chapter 3.2.3.3).
Isolation of CD4+ T cells
To isolate CD4+ T cells, 10 µl of anti-CD4 (L3T4) MicroBeads were added to 1x10⁷ total cells in
90 µl of MACS buffer. The cells were incubated with the beads at 4°C for 15 min. Then the cells
were washed by adding 1-2 ml of MACS buffer per 1x10⁷ cells followed by centrifugation at 1,200
rpm for 10 min. The supernatant was taken off and up to 1x10⁸ cells were resuspended in 500 µl
of buffer. To separate the labelled from the unlabelled cells, an appropriate MACS column was
used (Tab. 3.12). The column was placed in a MACS separator (magnet). The column was
equilibrated with MACS buffer and the cell suspension added to the top of the matrix. When inside
the separator, the column matrix provides a magnetic field which is sufficient to retain cells
labelled with a MicroBead conjugated antibody. Unlabelled CD4 negative cells pass through the
column. These were thoroughly washed out of the column with buffer (6x3ml). The retained cells
(CD4+ T cells) are eluted with buffer after the removal of the column from the magnet. The purity
of the CD4+ T cells was analysed by flow cytometry (chapter 3.2.4.1). The purity of the CD4+ T
cells was routinely around 95%.
Isolation of CD8+ T cells
For the isolation of CD8+ T cells, negative selection was used. To label non-CD8+ T cells, 10 µl of
a biotin-antibody cocktail against B cells, natural killer cells, CD4+T cells, dendritic cells,
granulocytes, macrophages and erythroid cells was added to 1x10⁷ total cells in 40 µl MACS
buffer. The cells were incubated with the cocktail at 4°C for 10 min. Following the labelling, 30 µl

Material and Methods
42
of buffer and 20 µl of anti-biotin MicroBeads per 1x10⁷ total cells were added. The cells were
incubated for 15 min at 4°C. The remaining procedure was as for the CD4+ T cell isolation,
however here the unlabelled cells in the eluate were those of interest as these were the CD8+ T
cells.
MACS buffer: PBS, Dulbecco’s, low endotoxin (Biochrom, Berlin)
+ 0.5% BSA (cell culture tested) + 2mM EDTA
MicroBead conjugated monoclonal rat IgG2b anti-mouse CD4 (L374) antibody (Miltenyi Biotec)
CD8+ T cell isolation kit, mouse (Miltenyi Biotec). Contains:
1) Cocktail of biotin-conjugated monoclonal antibodies against mouse CD4 (L3T4) (rat
IgG2b), CD11b (Mac-1) (rat IgG2b), CD45R (B220) (rat IgG2a), DX5 (rat IgM) and Ter-
119 (rat IgG2b).
2) MicroBeads conjugated monoclonal anti-biotin antibody (mouse IgG1) Table 3.12 MACS columns Column Max. number of labelled cells Max. number of total cells MS 1x10⁷ 2x10⁸ LS 1x10⁸ 2x10⁹
3.2.3.8 Assessment of antigen specific CD4+ T cell activation by mDCs
3.2.3.8.1 Activation of antigen specific CD4+ T cells from naïve transgenic mice with OVA specific TCR
Splenic CD4+ T cells were isolated from OT-2 or DO11.10 mice as described (3.2.3.7.). To
evaluate the T cell activation, 4x10⁴ CD4+ T cells were co-cultured in a U-bottom 96 well plate
(Nunc, Langenselbold) with 8x10³ mDCs and stimulated with 0.2, 20, or 200 µg/ml of either form
of OVA or BSA for 24, 48, 72 or 96h. In some experiments, 1.25x10⁵ mDCs were first incubated
with either form of OVA for 3 h in a 96 well flat bottom plate (Nunc) and then washed with PBS
and fixed with 0.008% glutaraldehyde (Roth). Subsequently 2.5 x 10⁵ CD4+ T cells were added
and incubated for 21 h. The concentration of IL-2 in the culture supernatants was measured by
ELISA (chapter 3.2.4.5.2.1).
3.2.3.8.2 Activation of antigen specific CD4+ T cells from mice after immunisation with OVA
Wild type BL6 mice were subcutaneously immunised with either form of OVA as described in
chapter 3.2.5.5.2. The inguinal (groin) and poplitial (knee) lymph nodes (LN) of immunised mice
were removed one week after immunisation. CD4+ T cells were isolated from LNs by magnetic

Material and Methods
43
cell sorting system (chapter 3.2.3.7). In a 96 well flat bottom plate (Nunc), 1.6x10⁵ CD4+ T cells
were co-cultured with 4x10⁴ BL6 mDCs and stimulated with 0.2, 20, or 200 µg/ml of AGE-OVA or
one of the controls. After 24 h, the IL-2 concentration in the co-culture supernatants was
measured (chapter 3.2.4.5.2.1).
3.2.3.9 Activation of antigen specific CD8+ T cells from naïve transgenic mice with OVA-specific TCR mDCs generated from BL6 mice were pre-matured for 2 h with 10 µg/ml LPS and 1.25x10⁵ cells
seeded into a 96 well flat bottom plate. The mDCs were then stimulated with 2, 20, or 200 µg/ml
of native, thermally processed or AGE-OVA for 3 h. The mDCs were washed with PBS and fixed
with 0.008% glutaraldehyde solution. Splenic CD8+ T cells were isolated from OT-1 mice as
described (chapter 3.2.3.7) and 2.5 x 10⁵ T cells added to the mDCs. The cells were incubated for
21 hours. After this time the IL-2 concentration in the supernatants was determined by ELISA
(chapter 3.2.4.5.2.1).
3.2.3.10 Assessment of T cell proliferation using carboxyfluorescein succinimidyl ester For the analysis of cell proliferation, staining of cells with carboxyfluorescein succinimidyl ester
(CFSE) is a sensitive and convenient method. CFSE is non-fluorescent and colourless until the
acetate groups of the agent are cleaved by intracellular esterases. This process yields the highly
fluorescent carboxyfluorescin succimidyl ester. The succimidyl ester groups react with intracellular
amines, forming fluorescent conjugates. The formed protein-dye adducts remain in the labelled
cells throughout meiosis. Daughter cells inherit the label after cell division, however the
fluorescence is diluted with each generation, as shown in Fig 3.1.
In this study, the CellTrace CFSE Cell Proliferation Kit (Invitrogen) was used to trace the
proliferation (cell division) of CD4+ T cells isolated from spleens of naïve OT-2 mice. For the
staining, T cells were resuspended in pre-warmed PBS/0.1% BSA at 1x10⁶ cells/ml. The cells
were incubated with 10 µM CFSE at 37°C for 10 min. The staining was quenched by adding 5
volumes of ice cold culture medium to the cells. The CFSE stained CD4+ T cells were then co-
cultured with mDCs upon stimulation with antigens as described in 3.2.3.8.1. After 24, 48, 72 and
96 h of stimulation, the cells were harvested from the wells with EDTA/Trypsin and stained with
APC-conjugated anti-mouse CD4 antibody (chapter 3.2.4.2.1). The intensity of CFSE in the CD4
T cells were analysed by flow cytometry (chapter 3.2.4.1).

Material and Methods
44
Division cycle
0 1 2 3
1
23
0
A B
Fig 3.1 Diagrams of dye dilution during proliferation of CFSE stained cells. A Scheme of the CFSE dilution after each cell division. B Example of flow cytometry histogram showing five generations
of CD4+ T cells, including the parent generation (0).
3.2.3.11 Assessment of T cell proliferation using tritium [3H] labelled thymidine Another method for the measurement of cell proliferation is radioactive labelling. This method
utilises the principle that cells incorporate radioactive labelled nucleotides into newly synthesised
DNA. The level of radioactive labelled nucleotide incorporated by the cells is measured by a
scintillation counter. A frequently used nucleotide is thymidine labelled with tritium [3H].
In this study the proliferation of CD4+ T cells isolated from the spleen (chapter 3.2.3.7) of
intraperitoneally immunised mice (chapter 3.2.5.5.1) was measured. As antigen presenting cells,
(APCs) splenocytes of naïve mice belonging to the same strain as the mice from which the CD4+
T cells were isolated from were used. To suppress proliferation while retaining the antigen
presenting ability of splenocytes, the cells were irradiated or treated with mitomycin C (MMC,
Sigma). For irradiation, splenocytes received γ-rays from Caesium 137 (1,500 R). MMC is an
antibiotic from Streptomyces caespitosus. It inhibits DNA synthesis by forming crosslinks between
complementary strands of DNA. For the MMC treatment, 1x10⁸ cells were resuspended in 900 µl
medium containing 10% FCS to which 100 µl 500 µM MMC was added and then incubated at
37°C for exactly 30 min. The cells where then washed 3 times with medium.
1x10⁵ CD4+ T cells were co-cultured with 4x10⁵ irradiated or MMC treated splenocytes in 96 well
flat bottom plates (Nunc). The cells were stimulated with antigens or Con A (a mitogen which
induces unspecific polyclonal activation of T cells). After 72 hours 0.1 µCi of [methyl-3H]Thymidine
(GE Healthcare) was added to each well. After further 20 h, the cells were harvested.
To harvest the cells, a harvester (Inotech) with vacuum pump was used to trap the cellular DNA
on a glass fibre membrane (Perkin Elmer, Rodgau). Medium and unincorporated thymidin was
removed by extensive washing with water followed by a wash with 70% ethanol. Once the
membranes were dry, a scintillation matrix (Perkin Elmer) was melted on. The level of tritium was
then determined using a gamma counter (1450 Microbeta, Perkin Elmer).
To compare the CD4+ T cell proliferation of different samples, the stimulation index was
calculated. This index takes into the account the proliferation (as counts per minute) in co-cultures

Material and Methods
45
which were treated with medium only. The Stimulation index is calculated by using the following
formula:
Stimluation index = (cpm Ag – cpm NC)/cpm NC
Where:
cpm: counts per minute
cpm Ag is the cpm measured in a well where the cells where stimulated with antigen
cpm NC is the cpm measured in a well where the cells were treated with medium only
3.2.4 Immunological methods 3.2.4.1 Flow cytometry Flow cytometry is a versatile method which simultaneously measures several characteristics of
particles, usually cells, as they flow in a stream through a beam of light. The properties, which can
be measured by flow cytometry, are size, granularity and relative fluorescence intensity of the
cells. The properties are defined using an optical-to-electronic coupling system which records how
a cell scatters laser light and emits fluorescence.
For the analyses, the cells are taken up by a capillary and singly pass a laser beam. Once the
cells pass through the laser intercept, they scatter laser light and additionally, if fluorescent
molecules are present on the cells, they fluorescence. The forward scatter of the light (FSC) is a
measurement of light deflection of a low angle and is dependent on the size of the cell. The
sideward scatter (SCC) is a measurement of the light refraction in a right angle and this is
dependent on the granularity of the cell, the size and structure of its nucleolus and the amount of
vesicles in the cell. With these two parameters, cell populations may be crudely differentiated.
The application of various fluorescent dyes is vital for the flow cytometric analysis. For instance, to
identify a particular cell type, the cells are labelled with fluorescent conjugated antibodies against
cell surface markers which are characteristic for the cells (e.g. proteins of the CD-classification
such as CD11c). The scattered and fluorescent light is steered to the appropriate detectors by a
combination of beam splitters and filters. The fluorescent signals are converted to electronic
signals in proportion to the fluorescent strength.
By combining the information from the FSC/SSC and the fluorescence intensity of the cells
stained with specific markers, identification of target cells and a measurement of the frequency of
the target cells in the total cell population is facilitated. The simultaneous use of different
fluorophores is possible because even if the fluorophores are excited at similar wavelengths, they
have emission spectra which are characteristic for each fluorophore. Overlaps in these spectra
can be compensated prior to the sample measurement.

Material and Methods
46
In this study, flow cytometric analysis was performed using an LSRII (Becton Dickinson) in
connection with the FACS-Diva Software. The data was analysed using FlowJo software (Tab.
3.7).
3.2.4.2 Antibody staining of cells for flow cytometry
3.2.4.2.1 Direct staining of cell surface molecules for flow cytometric analysis Cell surface molecules can be labelled directly when fluorescent dye conjugated antibodies
against the target molecules are available and staining with these antibodies is strong enough for
detection (i.e. does not need to be amplified with an additional step). In this study, the co-
stimulatory molecules CD40, CD80, CD86 and MHC II and RAGE on mDCs as well as CD4 on T
cells were stained with the direct staining method. To identify the mDCs by flow cytometric
analysis CD11c and CD11b were also routinely stained with fluorophore conjugated antibodies
specific for these markers.
For the staining, mDCs were harvested from the cell culture plates using a small cell scraper. To
stain the CD4+ T cells of co-culture assays, the cells were detached from the wells using
EDTA/Trypsin (2 min at 37°C). All cells were spun down (1,200 rpm, 5 min, 4°C) and then washed
with FACS buffer. Typically, 0.5 – 1.0 x 10⁶ cells in a total volume of 50 to 100 µl (FACS buffer)
were incubated with the antibody at 4°C for 20 min. Subsequently, the cells were washed with
FACS buffer. The pellet was then resuspended in FACS buffer containing 0.5% PFA and
analysed by flow cytometry on the same day.
3.2.4.2.2 Indirect staining of cell surface molecules for FACS analysis MR, SR-A type I, Galectin-3 and RAGE on mDCs were labelled with an indirect staining method
using unlabelled primary unlabelled antibodies. mDCs (2.5 x 10⁵ cells) were stained with
antibodies specific for MR, SR-A type I, Galectin-3 or RAGE. To prevent unspecific binding of the
antibodies to FcγRI (IgG receptors) on the cell surface, the cells were treated with 100 µl blocking
buffer for 30 min at 4°C. To this suspension the purified monoclonal rat anti-mouse MR, SR-AI or
galectin-3 antibody was given. The cells were incubated with the antibodies for 30 min at 4°C and
then washed with PBS. This was followed by 20 min incubation at 4°C with an AlexaFluor 488
goat anti-rat IgG antibody in blocking buffer. Following receptor staining, the cells were washed
three times with FACS buffer. Subsequently CD11b and CD11c were then stained as described
(chapter 3.2.4.2.1).
EDTA/Trypsin (PEI media kitchen)
FACS buffer: PBS pH 7.2
+ 1% BSA
+ 20mM EDTA
+ 0.75 % (w/v) Sodium azide
+ 0.75 % (w/v) Sodium azide
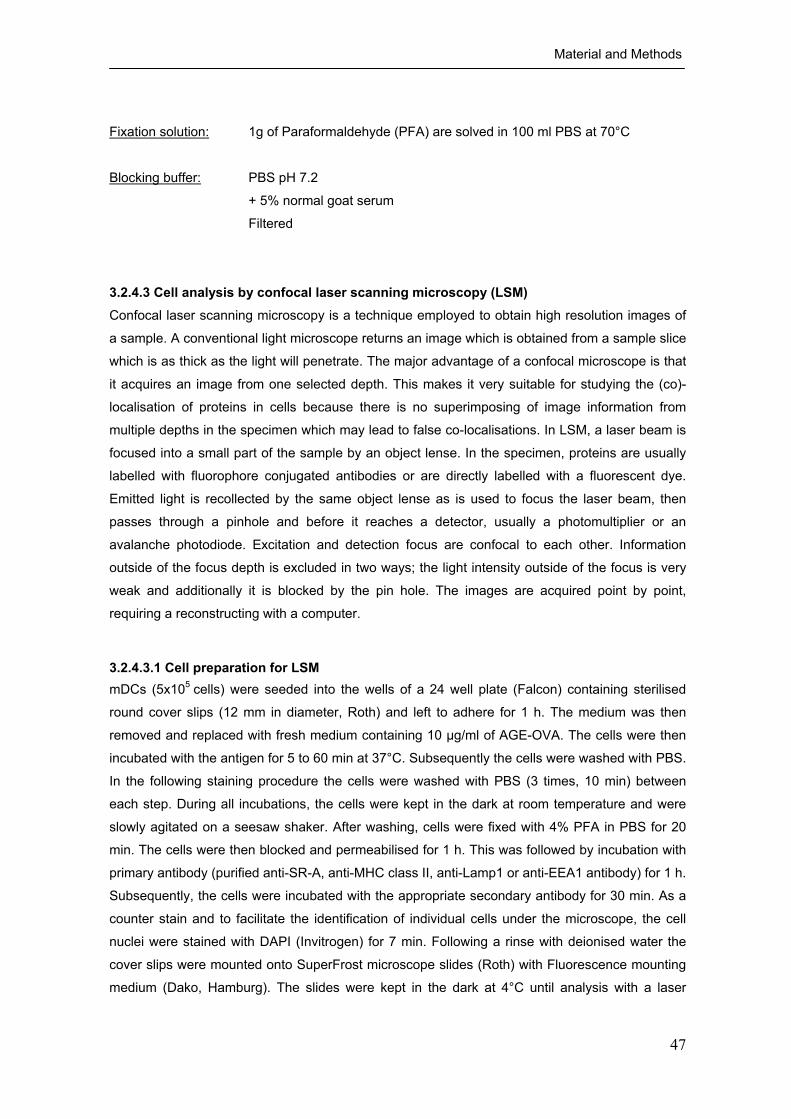
Material and Methods
47
Fixation solution: 1g of Paraformaldehyde (PFA) are solved in 100 ml PBS at 70°C
Blocking buffer: PBS pH 7.2
+ 5% normal goat serum
Filtered
3.2.4.3 Cell analysis by confocal laser scanning microscopy (LSM) Confocal laser scanning microscopy is a technique employed to obtain high resolution images of
a sample. A conventional light microscope returns an image which is obtained from a sample slice
which is as thick as the light will penetrate. The major advantage of a confocal microscope is that
it acquires an image from one selected depth. This makes it very suitable for studying the (co)-
localisation of proteins in cells because there is no superimposing of image information from
multiple depths in the specimen which may lead to false co-localisations. In LSM, a laser beam is
focused into a small part of the sample by an object lense. In the specimen, proteins are usually
labelled with fluorophore conjugated antibodies or are directly labelled with a fluorescent dye.
Emitted light is recollected by the same object lense as is used to focus the laser beam, then
passes through a pinhole and before it reaches a detector, usually a photomultiplier or an
avalanche photodiode. Excitation and detection focus are confocal to each other. Information
outside of the focus depth is excluded in two ways; the light intensity outside of the focus is very
weak and additionally it is blocked by the pin hole. The images are acquired point by point,
requiring a reconstructing with a computer.
3.2.4.3.1 Cell preparation for LSM mDCs (5x10⁵ cells) were seeded into the wells of a 24 well plate (Falcon) containing sterilised
round cover slips (12 mm in diameter, Roth) and left to adhere for 1 h. The medium was then
removed and replaced with fresh medium containing 10 µg/ml of AGE-OVA. The cells were then
incubated with the antigen for 5 to 60 min at 37°C. Subsequently the cells were washed with PBS.
In the following staining procedure the cells were washed with PBS (3 times, 10 min) between
each step. During all incubations, the cells were kept in the dark at room temperature and were
slowly agitated on a seesaw shaker. After washing, cells were fixed with 4% PFA in PBS for 20
min. The cells were then blocked and permeabilised for 1 h. This was followed by incubation with
primary antibody (purified anti-SR-A, anti-MHC class II, anti-Lamp1 or anti-EEA1 antibody) for 1 h.
Subsequently, the cells were incubated with the appropriate secondary antibody for 30 min. As a
counter stain and to facilitate the identification of individual cells under the microscope, the cell
nuclei were stained with DAPI (Invitrogen) for 7 min. Following a rinse with deionised water the
cover slips were mounted onto SuperFrost microscope slides (Roth) with Fluorescence mounting
medium (Dako, Hamburg). The slides were kept in the dark at 4°C until analysis with a laser

Material and Methods
48
scanning microscope LSM 510 (Carl Zeiss, Jena). The images were analysed with the Zeiss LSM
Image browser 4.2.
Fixation solution (4% PFA):
16% PFA (Pierce Bonn) diluted with PBS pH 7.2
Blocking/permeabilisation buffer: PBS, pH 7.2
+ 5% skimmed milk powder
+ 1% normal mouse serum (own production)
+ 0.1 % Triton X 100
+ 1 µg/ml normal mouse IgG (Santa Cruz)
Assay buffer: PBS, pH 7,2
+ 1% normal mouse serum (own production)
+ 0.1 % Triton X 100
3.2.4.4 Enzyme linked immunosorbent assay (ELISA) The enzyme linked immunosorbent assay (ELISA) employs antibodies as an exceedingly specific
analytical reagent for the detection and quantification of proteins or other antigens with which less
than 1 ng of protein can be detected.
There are two types of ELISA commonly used. One is the indirect ELISA, for which the antigen is
adsorbed directly to the microtitre plate. The second type is the sandwich ELISA, for which the
antigen is captured by an antigen specific antibody which is attached to the plate. In both types
the antigen is detected by a (second) antibody. This antibody can be conjugated with an enzyme
or it may be unlabelled and is itself detected by a further, enzyme conjugated, antibody. The
enzyme reacts with a colourless substrate to give a coloured product. Alternatively, biotin
molecules may be linked to the detection antibody to which a strepdavidin coupled enzyme can
bind, this additional step has the advantage of amplifying the signal. The optical density of the
coloured product indicates the quantity of the antigen or antibody of interest in the samples.
For all ELISAs, the wells were washed three times with washing buffer between each step to
remove any proteins or antibodies that were not specifically bound. Incubations at room
temperature were performed on an orbital shaker at 80 rpm.
3.2.4.4.1 Indirect ELISA
3.2.4.4.1.1 Measurement of mouse serum Immunoglobulins To detect antigen (OVA or rAra h 2) specific antibodies in mouse sera, microtitre plates (MaxiSorp
F96; Nunc, Langenselbold, Germany) were coated with antigens diluted in coating buffer at 4 °C

Material and Methods
49
over night. The OVAs were coated at 100 µg/ml using 100 µl/well, whereas Ara h 2 was coated at
5 µg/ml using 50 µl/well. The plates were then blocked with 2 % BSA in PBS for 1 h at RT. After
blocking, mice sera diluted in assay buffer were applied to the plates and incubated for 2 hours at
RT or over night at 4°C. Serum IgG antibodies bound to the antigen in the wells were detected
with horse reddish peroxidase (HRP) conjugated rabbit anti-mouse IgG1 or IgG2a antibodies
(Zymed), diluted 1:4000 in assay buffer. Serum IgE antibodies were detected by a biotin
conjugated anti-mouse IgE antibody (BD Biosciences), diluted 1:1000. The plates were incubated
with the secondary antibodies for one hour at RT. For the detection of serum IgE, the plates were
further incubated with a streptavidin-HRP conjugate diluted 1:2000 in assay buffer for 30 min at
RT. Subsequently, 100 µl of substrate solution were added to the plates, and incubated at RT for
10 to 30 min. The substrate used for the peroxidase was 3, 3’, 5, 5’-tetramethylbenzidine (TMB,
BD Biosciences). The reaction was stopped with 50 µl of stopping solution. The absorption of
each well at 450 nm was measured using an ELISA reader.
3.2.4.4.1.2 Detection of Maillard reaction products AGEs were detected using an indirect ELISA system. The procedure was as described in chapter
3.2.4.4.1.1. The different OVA samples were added to the first well at 10 mg/ml in 100 µl coating
buffer and then a tenfold serial dilution in the subsequent wells was performed. AGE structures
were detected with mouse monoclonal antibody (mAb) against CEL, pyrralin or GA-pyridine or
rabbit polyclonal antibodies against CML (each used at 0.1 µg/ml). Subsequently, the plates were
incubated with HRP conjugates of either anti-mouse IgG (diluted 1:4000, GE Healthcare, Munich,
Germany) or anti-rabbit IgG antibodies (diluted 1:5000, Sigma-Aldrich). The substrate was applied
to the plates as described in 3.2.4.3.1.1.
3.2.4.4.1.3 Verification of comparable FITC/protein ratio on labelled proteins To verify whether the FITC-conjugated proteins were labelled with a comparable F/P molar ratio,
an ELISA was performed in addition to the calculation based on the absorption at 280 and 495 nm
(chapter 3.2.2.6). The procedure was almost identical to that described above (chapter
3.2.4.4.1.1). The FITC conjugated proteins were added to the first well at 100 µg/ml in 100 µl
coating buffer and then diluted 1:10 in the consecutive wells. FITC on the proteins was detected
by an HRP-conjugated mouse anti-FITC antibody, diluted 1:5000. Subsequently, the substrate
was applied to the plates as described in 3.2.4.4.1.1.
3.2.4.5.2 Sandwich ELISA
3.2.4.5.2.1 Sandwich ELISA for the detection of cell supernatant cytokines Sandwich ELISAs were performed to measure the concentration of cytokines in cell culture
supernatants. Microtitre plates were coated at 4°C over night with a primary antibody
(eBioscience or Biolegend) against the cytokine of interest, diluted 1:1000 in coating buffer. After
blocking, cell culture supernatants were added to the wells. To quantify the cytokine concentration

Material and Methods
50
in the supernatant, recombinant cytokines (Tab. 3.3) with known concentrations were added to
the plates in different dilutions as standards. The supernatants and standards were incubated for
2 h at RT or at 4°C over night. The plates were then incubated with a biotin-conjugated secondary
antibody (eBioscience or Biolegend) specific for the cytokine, diluted 1:1000 and subsequently
with a streptavidin-HRP conjugate, diluted 1:4000. The substrate was then applied to the plates
as described in 3.2.4.4.1.1.
Micro titre plate: 96 well, Maxisorb (Nunc, Langenselbold)
Coating buffer (50mM Sodium-carbonate puffer): 1.696g Na2Co3
2.856g NaHCo3
ad 1L deionised water pH 9.6
(does not need to be adjusted)
Washing buffer: PBS pH 7.2
+ 0.05 % Tween 20
Blocking buffer: PBS pH 7.2
+ 2% BSA
Assay buffer: PBS pH 7.2
+ 0.05% Tween 20
+ 1% BSA
Tetramethylbenzidine (TMB) substrate reagent set (BD Biosciences)
Stopping solution: 1N H2SO4
3.2.5 Animal experimental methods All mice experiments were performed according to the guidelines of animal welfare of the state
and the PEI.
3.2.5.1 Housing of mice Gene modified mice were bred under specific pathogen free (SPF) conditions in the S1 area of
the “Zentrale Tierhaltung” of the PEI. For breeding, one male and one female were kept in a cage.
For experiments, mice were transferred into the experimental mouse room. In the room, mice
were housed in cages with single cage ventilation in same sex groups of up to 5 individuals.

Material and Methods
51
3.2.5.2 Short term mouse anaesthesia For short term anaesthesia, 1-2 ml of Isofluran were given into a glass with lid and covered with a
bit of tissue. The mouse was put into the glass and carefully watched until anaesthesia set in.
After taking the mouse out of the glass, it remained in anaesthesia for a further 30 sec.
3.2.5.3 Mouse euthanasia The mice were anaesthetised with Isofluran (chapter 3.2.5.2) and then sacrificed by cervical
dislocation.
3.2.5.4 Blood harvest from the tail vain The levels of antigen specific antibodies in sera of immunised mice are important indicators for
the antigenicity of protein. The sera were won by harvesting blood from the lateral tail vain of
immunised mice. To facilitate an easier harvest of blood, the mice were warmed up under an
infrared light for 20 sec. The mouse was then fixed in a tube which allowed easy access to the
tail. To draw blood, the tail was carefully cut with a thin razor blade and the blood collected.
After the harvest, the blood was kept at room temperature for 30 min to inactivate complement
factors. Then it was centrifuged at 4,500 rpm for 15 min at 4°C to separate the serum from the red
blood cells. The sera were kept at -20°C until analysed by ELISA (3.2.4.4.1.1).
3.2.5.5 Immunisation For this study, several immunisation methods were used. For all experiments an adjuvant was
used because proteins alone generally induce only weak immune responses in animal models.
Adjuvants are non-specific stimulators of the immune response, making a prospective antigen
more immunogenic. The effect of an adjuvant may be the result of one or more mechanisms of
action: a depot effect, an antigen presenting effect, via CD8 cytotoxic lymphocyte induction or by
an immune activation/modulation effect (Cox and Coulter, 1997).
3.2.5.5.1 Intraperitoneal immunisation For intraperitoneal immunisation (ip), aluminium hydroxide (Imject Alum, Pierce, Bonn) was used
as an adjuvant. Aluminium salts adsorb antigens and provide a depot effect (Gupta and Rost
2000). The depot effect is a classic mechanism in which the adjuvant protects the antigen from
dilution, rapid degradation and elimination by the host. The intact antigen is localised in the
immunised tissues and released slowly, resulting in prolonged exposure of the immune system to
the antigen. This results in a continued stimulation of antibody producing cells, leading to a
production of high levels of antibodies by the host. Additionally, aluminium adjuvants induce Th2
dominated immune response (Lindbald 2000).
The alum was added to the antigen in PBS and the mixture incubated at RT for 30 min, rotating
slowly. For the immunisation, 200 µl PBS containing the antigen (either of the OVAs or rAra h 2)
adsorbed to Alum was injected into the peritoneum of mice. Different immunisation protocols were
used, refer to the respective results section for these. Seven days after each immunisation, blood

Material and Methods
52
was harvested from the tail to determine the antibody levels in the serum. One week after the last
immunisation, the mice were sacrificed and the splenicT cell activation analysed (3.2.3.11).
3.2.5.5.2 Subcutaneous immunisation Subcutaneous (sc) immunisation was used as a method to obtain high frequency of antigen-
specific CD4+ T cells from inguinal (groin) and popliteal (knee) lymph nodes. For the
subcutaneous immunisation TiterMax Gold® Adjuvat (Sigma) was found to be an effective
adjuvant. This is a water-in-oil emulsion. Emulsions are commonly used depot adjuvants.
TiterMax Gold® consists of squalene (a metabolisable oil), an emulsifier, a microparticulate silica
and a block copolymer. The pronounced adjuvant activity of the high molecular weight copolymers
presumably results through antigen presentation, complement activation, chemotactic properties
and macrophage activation (Howerton et al., 1990; Hunter and Bennett 1984). To prepare the immunisation solution, AGE-OVA or one of the controls was diluted in PBS to 2
mg/ml. This antigen solution was then mixed at a ratio of 1:1 with TiterMax Gold®, adding the
antigen solution drop wise and mixing thoroughly in between additions to facilitate the preparation
of a homogenous emulsion. The emulsion was then taken up into a 1 ml syringe (Braun) with a
needle (25 G, Braun). Each mouse subcutaneously received 100 µg of OVA. One week after the
immunisation, the mice were sacrificed and the poplitial and inguinal lymph nodes removed to
assess the activation of the CD4+ T cells present in these organs (chapter 3.2.3.7.2).

Results
53
4 Results
4.1 Analysis of glycated ovalbumin (AGE-OVA) To investigate the influence of glycation by the Maillard reaction on the immunogenicity of food
allergens, OVA was used as a model allergen. First, OVA glycated by the Maillard reaction (AGE-
OVA) was prepared by incubation of OVA with glucose for six weeks (chapter 3.2.2.1.1). The
glycation structures on AGE-OVA were analysed by ELISA using antibodies recognising the AGE
structures N-ε-cyrboxymethyllysine (CML), N-ε-cyrboxyethyllysine (CEL), Glycolaldehyde-pyridine
(GA-pyridine) or pyrraline (Fig. 4.1). CML, CEL and GA-pyridine were detected on AGE-OVA,
whereas pyrraline was not detected by the used ELISA (Fig. 4.2). A reversed-phase HPLC
analysis (Henle 1991, Henle 1997) of AGE-OVA confirmed the presence of high levels of CML
(Tab. 4.1, performed by Ms Anne Wellner, TU Dresden). Fructose-lysine, which is an intermediate
of the Maillard reaction, was also detected by this method. The reversed-phase HPLC analysis
was sensitive enough to detect minimal amounts of pyrraline (Tab. 4.1). The respective glycation
structures were not detected on native OVA or OVA thermally processed under the same
conditions as AGE-OVA but without glucose (thermally processed OVA) (Fig. 4.2). Tab. 4.1 also
shows that the amount of free lysine was considerably reduced after OVA had been glycated by
the Maillard reaction. Only 22.1 ± 2.0mmol free lysine/100g protein remained in AGE-OVA as
opposed to 50.9 ± 0.1 mmol free lysine/100g protein found in native OVA. Therefore, over 50% of
the free lysine residues found in OVA had been modified during thermal processing with glucose.
Importantly, different batches of AGE-OVA produced and used for this study were glycated to a
similar extent with the same AGE structures (Fig. 4.2).
Fig. 4.1 Structural formula of glycation structures. Structural formulas of the advanced glycation end products which can be detected by specific antibodies in the ELISAs
used. Lys: lysine residues of protein
N-e-carboxyethyllysine(CEL)
N-e-carboxymethyllysine (CML) pyrraline
GA-pyridine
COOH H N Lys COOH
HN Lys
N
Lys
HOH2C CHO
N
O
HOOC
Lys
O
N
CH2OH OH

Results
54
GA-pyridineCEL
10-7
10-5
10-3
10-1
100
103
OVA concentration (µg/ml)10
-710-
510-
310
-110
010
3
OVA concentration (µg/ml)
0,00,20,40,60,81,01,21,41,6
pyrraline
10-7
10-5
10-3
10-1
100
103
OVA concentration (µg/ml)
0,00,20,40,60,81,01,21,41,6
0,00,20,40,60,81,01,21,41,6
CML
0,00,20,40,60,81,01,21,41,6
10-7
10-5
10-3
10-1
100
103
OVA concentration (µg/ml)
Mea
n O
D
Mea
n O
D
Mea
n O
D
Mea
n O
D
Batch 1Batch 2 Batch 3Batch 4native OVAthermally processed OVA
Fig. 4.2 Detection of glycation structures on AGE-OVA produced by the Maillard reaction. AGE-OVA was prepared by incubating 1 mM OVA with 1 M Glucose at 50°C for 6 weeks. The presence of glycation
structures was verified by ELISAs performed with antibodies against different AGE structures. The coloured curves show
four representative lots of AGE-OVA. Native OVA and OVA thermally processed without glucose were used as controls.
Table 4.1 Analysis of AGE-OVA
Fructose-lysine in glycated ovalbumin [mmol/100 g protein] 10.7 ± 0.6 Pyrraline in glycated ovalbumin [µmol/100 g protein] 29.4 ± 1.2 Pentosidine in glycated ovalbumin n.d. N-ε-carboxymethyllysine in glycated ovalbumin [mmol/100 g protein] 4.55 ± 0.49 Free lysine in glycated ovalbumin [mmol/100 g protein] 22.1 ± 2.0 Free lysine in non-glycated ovalbumin [mmol/100 g protein] 50.9 ± 0.1
The glycation structures found on AGE-OVA and loss of free lysine due to glycation. Analysis performed by A. Wellner, TU
Dresden, using biochemical methods.
Besides the modification with glycation structures, any conformational change of OVA after the
thermal incubation with or without glucose would be of importance, as this may also alter its
immunogenic potential. To analyse the 2D-structures of AGE-OVA and the control OVAs, CD

Results
55
spectroscopy was performed (chapter 3.2.2.5). The mean molar elipticity and the exact protein
concentration were included for the evaluation of the spectra. The spectra measured for native,
thermally processed and AGE-OVA were virtually identical (Fig 4.3, A). They have minima at 208
and 220 nm, characteristic for a mostly α-helical protein. The results indicate that the 2D-structure
of OVA was not affected by thermal incubation either with or without glucose.
An SDS-PAGE was also performed to examine the nature of AGE-OVA. Native OVA is found in
the gel at around 45 kDa (Fig. 4.3, B, lane 1), the 35 kDa band below the main band is only very
faint. The band at 35 kDa would probably stem from a fraction of OVA which has degraded. For
thermally processed OVA, the main band at 45 kDa is reduced and the 35kDa band has
increased in intensity (lane 2). This suggests that minor degradation occurred during thermal
treatment of OVA. The appearance of OVA in SDS-PAGE is completely changed by glycation.
AGE-OVA is seen as a smear (lane 3) where the majority of the protein is found above 45 kDa
and becomes very diffuse indicating, as expected, a significant modification of the protein by the
Maillard reaction. This is in accordance with the data in Fig. 4.2.
190 200 210 220 230 240 250 260
-15000
-10000
-5000
0
5000
10000
15000
20000
wavelenght (nm)
Mea
n m
olar
elli
ptic
ity p
er re
sidu
e q m
.r.w
.[m
deg
x cm
2x
dmol
-1]
Native OVAThermally processed OVAAGE-OVA M 1 2 3
205 -124 -
80 -
45,1 -
34,8 -
28,9 -
20,6 -
7,1 -
A B
Fig 4.3 Analysis of AGE-OVA by CD spectroscopy and SDS-PAGE The impact of thermally processing OVA at 50°C for 6 weeks with and without glucose on the 2D-structure and gel running
properties of OVA was analysed by CD spectroscopy and SDS-PAGE. A CD spectrum of native, thermally processed and
AGE-OVA was measured. B AGE-OVA and the controls were loaded on a 12.5% Tris-gylcine gel and stained with
Coomasie brilliant blue. M: molecular weight standard, Prestained Broad Range (BioRad), 1: native OVA; 2: thermally
processed OVA; 3: AGE-OVA.
4.2 Analysis of glycated bovine serum albumin (AGE-BSA) For some experiments bovine serum albumin (BSA) was used as a control protein. For this
purpose glycated BSA (AGE-BSA) and thermally processed BSA were prepared in the same way
as OVA (chapter 3.2.2.1.1).
As was observed for AGE-OVA, CML, CEL and GA-pyridine but not pyrraline were detected on
the AGE-BSA but not on BSA thermally processed without glucose (Fig. 4.4 A). In SDS-PAGE,

Results
56
native BSA is found at around 67 kDa (Fig. 4.4 B, lane 1). After thermal processing without
glucose, the majority of the protein was still found at 67 kDa (lane 2). As a result of the
modifications by the Maillard reaction, there is no distinct band in the lane where AGE-BSA was
applied (lane 3) but rather a diffused smear, similar to what was observed for AGE-OVA (Fig. 4.3,
B lane 3). Collectively the analysis of AGE-OVA and AGE-BSA indicates that these proteins
would possess similar glycation structures.
A B M 1 2 3
250 -150 -
100 -75 -
50 -
37 -
25 -
20 -
M 1 2 3
250 -150 -
100 -75 -
50 -
37 -
25 -
20 -
thermally processed BSAAGE-BSAthermally processed BSAAGE-BSA
0,0
0,1
0,2
0,3
0,4
0,5
Mea
n O
D
CML CEL GA-pyridine pyrraline Fig. 4.4 Detection of glycation structures on AGE-BSA produced by the Maillard reaction. AGE-BSA was prepared by incubating 1mM BSA with 1M Glucose at 50°C for 6 weeks. A The formation of glycation
structures was verified by ELISA using antibodies against different AGE structures. BSA thermally processed without
glucose was used as a control. B Native, thermally processed, or AGE-BSA were loaded on a 12.5% Tris-gylcine gel and
stained with Coomasie brilliant blue. M: molecular weight standard, Prestained Broad Range (BioRad), 1: native BSA; 2::
thermally processed BSA; 3: AGE-BSA.
4.3 Influence of glycation by the Maillard reaction on the T cell immunogenicity of OVA in vitro CD4+ T cells are key players in the onset and maintenance of allergic diseases. It was therefore of
interest how the glycation of OVA influences its T cell immunogenicity.
4.3.1 Activation of OVA specific CD4+ T cells in vitro by glycated OVA 4.3.1.1 Comparing the T cell activation ability of AGE-OVA and the unglycated OVAs First, the T cell immunogenicity of AGE-OVA was examined using an in vitro cell culture system. T
cells from two transgenic mouse strains, DO11.10 (BALB/c background) and OT-2 mice (BL6
background), were used. Around 80-85% of the CD4+ T cells from these transgenic mice posses
a T cell receptor (TCR) which is specific for OVA (peptide 323–339, one letter coded amino acid
sequence: ISQAVHAAHAEINEAGR). However, the TCRs of the two strains recognise different
haplotypes of the MHC class II molecule. TCRs of OT-2 cells recognise a complex of the peptide
and a I-Ab molecule, while TCRs of DO11.10 cells recognise a complex of the peptide and a I-Ad

Results
57
molecule. Furthermore, the TCRs of these CD4+ T cells bind to some different amino acid
residues of the OVA peptide 323–339. In this experiment the CD4+ T cells of OT-2 mice were
mainly used because other genetically modified mice used in this study were also generated on a
BL6 background. The experiment here was also performed with DO11.10 CD4+ T cells in order to
elucidate whether the genetic background may have an influence on the T cell activation by AGE-
OVA.
First, CD4+ T cells isolated from the spleen of OT-2 mice were co-cultured with mDCs and
stimulated with either AGE-OVA or one of the controls, native and thermally processed OVA, at 2,
20 or 200 µg /ml (chapter 3.2.3.8.1). Upon activation, CD4+ T cells produce the cytokine IL-2. The
concentration of IL-2 in the culture supernatant can easily be measured by ELISA and therefore is
a valuable marker to assess activation of T cell.
After 24 h, the highest concentration of IL-2 was found in the culture supernatants of T cells
stimulated with AGE-OVA (Fig 4.5 ). It was of interest whether this enhanced T cell activation by
AGE-OVA could also be seen at later time points or whether the level of activation becomes
aligned for all three forms of OVA. As shown in Fig. 4.5, the level of IL-2 in the culture
supernatants was much higher when the T cells were stimulated with AGE-OVA than when the
cells were stimulated with the controls also after 48, 72 and 96 hours of co-culture. This result
indicates that AGE-OVA activates OVA-specific CD4+ T cells much stronger than native or
thermally processed OVA.
To examine whether the genetic background of the mice influences the assessment of the T cell
immunogenicity of AGE-OVA, CD4+ T cells isolated from DO11.10 mice were co-cultured with
mDCs and stimulated with either form of OVA. As shown in Fig. 4.6, compared to the control
OVAs, AGE-OVA induced a higher level of IL-2 production after 24 h in the co-culture of
DO110.10 cells with mDCs. This was the case for all concentrations tested and also for incubation
times of 48, 72 and 96 hours (data not shown).
Together these results indicate that the glycation of OVA by the Maillard reaction enhances the
CD4+ T cell immunogenicity of the allergen. Additionally, the enhanced CD4+ T cell activation by
AGE-OVA was found to be independent of the mouse strain used as a source of the OVA specific
CD4+ T cells.

Results
58
Medium 2 20 200
Medium 2 20 200 Medium 2 20 200
Medium 2 20 200OVA concentration (µg/ml)OVA concentration (µg/ml)
OVA concentration (µg/ml)
0
IL-2
(pg/
ml)
200
400
600
1000
800
0
IL-2
(pg/
ml)
200
400
600
1000
800
0
IL-2
(pg/
ml)
200
400
600
1000
800
0
IL-2
(pg/
ml)
200
400
600
1000
800
24 h 48 h
72 h 96 h
OVA concentration (µg/ml)
native OVAthermally processed OVAAGE-OVA
Fig 4.5 Assessment of OT-2 CD4+ T cell activation induced by AGE-OVA OVA-specific CD4+ T cells isolated from OT-2 mice and BL6 mDCs were co-cultured and stimulated with native, thermally
processed or AGE-OVA for 24, 48, 72 or 96 hours. The IL-2 concentration in the culture supernatants was determined by
ELISA. Error bars signify the SD of culture triplicates and ELISA duplicates.
0
IL-2
(pg/
ml)
400
800
1200
1600
2000
Medium 2 20 200OVA concentration (µg/ml)
native OVAthermally processed OVAAGE-OVA
Fig 4.6 Assessment of DO11.10 CD4+ T cell activation induced by AGE-OVA OVA specific CD4+ T cells isolated from DO11.10 mice were co-cultured with BALB/c mDCs and stimulated with, native,
thermally processed or AGE-OVA for 24 h. The IL-2 concentration in the culture supernatants was measured by ELISA.
Error bars signify the SD of culture triplicates and ELISA duplicates.

Results
59
4.3.1.1.1 Verification of mDC involvement in CD4+ T cell activation by AGE-OVA It was viable to verify whether the CD4+ T cells could be directly activated by AGE-OVA or
whether mDCs are required to mediate the enhanced T cell activation. Therefore CD4+ T cells
isolated from DO11.10 mice were cultured with or without mDCs and stimulated with native,
thermally processed or AGE-OVA.
As shown in Fig. 4.7, the amount of IL-2 produced by CD4+ T cells cultured without mDCs but
stimulated with one of the OVAs at 20 or 200 µg/ml was extremely low when compared to the
amount of IL-2 produced by the T cells co-cultured with mDCs. This clearly indicates that mDCs
play a critical role in the enhanced OVA specific CD4+ T cell activation induced by AGE-OVA.
20 200 20 200 20 200
Nat
ive
OVA
Ther
mal
pro
cess
ed
OVA A
GE-
OVA
0
IL-2
(pg/
ml)
100
200
300
400
500
600 with mDCwithout mDC
20 200 20 200 20 200
Nat
ive
OVA
Ther
mal
pro
cess
ed
OVA A
GE-
OVA
0
IL-2
(pg/
ml)
100
200
300
400
500
600 with mDCwithout mDC
Fig 4.7 Involvement of mDCs in OVA specific CD4+ T cell activation by AGE-OVA CD4+ T cells isolated from DO11.10 mice were cultured with or without BALB/c mDCs. The cells were stimulated with
AGE-OVA or the controls for 24 h. The concentration of IL-2 in the culture supernatants was determined by ELISA. Error
bars signify the SD of culture triplicates and ELISA duplicates.
An additional experiment was performed to elucidate whether antigen modified with Maillard
glycation structures have the ability to activate CD4+ T cells directly. For this experiment, AGE-
BSA was used. The co-cultures of OVA specific CD4+ T cells and mDCs were stimulated with
native, thermally processed or AGE-BSA at 2, 20, and 200, µg/ml. The IL-2 concentration in the
culture supernatants was below the detection level of the ELISA (2 pg/ml, data not shown). These
results indicate that the T cells are only activated via their TCR which recognises the OVA peptide
323–339 presented on MHC class II molecules of mDCs. The glycation structures alone could not
activate the CD4+ T cells directly.
4.3.1.2 Assessment of T cell activation by selectively glycated OVA The AGE-OVA used in this study has a variety of glycation structures, some of which could be
detected by ELISA or biochemical methods (chapter 4.1). By selectively modifying OVA with
glycation structures, it could be verified that glycation of the allergen does indeed have a
significant influence on its T cell immunogenicity. Furthermore, it was of interest to investigate

Results
60
which of the AGE structures may be responsible for the enhanced CD4+ T cell activation induced
by AGE-OVA. The lysine residues of OVA were selectively modified with CML or CEL by Ms Anne
Wellner, TU Dresden. Samples in which different numbers of lysine residues were modified were
prepared: CML-OVA 1 or 2, modified with 36.77 and 1.64 mmol CML/100g OVA, respectively and
CEL-OVA 1, 2 or 3, modified with 45.17, 26.0 and 1.35 mmol CEL/100g OVA, respectively.
CD4+ T cells isolated from the spleen of OT-2 mice were co-cultured with BL6 mDCs, and
stimulated with CEL- or CML-OVA (3.2.3.8.1). As comparison, the T cells were again stimulated
with native, thermally processed or AGE-OVA. The AGE-OVA was analysed by Ms Anne Wellner
and was found to be modified with approximately 4.55 mmol CML/100g OVA (Tab. 4.1).
OVA selectively modified with CEL or CML induced a higher T cell activation than native and
thermally processed OVA. (Fig. 4.8). For CEL-OVA as well as CML-OVA the amount of IL-2
produced by the stimulated T cells was dependent on the level by which OVA was modified.
When higher levels of CML or CEL were present on OVA, more IL-2 was produced by the
stimulated T cells. CEL-OVA 1 and CML-OVA 2, the selectively modified OVA with high levels of
CEL and CML respectively, induced a comparable amount of T cell activation as AGE-OVA.
These results suggest that selective modification with either CEL or CML alone significantly
enhances the CD4+ T cell immunogenicity of OVA. Additionally, the data suggests that CML and
CEL detected on crude AGE-OVA would at least in part contribute to the enhanced CD4+ T cell
activation.
Medium 2 20 200
OVA concentration (µg/ml)
700
600
500
400
300
200
100
0
IL-2
(pg/
ml)
native OVAthermally processed OVAAGE-OVACML-OVA 1, 36,77 mmol OVA/100g OVACML-OVA 2, 1,64 mmol CML/100g OVACEL-OVA 1, 45,17 mmol CML/100g OVACEL-OVA 2, 26,02 mmol CML/100g OVACEL-OVA 3, 1,35 mmol CML/100g OVA
native OVAthermally processed OVAAGE-OVACML-OVA 1, 36,77 mmol OVA/100g OVACML-OVA 2, 1,64 mmol CML/100g OVACEL-OVA 1, 45,17 mmol CML/100g OVACEL-OVA 2, 26,02 mmol CML/100g OVACEL-OVA 3, 1,35 mmol CML/100g OVA
Fig 4.8 Determination of OT-2 CD4+ T cell activation induced by CML- and CEL-OVA after 24 h CD4+ T cells isolated from OT-2 mice were co-cultured with BL6 mDCs and stimulated with OVA modified with the lysine
derivates CML or CEL for 24 h. As comparison, the cells were also stimulated with native, thermally processed or AGE-
OVA. The IL-2 concentration in the cell culture supernatants was determined by ELISA. Error bars signify the SD of culture
triplicates and ELISA duplicates.

Results
61
4.3.2 Influence of AGE-OVA on the proliferation of OVA specific CD4+ T cells As AGE-OVA significantly enhanced the IL-2 production by OVA specific CD4+ T cells in
comparison to the control OVAs, it was of particular interest to see whether this also results in
enhanced proliferation of the T cells. CD4+ T cells isolated from the spleen of OT-2 mice were
stained with CFSE (chapter 3.2.3.10) before being co-cultured with mDCs and stimulated with
native, thermally processed or AGE-OVA, at 2, 20, or 200 µg/ml. The proliferation of the T cells
was then determined by analysing the CFSE dilution using flow cytometry (chapter 3.2.4.1).
For up to 48 hours no proliferation of CD4+ T cells could be observed (data not shown). After 72 h
cell division was clearly detected (Fig. 4.9). The number of dividing cells was significantly higher
upon stimulation with 2 or 20 µg/ml of AGE-OVA when compared to cells that were stimulated
with either of the control OVAs (Fig. 4.9) at these concentrations. This difference was not
observed when the CD4+ T cells were stimulated with the very high concentration of 200 µg/ml of
OVA. After 96 h, the number of cells which proliferate upon stimulation with 20 µg/ml of either
form of OVA had also become comparable. However, CD4+ T cells which had been stimulated
with only 2 µg/ml of allergen had proliferated only if stimulated with AGE-OVA (Fig. 4.9). These
results show that AGE-OVA not only induces enhanced IL-2 production but also increases the
proliferation of OVA specific CD4+ T cells when co-cultured with mDCs.
CFSE
96h
2 µg/ml 20 µg/ml 200 µg/ml
NativeOVA
CFSE
Cel
l cou
ntC
ell c
ount
Cel
l cou
nt
ThermallyProcessedOVA
AGE-OVA
72h
2 µg/ml 20 µg/ml 200 µg/ml
Fig 4.9 OVA specific CD4+ T cell proliferation induced by AGE-OVA analysed using CFSE staining CD4+ T cells were isolated from OT2-mice and stained with CFSE. The T cells were co-cultured with mDC and stimulated
with different concentrations of AGE-OVA, native or thermally processed OVA. After 72 and 96 h the proliferation of the
CD4+ T cells was determined by flow cytometry.

Results
62
4.3.3 Cytokine production by AGE-OVA activated CD4+ T cells Production of Th2 type cytokines such as IL-4 by allergen specific CD4+ T cells is a critical
component in the development and maintenance of food allergy (chapter 1.2 and 1.12.2.2). It was
of interest whether glycatated food allergens may preferentially induce Th2 differentiation.
Therefore the influence of the glycated OVA on the cytokine production of CD4+ T cells was
analysed. As CD4+ T cells from OT-2 mice predominantly produce Th1 type cytokines such as
IFN-γ but very little Th2 type cytokines such as IL-4, CD4+ T cells from DO11.10 mice, which
efficiently produce Th2 type cytokines, were used. The isolated T cells were co-cultured with
BALB/c mDCs and stimulated with native, thermally processed or AGE-OVA for 72h. The
concentration of IL-4 and IFN-γ in the culture supernatants was determined by ELISA (chapter
3.2.4.5.2.1).
All three forms of OVA induced a robust secretion of IFN-γ by CD4+ T cells when the cells were
stimulated with 200 µg/ml of allergen (Fig. 4.10). However, AGE-OVA induced significantly higher
IFN-γ and IL-4 production than the control OVAs when CD4+ T cells were stimulated with only 2 or
20 µg/ml of allergen. Native or thermally processed OVA induced robust secretion of IL-4 by the T
cells only at a very high allergen concentration, 200 µg/ml (Fig. 4.10). Collectively, the results
show that AGE-OVA, in addition to strongly enhanced CD4+ T cell activation and proliferation (Fig.
4.6), also increased secretion of IFN-γ and IL-4.
Interestingly, AGE-OVA induced the highest secretion of IL-4 by the T cells at the lower allergen
concentration of 2 µg/ml. It seems that in CD4+ T cells stimulated with AGE-OVA at 200 µg/ml, the
high level of IFN-γ inhibited IL-4 production by the cells. At the allergen concentrations used this
could not be observed for native or thermally processed OVA, however, it may be possible that if
higher allergen concentrations where used, increased IFN-γ may also inhibit IL-4 in cells
stimulated with native or thermally processed OVA. The fact that IFN-γ secretion inhibits
production of IL-4 is well established (chapter 1.12.2.1)
However, the ratio of IL-4/IFN-γ in the supernatants of T cells stimulated with native, thermally
processed OVA or AGE-OVA seems to be comparable. Therefore the glycation of the allergen
would not particularly induce Th2 cell differentiation.
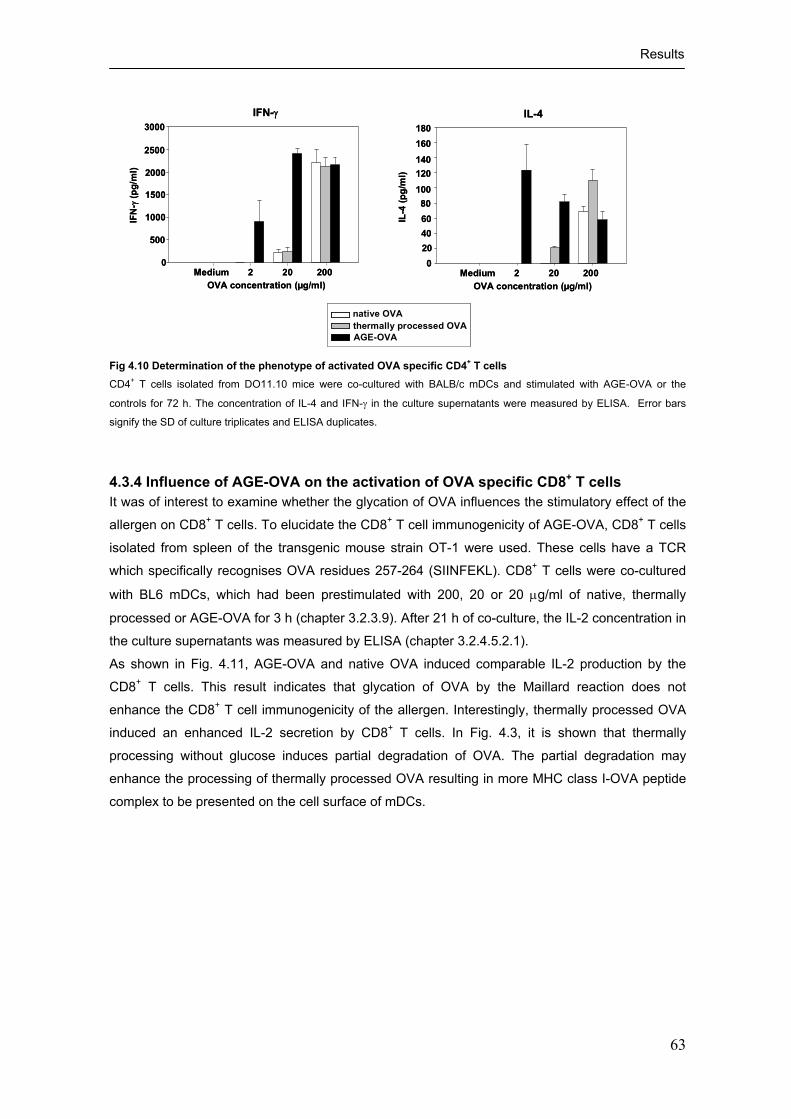
Results
63
120
80
20
IFN-γ IL-43000
2500
2000
1500
1000
500
0
IFN
-γ(p
g/m
l)
IL-4
(pg/
ml)
180160140
100
6040
0Medium 2 20 200
OVA concentration (µg/ml)Medium 2 20 200
OVA concentration (µg/ml)
native OVAthermally processed OVAAGE-OVA
120
80
20
IFN-γ IL-43000
2500
2000
1500
1000
500
0
IFN
-γ(p
g/m
l)
IL-4
(pg/
ml)
180160140
100
6040
0Medium 2 20 200
OVA concentration (µg/ml)Medium 2 20 200
OVA concentration (µg/ml)
native OVAthermally processed OVAAGE-OVA
Fig 4.10 Determination of the phenotype of activated OVA specific CD4+ T cells CD4+ T cells isolated from DO11.10 mice were co-cultured with BALB/c mDCs and stimulated with AGE-OVA or the
controls for 72 h. The concentration of IL-4 and IFN-γ in the culture supernatants were measured by ELISA. Error bars
signify the SD of culture triplicates and ELISA duplicates.
4.3.4 Influence of AGE-OVA on the activation of OVA specific CD8+ T cells It was of interest to examine whether the glycation of OVA influences the stimulatory effect of the
allergen on CD8+ T cells. To elucidate the CD8+ T cell immunogenicity of AGE-OVA, CD8+ T cells
isolated from spleen of the transgenic mouse strain OT-1 were used. These cells have a TCR
which specifically recognises OVA residues 257-264 (SIINFEKL). CD8+ T cells were co-cultured
with BL6 mDCs, which had been prestimulated with 200, 20 or 20 µg/ml of native, thermally
processed or AGE-OVA for 3 h (chapter 3.2.3.9). After 21 h of co-culture, the IL-2 concentration in
the culture supernatants was measured by ELISA (chapter 3.2.4.5.2.1).
As shown in Fig. 4.11, AGE-OVA and native OVA induced comparable IL-2 production by the
CD8+ T cells. This result indicates that glycation of OVA by the Maillard reaction does not
enhance the CD8+ T cell immunogenicity of the allergen. Interestingly, thermally processed OVA
induced an enhanced IL-2 secretion by CD8+ T cells. In Fig. 4.3, it is shown that thermally
processing without glucose induces partial degradation of OVA. The partial degradation may
enhance the processing of thermally processed OVA resulting in more MHC class I-OVA peptide
complex to be presented on the cell surface of mDCs.

Results
64
Medium 2 20 200OVA concentration (µg/ml)
1600
1400
12001000
800
600
400
200
0
IL-2
(pg/
ml)
native OVAthermally processed OVAAGE-OVA
Fig 4.11 Assessment of CD8+ T cell activation after stimulation with OVA CD8+ T cells isolated from OT-1 mice were co-cultured with BL6 mDCs, which had been preincubated with native,
thermally processed or AGE-OVA for 3 h. After 21 h of co-culture, the IL-2 concentration in the cell culture supernatants
was measured by ELISA. Error bars signify the SD of culture triplicates and ELISA duplicates.
4.4 Interaction of AGE-OVA with mDCs in vitro Dendritic cells are professional antigen presenting cells which are highly specialised in the uptake
of antigens and subsequent activation of T cells. As shown in Fig. 4.7, it was found that mDCs are
essential for the enhanced CD4+ T cell activation by AGE-OVA. To obtain insights into the role of
mDCs in the enhanced T cell activation by AGE-OVA, (i) the influence of AGE-OVA on mDC
maturation and (ii) the mechanisms involved in the uptake of AGE-OVA by mDCs were examined.
4.4.1 Influence of AGE-OVA on the maturation of mDCs First the influence of AGE-OVA on mDC maturation was assessed. mDCs were stimulated with
20 µg/ml of AGE-OVA or either of the controls, native and thermally processed OVA for 18 h. As
positive control in this experiment, LPS, a known inducer of mDC maturation, was used (chapter
3.2.3.5). The cell surface expression of the maturation markers CD40, CD80, CD86 and MHC
class II molecules (MHC II) on mDCs was analysed by flow cytometry (chapter 3.2.4.1).
Furthermore, the concentration of IL-12p70 and IL-10 in the supernatant of the stimulated mDCs
was measured by ELISA (chapter 3.2.4.5.2.1).
As expected, stimulation of mDCs with LPS upregulated the expression of all maturation markers
on the cell surface (Fig. 4.12 A). LPS stimulation also induced a significant secretion of IL-12p70
and IL-10 by mDCs (Fig. 4.12 B). In contrast, the expression of the maturation markers by mDCs
was not upregulated upon stimulation with AGE-OVA or any of the controls (Fig 4.12 A). In line
with this, mDCs stimulated with either of the OVAs did not secrete detectable levels of IL-12p70 or
IL-10 (Fig. 4.12, B). Collectively, these results indicate that AGE-OVA is not capable of inducing
the maturation of bone marrow derived mDCs.

Results
65
CD40 CD80
CD86 MHC II
% o
f Max
% o
f Max
20
40
60
80
100
0
LPS
Nat
ive
OVA
Ther
mal
pr
oces
sed
OVA
AG
E-O
VA
<10 <10 <10
IL-1
0 (p
g/m
l)
IL-10
20
40
60
80
100
0
LPS
Nat
ive
OVA
Ther
mal
pr
oces
sed
OVA
AG
E-O
VA
<10 <10 <10
IL-1
0 (p
g/m
l)
IL-10
0
500
1000
1500
2000
<2.5 <2.5 <2.5
IL-1
2 p7
0 (p
g/m
l)
LPS
Nat
ive
OVA
Ther
mal
pr
oces
sed
OVA
AG
E-O
VA
IL-12 p70
0
500
1000
1500
2000
<2.5 <2.5 <2.5
IL-1
2 p7
0 (p
g/m
l)
LPS
Nat
ive
OVA
Ther
mal
pr
oces
sed
OVA
AG
E-O
VA
IL-12 p70
A B
Native OVAThermally processed OVAAGE-OVALPS
Fig 4.12 Assessment of mDC maturation induced by AGE-OVA mDCs were stimulated with 20 µg/ml of native, thermally processed or AGE-OVA or 10 µg/ml of LPS for 18h.
A Expression of the maturation markers CD40, CD80, CD86 and MHC II on mDCs was analysed by flow cytometry. Gray
areas represent cells cultured with medium only. B The concentrations of IL-10 and IL-12p70 in the culture supernatants
were measured by ELISA. Error bars signify the SD of culture triplicates and ELISA duplicates.
4.4.2 Influence of glycation of OVA on the uptake of the allergen by mDCs Antigen-specific T cell activation is preceded by the uptake of antigens by DCs. To further
investigate the mediator function of mDCs in the enhanced CD4+ T cell immunogenicity of AGE-
OVA, the uptake of native, thermally processed and AGE-OVA by mDCs was compared. 4.4.2.1 Verifying the comparability of the FITC labelling of the different OVA forms In order to compare the uptake of AGE-OVA and the controls by mDCs, the OVAs had to be
labelled with FITC at comparable FITC/protein molar ratio (chapter 3.2.2.6). The FITC/protein
molar ratio was calculated by measuring the absorption of the samples at 280 nm (absorption
maximum of proteins) and 495 nm (absorption maximum of FITC) as described in chapter 3.2.2.6.

Results
66
The proteins were usually labelled with around 2.5 moles of FITC per mol of protein. Additionally,
an ELISA using a mouse-anti FITC monoclonal antibody was performed to verify comparable
labelling of all three OVA samples (chapter 3.2.4.4.1.3). A representative result of the ELISA is
shown in Fig. 4.13. The result shows that the anti-FITC monoclonal antibody bound to FITC
labelled native, thermally processed and AGE-OVA equally well at all concentrations. This
indicates that the three samples were labelled with a comparable FITC/protein molar ratio.
Therefore these FITC-conjugates could be used to compare the uptake of the three forms of OVA
since differences in FITC intensity of the cells would not be the result of non-uniform labelling of
the proteins.
10-5
10-4
10-2
100
102
104
OVA concentration (µg/ml)
10-7
0
1
2
3
5
4
Mea
nO
D
10-5
10-4
10-2
100
102
104
OVA concentration (µg/ml)
10-7
0
1
2
3
5
4
Mea
nO
D
Native OVAThermally processed OVAAGE-OVA
Native OVAThermally processed OVAAGE-OVA
Fig 4.13 Comparability of FITC/protein ratio of the three OVAs ELISA plates were coated with FITC labelled native, thermally processed or AGE-OVA. The level of FITC on the OVAs
was determined using a mouse-anti FITC antibody.
4.4.2.2 Analysis of the uptake of AGE-OVA by mDCs
To assess the level of OVA uptake by mDCs, the cells were incubated with 0.5 or 5 µg/ml of FITC
labelled native, thermally processed or AGE-OVA for 15 min (3.2.3.6). Following the incubation,
mDCs were harvested and stained with PE conjugated anti-mouse CD11b and APC conjugated
anti-mouse CD11c (3.2.4.2.1) antibody. The FITC intensity of the CD11b+CD11c+ cells was
measured by flow cytometry (3.2.4.1).
When incubated with 5 µg/ml of allergen, the mDC uptake of AGE-OVA is more than fivefold
higher than that of native or thermally processed OVA (Fig. 4.14 A). The result was even more
striking when only 0.5 µg/ml of the allergens were given to the cells. Here, the mDC uptake of
AGE-OVA was nearly tenfold higher than that of the control OVAs (Fig. 4.14 A). The fold increase
of the mean fluorescence intensity (MFI) of cells incubated with native, thermally processed or
AGE-OVA in relation to the auto fluorescence of mDCs cultured with medium only is shown in Fig.
4.14 B. The MFI of the mDCs incubated with native or thermally processed OVA was only around
5 and 20 fold greater than that of the unstimulated cells at the antigen concentration of 0.5 and 5

Results
67
µg/ml respectively. For AGE-OVA the fold increase of the MFI was approximately 20 and 60 fold
at the antigen concentration of 0.5 and 5 µg/ml respectively. The results strongly indicate that
AGE-OVA was taken up by mDCs much more efficiently than native and thermally processed
OVA.
The increased fluorescence intensity of mDCs incubated with FITC-AGE-OVA might result from
the attachment of the glycated allergen on the cell surface due to electric charges of the glycation
structures. To verify whether AGE-OVA was taken up (endocytosed) by mDCs or simply attached
to the cell surface, the localisation of AGE-OVA in the cells was analysed by confocal laser
scanning microscopy (chapter 3.2.4.3). The mDCs were incubated with AGE-OVA for 15 min
under the same conditions as for the flow cytometric analysis. The majority of AGE-OVA was not
attached to the cell surface but clearly located within the mDCs (Fig. 4.14, C). This observation
indicates that AGE-OVA was indeed endocytosed by the mDCs.
5 µg/ml 0.5 µg/ml
% o
f Max
FITC
native OVA
thermally processed OVA
AGE-OVA
native OVAthermally processed OVAAGE-OVA
0.5 5OVA concentration (µg/ml)
80
60
40
20
0
fold
incr
ease
of M
FI
A
B CFITC AGE-OVA Phase contrast Merge
Fig 4.14 Influence of glycation on its uptake by mDCs Wt mDCs were incubated with 0.5 or 5 µg/ml of FITC conjugated native, thermally processed or AGE-OVA for 15 min.
A Analysis of uptake by CD11b+CD11c+ mDCs using flow cytometry. Gray areas represent cells cultured with medium
only. Graphs are representative of three independent experiments. B The FITC mean fluorescence intensity (MFI) is
shown as fold increase of MFI of cells cultured with medium only. Error bars signify the SD of three independent
experiments. C The uptake of FITC AGE-OVA by mDCs was analysed by confocal laser scanning microscopy.

Results
68
4.4.3 Receptors mediating the uptake of AGE-OVA by mDCs Native OVA has a single carbohydrate side chain composed of N-acetylglucoseamine (GNAc)
and mannose which facilitates the uptake of the allergen by the mannose receptor (MR)
(Huntington 2001 et al., Burgdorf 2006, Autenrith et al., 2007). AGEs have been shown to bind to
a variety of cell surface receptors such as RAGE (receptor for advanced glycation end products)
(Schmidt 1992, Neeper 1992), scavenger receptor class A type I and II (SR-AI/II) (Suzuki 1997,
Araki 1999) scavenger receptor class B type I (SR-BI) (Ohgami et al., 2001, a), CD36 (Ohgami et
al., 2001, b) and Galectin-3 (Vlassara 1995). Following the observation that glycation of OVA
enhances its uptake by mDCs, the aim was to identify the receptor(s) involved in the uptake of
AGE-OVA by mDCs. 4.4.3.1 Detection of receptors expressed on bone marrow derived mDCs First, it was verified whether the receptors which have previously been found to bind AGEs and
the MR are expressed by the mDCs used in this study. The expression of MR, SR-AI, RAGE and
Galectin-3 on the surface of the mDCs was analysed by flow cytometry (chapter 3.2.4.1) using
monoclonal antibodies recognising these receptors (chapter 3.2.4.2.2). Expression of SR-B1,
CD36, and also SR-AI/II by mDCs was examined by RT-PCR (chapter 3.2.1.2)
As shown in Fig. 4.15 A and B, the majority of mDCs express the MR and Galectin-3. Cell surface
expression of RAGE however, could not be detected by flow cytometry (Fig. 4.15, C). Gene and
protein expression of RAGE was also not detected when using RT-PCR and Western Blot,
respectively (data not shown). For the detection of SR-A a monoclonal antibody against SR-A
type I only was used, as this is the only antibody commercially available which was suitable for
flow cytometric analysis of BL6 derived mDCs. As shown in Fig. 4.15 D SR-AI was detected on
some but not all mDCs. Additionally, the expression of SR-AI/II was confirmed by RT-PCR (Fig.
4.15, E, lane 3). Gene expression of SR-B1 and CD36 by mDCs could also be shown by RT-PCR
(Fig. 4.1,E, lanes 1 and 2). Therefore several receptors which may potentially bind AGE (-OVA)
are expressed by the mDCs used in the present study.

Results
69
MR Galectin-3 RAGE
SR-AI/II- mDC
WT mDC
% o
f Max
M 1 2 3
700 -800 -900 -
1000 -1200 -
600 -500 -
400 -
300 -
200 - 215 bp
726 bp (lane 2)
product size
708 bp (lane 1)
% o
f Max
A B C
D E
SR-A I
MR Galectin-3 RAGE
SR-AI/II- mDC
WT mDC
% o
f Max
M 1 2 3
700 -800 -900 -
1000 -1200 -
600 -500 -
400 -
300 -
200 - 215 bp
726 bp (lane 2)
product size
708 bp (lane 1)
M 1 2 3
700 -800 -900 -
1000 -1200 -
600 -500 -
400 -
300 -
200 - 215 bp
726 bp (lane 2)
product size
708 bp (lane 1)
% o
f Max
A B C
D E
SR-A I
Fig. 4.15 Expression of OVA and AGE-binding receptors expressed by mDCs Wt mDCs were analysed for their expression of the receptors to which AGE-OVA may bind. A-D The cells were stained
with the respective monoclonal antibody and the expression of the receptors in CD11b+CD11c+ cells was analysed by flow
cytometry. Gray areas represent the relevant isotype controls. E Total RNA of mDCs was isolated and subjected to
reverse transcriptase treatment. PCR was then performed using primers detecting the genes for SR-B1, CD36 and SR-A,
respectively. PCR products were analysed using a 1.5% agarose gel. M: size standard, 100 bp DNA ladder (NEB), 1: SR-
B1; 2: CD36; 3: SR-A.
4.4.3.2 Non-involvement of RAGE in the uptake of AGE-OVA As shown in Fig. 4.15, expression of RAGE by mDCs could not be detected. However, as RAGE
is a well known AGE-binding receptor, it remained an attractive potential receptor for the
endocytosis of AGE-OVA in this study. It could not be excluded that the methods described above
to detect RAGE expression were not optimal. Therefore it was examined whether the uptake of
AGE-OVA is attenuated in mDCs generated from RAGE deficient mice.
After incubation of wild type (Wt) mDCs and RAGE deficient mDCs with 5 µg/ml FITC-conjugated
native, thermally processed or AGE-OVA for 15 min (chapter 3.2.3.6), the cells were stained with
PE conjugated anti-mouse CD11b and APC conjugated anti-mouse CD11c (chapter 3.2.4.2.1)
antibodies. The FITC intensity of CD11+CD11c+ cells was analysed by flow cytometry (chapter
3.2.4.1). The fluorescence intensity of mDCs incubated with AGE-OVA was comparable in Wt and
RAGE deficient mDCs (Fig. 4.16). A reduction in the uptake of native and thermally processed
OVA was also not observed in RAGE deficient mDCs. The results indicate that RAGE is not

Results
70
involved in the uptake of AGE-OVA or in the uptake native and thermally processed OVA in the
experimental system used in this study.
Native OVA Thermally processed OVA AGE-OVA%
of M
ax
FITC
RAGE- mDCWt mDC
Fig. 4.16 RAGE is not involved in the uptake of AGE-OVA by mDCs Wt or RAGE deficient mDCs were incubated with 5 µg/ml of FITC conjugated AGE-OVA or the controls. The uptake of the
OVAs by CD11b+CD11c+ mDCs was analysed by flow cytometry. Gray areas represent mDCs cultured with medium only.
Graphs are representative of three independent experiments.
4.4.3.3 Non-involvement of Galectin-3 in the uptake of AGE-OVA Next it was investigated, whether Galectin-3 is engaged in the uptake of AGE-OVA. Lactose is a
ligand of Galectin-3 (Cherayil et al., 1989) and is commonly used to block the interaction of other
ligands with this receptor (Li et al., 2008; Karlsson et al., 2009). The uptake of all three OVAs by
lactose treated and untreated Wt mDCs was compared. mDCs were treated with 150 mM lactose
30 min prior to the addition of the OVAs (chapter 3.2.3.6). No significant reduction in the uptake of
AGE-OVA or of the controls was observed in lactose treated mDCs (Fig. 4.17). Therefore
galectin-3, highly expressed on the mDCs (Fig 4.15, B), does not mediate the uptake of AGE-
OVA.
% o
f Max
Native OVA Thermally processed OVA AGE-OVA
FITC
+ lactose- lactose
Fig. 4.17 Galectin-3 is not involved in the uptake of AGE-OVA by mDCs mDCs were pre-incubated with lactose for 30 min to inhibit possible galectin-3 mediated uptake. Subsequently the cells
were incubated with 5 µg/ml of FITC conjugated native, thermally processed or AGE-OVA .The uptake of the OVAs by
CD11b+CD11c+ mDCs was measured by flow cytometry. Gray areas represent mDCs cultured with medium only. Graphs
are representative of three independent experiments.

Results
71
4.4.3.4 Involvement of SR-AI/II in the uptake of AGE-OVA by mDCs Following the findings that RAGE and Galectin-3 are not involved in AGE-OVA uptake by mDCs,
the role of a further potential receptor, SR-AI/II, was examined using mDCs generated from bone
marrow cells of SR-AI/II deficient mice (chapter 3.2.3.6). Importantly, AGE-OVA uptake by SR-
AI/II deficient mDCs was significantly reduced in comparison to that by Wt mDCs (Fig. 4.18). This
reduction of uptake by the SR-AI/II deficiency is particularly pronounced when adding the lower
concentration of AGE-OVA, 0.5 µg/ml. Surprisingly, native and thermally processed OVA uptake
was also reduced in SR-AI/II deficient mDCs (Fig. 4.18). However, the reduction in the uptake of
the control OVAs was considerably less than that of AGE-OVA. Additionally, when SR-AI/II
deficient mDCs were treated with only 0.5 µg/ml of native or thermally processed OVA, a visible
reduction of the uptake was no longer observed. The results indicate that SR-AI/II plays a pivotal
role in the uptake of AGE-OVA by mDCs. The uptake of native and thermally processed OVA
could also be mediated by SR-AI/II but only to a small extend.
0.5 µg/ml
5 µg/ml
Native OVA Thermally processed OVA AGE-OVA
% o
f Max
FITC
SR-AI/II- mDCWt mDCSR-AI/II- mDCWt mDC
% o
f Max
Fig. 4.18 Uptake of AGE-OVA by SR-AI/II deficient mDCs
Wt mDC or SR-AI/II deficient mDCs were incubated with 0.5 or 5 µg/ml of FITC labelled native, thermally processed or
AGE-OVA for 15 min. The FITC fluorescence intensity of CD11b+CD11c+ cells was measured by flow cytometry. Gray
areas represent mDCs cultured with medium only. Graphs are representative of three independent experiments.
4.4.3.5 Involvement of the MR in the uptake of AGE-OVA by mDCs There was still considerable uptake of all three OVAs by SR-AI/II deficient mDCs (Fig. 4.18). OVA
has a single carbohydrate side chain containing mannose, which facilitates the uptake of the
allergen by the mannose receptor (MR) (Huntington 2001 et al., Burgdorf 2006, Autenrith et al.,
2007). Therefore the remaining uptake observed in SR-AI/II deficient mDCs may be mediated by
the MR. To verify this, mannan, a carbohydrate which inhibits MR mediated endocytosis (Sallusto

Results
72
et al., 1995), was used. SR-AI/II deficient mDCs were treated with 3 mg/ml of mannan prior to the
incubation with 0.5 or 5 µg/ml of either of the FITC conjugated OVAs (chapter 3.2.3.6).
Treatment of SR-AI/II deficient mDCs with mannan almost completely abolished the uptake of
native and thermally processed OVA (Fig. 4.19). This observation indicates that the MR is the
main receptor for the uptake of native and thermally processed OVA. Regarding the mDC uptake
of AGE-OVA, the MR inhibition in combination with the SR-AI/II deficiency did not attenuate the
uptake completely. Some uptake of AGE-OVA was still observed in SR-AI/II deficient mDCs which
had been incubated with 5 µg/ml of OVA even after mannan treatment. The results suggest that in
addition to the SR-AI/II, the MR is a mediator for the uptake of AGE-OVA. However, one or more
further receptor(s) could be involved in the mDC uptake of AGE-OVA .
0.5 µg/ml
5 µg/ml
Native OVA Thermally processed OVA AGE-OVA
% o
f Max
FITC
+ mannan- mannan
% o
f Max
Fig. 4.19 Influence of mannan treatment on AGE-OVA uptake by SR-AI/II deficient mDCs
SR-AI/II deficient mDCs were treated with 3 mg/ml of mannan for 30 min and then incubated with 0.5 or 5 µg/ml of FITC
labelled native, thermally processed or AGE-OVA for 15 min. The FITC fluorescence intensity of CD11b+CD11c+ mDCs
was measured by flow cytometry. Gray areas represent mDCs cultured with medium only. Graphs are representative of
three independent experiments.
4.4.4 Verification of interaction of AGEs with SR-AI/II The experiments in chapter 4.4.3 have demonstrated that the uptake of AGE-OVA is significantly
reduced in SR-AI/II deficient mDCs while the uptake of native OVA and thermally processed OVA
is only marginally affected. It was therefore very likely that the glycation structures on AGE-OVA
enhance the interaction of AGE-OVA with SR-AI/II. To verify the interaction of AGEs with SR-AI/II,
AGE-BSA was used. The profile of the glycation structures of AGE-BSA was comparable with that
of AGE-OVA as shown in Fig. 4.2 and Fig. 4.4.

Results
73
4.4.4.1 Uptake of native and AGE-BSA by Wt mDCs First, it was determined whether the glycation of BSA increases the uptake of the protein by
mDCs as was observed for OVA (Fig. 4.14). Native BSA and AGE-BSA were labelled with FITC
at a comparable FITC/protein ratio (chapter 3.2.2.6). The level of the uptake of these BSAs was
compared by measuring the FITC intensity of mDCs by flow cytometry (chapter 3.2.4.1).
As shown in Fig. 4.20, the uptake of AGE-BSA was markedly greater than that of native BSA at
both antigen concentrations used. Similar to the observations made with OVA (Fig 4.14), this
difference was most evident at an antigen concentration of 0.5 µg/ml (Fig. 4.20) at which an
uptake of native BSA by mDCs could barely be detected, while AGE-BSA is efficiently taken up.
This result suggests that glycation structures are indeed the critical component for the enhanced
uptake of glycated proteins by mDCs.
0.5 µg/ml 5 µg/ml
% o
f Max
AGE-BSAnative BSA
FITC Fig. 4.20 Uptake of native BSA and AGE-BSA by Wt mDCs mDCs were incubated with 0.5 or 5 µg/ml of FITC conjugated native BSA or AGE-BSA for 15 min. The uptake of these
BSAs by CD11b+CD11c+ mDCs was measured by flow cytometry. Gray areas represent cells cultured with medium only.
Graphs are representative of three independent experiments.
4.4.4.2 Inhibition of mDC uptake of AGE-OVA by AGE-BSA To further verify the involvement of the glycation structures of AGE-OVA in the enhanced uptake
by mDCs, an inhibition assay using AGE-BSA was performed. To this end, mDC uptake of FITC
labelled AGE-OVA in the presence of native BSA or AGE-BSA was examined (chapter 3.2.3.6). In
contrast to OVA, BSA does not possess natural carbohydrate residues which may facilitate
binding to SR-AI/II (Wada, 1996). However, AGE-BSA, as an AGE derivative, should also be
capable to bind to SR-AI/II.
Native BSA did not inhibit the uptake of AGE-OVA by Wt mDCs, even when added at a very high
concentration, 500 µg/ml (Fig. 4.21, A). In contrast, AGE-BSA inhibited the uptake of AGE-OVA
by Wt mDCs in a dose dependent manner. High concentrations of AGE-BSA also inhibited the
uptake of AGE-OVA by SR-AI/II deficient mDCs, but considerably less than in Wt mDCs (Fig. 4.21
B). Native BSA, again, did not inhibit the uptake of AGE-OVA by the deficient mDCs. These
results further support that (i) the glycation structures are the critical components in the uptake of
AGE-OVA by SR-AI/II and (ii) (an)other receptor(s) in addition to SR-AI/II interact(s) with AGEs,
although the role of the(se) receptor(s) in the uptake of the AGEs would be minor.

Results
74
50 µg/ml 5 µg/mlA
B
FITC
% o
f Max
% o
f Max
- Native BSA+ Native BSA
- AGE-BSA+ AGE-BSA
FITC
500 µg/ml 50 µg/ml 5 µg/ml
% o
f Max
% o
f Max
- Native BSA+ Native BSA
- AGE-BSA+ AGE-BSA
500 µg/ml
Fig. 4.21 AGE-BSA inhibition of AGE-OVA uptake by Wt and SR-AI/II deficient mDCs A WT mDCs or B SR-AI/II deficient mDCs were incubated with 5 µg /ml of FITC-conjugated AGE-OVA together with native
or AGE-BSA at the indicated concentrations for 15 min. The uptake of AGE-BSA by CD11b+CD11c+ mDCs was measured
by flow cytometry. Gray areas represent cells cultured with medium only. Graphs are representative of three independent
experiments. 4.4.4.3 Excluding unspecific interaction of FITC with SR-AI/II SR-AI/II has a broad ligand binding specificity against polyanionic molecules such as
glycoproteins and chemically modified proteins. It was of importance to exclude the possibility of
an involvement of FITC in the interaction of the labelled OVAs with SR-AI/II.
To examine the involvement of FITC in SR-AI/II mediated uptake by mDCs, Transferrin (Trf)
labelled with FITC was used. This protein is specifically internalised by the Transferrin receptor
(TrfR) (Trowbridge and Shackleford, 1986). The endocytosis of Trf should therefore not be

Results
75
affected by a lack of SR-AI/II on mDCs. As was expected, the uptake of FITC-Trf was comparable
in Wt and SR-AI/II deficient mDCs (Fig. 4.22.). This result indicates that FITC-Trf uptake is
mediated only by the TrfR and, importantly, excludes the possibility of FITC binding to SR-AI/II.
50 µg/ml5 µg/ml
SR-I/II- mDCWt mDC
% o
f Max
FITC Fig 4.22 Using FITC-Trf to exclude the possibility of unspecific interaction of FITC with SR-AI/II Wt mDCs or SR-AI/II deficient mDCs were incubated with 5 or 50 µg/ml of FITC-conjugated Trf. The uptake by
CD11b+CD11c+ mDCs was measured by flow cytometry. Gray areas represent cells cultured with medium only. Graphs
are representative of three independent experiments.
4.4.5 Uptake of recombinant OVA by Wt mDCs and SR-AI/II deficient mDCs In general, recombinant proteins which are prepared employing expression systems in E. coli do
not possess natural carbohydrate residues. By using recombinant OVA it was possible to examine
whether the natural single carbohydrate side chain composed of mannose and N-acetyl-
glucosamine on native OVA binds to SR-AI/II, or not (Fig. 4.18). The only possible mechanism for
recombinant OVA to be taken up by mDCs would be pinocytosis. Here, the uptake of recombinant
OVA and native OVA by Wt mDCs and SR-AI/II deficient mDCs was compared. The uptake level
of recombinant OVA by Wt mDCs was significantly less than that of native OVA (Fig. 4.23, A).
Furthermore, the uptake of recombinant OVA by SR-AI/II deficient mDCs is not reduced in
comparison to the uptake by Wt mDCs (Fig. 4.23, B) while the uptake of native OVA was reduced
by SR-AI/II deficiency (Fig. 4.18). These results indicate that SR-AI/II is engaged in the uptake of
native OVA by association with the single carbohydrate side chain of the allergen.

Results
76
recombinant OVAnative OVA
0.5 µg/ml 5 µg/ml
SR-I/II- mDCWt mDC
% o
f Max
A
B
FITC
% o
f Max
FITC
0.5 µg/ml 5 µg/ml
Fig 4.23 Uptake of recombinant OVA by Wt mDCs and SR-AI/II deficient mDCs
Wt mDCs or SR-AI/II deficient mDCs were incubated with 0.5 or 5 µg/ml of FITC-conjugated native or recombinant OVA
for 15 min. The uptake by CD11b+CD11c+ mDCs was measured by flow cytometry. A Uptake of native or recombinant
OVA by Wt mDCs. B Comparison of recombinant OVA uptake by Wt and SR-AI/II deficient mDCs. Gray areas represent
cells cultured with medium only. Graphs are representative of three independent experiments.
4.4.5 Role of SR-AI/II mediated OVA uptake by mDCs in the activation of OVA specific CD4+ T cells In this study it was found that (i) mDC uptake of AGE-OVA is greater than that of native or
thermally processed OVA and that (ii) SR-AI/II plays a key role in the increased uptake of AGE-
OVA by mDCs. Next, it was of interest whether the SR-AI/II mediated uptake of AGE-OVA
contributes to the enhanced CD4+ T cell immunogenicity of the allergen (chapters 4.3.1 and
4.3.2).
4.4.5.1 Verification of antigen uptake and T cell stimulatory capacity of SR-AI/II deficient mDCs First, it had to be verified that SR-AI/II deficient mDCs have the capacity to express similar levels
of co-stimulatory molecules and MHC II as Wt mDCs, since these molecules are essential for an
efficient T cell stimulation (chapter 1.12.1). Wt and SR-AI/II deficient mDCs were stimulated with
LPS, an inducer of DC maturation, and the expression of CD40, CD80 CD86 and MHC II on the
cell surface was measured by flow cytometry (chapter 3.2.4.1). As seen in Fig. 4.24, the co-
stimulatory and MHC II were comparably expressed on both Wt and SR-AI/II deficient mDCs. This

Results
77
result indicates that the T cell stimulatory capacity of SR-AI/II deficient mDCs is not affected by a
reduced ability to express surface molecules essential for T cell activation.
Additionally, the assessment of the uptake ability of mDCs using FITC conjugated Trf (Fig. 4.22)
showed that the uptake of Trf by SR-AI/II deficient mDCs was comparable to that of Wt mDCs.
Collectively these results show that SR-AI/II deficiency would not generally influence the antigen
uptake by and the T cell stimulatory ability of mDCs.
CD40 CD80
CD86 MHC II
SR-AI/II- mDC
WT mDC
SR-AI/II- mDC
WT mDC
% o
f Max
% o
f Max
Fig 4.24 Expression of co-stimulatory molecules by Wt and SR-AI/II deficient mDCs after LPS stimulation. Wt mDCs or SR-AI/II deficient mDCs were incubated with 10 µg/ml of LPS for 18 h. The expression of CD40, CD80, CD86
and MHC II on the cell surface of CD11b+CD11c+ mDCs was analysed by flow cytometry. Gray areas represent cells
cultured with medium only. Graphs are representative of three independent experiments.
4.4.5.2 The role of SR-AI/II in the activation of OVA specific CD4+ T cells The role of SR-AI/II mediated OVA uptake in the activation of OVA-specific CD4+ T cells was
determined by performing a T cell activation assay with SR-AI/II deficient mDCs in addition to Wt
mDCs (chapter 3.2.3.8.1). Wt or SR-AI/II deficient mDCs were incubated with 20 or 200 µg/ml of
native, thermally processed, recombinant or AGE-OVA for 3 h before the cells were fixed with
0.008% Glutaraldehyde. CD4+ T cells isolated from OT-2 mice were then cultured for 21 h in the
presence of the fixed mDCs. The IL-2 concentration in the culture supernatants was measured by
ELISA (chapter 3.2.4.5.2.1). Recombinant OVA was included as a further control to verify the
importance of the natural carbohydrate residues in the uptake of native OVA by SR-AI/II. The
protocol using mDC fixation was chosen to reduce the involvement of pinocytosis in the uptake of
these OVAs by mDCs.
Consistent with the previous result (Fig. 4.5), OT-2 CD4+ T cells cultured in the presence of Wt
mDCs showed a considerably stronger activation when stimulated with AGE-OVA than when
stimulated with native or thermally processed OVA (Fig. 4.25). A remarkable reduction of the IL-2

Results
78
production by OVA-specific CD4+ T cells in response to the allergens was observed if the T cells
were cultured in the presence of SR-AI/II-deficient mDCs instead of Wt mDCs. The decrease was
observed for native, thermally processed and AGE-OVA stimulated T cells (Fig. 4.25). The results
clearly indicate that SR-AI/II mediated uptake of OVA by mDCs is important for efficient OVA
specific CD4+ T cell activation. The CD4+ T cell activation induced by recombinant OVA cultured
with Wt mDCs is considerably lower than the activation induced by native OVA and is not affected
by the lack of SR-AI/II expression on the mDCs. This suggests that the non-recombinant OVAs
interact with SR-AI/II via their carbohydrate side chain as was also indicated by Fig. 4.23. Highly
interestingly, for the T cells which were added to SR-AI/II deficient mDCs instead of Wt mDCs an
enhanced activation in response AGE-OVA could no longer be observed. The abolishment of the
difference in the IL-2 production induced by native, thermally processed and AGE-OVA when
using SR-AI/II deficient mDCs suggests that the enhanced CD4+ T cell immunogenicity of AGE-
OVA in in vitro co-cultures is dependent on the expression of SR-AI/II by the mDCs. The basis for
the SR-AI/II dependent enhanced CD4+ T cell activation by AGE-OVA would be an increased
affinity of AGE-OVA to SR-AI/II due to the glycation structures as was also indicated in Fig. 4.21.
Additionally, the data shown in Fig 4.25 suggests that OVA taken up by mDCs via endocytosis by
SR-AI/II enters the MHC class II loading pathway which results in the presentation of the antigen
peptide for CD4+ T cells.
IL-2
(pg/
ml)
(µg/ml)
200
400
600
800
20 200 20 200 20 200 20 200Native OVA
Thermally processed OVA
AGE-OVA
0
WT mDCSR-A- /- mDC
Recomb. OVA
Fig. 4.25 The role of SR-AI/II in the AGE-OVA mediated enhanced CD4+ T cell activation Wt mDCs or SR-AI/II-deficient mDCs were incubated with native, thermally processed, recombinant or AGE-OVA for 3 h
and fixed with 0.008% glutaraldehyde before CD4+ T cells isolated from OT-2 mice were added and cultured for 21h. The
concentration of IL-2 in the culture supernatant was measured by ELISA. Error bars signify the SD of culture triplicates and
ELISA duplicates.

Results
79
4.4.6 Localisation of internalised AGE-OVA in mDCs As shown in Fig 4.25, SR-AI/II mediated uptake of AGE-OVA facilitates OVA specific CD4+ T cell
activation. CD4+ T cells are activated by recognition of antigenic peptide bound to MHC II on the
cell surface of DCs via the TCR. It was therefore hypothesised that SR-AI/II targets its ligands to
the MHC class II loading pathway in mDCs. To elucidate whether AGE-OVA endocytosed by SR-
AI/II is indeed targeted to the MHC class II loading pathway, the localisition of endocytosed AGE-
OVA in mDCs was analysed. To this end, immunofluorescence staining of cellular compartments
for the MHC class II loading pathway in AGE-OVA incubated mDCs was performed (chapter
3.2.4.3.1). The stained cells were then analysed using confocal laser scanning microscopy (LSM,
chapter 3.2.4.3).
First, the association of AGE-OVA with SR-AI/II was verified. mDCs were incubated with FITC
labelled AGE-OVA for 5 min and immediately fixed. SR-AI/II in the incubated cells was then
stained anti-SR-AI/II antibodies. As show in Fig 4.26, AGE-OVA did indeed co-localise with SR-
AI/II, confirming the association of AGE-OVA with the receptor.
FITC AGE-OVA SR-AI/II Merge + DAPI
Fig 4.26 Localisation of AGE-OVA and SR-AI/II in mDCs mDCs were incubated with 10 µg/ml of FTIC labelled AGE-OVA for 5 min and then fixed with 4% PFA. The cells were then
stained with polyclonal goat anti-SR-AI/II antibodies and Alexa 568 labelled monoclonal anti-goat IgG antibody. DAPI
(blue) was used to stain the nucleus. The arrowheads point to SR-AI/II co-localised with AGE-OVA.
Next, it was examined whether AGE-OVA and MHC II were found in the same cellular
compartments. mDCs were incubated with FITC labelled AGE-OVA for 15 min and stained with
anti-MHC II antibody. As shown in Fig 4.27 A, AGE-OVA and MHC II co-localised in mDCs. In
SR-AI/II deficient mDCs, only small amounts of AGE-OVA were found inside the cells and there is
little co-localisation with MHC II (Fig. 4.27 B). In MR-deficient mDCs, the co-localisation of AGE-
OVA with MHC class II molecules was, again, observed (Fig. 4.27 C). These results suggest that
AGE-OVA taken up by SR-AI/II enters compartments which also contain MHC II.

Results
80
FITC AGE-OVA MHC II Merge + DAPI
Wt mDC
MR-/- mDC
A
BSR-AI/II-/- mDC
C
Fig 4.27 Localisation of AGE-OVA and MHC II in Wt, SR-AI/II deficient and MR deficient mDCs A WT mDCs, B SR-AI/II deficient mDCs or C MR deficient mDCs were incubated with FITC labelled AGE-OVA for 15 min
and then fixed with 4% PFA. The cells were then stained with a monoclonal rat anti-MHC II antibody and Alexa 568
labelled monoclonal anti-rat IgG antibody. DAPI (blue) was used to stain the nucleus. The arrowheads indicate MHC II co-
localisation with AGE-OVA.
Multiple pathways regulate the targeting of antigens to MHC class II restricted presentation
(Chapter 1.9.2). Burgdorf et al have shown that pinocytosed native OVA is delivered to the late
endosomes/lysosomes in DCs, where antigenic peptides are generated by proteases and loaded
to MHC II. To elucidate whether AGE-OVA was targeted to the late endosomes/lysosomes in
mDCs here, the cells were incubated with FITC AGE-OVA for 15 to 60 min and then stained with

Results
81
anti-LAMP-1 antibody. LAMP-1 is a marker protein for the late endosomes/lysosomes. Here, co-
localisation of AGE-OVA with LAMP-1 could not be observed at any time point of the incubation
(Fig 4.28 A, showing 60 min incubation of AGE-OVA).
FITC AGE-OVA LAMP 1 Merge + DAPI
Fig 4.28 Localisation of AGE-OVA and LAMP-1 in mDCs Wt mDCs were incubated with FITC labelled AGE-OVA for 60 min and then fixed with 4% PFA. The cells were then
stained with monoclonal rat anti-LAMP1 antibody and Alexa 568 labelled monoclonal anti-rat IgG antibody to stain the
lysosome / late endosome. DAPI (blue) was used to stain the nucleus.
Several studies have shown that nascent MHC II is delivered from the ER, where they are
assembled, to the early endosomes (Villadangos et al., 2000; Benaroch et al., 1995) (chapter
1.10.3). To examine whether this may also be the case in mDCs, the cells were stained with anti-
MHC II antibody and anti-early endosome associated protein 1 (EEA1) antibodies. Consistent with
the previous studies, co-localisation of MHC II and EAA1 was observed in mDCs (Fig. 4.29).
MHC II Merge + DAPIEEA
1
Fig 4.29 Localisation of MHC II and EEA1 in mDCs Wt mDCs were fixed with 4% PFA. The cells were then stained with a monoclonal rat anti-mouse MHC II antibody and
polyclonal rat anti-EEA1 antibodies followed by Alexa 568 labelled monoclonal anti-rat IgG antibody and Cy3 labelled
monoclonal anti-rabbit IgG antibody to stain MHC II and the early endosomes, respectively. DAPI (blue) was used to stain
the nucleus. The arrowheads indicate MHC II co-localisation with EEA1.

Results
82
Next it was elucidated whether AGE-OVA had also been delivered to the early endosomes.
Therefore mDCs were incubated with FITC conjugated AGE-OVA for 15 min followed by staining
with anti-EAA1 antibodies. A clear co-localisation of AGE-OVA with EAA1 was observed (Fig 4.30
A). Burgdorf et al have shown that the MR targets OVA to the early endosomes (Burgdorf et al.,
2007). To eliminate involvement of MR mediated targeting to the early endosome, MR deficient
mDCs were also stained with anti-EAA1 antibodies after incubation with AGE-OVA. As shown in
Fig 4.30 B, AGE-OVA was found in the early endosomes even in MR deficient mDCs. These
results suggest that SR-AI/II, as the only other main receptor involved in AGE-OVA uptake,
targets AGE-OVA to the early endosomes, in which MHC II was also found (Fig. 4.29).
FITC AGE-OVA EEA1 Merge + DAPI
Wt mDC
MR-/- mDC
A
B
Fig 4.30 Localisation of AGE-OVA and EEA1 in Wt and MR deficient mDCs A WT mDCs or B MR deficient mDCs were incubated with AGE-OVA and then fixed with 4% PFA. The cells were stained
with polyclonal rabbit anti-EEA1 antibodies and Cy3 labelled monoclonal anti-rabbit IgG antibody. DAPI (blue) was used to
stain the nucleus. The arrowheads indicate co-localisation of EEA1 with AGE-OVA.

Results
83
4.7 Influence of glycation by the Maillard reaction on the T cell immunogenicity and antigenicity of OVA in vivo
As demonstrated in chapter 4.3, the glycation of OVA by the Maillard reaction significantly
enhanced the CD4+ T cell immunogenicity of the allergen in vitro. Next, it was investigated
whether AGE-OVA has a higher CD4+ T cell immunogenicity and antigenicity (the ability to induce
antibody production) than native OVA and thermally processed OVA in vivo. It was of particular
interest to see whether AGE-OVA has a higher potential to induce allergen specific IgE antibodies,
as this immunoglobulin is a critical component in the pathophysiology of (food) allergy (chapter
1.2). BL6 mice were used for the in vivo experiments since the SR-AI/II and RAGE deficient mice
used for the in vitro study were generated on this genetic background.
4.7.1 Assessment of the T cell immunogenicity of AGE-OVA by subcutaneous immunisation of mice
First, subcutaneous (sc) immunisation was performed to examine the CD4+ T cell immunogenicity
of all three OVAs in vivo (chapter 3.2.5.5.2). The method efficiently induces activation of antigen
specific CD4+ T cells in the draining lymph nodes (LN) by only one immunisation. Mice were sc
immunised with native, thermally processed or AGE-OVA together with the adjuvant TiterMax
Gold®. Seven days after immunisation, CD4+ T cells were isolated from the LN using a magnetic
cell sorting system (chapter 3.2.3.7). The T cells were co-cultured with mDCs, and stimulated with
the OVAs for 24 h. As a positive control for the assay, CD4+ T cells were incubated with
concanavalin A (Con A) which is a lectin with mitogenic properties, i.e. it induces antigen
unspecific activation and proliferation of T cells. In order to assess the level of CD4+ T cell
activation, the IL-2 concentration in the cell culture supernatants was measured (chapter
3.2.4.5.2.1).
The sc immunisation efficiently induced activation of antigen specific CD4+ T cells in the LNs (Fig.
4.31). CD4+ T cells from all three immunisation groups displayed a greater IL-2 production upon
ex vivo recall stimulation with AGE-OVA compared to the recall stimulation with native or
thermally processed OVA. Furthermore, CD4+ T cells isolated from AGE-OVA immunised mice
produced considerably higher levels of IL-2 in response to AGE-OVA than T cells from mice
immunised with native or thermally processed OVA. The results suggest that AGE-OVA has a
higher T cell immunogenicity than native OVA and thermally processed OVA not only in vitro but
also in vivo.

Results
84
Medium 2 20 200OVA concentration (µg/ml)
Medium 2 20 200OVA concentration (µg/ml)
Medium 2 20 200OVA concentration (µg/ml)
0
200
400
600
1000
800
1200
1400IL
-2 (p
g/m
l)
0
200
400
600
1000
800
1200
1400
IL-2
(pg/
ml)
0
200
400
600
1000
800
1200
1400
IL-2
(pg/
ml)
native OVAthermally processed OVAAGE-OVA
native OVA immunisation
thermally processed OVA immunisation
AGE-OVA immunisation
Fig. 4.31 LN CD4+ T cell activation induced by subcutaneous injection of AGE-OVA in BL6 mice
BL6 mice (n=3) were subcutaneously immunised with 100 µg of native, thermally processed or AGE-OVA. Seven days
after immunisation, CD4+ T cells were isolated from the LN, co-cultured with mDCs and stimulated with either form of the
OVA for 24 h. The IL-2 concentration in the culture supernatants was determined by ELISA. IL-2 production by CD4+ T
cells stimulated with Con A (2.5 µg/ml) was comparable among all immunisation groups. Error bars signify the SD of cell
culture triplicates and ELISA duplicates.
4.7.2 Assessment of the T cell immunogenicity and antigenicity of AGE-OVA using intraperitoneal immunisation of mice
Next, the T cell immunogenicity and antigenicity of AGE-OVA was assessed by intraperitoneal (ip)
immunisation of BL6 mice with the glycated or unglycated forms of the allergen. In mice, the
usage of an adjuvant is generally required to induce a robust IgE production. Therefore, for the
assessment of the antigenicity of AGE-OVA, the mice were immunised with the allergen in
combination with the adjuvant aluminium hydroxide (Alum) which efficiently facilitates the
production of antigen specific IgE and IgG antibodies (Cox and Coulter, 1997). BL6 mice were
immunised ip with 50 µg of native, thermally processed or AGE-OVA in combination with 2 mg
Alum (chapter 3.2.5.5.1). The mice were immunised three times to induce detectable level of
allergen specific IgE antibodies. The second and third immunisations were performed two weeks
and three weeks after the first immunisation, respectively. As controls, mice were immunised with
Alum in PBS only.

Results
85
4.7.2.1 Assessment of the T cell immunogenicity of AGE-OVA by ip immunisation of mice First, the T cell immunogenicity of all three OVAs in ip immunised mice was assessed. One week
after the final immunisation, CD4+ T cells isolated from the spleen were co-cultured with
mitomycin C (MMC) treated splenocytes (used as antigen presenting cells) and stimulated with
native, thermally processed or AGE-OVA for 96 hours. Proliferation of T cells during the final 20 h
was assessed by measuring the incorporation of [3H-methly]-thymidine into the cells (chapter
3.2.3.11).
CD4+ T cells isolated from mice after three ip immunisations with either of the OVAs showed
comparable levels of proliferation in response to native, thermally processed and AGE-OVA (Fig.
4.32). Due to the multiple immunisation, the maximum in vivo level of T cell responses to the
antigens could have been induced, which may lead to the comparable levels of T cell activation in
all immunisation groups.
Con A 2 20 200OVA concentration (µg/ml)
Con A 2 20 200OVA concentration (µg/ml)
Con A 2 20 200OVA concentration (µg/ml)
0
Stim
ulat
ion
inde
x
5
15
10
20
25
0
Stim
ulat
ion
inde
x
5
15
10
20
25
0
Stim
ulat
ion
inde
x
5
15
10
20
25
native OVAthermally processed OVAAGE-OVA
native OVAthermally processed OVAAGE-OVA
native OVA immunisation
thermally processed OVA immunisation
AGE-OVA immunisation
Fig. 4.32 Splenic CD4+ T cell activation induced by ip immunisation of BL6 mice BL6 mice (n=3) were ip immunised with native, thermally processed or AGE-OVA. Seven days after the third immunisation
splenic CD4+ T cells were purified from the immunised mice. The T cells were co-cultured with MMC treated splenocytes
from naïve BL6 mice and stimulated with either of the OVAs for 96 h. Proliferation of the T cells during the final 20 h was
assessed by measuring incorporation of [3H-methly]-thymidine into the cells. The proliferation is shown as stimulation
index. Error bars signify the SD of cell culture triplicates. The data shown represents two independent experiments

Results
86
4.7.2.2 Assessment of the antigenicity of AGE-OVA by intraperitoneal immunisation of mice Next, the antigenicity of the OVAs in ip immunised mice was examined. Seven days after each
immunisation serum samples were collected (chapter 3.2.5.4.). The levels of IgG1, IgG2a and IgE
antibodies specific for native, thermally processed or AGE-OVA in the sera of individual mice
were measured by ELISA (chapter 3.2.4.4.1.1).
First, the allergen specific IgG1 and IgG2a antibodies in the sera of the immunised mice were
measured. The levels of allergen specific IgG1 antibodies in the sera of the mice which had
received only one ip immunisation with the OVAs was very low (data not shown). After the second
ip immunisation a robust allergen specific IgG1 antibody production was observed. The level of
IgG1 antibodies binding to native, thermally processed, or AGE-OVA was almost comparable in
all three immunisation groups (Fig. 4.33).
Small differences were observed in IgG2a production (Fig. 4.34). The production of IgG2a
appears to be a bit higher in three mice of the AGE-OVA immunised group. Also, the binding of
IgG2a to AGE-OVA from native and thermally processed OVA is a little reduced compared to
binding to the unglycated OVA forms (Fig. 4.34,C). Compared to the levels of allergen specific
IgG1 antibodies, those of specific IgG2a antibodies were significantly lower in the immunised
mice. In mice, IgG antibodies are classified into IgG1, IgG2a, IgG2b and IgG3. IgG1 antibody
production is mediated by Th2 cells, whereas IgG2a antibody production is mediated by Th1 cells.
As Alum predominantly induces Th2 cell responses, IgG1 antibody production would be dominant
in the immunised mice (Cox and Coulter, 1997).
To examine whether glycation structures influence T cell differentiation in vivo, the IgG1/IgG2a
ratio for each immunised mouse was calculated. AGE-OVA induced a slightly lower IgG1/IgG2a
ratio than immunisation with the control OVAs (Fig. 4.35). However, the difference was not
considerable. These results suggest that AGE-OVA would not have any influence on the T cell
differentiation in vivo, which is consistent with the in vitro data (Fig. 4.10).

Results
87
0,0
Mea
nO
D
0,5
1,51,0
2,02,5
3,53,0
4,54,0
103
108105
106
serum dilution
107102 104
100 109
0,0
Mea
nO
D
0,5
1,51,0
2,02,5
3,53,0
4,54,0
0,0
Mea
nO
D
0,5
1,51,0
2,02,5
3,53,0
4,54,0
103 108105 106
serum dilution10
7102 10
410
010
910
310810
510
6
serum dilution107102 10
4100 109
0,0
Mea
nO
D
0,5
1,51,0
2,02,5
3,53,0
4,54,0
0,0
Mea
nO
D
0,5
1,51,0
2,02,5
3,53,0
4,54,0
0,0
Mea
nO
D
0,5
1,51,0
2,02,5
3,53,0
4,54,0
103
108105 106
serum dilution107102 10
4100 10
9
103
108105
106
serum dilution107102 10
4100 109103 10
8105 106
serum dilution10
7102 10
4100 109
0,0
Mea
nO
D
0,5
1,51,0
2,02,5
3,53,0
4,54,0
0,0
Mea
nO
D
0,5
1,51,0
2,02,5
3,53,0
4,54,0
0,0
Mea
nO
D
0,5
1,51,0
2,02,5
3,53,0
4,54,0
103
108105
106
serum dilution107102 10
4100 109 103 10
810
5106
serum dilution107102 10
410
0109103 10
8105 106
serum dilution10
7102 10
4100 109
A
B
C
native OVA immunisation
thermally processed OVA immunisation
AGE-OVA immunisation
mouse 1 mouse 2 mouse 3mouse 4mouse 5mouse 6NC 1 NC 2
Fig. 4.33 Allergen specific IgG1 production in BL6 mice after the second ip immunisation with native, thermally processed or AGE-OVA BL6 mice (n=6) were ip immunised with 50 µg of native, thermally processed or AGE-OVA with 2 mg Alum three times.
One week after the second immunisation, blood was harvested from the mice. A The level of anti-native OVA IgG1
antibodies in the sera was measured using ELISA plates coated with the native allergen. B The level of anti-thermally
processed OVA specific IgG1 antibodies in the sera was measured using plates coated with thermally processed OVA. C
The level of anti-AGE-OVA IgG1 antibodies in the sera was measured using plates coated with glycated OVA. NC1 and
NC2; mice immunised with PBS and Alum alone.

Results
88
103 108105 106
serum dilution
107102 104100 109 103 108105 106
serum dilution107102 10
4100 109 103 108105 106
serum dilution107102 10
4100 109
103 108105 106
serum dilution107102 10
4100 109 103 108105 106
serum dilution107102 10
4100 109 103 108105 106
serum dilution107102 104100 109
103 108105 106
serum dilution
107102 104
100 109 103 108105 106
serum dilution107102 104100 109 103 108105 106
serum dilution107102 10
4100 109
A
B
C
Mea
nO
D
0,5
1,5
2,0
2,5
3,5
3,0
1,0
0,0
Mea
nO
D
0,5
1,5
2,0
2,5
3,5
3,0
1,0
0,0
Mea
nO
D
0,5
1,5
2,0
2,5
3,5
3,0
1,0
0,0
Mea
nO
D
0,5
1,5
2,0
2,5
3,5
3,0
1,0
0,0
Mea
nO
D
0,5
1,5
2,0
2,5
3,5
3,0
1,0
0,0
Mea
nO
D
0,5
1,5
2,0
2,5
3,5
3,0
1,0
0,0
Mea
nO
D
0,5
1,5
2,0
2,5
3,5
3,0
1,0
0,0
Mea
nO
D
0,5
1,5
2,0
2,5
3,5
3,0
1,0
0,0
Mea
nO
D
0,5
1,5
2,0
2,5
3,5
3,0
1,0
0,0
native OVA immunisation
thermally processed OVA immunisation
AGE-OVA immunisation
mouse 1 mouse 2 mouse 3mouse 4mouse 5mouse 6NC 1 NC 2
Fig. 4.34 Allergen specific IgG2a antibody production in BL6 mice after the second ip immunisation with native, thermally processed or AGE-OVA. BL6 mice (n=6) were ip immunised with 50 µg of native OVA, thermally processed OVA or AGE-OVA with 2 mg Alum
three times. One week after the second immunisation, blood was harvested from the mice. A The level of anti-native OVA
IgG2a antibodies in the sera was measured using ELISA plates coated with the native allergen. B The level of anti
thermally processed OVA specific IgG2a antibodies in the sera was measured using plates coated with thermally
processed OVA. C The level of anti-AGE-OVA IgG2a antibodies in the sera was measured using plates coated with
glycated OVA. NC1 and NC2; mice immunised with PBS and Alum alone.

Results
89
0
IgG
1/Ig
G2a
2
4
6
8
10
0
IgG
1/Ig
G2a
2
4
6
8
10
0
IgG
1/Ig
G2a
2
4
6
8
10native OVA coated plate
thermally processed OVA coated plate AGE-OVA coated plate
Fig. 4.35 IgG1/IgG2a ratio in BL6 mice after the second ip immunisation with native, thermally processed or AGE-OVA The IgG1/IgG2a ratio in individual mouse ip immunised with native, thermally processed, or AGE-OVA, was calculated
using the allergen concentration at 50% of the maximum absorption in the ELISA for measurement of IgG1 (Fig. 4.33) and
IgG2a levels (Fig 4.34). Each dot represents the IgG1/IgG2a ratio of an individual mouse. Horizontal bars represent the
mean for each group.
Finally, the allergen specific IgE antibodies in the sera of ip immunised mice were measured.
AGE-OVA induced significantly higher levels of allergen specific IgE antibodies than native and
thermally processed OVA (Fig. 4.36). Furthermore, the IgE antibodies from AGE-OVA immunised
mice bound equally well to native, thermally processed and AGE-OVA. These results strongly
suggest that the glycation of OVA by the Maillard reaction could enhance the antigenicity of the
egg white allergen to induce allergen specific IgE antibodies and antibodies from mice immunised
with AGE-OVA not only recognise the glycated allergen but also the unglycated forms.

Results
90
105104
serum dilution101 10
3100
native OVA immunisation
thermally processed OVA immunisation
AGE-OVA immunisation
102
105104
serum dilution101 10
3100 10
2105104
serum dilution101 103100 10
2
105104
serum dilution101 103100 10
2105104
serum dilution101 10
3100 10
2105104
serum dilution101 10
3100 10
2
105104
serum dilution101 10
3100 102 105104
serum dilution101 10
3100 10
2105104
serum dilution101 10
3100 10
2
0,0
Mea
nO
D
0,5
1,5
2,0
1,0
A
B
C
0,0
Mea
nO
D
0,5
1,5
2,0
1,0
0,0
Mea
nO
D
0,5
1,5
2,0
1,0
0,0
Mea
nO
D
0,5
1,5
2,0
1,0
0,0
Mea
nO
D
0,5
1,5
2,0
1,0
0,0
Mea
nO
D
0,5
1,5
2,0
1,0
0,0
Mea
nO
D
0,5
1,5
2,0
1,0
0,0
Mea
nO
D
0,5
1,5
2,0
1,0
0,0
Mea
nO
D
0,5
1,5
2,0
1,0
mouse 1 mouse 2 mouse 3mouse 4mouse 5mouse 6NC 1 NC 2
Fig. 4.36 Allergen specific IgE antibody production in BL6 mice after the second ip immunisation with native, thermally processed or AGE-OVA BL6 mice (n=6) were ip immunised with 50 µg of native OVA, thermally processed OVA or AGE-OVA with 2 mg Alum
three times. One week after the second immunisation, blood was harvested from the mice. A The level of anti-native OVA
IgE antibodies in the sera was measured using ELISA plates coated with the native allergen. B The level of anti-thermally
processed OVA IgE antibodies in the sera was measured using plates coated with thermally processed allergen. C The
level of anti-AGE-OVA IgE antibodies in the sera was measured using plates coated with glycated OVA. NC1 and NC2;
mice immunised with PBS and Alum alone.

Results
91
4.8 Analysis of AGE-rAra h 2 Peanuts are one of the most common causes of severe allergic reactions to food. It has been
shown that the Maillard reaction occurs during thermal processing of peanuts as the nuts contain
many carbohydrates such as glucose and galactose (Maleki et al., 2001, Chung et al., 2003).
Since peanuts are usually not eaten raw but roasted, fried or boiled, it is of importance to
investigate how the Maillard reaction influences the T cell immunogenicity and antigenicity of
peanut allergens such as one of the major allergens Ara h 2. Our collaborator, the Department of
Allergology at the Paul-Ehrlich-Institut, has succeeded in producing recombinant Ara h 2 (rAra h
2) using an expression system in E.coli. Here, it was investigated whether the Maillard reaction
influences the T cell immunogenicity and antigenicity of Ara h 2 by using the recombinant protein.
First, it was examined whether the type of carbohydrate present during thermal processing has an
influence on the formation of glycation structures on glycated Ara h 2 (AGE-Ara h 2). rAra h 2 was
incubated with glucose, galactose, fructose, lactose, maltose or mannose at 120°C for 2h (chapter
3.2.2.1.1). ELISAs were performed to analyse the glycation structures on rAra h 2 after thermal
processing with the different carbohydrates (chapter 3.2.4.4.1.2). Independent of the carbohydrate
used for the process, high levels of CML and GA-pyridine were detected on AGE-Ara h 2 (Fig.
4.37), while pyrraline and CEL were not detected by the ELISAs. Galactose, which is naturally
contained in peanuts, induced a higher level of GA-pyridine than the other carbohydrates and was
also very potent in inducing CML. Therefore, galactose, which is found in peanuts (Rudrapatnam
et al., 197), was used in the preparation of AGE-Ara h 2 for the subsequent studies.

Results
92
GA-pyridineCEL
pyrralineCML
0,1 1 10 100 1000
rAra h 2 concentration (µg/ml)
0,1 1 10 100 1000
rAra h 2 concentration (µg/ml)
0,1 1 10 100 1000
rAra h 2 concentration (µg/ml)
0,1 1 10 100 1000
rAra h 2 concentration (µg/ml)
0,0
0,5
1,0
1,5
2,0
2,5M
ean
OD
0,0
0,5
1,0
1,5
2,0
2,5
Mea
n O
D
0,0
0,5
1,0
1,5
2,0
2,5
Mea
n O
D
0,0
0,5
1,0
1,5
2,0
2,5
Mea
n O
D
untreatedheat processedlactoseglucosegalactosemannosefructosemaltose
Fig. 4.37 Glycation structures on AGE-rAra h 2 produced by the Maillard reaction. AGE-rAra h 2 was prepared by incubating 500 µg/ml of rAra h 2 with 0.1M lactose, glucose, galactose, mannose, fructose
or maltose in PBS at 120°C for 2h. The glycation structures on rAGE-Ara h 2 were analysed by ELISA. Unprocessed
Ara h 2 and Ara h 2 thermally processed without carbohydrates were used as controls.
To examine whether the thermal processing with or without galactose at 120°C influences the
secondary structure of rAra h 2, CD spectroscopy was performed (chapter 3.2.2.5). The mean
molar elipticity and the exact protein concentration were included for the evaluation of the spectra.
Consistent with the CD spectrum of native rAra h 2 isolated from peanut extracts (Lehmann et al,
2006), unprocessed rAra h 2 had its maximum at 190 to 193 nm and its minima at 208 – 210 and
222 nm (Fig. 4.38). The result indicates that α-helices dominate the secondary structure of the
protein. The CD spectrum of rAra h 2 incubated at 120°C with or without galactose significantly
differed from that of the unprocessed allergen. The minima of thermally processed and AGE-Ara h
2 were at 199 and 198 nm respectively (Fig 4.38). The result suggests that (i) thermal processing

Results
93
of rAra h 2 at 120°C leads to a destruction of the α-helical structures, and that (ii) the protein
structure of the processed allergen is dominated by random coils.
170 180 190 200 210 220 230 240 250 260
Mea
nm
olar
elli
ptic
itype
r res
idue
q m.r.
w.
[mde
gx
cm2
x dm
ol-1
]
10000
20000
30000
- 10000
- 20000
- 30000
wavelenght (nm)
Untreated rAra h 2Thermally processed rAra h 2AGE-rAra h 2
0
Fig 4.38 Analysis of AGE-rAra h 2 by CD spectroscopy rAra h 2 was incubated with and without galactose at 120°C for 2h. The CD spectrum of unprocessed, thermally
processed and AGE- rAra h 2 was analysed.
4. 9 Influence of glycation by the Maillard reaction on the T cell immunogenicity and antigenicity of rAra h 2
C3H/HeJ mice are a high responder mouse strain for Ara h 2 (Li et al., 2000; Proust et al., 2008).
To examine whether the glycation of rAra h 2 by the Maillard reaction influences the T cell
immunogenicity and antigenicity of this major peanut allergen, C3H/HeJ mice were ip immunised
with 5 µg of unprocessed, thermally processed or AGE-rAra h 2 together with 2 mg Alum in 200 µl
PBS (chapter 3.2.5.5.1). Two and three weeks after the first immunisation, the mice were boosted
with 1 µg of the allergen together with 1 mg Alum. As controls, mice were immunised with Alum in
PBS only.
4.9.1 Assessment of the T cell immunogenicity of AGE-rAra h 2 by ip immunisation of mice
To assess the T cell immunogenicity of AGE-rAra h 2, mice were sacrificed one week after the
final immunisation and CD4+ T cells were isolated from the spleen of immunised mice. The

Results
94
proliferation of splenic CD4+ T cells in response to unprocessed, thermally processed or AGE-
rAra h 2 was measured (chapter 3.2.3.11).
As show in Fig. 4.39, stimulation with Con A induced comparable levels of proliferation of CD4+ T
cells from all three groups. Therefore it was feasible to compare the levels of proliferation of CD4+
T cells from the mice immunised with the different forms of rAra h 2. The stimulation index was
highest for splenic CD4+ T cells from all three groups when re-stimulated with unprocessed rAra h
2. This indicates, that unprocessed rAra h 2 is the best stimulator of proliferation of T cells purified
from rAra h 2 immunised mice, independent of the form of rAra h 2 used for immunisation. The
data suggests that the CD4+ T cell immunogenicity of AGE-rAra h 2 is lower than that of
unprocessed rAra h 2 and thermally processed Ara h 2 in C3H/HeJ mice.
Untreated rAra h 2thermally processed rAra h 2 AGE-rAra h 2
Untreated rAra h 2thermally processed rAra h 2 AGE-rAra h 2
Con A 1 10 rAra h 2 concentration (µg/ml)
Con A 1 10 rAra h 2 concentration (µg/ml)
Con A 1 10 rAra h 2 concentration (µg/ml)
0
10
20
30
50
40
Stim
ulat
ion
inde
x
0
10
20
30
50
40St
imul
atio
n in
dex
0
10
20
30
50
40
Stim
ulat
ion
inde
x
unprocessed rAra h 2 immunisation
thermally processed rAra h 2 immunisation
AGE-rAra h 2 immunisation
Fig 4.39 Allergen specific proliferation of CD4+ T cells from mice after ip immunisation with unprocessed, thermally processed or AGE-rAra h 2 C3H/HeJ mice (n=4) were ip immunised with unprocessed, thermally processed or AGE-rAra h 2 together with Alum three
times. Splenic CD4+ T cells were isolated from immunised mice, co-cultured with irradiated syngeneic splenocytes and
stimulated with either form of rAra h 2 for 96 h. Proliferation of T cells during the final 20 h was assessed by measuring
the incorporation of [3H-methly]-thymidine by the cells. The level of proliferation is indicated as stimulation index. Error
bars signify the SD of cell culture triplicates.
4.9. 2 Cytokine production of CD4+ T cells from the mice after receiving ip immunisation with unprocessed, thermally processed or AGE-rAra h 2
To assess whether AGE-rAra h 2 influences the CD4+ T cell differentiation in vivo, the cytokine
production of splenic CD4+ T cells from mice immunised with unprocessed, thermally processed

Results
95
or rAGE-Ara h 2 was examined. The concentration of Th1 type cytokine IFN-γ and Th2 type
cytokine IL-4 in the culture supernatant of CD4+ T cells after 72h incubation with either form of
rAra h 2 was measured by ELISA (chapter 3.2.4.5.2.1).
Unprocessed rAra h 2 induced the highest secretion of both IFN-γ and IL-4 by CD4+ T cells,
independent of which mouse group these were isolated from (Fig. 4.40 A and B). The cytokine
production by CD4+ T cells stimulated with thermally processed or AGE-Ara h 2 was comparable
for all three immunisation groups. The level of cytokine production and proliferative responses of
isolated CD4+ T cells (Fig. 4.39) corresponded well. Collectively these results suggest that the
glycation structures on AGE-rAra h 2 do not influence on the T cell differentiation in C3H/HeJ
mice.

Results
96
A
B
Untreated rAra h 2thermally processed rAra h 2 AGE-rAra h 2
Untreated rAra h 2thermally processed rAra h 2 AGE-rAra h 2
Medium Con A 1 10 rAra h 2 concentration (µg/ml)
0
20000
IFN
-g (p
g/m
l)
40000
60000
80000
0
20000
IFN
-g (p
g/m
l)
40000
60000
80000
0
20000
IFN
-g (p
g/m
l)
40000
60000
80000
Medium Con A 1 10 rAra h 2 concentration (µg/ml)
Medium Con A 1 10 rAra h 2 concentration (µg/ml)
unprocessed rAra h 2 OVA immunisation
thermally processed rAra h 2 immunisation
AGE-rAra h 2 immunisation
Untreated rAra h 2thermally processed rAra h 2 AGE-rAra h 2
Untreated rAra h 2thermally processed rAra h 2 AGE-rAra h 2
Medium Con A 1 10 rAra h 2 concentration (µg/ml)
0Medium Con A 1 10
rAra h 2 concentration (µg/ml)
Medium Con A 1 10 rAra h 2 concentration (µg/ml)
0
2000
IL-4
(pg/
ml)
4000
6000
8000
00
2000
IL-4
(pg/
ml)
4000
6000
8000
00
2000
IL-4
(pg/
ml)
4000
6000
8000
unprocessed rAra h 2 OVA immunisation
thermally processed rAra h 2 immunisation
AGE-rAra h 2 immunisation
Fig 4.40 Cytokine production of CD4+ T cells from mice immunised with unprocessed, thermally processed or AGE-Ara h 2. C3H/HeJ mice (n=4) were ip immunised with unprocessed, thermally processed or AGE-rAra h 2 with Alum three times.
Splenic CD4+ T cells were isolated from immunised mice. The T cells were co-cultured with irradiated syngeneic
splenocytes and stimulated with either form of rAra h 2 for 72h. The concentration of A IFN-γ and B IL-4 in the culture
supernatants was measured by ELISA. Error bars signify the SD of cell culture triplicates and ELISA duplicates.

Results
97
4.9.3 Assessment of the antigenicity of AGE-rAra h 2 by ip immunisation of mice
For the assessment of the antigenicity of AGE-rAra h 2, serum harvested seven days after the last
immunisation was used. The experiments to examine the antigenicity of AGE-rAra h 2 were
performed twice.
The levels of IgG1 and IgG2a antibodies specific for unprocessed rAra h 2 in the sera of
immunised mice were measured by ELISA (chapter 3.2.4.4.1.1). Both independent experiments
showed that immunisation with unprocessed rAra h 2 and Ara h 2 thermally processed without
galactose induced higher rAra h 2 specific IgG1 and IgG2a antibodies in mice, compared to
immunisation with AGE-rAra h 2 (Fig. 4.41, A and B and Fig. 4.42, A and B). The results indicate
that in C3H/HeJ mice the potential of AGE-rAra h 2 to induce allergen specific IgG was lower than
that of unprocessed and thermally processed Ara h 2.
Next, the level of IgE antibodies specific for unprocessed rAra h 2 in the sera of immunised mice
was measured. In both experiments, the level of anti-unprocessed rAra h 2 IgE antibodies in the
sera of AGE-rAra h 2 immunised mice was lower than that in the sera of mice immunised with
unprocessed or thermally processed rAra h 2 (Fig. 4.41 C and Fig. 4.42 C). Since the amount of
thermally processed rAra h 2 and AGE-rAra h 2 was limited, the levels of anti- thermally
processed rAra h 2 and anti-AGE-rAra h 2 IgE antibodies could only be measured for experiment
1. In this experiment, IgE antibodies in the serum of several mice immunised with unprocessed,
thermally processed or AGE-rAra h 2 exihibited IgE antibodies binding to unprocessed rAra h 2
but not to AGE-rAra h 2 (Fig. 4.43). Only one mouse immunised with thermally processed rAra h 2
had serum IgE antibodies which had binding activity to the glycated allergen. The results suggest
that glycation of rAra h 2 results in a decrease of the antigenicity of the allergen and also reduces
recognition of the allergen by IgE antibodies specific for the unglycated forms of rAra h 2.

Results
98
Mea
nO
DA
B
0
5
2
3
1
4
Mea
nO
D
Mea
nO
D
0
5
2
3
1
4
Mea
nO
D
0
5
2
3
1
4
0
2
3
1
4
Mea
nO
D
0
2
3
1
4
Mea
nO
D
0
2
3
1
4
103 108105 106
serum dilution
107102 104100 109 103 108105 106
serum dilution107102 10
4100 109 103 108105 106
serum dilution107102 10
4100 109
103 108105 106
serum dilution
107102 104100 109 103 108105 106
serum dilution107102 10
4100 109 103 108105 106
serum dilution107102 104100 109
unprocessed rAra h 2 immunisation
thermally processed rAra h 2 immunisation
AGE-rAra h 2 immunisation
105104
serum dilution101 103100 102 105104
serum dilution101 103100 102 105104
serum dilution101 103100 102
Mea
nO
D
0,0
0,5
1,5
2,0
1,0
Mea
nO
D
0,0
0,5
1,5
2,0
1,0
Mea
nO
D
0,0
0,5
1,5
2,0
1,0
C
mouse 1mouse 2mouse 3mouse 4 NC
Fig. 4.41 Detection of rAra h 2 specific IgG1, IgG2a and IgE antibody production in mice after ip immunisation with unprocessed, thermally processed or AGE-rAra h 2 in Experiment 1 C3H/HeJ mice (n=4) were ip immunised with unprocessed, thermally processed or AGE-rAra h 2 with Alum three times.
The levels of A IgG1, B IgG2a and C IgE binding to unprocessed rArah2 in the sera of immunised mice was determined
by ELISA using plates coated with unprocessed rAra h 2. NC; mouse immunised with PBS and Alum only.

Results
99
103 108105 106
serum dilution
107102 104100 109 103 108105 106
serum dilution107102 10
4100 109 103 108105 106
serum dilution107102 10
4100 109
103 108105 106
serum dilution
107102 104100 109 103 108105 106
serum dilution107102 104100 109 103 108105 106
serum dilution107102 104100 109
105104
serum dilution101 103100 102 105104
serum dilution101 103100 102 105104
serum dilution101 10
3100 102
Mea
nO
DA
B
0
2
3
1
4
Mea
nO
D
0
2
3
1
4
Mea
nO
D
0
2
3
1
4M
ean
OD
0
2
3
1
4
Mea
nO
D
0
2
3
1
4
Mea
nO
D
0
2
3
1
4
Mea
nO
D
0
1,0
1,5
0,5
2,0
Mea
nO
D
0
1,0
1,5
0,5
2,0
Mea
nO
D
0
1,0
1,5
0,5
2,0C
unprocessed rAra h 2 immunisation
thermally processed rAra h 2 immunisation
AGE-rAra h 2 immunisation
mouse 1 mouse 2 mouse 3mouse 4mouse 5mouse 6NC 1 NC 2
Fig 4.42 Detection of Ara h 2 specific IgG1, IgG2a and IgE antibody production in mice after ip immunisation with unprocessed, thermally processed or rAGE-Ara h 2 in Experiment 2. C3H/HeJ mice (n=6) were ip immunised with unprocessed, thermally processed or AGE-rAra h 2 plus Alum three times.
The levels of A IgG1, B IgG2a and C IgE binding to unprocessed rArah2 in the sera of immunised mice was determined
by ELISA using plates coated with unprocessed rAra h 2. NC; mouse immunised with PBS and Alum only.

Results
100
105104
serum dilution101 10
3100 10
2105104
serum dilution101 10
3100 10
2105104
serum dilution101 10
3100 102
105104
serum dilution101 10
3100 10
2105104
serum dilution101 103100 10
2105104
serum dilution101 10
3100 10
2
Mea
nO
D
0,0
0,5
1,5
2,0
1,0
2,5
Mea
nO
D
0,0
0,5
1,5
2,0
1,0
2,5
Mea
nO
D
0,0
0,5
1,5
2,0
1,0
2,5
Mea
nO
D
0,0
0,5
1,5
2,0
1,0
2,5M
ean
OD
0,0
0,5
1,5
2,0
1,0
2,5
Mea
nO
D
0,0
0,5
1,5
2,0
1,0
2,5
A
B
unprocessed rAra h 2 immunisation
thermally processed rAra h 2 immunisation
AGE-rAra h 2 immunisation
mouse 1mouse 2mouse 3NC
Fig. 4.43 Allergen specific IgE antibody production in C3H/HeJ mice after ip immunisation with unprocessed, thermally processed or AGE-rAra h 2 in Experiment 1 C3H/HeJ mice were ip immunised with unprocessed, thermally processed or AGE-rAra h 2 plus Alum three times. A The
levels of anti-thermally processed rAra h 2 specific IgE antibodies in the sera of the mice was measured using plates
coated with the processed allergen. B The levels of anti-AGE-rAra h 2 specific IgE antibodies in the sera of the mice was
measured using plates coated with the glycated allergen. NC; mouse immunised with PBS and Alum only.

Discussion
101
5. Discussion The majority of our food is modified by physical and chemical events during storage and
processing. The formation of AGEs produced by the Maillard reaction during the thermal
processing or storing of food has been suggested to exert important effects on the
immunogenicity of food proteins. In this thesis, it was investigated how the T cell immunogenicity
and antigenicity of allergens is influenced by glycation by the Maillard reaction using the hen egg
white allergen OVA and one of the major peanut allergens, Ara h 2, as model allergens.
5.1 Glycation of OVA enhances the CD4+ T cell immunogenicity of the allergen in vitro
First, the impact of AGEs derived from food allergens on DC function and the subsequent
activation of allergen specific T cells was studied using AGE-OVA. Here, it was found that AGE-
OVA does not trigger the maturation of bone marrow derived mouse myeloid dendritic cells
(mDCs) but enhances the activation of allergen specific CD4+ T cells. Moreover, it was
demonstrated that the enhanced T cell immunogenicity of AGE-OVA depends on SR-AI/II-
mediated uptake of AGE-OVA by mDCs.
5.1.1 Incubation of allergens with sugars efficiently induces modification by the Maillard reaction
For the preparation of AGE-OVA, native OVA was incubated with glucose at 50°C for 6 weeks.
On AGE-OVA, high levels of the glycation structures CEL, CML and GA-pyridine were detected
(Fig. 4.2). The secondary structure was not affected by the treatment (Fig. 4.3). The preservation
of the secondary structure of OVA during the medium temperature used here is consistent with a
study which extensively examined the effect of thermal processing and glycation on the
biochemical properties of OVA (Sun et al., 2004).
It may be argued that the long incubation time at medium temperature applied in the protocol for
AGE-OVA preparation is not appropriate since it does not reflect the conditions found when
cooking or frying an egg. A medium temperature and consequently a longer incubation time for
the preparation were chosen to limit thermal denaturation and aggregation of OVA. Higher
temperatures lead to denaturation and aggregation of OVA due to unfolding. The aggregated
OVA is insoluble in any buffer suitable for cell culture or in vivo use. Additionally, such medium
temperatures are often used in (accelerated) trials mimicking long term storage of food, during
which Maillard reaction products are also formed. Here, the aim was to study the influence of
glycation structures on the immunogenicity of food allergens. CEL and GA-pyridine detected on
AGE-OVA are also found on glycated rAra h 2 (Fig. 4.37) as well as in protein extracts of peanuts
roasted using conditions resulting in peanuts similar to industrially processed peanuts in taste,

Discussion
102
texture and browning (data not shown). Therefore AGE-OVA, as it was prepared here, is an
appropriate model AGE for studying the T cell immunogenicity and antigenicity of food allergen
derived AGEs.
5.1.2 AGE-OVA has a higher CD4+ T cell immunogenicity than unglycated OVA In this study it was found that AGE-OVA induced a higher OVA specific CD4+ T cell activation
than native and thermally processed OVA in vitro. As shown in Fig. 4.5 and Fig. 4.9, stimulation
with AGE-OVA resulted in a higher IL-2 production by OVA specific CD4+ T cells as well as a
stronger proliferation of these cells compared to stimulation with native or thermally processed
OVAs when the T cells were co-cultured with mDCs. The results suggest that AGE-OVA could
have a higher T cell immunogenicity than the unglycated forms of OVA.
If the AGEs were capable of directly stimulating T cell activation in an allergen unspecific manner,
this may result in harmful immune reactions in response to any glycated protein. It was found,
however, that the glycation structures of AGE-OVA do not directly activate T cells unspecifically,
but that CD4+ T cell activation depended on the presence of mDCs. Two different steps in the
interaction of AGE-OVA with mDCs may play a role in the enhanced CD4+ T cell activation by the
glycated allergen; namely mDC maturation and/or antigen uptake by the mDCs.
5.1.2.1 Increased CD4+ T cell activation does not result from an AGE-OVA induced enhanced maturation of mDCs The maturation of DCs is characterised by the upregulation of the expression of co-stimulatory
molecules (namely, CD40, CD80 and CD86) and MHC class II molecules (MHC II) on the cell
surface, all of which are required for efficient T cell priming. Furthermore, activation of mDCs also
results in the secretion of cytokines such as IL-10 and IL-12. Incubation of mDCs with AGE-OVA
did not increase the expression of the aforementioned molecules nor induce cytokine secretion by
mDCs (Fig. 4.12). The results indicate that the enhanced CD4+ T cell immunogenicity of AGE-
OVA was not due to a stimulatory effect of AGEs on the maturation and activation of mDCs.
Previous studies have shown that AGEs may have an inhibitory as well as a stimulatory effect on
human DC maturation (Price et al., 2004; Ge et al., 2005). The discrepancy among the
observations, including those of the present study, may be due to variations in the expression of
AGE receptors on the cell surface. Recent findings have shown that engagement of RAGE with its
ligands triggers the maturation of DCs (Manfredi et al., 2008; Dumitriu et al., 2005). RAGE was
not detected on mDCs in the experimental setting of the present study (Fig. 4.15 C); this may be a
reason why AGE-OVA did not induce the maturation of the cells. In the study by Price et al, which
also found that AGEs do not induce DC maturation, RAGE was also not detected on the DCs
(Price et al., 2004). In contrast, the DCs used in the study by Ge et al expressed RAGE and it was
found that AGEs induced enhanced maturation of these DCs (Ge et al., 2005).
As described in chapter 1.8 of the introduction, maturation of DCs is vital for the efficient priming
of T cells by these APCs. Although an enhanced expression of co-stimulatory molecules or MHC

Discussion
103
II after stimulating with either form of OVA could not be detected, a robust T cell activation was
achieved using these mDCs in co-culture with T cells. This can be explained by the fact that the
bone marrow derived DCs generated in this study are not fully immature but do express co-
stimulatory molecules without needing additional stimulation (Fig. 4.12).
5.1.2.2 Glycation of OVA by the Maillard reaction significantly enhances the uptake of the allergen by mDCs A very important finding in this thesis is that glycation of OVA by the Maillard reaction enhanced
the uptake of the allergen by mDCs (Fig 4.14). This is highly interesting, since the increased
uptake of AGE-OVA by mDCs would explain the enhanced CD4+ T cell activation by the glycated
allergen. Three mechanisms are responsible for antigen uptake by DCs, namely pinocytosis,
phagocytosis and receptor mediated endocytosis (chapter 1.9). It is very unlikely that
phagocytosis is responsible for the uptake of soluble OVAs as the mechanism is generally used
for particulate antigens. Pinocytosis would take up similar amounts of OVA, independent of the
presence of glycation structures and would therefore not contribute to enhancing the uptake of
OVA after glycation. Therefore, receptor mediated endocytosis was hypothesised to be the
mechanism underlying the enhanced uptake of AGE-OVA by mDCs.
Native OVA is glycosylated with a single carbohydrate side chain composed of N-acetyl-
glucosamine and mannose (Tai et al., 1975). It is well established that the endocytosis of native
OVA is mediated by the mannose receptor (MR) which binds to the mannose residues of the
carbohydrate side chain (Huntington 2001 et al., Burgdorf 2006, Autenrith et al., 2007). AGEs
have been found to bind to several cell surface receptors such as SR-AI/II (Suzuki et al., 1997;
Araki et al., 1999), RAGE (Schmidt et al., 1992; Neeper et al., 1992) and galectin-3 (Vlassara et
al., 1995) which are expressed by DCs. In this study, SR-AI/II and the MR, but not galectin-3 and
RAGE, were identified as important receptors mediating the uptake of AGE-OVA by mDCs.
Deficiency of RAGE in mDCs (Fig. 4.16) and treatment of Wt mDCs with lactose, an inhibitor for
galectin-3 mediated endocytosis, did not reduce the uptake of any form of OVA (Fig. 4.17). In
contrast, SR-AI/II deficiency in mDCs significantly attenuated the uptake of AGE-OVA by the cells
(Fig. 4.18). Treatment of SR-AI/II deficient mDCs with mannan, an inhibitor for MR mediated
endocytosis, further reduced the uptake of AGE-OVA considerably (Fig. 4.19). The results clearly
indicate that SR-AI/II and the MR mediate the uptake of AGE-OVA by mDCs. The minor uptake of
AGE-OVA still observed in SR-AI/II deficient mDCs after treatment with mannan (Fig. 4.19)
suggests a marginal involvement of further receptors in the uptake. As mDCs also express CD36
and SR-BI (Fig. 4.15 E), which too bind AGEs (Ohgami et al., 2001, a; Ohgami et al., 2001, b),
these receptors may be the ones engaged in the residual uptake by the mannan treated SR-AI/II
deficient mDCs.
Unexpectedly, the uptake of native OVA and thermally processed OVA was also reduced in the
SR-AI/II deficient mDCs, although the reduction level was considerably lower than that observed
for AGE-OVA (Fig. 4.18). Treatment of SR-AI/II deficient mDCs with mannan almost completely

Discussion
104
abolished the uptake of native and thermally processed OVA (Fig. 4.19). The results indicate that,
as expected, the MR is the main receptor mediating the uptake of native and thermally processed
OVA by mDCs. SR-AI/II would also be involved in the uptake of the unglycated OVAs but its role
is only a marginal one.
5.1.2.3 SR-AI/II mediates the enhanced uptake of AGE-OVA by mDCs As described above, the natural mannose residue found on OVA facilitates the uptake of the
allergen by the MR. In macrophages, scavenger receptors, in addition to the MR, were suggested
to contribute to the uptake of native OVA (Burgdorf et al., 2007). However, the scavenger
receptors constitute a heterogeneous and large receptor family and the specific scavenger
receptor(s) participating in the OVA uptake was/were not previously identified. Here, it was found
that SR-AI/II is the scavenger receptor involved in the uptake of native OVA by mDCs. SR-AI/II
binds to a wide range of anionic ligands including natural carbohydrates and chemically modified
residues of proteins (Platt and Gordon, 2001; Plüddemann et al., 2007). To test whether the
natural carbohydrate side chain of OVA can bind to SR-AI/II, recombinant OVA was used.
Recombinant OVA does not have any carbohydrate residues due to its production in E. coli where
posttranslational enzymatic glycolsylation generally does not occur. First, the uptake of
recombinant OVA by mDCs was less than the uptake of native OVA (Fig. 4.23 A). Furthermore,
SR-AI/II deficiency of mDCs did not attenuate the uptake of recombinant OVA (Fig. 4.23 B) in
contrast to the observations made with native OVA (Fig. 4.18). These results strongly indicate that
the carbohydrate side chain of OVA facilitates the interaction of native OVA with SR-AI/II,
resulting in the minor uptake by this receptor (Fig. 5.1).
AGE-OVA would bind to SR-AI/II not only via the natural carbohydrate side chain but also via the
glycation structures which result from the modification by the Maillard reaction. This hypothesis is
supported by the experiments performed with AGE-BSA. AGE-OVA and AGE-BSA have a similar
glycation profile (Fig. 4.2 and Fig. 4.4). The uptake of AGE-BSA by mDCs was considerably
higher than native BSA uptake (Fig. 4.20). As BSA does not have any natural carbohydrate
residues which may be recognised by the MR (Wada, 1996), the possibility that the MR mediates
the uptake of AGE-BSA is therefore excluded. AGE-BSA inhibited the uptake of AGE-OVA by Wt
mDCs (Fig. 4.21 A), but only induced very little inhibition of the uptake by SR-AI/II deficient cells
(Fig. 4.21 B). In contrast, native BSA could not inhibit AGE-OVA uptake by mDCs at all (Fig.
4.21). Those results strongly indicate that the glycation structures of AGE-OVA and AGE-BSA
mediate the binding of the glycated proteins to SR-AI/II. Collectively the results suggest that
native and thermally processed OVA interact with SR-AI/II via their natural carbohydrate side
chain only, whereas AGE-OVA can interact with SR-AI/II via its glycation structures in addition to
the natural carbohydrate residues (Fig. 5.1). Therefore, the presence of the glycation structures
enhances the binding of AGE-OVA to SR-AI/II, which increases the overall uptake of the allergen
by mDCs and subsequently induces higher allergen specific CD4+ T cell activation.

Discussion
105
SR-AI/II
AGE-OVA
Native or thermally processed OVA
Early endosomes Carbohydrate side chain
Glycation structures
Fig. 5.1 Glycation of OVA enhances the binding affinity of the allergen for SR-AI/II Native and thermally processed OVA bind to SR-AI/II via their natural carbohydrate side chain. AGE-OVA, in addition to
the natural carbohydrate side chain, can bind to SR-AI/II via the glycation structures, resulting in an increased uptake of
the glycated allergen by the receptor.
5.1.3 CEL and CML contribute to the enhanced CD4+ T cell activation by AGE-OVA Thermal incubation of OVA with glucose results in the modification of the protein with a mixture of
glycation structures. The glycation profile of AGE-OVA is not fully characterised but high
concentrations of CEL and CML were detected (Fig. 4.2 and Tab. 4.1). Here it was found that
OVA selectively modified with either CML or CEL only, enhanced the CD4+ T cell activation in a
similar way as crude AGE-OVA did (Fig. 4.8). This further supports the conclusion that the
glycation structures on AGE-OVA are indeed responsible for the increased CD4+ T cell
immunogenicity. The presence of either CML or CEL, or both, on AGE-OVA may mediate the
binding of the glycated allergen to SR-AI/II and contribute to the enhanced CD4+ T cell
immunogenicity of AGE-OVA.
Contradicting results have now been published concerning the binding of CML to RAGE. Some
studies do show CML to be a ligand for RAGE (Kislinger 1999, Hudson 2003). More recently, on
the other hand, it was also demonstrated that RAGE was actually unable to bind CML (Buetler et
al., 2008; Wilton et al., 2006). The Maillard glycation structures which act as ligands for the other
AGE binding receptors, galectin-3, SR-BI, CD36 and SR-AI/II, have not yet been identified. A
common denominator found for all SR-AI/II ligands is that they are polyanionic but the exact
molecular properties which enable a molecule to bind to SR-AI/II have not yet been fully

Discussion
106
elucidated (Platt and Gordon, 1998). In studies characterising AGE-BSA produced by incubating
the protein with glucose, glycation increases the number of negative charges on the protein (Wu
et al., 1996; Westwood and Thornally, 1995). Therefore, the modification with glycation structures
is likely to increase the negative charge of OVA. Although being polyanionic alone is not sufficient
in order for a molecule to become a ligand for SR-AI/II (Horiuchi et al., 1986), the increased
negative charge could be one factor responsible for enhancing the affinity of AGE-OVA for SR-
AI/II. Uptake studies using FITC-labelled CEL- and CML-OVA could help to elucidate whether
these glycation structures are able to interact with the AGE-binding receptors.
5.1.4 SR-AI/II plays a critical role in the activation of CD4+ T cells by (AGE-)OVA To closer investigate the role of SR-AI/II in OVA specific CD4+ T cell activation by mDCs, CD4+ T
cells were cultured in the presence of fixed allergen pulsed Wt or SR-AI/II deficient mDCs. CD4+ T
cell activation in response to native, thermally processed or AGE-OVA was significantly reduced
in cultures with SR-AI/II deficient mDCs (Fig. 4.25). In contrast, SR-AI/II deficiency did not reduce
T cell activation in response to recombinant OVA, which does not have a binding moiety for SR-
AI/II. The results are a further indicator that SR-AI/II mediates the uptake of all three OVAs by
mDCs and that it is a critical component for optimal activation of OVA specific CD4+ T cells.
Furthermore, IL-2 production in response to stimulation with native, thermally processed and
AGE-OVA was comparable when SR-AI/II deficient mDCs were used. This clearly demonstrates
that the enhanced uptake of glycated OVA by SR-AI/II is responsible for the increased CD4+ T cell
activation by AGE-OVA when WT mDCs are used as APCs.
The receptors which mediate the endocytosis of a particular antigen dictate the intracellular
routing of the endocytosed antigen and consequently on which class of MHC molecule the
antigen peptides will be presented (chapter 1.9.2). For example, antigens taken up by the glycan-
binding receptor DC-SIGN (CD209) are delivered to the MHC class II loading pathway (Engering
et al., 2002). On the other hand, antigens taken up by the MR are targeted to the MHC class I
loading pathway (Burgdorf et al., 2007). In the present study it was found that the glycation of
OVA does not enhance its potential to stimulate CD8+ T cell activation. OVA-specific CD8+ T cells
which were co-cultured with mDCs secreted comparable levels of IL-2 in response to stimulation
with native and AGE-OVA (Fig. 4.11). The results suggest that SR-AI/II is a receptor targeting its
ligands to the MHC class II, but not to the MHC class I loading pathway.
Since the uptake of AGE-OVA by SR-AI/II is considerably higher than that of native or thermally
processed OVA due to the glycation structures, an increased amount of AGE-OVA would be
delivered to the MHC class II loading pathway. Subsequently, this would result in a substantial
increase of the amount of OVA peptide-MHC class II complex on the surface of the mDCs,
facilitating the enhanced OVA specific CD4+ T cell activation. This result is in good accordance
with previous publications which have shown that the CD4+ T cell immunogenicity of an antigen is
enhanced if it is chemically modified to function as a SR-AI/II ligand (Abraham et al., 1995;
Nicoletti et al., 1999).

Discussion
107
5.1.5 SR-AI/II targets AGE-OVA to MHC class II loading pathway The results in the present study allow the hypothesis that SR-AI/II channels OVA to the MHC
class II loading pathway (Fig. 4.25, chapter 5.1.4). To further verify this hypothesis, it was
attempted to identify the location of AGE-OVA within the mDCs using immunocytochemistry. After
the uptake, the majority of AGE-OVA was found in EEA1 positive compartments, which are the
early endosomes (Fig. 4.30 A). Previously, the MR has been shown to transport its ligands to the
early endosomes. Here, it was observed that AGE-OVA co-localised with EEA1 even in MR
deficient mDCs (Fig. 4.30 B). Since SR-AI/II was found to be the only other receptor besides MR
which contributes significantly to AGE-OVA uptake by mDCs, it can be assumed, that AGE-OVA,
which co-localises with EEA1 in MR deficient mDCs was transported to the early endosomes after
uptake by SR-AI/II. These observations suggest that not only the MR but also SR-AI/II transports
its ligands to the early endosomes (Fig. 5.2).
As described in the introduction, nascent MHC II can be delivered from the endoplasmatic
reticulum (ER) to the early endosomes (Brachet et al., 1999; Pond and Watts, 1997; Villadangos
et al., 2000). In the present study MHC II was also found to co-localise with EEA1 (Fig. 4.29). In
the early endosomes, there appears to be a H2-DM independent process of Ii degradation and
peptide loading (Villadangos et al., 2000). Due to the open conformation of the peptide binding
groove, MHC II can bind to peptides of undefined length (Watts, 1997). Therefore, proteins can
bind to MHC II even before being processed to short peptides by the proteases in later
endocytotic compartments (Lindner et al., 1996). Taken together, the data of the present study
suggests that the majority of AGE-OVA could be targeted to the early endosomes by the SR-AI/II
(Fig. 5.2). In the early endosomes some of it is processed to polypeptides and loaded onto MHC II
(Fig. 4.27). The MHC II - OVA polypeptide complex may then continue along the endocytotic
pathway to the increasingly proteolytic compartments where the unprotected regions of the
polypeptide are clipped off (Villadangos, 2001). AGE-OVA which is not loaded onto MHC II in the
early endosomes would be degraded to peptides in the late endosomes/lysosomes and the
peptides loaded onto MHC II in the lysosomes (Fig. 5.2).
In this study, co-localisation of AGE-OVA with the late endosome/lysosome marker Lamp1 or the
lysosomal dye lysotracker was not detected (Fig. 4.27 and data not shown). The late
endosome/lysosomes are compartments involved in the processing of the majority of antigens
and the formation of MHC II - peptide complexes (Fig. 5.2). Inconsistent with the present study,
Burgdorf et al have suggested (Burgdorf et al., 2007) that most of the OVA endocytosed by
scavenger receptors is transported to the lysosomes for processing and loading onto MHC II. In
order to visualise OVA in mDCs, the protein was labelled with FITC. The possibility that FITC was
degraded in the lysosomes cannot be excluded. The lysosomes are very acidic compartments
with a pH ranging from 4-5 (Poole and Ohkuma, 1981). FITC is sensitive to pH and its
fluorescence intensity is quickly reduced in an acidic environment. The degradation of FITC in the
lysosomes could be the reason why AGE-OVA could not be observed in this particular
compartment. In the previous study, Burgdorf et al identified the cellular location of native OVA in

Discussion
108
the lysosomes using commercially available AlexaFluor 488 OVA conjugates (Burgdorf et al.,
2007). These are modified with a high amount of AlexaFluor 488, a dye which is more stable than
FITC under acidic conditions. A further study using AGE-OVA labelled with AlexaFluor 488 would
be necessary to verify whether AGE-OVA is also transported to the lysosomes.
OVA endocytosed by the MR is transported into stable early endosomes before being exported
into the cytosol where it is processed by the proteasome (Burgdorf et al, 2008). Subsequently, the
processed antigenic peptides are reimported into the same endosomal compartment by TAP
(transporter associated with antigen processing) to be loaded onto MHC I (Fig. 5.2) (Burgdorf et
al, 2008). In contrast to SR-AI/II binding, glycation of OVA does not appear to alter the binding of
OVA to the MR (Fig. 4.18 and 4.19). All three forms of OVA would therefore be taken up by the
MR in similar amounts (Fig. 4.19). As a result, AGE-OVA and native OVA induced comparable
activation of OVA specific CD8+ T cells (Fig. 4.11). Compared to native OVA, thermally processed
OVA induced higher CD8+ T cell activation. Although the CD analysis showed identical spectra
between native and thermally processed OVA (Fig. 4.3, A), SDS-PAGE analysis suggests that
minor degradation and/or denaturation of the allergen might be induced by the thermal processing
without glucose (Fig. 4.3., B). The enhanced CD8+ T cell activation by the thermally processed
OVA may therefore be due to slight denaturation, which may facilitate a more efficient processing
by the proteasome.
Collectively, the results presented here suggest that SR-AI/II targets its ligands to the early
endosomes for MHC class II loading. As described above, the MR also targets the ligands to the
early endosomes but for MHC class I loading. It is still not sure whether both receptors target their
ligands to the same early endosome population or not. It should however be noted that the early
endosomes of a cell are not made up of a uniform pool of endocytotic compartments. Instead, it
was recently shown that there are two distinct populations of endosomes, one which is highly
mobile and quickly matures to late endosomes and subsequently lysosomes and a second, much
more static population (chapter 1.9.2) (Lakadamyali et al., 2006). It appears that OVA
endocytosed by the MR is delivered to the stable early endosome population and never enters the
late endosomes or lysosomes (Burgdorf et al., 2007). On the other hand, OVA endocytosed by
SR-AI/II may enter the rapidly maturing early endosomes. The model of the intracellular pathway
of SR-AI/II endocytosed OVA presented here will have to be confirmed in future studies.

Discussion
109
CD4+ T cell
Pinocytosis
MR mediated endocytosis
SR-A mediated endocytosis
ER Ii
EE
Lysosomes
Proteasome
H2-DM
TAP
CD8+ T cell
SR-AI/IIOVA
CLIP
MHC II
MHC IOVA peptide
MR
Stable EE
OVA
OVA peptide
Fig. 5.2 Model for the processing of AGE-OVA taken up by mDCs via SR-AI/II AGE-OVA taken up by SR-AI/II is delivered to the early endosomes where MHC II is found. Another fraction of the AGE-
OVA may progress from the early endosomes to the late endosomes/lysosomes for processing and MHC II loading. AGE-
OVA taken up by pinocytosis also enters the MHC II restricted processing and loading. The MHC II-peptide complex is
subsequently transported to the cell surface where it is recognised by OVA peptide specific CD4+ T cells. AGE-OVA
taken up by the MR enters stable early endosomes from where it is brought to the proteasome for processing. The OVA
peptides re-enter the same early endosomes via TAP, are loaded onto MHC I and the MHC I-peptide complex is then
directly transported to the cell surface for presentation to CD8+ T cells. Figure partially adopted from Burgdorf et al., 2007.
5.2 Glycation of OVA by the Maillard reaction enhance the antigenicity and T cell immunogenicity of the allergen in vivo
Next, the immunogenicity and antigenicity of AGE-OVA was evaluated in vivo. Mice were used
for the evaluation because access to human materials, e.g. peripheral blood monocytes (PBMC)
and sera from patients with food allergy, is generally limited. In addition, many patients with egg
allergy are small children and so it is even more difficult to obtain suitable amounts of blood
samples for PBMC studies. The usage of mice also has the advantage that it is possible to
investigate the sensitisation (priming) effect of AGEs on the induction of allergen specific T cell
and antibody responses. Here, it was found that AGE-OVA induced a higher production of
allergen specific IgE antibodies in BL6 mice, compared to native and thermally processed OVAs.

Discussion
110
5.2.1 Antigenicity of AGE-OVA in intraperitoneal immunisation Intraperitoneal (ip) immunisation of mice with AGE-OVA resulted in a significantly higher IgE
production than immunisation with native or thermally processed OVA (Fig. 4.36). These results
indicate that AGE-OVA has a higher antigenicity than the unglycated forms of the allergen.
Allergic reactions are induced by the association of allergens with IgE bound to the high affinity
IgE receptor, FεcRI, on the surface of mast cells (chapter 1.2). Therefore, glycation by the
Maillard reaction may also increase the allergenicity of OVA.
Two components of the immune response could be involved in the enhanced IgE production by
AGE-OVA: CD4+ T cell and B cell activation. CD4+ T cells play a crucial role in the induction of
IgE production by B cells (chapter 1.13). The results of the experiments using in vitro co-culture of
CD4+ T cells with mDCs (Fig. 4.5) and subcutaneous immunisation (Fig. 4.31) for the assessment
of the CD4+ T cell immunogenicity of the three types of OVA strongly indicate that AGE-OVA has
a higher T cell immunogenicity than native or thermally processed OVA. These results suggest
that the enhanced IgE production results from increased CD4+ T cell activation by AGE-OVA.
Furthermore, the increased CD4+ T cell activation by AGE-OVA also resulted in a higher amount
of IL-4 being secreted by the activated T cells (Fig. 4.10). IL-4 is a key cytokine for the production
of IgE antibodies by B cells. This would further explain why the production of IgE was
considerably enhanced following immunisation with AGE-OVA.
It may be argued that in the case of ip immunisation, all three OVAs had a comparable T cell
immunogenicity (Fig. 4.32). The discrepancy may be the result of the immunisation protocol used;
three immunisations with a relatively high dose of allergen were performed. Therefore, even if
AGE-OVA does have an enhanced CD4+ T cell immunogenicity also with ip immunisation, the
enhancing effect may not have been detectable if the antigen dose was so high as to induce a
maximum activation even with less immunogenic antigens after three immunisations. The
influence of the allergen dose is also supported by the in vitro data showing that higher
concentrations of the different OVAs could induce comparable proliferation of CD4+ T cells but at
lower doses, AGE-OVA was a much more potent inducer of T cell proliferation than native and
thermally processed OVA (Fig. 4.9).
When analysing the data of CD4+ T cell activation and the antibody production, it has to be taken
into account that the data presented for the antibody production represents the situation after only
two immunisations, whereas the ex vivo stimulation of CD4+ T cells to asses the T cell
immunogenicity of AGE-OVA was performed after three immunisations. The antibody data after
three immunisations was not used as the levels of antibody were so high, that no differences
could be observed between serum dilutions (data not shown). This supports the notion that the T
cell activation had reached a maximum after three immunisations. However, it is likely that after
two immunisations, a difference in CD4+ T cell activation between the groups would be observed,
with a stronger activation in AGE-OVA immunised mice as was found after subcutaneous
immunisation (Fig. 4.31). This would explain the increased IgE production after just two ip
immunisations with AGE-OVA. The ip immunisation should therefore be repeated with an altered

Discussion
111
protocol to confirm that CD4+ T cell activation was higher in AGE-OVA immunised mice after only
two immunisations.
In addition to enhanced CD4+ T cell activation, the second component of the immune response
being influenced by the glycated OVA could be the B cell activation. The glycation structures may
act as novel immunepitopes for the immunoglobulins of B cells, the BCRs. This could result in the
production of antibodies specific for the glycation structures found on OVA. However, the
antibodies from AGE-OVA immunised mice bound equally well to native, thermally processed and
AGE-OVA (Fig. 4.33, Fig. 4.34 and Fig. 4.36). Therefore, even if some antibodies with specificity
for the glycation structures are produced in BL6 mice, their level would be rather low. Instead, the
data suggests that antibodies from AGE-OVA immunised mice are likely to recognise the same
epitopes as mice immunised with the unglycated forms of OVA. These could be epitopes which
remain unglycated or epitopes where the glycation does not affect immunoglobulin binding.
Hence, glycation of OVA does not appear to directly alter the interaction of the allergen with B
cells. Therefore, the enhanced production of IgE induced by AGE-OVA immunisation would
mainly be the result of increased CD4+ T cell activation.
As shown in Fig. 4.19 and Fig. 4.25, it was found that SR-AI/II mediates the uptake of AGE-OVA
by mDCs and that this contributes to the enhanced OVA specific CD4+ T cell activation by the
glycated allergen. In order to verify the importance of SR-AI/II for the enhanced antigenicity of
AGE-OVA in vivo, the usage of SR-AI/II deficient mice may be a choice. However, SR-AI/II does
not only play a role in antigen uptake but also promotes cell adhesion to matrix molecules and
other cells (Khoury et al., 1994; Gowen et al., 2000). This function could contribute to the
involvement of SR-AI/II in limiting DC migration from the site of antigen uptake to the draining
lymph nodes (Arredouani et al., 2007). Therefore, the absence of SR-AI/II itself can have an
enhancing influence on the T cell activation in the lymph nodes. For this reason, SR-AI/II deficient
mice were not used to verify the role of SR-AI/II in vivo. Further study would be necessary to see
whether DCs which express SR-AI/II predominantly take up AGE-OVA in vivo. This could for
example be done using immunohistochemistry.
5.2.2 The influence of AGEs on CD4+ T cell differentiation As illustrated in chapters 1.12.2.2 and 1.13, Th2 cells play a pivotal role in the IgE production by B
cells and in the maturation and activation of inflammatory cells involved in allergic reactions. Th2
cells are opposed by Th1 cytokines and regulatory T cells which inhibit the differentiation of CD4+
T cells to Th2 cells and suppress the activation of effector T cells respectively. Therefore, it was of
utmost interest to see whether the glycation of food allergens influences the differentiation of
CD4+ T cells.
In this study it was found that neither AGE-OVA nor AGE-rAra h 2 influences the T cell
differentiation. In in vitro co-cultures of mDCs and OVA specific CD4+ T cells, AGE-OVA
enhanced the production of IL-4 but also IFN-γ (Fig. 4.10), giving no indication of a shift in T cell
polarisation. Furthermore, in ip immunised mice, native, thermally processed and AGE-OVA

Discussion
112
induced comparable IgG1/IgG2a antibody ratios (Fig. 4.34). These results indicate that AGE-OVA
did not alter the CD4+ T cell differentiation towards a particular T helper cell phenotype.
SR-AI/II plays a pivotal role in the uptake of AGE-OVA in vitro and possibly also in vivo. Previous
data regarding the influence of SR-AI/II on T cell differentiation is controversial. Maleyated
allergen, a modification which targets the protein for SR uptake, induced a Th1 dominated
allergen response, e.g. predominant production of the Th1 cytokine IFN-γ by splenic T cells and
increased IgG2a antibody production in response to the antigen (Bhatia et al., 2002). In contrast,
other studies showed that OVA treated with formaldehyde, resulting in an aldehyde modified
allergen which was taken up by macrophages via the SR, leads to a Th2 dominated immune
response marked by higher IL-5 production by T cells and increased IgG1 production in
comparison with the unmodified OVA (Moghaddam et al., 2002; Allison and Fearon 2000; Willis et
al., 2002). The different observations could be due to different protein modifications which may
bind to distinct binding sites of SR-AI/II and subsequently trigger different signalling pathways.
The collagenous region of SR-AI/II has been identified as the binding site of the receptor, however
within this at least two discrete binding sites exist. For instance, the SR-AI/II ligand acetylated LDL
is a poor competitor for binding of oxidised LDL, also a SR-AI/II ligand (Platt and Gordon, 2001,
Plüddemann et al., 2007). SR-AI/II ligands, by binding to distinct binding sites of the receptor,
differentially modulate specific protein kinase signal transduction pathways (Coller and Paulnock,
2001; Hsu et al., 2001). Therefore, the stimulatory effect of SR-AI/II-ligand interaction on
maturation and cytokine production of DCs appears to be ligand dependent. The cytokines which
are produced by DCs influence the differentiation of CD4+ T cells (chapter 1.12.2). However,
AGE-OVA did not induce maturation of mDCs nor did it stimulate cytokine production by these
cells (Fig. 4.12). In summary, binding to distinct binding sites and the triggering of different
signalling pathways could offer an explanation for the contrasting immunomodulating effects
observed by ligand binding to SR-AI/II. The AGEs may associate with a binding site of SR-AI/II
which does not trigger maturation nor results in the release of cytokines which generates a
different phenotype than the uptake of unglycated OVA.
5.3 Glycation reduces the allergenicity of rAra h 2 Ara h 2 is one of the major allergens of peanuts (Burks et al., 1992; Burks et al., 1995). Peanuts
are usually not consumed raw but roasted, fried or boiled. Since peanuts contain a significant
amount of reducing sugars (Vercellotti et al., 1995), the Maillard reaction occurs during the
thermal treatment of peanuts (Maleki et al., 2000, Chung et al., 2003). Consequently, it was of
major interest to elucidate what effect the Maillard reaction may have on the immunogenicity of
this allergen. Several studies have shown that thermal treatment of peanuts or single allergens in
the presence of carbohydrates enhances their binding activity for serum IgE from peanut allergic
patients as a result of modifications by the Maillard reaction (Maleki et al., 2000; Chung SY et
al.,2001; Gruber et al, 2005). However, so far no study has been performed to examine the

Discussion
113
influence of the Maillard reaction on the immunogenicity, antigenicity and allergenicity of Ara h 2
in vivo. Here, it was observed that glycation of Ara h 2 by the Maillard reaction reduced the
immunostimulatory potential of rAra h 2 in C3H/HeJ mice.
5.3.1 Thermal incubation of rAra h 2 with carbohydrates leads to glycation and loss of secondary structure
First, different carbohydrates were tested for the glycation of rAra h 2, namely fructose, glucose,
galatcose and mannose, which are naturally found in peanuts (Rudrapatnam et al., 1974).
Lactose and maltose were also used; these are not present in peanut but are frequently used in
peanut products. In a previous study it was observed that the binding properties of AGE-Ara h 2
for serum IgE from peanut allergic patients is dependent on the carbohydrate used for the
preparation of the particular AGE-Ara h 2 (Maleki et al., 2000). The data suggest that the
carbohydrate present during the thermal processing could influence the development of the type
and/or the amount of glycation structures and subsequently influences the binding properties of
the prepared AGEs for serum IgE. It was therefore of interest to see whether the different
carbohydrates resulted in different glycation structures on rAra h 2.
CML and GA-pyridine but not CEL and pyrraline could be detected in rAra h 2 incubated with any
one of the carbohydrates (Fig. 4.37). Galactose appeared to generate the highest level of GA-
pyridine. Whether this difference in the amount of GA-pyridine could be of relevance for the
immunogenicity of the allergen was beyond the scope of this study. However, it was interesting,
since a particularly high increase in the binding of serum IgE of peanut allergic patients was
observed when Ara h 2 had been incubated with galactose (Maleki et al., 2000). CML and GA-
pyridine were also detected in extracts of roasted peanuts in our hands (data not shown). The
presence of CML in roasted peanut extracts was also confirmed by another study (Chung et al.,
2001). As galactose induced the highest level of GA-pyridine as well as inducing high levels of
CML and is a carbohydrate found in peanuts (Rudrapatnam et al., 1974), it was used for the
preparation of AGE-rAra h 2 in the present study.
Here, it was also observed that rAra h 2 was severely affected by thermal treatment. The CD
spectrum of untreated rAra h 2 shows that rAra h 2 is a protein dominated by α-helices (Fig.
4.38). This finding is in consent with the CD spectra published for rAra h 2 by Lehmann et al. and
for native Ara h 2 (Lehmann et al., 2006; Maleki et al., 2003). However, the α-helical structure of
rAra h 2 was lost after thermal treatment with or without galactose (Fig. 4.38). In contrast,
Lehmann et al. found that when heating rAra h 2 up to 90°C, there was little change of the CD
spectrum (Lehmann et al., 2006) and Ara h 2 isolated from roasted peanut extracts exhibited only
a very minor reduction of the α-helical structure in favour of β-sheets and random coils (Maleki et
al., 2003). Intact disulfide bonds were found to be vital for the heat stability of rAra h 2 (Lehmann
et al., 2006). The correct disulfide bond formation was not checked for rAra h 2 used in the
present study. Although the CD spectrum of rAra h 2 used here resembles that of rAra h 2 and

Discussion
114
native Ara h 2 published previously, it is possible that the disulfide bonds of rAra h 2 used for this
study were not formed correctly, which would make the protein more susceptible to heat
degradation. Therefore, the loss of secondary structure observed for rAra h 2 after thermal
incubation with and without galactose may be due to incompletely formed disulfide bonds. The
discrepancy to the other publications may also be explained by the different incubation conditions
used. In the present study rAra h 2 was heated in solution at 120°C for 2 h. Lehmann et al. heated
rAra h 2 to 90°C, a considerably lower temperature, during CD spectroscopy. In the study by
Maleki et al. Ara h 2 was isolated after the complete nuts had been roasted at 350°C for 20 min
(Lehmann et al., 2006; Maleki et al., 2003). In the latter study the food matrix of the whole peanut
may protect the conformation of Ara h 2 during roasting.
5.3.2 The glycation of rAra h 2 by the Maillard reaction reduces the CD4+ T cell immunogenicity of the allergen in vivo
In this thesis it was found that glycation of rAra h 2 by the Maillard reaction reduces the CD4+ T
cell immunogenicity of the allergen. CD4+ T cells isolated from mice immunised with AGE-rAra h 2
proliferated much better in response to unprocessed rAra h 2 and rAra h 2 thermally processed
without galactose (Fig. 4.39) than to AGE-rAra h 2. One factor influencing the CD4+ T cell
immunogenicity of the allergen may be the denaturation of the allergen induced by heating; CD4+
T cells isolated from all three immunisation groups responded better to stimulation with
unprocessed rAra h 2 than to thermally processed rAra h 2. Since T cells recognise sequential
epitopes, the loss of the conformation of rAra h 2 by thermal treatment is unlikely to directly
influence the recognition of the allergen by TCRs. Thermal denaturation of proteins is often
irreversible and this appears to also be true for the rAra h 2 used in this study as shown by the CD
spectrum analysis performed at room temperature after heating (Fig. 4.38, discussed in 5.3.1).
Generally, the cause for the irreversibility is aggregation of the heat unfolded polypeptide (Benjwal
et al., 2006). Therefore both thermally processed and AGE-rAra h 2 are likely to be aggregated. In
order for T cells to be activated by an allergen, the protein has to be processed by APCs and the
allergen peptides loaded onto MHC molecules (chapter 1.10). It is possible that the aggregation of
rAra h 2 inhibits or alters the processing of the allergen by the proteases in the endosomes and
lysosomes where antigens are processed for MHC class II presentation. If this is the case, less
MHC II-peptide rAra h 2 complexes would result from the intracellular processing of the
aggregated allergen as opposed to processing of the rAra h 2 which had not been subjected to
thermal treatment. Consequentially, less peptide would be presented on the cell surface of the
APCs resulting in reduced CD4+ T cell activation by thermally processed and AGE-rAra h 2.
The proliferate response was even lower in response to AGE-rAra h 2 than to thermally
processed rAra h 2 stimulation. Therefore, the CD4+ T cell immunogenicity of AGE-rAra h 2 may
be further reduced by the glycation structures on the allergen. In the amino acid sequence of Ara
h 2 arginine is fairly abundant and some lysines are also present (Chatel et al., 2003). It could be

Discussion
115
assumed that some of these residues are part of the T cell epitopes recognised by C3H/HeJ mice.
Therefore, core amino acid residues recognised by TCRs of Ara h 2 specific T cells may be
glycated by the Maillard reaction and this could influence the binding of TCRs to the MHC II – rAra
h 2 peptide complex on the surface of APCs. There are two possible ways in which T cells could
have been primed in mice immunised with AGE-rAra h 2 if core epitope residues of the allergen
where glycated: (i) the T cells in AGE-rAra h 2 immunised mice were primed in vivo by Ara h 2
epitopes which remained unglycated but of which less may be available on AGE-rAra h 2 than on
the unglycated rArah 2 forms or (ii) they were primed by glycated epitopes but glycation impairs
optimal binding to the TCRs. Both possibilities would result in a dampened T cell response to
AGE-rAra h 2. In addition, glycation may further impair the intracellular processing of the allergen
which may already be affected by aggregation, as discussed above. This could also further
reduce the T cell immunogenicity of AGE-rArah 2.
5.3.3 The glycation of rAra h 2 by the Maillard reaction reduces the antigenicity of the allergen in vivo
The present study also showed that the glycation of rAra h 2 by the Maillard reaction significantly
reduces the antigenicity of the allergen when C3H/HeJ mice were exposed to the allergen by ip
immunisation. AGE-rAra h 2 was a poor inducer of rAra h 2 specific IgE as well as IgG1 and
IgG2a (Fig. 4.41 and Fig. 4.42). The results suggested that glycation of the Maillard reaction could
also reduce the allergenicity in some food allergens.
As described in chapter 5.3.2, the activation of allergen specific CD4+ T cells in response to AGE-
rAra h 2 was lower than in response to unprocessed or thermally processed rAra h 2. Since
activated CD4+ T cells are essential for the activation of B cells and the subsequent antibody
production (chapter 1.14), the reduced activation of CD4+ T cells by AGE-rAra h 2 could be one
reason why only very little amounts of antibody were produced in mice immunised with AGE-rAra
h 2.
The reduced antigenicity of AGE-rAra h 2 could also be explained by glycation of B cell epitopes
of the allergen. It is unlikely that loss of secondary structure alone influences the antigenicity since
rAra h 2 thermally processed without glucose induced a similar level of antibody production as
unprocessed rAra h 2. Furthermore, the serum IgE from mice immunised with the unprocessed
rAra h 2 was able to bind to thermally processed Ara h 2 (Fig. 4.43). In contrast, IgE antibodies
from mice immunised with unprocessed or thermally processed rAra h 2 were not able to bind to
AGE-rAra h 2 (Fig. 4.43). Ara h 2 has eleven IgE epitopes recognised by C3H/HeJ mice (Li et al.,
2000). Some of the epitopes, including two of the three major epitopes, contain lysine and/or
arginine residues. Glycation of lysine and/or arginine residues within the B cell epitopes of Ara h 2
may hamper the recognition of AGE-rAra h 2 by B cells and therefore contribute to the reduced
antigenicity of AGE-rAra h 2.

Discussion
116
The data obtained here in vivo in a mouse model is in contrast to studies showing that roasted
peanut extracts or single glycated peanut allergens had a higher binding activity for peanut
allergic patient serum IgE than extracts from raw peanuts or unmodified single allergens (Maleki
et al., 2001; Chung et al., 2001; Gruber et al., 2005). More specifically, the binding activity for
human IgE of peptide sequences containing complete sequences or parts of the sequence of two
major Ara h 2 epitopes was increased after thermal incubation with carbohydrates, suggesting
that the incubation may have transformed these residues into high affinity IgE binding sites
(Gruber et al., 2005). One reason why human IgE may show increased binding to glycated
allergens may be that peanut allergic patients have some antibodies specific for the glycated form
of the allergens as suggested by the work by Chung et al. where AGE-specific IgG antibodies
inhibited binding of patient IgE to roasted peanut extracts (Chung et al., 2001). Increased binding
of patient serum IgE to peanut allergens after heating may also result from antibodies which were
produced in response to recognition of unmodified epitopes by the specific BCRs. That IgE
antibodies primarily produced in response to unmodified Ara h 2 can indeed exhibit enhanced
binding to the glycated allergen was demonstrated with serum from rabbits immunised with
unprocessed Ara h 2 (Gruber et al., 2005). IgE binding to glycated proteins could be enhanced
due to the polyanionic character and the alkylated lysines of the glycated protein (Sano et al.,
1999). The possible explanations why glycation enhances binding of peanut proteins to human or
rabbit IgE do not appear to apply to the particular mouse model used here. The data in Fig. 4.43
suggests that IgE antibodies produced in AGE-rAra h 2 immunised mice recognise only the
unglycated allergen, indicating that recognition of unglycated epitopes underlies the antibody
production even in mice immunised with the glycated allergen. In addition, antibodies primarily
recognising unglycated allergen do not appear to be able to bind AGE-rAra h 2 and show no
enhanced binding to rAra h 2 thermally processed without galactose (Fig. 4.43). It was shown that
nine out of the eleven epitopes recognised by C3H/HeJ mice are essentially in the same regions
as the epitopes identified as human-IgE binding epitopes, including the two major epitopes which
displayed enhanced IgE binding after being glycated (Li et al., 2000; Stanley et al., 1997; Gruber
et al., 2005). It may therefore be expected, that IgE antibodies from C3H/HeJ mice could also bind
to these glycated epitopes, but this does not appear to be the case. The human immune system is
able to respond to an enormous variety of antigens. The basis for this is the huge genetic variety
of the genes encoding the MHC molecules, the TCRs and the BCRs/Immunoglobulins found in
the population. Furthermore, the variability of these receptors is increased by mechanisms such
as gene rearrangement and polygeny. In contrast to the enormous versatility of the human
immune system, the immune system of an inbred mouse strain, such as the C3H/HeJ mouse,
where individuals are homozygous and 99% genetically identical to each other, is rather
restricted. Therefore, while Ara h 2 modified with glycation structures may be able to induce
allergen specific IgE production in some human individuals and human IgE have been shown to
bind glycated peanut allergen (Maleki et al., 2001, Gruber et al., 2005), the considerable more

Discussion
117
limited variability of IgE antibodies in the mice may not have yielded IgE antibodies which can
recognise glycated Ara h 2 despite recognising similar sequences of the allergen.
One final possibility which has to be considered is that AGE-rAra h 2 was not bound efficiently to
the plates used for the ELISAs. If this was the case, this could falsely give the impression that IgE
antibodies from C3H/HeJ mice are not able to bind to AGE-rAra h 2. It was aimed to exclude this
possibility by using different kinds of ELISA plates with coatings facilitating the capture of proteins
with a variety of molecular properties. No difference between the plates used could be observed
(data not shown). To further examine this issue, inhibition ELISAs could be performed in a future
study.
5.4 Differential effects of glycation on the T cell immunogenicity and antigenicity of OVA and rAra h 2
In this study, the glycation of OVA enhanced the CD4+ T cell immunogenicity and antigenicity of
the allergen. In contrast AGE-rAra h 2 was found to have a reduced T cell immunogenicity and
antigenicity compared to unprocessed rAra h 2. Previous studies have also suggested that the
influence of glycation on the immunostimulatory properties of a particular protein is partially
dependent on the protein itself (Price et al., 2004; Ge et al., 2005). This highlights the complexity
of the immune reaction against food allergens glycated by the Maillard reaction.
A likely explanation for the differential effect of the glycation on the immunogenicity and
antigenicity of the food allergens is that the glycation of amino acid residues within epitopes
recognised by TCRs or BCRs could influence the interaction of the allergen with the receptors. In
BL6 and BALB/c mice, the dominant epitope for OVA specific CD4+ T cells of OVA are the amino
acid residues 323-339 (one letter coded amino acid sequence: ISQAVHAAHAEINEAGR). This
region contains one arginine residue which may be glycated by the Maillard reaction. However,
the arginine residue is not a core amino acid recognised by the TCR of the transgenic OT-II and
DO11.10 CD4+ T cells, which represent a dominant clone of OVA specific CD4+ T cells in BL6 and
BALB/c mice (Robertson et al., 2000). As the T cell epitope in OVA is not influenced by the
glycation, only the enhanced binding of AGE-OVA with SR-AI/II expressed on mDCs is likely to
play a role in the enhanced T cell immunogenicity of the glycated allergen.
In contrast to OVA, T cell and/or B cell epitope(s) in rAra h 2 may be modified by glycation as was
described in the previous sections (chapter 5.3.2 and 5.3.3). To assess the immunogenicity and
antigenicity of AGE-rAra h 2, C3H/HeJ mice were used. This particular mouse strain was
identified as a high responder strain for Ara h 2 by assessing immune responses against
“unprocessed native Ara h 2” and raw peanut extract (Li et al., 2000; Proust et al., 2008). CD4+ T
cells and B cells in C3H/HeJ mice may be the best responders to the native Ara h 2, but not to the
glycated rAra h 2.
While it was shown here that both AGE-OVA and AGE-rAra h 2 had been modified with CML and
GA-pyridine by thermal processing with carbohydrates, the glycation profile of the two allergens

Discussion
118
would not be exactly the same. For example, on AGE-OVA CEL could be detected (Fig. 4.2) but it
was not found on AGE-rAra h 2 (Fig. 4.37). It is therefore possible that the different glycation
profiles of the allergens contribute to the contrasting influence which the Maillard reaction has on
the immunostimulatory properties of each allergen. The different modifications present could
influence the recognition of the allergen by TCRs and BCRs or the antigen processing due to
different sizes and molecular properties of the individual glycation structures.
The particular glycation structures present on an allergen would also influence to which
endocytotic receptors the allergen can bind. It was not tested whether AGE-rArah 2 binds to, for
example, SR-AI/II. It was shown that enhanced CD4+ T cell activation by AGE-OVA is heavily
dependent on the interaction of the glycated allergen with SR-AI/II. If AGE-rAra h 2 is not able to
bind to SR-AI/II, this could also contribute to the differences seen in the immunogenic properties
of the glycated forms of the two allergens.
Collectively the presented data suggests that the influence which the glycation has on the
immunogenic properties of a particular food allergen depends on the occurrence of glycation
within T cell and/or B cell epitopes of the allergen. The interaction with endocytotic receptors
expressed by APCs is also likely to play a role.
5.5. Potential Allergenicity of AGEs of food allergens
In this thesis it could be demonstrated that the Maillard reaction influences the CD4+ T cell
immunogenicity of the hen egg white allergen OVA and the recombinant peanut allergen Ara h 2.
CD4+ T cells are a critical component for the IgE production by B cells and subsequently the
allergic responses. Hence, the results presented here suggest that the Maillard reaction could be
capable of influencing the allergenicity of food allergens in allergic individuals. If the glycation by
the Maillard reaction does not attenuate T cell and B cell epitope recognition, the glycated food
allergens could enhance Th2 cell activation and subsequent IgE production by efficient SR-AI/II
mediated uptake of the AGEs by DCs. In fact, AGE-OVA, which is capable of binding to SR-AI/II,
induced higher CD4+ T cell activation and IgE production in mice than its unglycated counterparts.
An increased amount of IgE could augment the activation of effector cells, e.g. mast cells,
resulting in the release of more inflammatory mediators. This would lead to an increase in the
severity of allergic symptoms. To our knowledge, the present study is the first to demonstrate that
the formation of AGEs enhances the CD4+ T cell immunogenicity, antigenicity and potential
allergenicity of a food allergen. The results strongly suggest that the influence of the Maillard
reaction needs to be carefully considered in the evaluation of the allergenicity of food allergens.
The results in this thesis show that AGE-OVA was able to enhance the production of Th1 as well
as Th2 cytokines by allergen specific CD4+ T cells (Fig. 4.10). Therefore, while AGE stimulation
can result in enhanced activation of allergen specific CD4+ T cells and a subsequent increase in
cytokine production, the increase of both Th1 and Th2 cytokines in response to AGEs indicates

Discussion
119
that they do not alter the differentiation of activated CD4+ T cells. In recent years, studies have
been published which suggest that in healthy subjects IL-10 producing regulatory T cells (Tregs)
are the dominant T cell subset specific for food allergens, in contrast, patients with allergy have
increased numbers of allergen specific IL-4 producing T cells (Akdis M, et al., 2004; Akdis CA, et
al., 2005). In healthy individuals, glycated allergens may enhance the activation of Tregs and help
to maintain tolerance. In allergic patients, glycated allergens could enhance activation of Th2 T
cells and promote allergic symptoms by increased production of cytokines which enhance
allergen specific IgE production (mediated by IL-4, IL-13) or activation and infiltration of
inflammatory cells such as eosinophils (IL-5).
It has been speculated that the glycation structures in food allergens could act as novel B cell
epitopes. The results presented here do not clearly show an induction of antibodies specifically
binding to AGE structures in mice. However, this does not exclude the possibility that anti-AGE
antibodies are induced in human subjects. Compared to the mouse immune system, the immune
system of humans has a much greater diversity in regards to genes encoding MHC molecules,
TCRs and BCRs/immunoglobulins. The vast genetic diversity enables the human immune system
to respond to the enormous amount of different antigens which it encounters. In the genetic
diversity among different individuals some would produce antibodies specific for the glycated form
of a particular allergen while others may not. This notion is supported by observation that some
but not all allergic patients have IgE antibodies exclusively to determinants found in a particular
food only after thermal processing or storage or have allergic reactions only to the cooked form of
a food (Prausnitz and Kustner, 1921; Malanin, 1995; Rosen et al., 1994). Furthermore, several
studies have shown the existence of T cells specially recognising glycoepitopes (Dudler et al.,
1995; Corthay et al., 1995; Michaelsson et al., 1996; Haurum et al., 1994), suggesting that T cells
specific for glycation structures could also be induced in humans. Studies with human cell culture
systems, preferably employing APCs and T cells from food allergic individuals, would give further
insight to how the glycation of food allergens could influence the immune response in food allergy.
In the past decade, the prevalence of food allergy has increased and currently no effective
treatment has been established. It is therefore a pressing concern to gain further understanding of
the mechanisms underlying food allergy in order to develop new strategies of treatment and
prevention. One important aspect to study would be the properties of the food allergens
themselves. While many food allergens have been isolated and characterised, the influence which
food processing has on the allergenic properties of allergens has not been studied in great detail.
In the present study it could be shown that the Maillard reaction, as it occurs during thermal
processing and storage of food, can severely alter the T cell immunogenicity and antigenicity of
food allergens which could potentially contribute in the enhancement in the severity of allergic
reactions. The results of this thesis unequivocally show that the influence of the Maillard reaction
is an important factor to be considered when studying the pathology of food allergy. This study
can help to increase our understanding of the mechanisms contributing to food allergy.

Summary
120
6 Summary The Maillard reaction takes place between proteins and reducing sugars during thermal
processing and storage of foods. The reaction produces protein derivates with glycation structures
such as Nε-carboxyethyllysine (CEL), Nε-carboxymethyllysine (CML), pyrralin and GA-pyridine,
collectively called advanced glycation end products (AGE). As many foods are cooked in some
form before being consumed, a potential involvement of AGEs in the pathology of food allergy is
of great interest. This assumption is corroborated by the fact that some food allergic patients show
anaphylactic reactions only against stored or heated foods. The Maillard reaction may create new
pathogenesis related immune epitopes in food allergy. The aim of this thesis was to examine the
influence of the Maillard reaction on the immunogenic properties of food allergens.
In the first part of the thesis, the influence of the Maillard reaction on the T cell immunogenicity of
the egg white allergen OVA was studied. The uptake mechanisms of mDCs for AGE-OVA were
investigated using inhibitors of putative cell surface receptors for AGEs as well as mDCs which
are deficient of one of these receptors. Here, it was shown for the first time that an AGE of a food
allergen has a higher T cell immunogenicity than its native counterpart. AGE-OVA was prepared
by thermal processing of OVA in the presence of glucose. Activation and proliferation of OVA
specific CD4+ T cells by AGE-OVA was evaluated in co-cultures with mDCs as antigen presenting
cells. Compared to the controls (native OVA and OVA thermally processed without glucose),
AGE-OVA enhanced the activation of OVA-specific CD4+ T cells upon co-culture with mDCs. The
result indicates that glycation of OVA by the Maillard reaction enhances the T cell immunogenicity
of the allergen. Antigen specific T cell activation is preceded by the uptake of antigens by DCs. In
the present study, it was found that mDC uptake of AGE-OVA was significantly higher than that of
the controls. Additionally, the scavenger receptor class A type I and II (SR-AI/II) was identified as
a mediator of AGE-OVA uptake, whereas the receptor for AGEs (RAGE) and galectin-3 were not
involved. CD4+ T cell activation in response to stimulation with AGE-OVA was significantly
inhibited when the T cells were cultured with SR-AI/II deficient mDCs. Furthermore,
immunocytochemistry data showed co-localisation of AGE-OVA with SR-AI/II and MHC II in
mDCs incubated with the glycated allergen. The presentation of soluble antigens by APCs is
governed by endocytotic receptors, which determine the intracellular routing of the endocytosed
molecules. The results of this thesis suggest that SR-AI/II targets its ligands to the MHC class II
loading pathway in DCs. Taken together, the presented data allows the following hypothesis. The
glycation of OVA results in an enhanced association of the allergen with SR-AI/II which leads to
the observed increased uptake of the allergen by mDCs. Therefore, larger amounts of the
allergen enters the MHC class II loading pathway, leading to a greater amount of OVA peptide-
MHC II complex being presented on the cell surface of mDCs. This in turn results in the observed
enhanced activation and proliferation of the OVA specific CD4+ T cells by AGE-OVA. Collectively,
the data shown in this thesis indicate that mDC expressed SR-AI/II is critical for the enhanced
CD4+ T cell immunogenicity of AGE-OVA.

Summary
121
Next, T cell immunogenicity and antigenicity of AGE-OVA was evaluated in vivo. C57BL/6 mice
received subcutaneous (sc) or intraperitoneal (ip) immunisation with native, thermally processed
or AGE-OVA. For the evaluation of the T cell immunogenicity, CD4+ T cells were isolated from
lymph nodes of immunised mice and the activation/proliferation of T cells upon recall stimulation
with the allergens was measured. To assess the antigenicity, levels of allergen specific antibodies
in sera of ip immunised mice were measured by ELISA. Importantly, AGE-OVA showed a higher
T cell immunogenicity in mice which had received sc immunisation with either form of OVA.
Furthermore, when the mice received OVA by ip immunisation, AGE-OVA induced a higher IgE
production than native or thermally processed OVA. These results indicate that AGE-OVA has a
higher CD4+ T cell immunogenicity as well as an enhanced antigenicity in vivo in comparison to
the unglycated forms of OVA. Since CD4+ T cells play a pivotal role in the IgE production by B
cells, the enhanced T cell immunogenicity of AGE-OVA would explain the higher IgE production
following immunisation with the glycated allergen. IgE antibodies are critical components in the
induction of allergic responses. Therefore, the results of this thesis suggest that the Maillard
reaction would be capable of enhancing the allergenicity of food allergens.
In the final part of the thesis, the influence of glycation by the Maillard reaction on the T cell
immunogenicity and antigenicity of the major peanut allergen rAra h 2 was studied. As peanuts
are responsible for the majority of the more severe allergic reactions to food and are usually eaten
after thermal processing, it is of major interest to elucidate how the Maillard reaction affects the
allergenic potential of the peanut allergen. In order to evaluate the T cell immunogenicity and
antigenicity of AGE-rAra h 2, C3H/HeJ mice were ip immunised with unprocessed rAra h 2, rAra h
2 thermally processed without carbohydrate or AGE-rAra h 2. AGE-rAra h 2 showed a lower T cell
immunogenicity in mice receiving ip immunisation than unprocessed or thermally processed rAra
h 2. Furthermore, the ip immunisation with AGE-rAra h 2 induced a lower IgE production than ip
immunisation with its unglycated counterparts. Collectively these results suggest that the glycation
of rAra h 2 may reduce the allergenicity of the allergen.
In conclusion, the present study shows that the Maillard reaction alters the allergenic properties of
food allergens considerably by influencing the T cell immunogenicity of the allergens. The results
of this thesis strongly support the significance of Maillard glycation products as pathogenesis-
related factors in food allergy. Here, the immune mechanisms underlying the influence of
glycation structures on T cell immunogenicity of food allergens were elucidated. If the glycation by
the Maillard reaction does not attenuate the recognition of T cell or B cell epitopes, glycation of
food allergen can enhance allergen specific CD4+ T cell activation and subsequent IgE production
by efficient SR-AI/II mediated uptake of the allergens by DCs. Together, this study provides
valuable information about the allergenicity of glycated proteins in thermally processed foods and
helps to increase our knowledge on the respective mechanisms of food allergy.

German Summary
122
7 German Summary Die allergische Reaktion ist eine Überempfindlichkeit des Immunsystems gegenüber harmlosen,
nicht-infektiösen Substanzen, sogenannten Allergenen. Stoffe die allergische Reaktionen vom
Soforttyp (IgE-vermittelt) hervorrufen können sind z.B. Pflanzenpollen, tierische Epithelzellen,
Staubmilben, Insektengifte und Lebensmittel. Die darin sich befindenden Allergene sind meist
Proteine. Für die Ausbildung einer allergischen Erkrankung ist ein wiederholter Kontakt mit den
Allergenen nötig. Während des ersten Kontaktes mit dem Allergen wird das Immunsystem
sensibilisiert, dabei werden Immunzellen wie z.B. dendritische Zellen, T-Zellen und B-Zellen
aktiviert und Allergen-spezifische Antikörper gebildet. Insbesondere IgE Antikörper spielen bei der
Allergie eine wichtige Rolle. Bei dem ersten Kontakt mit dem Allergen kommt es noch nicht zur
Manifestation von Symptomen. Erst bei einem wiederholten Kontakt mit dem Allergen werden
Symptome induziert. Die Symptome können lokal sein wie zum Beispiel Juckreiz in Mundhöhle
und Pharynx bei Nahrungsmittelallergien oder die allergische Rhinitis bei der die oberen
Atemwege betroffen sind. Es kann aber auch zu systemischen Reaktionen wie einem
anaphylaktischen Schock kommen, der zum Tode führen kann.
Die Prävalenz von Lebensmittelallergien hat in den vergangenen Jahrzehnten in der Bevölkerung
der westlichen Welt deutlich zugenommen (Sicherer 2002; Sampson 2003) und aktuell gibt es
keine wirkungsvolle kausale Behandlung. Es ist deshalb von hohem Interesse die Mechanismen
der Nahrungsmittelallergie weiter zu untersuchen, um neue Strategien für die Prophylaxe und
Therapie entwickeln zu können. Ein wichtiger Faktor dabei ist es, die Eigenschaften der Allergene
besser einordnen zu können. Dabei muss bedacht werden, dass Lebensmittel vor dem Verzehr
häufig verschiedenen Prozessen, wie z.B. Garen durch Hitze unterzogen werden, die sich
erheblich auf die immunogenen Eigenschaften der Allergene auswirken können. Abhängig von
den Bedingungen der Prozessierung und der Hitzestabilität des Proteins, kann sich die
Allergenität eines Allergens durch Hitze verringern, aber ebenso auch erhöhen. Einer Erhöhung
der Allergenität können ein oder mehrere Dinge zugrundeliegen, so kann das Allergen z.B.
resistenter gegenüber Verdauungsenzymen werden (Maleki et al., 2001). Durch die
Denaturierung des Proteins können möglicherweise IgE-Bindungsstellen leichter zugänglich
werden, oder auch neue entstehen. Auch durch chemische Modifikation können neue IgE-
Bindungsstellen auftauchen. Durch das Entstehen neuer Bindungsstellen können somit
sogenannte Neoallergene gebildet werden. Ein biochemischer Prozess der während der
Lagerung bzw. der Verarbeitung von Lebensmitteln unter Hitzeeinwirkung abläuft und zur Bildung
von Neoallergenen führen, bzw. die allergenen Eigenschaften von bestehenden Allergenen
verändern kann, ist die Maillard-Reaktion.
Die Maillard Reaktion ist verantwortlich für die nicht-enzymatische Bräunung der Lebensmittel.
Während der Reaktion werden die Aminosäure-Gruppen der Proteine durch nicht-enzymatische
Kondensation mit reduzierenden Zuckern modifiziert. Die dabei entstehenden Glykosylamine
bilden durch Umlagerung die ersten stabilen Produkte der Reaktion, die sogenannten Amadori-

German Summary
123
Produkte. Diese können zu reaktiven Dicarbonyl-Intermediaten degradiert werden, welche mit
weiteren Aminosäureresten reagieren und durch Quervernetzungen oder Umlagerungen stabile
Endprodukte bilden (Henle, 2005). Beispiele solcher Endprodukte sind Nε-Carboxyethyl-Lysin
(CEL), Nε-Carboxymethyl-Lysin (CML), Pyrraline und Glykoaldehyde-Pyridine (GA-pyridine).
Proteine die auf diese Weise durch die Maillard-Reaktion modifiziert wurden, nennt man
advanced glycation end products (AGEs). Um den Prozess von der enzymatischen
Glykosylierung zu unterscheiden, wurde der Begriff Glykierung eingeführt (Ledl and Schleicher,
1990).
Bereits veröffentliche Studien deuten darauf hin, dass die Maillard-Reaktion eine wichtige Rolle im
Pathomechanismus der Lebensmittelallergie spielt. So gibt es eine Reihe von Veröffentlichungen
die Fälle beschreiben bei denen allergische Reaktionen auf gekochte, aber nicht auf rohe
Lebensmittel beobachtet wurden (Prausnitz and Kustner, 1921; Malanin, 1995). Des Weiteren
wurde gezeigt, dass die Glykierung von Allergenen durch die Maillard-Reaktion deren Fähigkeit
Serum-IgE von Patienten mit einer Sensibilisierung für das entsprechende Allergen zu binden
signifikant erhöhen (Gruber et al., 2005; Chung et al., 2001; Chung et al., 2003). Diese
Beobachtungen sprechen deutlich dafür, dass durch die Maillard-Reaktion neue, für die
Pathogenese der Lebensmittelallergie relevante, Immunepitope entstehen.
Bei der Sensibilisierung und auch bei den allergischen Reaktionen nach wiederholten
Allergenkontakt spielen dendritische Zellen und T-Zellen, insbesondere CD4+ T-Zellen, eine
zentrale Rolle. Bisherige Studien haben unterschiedliche Auswirkungen von AGEs auf
dendritische Zellen gezeigt. AGE-Derivate von BSA induzierten verstärkt die Reifung der
dendritischen Zellen und erhöhten auch deren Fähigkeit die Aktivierung von T-Zellen zu
induzieren (Ge et al., 2005). Im Gegensatz dazu, zeigte sich, dass AGE-Derivate des
Adrenocorticotrophen Hormons die Reifung von dendritischen Zellen inhibiert und deren Kapazität
T-Zellen zu stimulieren verringert (Price et al., 2001). Diese Ergebnisse zeigen, dass die T-Zell-
Immunogenität von Antigenen durch die Maillard-Reaktion beeinflusst werden kann. Allerdings ist
der Einfluss von AGE-Derivaten von Lebensmittelallergenen auf die Funktion von dendritischen
Zellen und die Aktivierung von T-Zellen weitgehend unbekannt, insbesondere gab es bisher keine
in vivo Studien die den Einfluss der Maillard-Reaktion auf die immunogenen Eigenschaften von
Allergenen untersucht haben.
Der Aktivierung von T-Zellen geht die Aufnahme des Allergens durch die dendritischen Zellen
voran. Häufig vermitteln Rezeptoren auf der Oberfläche der dendritischen Zellen die Aufnahme.
Für einige Rezeptoren wurde gezeigt, dass sie AGEs binden können, zu diesen gehört RAGE
(Receptor for AGEs) (Schmidt et al., 1992; Neeper et al., 1992), Galectin-3 (Vlassara et al., 1995),
macrophage scavenger receptor class A type I/II (SR-AI/II) (Suzuki et al., 1997; Araki et al., 1999)
sowie scavenger receptor class B type I und CD36 (Ohgami et al., 2001 a; Ohgami et al., 2001).
Welche Rezeptoren für die Aufnahme von AGEs durch dendritische Zellen verantwortlich sind,
wurde bisher nicht genau untersucht.

German Summary
124
In dieser Dissertation sollte der Einfluss der Maillard-Reaktion auf die immunogenen
Eigenschaften von Lebensmittelallergenen in vitro und in vivo untersucht werden. Dafür wurde
zum einen das Modelallergen Ovalbumin (OVA) und zum anderen ein Majorallergen der Erdnuss,
Ara h 2, in rekombinanter Form verwendet (rAra h 2). Von beiden Allergenen wurde durch
Erhitzen zusammen mit einem Kohlenhydrat ein AGE-Derivat hergestellt, AGE-OVA bzw. AGE-
rAra h 2. Für alle Versuche wurden als Kontrollen unbehandeltes Allergen und Allergen welches
ohne Kohlenhydrate erhitzt wurde verwendet.
Im ersten Teil der Arbeit wurden die immunogenen Eigenschaften von AGE-OVA in vitro in
murinen Zellkulturen untersucht. Verwendet wurden dabei aus Knochenmarkzellen der Maus
generierte dendritische Zellen. Des Weiteren wurden T-Zellen verwendet die aus der Milz von
transgenen Mäusen isoliert wurden. Diese T-Zellen besitzen T-Zellrezeptoren die spezifisch OVA
erkennen. Es konnte gezeigt werden, dass die Modifizierung von OVA durch die Maillard-
Reaktion die CD4+T-Zell-Immunogenität des Allergens deutlich erhöht: AGE-OVA induzierte eine
verstärkte Aktivierung und Proliferation von CD4+ T-Zellen die mit dendritischen Zellen co-
kultiviert wurden. Die erhöhte Stimulation der CD4+ T-Zellen durch AGE-OVA wurde nur
beobachtet, wenn die T-Zellen mit dendritischen Zellen kultiviert wurden. AGE-OVA kann daher
die T-Zellen nicht direkt aktivieren, sondern muss von den dendritischen Zellen aufgenommen,
prozessiert und auf MHC Klasse II Molekülen (MHC II) präsentiert werden, um von den T-Zellen
erkannt zu werden. Daraus ließ sich schlussfolgern, dass die erhöhte Aktivierung der CD4+ T-
Zellen durch AGE-OVA von der Interaktion des glykierten Allergens mit den dendritischen Zellen
abhängig ist. Im Folgenden wurde gezeigt, dass AGE-OVA besser von den dendritischen Zellen
aufgenommen wird, als natives OVA oder OVA welches ohne Glukose erhitzt wurde. Es war
deshalb von Interesse den oder die Rezeptor(en) zu identifizieren welche die Aufnahme von
AGE-OVA vermitteln. OVA besitzt durch enzymatische, postranslationale Glykosilierung eine
Kohlenhydratseitenkette aus N-Acetyl-Glukosamin und Mannose. Es ist bekannt, dass Mannose
die Bindung an den Mannoserezeptor (MR) erlaubt und OVA durch diesen Rezeptor
aufgenommen wird (Huntington 2001 et al., Burgdorf 2006, Autenrith et al., 2007). Das konnte in
der vorliegenden Arbeit für alle drei OVA-Formen bestätigt werden. Zusätzlich stellte sich heraus,
dass SR-AI/II eine elementare Rolle bei der Aufnahme von AGE-OVA spielt. Für die Aufnahme
von nativen und ohne Glukose erhitztem OVA spielte er dagegen nur eine untergeordnete Rolle.
Es wurde in früheren Publikationen gezeigt, dass Antigene die über Scavenger Rezeptoren
aufgenommen werden hauptsächlich auf MHC II präsentiert werden und CD4+ T-Zellen aktivieren
(Burgdorf et al., 2007). Auch die Ergebnisse der vorliegenden Arbeit deuten darauf hin, dass
AGE-OVA welches von SR-AI/II aufgenommen wird auf MHC II präsentiert wird. Zum einen führte
die Kultivierung von OVA-spezifischen CD4+ T-Zellen mit SR-AI/II defizienten dendritischen Zellen
zu einer signifikanten Reduktion der CD4+ T-Zell-Aktivierung was darauf hindeutet, dass die SR-
AI/II-vermittelte Aufnahme des Allergens zur Aktivierung der CD4+ T-Zellen beiträgt. Zum anderen
zeigte sich, dass die Glykierung von OVA nicht zu einer erhöhten CD8+ T-Zell-Aktivierung führte.
Das deutete darauf hin, dass OVA welches vom SR-AI/II aufgenommen wurde nicht auf MHC I

German Summary
125
präsentiert wurde. In vorhergehenden Studien wurde gezeigt, dass OVA-spezifische CD8+ T-
Zellen durch OVA aktiviert werden, welches vom MR aufgenommen wurde (Burgdorf et al., 2007).
Da alle drei OVA-Formen ähnlich gut vom MR aufgenommen wurden, entspricht das Ergebnis
den Erwartungen. Weitere Hinweise darauf, dass OVA, welches vom SR-AI/II aufgenommen
wurde auf MHC II präsentiert wird, stammen von Experimenten mit rekombinanten OVA.
Rekombinantes, in E. coli hergestelltes, OVA besitzt keine natürlichen Kohlenhydratseitenketten
die ein Aufnahme durch Rezeptoren ermöglicht und wird deshalb nur durch Pinozytose
aufgenommen. Im Gegensatz zur Aufnahme von nativen, ohne Glukose erhitzten und AGE-OVA,
wurde die Aufnahme von rekombinanten OVA deshalb nicht durch die Abwesenheit von SR-AI/II
auf den dendritischen Zellen beeinflusst. Gleiches galt für die Aktivierung von CD4+ T-Zellen
durch rekombinantes OVA. Zusätzlich war die Aufnahme des rekombinanten OVAs und auch die
Aktivierung der T Zellen sehr gering. Durch Pinozytose aufgenommenes OVA wird ebenfalls auf
MHC II präsentiert (Burgdorf et al., 2007). Natives, ohne Glukose erhitztes, wie auch AGE-OVA
werden zusätzlich zur Pinozytose vor allem durch MR bzw. SR-AI/II vermittelte Endozytose
aufgenommen. Die Ergebnisse der vorliegenden Arbeit lassen folgende Hypothese zu: Sowohl
natives als auch ohne Glukose erhitztes OVA können durch ihre Kohlenhydratseitenkette an SR-
AI/II binden und der Rezeptor vermittelt eine partielle Aufnahme dieser nicht-glykierten OVA-
Formen. AGE-OVA hat zusätzlich zu der natürlichen Kohlenhydratseitenkette die AGE-Strukturen
auf der Oberfläche, die eine stärkere Bindung an SR-AI/II erlauben und daraus folgt eine erhöhte
Aufnahme von AGE-OVA durch die dendritischen Zellen. Das führt dazu, dass eine größere
Menge des Allergens für die MHC II-Beladung prozessiert wird. Dadurch erhöht sich die Menge
an MHC II-OVA-Peptid-Komplexen auf der Oberfläche der dendritischen Zellen, wodurch
wiederum eine stärkere Aktivierung der CD4+ T-Zellen stattfinden kann. Dieses Ergebnis wird
durch frühere Publikationen unterstützt, die gezeigt haben, dass die CD4+ T-Zell-Immunogenität
erhöht wird, wenn Proteine chemisch so modifiziert werden, dass sie an SR-AI/II binden können
(Abraham et al., 1995; Nicoletti et al., 1999).
Ein Einfluss der Glykierung durch die Maillard-Reaktion auf die Fähigkeit von OVA die Reifung
der dendritischen Zellen zu induzieren konnte dagegen nicht beobachtet werden. Eine Erklärung
dafür könnte das Fehlen von RAGE auf den hier verwendeten Zellen sein, wurde doch in einer
früheren Studie gezeigt, dass die verstärkte Reifung der dendritischen Zellen nach Stimulation mit
AGE-BSA von der Anwesenheit von RAGE abhing (Ge et al., 2005), dessen Bedeutung für die
Reifung von dendritischen Zellen auch in anderen Studien gezeigt wurde (Dimitriu et al., 2005;
Manfredi et al., 2008).
Im zweiten Teil der Arbeit wurde der Einfluss der Glykierung auf die T-Zellen Immunogenität und
die Antigenität von OVA in vivo untersucht. Hierfür wurden C57BL/6-Mäuse subkutan oder
intraperitoneal mit AGE-OVA, oder einer der Kontrollen immunisiert. Zur Bestimmung der T-Zell-
Immunogenität wurden die CD4+ T-Zellen der Lymphknoten bzw. der Milz isoliert und in vitro mit
den Allergenen restimuliert. Daraufhin wurde die Aktivierung bzw. die Proliferation der T-Zellen
gemessen. Es konnte gezeigt werden, dass bei der subkutanen Immunisierung der Mäuse, AGE-

German Summary
126
OVA eine deutlich höhere T-Zellen-Immunogenität besitzt als natives oder ohne Glucose erhitztes
OVA. Weiterhin induzierte AGE-OVA in Mäusen denen die Allergene intraperitoneal verabreicht
wurden eine höhere allergenspezifische IgE-Produktion, als die Kontrollen. Somit konnte gezeigt
werden, dass die Glykierung von OVA nicht nur dessen OVA-spezifische CD4+ T-Zell-
Immunogenität in vitro und in vivo erhöht, sondern auch die Antigenität des Allergens verstärkt.
Da die B-Zell-Aktivierung und die IgE-Produktion dieser Zellen maßgeblich von CD4+ T-Zellen
beeinflusst wird, ist die erhöhte IgE-Produktion nach Immunisierung mit AGE-OVA mit großer
Wahrscheinlichkeit auf die verstärkte Aktivierung der allergenspezifischem CD4+ T-Zellen
zurückzuführen.
Schlussendlich sollte der Einfluss der Maillard-Reaktion auf die immunstimulatorischen
Eigenschaften eines Hauptallergens der Erdnuss, Ara h 2, untersucht werden. Erdnüsse sind die
häufigsten Verursacher von sehr starken allergischen Reaktionen nach dem Verzehr von
Nahrungsmitteln, diese können mitunter auch letal sein (Burks et al., 1992; Burks et al., 1995).
Erdnüsse werden meist erst nach thermischer Verarbeitung verzehrt. Es wurde gezeigt, dass die
Maillard-Reaktion in Erdnüssen stattfindet (Maleki et al., 2001, Chung et al., 2003). Es sollte
deshalb auch hier untersucht werden wie die Glykierung des Allergens dessen T-Zell-
Immunogenität und die Antigenität in vivo beeinflusst. Dafür wurden C3H/HeJ-Mäuse
intraperitoneal mit AGE-rAra h 2, oder einer der Kontrollen immunisiert und die Immunogenität
und die Antigenität wie für OVA beschrieben analysiert. Es stellte sich heraus, dass die
Glykierung von rAra h 2 zu einer deutlichen Reduktion von sowohl der T-Zell-Immunogenität als
auch der Antigenität führte. Es scheint möglich, dass durch die Glykierung T-Zellen-Epitope
verändert wurden und dadurch eine effektive Aktivierung der CD4+ T-Zellen eventuell durch
verminderte Bindung des T-Zellen-Rezeptors verhindert wurde. Es besteht auch die Möglichkeit,
dass im Falle von rAra h 2 die Glykierung eine reduzierte Prozessierung und Präsentation des
Allergens durch Antigen-präsentierende Zellen zur Folge hat. Die verringerte Antigenität ist
höchstwahrscheinlich eine direkte Folge der geringen T-Zell-Aktivierung durch AGE-rAra h 2.
Mitunter könnten auch die B-Zell-Epitope glykiert sein und ebenfalls die Bindung des Allergens an
die Rezeptoren behindern.
Zwar beeinflusste die Maillard-Reaktion die immunstimulatorischen Eigenschaften sowohl von
OVA als auch von rAra h 2, der Effekt für die beiden Allergene war aber gegensätzlich. Auch
andere Studien haben gezeigt, dass der Einfluss den die nicht-enzymatische Glykierung auf ein
Protein haben kann, nicht zuletzt auch von der Eigenschaft des Proteins selber abhängig ist
(Price et al., 2004; Ge et al., 2005). Eine Möglichkeit für den Unterschied kann die Positionen
sein, an denen die beiden Allergene modifiziert wurden. Während die Epitope von OVA die für die
Bindung des Allergens durch T- und B-Zellen benötigt werden evtl. nicht modifiziert wurden bzw.
nur an Stellen wo die Bindung nicht behindert wurde, könnten die Epitope von rAra h 2 so
modifiziert wurden sein, dass die Bindungen teilweise blockiert wurden.
Th2-Lymphozyten spielen eine kritische Rolle in der Pathogenese der Allergie. AGE-OVA konnte
in vitro sowohl die Sekretion des Th1-Zytokins IFN-γ, als auch des Th2-Zytokins IL-4 durch die

German Summary
127
CD4+ T-Zellen erhöhen. Es fand dabei aber keine Polarisierung der Zytokin-Produktion statt. Die
Zytokine beeinflussen die Antikörperantwort; während Th1-Zytokine die Produktion von IgG2a
fördern, führt die Ausschüttung von Th2-Zytokinen zur Produktion von IgG1 und IgE (Kopf et al.,
1993; Coffman et al, 1986; Snapper et al., 1987). In vivo führte die Immunisierung mit AGE-OVA
im Vergleich zur Immunisierung mit nativen oder ohne Glucose erhitztes OVA nicht zu einer
nennenswerten Veränderung des Verhältnisse von IgG1 zu IgG2a. Daher zeigen zwar sowohl die
in vitro als auch die in vivo Daten, dass AGE-OVA die Aktivierung der CD4+ T-Zellen erhöht aber
keine Polarisierung in Richtung eines bestimmtes Th Phenotypes bewirkt. In gesunden Individuen
sind IL-10 produzierende regulatorische T-Zellen der dominierende Allergen-spezifische T-Zellen
Subtyp, während bei Allergikern eine erhöhte Anzahl an IL-4 produzierenden Allergen-
spezifischen T-Zellen festgestellt werden konnte (Akdis M, et al., 2004; Akdis CA, et al., 2005). In
gesunden Menschen könnte es daher zu eine verstärkten Aktivierung der regulatorischen T-
Zellen durch glykierte Allergene kommen und die Toleranz gegenüber harmlosen Allergenen
fördern, während es womöglich in Allergikern zu einer verstärkten Aktivierung von Allergen-
spezifischen Th2 Zellen kommt. Die dementsprechend erhöhte Ausschüttung an Th2-typischen
Zytokinen würde zu einem Anstieg der IgE-Produktion (durch IL-4, IL-13) oder zur Einwanderung
und Aktivierung von Eosinophilen (IL-5) führen. Das wiederum hätte eine Verschlimmerung der
allergischen Symptome zur Folge.
Es wurde gemutmaßt, dass Glykierungs-Strukturen die durch die Maillard-Reaktion bei
Lebensmitteln entstehen als neue B-Zellen-Epitope fungieren könnten. Die Ergebnisse der
vorliegenden Arbeit zeigen keine eindeutigen Hinweise darauf, dass in den immunisierten
Mäusen Antikörper, die spezifisch Glykierungs-Strukturen binden, induziert wurden. Diese
Feststellung schließt aber nicht aus, dass in Allergikern anti-AGE-Antikörper gebildet werden. Im
Vergleich zum Immunsystem der Maus, besitzt das humane Immunsystem eine wesentlich
grössere Variabilität hinsichtlich der Gene welche für die MHC-Moleküle, T-Zell-Rezeptoren und
B-Zellen-Rezeptoren/Immunoglobuline kodieren. Die große genetische Variabilität ermöglicht es
dem menschlichen Immunsystem auf die enorme Vielfalt an Antigenen zu reagieren. Zieht man
die genetische Diversität zwischen einzelnen Individuen in Betracht, so erscheint es realistisch,
dass einige Menschen Antikörper spezifisch für AGE-Derivate von Lebensmittelallergenen
produzieren, andere dagegen nicht. Diese Ansicht wird auch dadurch unterstützt, dass einige
Allergiker nur auf erhitzte Nahrungsmittel reagieren, andere aber nur auf rohe. Zudem haben
einige Studien gezeigt, dass es T-Zellen gibt, die spezifisch Glykanepitope erkennen (Dudler et
al., 1995; Corthay et al., 1995; Michälsson et al., 1996; Haurum et al., 1994), was darauf
hindeutet, dass es auch T-Zellen mit einer Spezifität für Glykierungs-Strukturen geben könnte.
Studien in humanen Zellkulturen, vorzugsweise mit Antigen-präsentierenden Zellen von
Lebensmittelallergikern könnten dazu beitragen weitere Erkenntnisse darüber zu gewinnen wie
die Glykierung von Nahrungsmittelallergenen die humane Immunantwort auf das respektive
Allergen beeinflussen kann.

German Summary
128
Zusammengefasst konnte in dieser Arbeit gezeigt werden, dass die Maillard Reaktion die CD4+ T-
Zellen-Immunogenität des Hühnereiweiss-Allergens OVA und des Erdnuss-Allergens Ara h 2
beeinflussen kann. Da CD4+ T-Zellen ein zentrale Rolle bei der Produktion von IgE-Antikörpern
durch B-Zellen spielen, und somit auch für die darauf folgenden Symptome, zeigen die hier
präsentierten Ergebnisse, dass die Maillard-Reaktion die Allergenität von Nahrungsmittel-
Allergenen in Individuen mit Nahrungsmittelallergie beeinflussen könnte. Es besteht die
Möglichkeit, dass die Glykierung durch die Maillard-Reaktion die Erkennung von T- und B-
Zellepitope inhibieren kann. Ist diese jedoch nicht der Fall, wie höchst wahrscheinlich bei OVA, so
könnten glykierte Lebensmittelallergene die Th2-Akitiveirung und die IgE-Produktion erhöhen
indem sie effizienter durch SR-AI/II-vermittelte Endozytose von dendritischen Zellen
aufgenommen werden als das native Protein. Diese These wird dadurch unterstützt, dass in
dieser Arbeit gezeigt wurde, dass AGE-OVA auch in vivo eine erhöhte CD4+ T-Zell-Aktivierung
und IgE-Produktion auslösen kann, wahrscheinlich durch Interaktion mit SR-AI/II. Soweit bekannt,
ist die vorliegende Arbeit die erste Studie die zeigt, dass die Bildung von AGEs die CD4+ T-Zell-
Immunogenität, Antigenität und potentiell die Allergenität von Lebensmittelallergenen erhöhen
kann. Schlussfolgernd zeigen die Ergebnisse, dass der Einfluss der Maillard-Reaktion bei der
Bewertung der Allergenität von Lebensmitteln bedacht werden sollte. In zukünftigen Studien muss
zu einem geklärt werden welche AGE-Strukturen an SR-AI/II binden können, zum anderen wäre
es von Interesse, dass in vitro Studien mit Immunzellen durchgeführt werden die von Allergikern
isoliert wurden.
Abbreviations
129
8 Abbreviations °C Degree Celcius
µCi Microcurie
µg Microgram
µl Microlitre 3H Tritium
Ax Absorbance at x nm
aa Amino acid
Ab Antibody
AD Alzheimers disease
APC Antigen presenting cell
APC Allophycocyanin
AGE Advanced glycation end products
Ara h Arachis hypogaea (peanut)
BCA Bicinchoninic acid
BCR B cell receptor
Bet v Betula verrucosa (common birch)
BL6 C57BL/6 mice, immunocompetent black Wt mice
BSA Bovine serum albumin
CD Cluster of differentiation
CFSE Carboxyfluorescein succinimidyl ester
CD Circular dichroism
CEL N-ε-cyrboxyethyllysine
CML N-ε-cyrboxymethyllysine
Con A Concanavalin A
Cor a Corylus avellana (hazelnut)
cpm Counts per minute
CRD Carbohydrate recognition domain
CT Cholera toxin
DC Dendritic cells
DNA Desoxyribonucleic acid
dNTP Desoxyribonucleosidtriphosphat
DO11.10 C.Cg-Tg(DO11.10)10Dlo/J mice, transgenic mice with OVA specific TCR
on CD4+ T cells
EAACI European Academy of Allergology and Clinical Immunology
EDTA Ethylendiamintetraacetat
EEA1 Early Endosome Antigen 1

Abbreviations
130
e.g. For example
ELISA Enzyme linked immunosorbent assay
ER Endosplasmatic reticulum
FACS Fluorescence-activated cell sorting
FcεRI/II Receptor for the constant region (Fc) of IgE
FCS Fetal calf serum
Fig Figure
FITC Fluorescein isothiocyanate
g gram
G Gauge
GA-pyridine Glycolaldehyde-pyridine
GM-CSF Granulocyte-macrophage colony-stimulating factor
GNac N-Acetylglucoseamine
h hour
HEPES N-2-hydroxyethylpiperazin-N2`-ethansulfonic acid
HRP Horseradisch Peroxidase
i.e. That is
IL Interleukin
IFN Interferon
IgE Immunoglobulin E
IgG Immunoglobulin G
ip intraperitoneal
kDa Kilodalton
l Litre
LPS Lipopolysaccharides
LN Lymph node
M Molar
mA Milliampere
MACS Magnetic adsorption cell sorting
mDC Myeloid dendritic cell
mg Milligram
min Minutes
MHC Major histocompatibility complex
MHC I MHC class I molecule
MHC II MHC class II molecule
ml Millilitre
MLN Mesenteric lymph nodes
mM Millimolar
MMC Mytomycin C

Abbreviations
131
MR Mannose receptor
mRNA messenger RNA
MW Molecular weight
NC Negative control
n.d. Not detected
Num. Number
ng nanogram
nm nanometre
OAS Oral allergy syndrome
OD Optical density
OT-1 C57BL/6-Tg(TcraTcrb)1100Mjb/J mice, transgenic mice with OVA specific
TCR on CD4+ T cells
OT-2 C57BL/6-Tg(TcraTcrb)425Cbn/J mice, transgenic mice with OVA specific
TCR on CD8+ T cells
OVA Ovalbumin
PBS Phosphate Buffered Saline
pDC Plasmacytoid dendritic cells
PCR Polymerase chain reaction
PE Phycoerythrin
PEI Paul-Ehrlich-Institut
PFA Paraformaldehyde
pg picogram
Pru av Prunus avium (cherry)
RNA Ribonucleic acid
RT-PCR Reverse trancriptase polymerase chain reaction
SD Standard deviation
SDS Sodiumdodecylsulfat
SDS-PAGE sodium dodecylsulfate polyacrylamide gel electrophoresis
sec Seconds
sc Subcutaneous
SR-AI/II Scavenger receptor class A type I and II
SR-BI Scavenger receptor class B type I
Tab Tabel
TAE Tris-Acetat EDTA
TAP Transporter associated with antigen processing
TCR T cell receptor
TEMED Tetramethylethylendiamin
TGF Transforming growth factor
Th1 T helper cell subtype 1

Abbreviations
132
Th2 T helper cell subtype 2
TMB Tetramethylbenzidine
TNF Tumour necrosis factor
Treg Regulatory T cell
Tris Tris-(hydroxymethyl)-aminomethan
Vol. Volume
Wt Wild type

References
133
9 References Abbas AK, Murphy KM, Sher A. Functional diversity of helper T lymphocytes. (1996) Nature. 383:787-793.
Abraham, R., N. Singh, A. Mukhopadhyay, S. K. Basu, V. Bal, S. Rath. (1995) Modulation of immunogenicity and antigenicity of proteins by maleylation to target scavenger receptors on macrophages. J. Immunol. 154:1-8. Abraham R, Choudhury A, Basu SK, Bal V, Rath S. (1997) Disruption of T cell tolerance by directing a self antigen to macrophage-specific scavenger receptors. J. Immunol. 158: 4029-35. Acton SL, Scherer PE, Lodish HF, Krieger M. (1994) Expression cloning of SR-BI, a CD36-related class B scavenger receptor. J Biol Chem. 269(33):21003-9. Ahmed N. (2005) Advanced glycation endproducts--role in pathology of diabetic complications. Diabetes Res Clin Pract. 67(1):3-21 Akbari O, Freeman GJ, Meyer EH, Greenfield EA, Chang TT, Sharpe AH, Berry G, DeKruyff RH, Umetsu DT. (2002) Antigen-specific regulatory T cells develop via the ICOS-ICOS-ligand pathway and inhibit allergen-induced airway hyperreactivity. Nat Med. 8(9):1024-32. Akdis M, Verhagen J, Taylor A, Karamloo F, Karagiannidis C, Crameri R, Thunberg S, Deniz G, Valenta R, Fiebig H et al. (2004) Immune responses in healthy and allergic individuals are characterized by a fine balance between allergen-specific T regulatory 1 and T helper 2 cells, J Exp Med: 199: 1567–1575. Akdis M, Blaser K, Akdis CA. (2005) T regulatory cells in allergy: novel concepts in the pathogenesis, prevention, and treatment of allergic diseases. J Allergy Clin Immunol. 116(5):961-8;
Akdis CA.(2009) T cells in health and disease. J Allergy Clin Immunol. 123(5):1022-3
Allan CH, Mendrick DL and Trier JS. (1993) Rat intestinal M cells contain acidic endosomal-lysosomal compartments and express class II major histocompatibility complex determinants. Gastroenterology. 104(3):698-708
Amiel E, Nicholson-Dykstra S, Walters JJ, Higgs H, Berwin B. (2007) Scavenger receptor-A functions in phagocytosis of E. coli by bone marrow dendritic cells. Exp Cell Res. 313(7):1438-48.
Andre F, Pène J,André C. (1996) Interleukin-4 and interferon-gamma production by peripheral blood mononuclear cells from food-allergic patients. Allergy 51: 350–355.
Anjuere F, Luci C, Lebens M, Rousseau D, Hervouet C, Milon G, et al. (2004) In vivo adjuvant-induced mobilization and maturation of gut dendritic cells after oral administration of cholera toxin. J Immunol. 173:5103–5111.
Ansel KM, Djuretic I, Tanasa B, Rao A. (2006) Regulation of Th2 differentiation and Il4 locus accessibility. Annu Rev Immunol. 24:607-56

References
134
Appleman LJ, Boussiotis VA. (2003) T cell anergy and costimulation, Immunol Re.161–180.
Araki N, Higashi T, Mori T, Shibayama R, Kawabe Y, Kodama T, Takahashi K, Shichiri M, Horiuchi S. (1995) Macrophage scavenger receptor mediates the endocytic uptake and degradation of advanced glycation end products of the Maillard reaction. Eur J Biochem. 230(2):408-15.
Arentz-Hansen H, Korner R, Molberg O, Quarsten H, Vader W, Kooy YM, Lundin KE, Koning F, Roepstorff P, Sollid LM, McAdam SN. (2000) The intestinal T cell response to alpha-gliadin in adult celiac disease is focused on a single deamidated glutamine targeted by tissue transglutaminase. J. Exp. Med. 191:603–612.
Arredouani MS, Franco F, Imrich A, Fedulov A, Lu X, Perkins D, Soininen R, Tryggvason K, Shapiro SD, Kobzik L. (2007) Scavenger Receptors SR-AI/II and MARCO limit pulmonary dendritic cell migration and allergic airway inflammation. J Immunol. 178(9):5912-20
Arunachalam B, Phan UT, Geuze HJ, Cresswell P. (2000) Enzymatic reduction of disulfide bonds in lysosomes: characterization of a gamma-interferon-inducible lysosomal thiol reductase (GILT). Proc Natl Acad Sci USA 97:745–750
Ashkenas J, Penman M, Vasile E, Acton S, Freeman M, Krieger M. (1993) Structures and high and low affinity ligand binding properties of murine type I and type II macrophage scavenger receptors. J Lipid Res. 34(6):983-1000.
Askew D, Harding CV. (2008) Antigen processing and CD24 expression determine antigen presentation by splenic CD4+ and CD8+ dendritic cells. Immunology. 123(3):447-55.
Autenrieth SE, Soldanova I, Rösemann R, Gunst D, Zahir N, Kracht M, Ruckdeschel K, Wagner H, Borgmann S, Autenrieth IB. (2007)Yersinia enterocolitica YopP inhibits MAP kinase-mediated antigen uptake in dendritic cells. Cell Microbiol. 9(2):425-37.
Bannon G, Fu TJ, Kimber I, Hinton DM. (2003) Protein digestibility and relevance to allergenicity. Environ Health Perspect. 111(8):1122-4
Barnden MJ, Allison J, Heath WR, Carbone FR. (1998) Defective TCR expression in transgenic mice constructed using cDNA-based alpha- and beta-chain genes under the control of heterologous regulatory elements. Immunol Cell Biol. 76(1):34-40
Barondes SH, Cooper DN, Gitt MA, Leffler H. (1994) Galectins. Structure and function of a large family of animal lectins. J Biol Chem. 269(33):20807-10.
Barone KS, Jain SL, Michael JG. (1995) Effect of in vivo depletion of CD4+ and CD8+ cells on the induction and maintenance of oral tolerance, Cell Immunol. 163:19–29.
Bashir MEH, Louie S, Shi HN, Nagler-Anderson C. (2004) Toll-like receptor 4 signaling by intestinal microbes influences susceptibility to food allergy, J Immunol. 172 6978–6987
Becker M, Cotena A, Gordon S, Platt N. (2006) Expression of the class A macrophage scavenger receptor on specific subpopulations of murine dendritic cells limits their endotoxin response. Eur J Immunol. 36(4):950-60.

References
135
Bell JI, Denny DW Jr, McDevitt HO. (1985) Structure and polymorphism of murine and human class II major histocompatibility antigens. Immunol. Rev. 84: 51–71. Berg JM, Tymoczko JL, Stryer L. (2002) Biochemsitry, 5th Edition. W.H. Freeman and Company Benaroch P, Yilla M, Raposo G, Ito K, Miwa K, Geuze HJ, Ploegh HL. (1995) How MHC class II molecules reach the endocytic pathway. Embo. J. 14:37–49. Benjwal S, Verma S, Röhm KH, Gursky O. (2006) Monitoring protein aggregation during thermal unfolding in circular dichroism experiments. Protein Sci. (3):635-9 Ben-Shahar S, Cassouto B, Novak L, Porgador A, Reiss Y.(1997) Production of a specific major histocompatibility complex class i-restricted epitope by ubiquitin-dependent degradation of modified ovalbumin in lymphocyte lysate. J. Biol. Chem. 272:21060-21066.
Berin MC, Kiliaan AJ, Yang PC, Groot JA, Kitamura Y, Perdue MH. (1998) The influence of mast cells on pathways of transepithelial antigen transport in rat intestine, J Immunol. 161:2561–2566
Beyer K, Ellman-Grunther L, Järvinen KM, Wood RA, Hourihane J, Sampson HA. (2003) Measurement of peptide-specific IgE as an additional tool in identifying patients with clinical reactivity to peanuts. J Allergy Clin Immunol. 112(1):202-7.
Bland PW, Warren LG. (1986) Antigen presentation by epithelial cells of the rat small intestine. II. Selective induction of suppressor T cells, Immunology. 58: 9–14.
Blumberg RS, Pitman RS, Taylor CT, Colgan SP. (2005) Cholera toxin potentiates influences of IFN-gamma through activation of NF-kappaB and release of tumor necrosis factor-alpha. J Interferon Cytokine Res. 25:209–219. Bogiatzi SI, Fernandez I, Bichet JC, Marloie-Provost MA, Volpe E, Sastre X, Soumelis V. (2007) Cutting Edge: Proinflammatory and Th2 cytokines synergize to induce thymic stromal lymphopoietin production by human skin keratinocytes. J Immunol. 178:3373-7.
Bohle B. (2007) The impact of pollen-related food allergens on pollen allergy. Allergy. 62(1):3-10
Brachet V, Pehau-Arnaudet G, Desaymard C, Raposo G, S. Amigorena S. (1999) Early endosomes are required for major histocompatiblity complex class II transport to peptide-loading compartments. Mol. Biol. Cell. 10:2891–2904.
Brandt EB, Strait RT, Hershko D, Wang Q, Muntel EE, Scribner TA et al. (2003) Mast cells are required for experimental oral allergen-induced diarrhea, J Clin Invest. 112:1666–1677
Brawand P, Fitzpatrick DR, Greenfield BW, Brasel K, Maliszewski CR, Smedt T. (2002) Murine plasmacytoid pre-dendritic cells generated from Flt3 ligand-supplemented bone marrow cultures are immature APCs. J. Immunol. 169, 6711-6719
Breiteneder H, Ebner C.(2000) Molecular and biochemical classification of plant-derived food allergens. J Allergy Clin Immunol. 106(1 Pt 1):27-36

References
136
Brett J, Schmidt AM, Yan SD, Zou YS, Weidman E, Pinsky D, Nowygrod R, Neeper M, Przysiecki C, Shaw A. (1993) Survey of the distribution of a newly characterized receptor for advanced glycation end products in tissues. Am J Pathol. 143(6):1699-712
Brocke P, Garbi N, Momburg F, Hämmerling G. (2002) JHLA-DM, HLA-DO and tapasin: Functional similarities and differences. Curr Op in Immun. 14(1):22-29
Bromander A, Holmgren J, Lycke N. (1991) Cholera toxin stimulates IL-1 production and enhances antigen presentation by macrophages in vitro. J Immunol. 146(9):2908-14
Bromander AK, Kjerrulf M, Holmgren J, Lycke N. (1993) Cholera toxin enhances alloantigen presentation by cultured intestinal epithelial cells. Scand J Immunol. 37(4):452 8
Brown, J. R. (1977) FEBS Meet. I th 50, 1-20 Brown, J. R. (1975) Fed. Proc. Fed. Am. Soc. Exp. Biol. 34,591
Brown MS, Basu SK, Falck JR, Ho YK, Goldstein JL. (1980) The scavenger cell pathway for lipoprotein degradation: specificity of the binding site that mediates the uptake of negatively-charged LDL by macrophages. J Supramol Struct. 13(1):67-81
Brownlee M. (1992) Glycation products and the pathogenesis of diabetic complications. Diabetes Care. 15(12):1835-43.
Bucala R and Vlassara H. (1995) Advanced glycosylation end products in diabetic renal and vascular disease. Am J Kidney Dis. 26: 875–888
Bucciarelli LG, Ananthakrishnan R, Hwang YC et al. (2008) RAGE and modulation of ischemic injury in the diabetic myocardium. Diabetes. 57:1941–1951 Buetler TM, Leclerc E, Baumeyer A, Latado H, Newell J, Adolfsson O, Parisod V, Richoz J, Maurer S, Foata F, Piguet D, Junod S, Heizmann CW, Delatour T. (2008) N(epsilon)-carboxymethyllysine-modified proteins are unable to bind to RAGE and activate an inflammatory response. Mol Nutr Food Res. 52(3):370-8 Burgdorf S, Lukacs-Kornek V, Kurts C. (2006) The mannose receptor mediates uptake of soluble but not of cell-associated antigen for cross-presentation. J Immunol. 176(11):6770-6 Burgdorf S, Kautz A, Böhnert V, Knolle PA, Kurts C. (2007) Distinct pathways of antigen uptake and intracellular routing in CD4 and CD8 T cell activation. Science. 316:612-6. Burgdorf S, Schölz C, Kautz A, Tampé R, Kurts C. (2008) Spatial and mechanistic separation of cross-presentation and endogenous antigen presentation. Nat Immunol. 9(5):558-66. Burks AW, Williams LW, Connaughton C, Cockrell G, O'Brien TJ, Helm RM. (1992) Identification and characterization of a second major peanut allergen, Ara h II, with use of the sera of patients with atopic dermatitis and positive peanut challenge. J Allergy Clin Immunol. 90(6 Pt 1):962-9

References
137
Burks AW, Cockrell G, Stanley JS, Helm RM, Bannon GA. (1995) Isolation, identification, and characterization of clones encoding antigens responsible for peanut hypersensitivity. Int Arch Allergy Immunol. 107(1-3):248-50
Bursch LS, Wang L, Igyarto B, Kissenpfennig A, Malissen B, Kaplan DH, Hogquist K. (2007) AIdentification of a novel population of Langerin+ dendritic cells. J Exp Med. 204(13):3147-56.
Butscheid M, Hauptvogel P, Fritz P, Klotz U, Alscher DM. (2007) Hepatic expression of galectin-3 and receptor for advanced glycation end products in patients with liver disease. J Clin Pathol. 60(4):415-8
Carter RW, Thompson C, Reid DM, Wong SY, Tough DF. (2006) Preferential induction of CD4+ T cell responses through in vivo targeting of antigen to dendritic cell-associated C-type lectin-1, J Immunol. 177:2276–2284
Cascio P, Hilton C, Kisselev AE, Rock KL, Goldberg, AL. (2001) 26S proteasomes and immunoproteasomes produce mainly N-extended versions of an antigenic peptide. EMBO J. 20:2357-2366. Cataldegirmen G, Zeng S, Feirt N et al. (2005) RAGE limits regeneration after massive liver injury by coordinated suppression of TNF-alpha and NF-kappaB. J Exp Med. 201:473–484
Chambers SJ, Bertelli E, Winterbone MS, Regoli M, Man AL, Nicoletti C. (2004) Adoptive transfer of dendritic cells from allergic mice induces specific immunoglobulin E antibody in naïve recipients in absence of antigen challenge without altering the T helper 1/ T helper 2 balance, Immunol. 112:72–79.
Chapman HA. (1998) Endosomal proteolysis and MHC class II function. Curr Opin Immunol 10:93–102
Chatchatee P, Järvinen KM, Bardina L, Vila L, Beyer K, Sampson HA. (2001) Identification of IgE and IgG binding epitopes on beta- and kappa-casein in cow's milk allergic patients. Clin Exp Allergy. 31(8):1256-62.
Chatel JM, Bernard H, Orson FM. (2003) Isolation and characterization of two complete Ara h 2 isoforms cDNA. Int Arch Allergy Immunol. 131(1):14-8.
Chen Y, Inobe J, Marks R, Gonnella P, Kuchroo VK, Weiner HL. (1995) Peripheral deletion of antigen-reactive T cells in oral tolerance, Nature. 376:177–180.
Chen Y, Inobe J, Weiner HL.(1995) Induction of oral tolerance to myelin basic protein in CD8-depleted mice: both CD4+ and CD8+ cells mediate active suppression, J Immunol. 155:910–916
Chen Y, Inobe J, Weiner HL. (1997) Inductive events in oral tolerance in the TCR transgenic adoptive transfer model. Cell Immunol. 178(1):62-8.
Chen HY, Liu FT, Yang RY. (2005) Roles of galectin-3 in immune responses. Arch. Immunol. Ther. Exp. 53:497–504.

References
138
Chen JW, Murphy TL, Willingham MC, Pastan I, August JT. (1985) Identification of two lysosomal membrane glycoproteins. J Cell Biol. 101(1):85-95.
Cherayil BJ, Weiner SJ, Pillai S. (1989) The Mac-2 antigen is a galactose-specific lectin that binds IgE. J Exp Med 170(6):1959-72.
Chieppa M, Bianchi G, Doni A, Del Prete A, Sironi M, Laskarin G, Monti P, Piemonti L, Biondi A, Mantovani A et al. (2003) Cross-linking of the mannose receptor on monocyte-derived dendritic cells activates an anti-inflammatory immunosuppressive program. J. Immunol. 171:4552–4560.
Chung SY, Champagne ET. (1999) Allergenicity of Maillard reaction products from peanut proteins. J Agric Food Chem. 47(12):5227-31
Chung SY, Champagne ET. (2001) Association of end-product adducts with increased IgE binding of roasted peanuts. J Agric Food Chem. 49(8):3911-6
Chung F. (2001) Anti-inflammatory cytokines in asthma and allergy: interleukin-10, interleukin-12, interferon-gamma. Mediators Inflamm. 10(2):51-9
Chung SY, Butts CL, Maleki SJ, Champagne ET. (2003) Linking peanut allergenicity to the processes of maturation, curing, and roasting. J Agric Food Chem. 51(15):4273-7.
Coffman RL, Carty J. (1986) A T cell activity that enhances polyclonal IgE production and its inhibition by interferon-gamma. J Immunol. 136(3):949-54 Cohn L, Homer RJ, Niu N, Bottomly K. (1999) T helper 1 cells and interferon gamma regulate allergic airway inflammation and mucus production. J Exp Med. 190: 1309-1318
Coller SP, Paulnock DM. (2001) Signaling pathways initiated in macrophages after engagement of type A scavenger receptors. J Leukoc Biol. 70(1):142-8
Collins DS, Unanue ER, Harding CV. (1991) Reduction of disulfide bonds within lysosomes is a key step in antigen processing. J Immunol 147:4054–4059.
Cooke SK, Sampson HA. (1997) Allergenic properties of ovomucoid in man. J Immunol. 159(4):2026-32.
Coombs RRA, Gell P.G.H. (1963) The classification of allergic reactions underlying disease. Clinical aspects of immunology 317
Coombes JL, Powrie F. (2008) Dendritic cells in intestinal immune regulation. Nat Rev Immunol. 8(6):435-46.
Cox JC, Coulter AR. (1997) Adjuvants--a classification and review of their modes of action. Vaccine. 15(3):248-56.
Corthay, A., J. Backlund, J. Broddefalk, E. Michaelsson, T.J. Goldschmidt, J. Kihlberg, and R. Holmdahl. (1998) Epitope glycosylation plays a critical role for T cell recognition of type II collagen in collagen-induced arthritis. Eur. J. Immunol. 28:2580–2590.

References
139
Cresswell P. (1996) Invariant chain structure and MHC class II function. Cell. 84: 505–507.
D'Amico A, Wu L. (2003) The early progenitors of mouse dendritic cells and plasmacytoid predendritic cells are within the bone marrow hemopoietic precursors expressing Flt3. J Exp Med. 198(2):293-303
Davis PJ, Smales CM, James DC. (2001) How can thermal processing modify the antigenicity of proteins? Allergy. 56:56–60.
Davis SS. (1989) Assessment of gastrointestinal transit and drug absorption, in: L.F. Prescott, W.S. Nimmo (Eds.), Novel Drug Delivery and its Therapeutic Application, John Wiley, New York, 89–101.
Debard N, Sierro F, Browning J, Kraehenbuhl JP. (2001) Effect of mature lymphocytes and lymphotoxin on the development of the follicle-associated epithelium and M cells in mouse Peyer's patches. Gastroenterology. 120(5):1173-82. de Baey A, Lanzavecchia, A. (2000) The role of aquaporins in dendritic cell macropinocytosis. J. Exp. Med. 191:743–748 de Heer HJ, Hammad H, Soullié T, Hijdra D, Vos N, Willart MA, Hoogsteden HC, Lambrecht BN. (2004) Essential role of lung plasmacytoid dendritic cells in preventing asthmatic reactions to harmless inhaled antigen. J Exp Med. 200(1):89-98
de Vries JE, Punnonen J, Cocks BG, de Waal Malefyt R, Aversa G. (1993) Regulation of the human IgE response by IL4 and IL13. Res Immunol. 144(8):597-601.
Demetriou M, Granovsky M, Quaggin S, Dennis JW. (2001) Negative regulation of T-cell activation and autoimmunity by Mgat5 N-glycosylation. Nature 409:733–739
den Haan JM, Lehar SM, Bevan MJ. (2000) CD8+ but not CD8- dendritic cells cross-prime cytotoxic T cells in vivo. J. Exp. Med. 192:1685–1696.
Derby CJ, Gowland MH, Hourihane JO. (2005) Sesame allergy in Britain: a questionnaire survey of members of the Anaphylaxis Campaign, Pediatr Allergy Immunol 16:171–175.
Des RA, Nguyen M, Paradis L, Primeau MN, S. Singer S. (2006)Tolerance to cooked egg in an egg allergic population, Allergy. 61:900–901.
Djuretic IM, Levanon D, Negreanu V, Groner Y, Rao A, Ansel KM. (2007)Transcription factors T-bet and Runx3 cooperate to activate Ifng and silence Il4 in T helper type 1 cells. Nat Immunol. 8(2):145-53.
Dongre AR, Kovats S, deRoos P, McCormack AL, Nakagawa T, Paharkova-Vatchkova V, Eng J, Caldwell H, Yates JR 3rd, Rudensky AY. (2001) In vivo MHC class II presentation of cytosolic proteins revealed by rapid automated tandem mass spectrometry and functional analyses. Eur J Immunol. 31:1485–1494 d'Ostiani CF, Del Sero G, Bacci A, Montagnoli C, Spreca A, Mencacci A, Ricciardi-Castagnoli P, Romani L. (2000) Dendritic cells discriminate between yeasts and hyphae of the

References
140
fungus Candida albicans: Implications for initiation of T helper cell immunity in vitro and in vivo. J. Exp. Med. 191:1661–1674. Dow SW, Schwarze J, Heath TD, Potter TA, Gelfand EW. (1999) Systemic and local interferon gamma gene delivery to the lungs for treatment of allergen-induced airway hyperresponsiveness in mice. Hum Gene Ther. 10:1905-1914. Dudler T, Altmann F, Carballido JM, Blaser K. (1995) Carbohydrate-dependent, HLA class II-restricted, human T cell response to the bee venom allergen phospholipase A2 in allergic patients. Eur. J. Immunol. 25:538–542. Dudziak D, Kamphorst AO, Heidkamp GF, Buchholz VR, Trumpfheller C, Yamazaki S, Cheong C, Liu K, Lee HW, Park CG et al. (2007) Differential antigen processing by dendritic cell subsets in vivo, Science. 315:107–111. Dumic J, Dabelic S, Flogel M. (2006) Galectin-3: an open-ended story. Biochim. Biophys. Acta 1760:616–635. Dumitriu IE, Baruah P, Bianchi ME, Manfredi AA, Rovere-Querini P. (2005) Requirement of HMGB1 and RAGE for the maturation of human plasmacytoid dendritic cells. Eur J Immunol. 35:2184-90. Dupont C, Barau E, Molkhou P, Raynaud F, Barbet JP, Dehennin L. (1989) Food-induced alterations of intestinal permeability in children with cow's milk-sensitive enteropathy and atopic dermatitis, J Pediatr Gastroenterol Nutr. 8:459–465 Eastham EJ, Lichauco T, Grady MI, Walker WA. (1978) Antigenicity of infant formulas: role of immature intestine on protein permeability, J Pediatr. 93:561–564. Eichner K (1982) Analytical detection of thermally induced qualitative changes in vegetables and fruits. Z Lebensm Unters Forsch 36: 101-104 Elliott T, Williams A. (2005) The optimization of peptide cargo bound to MHC class I molecules by the peptide-loading complex. Immunol. Rev. 207:89–99 Elomaa O, Kangas M, Sahlberg C, Tuukkanen J, Sormunen R, Liakka A, Thesleff I, Kraal G, Tryggvason K. (1995) Cloning of a novel bacteria-binding receptor structurally related to scavenger receptors and expressed in a subset of macrophages. Cell. 80(4):603-9.
Elsayed S, Hammer AS, Kalvenes MB, Florvaag E, Apold J, Vik H. (1986) Antigenic and allergenic determinants of ovalbumin. I. Peptide mapping, cleavage at the methionyl peptide bonds and enzymic hydrolysis of native and carboxymethyl OA. Int Arch Allergy Appl Immunol. 79(1):101-7
Engelhard VH . (1994) Structure of peptides associated with class I and class II MHC molecules. Annu. Rev. Immunol. 12:181–207 Engering A, Geijtenbeek TB, Vliet SJ, Wijers W, van Liempt E, Demaurex N, Lanzavecchia A, Fransen J, Figdor, Piguet V et al. (2002) The dendritic cell-specific adhesion receptor DC-SIGN internalizes antigen for presentation to T cells, J Immunol. 168:2118–2126

References
141
Ermak TH, Teger HJ, Pappo J. (1990) Phenotypically distinct subpopulations of T cells in domes and M-cell pockets of rabbit gut-associated lymphoid tissues. Immunology. 71:530–537
Ermak TH, Bhagat HR, Pappo J. (1994) Lymphocyte compartments in antigen-sampling regions of rabbit mucosal lymphoid organs. Am J Trop Med Hyg. 50(5 Suppl):14-28.
Escudero C, Quirce S, Fernández-Nieto M, de Miguel J, Cuesta C, Sastre J. (2003) Egg white proteins as inhalant allergens associated with baker’s asthma. Allergy. 58: 616-20. Ezekowitz RA, Sastry K, Bailly P, Warner A. (1990) Molecular characterization of the human macrophage mannose receptor: demonstration of multiple carbohydrate recognition-like domains and phagocytosis of yeasts in Cos-1 cells. J. Exp. Med. 172:1785-1794. Fanger NA, Wardwell K, Shen L, Tedder TF, Guyre PM. (1996) Type I (CD64) and type II (CD32) Fc γ receptor-mediated phagocytosis by human blood dendritic cells. J. Immunol. 157:541–548.
Farkas L, Beiske K, Lund-Johansen F, Brandtzaeg P, Jahnsen FL. (2001) Plasmacytoid dendritic cells (natural interferon- alpha/beta-producing cells) accumulate in cutaneous lupus erythematosus lesions. Am J Pathol. 159(1):237-43
Fernandez-Botran R, Sanders VM, Mosmann TR, Vitetta ES. (1988) Lymphokine-mediated regulation of the proliferative response of clones of T helper 1 and T helper 2 cells. J. Exp. Med.168:543–558
Figdor CG, van Kooyk Y, Adema GY. (2002) C-type lectin receptors on dendritic cells and Langerhans cells. Nat. Rev. Immunol 2:77-84. Finzi G, Cornaggia G, Capella C, Fiocca R, Bosi F, Solcia E, Samloff IM. (1993) Cathepsin E in follicle associated epithelium of intestine and tonsils: localization to M cells and possible role in antigen processing. Histochemistr. 99:201–211. Firer MA, Hosking CS, Hill DJ. (1982) Cow's milk allergy and eczema: Patterns of the antibody response to cow's milk in allergic skin disease. Clin Allergy. 12:385–90. Foell D, Wittkowski H, Roth J. (2007) Mechanisms of disease: a ’DAMP’ view of inflammatory arthritis. Nat Clin Pract Rheumatol. 3:382–90.
Fötisch K, Vieths S. (2001) N- and O-linked oligosaccharides of allergenic glycoproteins. Glycoconj J. 18(5):373-90
Friedmann M (1996) Food browning and its prevention. J Agric Foo Chem 44: 631-653 Friedman A, Weiner HL. (1994) Induction of anergy or active suppression following oral tolerance is determined by antigen dosage, Proc Natl Acad Sci USA.91:6688–6692. Frossard CP, Tropia L, Hauser C, Eigenmann PA. (2004) Lymphocytes in Peyer patches regulate clinical tolerance in a murine model of food allergy, J Allergy Clin Immunol. 113:958–964.

References
142
Gagliardi MC, Sallusto F, Marinaro M, Langenkamp A, Lanzavecchia A, De Magistris MT. (2000) Cholera toxin induces maturation of human dendritic cells and licences them for Th2 priming. Eur J Immunol. 30(8):2394-403. Gajewski TF, Joyce J, Fitch FW. (1989) Antiproliferative effect of IFN-γ in immune regulation. III. Differential selection of TH1 and TH2 murine helper T lymphocyte clones using recombinant IL-2 and recombinant IFN-γ J. Immunol. 143:15–21 Garside P, Steel M, Liew FY, Mowat AM. (1995) CD4+ but not CD8+ T cells are required for the induction of oral tolerance, Int Immunol. 7:501–504 Gasic-Milenkovic J, Dukic-Stefanovic S, Deuther-Conrad W, Gärtner U, Münch G.(2003) Beta-amyloid peptide potentiates inflammatory responses induced by lipopolysaccharide, interferon-gamma and 'advanced glycation endproducts' in a murine microglia cell line. Eur J Neurosci. 17:813-21.
Ganeshan K, Neilsen CV, Hadsaitong A, Schleimer RP, Luo X, Bryce PJ. (2009) Impairing oral tolerance promotes allergy and anaphylaxis: a new murine food allergy model. J Allergy Clin Immunol. 123(1):231-238
Ge J, Jia Q, Liang C, Luo Y, Huang D, Sun A, et al. (2005) Advanced glycosylation end products might promote atherosclerosis through inducing the immune maturation of dendritic cells. Arterioscler Thromb Vasc Biol. 25:2157-63. Gebert A, Rothkötter HJ, Pabst R. (1996) M cells in Peyer's patches of the intestine. Int. Rev. Cytol. 167:91–159. Gessner A, Blum H, Röllinghoff M. (1993) Differential regulation of IL-9-expression after infection with Leishmania major in susceptible and resistant mice. Immunobiology. 189(5):419-35 Geuze HJ.(1998) The role of endosomes and lysosomes in MHC class II functioning. Immunol. Today. 19:282–287. Glaspole IN, de Leon MP, Rolland JM, O'Hehir RE (2005) Characterization of the T-cell epitopes of a major peanut allergen, Ara h 2. Allergy. 60(1):35-40 Goldstein JL, Ho YK, Basu SK, Brown MS. (1979) Binding site on macrophages that mediates uptake and degradation of acetylated low density lipoprotein, producing massive cholesterol deposition. Proc Natl Acad Sci USA. 76(1):333-7
Goldstein JL, Brown MS, Anderson RG, Russell DW, Schneider WJ. (1985) Receptor-mediated endocytosis: concepts emerging from the LDL receptor system. Annu Rev Cell Biol. 1:1-39.
Golovkina TV, Shlomchik M, Hannum L, Chervonsky A. (1999) Organogenic role of B lymphocytes in mucosal immunity. Science. 286(5446):1965-8.
Gonnella PA, Chen Y, Inobe J, Komagata Y, Quartulli M, Weiner HL. (1998) In situ immune response in gut-associated lymphoid tissue (GALT) following oral antigen in TCR-transgenic mice, J Immunol. 160:4708–4718

References
143
Goh SY, Cooper ME. (2008) Clinical review: The role of advanced glycation end products in progression and complications of diabetes. J Clin Endocrinol Metab. 93:1143-52
Gough PJ, Greaves DR, Gordon S. (1998) A naturally occurring isoform of the human macrophage scavenger receptor (SR-A) gene generated by alternative splicing blocks modified LDL uptake. J Lipid Res. 39(3):531-43.
Gowen BB, Borg TK, Ghaffar A, Mayer EP. (2000) Selective adhesion of macrophages to denatured forms of type I collagen is mediated by scavenger receptors. Matrix Biol. 19(1):61-71
Graffi SJ, Dekan G, Stingl G, Epstein MM. (2002) Systemic administration of antigen-pulsed dendritic cells induces experimental allergic asthma in mice upon aerosol antigen rechallenge. Clin Immunol. 103(2):176-84.
Grant EP, Michalek MT, Goldberg AL, Rock KL.(1995) Rate of antigen degradation by the ubiquitin-proteasome pathway influences MHC class I presentation. J. Immunol. 155:3750~758.
Greenwalt DE, Lipsky RH, Ockenhouse CF, Ikeda H, Tandon NN, Jamieson GA. (1992) Membrane glycoprotein CD36: a review of its roles in adherence, signal transduction, and transfusion medicine. Blood. 80(5):1105-15.
Grindebacke H, Wing K, Andersson AC, Suri-Payer E, Rak S, Rudin A. (2004) Defective suppression of Th2 cytokines by CD4CD25 regulatory T cells in birch allergics during birch pollen season. Clin Exp Allergy. 34(9):1364-7
Gruber P., Becker WM., Hofmann T. (2005) Influence of the Maillard reaction on the Allergenicity of rAra h 2, a Recombinant Major Allergen from Peanut (Arachis hypogaea), Its Major Epitopes, and peanut Agglutinin. J. Agric. Food Chem. 53:2289-2296
Guermonprez P, Saveanu L, Kleijmeer M, Davoust J, Van Endert P, Amigorena S. (2003) ER-phagosome fusion defines an MHC class I cross-presentation compartment in dendritic cells, Nature. 425:397–402
Gupta RK, Rost BE. (2000) Aluminium compounds as vaccine adjuvants. In: O’Hagan DT, ed Methods in Molecular Medicien. Vaccine Adjuvants – Preparation Methods and Research protocols. Totowa NJ Humana Press. 42:65-89
Hammad H, Lambrecht BN, Pochard P, Gosset P, Marquillies P, Tonnel AB, Pestel J. (2002) Monocyte-derived dendritic cells induce a house dust mite-specific Th2 allergic inflammation in the lung of humanized SCID mice: involvement of CCR7. J Immunol. 169(3):1524-34.
Hansen KS, Ballmer-Weber BK, Luttkopf D, Skov PS, Wuthrich B, Bindslev-Jensen C et al. (2003) Roasted hazelnuts–allergenic activity evaluated by double-blind, placebo-controlled food challenge. Allergy. 58:132–8
Harris N, Super M, Rits M, Chang G, Ezekowitz RA. (1992) Characterization of the murine macrophage mannose receptor: demonstration that the down-regulation of receptor expression mediated by interferon- occurs at the level of transcription. Blood 80: 2363-2373.

References
144
Hartkopf J, Erbersdobler HF (1994) Model experiments of the formation of N epsilon-carboxymethyllysine in food products. Z Lebensm Unters Forsch. 198(1):15-9
Haseto S, Ouchi H, Isoda T, Mizuma T, Hayashi M, Awazu S. (1994) Transport of low and high molecular peptides across rabbit Peyer's patches. Pharm. Res.11:361–364 Hashimoto T, Akiyama K, Kobayashi N, Mori A. (2005) Comparison of IL-17 production by helper T cells among atopic and nonatopic asthmatics and control subjects, Int Arch Allergy Immunol. 137(suppl 1):51–54. Haurum JS, Arsequell G, Lellouch AC, Wong SY, Dwek RA, McMichael AJ, Elliott T. (1994). Recognition of carbohydrate by major histocompatibility complex class I-restricted, glycopeptide-specific cytotoxic T lymphocytes. J. Exp. Med. 180:739–744
Henle T. (2005) Protein-bound advanced glycation endproducts (AGEs) as bioactive amino acid derivatives in foods. Amino Acids. 29(4):313-22.
Henle T, Walter H, Krause I, Klostermeyer H. (1991) Efficient determination of individual Maillard compounds in heat-treated milk products by amino acid analysis. Int Dairy J. 1:125-35. Henle T, Klostermeyer H. (1993) Determination of protein-bound 2-amino-6-(2formyl-2-hydroxymethyl-1-pyrol)-hexanoic acid („Pyrraline“) by ion-exchange chromatography and photoiode array detection. Z. Lebensm Unters Forsch 196:1-4 Henle T, Schwarzenbolz U, Klostermeyer H. (1997) Detection and quantification of pentosidine in foods. Z. Lebensm. Unters. Forsch. 204:95-98.
Henzgen M, Vieths S, Reese I, Erdmann S, Fuchs T, Jäger L et al. (2005) Nahrungsmittelallergien durch immunologische Kreuzreaktionen. Allergo J, 14:48-59
Herold K, Moser B, Chen Y, Zeng S, Yan SF, Ramasamy R, Emond J, Clynes R, Schmidt AM. (2007) Receptor for advanced glycation end products (RAGE) in a dash to the rescue: inflammatory signals gone awry in the primal response to stress. J Leukoc Biol. 82:204–12
Hill DJ, Hosking CS, Heine RG. (1999) Clinical spectrum of food allergy in children in Australia and South-East Asia: identification and targets for treatment. Ann Med. 31(4):272-81 Ho MK, Springer TA. (1982) Mac-2, a novel 32,000 Mr mouse macrophage subpopulation- specific antigen defined by monoclonal antibodies. J. Immunol. 128: 1221-1228. Hofmann MA, Drury S, Fu C, Qu W, Taguchi A, Lu Y, Avil C, Kambham N, Bierhaus A, Nawroth P et al. (1999) RAGE mediates a novel proinflammatory axis: a central cell surface receptor for S100/calgranulin polypeptides. Cell. 97:889–901 Hogquist KA, Jameson SC, Heath WR, Howard JL, Bevan MJ, Carbone FR. (1994) T cell receptor antagonist peptides induce positive selection. Cell. 76(1):17-27 Holland SM, DeLeo FR, Elloumi HZ, et al. (2007) STAT3 mutations in the hyper-IgE syndrome. N Engl J Med. 357:1608–1619

References
145
Honma K, Kohno Y, Saito K, Shimojo N, Tsunoo H, Niimi H. (1994) Specificities of IgE, IgG and IgA antibodies to ovalbumin. Comparison of binding activities to denatured ovalbumin or ovalbumin fragments of IgE antibodies with those of IgG or IgA antibodies. Int Arch Allergy Immunol. 103(1):28-35
Hopkins SA, Niedergang F, Corthesy-Theulaz IE, Kraehenbuhl JP. (2002) A recombinant Salmonella typhimurium vaccine strain is taken up and survives within murine Peyer's patch dendritic cells, Cell Microbiol. 2(1):59–68. Horiuchi S, Murakami M, Takata K, Morino Y. (1986) Scavenger receptor for aldehydemodified proteins. J Biol Chem. 261:4962–4966. Houde M, Bertholet S, Gagnon E, Brunet S, Goyette G, Laplante A, Princiotta MF, Thibault P, Sacks D, Desjardins M.(2003)Phagosomes are competent organelles for antigen cross-presentation, Nature. 425:402–406
Howerton DA, Hunter RL, Ziegler HK, Check IJ. (1990) Induction of macrophage Ia expression in vivo by a synthetic block copolymer, L81. J Immunol. 144(5):1578-84.
Hsieh CS, deRoos P, Honey K, Beers C, Rudensky AY. (2002) A role for cathepsin L and cathepsin S in peptide generation for MHC class II presentation. J Immunol. 168: 2618–2625 Hsieh KY, Tsai CC, Wu CH, Lin RH.(2003) Epicutaneous exposure to protein antigen and food allergy. Clin Exp Allergy. 33:1067–75.
Hsu HY, Chiu SL, Wen MH, Chen KY, Hua KF. (2001) Ligands of macrophage scavenger receptor induce cytokine expression via differential modulation of protein kinase signaling pathways. J Biol Chem. 276(31):28719-30.
Hudson BI, Bucciarelli LG, Wendt T, Sakaguchi T, Lalla E, Qu W, Lu Y, Lee L, Stern DM, Naka Y, Ramasamy R, Yan SD, Yan SF, D'Agati V, Schmidt AM. (2003) Blockade of receptor for advanced glycation endproducts: a new target for therapeutic intervention in diabetic complications and inflammatory disorders. Arch Biochem Biophys. 419(1):80-8
Hughes DA, Fraser IP, Gordon S. (1995) Murine macrophage scavenger receptor: in vivo expression and function as receptor for macrophage adhesion in lymphoid and non-lymphoid organs. Eur J Immunol.25(2):466-73. Hughes RC. (1999) Secretion of the galectin family of mammalian carbohydrate- binding proteins. Biochim. Biophys. Acta. 1473:172–185.
Hunter RL, Bennett B. (1984) The adjuvant activity of nonionic block polymer surfactants. II. Antibody formation and inflammation related to the structure of triblock and octablock copolymers. J Immunol. 133(6):3167-75.
Huntington JA, Stein PE. (2001) Structure and properties of Ovalbumin. Journal of Chromatography B. 756:189-98. Husby S, Oxelius VA, Tesiner B, et al. (1985) Humoral immunity to dietary antigens in healthy adults. Occurrence, isotype and IgG subclass distribution of serum antibodies to protein antigens. Int Arch Allergy Appl Immunol. 77:416–22. a

References
146
Husby S, Jensenius JC, Svehag SE. (1985) Passage of undegraded dietary antigen into the blood of healthy adults. Scand J Immunol. 22:83–92. B
Husby S, Foged N, Høst A, Svehag SE. (1987) Passage of dietary antigens into the blood of children with coeliac disease. Quantification and size distribution of absorbed antigens. Gut. 28(9):1062-72
Husemann J, Loike JD, Kodama T, Silverstein SC. (2001) Scavenger receptor class B type I (SR-BI) mediates adhesion of neonatal murine microglia to fibrillar beta-amyloid. J Neuroimmunol. 114(1-2):142-50.
Huttunen HJ, Fages C, Rauvala H. (1999) Receptor for advanced glycation end products (RAGE)-mediated neurite outgrowth and activation of NF-κB required the cytoplasmic domain of the receptor but different downstream signaling pathway. J. Biol. Chem. 274:19919–19924 Iacobini C, Menini S, Oddi G, Ricci C, Amadio L, Pricci F, Olivieri A, Sorcini M, Di Mario U, Pesce C, Pugliese G. (2004) Galectin-3/AGE-receptor 3 knockout mice show accelerated AGE-induced glomerular injury: evidence for a protective role of galectin-3 as an AGE receptor. FASEB J. 18(14):1773-5.
Ikeda K, Higashi T, Sano H, Jinnouchi Y, Yoshida M, Araki T, Ueda S, Horiuchi S. (1996) N (epsilon)-(carboxymethyl)lysine protein adduct is a major immunological epitope in proteins modified with advanced glycation end products of the Maillard reaction. Biochemistry. 35(24):8075-83
Iwamoto I, Nakajima H, Endo H, Yoshida S.(1993) Interferon g regulates antigen-induced eosinophil recruitment into the mouse airways by inhibiting the infiltration of CD4+ T cells. J Exp Med. 177:573-576 Iwasaki A, Kelsall BL. (1999) Freshly isolated Peyer's patch, but not spleen, dendritic cells produce interleukin 10 and induce the differentiation of T helper type 2 cells. J Exp Med. 190(2):229-39 Iwasaki A, Kelsall BL. (2000) Localization of distinct Peyer's patch dendritic cell subsets and their recruitment by chemokines macrophage inflammatory protein (MIP)-3alpha, MIP-3beta, and secondary lymphoid organ chemokine. J Exp Med. 191(8):1381-94. Iwasaki A. (2007) Mucosal dendritic cells. Annu Rev Immunol. 25:381-418.
Iyoda, T Shimoyama S, Liu K, Omatsu Y, Akiyama Y, Maeda Y, Takahara K, Steinman RM, Inaba K. (2002) The CD8+ dendritic cell subset selectively endocytoses dying cells in culture and in vivo. J. Exp. Med. 195:1289–1302.
Jarry A, Robaszkiewicz M, Brousse N, Potet F. (1989) Immune cells associated with M cells in the follicle-associated epithelium of Peyer's patches in the rat. An electron- and immuno-electron-microscopic study. Cell. Tissue Res. 225:293–298 Jain SL, Barone KS, Michael JG. (1996) Activation patterns of murine T cells after oral administration of an enterocoated soluble antigen, Cell Immunol. 167:170–175

References
147
Jancic C, Savina A, Wasmeier C, Tolmachova T, El-Benna J, Dang PM, Pascolo S, Gougerot-Pocidalo MA, Raposo G, Seabra MC, et al. (2007) Rab27a regulates phagosomal pH and NADPH oxidase recruitment to dendritic cell phagosomes, Nat Cell Biol. 9.367–378 Jaraquemada D, Marti M, Long EO. (1990) An endogenous processing pathway in vaccinia virus-infected cells for presentation of cytoplasmic antigens to class II-restricted T cells. J Exp Med 172:947–954. Jarry A, Robaszkiewicz M, Brousse N, Potet F. (1989) Immune cells associated with M cells in the follicle-associated epithelium of Peyer's patches in the rat. An electron- and immuno-electron-microscopic study. Cell. Tissue Res. 225:293–298
Järvinen KM, Beyer K, Vila L, Bardina L, Mishoe M, Sampson HA. (2006) Dendritic cells: translating innate to adaptive immunity. Curr Top Microbiol Immunol. 311:17-58.
Jensen PE. (1993) Acidification and disulfide reduction can be sufficient to allow intact proteins to bind class II MHC. J Immunol. 150:3347–3356. Jiang W, Swiggard WJ, Heufler C, Peng M, Mirza A, Steinman RM, Nussenzweig MC. (1995) The receptor DEC-205 expressed by dendritic cells and thymic epithelial cells is involved in antigen processing. Nature. 375:151–155.
Jiang Y, Oliver P, Davies KE, Platt NJ. (2006) Identification and characterization of murine SCARA5, a novel class A scavenger receptor that is expressed by populations of epithelial cells. Biol Chem. 281(17):11834-45.
Johansson SG, Bieber T, Dahl R, Friedmann PS, Lanier BQ, Lockey RF, Motala C, Ortega Martell JA, Platts-Mills TA, Ring J, Thien F, Van Cauwenberge P, Williams HC. (2004) Revised nomenclature for allergy for global use: Report of the Nomenclature Review Committee of the World Allergy Organization, October 2003. J Allergy Clin Immunol. 113(5):832-6
Johansson C, Kelsall BL. (2005) Phenotype and function of intestinal dendritic cells. Semin Immunol. 17(4):284-94.
de Jong EC, Van Zijverden M, Spanhaak S, Koppelman SJ, Pellegrom H, Penninks AH. (1998). Identification and partial characterization of multiple major allergens in peanut proteins. Clin Exp Allergy. 28(6):743-51.
Joo K, Kato Y. (2006) Assessment of allergenic activity of a heat-coagulated ovalbumin after in vivo digestion. Biosci Biotechnol Biochem. 70(3):591-7
Karlsson MR, Rugtveit J, Brandtzaeg P. (2004) Allergen-responsive CD4+CD25+ regulatory T cells in children who have outgrown cow's milk allergy, J Exp Med. 199:1679–1688 Karlsson A, Christenson K, Matlak M, Björstad A, Brown KL, Telemo E, Salomonsson E, Leffler H, Bylund J. (2009) Galectin-3 functions as an opsonin and enhances the macrophage clearance of apoptotic neutrophils. Glycobiology. 19(1):16-20. Ke Y, Kapp JA. (1996) Exogenous antigens gain access to the major histocompatibility complex class I processing pathway in B cells by receptor-mediated uptake, J Exp Med. 184:1179–1184

References
148
Kelsall BL, Strober W. (1996) Distinct populations of dendritic cells are present in the subepithelial dome and T cell regions of the murine Peyer's patch. J. Exp. Med. 183:237–247. Kernéis S, Bogdanova A, Kraehenbuhl JP, Pringault E. (1997) Conversion by Peyer's patch lymphocytes of human enterocytes into M cells that transport bacteria. Science. 277(5328):949-52.
Khoury J, Thomas CA, Loike JD, Hickman SE, Cao L, Silverstein SC. (1994) Macrophages adhere to glucose-modified basement membrane collagen IV via their scavenger receptors. J Biol Chem. 269(14):10197-200 Kiely ML, McKnight GS, Schimke RT. (1976) Studies on the attachment of carbohydrate to ovalbumin nascent chains in hen oviduct. J Biol Chem. 251(18):5490-5 Kim PH, Kagnoff MF. (1990) Transforming growth factor-β1 is a costimulator for IgA production, J Immunol. 144:3411–3416
King N, Helm R, Stanley JS, Vieths S, Lüttkopf D, Hatahet L, Sampson H, Pons L, Burks W, Bannon GA. (2005) Allergenic characteristics of a modified peanut allergen. Mol Nutr Food Res. 49(10):963-71
Kislinger T, Fu C, Huber B, Qu W, Taguchi A, Du Yan S, Hofmann M, Yan SF, Pischetsrieder M, Stern D, Schmidt AM. (1999) N(epsilon)-(carboxymethyl)lysine adducts of proteins are ligands for receptor for advanced glycation end products that activate cell signaling pathways and modulate gene expression. J Biol Chem. 274(44):31740-9
Kloetzel PM. (2001) Antigen processing by the proteasome. Nat Rev Mol Cell Biol. 2(3):179-87 Kloetzel PM. (2004)Generation of major histocompatibility complex class I antigens: functional interplay between proteasomes and TPPII. Nat. Immunol. 5:661–669. Kodama T, Freeman M, Rohrer L, Zabrecky J, Matsudaira P, Krieger M. (1990) Type I macrophage scavenger receptor contains alpha-helical and collagen-like coiled coils. Nature. 343(6258):531-5.
Koenig RJ, Blobstein SH, Cerami A. (1977) Structure of carbohydrate of hemoglobin AIc. A., J. Biol. Chem. 252: 2992
Kolls JK, Linden A. (2004) Interleukin-17 family members and inflammation, Immunity. 21:467–476. Konecny P, Stagg AJ, Jebbari H, English N, Davidson RN, Knight SC. (1999) Murine dendritic cells internalize Leishmania major promastigotes, produce IL-12 p40 and stimulate primary T-cell proliferation in vitro. Eur. J. Immunol. 29:1803–1811
Kool M, Soullié T, van Nimwegen M, Willart MA, Muskens F, Jung S, Hoogsteden HC, Hammad H, Lambrecht BN. (2008) Alum adjuvant boosts adaptive immunity by inducing uric acid and activating inflammatory dendritic cells. J Exp Med. 205(4):869-82.
Kopf M, Le Gros G, Bachmann M, Lamers MC, Bluethmann H, Köhler G. (1993) Disruption of the murine IL-4 gene blocks Th2 cytokine responses. Nature. 362(6417):245-8.

References
149
Koschinsky T, He CJ, Mitsuhashi T, Bucala R, Liu C, Buenting C, Heitmann K, Vlassara H. (1997) Orally absorbed reactive glycation products (glycotoxins): an environmental risk factor in diabetic nephropathy. Proc Natl Acad Sci USA. 94(12):6474-9.
Kraus TA, Toy L, Chan L, Child J, Mayer L. (2004) Failure to induce oral tolerance to a soluble protein in patients with inflammatory bowel disease, Gastroenterology. 126:1771–1778 Kraehenbuhl JP, Neutra MR. (1992) Transepithelial transport and mucosal defence II: secretion of IgA, Trends Cell Biol. 2:170–174
Kraehenbuhl JP, Neutra MR. (2000) Epithelial M cells: differentiation and function. Annu Rev Cell Dev Biol. 16:301-32.
Krieger M, Herz J. (1994) Structures and functions of multiligand lipoprotein receptors: macrophage scavenger receptors and LDL receptor-related protein (LRP). Annu Rev Biochem. 63:601-37. Krieger M. (1997)The other side of scavenger receptors: pattern recognition for host defense. Curr Opin Lipidol. 8(5):275-80.
Kripke ML, Munn CG, Jeevan A, Tang JM, Bucana C. (1990) Evidence that cutaneous antigen-presenting cells migrate to regional lymph nodes during contact sensitization. J Immunol. 145(9):2833-8
Lack G, Fox D, Northstone K, Golding J. (2003) Factors associated with the development of peanut allergy in childhood. N Engl J Med. 348:977-985 Laemmli UK. (1970) Cleavage of structural proteins during assembly of the head of bacteriophage T4. Nature. 277:680-685. Lakadamyali M, Rust MJ, Zhuang X. (2006) Ligands for clathrin-mediated endocytosis are differentially sorted into distinct populations of early endosomes, Cell. 124:997–1009 Lambrecht BN, Salomon B, Klatzmann D, Pauwels RA. (1998) Dendritic cells are required for the development of chronic eosinophilic airway inflammation in response to inhaled antigen in sensitized mice. J Immunol. 160(8):4090-7 Lamont AG, Mowat AM, Browning MJ, Parrott DMV. (1988) Genetic control of oral tolerance to ovalbumin in mice, Immunology. 63:737–739 Langerhans P. (1868) Uber die Nerven der menschlichen Haut. Virchows Arch. 44:325-337 Larché M, Robinson DS, Kay AB. (2003) The role of T lymphocytes in the pathogenesis of asthma, J Allergy Clin Immunol. 111:450–463 Largent BL, Walton KM, Hoppe CA, Lee YC, Schnaar RL. (1984) Carbohydrate-specific adhesion of alveolar macrophages to mannose-derivatized surfaces. J. Biol. Chem. 259:1764-1769.

References
150
Larregina AT, Falo LD Jr. (2005) Changing paradigms in cutaneous immunology: adapting with dendritic cells. J Invest Dermatol. 124(1):1-12
Larsen JN, Lowenstein H. (1996) Allergen nomenclature. J.Allergy Clin.Immunol. 97, 577-578
Lehmann K, Schweimer K, Reese G, Randow S, Suhr M, Becker WM, Vieths S, Rösch P. (2006) Structure and stability of 2S albumin-type peanut allergens: implications for the severity of peanut allergic reactions. Biochem J. 395(3):463-72.
Leld F, Schleicher E (1990) New aspects of the Maillard reaction in food and in the human body. Angew Chem Int Ed Engl 29: 565-594 Lee VHL, Yamamoto A. (1990) Penetration and enzymatic barriers to peptide and protein absorption. Adv. Drug Del. Rev. 171–207. Lee VHL, Traver RD, Taub M. (1991) Enzymatic barriers to peptide and protein drug delivery, in: V.H.L. Lee (Ed.), Peptide and Protein Drug Delivery, Marcel Dekker, New York. 303–358 Lee SJ, Evers S, Roeder D, Parlow AF, Risteli J, Risteli L, Lee YC, Feizi T, Langen H, Nussenzweig MC. (2002) Mannose receptor-mediated regulation of serum glycoprotein homeostasis. Science. 295:1898-1901. Li JJ, Dickson D, Hof PR, Vlassara H. (1998) Receptors for advanced glycosylation endproducts in human brain: role in brain homeostasis. Mol Med. 4(1):46-60.
Li P, Gregg JL, Wang N, Zhou D, O'Donnell P, Blum JS, Crotzer VL. (2005) Compartmentalization of class II antigen presentation: contribution of cytoplasmic and endosomal processing. Immunol Rev. 207:206-17.
Li Y, Komai-Koma M, Gilchrist DS, Hsu DK, Liu FT, Springall T, Xu D. (2008) Galectin-3 is a negative regulator of lipopolysaccharide-mediated inflammation. J Immunol.181(4):2781-9.
Li XM, Chopra RK, Chou TY, Schofield BH, Wills-Karp M, Huang SK. (1996) Mucosal IFN-γ gene transfer inhibits pulmonary allergic responses in mice. J. Immunol. 157:3216–3219.
Li XM, Schofield BH, Huang CK, Kleiner GI, Sampson HA. (1999) A murine model of IgE-mediated cow's milk hypersensitivity, J Allergy Clin Immunol. 103:206–214
Li XM, Serebrisky D, Lee SY, Huang CK, Bardina L, Schofield BH, Stanley JS, Burks AW, Bannon GA, Sampson HA. (2000) A murine model of peanut anaphylaxis: T- and B-cell responses to a major peanut allergen mimic human responses. J Allergy Clin Immunol. 106(1 Pt 1):150-8
Limmer A, Ohl J, Kurts C, Ljunggren HG, Reiss Y, Groettrup M, Momburg F, Arnold B, Knolle PA. (2000) Efficient presentation of exogenous antigen by liver endothelial cells to CD8+ T cells results in antigen-specific T-cell tolerance, Nat Med. 6:1348–1354 Lin L, Park S, Lakatta EG. (2009) RAGE signaling in inflammation and arterial aging. Front Biosci. 14:1403-13.

References
151
Lindbald NS. (2000) Freund’s adjuvants. In: O’Hagan DT, ed Methods in Molecular Medicien. Vaccine Adjuvants – Preparation Methods and Research protocols. Totowa NJ Humana Press. 42:49-63 Lindner R, Unanue ER. (1996) Distinct antigen MHC class II complexes generated by separate processing pathways. EMBO J. 15:6910 Linehan SA, Martinez-Pomares L, Stahl PD, Gordon S. (1999) Mannose receptor and its putative ligands in normal murine lymphoid and nonlymphoid organs: In situ expression of mannose receptor by selected macrophages, endothelial cells, perivascular microglia, and mesangial cells, but not dendritic cells. J. Exp. Med. 189:1961–1972. Liu FT. (2000) Galectins: a new family of regulators of inflammation. Clin. Immunol. 97:79–88. Liu LM, MacPherson GG. (1991) Lymph-borne (veiled) dendritic cells can acquire and present intestinally administered antigens. Immunology. 73:281–286 Liu LM, MacPherson GG. (1993) Antigen acquisition by dendritic cells: intestinal dendritic cells acquire antigen administered orally and can prime naive T cells in vivo. J Exp Med. 177(5):1299-307 Locksley RM, Heinzel FP, Sadick MD, Holaday BJ, Gardner KD Jr. (1987) Murine cutaneous leishmaniasis: susceptibility correlates with differential expansion of helper T-cell subsets Ann Inst Pasteur Immunol. 138(5):744-9
López-Bravo M, Ardavín C. (2008) In vivo induction of immune responses to pathogens by conventional dendritic cells. Immunity. 29(3):343-51
Lycke N, Karlsson U, Sjölander A, Magnusson KE. (1991)The adjuvant action of cholera toxin is associated with an increased intestinal permeability for luminal antigens. Scand J Immunol. 33(6):691-8.
McGee DW, Elson CO, McGhee JR. (1993) Enhancing effect of cholera toxin on interleukin-6 secretion by IEC-6 intestinal epithelial cells: mode of action and augmenting effect of inflammatory cytokines. Infect Immun. 61(11):4637-44 Maggi E, Parronchi P, Manetti R, Simonelli C, Piccinni MP, Rugiu FS, De Carli M, Ricci M, Romagnani S. (1992) Reciprocal regulatory effects of IFN-gamma and IL-4 on the in vitro development of human Th1 and Th2 clones. J Immunol. 148(7):2142-7 Magnusson KE, Kihistrom E, Sundqvist T. (1985) Effeci of cholera loxin on rat intestinal permeability assessed with lluorescent dextran 3000. FEMS Microhiot.Lett. 29:15 Mahnke K, Guo M, Lee S, Sepulveda H, Swain SL, Nussenzweig M, Steinman RM. (2000) The dendritic cell receptor for endocytosis, DEC-205, can recycle and enhance antigen presentation via major histocompatibility complex class II-positive lysosomal compartments. J. Cell Biol. 151:673–684 Maillard LC (1912) Action of amino acids on sugars. Formation of melanoidins in a methodical way. Compt Rend 154: 66-68

References
152
Majamaa M, Isolauri E. (1997) Probiotics: a novel approach in the management of food allergy, J Allergy Clin Immunol. 99:179–185. Maleki SJ, Chung SY, Champagne ET, Raufman JP. (2000) The effects of roasting on the allergenic properties of peanut proteins. J Allergy Clin Immunol. 106(4):763-8.
Maleki SJ, Viquez O, Jacks T, Dodo H, Champagne ET, Chung SY, Landry SJ. (2003) The major peanut allergen, Ara h 2, functions as a trypsin inhibitor, and roasting enhances this function. J Allergy Clin Immunol. 112(1):190-5
Maloy KJ, Donachie AM, Mowat AM. (1995) Induction of Th1 and Th2 CD4+ T cell responses by oral or parenteral immunization with ISCOMS. Eur J Immunol. 25(10):2835-41.
Man AL, Bertelli E, Regoli M, Chambers SJ, Nicoletti C. (2004) Antigen-specific T cell-mediated apoptosis of dendritic cells is impaired in a mouse model of food allergy, J Allergy Clin Immunol. 113:965–972
Manfredi AA, Capobianco A, Esposito A, De Cobelli F, Canu T, Monno A, et al. (2008) Maturing dendritic cells depend on RAGE for in vivo homing to lymph nodes. J Immunol. 180:2270-5. Manoury B, Hewitt EW, Morrice N, Dando PM, Barrett AJ, Watts C. (1998) An asparaginyl endopeptidase processes a microbial antigen for class II MHC presentation. Nature 396: 695–699 Maric MA, Taylor MD, Blum JS. (1994) Endosomal aspartic proteinases are required for invariant-chain processing. Proc Natl Acad Sci USA. 91: 2171–2175 Marinaro M, Staats HF, Hiroi T, Jackson RJ, Coste M, Boyaka PN, Okahashi N, Yamamoto M, Kiyono H, Bluethmann H, Fujihashi K, McGhee JR. (1995) Mucosal adjuvant effect of cholera toxin in mice results from induction of T helper 2 (Th2) cells and IL-4. J Immunol. 155(10):4621-9 Marrack P, Shimonkevitz R, Hannum C, Haskins K, Kappler J. (1983) The major histocompatibility complex-restricted antigen receptor on T cells. IV. An antiidiotypic antibody predicts both antigen and I-specificity. J Exp Med. 158(5):1635-46.
Marsh M, Schmid S, Kern H, Harms E, Male P, Mellman I, Helenius A. (1987) Rapid analytical and preparative isolation of functional endosomes by free flow electrophoresis. J Cell Biol. 104(4):875-86.
Marth T, Zeitz M, Ludviksson B, Strober W, Kelsall B. (1998) Murine model of oral tolerance. Induction of Fas-mediated apoptosis by blockade of interleukin-12, Ann N Y Acad Sci. 859:290–294. Mason DW, Dallman M, Barclay AN. (1981) Graft-versus-host disease induces expression of Ia antigen in rat epidermal cells and gut epithelium, Nature. 293:150–151. Matsumoto A, Naito M, Itakura H, Ikemoto S, Asaoka H, Hayakawa I, Kanamori H, Aburatani H, Takaku F, Suzuki H, et al. (1990) Human macrophage scavenger receptors: primary structure, expression, and localization in atherosclerotic lesions. Proc Natl Acad Sci USA. 87(23):9133-7.

References
153
Matsunaga K, Yanagisawa S, Ichikawa T, Ueshima K, Akamatsu K, Hirano T et al. (2006) Airway cytokine expression measured by means of protein array in exhaled breath condensate: correlation with physiologic properties in asthmatic patients, J Allergy Clin Immunol. 118:84–90 May CD, Remigio L, Feldman J, Bock SH, Carr RI. (1977) A study of serum antibodies to isolated milk proteins and ovalbumin in infants and children. Clin Allergy. 7:583–95. Mayer L, Shlien R. (1987) Evidence for function of Ia molecules on gut epithelial cells in man, J Exp Med. 166:1471–1483. Mayer L , Eisenhardt D. (1990) Lack of induction of suppressor T cells by intestinal epithelial cells from patients with inflammatory bowel disease, J Clin Invest. 86:1255–1260. McGreal EP, Miller JS, Gordon S. (2005) Ligand recognition by antigen-presenting cell C-type lectin receptors. Curr. Opin. Immunol. 17:18-24 Meade R, Askenase PW, Geba GP, Neddermann K, Jacoby RO, Pasternak RD. (1992)Transforming growth factor-β1 inhibits murine immediate and delayed type hypersensitivity, J Immunol. 149:521–528 Meiler F, Zumkehr J, Klunker S, Ruckert B, Akdis CA, Akdis M. (2008) In vivo switch to IL-10-secreting T regulatory cells in high dose allergen exposure, J Exp Med. 205: 2887–2898. Mestecky J, Russell MW, Elson CO. (1999) Intestinal IgA: novel views on its function in the defence of the largest mucosal surface, Gut. 44: 2–5. Meltzer EO. (1997) The pharmacological basis for the treatment of perennial allergic rhinitis and non-allergic rhinitis with topical corticosteroids. Allergy 52(suppl 36):33-44. Michaelsson E, Broddefalk J, Engstrom A, Kihlberg J, Holmdahl R. (1996) Antigen processing and presentation of a naturally glycosylated protein elicits major histocompatibility complex class II-restricted, carbohydrate-specific T cells. Eur. J. Immunol. 26:1906–1910. Michalek MT, Grant EP, Gramm C, Goldberg AL, Rock KL. (1993) A role for theubiquitin-dependent proteolytic pathway in MHC class 1-restricted antigen presentation. Nature. 363:552-554. Michalek MT, Grant EP, Rock KL. (1996) Chemical denaturation and modification of ovalbumin alters its dependence on ubiquitin conjugation for class I antigen presentation. J.Immunol. 157:617-624. Miller H, Campbell DH. (1950) Skin test reactions to various chemical fractions of egg white and their possible clinical significance. J Allergy. 21:522-4 Mine Y, Zhang JW. (2002) Comparative studies on antigenicity and allergenicity of native and denatured egg white proteins. J Agric Food Chem. 50(9):2679-83
Mine Y, Rupa P. (2006) Fine mapping and structural analysis of immunodominant IgE allergenic epitopes in chicken egg ovalbumin. Curr Top Microbiol Immunol. 311:17-58

References
154
Mine Y, Yang M. (2007) Epitope characterization of ovalbumin in BALB/c mice using different entry routes. Biochim Biophys Acta. 1774(2):200-12.
Molet S, Hamid Q, Davoine F, Nutku E, Taha R, Page N et al. (2001) IL-17 is increased in asthmatic airways and induces human bronchial fibroblasts to produce cytokines, J Allergy Clin Immunol. 108:430–438.
Mondoulet L, Paty E, Drumare MF, Ah-Leung S, Scheinmann P, Willemot RM, Wal JM, Bernard H. (2005) Influence of thermal processing on the allergenicity of peanut proteins. J Agric Food Chem. 53(11):4547-53.
Moreau MC, Corthier G. (1988) Effect of the gastrointestinal microflora on induction and maintenance of oral tolerance to ovalbumin in C3H/HeJ mice, Infect Immun. 56:2766–2768 Morgan R, Gao G, Pawling J, Dennis JW, Demetriou M, Li B. (2004) N – acetylglucosaminy-ltransferase V (Mgat5)-mediated N-glycosylation negatively regulates Th1 cytokine production by T cells. J. Immunol. 173:7200–7208.
Moser M, Murphy KM. (2000) Dendritic cell regulation of TH1-TH2 development. Nat Immunol. 1(3):199-205
Moser B, Desai DD, Downie MP, Chen Y, Yan SF, Herold K, et al. (2007) Receptor for advanced glycation end products expression on T cells contributes to antigen-specific cellular expansion in vivo. J Immunol. 179:8051-8. Moss CX, Tree TI, Watts C. (2007) Reconstruction of a pathway of antigen processing and class II MHC peptide capture. EMBO J. 26:2137–2147 Mowat AM, Lamont AG, Bruce MG. (1987) A genetically determined lack of oral tolerance to ovalbumin is due to failure of the immune system to respond to intestinally derived tolerogen, Eur J Immunol. 17:1673–1676 Mowat AM. (1987) The regulation of immune responses to dietary protein antigens. Immunol. Today. 8:93–98. Mowat AM, Donachie AM, Parker LA, Robson NC, Beacock-Sharp H, McIntyre LJ, et al. (2003) The role of dendritic cells in regulating mucosal immunity and tolerance, Novartis Found Symp. 252:291–302 Murphy KM, Heimberger AB, Loh DY. (1990) Induction by antigen of intrathymic apoptosis of CD4+CD8+TCRlo thymocytes in vivo. Science. 250(4988):1720-3. Murphy K, Travers P, Walport M. (2008) Janeway’s Immunobiology, 7th Edition. Garland Science, UK Myint KM, Yamamoto Y, Doi T, Kato I, Harashima A, Yonekura H, et al. (2006) RAGE control of diabetic nephropathy in a mouse model: effects of RAGE gene disruption and administration of low-molecular weight heparin. Diabetes. 55:2510-22.

References
155
Nagai R, Matsumoto K, Ling X, Suzuki H, Araki T, Horiuchi S. Glycolaldehyde. (2000) a reactive intermediate for advanced glycation end products, plays an important role in the generation of an active ligand for the macrophage scavenger receptor. Diabetes. 49(10):1714-23.
Nakagawa T, Roth W, Wong P, Nelson A, Farr A, Deussing J, Villadangos JA, Ploegh H, Peters C, Rudensky AY. (1998) Cathepsin L: critical role in Ii degradation and CD4 T cell selection in the thymus. Science. 280:450–453 Nakajima H, Iwamoto I, Yoshida S. (1993) Aerosolized recombinant interferon-gamma prevents antigen-induced eosinophil recruitment in mouse trachea. Am. Rev. Respir. Dis. 148:1102–1104.
Nakamura A, Watanabe K, Ojima T, Ahn DH, Saeki H. (2005) Effect of maillard reaction on allergenicity of scallop tropomyosin. J Agric Food Chem. 53(19):7559-64.
Nakamura K, Funakoshi H, Tokunaga F, Nakamura T.(2001) Molecular cloning of a mouse scavenger receptor with C-type lectin (SRCL)(1), a novel member of the scavenger receptor family. Biochim Biophys Acta. 1522(1):53-8. Neeper M, Schmidt AM, Brett J, Yan SD, Wang F, Pan YCE, Elliston K, Stern D, Shaw, A. (1992) Cloning and expression of a cell surface receptor for advanced glycosylation end products of proteins. J. Biol. Chem. 267;14998–15004 Neumann A, Schinzel R, Palm D, Riederer P, Munch G. (1999) High molecular weight hyaluronic acid acid inhibits advanced glycation endproduct induced NF-κB activation and cytokine expression, FEBS Lett. 453: 283–287 Neutra MR, Phillips TL, Mayer EL, Fishkind DJ. (1987) Transport of membrane-bound macromolecules by M cells in follicle-associated epithelium of rabbit Peyer's patch. Cell Tissue Res. 247:537–546 Neutra MR, Giannasca PJ, Giannasca KT and Kraehenbuhl JP , M cells and microbial pathogens, in: M. Blaser, P. Smith, J. Ravdin, H. Greenberg, R. Guerrat (Eds.), Infections of the GI Tract, Raven Press, New York. 1994;163–178. Neutra MR. (1999) M cells in antigen sampling in mucosal tissues. Curr Top Microbiol Immunol. 236:17-32. Neutra MR, Pringault E, Kraehenbuhl JP. (1996) Antigen sampling across epithelial barriers and induction of mucosal immune responses. Annu. Rev. Immunol. 14:275–300. Nicoletti A, Caligiuri G, Tornberg I, Kodama T, Stemme S, Hansson GK. (1999) The macrophage scavenger receptor type A directs modified proteins to antigen presentation. Eur. J. Immunol. 29:512-21.
Niess JH, Brand S, Gu X, Landsman L, Jung S, McCormick BA, Vyas JM, Boes M, Ploegh HL, Fox JG, Littman DR, Reinecker HC. (2005) CX3CR1-mediated dendritic cell access to the intestinal lumen and bacterial clearance. Science. 307(5707):254-8.
Niess JH, Reinecker HC. (2005) Lamina propria dendritic cells in the physiology and pathology of the gastrointestinal tract. Curr Opin Gastroenterol. 21(6):687-91.

References
156
Nisbet AD, Saundry RH, Moir AJ, Fothergill LA, Fothergill JE. (1981) The complete amino-acid sequence of hen ovalbumin. Eur J Biochem. 115(2):335-45
Nogaard A, Bindslev-Jensen C. (1992) Egg and milk allergy in adults. Allergy. 47:503-9. Norbury CC, Basta S, Donohue KB, Tscharke DC, Princiotta MF, Berglund P, Gibbs J, Bennink JR, Yewdell JW. (2004) CD8+ T cell cross-priming via transfer of proteasome substrates, Science. 304:1318–1321.
Novak N, Bieber T. (2008) 2. Dendritic cells as regulators of immunity and tolerance. J Allergy Clin Immunol. 121(2 Suppl):S370-4
Oboki K, Ohno T, Saito H, Nakae S. (2008) Th17 and allergy. Allergol Int. 57(2):121-34
Oehen S, Feng L, Xia Y, Surh CD, Hedrick SM. (1996) Antigen compartmentation and T helper cell tolerance induction. J Exp Med 183:2617–2626 Ohgami N, Nagai R, Miyazaki A, Ikemoto M, Arai H, Horiuchi S, et al. (2001a) Scavenger receptor class B type I-mediated reverse cholesterol transport is inhibited by advanced glycation end products. J Biol Chem. 276:13348-55. Ohgami N, Nagai R, Ikemoto M, Arai H, Kuniyasu A, Horiuchi S, et al. (2001b) CD36, a member of the class b scavenger receptor family, as a receptor for advanced glycation end products. J Biol Chem. 276:3195-202. Ohnishi K, Daigo M, Tokunaga T. (1995) SV40-adenovirus immortalized cell lines derived from mouse lymphoid dendritic cell preparations. Immunol Cell Biol. 73(3):205-11
Okunuki H, Teshima R, Harikai N, Sakai S, Akiyama H, Maitani T, Sawada J. (2003) Oral sensitization of W/W(v) mice with ovalbumin and possible involvement of the decrease in gammadelta-T cells. Biol Pharm Bull. 26(9):1260-5
Owen L. (1977) Sequential uptake of horseradish peroxidase by lymphoid follicle epithelium of Peyer's patches in the normal unobstructed mouse intestine: an ultrastructural study. Gastroenterology. 72:440–451. Paganelli R, Levinsky RJ. (1980) Solid phase radioimmunoassay for detection of circulating food protein antigens in human serum. J Immunol Methods. 37:333–41.
Palframan RT, Collins PD, Severs NJ, Rothery S, Williams TJ, Rankin SM. (1998) Mechanisms of acute eosinophil mobilization from the bone marrow stimulated by interleukin 5: the role of specific adhesion molecules and phosphatidylinositol 3-kinase. J Exp Med. 188(9):1621-32
Pappo J, Ermak TH. (1989) Uptake and translocation of fluorescent latex particles by rabbit Peyer’s patch follicle epithelium: a quantitative model for M cell uptake. Clin. Exp. Immunol. 76: 144–148 Pavli P, Woodhams CE, Doe WF, Hume DA. (1990) Isolation and characterization of antigen-presenting dendritic cells from the mouse intestinal lamina propria, Immunology. 70:40–47.

References
157
Peng HJ, Chang ZN, Tsai LC, Su SN, Shen HD, Chang CH. (1998) Heat denaturation of egg-white proteins abrogates the induction of oral tolerance of specific Th2 immune responses in mice. Scand J Immunol. 48(5):491-6
Perez-Machado MA, Ashwood P, Thompson MA, Latcham F, Sim R, Walker-Smith JA et al. (2003) Reduced transforming growth factor-β1-producing T cells in the duodenal mucosa of children with food allergy, Eur J Immunol. 33:2307–2315. Perlmann, GE. (1952) Enzymatic dephosphorylation of ovalbumin and plakalbumin. J Gen Physiol.35(5):711-26. Pierre P, Denis O, Bazin H, Mbongolo Mbella E, Vaerman JP. (1992) Modulation of oral tolerance to ovalbumin by cholera toxin and its B subunit. Eur J Immunol. 22(12):3179-82. Platt N, Gordon S. (1998) Scavenger receptors: diverse activities and promiscuous binding of polyanionic ligands. Chem Biol. 5(8):R193-203.
Platt N, Gordon S. (2001) Is the class A macrophage scavenger receptor (SR-A) multifunctional? - The mouse's tale. J Clin Invest. 108(5):649-54.
Plüddemann A, Neyen C, Gordon S. (2007) Macrophage scavenger receptors and host-derived ligands. Methods. 43:207-17. Pond L, Watts C. (1997) Characterization of transport of newly assembled, T cell-stimulatory MHC class II-peptide complexes from MHC class II compartments to the cell surface. J. Immunol. 159:543–553. Poo WJ, Conrad L, Janeway CA, Jr. (1988) Receptor-directed focusing of lymphokine release by helper T cells. Nature 332, 378-380. Poole B, Ohkuma S. (1981) Effect of weak bases on the intralysosomal pH in mouse peritoneal macrophages. J. Cell Biol. 90:665-669. Pooley JL, Heath WR, Shortman K. (2001) Cutting edge: intravenous soluble antigen is presented to CD4 T cells by CD8− dendritic cells, but cross-presented to CD8 T cells by CD8+ dendritic cells, J Immunol. 166:5327–5330
Pastorello EA, Vieths S, Pravettoni V, Farioli L, Trambaioli C, Fortunato D, Lüttkopf D, Calamari M, Ansaloni R, Scibilia J, Ballmer-Weber BK, Poulsen LK, Wütrich B, Hansen KS, Robino AM, Ortolani C, Conti A. (2002) Identification of hazelnut major allergens in sensitive patients with positive double-blind, placebo-controlled food challenge results. J Allergy Clin Immunol. 109(3):563-70
Pricci F, Leto G, Amadio L, Iacobini C, Romeo G, Cordone S, Gradini R, Barsotti P, Liu FT, Di Mario U, Pugliese G. (2000) Role of galectin-3 as a receptor for advanced glycosylation end products. Kidney Int Suppl. 77:S31-9. Price CL, Sharp PS, North ME, Rainbow SJ, Knight SC. (2004) Advanced glycation end products modulate the maturation and function of peripheral blood dendritic cells. Diabetes. 53:1452-8.

References
158
Pron B, Boumaila C, Jaubert F, Berche P, Milon G, Geissmann F, et al. (2001) Dendritic cells are early cellular targets of Listeria monocytogenes after intestinal delivery and are involved in bacterial spread in the host, Cell Microbiol. 3(5):331–340
Proust B, Astier C, Jacquenet S, Ogier V, Magueur E, Roitel O, Belcourt C, Morisset M, Moneret-Vautrin DA, Bihain BE, Kanny G. (2008) A single oral sensitization to peanut without adjuvant leads to anaphylaxis in mice. Int Arch Allergy Immunol. 146(3):212-8.
Puente Navazo MD, Daviet L, Ninio E, McGregor JL. (1996) Identification on human CD36 of a domain (155-183) implicated in binding oxidized low-density lipoproteins (Ox-LDL). Arterioscler Thromb Vasc Biol. 16(8):1033-9.
Rahbar S. (1968) Clin. Hemoglobin H disease in two Iranian families. Chim. Acta. 22:296
Ravetch JV, Bolland S. (2001) IgG Fc receptors. Annu. Rev. Immunol. 19:275–290.
Reddy S, Bichler J, Wells-Knecht KJ, Thorpe SR, Baynes JW. (1995) N epsilon-(carboxymethyl)lysine is a dominant advanced glycation end product (AGE) antigen in tissue proteins. Biochemistry. 34(34):10872-8
Regnault A, Lankar D, Lacabanne V, Rodriguez A, Thery C, Rescigno M, Saito, T, Verbeek, S, Bonnerot C, Ricciardi-Castagnoli P, Amigorena S. (1999) Fcγ receptor-mediated induction of dendritic cell maturation and major histocompatibility complex class I-restricted antigen presentation after immune complex internalization. J. Exp. Med. 189:371–380
Reits E, Neijssen J, Herberts C, Benckhuijsen W, Janssen L, Drijfhout JW, Neefjes J. (2004) A major role for TPPII in trimming proteasomal degradation products for MHC class I antigen presentation. Immunity. 20(4):495-506.
Renz H, Bradley K, Larsen GL, McCall C, Gelfand EW. (1993) Comparison of the allergenicity of ovalbumin and ovalbumin peptide 323–339. Differential expansion of V beta-expressing T cell populations, J. Immunol. 151(12):7206–7213
van Renswoude J, Bridges KR, Harford JB, Klausner RD. (1982) Receptor-mediated endocytosis of transferrin and the uptake of fe in K562 cells: identification of a nonlysosomal acidic compartment. Proc Natl Acad Sci USA. 79(20):6186-90.
Repa A, Wild C, Hufnagl B, Winkler B, Bohle B, Pollak A, Wiedermann U. (2004) Influence of the route of sensitization on local and systemic immune responses in a murine model of type I allergy, Clin. Exp. Immunol. 137(1):12–18
Rescigno M, Urbano M, Valzasina B, Francolini M, Rotta G, Bonasio R, Granucci F, Kraehenbuhl JP, Ricciardi-Castagnoli P. (2001) Dendritic cells express tight junction proteins and penetrate gut epithelial monolayers to sample bacteria.Nat Immunol. 2(4):361-7. Riese RJ, Wolf PR, Brömme D, Natkin LR, Villadangos JA, Ploegh HL, Chapman HA. (1996) Essential role for cathepsin S in MHC class II-associated invariant chain processing and peptide loading. Immunity. 4:357–366.

References
159
Rescigno, M. (2002) Dendritic cells and the complexity of microbial infection. Trends Microbiol. 10:425–461. Rock KL, York IA, Saric T, Goldberg AL. (2002) Protein degradation and the generation of MHC class I-presented peptides. Adv Immunol. 80:1-70. Rock KL, York IA, Goldberg AL. (2004) Post-proteasomal antigen processing for major histocompatibility complex class I presentation. Nat. Immunol. 5:670–677.
Rohrer L, Freeman M, Kodama T, Penman M, Krieger M. (1990) Coiled-coil fibrous domains mediate ligand binding by macrophage scavenger receptor type II. Nature. 343(6258):570-2.
Rona RJ, Keil T, Summers C, Gislason D, Zuidmeer L, Sodergren E, Sigurdardottir ST, Lindner T, Goldhahn K, Dahlstrom J, McBride D, Madsen C. (2007). The prevalence of food allergy: a meta-analysis. J Allergy Clin Immunol. 120(3):638-46. Rosen JP, Selcow E, Mendelson LM, Grodofsky MP, Factor JM, Sampson HA. (1994) Skin testing with natural foods in patients suspected of having food allergies: is it a necessity? J Allergy Clin Immunol. 93:1068–1070. Roux ME, McWilliams M, Phillips-Quagliata JM, Lamm ME. (1981) Differentiation pathway of Peyer's patch precursors of IgA plasma cells in the secretory immune system, Cell Immunol. 61:141–153. Rudensky A, Preston-Hurlburt P, Hong SC, Barlow A, Janeway CA Jr. (1991) Sequence analysis of peptides bound to MHC class II molecules. Nature. 353: 622–627
Rudrapatnam N. Tharanathan, Dharmaraj B. Wankhede, Madhava Rao R. (1974) Carbohydrate composition of groundnuts (Arachis hypogea). J. Science Food a. Agri,. 26 (6): 749 - 754
Ruedl C, Rieser C, Bock G, Wick G, Wolf H. (1996) Phenotypic and functional characterization of CD11c+ dendritic cell population in mouse Peyer's patches, Eur J Immunol. 26:1801–1806.
Rufián-Henares JA, García-Villanova B, Guerra-Hernández E. (2004) Generation of furosine and color in infant/enteral formula-resembling systems. J Agric Food Chem. 52(17):5354-8
Sakaguchi, T. Yamaguchi, T. Nomura and M. Ono, (2008) Regulatory T cells and immune tolerance, Cell. 133: 775–787 Sala A, He J, Laricchia-Robbio L, Gorini S, Iwasaki A, Braun M, Yap GS, Sher A, Ozato K, Kelsall. (2009) Cholera toxin inhibits IL-12 production and CD8alpha+ dendritic cell differentiation by cAMP-mediated inhibition of IRF8 function. B. J Exp Med. 206(6):1227-35. Sallusto F, Cella M, Danieli C, Lanzavecchia A. (1995) Dendritic cells use macropinocytosis and the mannose receptor to concentrate macromolecules in the major histocompatibility complex class II compartment: Downregulation by cytokines and bacterial products. J. Exp. Med. 182:389–400. Sampson HA. (1999) Food allergy. Part 1: immunopathogenesis and clinical disorders. J Allergy Clin Immunol. 103(5 Pt 1):717-28.

References
160
Sampson HA. (2003) Food allergy. J Allergy Clin Immunol. 111:S540–7. Sampson HA. (2004) Update on food allergy. J Allergy Clin Immunol. 113:805–819. Sano, H.; Nagai, R.; Matsumoto, K.; Horiuchi, S. (1999) Receptors for proteins modified by advanced glycation end-products (AGE)s their functional role in atherosclerosis. Mech. Aging DeV. 107, 333-346. Sano, H, Hsu DK, Apgar JR, Yu L, Sharma BB, Kuwabara I, Izui S, Liu FT. (2003) Critical role of galectin-3 in phagocytosis by macrophages. J. Clin. Investig. 112:389–397. Sant AJ, Miller J. (1994) MHC class II antigen processing: biology of invariant chain. Curr Opin Immunol. 6: 57–63 Santiago-García J, Mas-Oliva J, Innerarity TL, Pitas RE. (2003) Secreted forms of the amyloid-beta precursor protein are ligands for the class A scavenger receptor. J Biol Chem. 276(33):30655-61. Santiago-García J, Kodama T, Pitas RE. (2003) The class A scavenger receptor binds to proteoglycans and mediates adhesion of macrophages to the extracellular matrix. J Biol Chem. 278(9):6942-6.
Sanz ML, del Castillo MD, Corzo N, Olano A.(2003) 2-Furoylmethyl amino acids and hydroxymethylfurfural as indicators of honey quality. J Agric Food Chem. 51(15):4278-83
Sato A, Hashiguchi M, Toda E, Iwasaki A, Hachimura S, Kaminogawa S. (2003) CD11b+ Peyer's patch dendritic cells secrete IL-6 and induce IgA secretion from naive B cells, J Immunol. 171(7):3684–3690. Sato, S, Nieminen J. (2004) Seeing strangers or announcing “danger”: galectin-3 in two models of innate immunity. Glycoconj. J. 19:583–591.
Savage JH, Matsui EC, Skripak JM, Wood RA. (2007) The natural history of egg allergy. J Allergy Clin Immunol. 120(6):1413-7
Savina A, Jancic C, Hugues S, Guermonprez P, Vargas P, Moura IC, Lennon-Dumenil AM, Seabra MC, Raposo G, Amigorena S. (2006) NOX2 controls phagosomal pH to regulate antigen processing during crosspresentation by dendritic cells, Cell. 126:205–218
Scheinecker C, McHugh R, Shevach EM, Germain RN. (2002) Constitutive presentation of a natural tissue autoantigen exclusively by dendritic cells in the draining lymph node, J Exp Med. 196:079–1090.
Scheurer S, Lauer I, Foetisch K, San Miguel Moncin M, Retzek M, Hartz C, Enrique E, Lidholm J, Cistero-Bahima A, Vieths S. (2004) Strong allergenicity of Pru av 3, the lipid transfer protein from cherry, is related to high stability against thermal processing and digestion. J Allergy Clin Immunol. 114(4):900-7.
Schmidt AM, Vianna M, Gerlach M, Brett J, Ryan J, Kao J, Esposito C, Hegarty H, Hurley W, Clauss M, et al.(1992) Isolation and characterization of two binding proteins for advanced

References
161
glycosylation end products from bovine lung which are present on the endothelial cell surface. J Biol Chem. 267(21):14987-97. Schmidt AM, Stern DM. (2000) RAGE: a new target for the prevention and treatment of the vascular and inflammatory complications of diabetes. Trends Endocrinol Metab. 11(9):368-75.
Schmidt AM, Yan SD, Yan SF, Stern DM. (2001) The multiligand receptor RAGE as a progression factor amplifying immune and inflammatory responses. J Clin Invest. 108(7):949-55.
Schmidt-Weber CB, Akdis M, Akdis CA. (2007) TH17 cells in the big picture of immunology. J Allergy Clin Immunol. 120(2):247-54.
Scott P. (1991) IFN-gamma modulates the early development of Th1 and Th2 responses in a murine model of cutaneous leishmaniasis. J Immunol. 147(9):3149-55 Scott H, Rognum TO, Midtved T, Brandtzaeg P. (1985) Age-related changes of human serum antibodies to dietary and colonic bacterial antigens measured by an enzyme-linked immunosorbent assay. Acta Pathol Microbiol Immunol Scand. 93:65–70. Scott H, Solheim BG, Brandtzaeg P, Thorsby E. (1980) HLA-DR-like antigens in the epithelium of the human small intestine, Scand J Immunol. 12:77–82. Selkoe DJ. (1994) Normal and abnormal biology of the β-amyloid precursor protein. Annu Rev Neurosci. 17:489-517
Shastri N, Schwab S, Serwold T. (2002) Producing nature's gene-chips: the generation of peptides for display by MHC class I molecules. Annu. Rev. Immunol. 20:463–493.
Shi GP, Villadangos JA, Dranoff G, Small C, Gu L, Haley KJ, Riese R, Ploegh HL, Chapman HA. (1999) Cathepsin S required for normal MHC class II peptide loading and germinal center development. Immunity. 10:197–206.
Shortman K, Liu YJ. (2002) Mouse and human dendritic cell subtypes. Nat Rev Immunol. 2(3):151-61.
Shortman K, Naik SN. (2007) Steady-state and inflammatory dendritic-cell development. Nat. Rev Immunol. 7, 19-30
Shreedhar VK, Kelsall BL, Neutra MR. (2003) Cholera toxin induces migration of DCs from the subepithelial dome region to T- and B-cell areas of Peyer's patches, Infect Immun. 71:504–509
Sicherer S, Sampson H. Food hypersensitivity and atopic dermatitis: pathophysiology, epidemiology, diagnosis, and management. J Allergy Clin Immunol 1999; 104: S114–22 Sicherer SH. (2002) Food Allergy. Lancet. 360:701–10 Sicherer SH, Sampson HA. (2006) 9. Food allergy. J Allergy Clin Immunol. 117(2 Suppl Mini-Primer) Sicinski P, Rowinski J, Warchol JB, Jarzabek Z, Gut W Szczygiel B et al. (1990) Poliovirus type 1 enters the human host through intestinal M cells, Gastroenterology. 98:56–58.

References
162
Silverstein RL, Asch AS, Nachman RL. (1989) Glycoprotein IV mediates thrombospondin-dependent platelet-monocyte and platelet-U937 cell adhesion. J Clin Invest. 84(2):546-52. Simm A, Nass N, Bartling B, Hofmann B, Silber RE, Navarrete Santos A. (2008) Potential biomarkers of ageing. Biol Chem. 389:257-65 Singh N, Bhatia R, Abraham S, Basu K, George A, Bal V, Rath S. (1998) Modulation of T cell cytokine profiles and peptide-MHC complex availability in vivo by delivery to scavenger receptors via antigen maleylation. J. Immunol. 160:4869-4880
Sjölander A, Cox JC. (1998) Uptake and adjuvant activity of orally delivered saponin and ISCOM vaccines. Adv Drug Deliv Rev. 34(2-3):321-338.
Smart JM, Horak E, Kemp AS, Robertson CF, Tang ML. (2002) Polyclonal and allergen-induced cytokine responses in adults with asthma: resolution of asthma is associated with normalization of IFN-gamma responses. J Allergy Clin Immunol. 110: 450-456 Smith MA, Taneda S, Richey PL, Miyata S, Yan SD, Stern D, Sayre LM, Monnier VM, Perry G. (1994) Advanced Maillard reaction end products are associated with Alzheimer disease pathology. Proc Natl Acad Sci USA. 91:5710-5714 Snapper CM, Paul WE. (1987) Interferon-gamma and B cell stimulatory factor-1 reciprocally regulate Ig isotype production. Science. 236(4804):944-7. Sneller MC, Strober W. (1986) M cells and host defence. J. Infect. Dis.154:737–741 Snider DP. (1995) The mucosal adjuvant activities of ADP-ribosylating bacterial enterotoxins. Critical Reviews Immunology. 1995;15(3-4):317-348 Soriani M, Bailey L, Hirst TR. (2002) Contribution of the ADP-ribosylating and receptor-binding properties of cholera-like enterotoxins in modulating cytokine secretion by human intestinal epithelial cells. Microbiology. 148:667–676
Soumelis V, Reche PA, Kanzler H, Yuan W, Edward G, Homey B, Gilliet M, Ho S, Antonenko S, Lauerma A, Smith K, Gorman D, Zurawski S, Abrams J, Menon S, McClanahan T, de Waal-Malefyt Rd R, Bazan F, Kastelein RA, Liu YJ. (2002) Human epithelial cells trigger dendritic cell mediated allergic inflammation by producing TSLP. Nat Immunol. 3(7):673-80.
Spangler, B.D. (1992) Structure and function of cholera toxin and the related Escherichia coli heat-labile enterotoxin. Micro Biol Reviews. 56(4):622-647
Stanley JS, Bannon. (1999) GA. Biochemistry of food allergens. Clin Rev Allergy Immunol. 17(3):279-91
Steinman RM, Turley S, Mellman I, Inaba K.(2000) The induction of tolerance by dendritic cells that have captured apoptotic cells. J. Exp. Med. 191:411–416.
Strid J, Hourihane J, Kimber I, Callard R, Strobel S. (2005) Epicutaneous exposure to peanut protein prevents oral tolerance and enhances allergic sensitization. Clin Exp Allergy 35:757-766

References
163
Strobel S, Ferguson A. (1984) Immune responses to fed protein antigens in mice. 3. Systemic tolerance or priming is related to age at which antigen is first encountered, Pediatr Res.18:588–594. Strobel S, Mowat AM, Ferguson A. (1985) Prevention of oral tolerance induction to ovalbumin and enhanced antigen presentation during a graft-versus-host reaction in mice. Immunology. 56(1):57-64. Strober W, Kelsall B, Fuss I, Marth T, Ludviksson B, Ehrhardt R, Neurath M. (1997) Reciprocal IFN-gamma and TGF-beta responses regulate the occurrence of mucosal inflammation. Immunol Today. 18(2):61-4.
Stumbles PA, Thomas JA, Pimm CL, Lee PT, Venaille TJ, Proksch S, Holt PG. (1998) Resting respiratory tract dendritic cells preferentially stimulate T helper cell type 2 (Th2) responses and require obligatory cytokine signals for induction of Th1 immunity. J Exp Med. 188(11):2019-31
Sudo N, Sawamura S, Tanaka K, Aiba Y, Kubo C, Koga Y. (1997) The requirement of intestinal bacterial flora for the development of an IgE production system fully susceptible to oral tolerance induction, J Immunol. 159:1739–1745.
Sun Y, Hayakawa S, Izumori K. (2004) Modification of ovalbumin with a rare ketohexose through the Maillard reaction: effect on protein structure and gel properties. J Agric Food Chem. 52(5):1293-9.
Suzuki H, Kurihara Y, Takeya M, Kamada N, Kataoka M, Jishage K, Ueda O, Sakaguchi H, Higashi T, Suzuki T, Takashima Y, Kawabe Y, Cynshi O, Wada Y, Honda M, Kurihara H, Aburatani H, Doi T, Matsumoto A, Azuma S, Noda T, Toyoda Y, Itakura H, Yazaki Y, Kodama T, et al. (1997) A role for macrophage scavenger receptors in atherosclerosis and susceptibility to infection. Nature. 386(6622):292-6. Suzuki D, Miyata T. (1999) Carbonyl stress in the pathogenesis of diabetic nephropathy. Intern Med. 38:309–314 Taguchi A, Blood DC, del Toro G, Canet A, Lee DC, Qu W, Tanji N, Lu Y, Lalla E, Fu C, Hofmann MA, Kislinger T, Ingram M, Lu A, Tanaka H, Hori O, Ogawa S, Stern DM, Schmidt AM. (2000) Blockade of RAGE-amphoterin signalling suppresses tumour growth and metastases. Nature. 405(6784):354-60.
Tai T, Yamashita K, Ogata-Arakawa M, Koide N, Muramatsu T, Iwashita S, Inoue Y, Kobata A. (1975) Structural studies of two ovalbumin glycopeptides in relation to the endo-beta-N-acetylglucosaminidase specificity. J Biol Chem. 250(21):8569-75.
Takagi K, Teshima R, Okunuki H, Sawada J. (2003) Comparative study of in vitro digestibility of food proteins and effect of preheating on the digestion. Biol Pharm Bull. 26(7):969-73.
Takeuchi M, Yamagishi S. (2008) Possible involvement of advanced glycation end-products (AGEs) in the pathogenesis of Alzheimer's disease. Curr Pharm Des. 14:973-8

References
164
Tavernier J, Van der Heyden J, Verhee A, Brusselle G, Van Ostade X, Vandekerckhove J, North J, Rankin SM, Kay AB, Robinson DS. (2000) Interleukin 5 regulates the isoform expression of its own receptor alpha-subunit. Blood. 95(5):1600-7
Terahara K, Yoshida M, Igarashi O, Nochi T, Pontes GS, Hase K, Ohno H, Kurokawa S, Mejima M, Takayama N, Yuki Y, Lowe AW, Kiyono H. (2008) Comprehensive gene expression profiling of Peyer's patch M cells, villous M-like cells, and intestinal epithelial cells. J Immunol. 180(12):7840-6
Terpstra V, van Amersfoort ES, van Velzen AG, Kuiper J, van Berkel TJ. Hepatic and extrahepatic scavenger receptors: function in relation to disease. Arterioscler Thromb Vasc Biol. 2000;20(8):1860-72. Tobery TW and Siliciano RF. (1997) Targeting of hiv-1 antigens for rapid intracellular degradation enhances cytotoxic T lymphocyte (CTL) recognition and the induction of de novo CTL responses in vivo after immunization. J. Exp. Med. 185:909-920. Tobery TW, Siliciano RF. (1999) Cutting edge: Induction of enhanced CTL-dependent protective immunity in vivo by n-end rule targeting of a model tumor antigen. J. Immunol. 162:639-642.
Todryk SM, Kelly CG, Lehner T. (1998) Effect of route of immunisation and adjuvant on T and B cell epitope recognition within a streptococcal antigen, Vaccine. 16 (2–3): 174–180
Tomokiyo R, Jinnouchi K, Honda M, Wada Y, Hanada N, Hiraoka T, Suzuki H, Kodama T, Takahashi K, Takeya M. (2002) Production, characterization, and interspecies reactivities of monoclonal antibodies against human class A macrophage scavenger receptors. Atherosclerosis. 161(1):123-32.
Trowbridge IS, Shackelford DA. (1986) Structure and function of transferrin receptors and their relationship to cell growth. Biochem Soc Symp. 51:117-29.
Tsukahara H, Shibata R, Ohta N, Sato S, Hiraoka M, Ito S, Noiri E, Mayumi M. (2003) High levels of urinary pentosidine, an advanced glycation end product, in children with acute exacerbation of atopic dermatitis: relationship with oxidative stress. Metabolism. 52(12):1601-5
Turcanu V. (2005) Characterization of lymphocyte responses to peanuts in normal children, peanut-allergic children, and allergic children who acquired tolerance to peanuts. J. Clin. Invest. 111:1065–1072.
Turnbull EL, Yrlid U, Jenkins CD, Macpherson GG. (2005) Intestinal dendritic cell subsets: differential effects of systemic TLR4 stimulation on migratory fate and activation in vivo, J Immunol. 174(3):1374–1384.
Ueno H, Klechevsky E, Morita R, Aspord C, Cao T, Matsui T, Di Pucchio T, Connolly J, Fay JW, Pascual V, Palucka AK, Banchereau J. (2007) Dendritic cell subsets in health and disease. Immunol Rev. 219:118-42
van Kooyk, Y, Geijtenbeek TB. (2003) DC-SIGN: Escape mechanism for pathogens. Nat. Rev. Immunol. 3:697–709.

References
165
Van Ree, Akkerdaas JH, van Leeuven A et al. (2000) New perspectives for the diagnosis of food allergy. ACI International. 12:7-12 van Rijt LS, Jung S, Kleinjan A, Vos N, Willart M, Duez C, Hoogsteden HC, Lambrecht BN. (2005) In vivo depletion of lung CD11c+ dendritic cells during allergen challenge abrogates the characteristic features of asthma. J Exp Med. 201(6):981-91. van Stipdonk MJ, Willems AA, Amor S, Persoon-Deen C, Travers PJ, C.J. Boog CJ, J.M. van Noort JM. (1998) T cells discriminate between differentially phosphorylated forms of αB-crystallin, a major central nervous system myelin antigen. Int. Immunol. 10:943–950.
Vaz NM, Phillips-Quagliata JM, Levine BB, Vaz EM. (1971) H-2-linked genetic control of immune responsiveness to ovalbumin and ovomucoid. J Exp Med.134:1335-1348
Vercelotti JR, Sanders TH, Chung SY, Bett KL, Vinyard BT. (1995) Carbohydrate metabolism in peanuts during postharvest curing and maturation. In Food Flavors: Generation, Analysis and Process Influence; pp 1547-1578
Vidard L, Rock KL, Benacerraf B. (1992) Heterogeneity in antigen processing by different types of antigen-presenting cells. Effect of cell culture on antigen processing ability, J. Immunol. 149(6):1905–1911
Vieths S, Hoffmann A, Holzhauser T, Muller U, Reindl J, Haustein D. (1998) Factors influencing the quality of food extracts for in vitro and in vivo diagnosis. Allergy 53, 65-71. Vieths S, Scheurer S, Ballmer-Weber B. (2002) Current understanding of cross-reactivity of food allergens and pollen, Ann N Y Acad Sci. 964:47–68. Villadangos JA, Bryant RAR, Deussing J, Driessen C, Lennon-Dumenil AM, Riese RJ et al. (1999) Proteases involved in MHC class II antigen presentation. Immunol. Rev.171:109–120. Villadangos JA, Ploegh HL. (2000) Proteolysis in MHC class II antigen presentation: who's in charge?, Immunity. 12:233–239 Villadangos JA, Driessen C, Shi GP, Chapman HA, Ploegh HL. (2000) Early endosomal maturation of MHC class II molecules independently of cysteine proteases and H-2DM. EMBO J. 19:882–891.
Villadangos JA. (2001) Presentation of antigens by MHC class II molecules: getting the most out of them. Mol Immunol. 38(5):329-46.
Vitek MP, Bhattacharya K, Glendening JM, Stopa E, Vlassara H, Bucala R, Manogue K, Cerami A. (1994) Advanced glycation end products contribute to amyloidosis in Alzheimer disease. Proc Natl Acad Sci USA. 91(11):4766-70
Vlad AM, Muller S, Cudic M, Paulsen H, Otvos L Jr, Hanisch FG, Finn OJ. (2002) Complex carbohydrates are not removed during processing of glycoproteins by dendritic cells: processing of tumor antigen MUC1 glycopeptides for presentation to major histocompatibility complex class II-restricted T cells. J Exp Med. 196(11):1435-46

References
166
Vlassara H, Li YM, Imani F, Wojciechowicz D, Yang Z, Liu FT, Cerami A. (1995) Identification of galectin-3 as a high-affinity binding protein for advanced glycation end products (AGE): a new member of the AGE-receptor complex. Mol Med. 1(6):634-46.
Vojdani A. (2009) Detection of IgE, IgG, IgA and IgM antibodies against raw and processed food antigens. Nutr Metab (Lond). 6:22.
Von Pirquet C: Allergie. (1906) Münch Med Wochenschr. 53:1457- Vremec D, Pooley J, Hochrein H, Wu L, Shortman, K. (2000) CD4 and CD8 expression by dendritic cell subtypes in mouse thymus and spleen. J. Immunol. 164:2978–2986. Wada Y. (1996) Primary sequence and glycation at lysine-548 of bovine serum albumin. J Mass Spectrom. 31:263-6.
Walsh BJ, Hill DJ, Macoun P, Cairns D, Howden ME. (2005) Detection of four distinct groups of hen egg allergens binding IgE in the sera of children with egg allergy. Allergol Immunopathol (Madr). 33(4):183-91
Wang RF, Wang X, Atwood AC, Topalian SL, Rosenberg SA. (1999) Cloning genes encoding MHC class II-restricted antigens: mutated CDC27 as a tumor antigen. Science. 284: 1351–1354.
Watts, C. (1997) Capture and processing of exogenous antigens for presentation on MHC molecules. Annu. Rev. Immunol. 15:821
Watts C. (2001) Antigen processing in the endocytic compartment. Curr. Opin. Immunol. 13:26–31.
Watts C. (2004) The exogenous pathway for antigen presentation on major histocompatibility complex class II and CD1 molecules. Nat Immunol. 5(7):685-92
Wautier MP, Chappey O, Corda S et al. (2001) Activation of NADPH oxidase by AGEs links oxidant stress to altered gene expression via RAGE. Am J Physiol Endocrinol Metab. 280: E685–E694 Webb NR, de Villiers WJ, Connell PM, de Beer FC, van der Westhuyzen DR. (1997) Alternative forms of the scavenger receptor BI (SR-BI). J Lipid Res. 38(7):1490-5.
Westwood ME, Thornalley PJ. (1995) Molecular characteristics of methylglyoxal-modified bovine and human serum albumins. Comparison with glucose-derived advanced glycation endproduct-modified serum albumins. J Protein Chem. 14(5):359-72
Whitacre CC, Gienapp IE, Orosz CG, Bitar DM. (1991) Oral tolerance in experimental autoimmune encephalomyelitis. III. Evidence for clonal anergy, J Immunol. 147:2155–2163. Wick, MJ. (2007) Monocyte and dendritic cell recruitment and activation during oral Salmonella infection. Immunol. Lett. 112:68-74.

References
167
Wilson CB, Rowell E, Sekimata M. (2009) Epigenetic control of T-helper-cell differentiation. Nat Rev Immunol. 9(2):91-105.
Wilton R, Yousef MA, Saxena P, Szpunar M, Stevens FJ. (2006) Expression and purification of recombinant human receptor for advanced glycation endproducts in Escherichia coli. Protein Expr Purif. 47(1):25-35.
Woo SL, Beattie WG, Catterall JF, Dugaiczyk A, Staden R, Brownlee GG, O'Malley BW. (1981) Complete nucleotide sequence of the chicken chromosomal ovalbumin gene and its biological s2**3ignificance. Biochemistry. 20(22):6437-46.
Wood RA. (2003) The natural history of food allergy. Pediatrics. 111:1631–1637
Wu L, Liu YJ. (2007) Development of dendritic-cell lineages. Immunity. 26(6):741-50.
Wu JT, Tu MC, Zhung P. (1996) Advanced glycation end product (AGE): characterization of the products from the reaction between D-glucose and serum albumin. J Clin Lab Anal. 10(1):21-34
Wu L, Shortman K. (2005) Heterogeneity of thymic dendritic cells. Semin Immunol. 17:304–312
Xu-Amano J, Kiyono H, Jackson RJ, Staats HF, Fujihashi K, Burrows PD, Elson CO, Pillai S, McGhee JR. (1993) Helper T cell subsets for immunoglobulin A responses: oral immunization with tetanus toxoid and cholera toxin as adjuvant selectively induces Th2 cells in mucosa associated tissues. J Exp Med. 178(4):1309-20
Yamagishi S, Takeuchi M, Inagaki Y, Nakamura K, Imaizumi T. (2003) Role of advanced glycation end products (AGEs) and their receptor (RAGE) in the pathogenesis of diabetic microangiopathy. Int J Clin Pharmacol Res. 23(4):129-34
Yamagishi S, Imaizumi T. (2005) Diabetic vascular complications: pathophysiology, biochemical basis and potential therapeutic strategy. Curr Pharm Des. 11(18):2279-99
Yan SD, Schmidt AM, Anderson GM, Zhang J, Brett J, Zou YS, Pinsky D, Stern D. (1994) Enhanced cellular oxidant stress by the interaction of advanced glycation end products with their receptors/binding proteins. J Biol Chem. 269:9889–97. Yewdell JW. (2001) Not such a dismal science: the economics of protein synthesis, folding, degradation and antigen processing. Trends Cell Biol. 11:294–297 Yonekura H, Yamamoto Y, Sakurai S, Petrova RG, Abedin MJ, Li H, Yasui K, Takeuchi M, Makita Z, Takasawa S, Okamoto H, Watanabe T, Yamamoto H. (2003) Novel splice variants of the receptor for advanced glycation end-products expressed in human vascular endothelial cells and pericytes, and their putative roles in diabetes-induced vascular injury. Biochem J. 370(Pt 3):1097-109. Yrlid U, Wick MJ. (2002) Antigen presentation capacity and cytokine production by murine splenic dendritic cell subsets upon Salmonella encounter, J Immunol. 169(1):08–116.

References
168
Yu LC, Yang PC, Berin MC, Di Leo V, Conrad DH, McKay DM et al. (2001) Enhanced transepithelial antigen transport in intestine of allergic mice is mediated by IgE/CD23 and regulated by interleukin-4, Gastroenterology. 121:370–381.
Zamoyska R. (1998) CD4 and CD8: modulators of T-cell receptor recognition of antigen and of immune responses? Curr Opin Immunol. 10(1):82-7
Zivny JH, Moldoveanu Z, Vu HL, Russell MW, Mestecky J, Elson CO. (2001) Mechanisms of immune tolerance to food antigens in humans, Clin Immunol. 101:158–168.

Lebenslauf
169
10 Lebenslauf Geburtsdatum/Ort 14.09.1981, Dresden Familienstand ledig Staatsangehörigkeit Deutsch Berufserfahrung April 2006 - Juni 2009
Paul-Ehrlich-Institut, Langen (Bundesamt für Sera und Impfstoffe ) Wissenschaftliche Mitarbeiterin in der Wissenschaftlichen Nachwuchsgruppe „Experimentelle Allergologie“, NG1
September 1999 - August 2000 Freiwilliges soziales Jahr am Marienhospital, Bonn. Studium und Promotion Seit April 2006 Promotion am Paul-Ehrlich-Institut in Langen in
der Arbeitsgruppe von Frau Dr. M. Toda (NG1) zum Thema: „The influence of the Maillard reaction on the immunogenic property of food allergens”
Juli 2005 – März 2006 Diplomarbeit bei Frau Prof. G. Klug am Institut für
Mikrobiologie und Molekularbiologie der Justus-Liebig-Universität, Gießen zum Thema: „Partielle Aufreinigung des Exosoms aus Sulfolobus solfataricus und Studien zur Interaktion des Komplexes mit anderen Proteinen“
Oktober 2000 – März 2006 Studium der Biologie an der Justus-Liebig-Universität, Gießen Schulbildung 1994 - 1999 Colaiste Muire, Ennis, Co. Clare, Irland
Secondary School (Gymnasium) 1991 - 1994 Scoil Chríost Rí, Ennis, Co. Clare, Irland
Primary School (Grundschule) 1988 - 1991 106. Oberschule Albert Hensel, Dresden
(Grundschule)

Lebenslauf
170
Auszeichnungen/Preise Juni 2007 Stipendium für die Reise zum Congress of the EAACI
(European Academy of Allergology and Clinical Immunology), Götheburg, Schweden. Verliehen für den Abstract “Glycation of ovalbumin by the Maillard reaction enhanced allergen-specific activation of murine T cells”
Juni 2008 Congress of the EAACI (European Academy of Allergology
and Clinical Immunology), Barcelona, Spanien. Posterpreis in der Kategorie Inflammatory Cells and Mediators I. Mit dem Poster “Glycation by the Maillard reaction enhances the uptake of Ovalbumin by murine dendritic cells”
September 2009 Einladung zum 4. Gemeinsamen Allergie-Kongress in Berlin.
Die Präsenentation vom Mainzer Allergie-Workshop der DGAKI 2009 wurde für die Vortragsreihe „Das Beste aus Mainz“ ausgewählt.
Oktober 2009 Forschungspreis des Paul-Ehrlich-Instituts, 1. Preis für
exzellente Nachwuchsforschung verliehen für die Publikation „Glycation of a food allergen by the Maillard reaction enhances T-cell immunogenicity: the role of macrophage scavenger receptor class A type I and II“

Publikationen und Präsentationen
171
11 Publikationen und Präsentationen
11.1 Publikationen Ilchmann A, Burgdorf S, Nagai R, Waibler Z, Wellner A, Yamamoto Y, Hiroshi Y, Scheurer S, Henle T, Kurts Ch, Kalinke U, Vieths S, Toda M. Glycation of a food allergen by the Maillard reaction enhances T-cell immunogenicity: the role of macrophage scavenger receptor class A type I and II. J Allergy Clin Immunol. 2009 Oct 27. [Epub ahead of print] Hilmenyuk T, Bellinghausen I, Heydenreich B, Ilchmann A, Toda M, Grabbe S, Saloga J. Effects of glycation of model food allergen ovalbumin on antigen uptake and presentation by dendritic cells as well as T cell proliferation and cytokine production. Immunology. 2009 Nov 17. [Epub ahead of print] Walter P, Klein F, Lorentzen E, Ilchmann A, Klug G, Evguenieva-Hackenberg E. Characterization of native and reconstituted exosome complexes from the hyperthermophilic archaeon Sulfolobus solfataricus. Mol Microbiol. 2006 Nov;62(4):1076-89
11.2 Präsentationen März 2007 Mainzer Allergie-Workshop der DGAKI (Deutsche Gesellschaft für Allergologie
und klinische Immunologie e.V) (Vortrag)
Juni 2007 Congress of the EAACI (European Academy of Allergology and Clinical
Immunology), Götheburg, Schweden (Vortrag)
März 2008 Mainzer Allergie-Workshop der DGAKI (Deutsche Gesellschaft für Allergologie
und klinische Immunologie e.V) (Vortrag)
Juni 2008 Congress of the EAACI (European Academy of Allergology and Clinical
Immunology), Barcelona, Spanien (Poster Präsentation)
März 2009 Mainzer Allergie-Workshop der DGAKI (Deutsche Gesellschaft für Allergologie
und klinische Immunologie e.V) (Vortrag)
März 2009 World Immnue Regulation Meeting, Davos, Switzerland.
(Poster Präsentation)

Danksagung
172
12 Danksagung Special thanks go to Dr. Masako Toda for giving me the interesting research topic and for her mentoring during the whole dissertation. Also thank you for always being generous with your time and for the valuable discussions which greatly enriched my work. Bei Herrn Prof. Dr. Stefan Vieths möchte ich mich herzlich für seine vielen hilfreichen Kommentare und Vorschläge für die Arbeit bedanken. Außerdem bedanke ich mich bei ihm für die Bereitschaft als Gutachter zu fungieren. Herrn Prof. Dr. Theodor Dingermann möchte ich herzlich für die Bereitschaft danken die Dissertation als Vertreter der Johann Wolfgang Goethe-Universität, Frankfurt am Main zu betreuen. Mein Dank gilt ebenfalls Frau Dr. Zoe Waibler die immer ein offenes Ohr für alle Fragen der Immunologie hatte. Für weitere hilfreiche wissenschaftliche Diskussion bedanke ich mich bei Dr. Stephan Scheurer, Prof. Dr. Ulrich Kalinke und Dr. Gerald Reese. Mein herzlicher Dank gilt Sonja Rehm für die Herstellung der rekombinanten Proteine, ohne die ein großer Teil dieser Arbeit nicht möglich gewesen wäre. Mein Dank gilt unseren technischen Assistenten Doreen Werchau und Laura Sandner die immer für eine lockere Atmosphäre gesorgt haben. Besonders anerkennen möchte ich die Hilfe von Maren Krause bei der Durchführung der ELISA in der letzten, heißen Phase meiner Arbeit. Ganz herzlich möchte ich mich auch bei Stefanie Randow bedanken, die mir gerade in der Anfangsphase oft bei der Lösung von methodischen Problemen geholfen hat. Vielen Dank an alle Mitarbeiter der Abteilungen 5/0, 5/1 und 5/4 für Ihre Hilfsbereitschaft bei Fragen und für die vielen Male wo sie mir mit Antikörpern oder anderem Material ausgeholfen haben. Ganz besonders möchte ich meinen Eltern, Helga und Dieter Ilchmann, danken. Diese Arbeit ist Euch gewidmet weil sie ohne Euch und Eure Unterstützung, nicht nur während der letzten drei Jahre, nicht möglich gewesen wäre. Meinem Bruder Jürgen möchte ich für seine moralische Unterstützung danken. Ein ganz persönlicher Dank geht an Thomas Henn, der wie kein anderer alle Höhen und Tiefen mit mir durchlebt hat und zu jeder Tages- und Nachtzeit für mich da war.