An Investigation of the Complexity of Maillard Reaction ... - MDPI
15
Foods 2014, 3, 461-475; doi:10.3390/foods3030461 foods ISSN 2304-8158 www.mdpi.com/journal/foods Article An Investigation of the Complexity of Maillard Reaction Product Profiles from the Thermal Reaction of Amino Acids with Sucrose Using High Resolution Mass Spectrometry Agnieszka Golon 1 , Christian Kropf 2 , Inga Vockenroth 2 and Nikolai Kuhnert 1, * 1 School of Engineering and Science, Jacobs University Bremen, Campus Ring 1, 28759 Bremen, Germany; E-Mail: [email protected] 2 Henkel AG & Co. KGaA, Henkelstr. 67, 40589 Düsseldorf, Germany; E-Mails: [email protected] (C.K.); [email protected] (I.V.) * Author to whom correspondence should be addressed; E-Mail: [email protected]; Tel.: +49-421-200-3120; Fax: +49-421-200-3229. Received: 15 March 2014; in revised form: 17 April 2014 / Accepted: 23 June 2014 / Published: 7 August 2014 Abstract: Thermal treatment of food changes its chemical composition drastically with the formation of “so-called” Maillard reaction products, being responsible for the sensory properties of food, along with detrimental and beneficial health effects. In this contribution, we will describe the reactivity of several amino acids, including arginine, lysine, aspartic acid, tyrosine, serine and cysteine, with carbohydrates. The analytical strategy employed involves high and ultra-high resolution mass spectrometry followed by chemometric-type data analysis. The different reactivity of amino acids towards carbohydrates has been observed with cysteine and serine, resulting in complex MS spectra with thousands of detectable reaction products. Several compounds have been tentatively identified, including caramelization reaction products, adducts of amino acids with carbohydrates, their dehydration and hydration products, disproportionation products and aromatic compounds based on molecular formula considerations. Keywords: mass spectrometry; Maillard reaction; carbohydrates; amino acids; complex mixture OPEN ACCESS
-
Upload
khangminh22 -
Category
Documents
-
view
0 -
download
0
Transcript of An Investigation of the Complexity of Maillard Reaction ... - MDPI

Foods 2014, 3, 461-475; doi:10.3390/foods3030461
foods ISSN 2304-8158
www.mdpi.com/journal/foods
Article
An Investigation of the Complexity of Maillard Reaction
Product Profiles from the Thermal Reaction of Amino Acids
with Sucrose Using High Resolution Mass Spectrometry
Agnieszka Golon 1, Christian Kropf
2, Inga Vockenroth
2 and Nikolai Kuhnert
1,*
1 School of Engineering and Science, Jacobs University Bremen, Campus Ring 1, 28759 Bremen,
Germany; E-Mail: [email protected] 2 Henkel AG & Co. KGaA, Henkelstr. 67, 40589 Düsseldorf, Germany;
E-Mails: [email protected] (C.K.); [email protected] (I.V.)
* Author to whom correspondence should be addressed; E-Mail: [email protected];
Tel.: +49-421-200-3120; Fax: +49-421-200-3229.
Received: 15 March 2014; in revised form: 17 April 2014 / Accepted: 23 June 2014 /
Published: 7 August 2014
Abstract: Thermal treatment of food changes its chemical composition drastically with the
formation of “so-called” Maillard reaction products, being responsible for the sensory
properties of food, along with detrimental and beneficial health effects. In this contribution,
we will describe the reactivity of several amino acids, including arginine, lysine, aspartic
acid, tyrosine, serine and cysteine, with carbohydrates. The analytical strategy employed
involves high and ultra-high resolution mass spectrometry followed by chemometric-type
data analysis. The different reactivity of amino acids towards carbohydrates has been
observed with cysteine and serine, resulting in complex MS spectra with thousands of
detectable reaction products. Several compounds have been tentatively identified,
including caramelization reaction products, adducts of amino acids with carbohydrates,
their dehydration and hydration products, disproportionation products and aromatic
compounds based on molecular formula considerations.
Keywords: mass spectrometry; Maillard reaction; carbohydrates; amino acids;
complex mixture
OPEN ACCESS

Foods 2014, 3 462
1. Introduction
The chemical composition of the raw materials of food is rather well understood; its chemical
composition changes, however, completely, upon processing. Most food consumed is processed prior
to consumption by thermal treatment, including cooking, frying, roasting, baking and storage,
including drying, pickling or fermentation [1]. Upon these processing steps, the original food
constituents undergo remarkable chemical changes producing a myriad of novel compounds. For
roasted coffee, only 50% of green bean components remain chemically unchanged, whereas the rest
are being chemically modified, resulting in a material composed of an unknown structure, usually
referred to as coffee melanoidins [2]; while for cocoa powder, around 75% of the material produced
through food treatment is unidentified. The situation is similar for most other processed foods, and
nowadays, the majority of chemical structures resulting from such a processing is yet to be identified.
In 1912, Louis Camille Maillard, for the first time, discovered chemical changes during food
processing, describing the reaction between amino acids and sugars at elevated temperatures, typical
for food processing conditions [3]. Since then, only a few defined reaction products of food processing
have been isolated and structurally characterized [4,5].
The Maillard reaction is one of the most important processes that takes place in food processing and
storage. In the first step of the reaction, Amadori compounds are formed and considered as precursors
of aroma, color and flavor. In the next steps, series of rearrangements, dehydrations and cyclizations
occur to produce advanced glycation end (AGE) products. The Maillard reaction products (MRPs),
especially Amadori compounds and melanoidins (high molecular weight compounds), are currently
receiving a great deal of interest due to their reported health-promoting properties and their potentials
as functional food ingredients [6]. Melanoidins, for example, represent an important part of human
diet, with an average intake of several grams per day [7]. Many studies are focused on the high
antioxidant capacity of MRPs in model systems and food materials, such as beer, coffee and bakery
products [8,9]. Moreover, the antioxidants, antimicrobial and cytotoxic properties of MRPs have
been reported [10–12].
The MRPs of cysteine are responsible for meat-like aromas, for example, 2-methyl-3-furanthiol,
2-furfurylthiol or 3-mercapto-2-butanone [8,13]; those of lysine and arginine have been detected in
many bakery products, in the crust or crumb of bread, and in roasted coffee. Despite several
investigations, the great complexity of Maillard reaction products is still a challenge for food chemists.
Much attention has been given to the reactions of sugars, such as glucose and fructose and other
monosaccharides, whereas food constituents important to browning include disaccharides, for example
sucrose, extensively used in confectionery and pastry products [14,15].
To obtain a comprehensive picture of the Maillard chemistry underlying food processing, further
investigations and the development of suitable analytical tools are necessary. Fourier Transform Ion
Cyclotron mass spectrometry (FT ICR-MS) has been used only on a few occasions in the analysis of
food materials. It has been successfully applied in our group to characterize the composition of black
tea thearubigins, roasted coffee beans and the thermal decomposition products of starch [16–19].
The objective of this study is to better understand the composition of unresolved complex mixtures
of food materials upon heating by employing the analytical technology and data interpretation
approaches. The study focuses on the reaction products formed, when lysine (1), arginine (2), aspartic

Foods 2014, 3 463
acid (3), tyrosine (4), serine (5) and cysteine (6) are heated with sucrose (7). High resolution mass
spectrometry as a direct infusion was applied for all of the samples. Moreover, FT ICR-MS was used
for the reactions of cysteine and serine with sucrose. Thus, generated molecular formula lists were
subjected to graphical interpretation tools, such as the van Krevelen analysis, in order to provide more
information about structural trends.
2. Experimental Section
2.1. Sample Preparation
All chemicals (analytical grade) were purchased from Sigma-Aldrich (Germany). All components
of Maillard reaction mixtures were ground in a mortar, mixed together, dissolved in 1 mL of water and
heated at 200 °C in the oven with a power of 1.2 kW. The heated samples were then stored at room
temperature. Heated products were dissolved in methanol/water (1:1, v/v, 1 mL) and used for mass
spectrometry analyses.
2.2. Methods
2.2.1. ESI-TOF-MS
High-resolution mass spectra were recorded using a Bruker Daltonics micrOTOF instrument
(Bruker Daltonics, Bremen, Germany) employing both negative and positive electrospray ionization
modes. The micrOTOF Focus mass spectrometer (Bruker Daltonics) was fitted with an ESI source,
and internal calibration was achieved with 10 mL of 0.1 M sodium formate solution. Calibration was
carried out using the enhanced quadratic calibration mode. All MS measurements were performed in
both negative and positive ion modes.
2.2.2. FT ICR-MS
Ultra high resolution mass spectra were acquired using a Bruker (Bremen, Germany) solarix
Fourier Transform Ion Cyclotron Resonance mass spectrometer (FTICR-MS) with a 12 T refrigerated
superconducting cryo-magnet. The instrument was equipped with a dual electrospray ion source with
ion funnel technology. The spectra of the samples were recorded in electrospray ionization positive
and negative ion modes using direct infusion with a syringe pump with a flow rate of 120 μL/h.
3. Results and Discussion
3.1. Reactions of Amino Acids with Disaccharides
We have chosen different amino acids, namely arginine, lysine, aspartic acid, tyrosine, serine and
cysteine, to probe their reactivity with disaccharides under thermal treatment. As disaccharides, the
two most common and relevant derivatives in food, sucrose and lactose, were chosen. The mixtures of
two selected disaccharides with selected amino acids were heated at various temperatures ranging from
150 to 200 °C. Heating parameters were optimized based on color formation and the recorded mass
spectra of products heated at different temperatures. Experiments performed at different heating

Foods 2014, 3 464
conditions showed that around a half an hour reaction time at 200 °C are the most suitable parameters
to obtain the desired brown material with in excess of 90% of the starting materials being consumed in
the reaction. Carbohydrates were mixed with amino acids with different proportions (1:1, 2:1 and
1:2, v/v), which correspond to their composition in typical food products. The reactions were
performed with sucrose and lactose, although in this contribution, we focus mainly on the reactions
with sucrose. The significant difference between two carbohydrates was observed, and lactose in
contrast to saccharose in the reactions with amino acids resulted in more complex mass spectra as
judged by the number of resolved peaks observed. This finding might be explained by the
stereochemistry of lactose having the axial C4-OH substituent of galactose. Upon heating, this can
cause a higher level of dehydration and, consequently, an increased number of intermediates. Mass
spectra for heated mixtures of amino acids with sucrose are displayed in Figure 1. All of the amino
acids exhibit different reactivities. Mass spectra from the reactions of sugars with lysine and tyrosine
are relatively simple, but more complex for arginine and extremely complex for cysteine and serine.
The term simple hereby signifies the observation of a small number of intense observed signals (≤100),
whereas the term complex refers to a large number of signals (≥400) usually at lower intensities. The
complexity can be easily visualized by the number of signals with an S/N ratio higher than 10 in
MS spectra, and the number of signals for the reactions are: 221-Lys:Suc (1:1), 495-Cys:Suc (1:1) and
691-Ser:Suc (1:2) (Table 1).
Figure 1. Mass spectra for heated: (a) lysine:sucrose (1:2), (b) arginine:sucrose (1:2),
(c) aspartic acid:sucrose (1:2), (d) tyrosine:sucrose (1:2), (e) serine:sucrose (1:2) and
(f) cysteine:sucrose (1:1) in negative ion mode using a direct infusion into an
ESI-TOF-MS instrument.
179.0565
341.1097
439.0759
683.2240
903.2662
-MS, 0.0-0.5min #(1-29)
0
20
40
60
80
100
Intens.
[%]
200 400 600 800 1000 m/z
210.0879
341.1090
387.1146
498.1931
552.2029
683.2232
729.2286
894.3197
-MS, 0.0-0.5min #(1-29)
0
20
40
60
80
100
Intens.
[%]
200 400 600 800 1000 m/z
OHO
HO
OOH
OH
OHO OH
OHHO
7
OH
O
NH2
H2N
1
OH
O
NH2
NH
H2N
NH
2
OHO
HO
OOH
OH
OHO OH
OHHO
7
a
b
m/z
m/z

Foods 2014, 3 465
Figure 1. Cont.
132.0299
323.0844474.1421
618.1826
780.2325
-MS, 0.0-0.5min #(1-28)
0
20
40
60
80
100
Intens.
[%]
200 400 600 800 1000 m/z
180.0650
264.0834
341.1045
522.1739
601.1209
683.2134
766.2430 864.2848
-MS, 0.0-0.4min #(1-22)
0
20
40
60
80
100
Intens.
[%]
200 400 600 800 1000 m/z
OHO
HO
OOH
OH
OHO OH
OHHO
7
OHO
HO
OOH
OH
OHO OH
OHHO
7
OH
O
NH2
O
OH
3
OH
O
NH2HO
4
d
c
m/z
m/z
161.0454
276.0725
392.1171
439.0841
503.1574
572.1791 665.2130
-MS, 0.3-0.5min #(16-27)
0
20
40
60
80
100
Intens.
[%]
200 400 600 800 1000 m/z
161.0456
315.0626
403.0711493.1027
639.1576
-MS, 0.2-0.2min #(11-13)
0
20
40
60
80
100
Intens.
[%]
200 400 600 800 1000 m/z
OHO
HO
OOH
OH
OHO OH
OHHO
7
OHO
HO
OOH
OH
OHO OH
OHHO
7
OH
O
NH2
HO
5
OH
O
NH2
HS
6 f
e
m/z
m/z

Foods 2014, 3 466
Table 1. The number of peaks observed for samples in ESI-TOF-MS and FT ICR-MS in
negative ion mode.
No. Sample Number of Signals
with S/N > 10
Number of Signals
with S/N > 3
1 Arginine-sucrose a 126 714
2 Lysine-sucrose a 221 670
3 Aspartic acid-sucrose a 297 796
4 Tyrosine-sucrose a 420 916
5 Serine-sucrose a 691 885
6 Cysteine-sucrose a 495 791
7 Serine-sucrose b 2682 4698
8 Cysteine-sucrose b 5193 8527 a ESI-TOF-MS; b FT ICR-MS.
The examination of the spectra aimed initially at the identification of typical caramelization
reactions products [20,21]. From the experimental mass lists, molecular formula lists were generated
and compared to those obtained for typical caramelization reactions in the absence of amino acids. The
comparison of peaks with identical accurate mass values and, therefore, molecular formulae, if
compared to previous studies on caramelization processes, allowed the tentative identification of
around 70 caramelization products, including oligomers of hexoses, with up to a maximum of six
monomeric units, both dehydration products of monomeric hexoses and oligomeric hexoses showing
successive a loss of up to seven water molecules, depending on the number of monomers. Hydration
products with up to two water molecules added to an oligomeric carbohydrate were detected [19,20].
Fragmentation products after the redox disproportionation reaction were found and also aromatic
compounds after excessive dehydration. The reaction products between amino acids and sucrose gave
oligomers of amino acid conjugated to hexoses after the hydrolysis of sucrose in the aqueous reaction
medium (either fructose or glucose; MSn data revealed exclusively neutral losses for hexose fragments
and did not allow distinction between fructose and glucose) with a maximum of four carbohydrate
units, the dehydration products loosing up to six water molecules and hydration products with up to
two water molecules added to the oligomeric products. In Table 2, a mass list of some of the
compounds for one of the studied mixtures, the reaction between aspartic acid with sucrose, is shown.
In this case, the reaction products of aspartic acid with sucrose with a maximum of four carbohydrate
units, their dehydration products loosing up to four water molecules and hydration products with up to
one water molecule were found. In most of the cases, signals corresponding to the molecular formulae
of dehydration products of amino acid conjugated to carbohydrates with the loss of two water
molecules appeared to have the highest intensities.
The studies on processed food components by many research groups are focused on single
compounds, such as 5-HMF, acrylamide or heteroaromatic cyclic amines (MeIQ, PhIP) formed during
cooking or baking [22]. Our work presented here allows a more global view on the many products so
far neglected in thermal processing. It clearly shows that many additional compounds of related
chemical structures are present in processed food, with a crude and tentative structure classification
based on molecular formulae considerations possible.

Foods 2014, 3 467
Table 2. ESI-TOF-MS data in negative ion mode of a reaction of aspartic acid with sucrose.
No. Assignment Molecular
Formula
Theoretical m/z
[M − H]−
Experimental m/z
[M − H]−
Error
(ppm)
1 Asp-Glu/Fru C10
H17
NO9 294.0831 294.0831 −0.1
2 Asp-Glu/Fru + H2O C10
H19
NO10
312.0936 312.0935 0.2
3 Asp-Glu/Fru-2 × H2O C16
H23
NO12
420.1147 420.1167 −4.6
4 Asp-Glu/Fru-H2O C16
H25
NO13
438.1253 438.1236 3.9
5 Asp-Suc C16
H27
NO14
456.1359 456.1357 0.3
6 Asp-Suc + H2O C16
H29
NO15
474.1464 474.1472 −1.6
7 Asp-3 × Glu/Fru-3 × H2O C22
H31
NO16
564.1570 564.1583 −2.3
8 Asp-3 × Glu/Fru-2 × H2O C22
H33
NO17
582.1676 582.1680 −0.7
9 Asp-3 × Glu/Fru-H2O C22
H35
NO18
600.1781 600.1789 −1.3
10 Asp-3 × Glu/Fru C22
H37
NO19
618.1887 618.1879 1.4
11 Asp-3 × Glu/Fru + H2O C22
H39
NO20
636.1993 636.1990 0.4
12 Asp-4 × Glu/Fru-4 × H2O C28
H39
NO20
708.1993 708.2048 −7.7
13 Asp-4 × Glu/Fru-3 × H2O C28
H41
NO21
726.2098 726.2139 −5.5
14 Asp-4 × Glu/Fru-2 × H2O C28
H43
NO22
744.2204 744.2236 −4.3
15 Asp-4 × Glu/Fru-H2O C28
H45
NO23
762.2310 762.2303 0.8
16 Asp-4 × Glu/Fru C28
H47
NO24
780.2415 780.2385 3.9
17 Asp-4 × Glu/Fru + H2O C28
H49
NO25
798.2521 798.2507 1.7
3.2. FT ICR-MS Measurement of Maillard Reactions of Serine and Cysteine with Sucrose
The reactions of serine and cysteine with sucrose resulted in extremely complex MS spectra with
signal numbers exceeding several thousand and were therefore analyzed by FT ICR-MS, providing
ultimate resolution. The samples were measured as a direct infusion in aqueous methanol solution
using a 12T FT ICR-MS instrument with ESI ionization in both positive and negative ion mode. The
data obtained provides a comprehensive overview of all products containing the reaction products
detectable by ESI-MS. Representative mass spectra are shown in Figure 2. Further expanded mass
spectra are available in the Supplementary Materials (Figures S1–S3).
From the data, mass lists were generated with an S/N ratio above four and a relative intensity higher
than or equal to 0.1%. A detailed discussion on the cut-off level of the signal intensity and the
distinction between noise and signals corresponding to real food processing products has been given in
earlier references [1,16]. In the case of serine, 5340 signals were present, while for cysteine 8530.
This confirms that the presence of sulfur in the molecule leads to the formation of several new MRPs.
It is worth mentioning that the number of detected ions is the minimum number of compounds present
in the sample, which must be multiplied by the number of potential isomers, consequently leading to
thousands of compounds.
From the mass lists, molecular formula lists were generated, accepting an error below 1 ppm and
the presence of C, H, O and N for serine and C, H, O, N and S for cysteine for all signals with a
relative intensity of 0.1% of the base peak. The data were then subjected to interpretation tools.
Molecular formulae have been assigned for almost 600 of the most intense peaks for the reactions
with serine and cysteine. The majority of assigned signals contain nitrogen atoms. In the case of
cysteine, around 90 molecular formulae contain one or more sulfur atoms, for example an adduct at

Foods 2014, 3 468
m/z 264.054607 with the molecular formula C9H15NO6S, which corresponds formally to the reaction
products between cysteine and hexose after dehydration, or at m/z 282.065162 with the molecular
formula C9H17NO7S, derived from the reaction between cysteine and hexose.
Figure 2. Direct infusion ESI-FT-ICR mass spectrum of a reaction of (a) sucrose with
serine and (b) sucrose with cysteine in negative ion mode.
3.3. Graphical Data Interpretation
To visualize differences in product formation, we generated graphs showing a number of
compounds and a second graph displaying the sum of ion intensities summed up over all signals with
the respective elemental composition, CHO, CHON and CHON1+x for the reaction of serine with
sucrose and CHO, CHON, CHOS, CHONS, CHOS1+x and CHON1+x for the reaction of cysteine with
sucrose (Figure 3). Each column represents the number of compounds with a defined elemental
composition. For serine, the number of nitrogen-containing molecules is higher than nitrogen-free
molecules, and more than a half of the latter contains more than one nitrogen atom; although the total
intensities of CHO molecules are higher than for nitrogen-containing molecules (Figure 4). The sum of
intensities of pseudomolecular ions corresponding to molecular formulae with one nitrogen atom are
higher than for the molecules containing two and more nitrogen atoms. For cysteine, the number of
compounds with the CHON elemental composition is higher than for CHO. The number of molecules
with nitrogen and sulfur atoms is lower than that of CHON molecules. The highest intensities
correspond to CHO molecules, followed by CHON, CHON1+x, CHONS, CHOS1+x and CHOS. The
sum of intensities of molecules with one nitrogen atom are slightly higher than for ones with more than
one nitrogen atom (Figure 4).
171.139068323.098377
341.108941
392.119839 465.304402503.161728
0
20
40
60
80
[%]
200 300 400 500 600 700 800 900 m/z
293.175832
255.232945
199.170346
227.20154
255.23282
293.17569
334.04230403.06366
419.09500
0
20
40
60
80
[%]
200 300 400 500 600 700 800 900 m/z
b
Intens.
a
m/z
m/z
Intens.
171.139068323.098377
341.108941
392.119839 465.304402503.161728
0
20
40
60
80
[%]
200 300 400 500 600 700 800 900 m/z
293.175832
255.232945
199.170346
227.20154
255.23282
293.17569
334.04230403.06366
419.09500
0
20
40
60
80
[%]
200 300 400 500 600 700 800 900 m/z
b
Intens.
a
m/z
m/z
Intens.

Foods 2014, 3 469
Figure 3. The number of compounds with the elemental composition (a) CHO, CHON and
CHON1+x for the reaction of serine with sucrose and (b) the elemental composition CHO,
CHON, CHOS, CHONS, CHOS1+x and CHON1+x for the reaction of cysteine with sucrose,
analyzed by negative ion mode FT ICR-MS.
(a) (b)
Figure 4. The sum of intensities for the compounds with the elemental composition (a)
CHO, CHON and CHON1+x for the reaction of serine with sucrose and (b) the elemental
composition CHO, CHON, CHOS, CHONS, CHOS1+x and CHON1+x for the reaction of
cysteine with sucrose analyzed by negative ion mode FT ICR-MS.
(a) (b)
3.4. The van Krevelen Diagrams for the Reaction of Serine with Sucrose
The van Krevelen diagrams were generated from the molecular formulae lists. In this diagram,
elemental ratios, such as H/C or O/C, were calculated from the molecular formulas and plotted in
two-dimensional graphs, with every point on the graph corresponding to one analyte with a defined
elemental composition in the sample. These diagrams allow the tentative classification of classes of
compounds based on their characteristic elemental ratio boundaries and the identification of possible
reaction trends [1,23].
The van Krevelen diagrams were generated in several variations, with one plot showing all analytes,
one bubble plot showing intensity coded data points and two-three plots showing Maillard products
with color coding according to different elemental compositions. The van Krevelen diagram of the
reaction of sucrose with serine is shown in Figure 5a. In typical elemental ratio boundaries for
carbohydrates (right top corner), products can be observed; in the middle of the graph are reaction
products between amino acid and carbohydrate and carbohydrate after dehydration. Many compounds
CHO
CHON
CHON1+x
1200
1000
800
600
400
200
0
Number of Compounds
CHO
CHON
CHOS
CHONS
CHOS1+x
CHON1+x
600
500
400
300
200
100
0
Number of Compounds
CHO
CHON
CHON1+x
4.0 × 10¹⁰
3.5 × 10¹⁰
3.0 × 10¹⁰
2.5 × 10¹⁰
2.0 × 10¹⁰
1.5 × 10¹⁰
1.0 × 10¹⁰
5 × 10⁹
0
Sum of Intensity
CHO
CHON
CHOS
CHONS
CHOS1+x
CHON1+x
3.5 × 10¹⁰
1.5 × 10¹⁰
1.0 × 10¹⁰
5.0 × 10⁹
0
3.0 × 10¹⁰
2.5 × 10¹⁰
2.0 × 10¹⁰Sum of Intensity

Foods 2014, 3 470
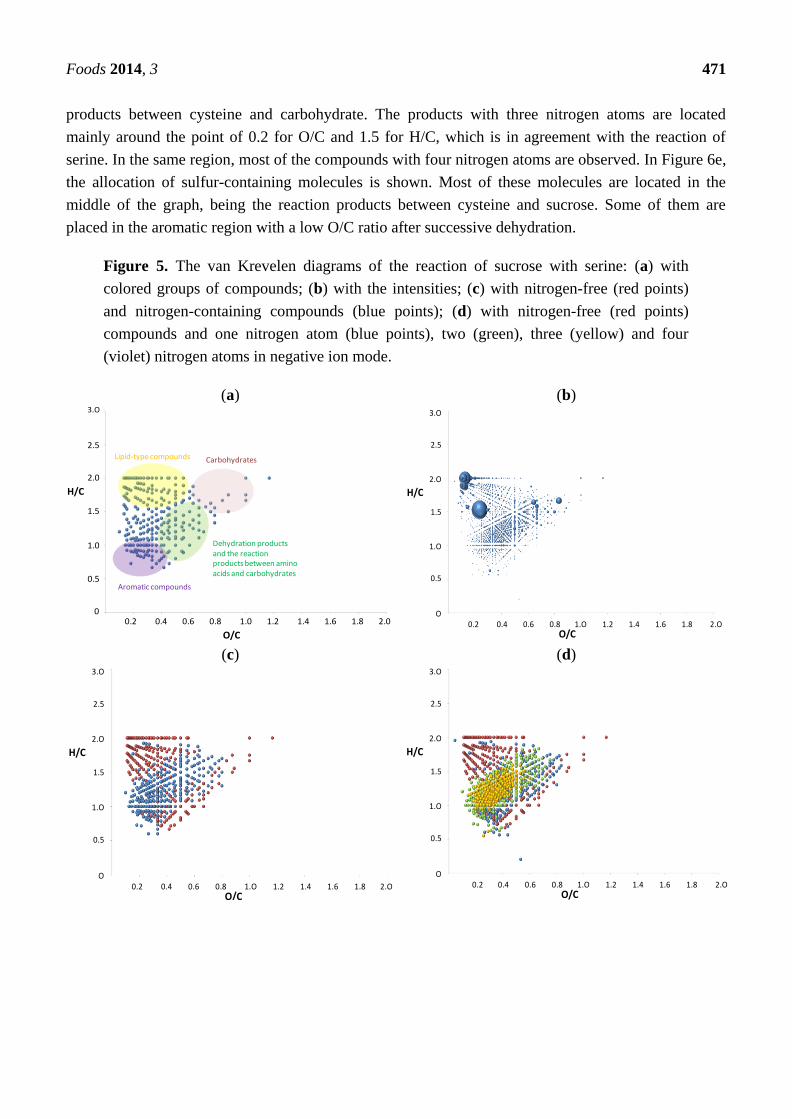
after gradual dehydration lay on the diagonal of the plot towards its origin. The second graph shows
the same points with their intensities (Figure 5b), and thus, the three compounds with the highest
intensities of ions observed correspond to two lipid-type compounds and one carbohydrate. The
observation of ions with a lipid-type elemental ratio comes as a surprise, and we cannot exclude an
erroneous molecular formulae assignment or other measurement artefact at this point. The reaction
products between amino acid and sugar are created in moderate intensities. Moreover, many
homologous series can be observed in the graph, such as dehydration products of amino acid-sugar
reaction products. In Figure 5c, red points represent nitrogen-free compounds, while blue
nitrogen-containing compounds. Within the mixture, 45% of the ions are CHO compounds free of
nitrogen and, therefore, originate from caramelization reactions, whereas the remaining 55% contain
nitrogen and must be considered as real Maillard products. The data points, which belong to
carbohydrates, can be easily seen by following dehydration products on the line with the negative
slope toward the origin in the middle of the graph. The next group of nitrogen-free compounds appear
in the range of 1.5–2.0 for the H/C ratio and 0.0–0.6 for the O/C ratio, corresponding to
disproportionation reaction products. The nitrogen-containing products are located mainly in the
middle of the graph and belong to the reaction products between serine and sucrose. Figure 5d displays
the distribution of nitrogen-containing compounds with respect to the nitrogen numbers in molecules.
The red points correspond to nitrogen-free compounds, while the blue points are the molecules with
one nitrogen atom, green with two and yellow with three nitrogen atoms. The distribution shows that
one-nitrogen-containing molecules are placed next to the carbohydrate-type molecules on the diagonal
line towards point zero, suggesting the dehydration products. From these data, it must be concluded
that oligopeptide-like structures are formed with three and more nitrogen atoms, with oligomerization
playing an important role in the Maillard reaction, as shown earlier for caramelization [19–21]
Compounds with two nitrogen atoms are mainly around 0.5 and 1.5 for the O/C and H/C ratio,
respectively, and go toward the more aromatic region. On the other hand, compounds with three
nitrogen atoms are placed mainly around the point of 0.3 for O/C and 1.2 for H/C, forming one circle.
3.5. The van Krevelen Diagrams for the Reaction of Cysteine with Sucrose
The profile of the van Krevelen diagram for the reaction of cysteine with sucrose is similar to the
one with serine and saccharose, although the number of points in the aromatic region is higher
(Figure 6a). The intensities of carbohydrate-type compounds are not as high as in the case of serine,
while the signals of some of the reaction products between the amino acid and carbohydrate appear
with relatively high intensities (Figure 6b). This can suggest the intensive conversion of sucrose into
various products. In Figure 6c, with red nitrogen-free and blue nitrogen-containing compounds, most
of the nitrogen-free compounds appearing in the left upper part are characteristic of lipid-type
compounds. Some of them are seen in the aromatic region after the successive dehydration reaction.
The nitrogen-containing compounds are almost evenly spread over the whole graph. In Figure 6d, we
can observe the distribution of nitrogen-containing compounds. The N-containing compounds show a
pattern resembling the van Krevelen plot of serine-derived Maillard products. As for serine, the
products with one nitrogen atom are distributed in the whole diagram and are placed in the upper left
side, in the aromatic region and in the middle of the graph. The last corresponds to the reaction
Foods 2014, 3 471
products between cysteine and carbohydrate. The products with three nitrogen atoms are located
mainly around the point of 0.2 for O/C and 1.5 for H/C, which is in agreement with the reaction of
serine. In the same region, most of the compounds with four nitrogen atoms are observed. In Figure 6e,
the allocation of sulfur-containing molecules is shown. Most of these molecules are located in the
middle of the graph, being the reaction products between cysteine and sucrose. Some of them are
placed in the aromatic region with a low O/C ratio after successive dehydration.
Figure 5. The van Krevelen diagrams of the reaction of sucrose with serine: (a) with
colored groups of compounds; (b) with the intensities; (c) with nitrogen-free (red points)
and nitrogen-containing compounds (blue points); (d) with nitrogen-free (red points)
compounds and one nitrogen atom (blue points), two (green), three (yellow) and four
(violet) nitrogen atoms in negative ion mode.
(a) (b)
(c) (d)
Dehydration products and the reaction products between amino acids and carbohydrates
CarbohydratesLipid-type compounds
Aromatic compounds
3.O
2.5
0.5
0
1.0
2.0
1.5
0.2 1.0 1.2 1.4 1.6 1.80.4 0.6 0.8
H/C
O/C
2.0
3.O
2.5
2.O
1.5
1.O
0.5
H/C
O0.2 0.4 0.6 0.8 1.O 1.2 1.4 1.6 1.8 2.O
O/C
3.O
2.5
2.O
1.5
1.O
0.5
H/C
O0.2 0.4 0.6 0.8 1.O 1.2 1.4 1.6 1.8 2.O
O/C
3.O
2.5
2.O
1.5
1.O
0.5
H/C
O0.2 0.4 0.6 0.8 1.O 1.2 1.4 1.6 1.8 2.O
O/C

Foods 2014, 3 472
Figure 6. The van Krevelen diagrams of the reaction of sucrose with cysteine: (a) with
colored groups of compounds; (b) with the intensities; (c) with nitrogen-free (red points)
and nitrogen-containing compounds (blue points); (d) with nitrogen-free (red points)
compounds and one nitrogen atom (blue points), two (green), three (yellow) and four
(violet) nitrogen atoms; (e) with sulfur-free (red points) and sulfur-containing (green
points) compounds in negative ion mode.
(a) (b)
(c) (d)
(e)
Dehydration products and the reaction products between amino acids and carbohydrates
CarbohydratesLipid-type compounds
Aromatic compounds
3.O
2.5
0.5
0
1.0
2.0
1.5
0.2 1.0 1.2 1.4 1.6 1.80.4 0.6 0.8
H/C
O/C2.0
3.O
2.5
2.O
1.5
1.O
0.5
H/C
O0.2 0.4 0.6 0.8 1.O 1.2 1.4 1.6 1.8 2.O
O/C
3.O
2.5
2.O
1.5
1.O
0.5
H/C
O0.2 0.4 0.6 0.8 1.O 1.2 1.4 1.6 1.8 2.O
O/C
3.O
2.5
2.O
1.5
1.O
0.5
H/C
O0.2 0.4 0.6 0.8 1.O 1.2 1.4 1.6 1.8 2.O
O/C
3.O
2.5
2.O
1.5
1.O
0.5
H/C
O0.2 0.4 0.6 0.8 1.O 1.2 1.4 1.6 1.8 2.O
O/C

Foods 2014, 3 473
4. Conclusions
To conclude, we have characterized complex mixtures formed upon the heating of different amino
acids with sucrose using powerful mass spectrometry techniques. We have shown that thermal
treatment of reactive amino acids with carbohydrates results in several thousand reaction products. The
different reactivity of free amino acids has been demonstrated. In particular, lysine and tyrosine in the
presence of sucrose yielded the simple spectra, followed by arginine and aspartic acid, while
cysteine and serine produced the highest number of compounds. We have identified the whole
range of caramelization products, including oligomers of carbohydrates with up to six carbohydrate
units, dehydration products of oligomers loosing up to a maximum of seven water molecules,
hydration products of sugar oligomers, disproportionation products and aromatic compounds. Except
caramelization reaction products, many reaction products between amino acids and carbohydrates have
been found in the samples, including adducts of amino acids with carbohydrates up to four
carbohydrate units. The formation of the reaction products between amino acids and sucrose without
two water molecules was favored. The compounds with up to four nitrogen atoms incorporated in the
structures have been formed and illustrated in the graphs. Several sulfur-containing MRPs have been
identified in the reaction of sucrose with cysteine (e.g., the addition products of cysteine and hexose).
Because of the high accuracy of FT ICR-MS, the formula assignment for nitrogen- and sulfur-containing
molecules was successful. The van Krevelen diagrams generated form FT ICR-MS data turned out to
be useful tools in complex mixture characterization. The work described herein provides a comprehensive
overview on Maillard chemistry, without which our life would be tasteless.
Acknowledgments
The authors thank Jacobs University Bremen and Henkel AG & Co. KGaA for the financial
support. We are grateful to Nadim Hourani and Matthias Witt for recording the FT ICR-MS spectra.
Technical assistance by Anja Müller and graphical support by Borislav Milev are acknowledged.
Author Contributions
Agnieszka Golon carried out all experimental work and data interpretation jointly with Nikolai Kuhnert.
All authors contributed to the writing of the manuscript.
Conflicts of Interest
The authors declare no conflict of interest.
References
1. Kuhnert, N.; Dairpoosh, F.; Yassin, G.; Golon, A.; Jaiswal, R. What is under the hump? Mass
spectrometry based analysis of complex mixtures in processed food—Lessons from the
characterisation of black tea thearubigins, coffee melanoidines and caramel. Food Funct. 2013, 4,
1130–1147.

Foods 2014, 3 474
2. Fogliano, V.; Morales, F.J. Estimation of dietary intake of melanoidins from coffee and bread.
Food Funct. 2011, 2, 117–123.
3. Delgado-Andrade, C.; Seiquer, I.; Haro, A.; Castellano, R.; Navarro, M.P. Development of the
Maillard reaction in foods cooked by different techniques. Intake of Maillard-derived compounds.
Food Chem. 2010, 122, 145–153.
4. Knerr, T.; Pischetsrieder, M.; Severin, T. 5-Hydroxy-2-methyl-4-(alkylamino)-2H-pyran-3(6H)-
one: A New Sugar-Derived Aminoreductone. J. Agric. Food Chem. 1994, 42, 1657–1660.
5. Du, Q.-Q.; Liu, S.-Y.; Xu, R.-F.; Li, M.; Song, F.-R.; Liu, Z.-Q. Studies on structures and
activities of initial Maillard reaction products by electrospray ionisation mass spectrometry
combined with liquid chromatography in processing of red ginseng. Food Chem. 2012, 135,
832–838.
6. Wang, H.-Y.; Qian, H.; Yao, W.-R. Melanoidins produced by the Maillard reaction: Structure and
biological activity. Food Chem. 2011, 128, 573–584.
7. Silván, J.M.; van de Lagemaat, J.; Olano, A.; del Castillo, M.D. Analysis and biological
properties of amino acid derivates formed by Maillard reaction in foods. J. Pharm. Biomed. Anal.
2006, 41, 1543–1551.
8. Cerny, C.; Davidek, T. Formation of aroma compounds from ribose and cysteine during the
Maillard reaction. J. Agric. Food Chem. 2003, 51, 2714–2721.
9. Borrelli, R.C.; Mennella, C.; Barba, F.; Russo, M.; Russo, G.L.; Krome, K.; Erbersdobler, H.F.;
Faist, V.; Fogliano, V. Characterization of coloured compounds obtained by enzymatic extraction
of bakery products. Food Chem. Toxicol. 2003, 41, 1367–1374.
10. Lindenmeier, M.; Hofmann, T. Influence of baking conditions and precursor supplementation on
the amounts of the antioxidant pronyl-l-lysine in bakery products. J. Agric. Food Chem. 2003, 52,
350–354.
11. Lindenmeier, M.; Faist, V.; Hofmann, T. Structural and functional characterization of
pronyl-lysine, a novel protein modification in bread crust melanoidins showing in vitro
antioxidative and phase I/II enzyme modulating activity. J. Agric. Food Chem. 2002, 50,
6997–7006.
12. Hofmann, T. AcetylformoinA chemical switch in the formation of colored Maillard reaction
products from hexoses and primary and secondary amino acids. J. Agric. Food Chem. 1998, 46,
3918–3928.
13. Cerny, C.; Briffod, M. Effect of pH on the Maillard reaction of [13C5]xylose, cysteine, and
thiamin. J. Agric. Food Chem. 2007, 55, 1552–1556.
14. Mundt, S.; Wedzicha, B.L. Role of glucose in the Maillard browning of maltose and glycine: A
radiochemical approach. J. Agric. Food Chem. 2005, 53, 6798–6803.
15. Hwang, I.G.; Kim, H.Y.; Lee, S.H.; Woo, K.S.; Ban, J.O.; Hong, J.T.; Yu, K.W.; Lee, J.;
Jeong, H.S. Isolation and identification of an antiproliferative substance from fructose-tyrosine
Maillard reaction products. Food Chem. 2012, 130, 547–551.
16. Kuhnert, N.; Drynan, J.W.; Obuchowicz, J.; Clifford, M.N.; Witt, M. Mass spectrometric
characterization of black tea thearubigins leading to an oxidative cascade hypothesis for
thearubigin formation. Rapid Commun. Mass Spectrom. 2010, 24, 3387–3404.

Foods 2014, 3 475
17. Kuhnert, N.; Clifford, M.N.; Muller, A. Oxidative cascade reactions yielding polyhydroxy-theaflavins
and theacitrins in the formation of black tea thearubigins: Evidence by tandem LC-MS. Food
Funct. 2010, 1, 180–199.
18. Jaiswal, R.; Matei, M.F.; Golon, A.; Witt, M.; Kuhnert, N. Understanding the fate of chlorogenic
acids in coffee roasting using mass spectrometry based targeted and non-targeted analytical
strategies. Food Funct. 2012, 3, 976–984.
19. Golon, A.; González, F.J.; Dávalos, J.Z.; Kuhnert, N. Investigating the thermal decomposition of
starch and cellulose in model systems and toasted bread using domino tandem mass spectrometry.
J. Agric. Food Chem. 2012, 61, 674–684.
20. Golon, A.; Kuhnert, N. Unraveling the chemical composition of caramel. J. Agric. Food Chem.
2012, 60, 3266–3274.
21. Golon, A.; Kuhnert, N. Characterisation of “caramel-type” thermal decomposition products of
selected monosaccharides including fructose, mannose, galactose, arabinose and ribose by
advanced electrospray ionization mass spectrometry methods. Food Funct. 2013, 4, 1040–1050.
22. Pais, P.; Knize, M.G. Chromatographic and related techniques for the determination of aromatic
heterocyclic amines in foods. J. Chromatogr. B Biomed. Sci. Appl. 2000, 747, 139–169.
23. Wu, Z.; Rodgers, R.P.; Marshall, A.G. Two- and three-dimensional van Krevelen diagrams: A
graphical analysis complementary to the Kendrick mass plot for sorting elemental compositions
of complex organic mixtures based on ultrahigh-resolution broadband fourier transform ion
cyclotron resonance mass measurements. Anal. Chem. 2004, 76, 2511–2516.
© 2014 by the authors; licensee MDPI, Basel, Switzerland. This article is an open access article
distributed under the terms and conditions of the Creative Commons Attribution license
(http://creativecommons.org/licenses/by/3.0/).