Photosynthetic limitations in Mediterranean plants: A review
Upload
independentCategory
view
1download
0
THE INFLUENCE OF PARTIAL PRESSURE OF CARBON DIOXIDE ON PHOTOSYNTHETIC EFFICIENCY.**
BY B. N . SINGH, D.SC. , Institute of Agricultural Research, BeJmres Hindn Uni~'ersity
A.~D
K. Ku~lX, ~LSc., Institute of Agricultural Research, Benares Hind',,. University.
Received January 30, 1935.
Introduction
Ix" the present paper it is proposed to analyse our data on the relation between the concentration of carbon dioxide in the environment and the rate of carbon dioxide assimilation by radish leaves, the same ' type leaves't being em- ployed whose photosynthetic behaviour was earlier studied in response to different light intensities under known conditions of other external variables.
The general technique of experimentation was the same as described in a previous contribution. 15 Variations of carbon dioxide supply were brought about by either altering the rate of dropping of hydrochloric acid upon the marble pieces in the CO2 generating tower or by altering the strength of the acid dropped, or both. The other external factors of temperature and light intensity were kept at a known value.
Observations made hitherto by different workers on the relation between the concentration of carbon dioxide and the rate of photosynthesis by plants, although not in entire unison with one another, possibly on account of the differences in the experimental conditions which have been used, have served to emphasise the fact that the curve connecting the partial pressure of carbon dioxide with the rate of photosynthesis consists of three main parts. There is the s ascending part of the curve, which is more or less linear, and where the photosynthetic activity appears to increase proportionately to the carbon dioxide concentration. This is followed either immediately or after an intervening gradual bend by a horizontally linear part where the
* This paper belongs to the series "Studies in Photosynthesis of Tropical Plants," and is fifth in the series.
Contributions from the Institute o~ Agric,.~ltural Research, Benares Hindu University.
t Young-mature leaves: such leaves are thirteen to sixteen days old chronologically, expose an area of 20-28 sq. cm. on a single side and are physiologically intermediate between the extreme type of young and mature leaves.
909

910 B. N. Singh and K. Kumar
assimilatory act ivi ty is limited by some factor other t han carbon dioxide concentration. And lastly comes the descending portion of the curve where the narcotic effect of high percentages of carbon dioxide on photo- synthesis manifests. The points round which the conflict centres a re : (1) whether the ascending portion of the curve passes into the horizontal portion at a clearly defined point or whether the transi t ion is a gradual one ? and, (2) whether the ascending portion of the curve is linear denoting strict proportionali ty between the rate of photosynthesis and the lower concentra- tions of carbon dioxide or whether there is a falling off of this relation right from the start ?
Regarding the first point, Blackman and Smith -~ have constructed the curve expressing the carbon-dioxide-photosynthesis relation with a sharp angle between the rising part of the curve and the subsequent horizontal phase. ~iost of the subsequent workers, however, including among others, Boysen Jensen ~, Bose? Warburg, is Harder, 11 and Lundeg~rdh 1,~ have ob- tained smooth curves expressing this relationship instead of the t3-pical limiting factor curve with a sharp bend. Again, Blackman and Smith ~ have demonstrated a direct proportionality between lower concentrations of carbon dioxide and the rate o f assimilation working with the aquatic plant Elodea. The experiments of Brown and Escombe 5 on Helianthus annuus and other land plants point in the same direction. Contrary to the findings of these workers, Warburg Is and I-Iarder ]I failed to detect a direct proportionality between carbon dioxide concentration and assimilation. More recently James ]~ working from a somewhat different s tandpoint of the conditions of supply of carbon dioxide to water plants has shown tha t the relationship between the partial pressure of carbon dioxide and the rate of assimilation is expressed by smooth curves of hyperbolic form.
Our object in undertaking these experiments was the re-investigation of the fundamental relation between CO.2 concentration and the velocity of photosynthesis in tropical leaves with special reference to the controversial points in question.
The rate of photosynthesis under varying concentration of C02
Low light intensity--Experiments I - - u were run at a more or less con- stant illumination intensity of 5,730 M.C. with young-mature leaves of radish selected from plants about a month and a quarter old. The experimental temperature throughout this series of experiments was mainta ined at 29 ~ C. with fair constancy. The results are graphically represented in curve I, Figs. 1 and 2. Details as regards the plotted values of assimilation and the carbon dioxide concentrations used in each experiment are given in the
lmqueme o~ Partial Pressure o/CO~_ o~ Pholosynfhetic E~cieJzcy 911
legend below the figures. I t will be observed that as the concentration of carbon dioxide increased from 0.057 to 7.65 mgm. per 100 c.c. the rate of photosynthesis continued to rise though the rise was not uniform throughout this range, it being higher between 3.07 and 5.5 mgm. per 100 c.c. than at the earlier range and in general showing a falling off as the concentration of carbon dioxide advanced to 7.65 mgm. per 100 c.c. From 7.65 to 8.9 mgm. per 100 c.c. the rate of assimilation kept at a practically stat ionary value showing thereby that some factor other than carbon dioxide, was limiting the rate of assimilation at this stage. Further increase of the con- centration of carbon dioxide to 9.6 mgm. per 100 c.c. resulted in a fall in the rate of assimilation due probably to the toxic action of high carbon dioxide percentages on assimilation beginning at this stage.
The impetus to using this light in this set of experiments arose from the fact that in these regions light intensities of this order obtain in nature during the months of August and September when the sky is frequently overcast and it rains not unoften. This series of experiments, therefore, gives us the means of predicting the photosynthetic behaviour of radish plants during the rainy season under various stresses of carbon dioxide concentration.
Medium light intensity--In the foregoing series of experiments it having been observed that the maxinmm assimilation value (56-100mgm.) was attained at 7-65 mgm. per 100 c.c. and tha t the increase of carbon dioxide concentration front 7.65 to 8.9 mgm. per 100 c.c. remained without visible effect in furthering the rate of assimilation, it was thought desirable to in- vestigate the nature of the controlling factor which exercised a limiting action at this stage. Since the temperature used was one tha t had been shown to be adequate for high rates of assimilation 15 it was decided to use a moderate illumination intensity of 28,650 N.C. Six experiments (VI--XI) were performed at this light intensity, using as in the previous series, several concentrations of carbon dioxide. The temperature was again maintained at 29 ~ C. throughout this series of experiments. The results are presented in curve II, Figs. 1 and 2. The plotted values of assimilation in each experi- ment together with the corresponding concentrations of CO~ are indicated in legends below the figures.
The general contour of the carbon dioxide concentration-assimilation carves obtained at this light intensiW is rather contrasted from tha t obtained for the lower light intensity especially in the first rising part of the curves which show a steeper rise. This may probably be connected with the general widening of the stomatal opening and the changes in the diffusion and photo- chemical redaction of carbon dioxide with the increase of light intensity. I t will be recalled that Lundeg~rcth's CO,,-curves (relating apparent
912 B.N. Singh and K. Kurnar
assimilation to carbon dioxide concentration) obtained at higher light show a similar distinction from those obtained at the lower light, though the light- curves (revealing the relat ion of apparent assimilation to light intensity) obtained at different carbon dioxide concentrations obviously adhere to the same form at all concentra t ions of carbon dioxide at which they were obtained. ~Ioreover, our own light-assimilation curves obtained at different par t ia l pressures of carbon dioxide 16 unlike our CO,2-assimilation curves obta ined at different l igh t intensities, show more uniformity among them- selves in th is respect.
The ascending p a r t of the curve is more or less gradually brought to a t e rmina t ion at a concentra t ion of 7.69 mgm. per 100 c.c. in the assimilation value of 181.009 mgm. Thereaf ter the curve is continued in an approxi- mate ly level phase up to 10.0 mgm. per 100 c.c. again indicating t ha t in th is region the assimilation is independent of carbon dioxide concentration and most probably l ight- l imited. W i t h this intensity of l ight the horizontal port ion of the curve is reached at a higher value of assimilation (181.009 mgm.) t han wi th the lower l igh t (56.100 mgm.). Further increase of carbon dioxide concentrat ion beyond 10.0 mgm. per 1O0 c.c. results in a depression of the assimilatory act iv i ty as is evidenced by the falling portion of the curve.
This declining phase of the curve represents the results of Exper iments X - - X I . In :Experiment X, at a concentration of 12.7 mgm. per 100 c.c. the rate of assimilation of a young-matu re leaf is depressed to a levelwhen the assimilation (apparent) ceases completely and a good deal of the respiratory carbon dioxide too remains unassimilated, inasmuch as the value of assimilation (real) under this high par t ia l pressure of carbon dioxide is only 0.24 mgm. as against a respiration value of 8 .24 mgm. During the course of the same experiment the leaf received a s l ight ly lower concentration of carbon dioxide of 12.6 mgm. per 100 c.c. when the assimilation (real) achieved was 1 -66 mgm., tha t is to say, the ass imila t ion was enhanced by a slight uncontrollable varia- t ion in the supply of ca rbon dioxide on the side of defect. I-Iowever, i t still remained at a pi tch a t which there was no apparent assimilation, and at which a considerable amoun t of the respiratory carbon dioxide continued to pass unassimilated. This accidental lowering of the COp-concentration having provided an ink l ing of the fact tha t the toxic effect of high carbon dioxide concentrat ion apparen t ly disappears, a substant ial ly lower concen- t ra t ion of carbon dioxide of 10.7 mgm. per 100 c.c. was designedly supplied to the leaf later. The ass imilat ion recorded under this carbon dioxide con- centrat ion was 120.006 mgm. This reading confirmed tha t recovery from the toxic effect of strong carbon dioxide is possible even when the assimilation has fallen to a level where the leaf has stopped assimilating a large measure

xrsz/f~tes~ce of ParLial Pressure o/CO.> oJz t~tzofosyu#zetic 27~ciency 913
of its respiratory exhalation even. Experiment XI was performed with a
young-mature leaf at a carbon dioxide concentration of II .01 mgm. per
I00 c.c. in the first half of the experiment and I0 .I mgm. per ]00 c.c. in the
second half of ihe experiment. The assimilation value obtained at II .01
mgm. carbon dioxide concentration was 115.212 mgm. In the latter half
of the experiment when the concentration supplied was I0.I mgm. this
value rose to 190.206mgm., which is in fair agreement with the value
obtained at i0.00 mgm. per I00 c.c., namely, 191.256 mgm.
The depression in assimilation due to high carbon dioxide concentra-
tion has been ascribed by Blackman to a general narcotic effect of strong carbon
dioxide upon protoplasm. A similar effect was previously noted by Chapin 6
in connection with the gro~ch of bean roots and the hypocotyl of Sinapis. Darwin, s Linsbaur, 12 Chapman, Cook and Thompson 7 have found that high
concentrations of carbon dioxide induce a closure of the stomata and thus
depress assimilation. Thus it appears that two causes are responsible for
the retardation of assimilation at high concentrations of carbon dioxide.
Little light seems to have been thrown, however, on the exact nature of the
insensibility produced in the protoplasm of the leaf which reacts adversely
on the photosynthetic activity.
B1ackman and Smith 2 have shown that in water plants there is no
depression even with such a high concentration of carbon dioxide as is con-
tained in an aqueous medium of 30 vols. per cent. dissolved carbon dioxide.
On this account the horizontal part of the curves relating to their experi-
ments, and those of Harder and others II who have experimented with water
plants, is fairly prolonged. In radish, on the other hand, as an inspection
of our curves would show, this region is comparatively short, denoting the
smaller resistance of radish leaves to the poisonous action of high concentra-
tions of carbon dioxide.
High light intensity---The assimilational values recorded in the experi- ments of the last section reached almost their highest magnitude in 181.009 mgm. at a carbon dioxide concentration of 7.696 mgm. per 100 c.c. and remained at approximately the same level between 7.696 mgm. per 100 c.c. and 10 mgm. per 100 c.c. In this section a series of experiments made at a higher light of 68,760 ~.C. with young-mature leaves of radish gathered from plants 32-40 days old are described. The temperature was kept the same as in the first two series, viz., 9,9 ~ C. The first determination was made at a concentration of 0.3 mgm. per 100 c.c. when the hourly assimilation was 37.902 mgm. (Experiment XII) . The next Exper iment (XIII) was run at a carbon dioxide concentration of 3.5 mgm. per 100 c.c. the assimila- tion mounting to 121.440 mgm. Exper iment XIV was carried out at two
]37
914 B. N. Singh and K. Kumar
different concentrations of 7.0 mgrn. in the earlier part and 7.9b mgm. per
i00 c.c. in the latter part, other conditions being maintained as in the earlier
experiments. At 7 mgm. per I00 c.c. the assimilation averaged 301.106 mgTn.
and at 7- 95 mgm. per I00 e.c. it was 827 -340 mgm. In Experiment XV the
carbon dioxide supply was raised to I0.6 rngm. per I00 c.c., the assimilation
achieved per hour under this concentration was 839.748 mgm., showing thereby
that increase of carbon dioxide concentration had ceased to sensibly increase
photosynthesis and that some factor other than carbon dioxide had begun
to act as a limiting factor. To trace the sloping portion of the curve at this
light intensity further, higher concentrations of carbon dioxide were used.
~Experiment XVI was conducted at a concentration of 12.5 mgm. per I00 c.c.
when the photosynthetic rate was found to drop to 289.060 mgm. The next
~Experiment (XVII) was performed at three different concentrations of 0.0525,
0-0815 and 0.15~5 mgm. per I00 c.c. giving tlle usual preliminary before the
determination at each concentration of carbon dioxide. The assimilation
values reached were ]?.146, 18-712 and 25.140rngms. respectively. The
last Experiment (XVIII) conducted under this high illumination intensity
was at a carbon dioxide supply of 0.598 mgm. per I00 c.c., the photosynthetic
value realised in this case being 43.906 mgm.
COo-Photosynthesis Proportionality A survey of the three carbon dioxide assimilation curves obtained at
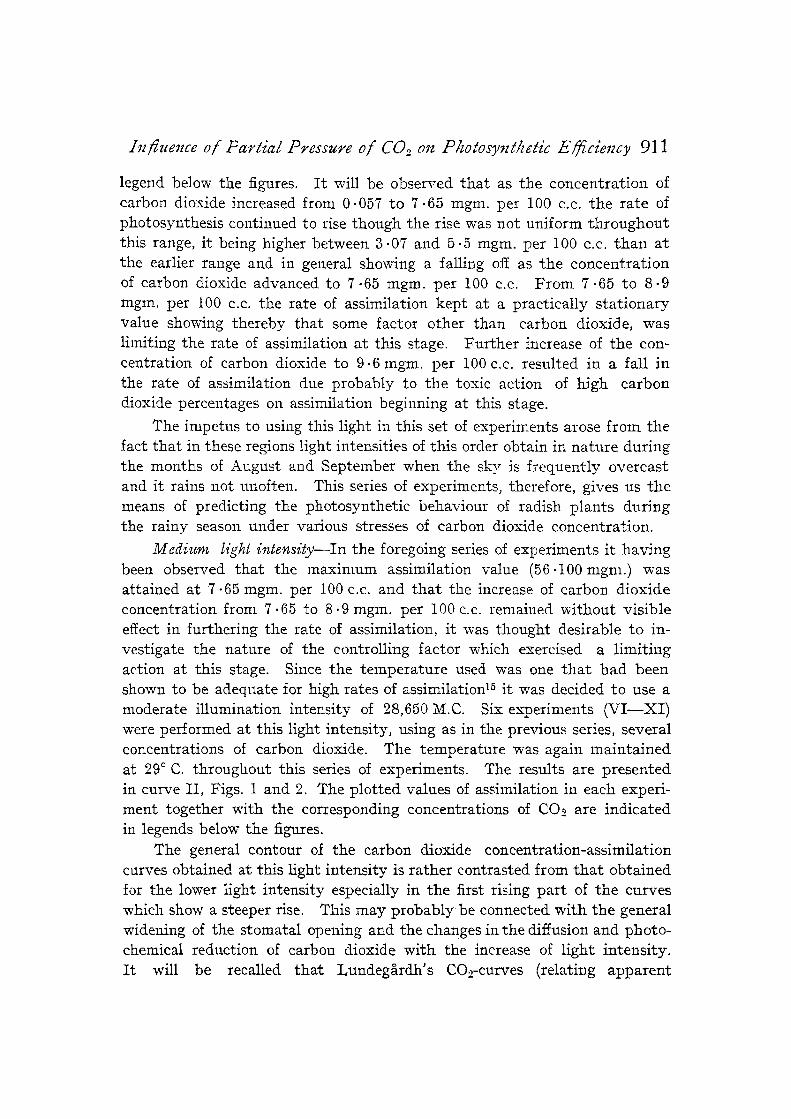
low, medium, and high Hght intensities shows tha t strict proport ional i ty does not hold over any range of concentrations, l~or example in curve I, the assimilation at carbon dioxide concentrations of 1.35 and 3"07 mgm. per 100 e.c. is 12.249 mgln. and 20.869 mg-m. respectively, i.e., by increasing the concentration of carbon dioxide 2.27 times the assimilation is only pro- moted 1.71 times. Examining the assimilation values for another two con- centrations 3.07 and 5.50 mgrn. per 100 c.c. on the same curve, we notice that an increase of carbon dioxide concentration by 1.79 times is followed by an increase of assimilation 2-1 times, the assimilation value at the la t ter concentration being 44.949 mgrn. A similar examination of curve I I between the same two pairs of carbon dioxide concentrations shows tha t the assimila- tion is increased 1 -77 times for an increase of 2.27 times in the carbon dioxide concentration with reference to the first pair of carbon dioxide percentages considered, and 2-85 times for an increase of 1.79 times in the concentrat ion with reference to the second pair considered. Likewise in carve I I I , the assimilation rose from 37-902 mgm. to 121.440 mgrn. by altering the concen- tration from 0.30 to 3.50 mgrn. per 100 e.c., i.e., there was an increase of 3.2 times in photosynthesis by raising the concentration ]1 .0 times. I n a further portion of curve 3, i t is seen tha t the assimilation is enhanced from

I~a/luc,zce of Partial Pressure of C02 o~a P~otosyntAetic k'~cie~acy 915
121-440 mgm. at 3.50 mgm. per 100 c.c. to 222 mgm. (read from curve) at 5"5 mgm. per 100 c.c. so tha t there is an increase of t -82 t imes in the assimilation as against an increase of 1.57 times in the carbon dioxide con- centration. These illustrations make it clear that there is no proport ional i ty kept between the varying carbon dioxide concentrations and the assimilation rate of radish leaves at concentrations lower than 2 mgm. per 100 c.c. and that between 3 and 5 mgm. per 100 c.c. such a relation appears to subsist. However, it is necessary to examine tha t region of the curve in which :Brown and Escombe 5 found a direct proportionality, i.e., upto 0.8 mgm. CO2 per 100 c.c.
In curve I, :Fig. 1, the value of real assimilation reached under an external carbon dioxide supply of 0.057 mgm. per 100 c.c. of air mixture passed over the leaf is 10.286 mgm. per hour and the value for about ten t imes tha t con- centration, viz., 0-5 mgm. is 11-549 mgm. per hour as can be easily seen from the inset d i a ~ a m in Fig. 1 which represents the earliest portions of curves, I, II, and I I I drawn to an extended scale. I t wiI1 be noted t h a t practically a ten-t ime increase in the concentration in this case has not resulted in a proportionate increase in the real assimilation which has only gone up 1.12 times what it was at the lower concentrations.
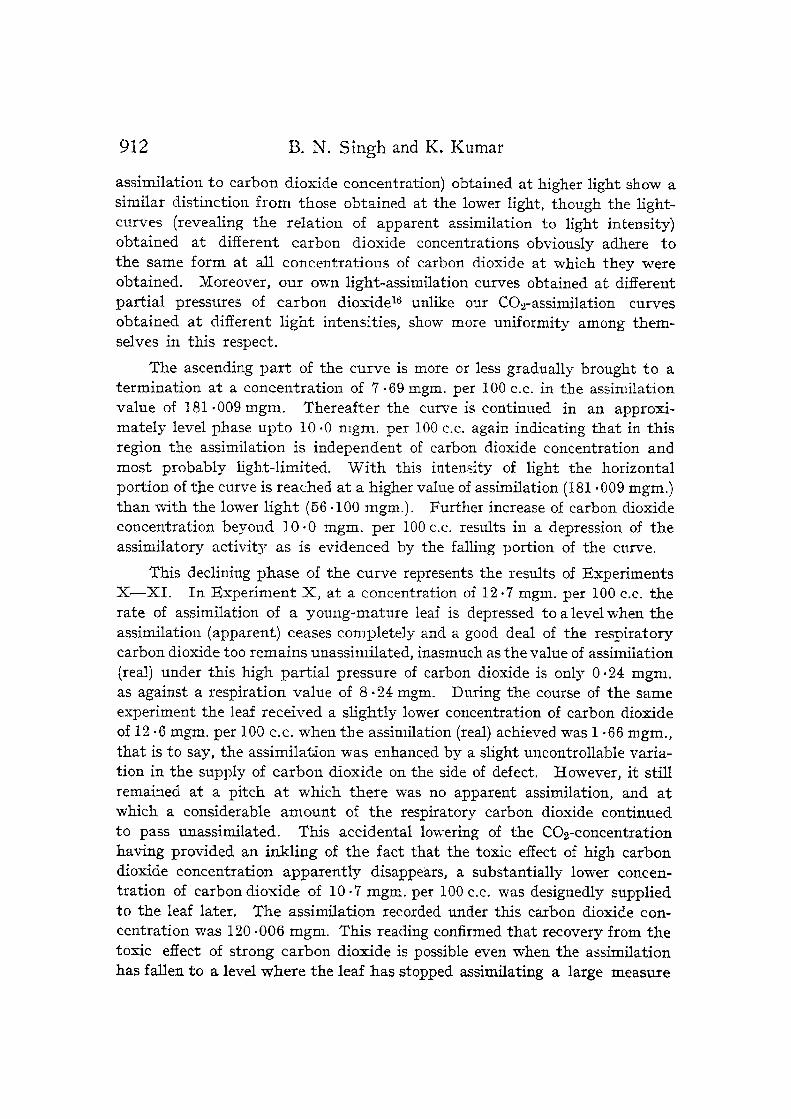
]Examining real assimilation values at C Q concentrations of about the same order in curve II, :Fig. 1, we find that at 0-049 mgm. carbon dioxide supply per 100 c.c. the hourly assimilation value is 10.846 mgm. atad at 0.0739 mgm. per 100 c.c. it is 11.585 mgm. That is to say, the ratio of the partial pressures of carbon dioxide in these two cases is 1 : 1.50 while the ratio of carbon dioxide absorbed per hour in these cases is 1 : 1-06. Surely there is not much correspondence between these ratios, but if we focus our at tent ion on the hourly apparent assimilation values achieved at these concentrations, viz., 0.986 mgm. and 1 �9 725 mgm. respectively (curve II, Fig. 2) the case is altered, and for a ratio of carbon dioxide concentrat ion 1 : 1-50 the ratio of apparent assimilation is 1 : 1.74 which is indicat ive of a fair measure of agreement between these ratios.
Inspection of curve III , :Fig. 1, obtained at the highest light intensity, shows that the value of real assimilation attained at 0.0815 mgm. CO2 per 100 c.c. is 18.712 mgm. whereas for a 0.1520 mgm. carbon dioxide supply it is 25.140 mgm. The ratio of carbon dioxide concentrations in tiffs case is 1 : 1.86 while the ratio of the hourly assimilated amounts is 1 : 1.34, again showing a lack of clear correspondence between the two ratios. Considering, however, the hourly apparent assimilation at these two concentra- tions, 8.872 and 15-300 mgms. respectively (curve III , Fig. 2) the relation

916 B. N. S ingh and K. Kumar
340 ! - ~ �9 ,
3oo28o r ! ' J / - ~ ~oo t /
~" 240 '
~ I I, i I I 200 I
,oo JI ' / , ,oo \ , I [ '
z / " - ' ! , .', r , '
20; _R ~_ ~L.
2 4 6 8 10 12 14 CO. Concentration in mgm. per 100 c.c.
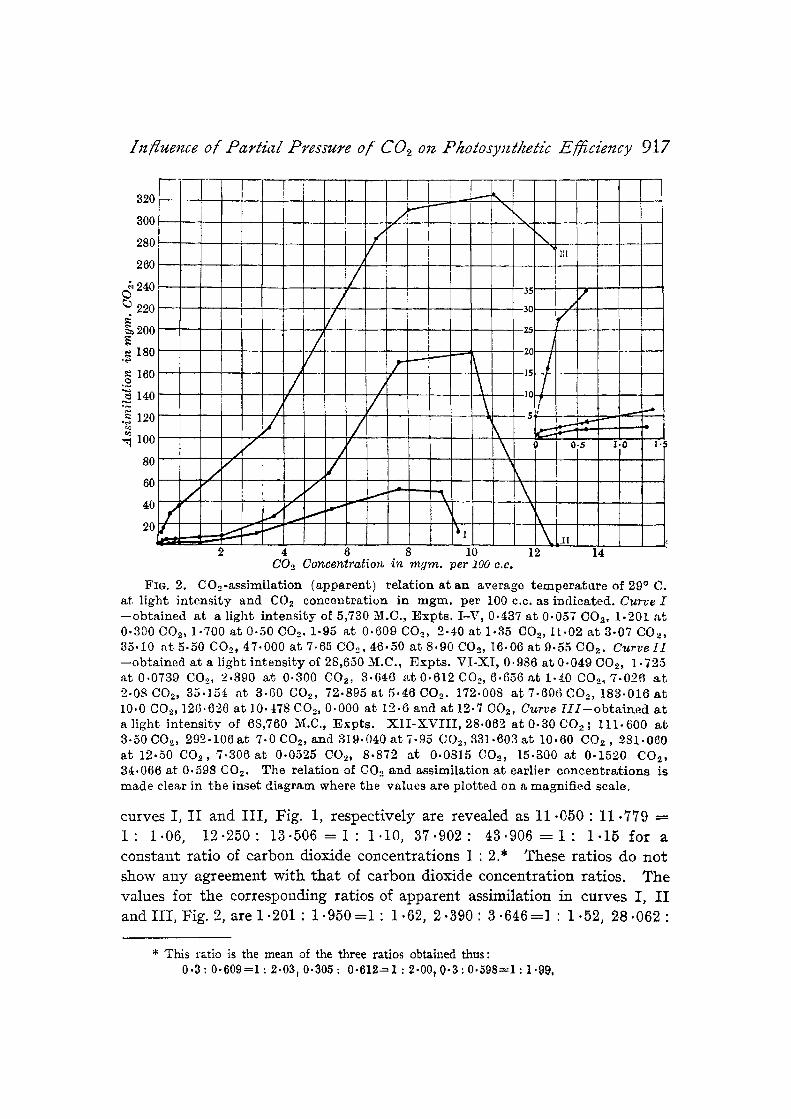
FIo. I. CO0-assimilation (real) relat ion a t an average t emp . of 29 ~ C~. a t t he l i gh t in tensi ty and COz concentrat ion in mgm. per 100 c.c. as indica ted . Curve Z--( lowest one) obtained a t a light, intensi ty of 5,730 M.C., :Expts. I - u 10.286 a t 0 .057 COo, 11-050 at 0.300 CO.-, 1 1 . 5 4 9 a t 0 . 5 0 C 0 , , 11.799 at 0 .609CO~, 1 2 - 2 t 9 9 5 1 . 3 5 0 COs, 20 .869 at 3.07 CO.,, 44.949 at 5.50 C0o, 56.100 at~ 7.65 COs, 5 4 . 9 5 a t 8 . 9 0 C O s , 24 .36 a,t 9.55 CO_~. Curve / / - - (midd le one) ob ta ined a t a light in t ens i ty of 28,(]50 lVLC., E x p t s . VI -XI , 10.8t6 at 0.049 O08, 11.585 a t 0.0739 COs, 12-250 a t 0 .305 COs, 1 3 . 5 0 6 a t 0.612 COs, 16-516 at 1.40 CO.~,16.886 at 2.08 CO.-, 45.014: a t 3.60 COs, 82.755 a t 5.4~0 COs, 1Sl-009 at 7-696 CO~, 191-25~i a t 10.0 CO..,, 134:.866 a t 10-478 CO~, 1 - 0 6 a t 12.60 CO,, 0.24 at 12.7 COo, 120.006 a t 10.70 CO,, 115.212 at 11.01 CO,,, 190.206, a t 10.10 COo. Curve I I I - - (uppermos t one) obta ined a,~a l ight inSensiby of 68,7601VI.C., Expts . X I I - X ~ ' I I I , 37.902 a t 0.30 COs, 121.4,40 a t 3 .50 CO2, 301.166 a t 7-0 (DO.,, 327.340 at 7.95, 339.74:3 at 10.60 CO.~, 289.060 at ]2 .50 CO_~, 17.14:6 a t 0.0525CO~, 18.712 at 0.0815 COs, 25.140 at 0.1520, 43.906 a t 0.598. In the inset d i ag ram t h e C02-assimilation ,'elation a t the earlier concent ra t ions is r ep resen ted on a magn i f i ed scale.
between carbon dioxide concentration and assimilation appears to be closer, for the ratios of the carbon dioxide partial pressures and of the appa ren t assimilations work out to be 1 : 1.86 and 1 : 1.72 respectively.
Again on surveying the values of real assimilation on curves, I, I I and I I I , Fig. 1, at a slightly further range of concentration, i.e., 0.30 mgm. at one end and 0.6 mgm. per 100 c.c. at the other, the ratios of real assimilation for
Izfluence of Parthd Pressure o/ C02 on PhotosyJz~hetic Efficiency 9 1 7
820
300
280
260
~ 2 4 0 ,
20q
.~ lSO
160
100
80
60
40 / /-
I r i i i �84 ! / " 7 - - - - " \
f I \ ,
/ f
/ /
!
/
/ /
/
/ /
/ /
2 4 6 8
Ill
35 :r
30 /
r ~-*
\ ,
\ , \[,
10 12 14 C02 Concentratio~ in mgm. per 100 c.c.
FIG. 2. COo-ass imi la t ion ( appa ren t ) r e l a t ion a t an average t e m p e r a t u r e of 29 ~ C. a t l igh t i n t e n s i t y and CO2 concen t r a t ion in m g m . per 100 c.c. as ind ica ted . Curve I - - o b t a i n e d a t a l ight i n t ens i t y of 5,730 M.C., F x p t s . I -V , 0.437 a t 0.057 CO2, 1.201 a t 0.300 (302, 1.700 a t 0 -50COe . 1.95 a t 0 .609CO~, 2-40 a t 1.35 CO2,1L.02 a t 3 .07 COx, 35.10 a t 5.50 CO~, 47.000 a t 7.65 CO, , g6.50 a t 8 .90 CO,, 16.06 a t 9.55 CO2. Curve I1 - -ob t a ined a t a l ight i n t ens i t y of 28,650 M.C., E x p t s . V I - X I , 0.986 a t 0 .049 OO.% 1.725 a t 0.0739 COe, 2.390 a t 0.300 CO.~, 3.6t-6 ~tt 0 .612 CO~, 6.656 a t 1.z.0 CO2, 7-026 a t 2.08 CO,, 35.154 a t 3 .60 COe, 72.895 a t 5.1-6CO2. 172,008 a t 7.696 CO-", 183-016 a t 10.0 CO.,, 126.626 a t 10.478 CO-", 0.000 a t 12.6 and a t 12.7 002, C~trve [ I I - - o b t a i n e d a t a l ight i n t ens i t y of 68,760 M.C., .Expts. X I I - X V I I I , 28.062 a t 0-30 CO,, ; 111.600 a t 3.50 CO-", 2 9 2 - 1 0 6 a t 7.0 C02, and 3 !9 .040 a t 7-95 CO.,, 331.603 a t 10.60 COz , 281.060 a t 12.50 COs, 7 . 3 0 6 a t 0.0525 CO.,, 8 .872 a t 0.0815 CO-", 15.300 a t 0 .1520 CO2, 34.066 a t 0.598 CO2. The re la t ion of CO.~ a n d ass imi la t ion a t ear l ier c o n c e n t r a t i o n s is m a d e clear in t he inset d i ag ram where the values a re p lo t ted on a magni f i ed scale.
curves I, I I and I I I , Fig. 1, respect ively are revealed as 11.050 : 11.779 ~- 1 : 1-06, 1 2 - 2 5 0 : 1 3 . 5 0 6 = 1 : 1.10, 3 7 - 9 0 2 : 4 3 . 9 0 6 = 1 : 1 - 1 5 for a cons tant rat io of carbon dioxide concentra t ions 1 : 2.* These rat ios do n o t show any agreement wi th t h a t of carbon dioxide concent ra t ion ratios. The values for t he corresponding ratios of apparent assimilat ion in curves I, I I and I I I , Fig. 2, are 1.201 : 1 . 9 5 0 = 1 : 1.62, 2 . 3 9 0 : 3 . 6 4 6 = 1 : 1.52, 2 8 . 0 6 2 :
* This ratio is the mean of the three ratios obtained thus: 0 . 3 : 0 - 6 0 9 = 1 : 2 . 0 3 , 0 . 3 0 5 : 0 . 6 1 2 = 1 : 2 . 0 0 , 0 . 3 : 0 . 5 9 8 = 1 : 1 . 9 9 ,
918 B. N. Singh and K. Kumar
3~ .066 =1 : 1 -21 respectively, showing in each case an at tempt to approach the value of the ratio of carbon dioxide partial pressures, viz., 1 : 2, though this at tempt does not appear to be effective in any case.
From considerations presented above the following facts are brought to light. Firstly, in any question of proportionality between CO2 tensions and rate of photosynthesis the relation between apparent assimilation and carbon dioxide concentration is more direct than that between real assimila- tion and carbon dioxide concentration, specially is this true of the lower CO.2 concentrations where the respiration component of real assimilation is likely to exceed in magnitude the assimilation component so far as to mask any proportionality relationship existing between the supply of carbon dioxide factor and the assimilatory activity. Secondly, the range of carbon dioxide concentration over which direct proportionality holds between carbon dioxide supply and the intensity of assimilation appears to be shorter in this plant (0-04 to 0. i5 mgm. per 100 c.c.) than that found by Brown and Escombe 5 in Helia~thus annuus and the other plants examined by them (between 0.6 part and 6 parts per 10,000 of air).
The Nature of the C02-Assimila~ion Cerves A perusal of the carbon dioxide-assimilation curves from the point of
view of their shape shows that they are neither in conformity with the typical limiting factor curve of Blackrnan 1 with a sharp angle at the point of change of the limiting factor nor do they follow the smooth-rounded contour of the Harder n or Boysen Jensen 4 curves. They appear to take an intermediate position in this respect. The departure from the typical limiting factor curve of Blackman noticed generalIy by the later workers has found an explanation in Maskell's 14 theoretical scheme where variations in the diffusion resistances have been shown to have certain definite effects on the curves expressing the relation between external carbon dioxide concentration and the rate of photo- synthesis. Maskell has shown that the smaller the value of D (total resistance in the diffusion path of carbon dioxide) under otherwise constant conditions, the more rectangular is the carbon dioxide-assimilation curve, in other words, the more closely it approaches the typical limiting factor curve. James 10 working with submerged water plants has found that increasing the flow of the carbon dioxide solution in his experiments had an analogous effect to reduction of the diffusion resistances in Maskell's deduced curves. I t has been shown elsewhere 9 in a physical research undertaken to elucidate this physiological problem that the curve connecting the absorption of carbon dioxide by potash solutions, with the carbon dioxide concentrations supplied has a tendency to straighten up if the rate of flow of CO2-1aden air current is increased, thus strengthening the conclusions of Maskell and James tha t

h z/fueme o/P~rHM Pressure o/6"O~ o~ P/~olosj~z//r E.'//iciency 919
variations in the diffusion resistances have a definite effect on the shape of the curves indicating the relation between external carbon dioxide concentra- tion and the rate of photosynthesis. Our present observations on the leaves of radish, in which the diffusion resistances to the chloroplast surface are comparatively small are in accord with the expectations on the conclusions of 3'Iaskel114 and James 1~ inasmuch as tile carbon dioxide-assimilation curves do not present the smooth-rounded contour of the Harder n or Boysen Jensen* type of curves but are more angular in outline. However, one fact is noteworthy. Though our CO~-assimilation curves do not present the smooth-rounded contour of the Harder or Boysen Jensen type of curves but are more or less angular in outline, neither of them shows a sharp angle at the point of change of the limiting factor bu t rather both of them present more or less round corners. This persistence of the somewhat round corners even with the generally angular outline of the curves is significant, for while the relative lowness of the diffusion resistances in radish may account for the generally angular shape of the curves, i t is obvious from the round corners tha t there must be an additional factor responsible for variat ions in the shape of the CO.~-assimilation curves.
The Inter-Relation of Exiernal Factors Prior to the introduction by Blackman in 1905 of the conception of
limiting factors the relationship between physiological processes and the external factors was largely governed by the idea of three of cardinal points--- a minimum, an optimum and a maximum--characteristic for each external variable in respect of any one process. The untenability of such fixed cardinal points for each external factor relative to each physiological activity was soon shown by the development of the principle of limiting factors, for it was obvious that the value of these cardinal points shifted for each factor according to the particular ensemble of other factors in which it was measured. Thus the theory of limiting factors in its development provided the first means for the accurate analysis of the relation of various external factors controlling
a process. The study of the interaction of factors s t imulated by the examinat ion
of the principle of l imiting factors made it lie within the range of pract ical experimentation to answer Whether it is possible to increase the rate of assimilation by increasing the intensi ty of other factors than t h a t which is held to be limiting, and made it also possible to predict, wi th in limits, the value of assimilation likely to be reached in any combination of ex te rna l
factors. A reference to our CO2-assimilation curves I, n and I I I (]Figs. I and II)
shows that they start independently practically right from the beginning. It

920 B. N. Singh and K. Kumar
is therefore obvious that at all points Oli the rising limbs of these curves the
rate of photosynthesis increases with an increase in carbon dioxide concentra-
tion as well as with an increase in light intensity. We have called attention
in an earlier communication 16 to a similar phenomenon where it is stated
that in the previous set of experiments both the light hltensity of 28,650 ~.C.
and concentration of 0.049 mgm. per I00 c.c. were limiting the rate
of assimilation. The independent course of the temperature-assimilation
curves 15 and the light-assimilation curves 16 obtained by us at different con-
centrations of carbon dioxide is again reminiscent of the fact that at least
two factors may be determining the rate of assimilation at the same time.
An increase in either of them brings about an increase in the photosynthetic
rate, in contrast to the original view of Blackman. Thus it is not one
factor and one alone that controls the photosynthetic rate at any point on
the curve, as indeed the experimental evidences detMled elsewhere 17 lead
us to hold. It has been shown there that an increase in either light
or CO2 or temperature results in photosynthetic augmentation in spite
of the more or less constant intensity of the other two variables. These
results while supported by Harder's observations in broader details, do not
justify Harder's idea of relative mimmum with respect to factor intensity.
The fact at once is brought to the forefront t~mt. assimilation rate at any
point does not depend entirely upon one factor and one alone in limiting
quantity or upon the relative minimum concentration of a single factor 17 or
a group of such variables present in concentrations much below those of
others. The photosynthetic activity, depending as it does upon a number of
factors, thus appears to be neither governed by Blackman's law of limiting
factors nor Harder's conception of relative minimum but by the intensity
of each of the conditioning variables present either in lower (limiting) or higher (nonqimiting) concentrations.
Formulation of an Environment/or Optimal Assimilation of Radish
The considerable body o~ experimental evidence relating to the effect of environic factors on the photosynthesis of the radish plants available to us in the present and the previous two communications 15, 18 enables us to
formulate an ideal or perfect environment, or what may be better termed a
more suitable environment for optimal assimilation of the radish plant in these regions.
To depict the inter-relationship of external factors and the rate of !Jhoto -
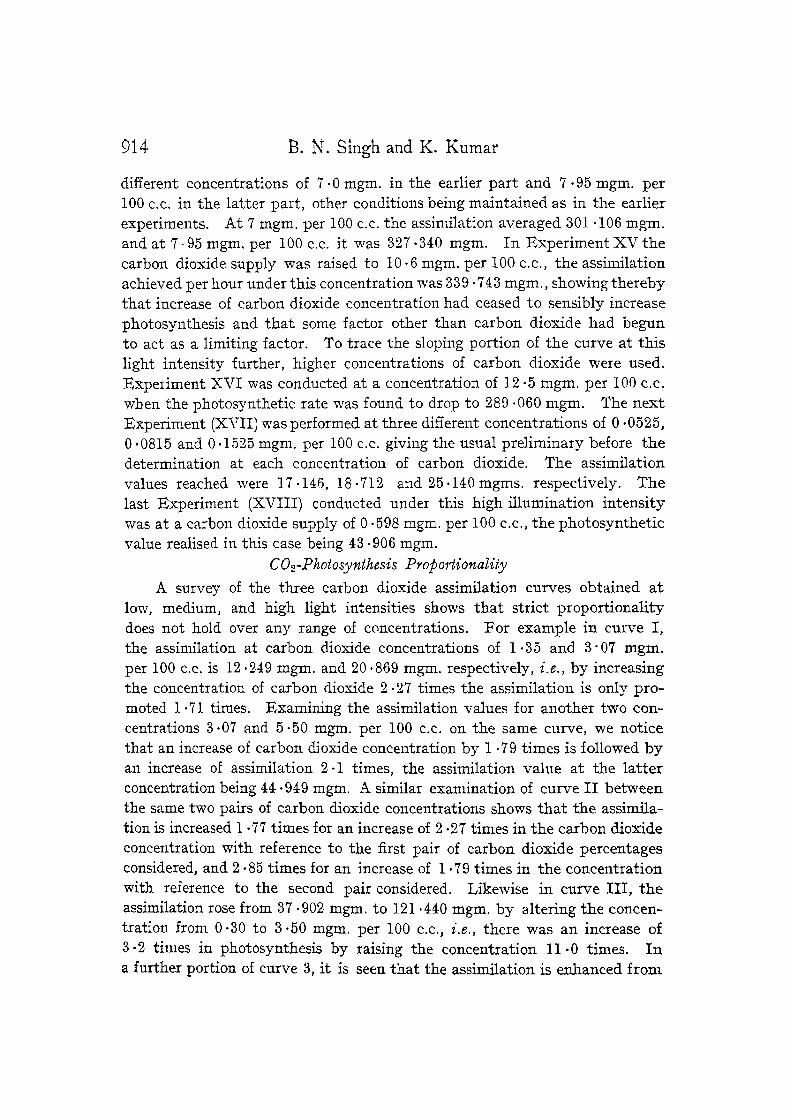
synthesis of radish leaves when one or more factors are limiting, Fig. 3 has been constructed more or less after the manner of Blackman and Smith. 2 The three separate curves are derived from certain data embodied in this paper and the previous two papers. ~, 18. Care has been taken to select those

I~zlZuence of Parlia/ Press:ire o f C02 on Photosynthetic &~.~Tciency 921
45
40'
3O
~ 25
�9 ~ 20
~ 15 "N,
10
/
I r/ t
/ /
/ /
/ I
I ,; I
0-1 0.2 0.3 0-40 .5 0.6 20 30 10 20 30 40 50 60 70 COo Concentratfon. Temp. in dejrees C. Light ~ntensity in 1,000 M.C.
F I e . 3. S h o w i n g i n t e r a c t i o n of e x t e r n a l f ac to r s .
sets of values for drawing the CO~-assimflation curves of this figure which cover almost the same range of assimilation intensity, but this has not been possible in the case of the temperature-assimilation curve, since all the C02- assimilation and light-assimilation data have been obtained at 29~ and the temperature-assimilation curve does not e_xhibit a linear course much beyond that being limited by the supply of carbon dioxide or light.
From Fig. 3 it is possible to predict the value of assimilation obtained under any combination of the three factors within the range treated. The values of assimilation corresponding to the intensities of the three factors have to be noted and the lowest of these three values represents to the nearest approximation the value of assimilation likely to be attained in tha t combination.
Radish is a rainy season or winter crop in these regions of the country, the sowings being made at intervals of about a fortnight. The crops which appear in August, September, or the following October generally do not experience a lack of adequate temperature in the atmosphere for their photo- synthetic work, the temperature seldom falling below 26~ at this time and

922 B. N. S ingh and K. K u m a r
for the major i ty of this period avera~ng 29~ The same, however, cannot be said of the latter par t of November, December and Janua ry when the atmospheric temperature generally obtaining is in the vicini ty of 21.5~ The conclusion reached by us previously ~ tells us tha t a temperature of 29~ is calculated to give the maximum sustained assimilation by this plant in the winter months at pressures of carbon dioxide lying between the atmospheric and about three times atmospheric, and possibly also at higher pressures of carbon dioxide.
The average illumination available in these regions, 25 ~ N. lati tude, during the winter months on a horizontal surface with a cloudless sky is 86,250 M.C. The data obtained in the preceding communications indicate tha t ,~ minimum light intensity of 68,760 M.C. is required for the maximum assimilation at 29~ under a carbon dioxide supply of 0.057 mgm. per 100 c.c. of air and a minimum light intensi ty of 72,197 ~ C . for the maximum assimilation at 29~ under a part ial pressure of carbon dioxide about ten times higher, viz., 0.52 mgm. per 100 c.c. of air. Thus light is never limiting in nature except in the early mornings. But during the rainy season (Tuly, August and September), when the average intensity of illumination at the eastern end of the Indo-Gangetic plain seldom exceeds 63,692 M.C. and when during actual heavy downpours it may fall to 5,800 M.C. light is often limiting.
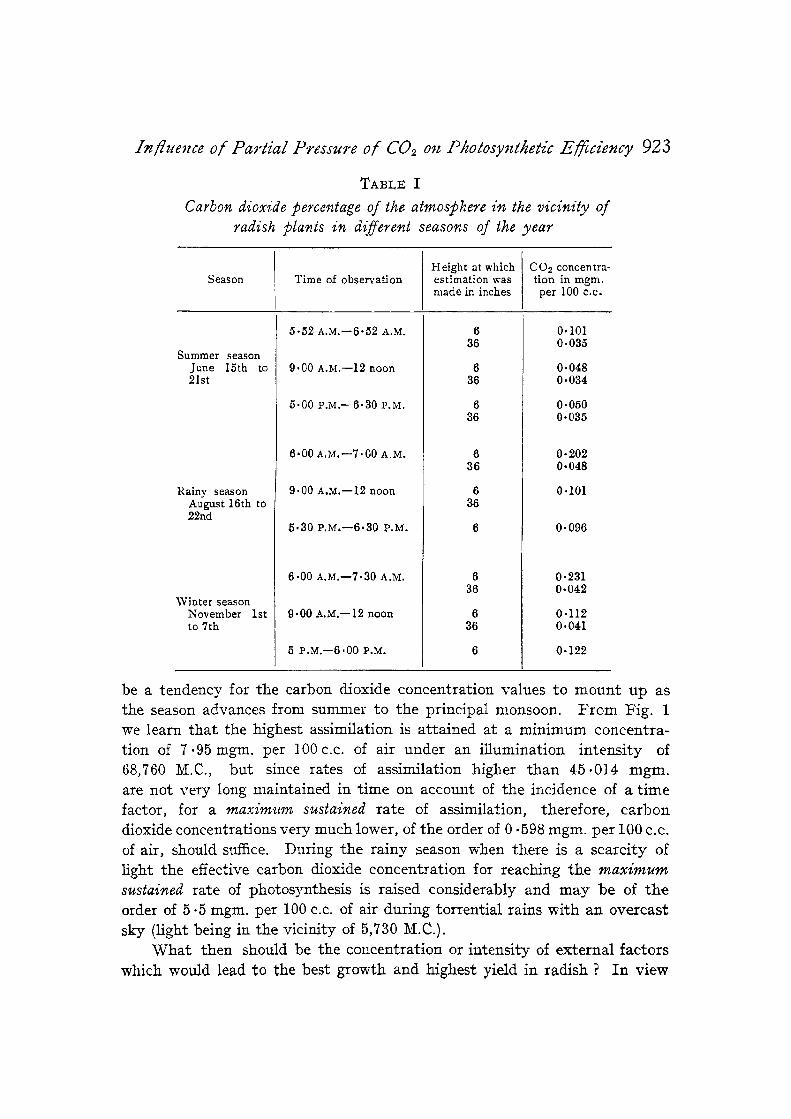
The carbon dioxide concentration in nature is usually identified wi th 0.03 volume per cent. But its instability at precisely tha t value is a common- place, especially in cultivated fields or near vegetation of any kind. Thus for a proper estimation of its influence on the photosynthetic act ivi ty of a crop in the field, actual measurements of the CO.2 factor and its variat ions in a particular habitat are essential and the usually assumed figure of 0.03 volume per cent. cannot be accepted as the basis of any accurate calctdation. I t was therefore deemed necessary to make such measurements of the carbon dioxide concentration at different times of the year in the field and from at least two different heights of the aerial portion of the radish plant, one near the upper leaves and another near the lower leaves of the plant. This has been achieved by aspirating the air in the vicinity of the radish plants at a fixed speed through baryta solution and calculating the percentage of carbon dioxide in the air stream on the basis of the CO2 absorbed by the solution. In Table I are presented a series of average daily values of carbon dioxide based upon seven days' records.
The fluctuations in the carbon dioxide content of the atmosphere a t the level of the radish plant range between 0.048 mgm. and 0.231 mgm. per 100 c.c. of air, and as a reference to Table I will show there appears to
Imfuence o f Partial Pressure o f CO.,_ on Photosynlhetir Efficiency 923
T A B L E I
Carbon dioxide percentage of the atmoslOhere in the vicinity of radish JJlants in d(fferent seasons of the year
Season Time of observation Height at which estimation was made in inches
CO2 concentra- tion in mgm.
per 100 c.c.
Summer season June 15th to 21st
Rainy season August 16th to 22rid
Winter season November 1st to 7th
5.52 A.M.--6.52 A.M.
9.00 A.M.--12 noon
5.00 P.M.--6.30 P.M.
6.00 A,M.--7.00 A.M.
9.00 A.M.--12 noon
5.30 P.M.--6.30 P.M.
6.00 A.M.--7.30 A.M.
9.00 A.M.--12 noon
5 P.M.--6 '00 P.M.
6 36
6 36
6 36
6 36
6 36
6 36
6 36
O.101 0- 035
0.048 0.034
0-050 0.035
0.202 0-048
0.101
0.096
O" 231 0 �9 042
0 .I12 0.041
0-122
be a tendency for the carbon dioxide concentration values to mount up as
the season advances from summer to the principal monsoon. From Fig. 1
we learn tha t the highest assimilation is a t ta ined at a minimum concentra- tion of 7.95 mgm. per ]00c.c. of air under an illumination intensity of
68,760 M.C., but since rates of assimilation higher than 45.014 mgm.
are not very long maintained in time on account of the incidence of a time
factor, for a maximum sustained rate of assimilation, therefore, carbon dioxide concentrations very much lower, of the order of 0.598 mgm. per I00 e.c. of air, should suffice. During the rainy season when there is a scarci ty of light the effective carbon dioxide concentration for reaching the maximum sustained rate of photosynthesis is raised considerably and may be of the order of 5.5 mgm. per 100 c.c. of air during torrential rains wi th an overcast sky (light being in the vicinity of 5,730 M.C.).
What then should be the concentration or intensity of external factors
which would lead to the best growth and highest yield in radish ? In view
924 B. N. Singh and K. Kumar
of the fact that whatever addition of material takes place in the plant is mainly due to photosynthetic intake of carbon dioxide by the leaves, the concentrations of external variables indicating a maximum sustained rate of assimilation should in all probability give an idea of the optimal condi- tions of the environment when we may expect to secure the maximal possi- bilities of growth and yield. In the light of the experimental findings such a condition in radish is not far from being realised. A light intensity of 68,760 M.C., supplied to the growing radish plants at a tempera- ture of 29 ~ C. and approximately 0-6 mgm. per 100 c.c. of carbon dioxide concentration would induce a fairly high sustained rate of assimilation as the experimental evidences indicate.
This idea of the concentration of external factors which should result in accelerated photosynthetic activity and in fact increased growth and yield of plant is specially important from the point of view of green-house culture of vegetables, flowers and fruits, where the control of factors like light, carbon dioxide and temperature, is absolutely necessary for the pro- duction of fruits, flowers, and vegetables in and out of season. At all such experimental stations, the range of anatomical and physiological adapta- tions of the plant in question should be studied with special reference to the factors of light, carbon dioxide and temperature and an idea of optimal factor intensity obtained. I t may be mentioned here tha t considerable difiiculties may be encountered in conducting such a type of work in different regions, with the same or a variety of plants, and sometimes diverse results may be the outcome of such experimentation. This is t rue since the requirement of plants depends upon the specificity of the material as well as the intensity of environic complex and as such it is commonly observed that in tropics and sub-tropics where the intensities of solar radia- tion and temperature are suthciently high as compared to the temperate zones the plants are adapted to higher intensities of temperature and solar radiation in contrast to those of the temperate zones where the time-factor is soon noticed under much lower range of these factors. Our results on the optimaI light and temperature range of radish are in accord with the view above referred to and show well-marked contrast with plants of temperate zones (cf. lXiatthei and others). Besides such inter-zonal differences which are no doubt common, it has been observed also in a separate investigation 17 that the range to which plants are adapted differs with the season in which they grow. Thus winter crops have lower optimal temperature range than summer ones due of course to the adaptability of the material to the environic condition in which growth takes place. Thus the optimal range of factor intensity differs with not only the stresses of the environment bu t
~r~]quence of Partial Pressure of CO.,_ on P/io[osynt~elic P.'~ciency 925
also the specific adaptability of the material towards the conditions in which it used to propagate previously.
Such facts when taken in conjunction with the facultative or obli- gate nature of the organism, as also the specific morphological, anatomical and physiological adaptations of the material may help a good deal in solving the final goal, namely, the formulatioi1 of an ideal environment for the best growth and yield of plants growing nnder diverse ecological levels of the atmosphere. Such a work with the many cultivable forms of plant species growing under the manifold status of the environment conducted in different parts of the world may not only lead to the realisation of the economic aspect of agriculture but also help a good deal in solving some of the weli-marked differences in the specific adaptability range of the plant species to different concentrations of external factors under the diverse climatic zones of the globe.
Summary and Conclusions. In this paper the relation between the concentration of carbon dioxide
and the rate of photosynthesis by radish leaves has been investigated with a view to throw light on the nature of the relationship and to trace the pro- portionality, if any, between the supply of carbon dioxide and the rate at which this may be taken up by the leaves.
The rate of photosynthesis under varying percentages of carbon dioxide has been studied under three distinct intensities of light both above and below the intensity of solar radiation to which the radish plants are subject in nature. The temperature is naaintained at such optimal values when time-factor does not seem to have any marked influence on the rate of assimilation.
With increase in C02 concentration the rate of photosynthesis rises till a certain range of factor intensity after which the curves representing this relationship show a stationary level phase to be sooner or later followed by a decline.
With increase in light intensity the eur~.-es show a steep rising phase exhibiting a characteristically different contour from those obtained under low light intensity. The range at which toxicity of CO2 is evinced also increases with increase in illumination.
The leaf subjected to very high concentrations of carbon dioxide no doubt undergoes toxication but this toxicity is capable of being reduced if the concentration of carbon dioxide in the surroundings is lowered. Radish leaves seem to offer a small resistance to the toxic action of high concentra- tions of carbon dioxide and hence the declining phase of assimilation is obtained at sufficiently low percentages of the gas.
926 B . N . S i n g h and K. Kumar
A strict proportionality between the CO2 concentration and photo- synthetic rate is outside the range of experimental observation. The rela- tionship seems to be more direct between carbon dioxide concentration and apparent assimilation than between real assimilation and the percentage of CO2. The direct proportionali ty if any holds true more under low con- centrations of sufficiently short range of the order of 0-04-0.15 mgm. carbon dioxide per 100 c.c.
The curves depicting the CO2-photosynthesis relationship are neither in conformity with the typical limiting factor curves of Blackman with a sharp angle at the point of change of limiting factor nor do they follow the smooth-rounded contour of Harder or Boysen Jensen curves, but appear to take an intermediate position in this respect.
The light and temperature-assimilation curves are reminiscent of the fact tha t the rate of photosynthesis is capable of augmentation consequent on an increase in any of the conditioning factors present below the limiting value. Assimilation thus does not seem to be rigidly governed by Blackman's law of limiting factors or t tarder 's conception of relative minimum.
From practical viewpoint, an ideal environment for best growth and yield of radish plant has been formulated. Such ideal conditions for optimal g r o ~ h have been suggested on the basis of the concentration of external variables when the radish leaves are in a position to carry on the nmxirnum sustained rate of photosynthesis for a sufficiently 10rig time. Light has also been thrown on the adaptabili ty range of plant to the environmental com- plex in which they grow.
LITERATURE CITED.
1. Blackman, F. F . . .
2. Blackman, F. F., and Smith, A. Iv[.
3. Bose, J. C . . . . .
4. Boyserl Jensen . . . .
S. Brown, I-I. T., and Escombe, F.
6. Chapin, P . . . . .
7. Chapman, R. E., Cook, W. R. I., and Thompson, (Miss) N. L.
"Optima and limiting factors," ATm. Bot., 1905, 19.
"Experimental Researchcs on veg'etable assimilation and respiration. IX. On assimilation in submerged water plants, and its relation to the concentration of carbon dioxide and other factors," Proc. Roy. Soc., B, 1911, 83.
The physiology o] photosynthesis, Longmans, Green & Cc., London, 1924.
"Studies on the production of matter in light and shadow plants," Bot. Tidssk., 1918, 35, 219-262.
"The influence of varying amounts of carbon-dioxlde in the air on the photosynthetic process of leaves and on the mode of growth of plants," Proc. Roy. Soc., B, 70, 1902.
"Einfluss der Kohleusaure auf das Wachstmn," Flora, 91, Erganzungsband, 1902, 348-379.
"The effect of carbon dioxide on the tropic reactions of Helianthus stems," New Phyt, 1924, 23, $0-62.
I~z/fuence o/Parlial Pressure of CO., o;z Pkotosy~zffzetic iFfficiency 927
8. Darwin, F. ..
9. Inamdar, R. S., and Kumar, K.
10. James, W . O . ..
11. Harder, R. ..
12. Linsbauer, K. ..
13. Lundeg~rdh, H. ..
14. Maskell, E . J . ..
15. Singh, B. N., and Kumar, K.
I6. Singh, B. N., and Kumar, K.
17. Singh, B. N., and Lal, K. N.
18. Warburg, O . . . . .
.. "Observations on Stomata," Phil. Trans. Roy. Soc., London, B, 1898, 190, 531-621.
"The absorption of carbon dioxide by potash solutions with reference to the relation of assimilation to carbon dioxide concentration," Proc. Thirteenth Ind. Sci. Co~zg., 1926.
.. "Experimental researches on vegetable assimilation and respiration. IX. The effect of variations of carbon dioxide supply upon tile rate of assimilation of submerged water plants," Proc. Roy. Sot., B, 1928, 103.
.. "Kritische Versuche zu Blackman's Theorie der 'begrenzen- den Faktoren' bei der Kohlensaure assimilation," Jahrb. J. wiss. Bot., 1921, 60, 531-571.
. . "Beitrage zur Kenntnis der Spaltoffnungsbewegungen," Flora, 1916, 109 (N.R. 9), 100-143.
.. t~nvironment and PIa~t Development, Edward Arnold, 1931.
.. "Experimental researches on vegetable assimilation and respiration. X V I I I . The relation between stomatal open- ing and assimilation--A critical study of assimilation rates and porometer rates in leaves of Cherry laurel," Proc. Roy. Soc., B, 1928, 102.
"Photosynthetic behaviour of leaves to variations in tempera- ture," Proc. Ind. Acad. Sci., 1935, 1, No. 11.
"The reactions of the assimilatory system in radish to altera- tions of light intensity," Proc. IJzd. Acad. 5"ci., 1935, 1, No. 11.
"Limitations of Blackman's Law of Limiting :Factors and Harriet 's Concept of Relative Minimum as applied to Photosynthesis," Plant Physiol., 1935, 10, 2.
"Uber die Geschwindigkeit der photochemlschen Kohlen- saurezerstzung in Lebende~ zelle;~ I.," Bioche;n. Zeitschr., 1919, 100, 230-270.
Copyright © 2022 FDOKUMEN