The influence of coarse aggregate size and volume on the fracture behavior and brittleness of...
16
The influence of coarse aggregate size and volume on the fracture behavior and brittleness of self-compacting concrete Morteza H.A. Beygi a,1 , Mohammad Taghi Kazemi b,2 , Iman M. Nikbin c, ⁎, Javad Vaseghi Amiri a,1 , Saeed Rabbanifar a,1 , Ebrahim Rahmani a,1 a Department of Civil Engineering, Babol University of Technology, Iran b Department of Civil Engineering, Sharif University of Technology, P.O. Box 11155-9313, Iran c Faculty of Civil Engineering, Islamic Azad University, Rasht Branch, Rasht, Iran abstract article info Article history: Received 7 September 2013 Accepted 19 June 2014 Available online xxxx Keywords: Fracture toughness Microstructure Aggregate This paper presents the results of an experimental investigation on fracture characteristics and brittleness of self- compacting concrete (SCC), involving the tests of 185 three point bending beams with different coarse aggregate size and content. Generally, the parameters were analyzed by the work of fracture method (WFM) and the size effect method (SEM). The results showed that with increase of size and content of coarse aggregate, (a) the frac- ture energy increases which is due to the change in fractal dimensions, (b) behavior of SCC beams approaches strength criterion, (c) characteristic length, which is deemed as an index of brittleness, increases linearly. It was found with decrease of w/c ratio that fracture energy increases which may be explained by the improvement in structure of aggregate-paste transition zone. Also, the results showed that there is a correlation between the fracture energy measured by WFM (G F ) and the value measured through SEM (G f ) (G F = 3.11G f ). © 2014 Elsevier Ltd. All rights reserved. 1. Introduction During the recent decades, self-compacting concrete (SCC) has un- dergone extraordinary development worldwide. SCC shows notable benefits in terms of both working environment and technology, such as elimination of serious troubles associated with the vibration and cast- ing process including inadequate or excessive compaction [1]. SCC has high workability and simultaneously prevents bleeding and segregation during casting. Obviously, it has environmental, technical and econom- ical benefits over normal vibrated concrete (NVC) such as accelerating the construction process, reduction of human force and improved dura- bility [2]. Beside research interests, applications of SCC in building in- dustry have also increased due to revolutionary changes in the concrete technology. There are major concerns among researchers that SCC may have dif- ferent behavior compared to NVC and this is due to use of comparatively higher contents of fine particles in order to avoid segregation in fresh mix [3]. These differences in mix composition can lead to change in the pore structure, mechanical properties and especially fracture response and consequently cracking patterns in SCC compared to NVC. It should be noted that fracture behavior of concrete, as a quasi-brittle material, is an important aspect that should be considered in analysis and design of engineering structures especially large-scale members [4]. In addition, fracture behavior of SCC has direct effect on the durabil- ity of concrete structures which is, nowadays a major concern in the realm of construction. Researchers have reported that reduction of the aggregate content in concrete may decrease the contribution of aggre- gate bridging and interlocking across the crack resulting in the reduc- tion of energy absorption [5,6]. On the other hand, recent research indicated that SCC mixes containing limestone powder, as a mineral ad- ditive, have a large autogenous shrinkage and consequently higher cracking tendency [7]. Nevertheless, a number of studies have reported that use of extra-fine particles such as limestone powder makes the SCC matrix more compact and consequently interface transition zone (ITZ) between aggregate and paste may be improved [8,9]. Improvement of ITZ may cause the concrete to be more brittle. This is due to the fact that although the capacity of the material along the crack path is increased, the path goes through aggregates and reduces the interlock. Studying fracture behavior of SCC, higher strength and quality of ITZ are major factors to be taken into account. On the other hand, the properties of ITZ heavily depend on the properties of the ag- gregates such as size, volume, shape, surface texture and etc. [10]. Giaccio and Zerbino [11] reported that strength, size, shape and surface texture of the aggregate have profound effect on ITZ and influence the cracking degree in the concrete. Torrijos et al. [12] stated that, due to Cement and Concrete Research 66 (2014) 75–90 ⁎ Corresponding author. Tel.: +98 112 5280914. E-mail addresses: [email protected] (M.H.A. Beygi), [email protected] (M.T. Kazemi), [email protected] (I.M. Nikbin), [email protected] (J. Vaseghi Amiri), [email protected] (S. Rabbanifar), [email protected] (E. Rahmani). 1 Tel.: +98 112 5280914. 2 Tel.: +98 21 6616 4237. http://dx.doi.org/10.1016/j.cemconres.2014.06.008 0008-8846/© 2014 Elsevier Ltd. All rights reserved. Contents lists available at ScienceDirect Cement and Concrete Research journal homepage: http://ees.elsevier.com/CEMCON/default.asp
Transcript of The influence of coarse aggregate size and volume on the fracture behavior and brittleness of...

Cement and Concrete Research 66 (2014) 75–90
Contents lists available at ScienceDirect
Cement and Concrete Research
j ourna l homepage: ht tp : / /ees .e lsev ie r .com/CEMCON/defau l t .asp
The influence of coarse aggregate size and volume on the fracturebehavior and brittleness of self-compacting concrete
Morteza H.A. Beygi a,1, Mohammad Taghi Kazemi b,2, Iman M. Nikbin c,⁎, Javad Vaseghi Amiri a,1,Saeed Rabbanifar a,1, Ebrahim Rahmani a,1
a Department of Civil Engineering, Babol University of Technology, Iranb Department of Civil Engineering, Sharif University of Technology, P.O. Box 11155-9313, Iranc Faculty of Civil Engineering, Islamic Azad University, Rasht Branch, Rasht, Iran
⁎ Corresponding author. Tel.: +98 112 5280914.E-mail addresses:[email protected] (M.H.A. Beygi), Ka
[email protected] (I.M. Nikbin), [email protected] (J. [email protected] (S. Rabbanifar), Ebrahim.rah(E. Rahmani).
1 Tel.: +98 112 5280914.2 Tel.: +98 21 6616 4237.
http://dx.doi.org/10.1016/j.cemconres.2014.06.0080008-8846/© 2014 Elsevier Ltd. All rights reserved.
a b s t r a c t
a r t i c l e i n f oArticle history:Received 7 September 2013Accepted 19 June 2014Available online xxxx
Keywords:Fracture toughnessMicrostructureAggregate
This paper presents the results of an experimental investigation on fracture characteristics and brittleness of self-compacting concrete (SCC), involving the tests of 185 three point bending beamswith different coarse aggregatesize and content. Generally, the parameters were analyzed by the work of fracture method (WFM) and the sizeeffect method (SEM). The results showed that with increase of size and content of coarse aggregate, (a) the frac-ture energy increases which is due to the change in fractal dimensions, (b) behavior of SCC beams approachesstrength criterion, (c) characteristic length, which is deemed as an index of brittleness, increases linearly. Itwas foundwith decrease ofw/c ratio that fracture energy increaseswhichmay be explained by the improvementin structure of aggregate-paste transition zone. Also, the results showed that there is a correlation between thefracture energy measured by WFM (GF) and the value measured through SEM (Gf) (GF = 3.11Gf).
© 2014 Elsevier Ltd. All rights reserved.
1. Introduction
During the recent decades, self-compacting concrete (SCC) has un-dergone extraordinary development worldwide. SCC shows notablebenefits in terms of both working environment and technology, suchas elimination of serious troubles associatedwith the vibration and cast-ing process including inadequate or excessive compaction [1]. SCC hashighworkability and simultaneously prevents bleeding and segregationduring casting. Obviously, it has environmental, technical and econom-ical benefits over normal vibrated concrete (NVC) such as acceleratingthe construction process, reduction of human force and improved dura-bility [2]. Beside research interests, applications of SCC in building in-dustry have also increased due to revolutionary changes in theconcrete technology.
There are major concerns among researchers that SCCmay have dif-ferent behavior compared toNVC and this is due to use of comparativelyhigher contents of fine particles in order to avoid segregation in freshmix [3]. These differences in mix composition can lead to change inthe pore structure, mechanical properties and especially fracture
[email protected] (M.T. Kazemi),seghi Amiri),[email protected]
response and consequently cracking patterns in SCC compared to NVC.It should be noted that fracture behavior of concrete, as a quasi-brittlematerial, is an important aspect that should be considered in analysisand design of engineering structures especially large-scale members[4]. In addition, fracture behavior of SCC has direct effect on the durabil-ity of concrete structures which is, nowadays a major concern in therealm of construction. Researchers have reported that reduction of theaggregate content in concrete may decrease the contribution of aggre-gate bridging and interlocking across the crack resulting in the reduc-tion of energy absorption [5,6]. On the other hand, recent researchindicated that SCCmixes containing limestone powder, as amineral ad-ditive, have a large autogenous shrinkage and consequently highercracking tendency [7]. Nevertheless, a number of studies have reportedthat use of extra-fine particles such as limestone powdermakes the SCCmatrix more compact and consequently interface transition zone (ITZ)between aggregate and paste may be improved [8,9].
Improvement of ITZ may cause the concrete to be more brittle. Thisis due to the fact that although the capacity of the material along thecrack path is increased, the path goes through aggregates and reducesthe interlock. Studying fracture behavior of SCC, higher strength andquality of ITZ are major factors to be taken into account. On the otherhand, the properties of ITZ heavily depend on the properties of the ag-gregates such as size, volume, shape, surface texture and etc. [10].Giaccio and Zerbino [11] reported that strength, size, shape and surfacetexture of the aggregate have profound effect on ITZ and influence thecracking degree in the concrete. Torrijos et al. [12] stated that, due to

Table 1Compositions and fresh properties of the series I mixtures.
Materials Weight(kg/m3)
GH9 GH12 GH19 GM9 GM12 GM19
Cement (C) 422.4 422.4 422.4 352.8 352.8 352.8Sand 917 917 917 917 917 917Coarse aggregate 4.75–9.5 mm 750 300 300 750 300 300
9.5–12.5 mm – 450 300 – 450 30012.5–19 mm – – 150 – – 150
Limestone powder 205 205 205 205 205 205Free water (W) 160.7 160.7 160.7 187 187 187Superplasticizer 9 9 9 4.4 4.4 4.4Vol. of paste (Lit) 380 380 380 380 380 380w/c (by weight) 0.38 0.38 0.38 0.53 0.53 0.53w/p (by weight) 0.256 0.256 0.256 0.335 0.335 0.335w/p (by volume) 0.76 0.76 0.76 0.99 0.99 0.99Unit weight (kg/m3) 2399 2448 2462 2318 2408 2428Slump flow (mm) 730 755 715 680 670 725Flow time (sec) 8.1 4.3 7.9 3.3 2.5 2.3Sieve test (%) 5.6 7 9.8 2 4 9L-Box (h2/h1) 0.93 0.88 0.82 0.91 0.89 0.83
76 M.H.A. Beygi et al. / Cement and Concrete Research 66 (2014) 75–90
different ITZ, coarser aggregate arrest the crack growth, producingmeandering and branching of cracks. Shah and Chandra [13] indicatedthat strength reduction of ITZ increases fracture energy (GF) significant-
Table 2Compositions and fresh properties of the series II mixtures.
Materials Weight (kg/m3)
G30
Cement (C) 373.9Sand 1167Coarse aggregate 500Limestone powder 205Free water (W) 179.3Superplasticizer 5Vol. of paste (Lit) 380w/c (by weight) 0.48w/p (by weight) 0.3w/p (by volume) 0.91Unit weight (kg/m3) 2406Slump flow (mm) 675Flow time (sec) 4.9Sieve test (%) 2.7L-Box (h2/h1) 0.91
Fig. 1. Geometry of the 3-point
ly. Also the stress concentration in the ITZ aswell as early age cracking isdue to differences of drying shrinkage and stiffness between aggregateand the paste [10,14]. Akcaoglu et al. [10] concluded with increase
G40 G50 G60
373.9 373.9 373.91000 834 667667 833 1000205 205 205179.3 179.3 179.35.5 6.1 7.4380 380 3800.48 0.48 0.480.3 0.3 0.30.91 0.91 0.912438 2445 2450660 695 7003.4 4.9 2.57.9 15.8 11.50.92 0.85 0.82
bending specimens used.

Fig. 2. Specimens of four different sizes, left a0 = 0.4d and right a0 = 0.2d.
77M.H.A. Beygi et al. / Cement and Concrete Research 66 (2014) 75–90
of maximum aggregate size (dmax), ITZ becomes critical. Giaccioet al. [15] concluded that size and type of coarse aggregate has strongereffect on fracture behavior of concrete than other additives such asrice husk ash do. Several studies have been carried out by manyauthors on fracture behavior of NVC considering various mixture pa-rameters such as water to cement ratio, maximum aggregate size andetc. [16,17].
Since aggregates almost always constitute about 60–70% of the vol-ume of concrete, they have clearly governing effect on the properties offresh and hardened concrete [18]. Hillerborg [17] analyzed the effect ofdmax on GF and indicated that GF tends to increase while dmax increases.The same trend was reported by Mihashi et al. [19], Walsh [20], Bazantand Oh [21], Zhao et al. [22] and Trunk and wittmann [23]. They intro-duced a power function between GF and dmax. Issa et al. [6] observedthat GF increases monotonically with increase of dmax. Zhou et al. [24]conducted systematic testing of the effect of various values of dmax onthe fracture properties of high strength concrete. They reported thatGF increases with increase of dmax. However, some researchers have re-ported the opposite trend. Bar et al. [25] and Wolinski et al. [26] con-cluded that there is no monotonic effect of dmax on fracture toughnessvalues. Petersson [16] reported that the GF does not depend on dmax.However the characteristic length, Lch, increases with increasing dmax.Moseley et al. [27] indicated that, as the aggregate size increases, NVCshowsmore ductile behavior. Yan et al. [28] reported that the fractal di-mension of NVC greatly improves with increasing dmax. Gopalaratnamand Shah [29] and Akcay et al. [30] indicated that the aggregate volumeaffects the fracture mechanics parameters of NVC. Feng et al. [31] con-cluded that GF increases monotonically with increasing the volume ofcoarse aggregates. Chen and Liu [32] found that volume and size ofcoarse aggregate affected the FPZ of NVC. Amparano et al. [18] statedthat the size of FPZ decreases when volume of aggregate is increased.
These experimental studies proved that, for NVC, there is a relation-ship between coarse aggregate size and volume with fracture parame-ters. Since few investigations have been carried out on fracture
Fig. 3. Specimens of four different sizes (for dmax = 19 mm).
behavior of SCC, applying all assumptions and relations that are validfor NVC might be somehow risky for SCC.
This paper describes an experimental investigation on the influenceof coarse aggregate size and volume on fracture parameters of SCC. Inthis study, the fracture parameters are examined using two differentmethods, namelywork of fracturemethod (WFM) and, size effectmeth-od (SEM). The tests have been carried out on 185 notched beams in aservo controlled testing system subjected to 3-point bending accordingto RILEM recommendations [33,34].
2. Determination of fracture parameters
2.1. Work of fracture method (WFM)
Differentmethods have been proposed by international standards inorder to determine the fracture parameters of SCC. The simplestmethodto determine the fracture energy, as themost important fracture param-eter of concrete, is work of fracture method (WFM) introduced byRILEM 50-FMC [33]. In this method, conducting 3-point bending teston notched beams the fracture energy is obtained as:
GF ¼WF
b d−a0ð Þ ð1Þ
whereWF is the total energy in the test when the beam is halvedwhichis equal to the area under load–displacement curve, b is the beamwidth,d is the beam height and a0 is the notch depth.
Although simple, this method has the drawback of being dependenton specimen size. This has been reported by many researchers and hasbeen further explained in Bazant and Planas's book [4]. Extensive re-search has been conducted by researchers into the reasons of the frac-ture energy's dependency on the specimen size and the major reasonhas been attributed to the specimenweight [35]. One approach to elim-inate this defect during the test is the one proposed by Elices et al. [35]in which weight compensation method. This method has been intro-duced in RILEM TC 187-SOC [36] and also used in the present research.
Hillerborg et al. [37] also stated that the fracture energy obtainedfrom WFM alone cannot be used to describe brittleness and ductilityofmaterials. Therefore, they introduced the characteristic length, Lch, as:
Lch ¼ EGF= f2t ð2Þ
where E is the modulus of elasticity, ft is the tensile strength and GF isthe fracture energy.
The more Lch, the more ductile the concrete and the higher strengthagainst cracking and vice versa.
2.2. Size effect method (SEM)
Since results obtained fromWFM are highly scattered, more con-venient alternative methods, whose results are not size-dependent,have been developed [38]. One of the most useful methods is thesize-effect method. This method, which has been included in RILEM

Table 3Dimensions of beam specimens in SEM.
Aggregate size(mm)
d (mm) b (mm) a0/d S/d L/d
9.5 28.5 28.5 0.2 2.5 2.6757.1114.3228.6
12.5 38.1 38.1 0.2 2.5 2.6776.2152.4304.8
19 57.1 57.1 0.2 2.5 2.67114.3228.6457.2
78 M.H.A. Beygi et al. / Cement and Concrete Research 66 (2014) 75–90
TC-89 [34], is known as SEM. In this method, major fracture parame-ters are determined using 3-point bending test on geometricallysimilar notched beams with varying sizes. Based on this method,nominal strength of geometrically similar concrete specimen canbe described by size-effect law as:
σN ¼ Bffiffiffiffiffiffiffiffiffiffiffiffi1þ β
p β ¼ dd0
ð3Þ
where β is the brittleness number introduced by Bazant and Kazemi[39], B and d0 are empirical coefficients that are related to materialproperties and structure geometry and σN is the nominal strengthof structures that are similar in two dimensions.
In SEM, using linear regression of the peak loads of geometricallysimilar specimens of varying sizes, and according to Eq. (3), the coeffi-cients B and d0 can be determined as:
Y ¼ AXþ C ð4Þ
in which:
X ¼ d ; Y ¼ 1=σNð Þ2; d0 ¼ C=A; B ¼ 1=ffiffiffiC
p:
Based on the concept of LEFM, the two major fracture parameters,fracture energy (Gf) and effective length of process zone (Cf) can be de-termined through:
Gf ¼g α0ð ÞAE
ð5Þ
Cf ¼g α0ð Þg0 α0ð Þ �
CA
ð6Þ
Fig. 4. Test setup. Specimen with d = 304.8
where E is the modulus of elasticity of concrete, A is the angularcoefficient of regression line, C is the y-intercept of the regressionline, g(α0) is the non-dimensional energy release rate and g′(α0) isthe derivative of g(α0) with respect to the relative initial crack length(α0 = a0/d).
These functions (g(α0) and g′(α0)) depend in the geometry and areobtained according to LEFM [39]. In SEM, other fracture parameters in-cluding fracture toughness (KIC) and the effective crack tip opening dis-placement at the peak load (δc) can also be determined as:
KIC ¼ffiffiffiffiffiffiffiffiffiEGf
pð7Þ
δc ¼8KIC
E�
ffiffiffiffiffifficf2π
r: ð8Þ
3. Experimental program
3.1. Mixture design
To investigate the relationship between fracture parameters of SCCand themaximumsize and volume of coarse aggregate, two series of ex-perimental programs were designed consisting 10 concrete mixes. Se-ries I was considered to examine the effect of maximum aggregatesize on the fracture characteristics of SCC containing varying maximumaggregate sizes, for two different strength levels, medium strength (M-series) and high strength (H-series). For each strength level, three max-imum aggregate sizes of 9.5, 12.7 and 19 mmwere considered. The mixproportions of the series I consisting six mixes are listed in Table 1. Inthis study, also series II was considered to evaluate the effect of thecoarse aggregate volume on the fracture parameters of SCC. Four differ-ent volumes of coarse aggregate, 30%, 40%, 50% and 60%, were used asthe percentage of the total aggregate volume. Thus, in this series, w/cratio and maximum coarse aggregate size were kept constant at 0.5and 12.7 mm respectively for all the mixes. Detailed mix proportionsof series II are given in Table 2.
3.2. Materials
Type II Portland cement, produced by Mazandaran cement factory(Neka, Iran), was used to prepare the concrete. The ultra-fine limestonepowder, provided by Negin factory of Neka, Iran, with a specific gravityof 2.66, was used as a mineral viscosity enhancing admixture. Thesuperplastisizer (SP), used in this study was Glenium 110 from BASFCompany. The fine aggregate used was natural sand whose finenessmoduluswas 2.85. The coarse aggregatewas the natural crashed gravelswith maximum size of 9.5, 12.7 and 19 mm. All the coarse aggregateswere provided from one source. As mentioned above, since series II
mm (left) and d = 152.4 mm (right).

Table 4Value of GF measured from beam tested in series I mixtures.
Mix ID fc (MPa) E(GPa)
ft (MPa) GF (N/m) Average GF
(N/m)Coefficient of variation (%) lch
(mm)Beam 1 Beam 2 Beam 3
GM9 38.2 28.1 3.38 117.3 110.0 94.6 107.3 10.8 263.9GM12 44.9 31.0 3.27 119.2 121.9 115.1 118.7 2.8 344.4GM19 48.0 32.3 3.16 135.8 140.7 156.3 144.2 7.4 466.4GH9 75.9 38.6 4.59 106.0 116.0 120.8 114.2 6.6 209.2GH12 76.9 39.5 4.43 135.0 126.0 123.0 128.0 4.9 257.6GH19 80.0 40.0 3.93 166.8 136.5 153.5 152.2 9.9 394.7
79M.H.A. Beygi et al. / Cement and Concrete Research 66 (2014) 75–90
concentrated only on the effect of coarse aggregate volume, the maxi-mum size of coarse aggregate used was selected to be constant(12.7 mm) for all mixes in this series. In order to evaluate the freshproperties of SCC such as flowability, passing ability and segregation re-sistance, according to EFNARC recommendation [40], slump flow, L-Boxand sieve segregation tests were considered respectively. The freshproperties of the SCC mixes in the series I and II are tabulated inTables 1 and 2 respectively.
3.3. Test specimen preparation and test procedure
The experimental tests were conducted to determine the relation-ship between maximum coarse aggregate size and volume and fractureparameters of SCC. The tests were carried out on notched specimenssubject to 3-point bending. In order to evaluate fracture parametersbased on WFM, for each mix design three notched beams with thesame dimensions of 100 × 100 × 840 mm3 (depth × width × length)with span of 800 mm were cast according to RILEM 50-FMC [33] andconsidering the maximum aggregate size (9.5 mm and 12.7 mm). Alsofor maximum aggregate size of 19 mm, for each mix, three separatenotched beams with dimensions of 200 × 100 × 1190 mm3 with aspan equal to 1130 mm were prepared. For all beams, the verticalnotch (pre-crack) was created in the middle of the length with anotch to depth ratio of 0.5 using a 3 mm thick acrylic plate during theconcrete casting. It should be said that since series II concentrates onthe effect of aggregate volume, themaximumaggregate size is kept con-stant at 12.7 mm. Accordingly, three beams of the same dimension of100 × 100 × 840 mm3 and notch depth of 50 mm were made for eachmix in this series. In order to evaluate fracture parameters in SEM ineach series, considering the maximum aggregate size and RILEM-TC89 recommendation [34], beams of various sizes with geometrical sim-ilarities in two dimensions and samewidth are used. In this experimen-tal study, beamwidths (b), proportion of length to depth (l/d) and spanto depth (s/d) are considered constant (Fig. 1). According to RILEM-TC89 recommendation [34], the proportion of vertical notch depth to
G(N/m
)
120
160
G F(N/m
)
0
40
80
w/c = 0.38
114.2
128
w/c = 0.53
15
10
52.2
7.3
118.7
144.2
dmax= 9.5 mm
dmax= 12.7 mm
dmax= 19 mm
Fig. 5. Variation of the total fracture energy with maximum size of coarse aggregate formixes prepared with different w/c ratios.
depth of each beam in all cases is considered to be 0.2 (a0 = 0.2d). Itshould be noted that in series II, in the tensile face of beams, two groupsof beams with notch depths 0.2d and 0.4d (Fig. 2) were introduced, Forthe first group (a0 = 0.2d), the post peak curve was not complete andhad a sudden jump. Thus, the notch depth was deepened (a0 = 0.4d)and the specimens were named GB30, GB40, GB50 and GB60 whichhad the same mix designs as the first group to achieve complete load–displacement curve. However, even the second group (a0 = 0.4d) didnot result in a complete curvewith a stable trend. Therefore, only the re-sults of peak loads were reported for the second group and SEM wasconsidered in the analysis. Since in series I the aggregate size is varyingand dimensions of the notched beams are function of maximum size ofcoarse aggregate, for each aggregate size used in themix design of seriesI, four beamswith varying sizes are considered (Fig. 3). The geometricalproperties of the test specimens of various sizes are given in Table 3.Since, in series II, the maximum coarse aggregate size is constant andequal to 12.7 mm, only the four sizes presented in Table 3 for aggregatesize of 12.7mmare used in all mix designs in series II. Basically, the testswere displacement-controlled. All notched beams were tested bymeans of a closed loop servo electro controlled testing universal ma-chine with a maximum load capacity of 150 kN and were subjected toload under a constant displacement rate so that the maximum load foreach specimen was achieved in 1 min and 5 min in WFM and SEM re-spectively, based on RILEM recommendations [33,34]. The test setup isshown in Fig. 4. Six standard cylinders 150 × 300 mm3 and three stan-dard cubes 100×100×100mm3were also cast fromeachmix. All spec-imenswere cured underwater at about 20 °C and used to determine thecompressive strength, fc, modulus of elasticity, E, and splitting tensilestrength, ft, according to BS EN 12390 [41], ASTM C469 [42] and ASTMC496 [43] respectively.
4. Analysis of results
4.1. Analysis of fracture parameters from WFM
As it wasmentioned in Section 2, the fracture energy (GF) which, ac-cording to RILEM 50-FMC [33] recommendation, is the energy requiredto create a crackwith unit surface area and is obtained through Eq. (1). Itwas also previously mentioned that although fracture parameters canbe easily determined through the above method, it is not likely to elim-inate all error sources in determination of GF. Thus, scattering in the re-sults of GF is common [4]. Variation of GF with dmax, in NVC, has beenreported by many researchers. El-Sayed et al. [44] proved that for spec-imens of dmax between 10 mm and 20 mm and w/c ratio of 0.48, thefracture energy increases by 41%. Yan et al. [28] stated that, in NVC,when aggregate size increases from10mmto 20mm, the fracture ener-gy increases by 19% and 32% respectively for w/c ratio of 0.26 and 0.44.However, Chen and Liu [32] reported that, in NVCwithw/c ratio of 0.37,increase of aggregate size from 10mm to 20mmmakes fracture energyto increase by 38%. Also, studying NVC with w/c ratios of 0.32 to 0.36,Rao and Prasad [45] demonstrated that increase of dmax from 6.3 mmto 20mmcauses fracture energy to increase by 20% and 45% respective-ly. The same trendhas been reported by Petersson [16] for NVCwithw/cratio of 0.5 in which increase of dmax from 8 mm to 16 mm results in a
50
70
90
110
130
150
170
190
210
0 10 20 30 40
d max (mm)
Test results (M- serie)Test results (H- serie)Petersson [16]Mihashi et al [19]Yan et al. [28]Chen and Liu [32]El - Sayed [44]Rao and Prasad [45]Hilsdorf and Brameshober [47]
Frac
ture
ene
rgy
, GF ,(
N/m
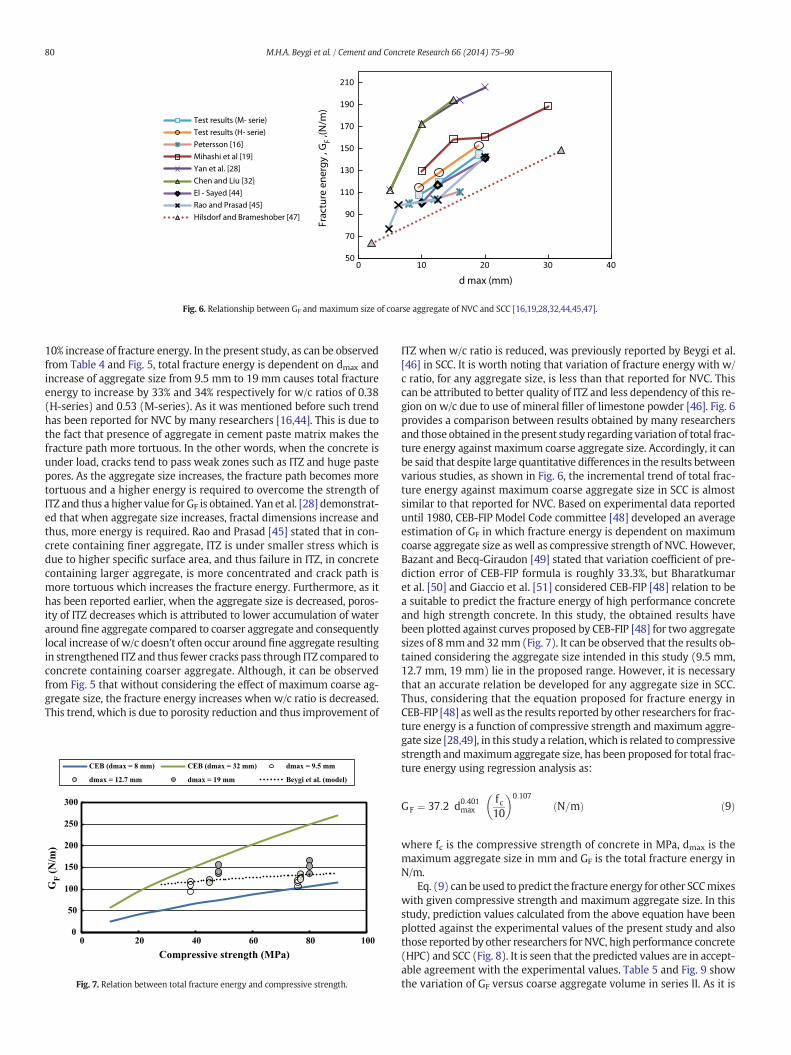
)Fig. 6. Relationship between GF and maximum size of coarse aggregate of NVC and SCC [16,19,28,32,44,45,47].
80 M.H.A. Beygi et al. / Cement and Concrete Research 66 (2014) 75–90
10% increase of fracture energy. In the present study, as can be observedfrom Table 4 and Fig. 5, total fracture energy is dependent on dmax andincrease of aggregate size from 9.5 mm to 19 mm causes total fractureenergy to increase by 33% and 34% respectively for w/c ratios of 0.38(H-series) and 0.53 (M-series). As it was mentioned before such trendhas been reported for NVC by many researchers [16,44]. This is due tothe fact that presence of aggregate in cement paste matrix makes thefracture path more tortuous. In the other words, when the concrete isunder load, cracks tend to pass weak zones such as ITZ and huge pastepores. As the aggregate size increases, the fracture path becomes moretortuous and a higher energy is required to overcome the strength ofITZ and thus a higher value for GF is obtained. Yan et al. [28] demonstrat-ed that when aggregate size increases, fractal dimensions increase andthus, more energy is required. Rao and Prasad [45] stated that in con-crete containing finer aggregate, ITZ is under smaller stress which isdue to higher specific surface area, and thus failure in ITZ, in concretecontaining larger aggregate, is more concentrated and crack path ismore tortuous which increases the fracture energy. Furthermore, as ithas been reported earlier, when the aggregate size is decreased, poros-ity of ITZ decreases which is attributed to lower accumulation of wateraround fine aggregate compared to coarser aggregate and consequentlylocal increase of w/c doesn't often occur around fine aggregate resultingin strengthened ITZ and thus fewer cracks pass through ITZ compared toconcrete containing coarser aggregate. Although, it can be observedfrom Fig. 5 that without considering the effect of maximum coarse ag-gregate size, the fracture energy increases when w/c ratio is decreased.This trend, which is due to porosity reduction and thus improvement of
0
50
100
150
200
250
300
0 20 40 60 80 100Compressive strength (MPa)
CEB (dmax = 8 mm) CEB (dmax = 32 mm) dmax = 9.5 mm
dmax = 12.7 mm dmax = 19 mm Beygi et al. (model)
GF (N
/m)
Fig. 7. Relation between total fracture energy and compressive strength.
ITZ when w/c ratio is reduced, was previously reported by Beygi et al.[46] in SCC. It is worth noting that variation of fracture energy with w/c ratio, for any aggregate size, is less than that reported for NVC. Thiscan be attributed to better quality of ITZ and less dependency of this re-gion on w/c due to use of mineral filler of limestone powder [46]. Fig. 6provides a comparison between results obtained by many researchersand those obtained in the present study regarding variation of total frac-ture energy against maximum coarse aggregate size. Accordingly, it canbe said that despite large quantitative differences in the results betweenvarious studies, as shown in Fig. 6, the incremental trend of total frac-ture energy against maximum coarse aggregate size in SCC is almostsimilar to that reported for NVC. Based on experimental data reporteduntil 1980, CEB-FIP Model Code committee [48] developed an averageestimation of GF in which fracture energy is dependent on maximumcoarse aggregate size as well as compressive strength of NVC. However,Bazant and Becq-Giraudon [49] stated that variation coefficient of pre-diction error of CEB-FIP formula is roughly 33.3%, but Bharatkumaret al. [50] and Giaccio et al. [51] considered CEB-FIP [48] relation to bea suitable to predict the fracture energy of high performance concreteand high strength concrete. In this study, the obtained results havebeen plotted against curves proposed by CEB-FIP [48] for two aggregatesizes of 8mmand 32mm(Fig. 7). It can be observed that the results ob-tained considering the aggregate size intended in this study (9.5 mm,12.7 mm, 19 mm) lie in the proposed range. However, it is necessarythat an accurate relation be developed for any aggregate size in SCC.Thus, considering that the equation proposed for fracture energy inCEB-FIP [48] aswell as the results reported by other researchers for frac-ture energy is a function of compressive strength and maximum aggre-gate size [28,49], in this study a relation,which is related to compressivestrength andmaximum aggregate size, has been proposed for total frac-ture energy using regression analysis as:
GF ¼ 37:2 d0:401max
fc10
� �0:107N=mð Þ ð9Þ
where fc is the compressive strength of concrete in MPa, dmax is themaximum aggregate size in mm and GF is the total fracture energy inN/m.
Eq. (9) can be used to predict the fracture energy for other SCCmixeswith given compressive strength and maximum aggregate size. In thisstudy, prediction values calculated from the above equation have beenplotted against the experimental values of the present study and alsothose reported by other researchers for NVC, high performance concrete(HPC) and SCC (Fig. 8). It is seen that the predicted values are in accept-able agreement with the experimental values. Table 5 and Fig. 9 showthe variation of GF versus coarse aggregate volume in series II. As it is

0
50
100
150
200
250
0 50 100 150 200 250Pr
edic
ted
GF
(N/m
)Experimental GF (N/m)
Test results
Petersson [16]
Wolinski et al. [26]
Yan et al. [28]
El-sayed et al.[44]
Rao and Prasad [45]
Beygi et al.[46]
Hilsdorf and Brameshuber [47]
Bharatkumar et al.[50]
Eskandari et al.[52]
Ensfeld and Velasco[53]
Wittman [54]
Mindess [55]
Petersson [56]
Rossi et al. [57]
Malvar and Warren [58]
Hassanzadeh [59]
Fig. 8. Comparison of the experimental results versus predicted values from the proposed relation for GF in the NVC, HPC and SCC [16,26,28,44,45,46,47,50,52,53,54,55,56,57,58,59].
81M.H.A. Beygi et al. / Cement and Concrete Research 66 (2014) 75–90
observed, the total fracture energy increases from109.7N/m to 128.9 N/m when aggregate volume increases from 30% to 60%. The reason forthis increase is that when coarse aggregate volume increases, more ag-gregate is pulled out of the matrix during fracture process and the frac-ture path becomes more tortuous due to bridging and aggregateinterlocking and thus more energy is required. Also in the mix contain-ing more coarse aggregate, more ITZ is created and therefore it is morelikely that aggregate debonding happens in concrete containing largeraggregate volume. Chen and Liu [32] showed that, in medium andhigh strength NVC, increase of aggregate volume from 40% to 60%causes the fracture energy to increase 16% and 11% respectively whichis in good agreement with the findings of present research. As it wasmentioned earlier, the fracture energy obtained from WFM alone can-not characterize the brittleness of concrete and according to Hillerborget al. [37], the brittleness is assessed through characteristic length, Lch,as well, based on Eq. (2). Petersson [16] reported that in NVC with w/cratio of 0.5, Lch increases from 233.5 mm to 332.2 mm with increasingaggregate size from 8 mm to 16 mm. Zhou et al. [24] also showed thatin NVC with w/c ratio of 0.32, Lch increases from 210 mm to 280 mmwhen aggregate size is increased from 10 mm to 20 mm. Rao an Prasad[45] studiedHPC and concluded that Lch varies from532mmto 649mm
R² = 0.95
100
110
120
130
140
20 30 40 50 60 70
Frac
ture
ene
rgy
, GF,
(N/m
)
Coarse aggregate volume (%)
Fig. 9. Variation of the GF of SCC with different coarse aggregate volume percent.
with increasing aggregate size from6.3mmto 20mm. Variation of Lch inmixes of series I is depicted in Fig. 10 and Table 4. It can be observed thatincrease of aggregate size from 9.5mm to 19mmcauses Lch to rise from263.9 mm to 466.4 mm and from 209.2 mm to 394.7 mm for mediumstrength and high strength concrete respectively. This is due to thefact that in concrete containing coarser aggregate, ITZ is weakenedand process zone in front of the crack is larger and the cracking path ismore deviated. In other words, when the aggregate size in concrete be-comes smaller, the effect of bridging and aggregate interlocking in thecrack path is attenuated. Yan et al. [28] showed that ductility index inconcrete is related to fractal dimensions andwhen the coarse aggregatesize is increased, coarse aggregate is debonded and fractal dimensionsare increased. Chen and Liu [32] also reported that for a constant aggre-gate volume, in NVC, increase of average aggregate size, causes the sizeof FPZ to increase which is corresponding to more energy absorption inthis zone andmore concrete ductility aswell. In addition increasingw/cratio and decreasing compressive strength, Lch is increased indicatingthat concrete ductility is improved. It may be due to the fact that withincrease of w/c ratio, ITZ is weakened and more aggregate is pulledout of matrix and the fracture surface becomes complex while decreas-ing w/c ratio and increasing compressive strength, fracture mode is
w/c = 0.53
w/c = 0.380
100
200
300
400
500
9.512.7
19
L ch
(mm
)
dmax (mm)
Fig. 10. Variation of the Lch with maximum size of coarse aggregate for mixes preparedwith different w/c ratios.

Fig. 11. Fracture surface appearance for dmax = 19 mmwith w/c = 0.53 (left) and w/c = 0.38 (right).
100
200
300
400
500
600
100 200 300 400 500 600
Pred
icte
d L
ch (m
m)
Experimental Lch (mm)
Test results
Petersson [16]
El -sayed et al.[44]
Beygi et al. [46]
Bharatkumar et al.[50]
Fig. 12. Comparison of the experimental results versus predicted values from the proposed relation for Lch in the NVC, HPC and SCC [16,44,46,50].
82 M.H.A. Beygi et al. / Cement and Concrete Research 66 (2014) 75–90
through the aggregate and the fracture surface becomes smooth. Thus,the fracture path and fractal dimension become small reducing the ef-fect of aggregate bonding and deflecting. Therefore, FPZ at the tip ofthe crack becomes local. Fig. 11 shows the fracture surface for aggregatesize of 19 mm and two w/c ratios of 0.38 and 0.53. In Fig. 11, mode(a) represents a smooth surface in which crack passes through the ag-gregate and all the aggregates appear to be across the crack path,while mode (b) indicates a rough surface that a crack runs around theaggregates andmost of the aggregates are debonded. Other researchershave reported a meaningful dependency between Lch, the compressivestrength and maximum aggregate size. Thus, in the present study,using regression analysis, a relation for Lch based on compressivestrength and maximum aggregate size has been introduced as:
Lch ¼ 53:6 d0:95max
fc10
� �−0:39mmð Þ ð10Þ
R² = 0.87
100
200
300
400
500
20 30 40 50 60 70
Cha
ract
eris
tic le
ngth
, L
ch, (
mm
)
Coarse aggregate volume (%)
Fig. 13. Variation of the Lch of SCC with different coarse aggregate volume percent.
where fc is the compressive strength in MPa, dmax is the maximum ag-gregate size in mm and Lch is the characteristic length in mm. Eq. (10)implies that the characteristic length varies almost linearly to dmax,which was previously proposed by Bazant and Beaq-Giraudon [49].The above equation can be used to predict the characteristic length ofother SCCmixes with given compressive strength andmaximumaggre-gate size. Prediction values for various mixes obtained from Eq. (10)have been plotted in Fig. 12 versus the corresponding experimentalvalues achieved in present study alongwith those reported by other re-searchers for NVC, HPC and SCC. Considering Fig. 12, it can be observedthat the prediction values and experimental ones are acceptably close.Fig. 13 shows the variation of Lch versus coarse aggregate volume per-centage in series II. It can be observed thatwith increase of coarse aggre-gate volume, from 30% to 60%, the value of Lch increases by 42%. Thereason for this increase may be due to the fact that with increase ofcoarse aggregate volume percentage, more aggregate is deboundedfrom thematrix and the crack path becomes tortuous. Thus, more ener-gy is consumed and concrete ductility is enhanced. In the other words,decreasing coarse aggregate volume, the mix is more homogenousand brittle.
4.2. Analysis of fracture parameters from SEM
According to RILEM-TC 89 [34] in SEM, the weight of each bendingspecimen should be added to the peak load recorded by testing equip-ment. Thus, peak loads recorded for each bending beam is corrected ac-cording to RILEM-TC 89 [34] recommendation as:
P0max nð Þ ¼ Pmax nð Þ þ
2Sn−Ln2Sn
� g �mn ð11Þ
where Pmax(n)0 is the corrected peak load, Pmax(n) is the peak load record-
ed by the testing equipment, mn is the mass of each specimen, sn is thespecimen span, Ln is the specimen length, g is the gravity accelerationand n is the number of specimens tested. The corrected peak loads are

Table 5Value of GF measured from beam tested in series II mixtures.
Mix ID fc (MPa) E(GPa)
ft (MPa) GF (N/m) AverageGF (N/m)
Coefficient of variation (%) lch (mm)
Beam 1 Beam 2 Beam 3
G30 55.3 33.4 3.82 109.0 109.0 111.1 109.7 1.1 251.8G40 54.2 35.1 3.61 124.4 125.2 108.7 119.4 7.8 321.5G50 57.8 37.7 3.71 118.2 121.4 137.3 125.6 8.1 344.0G60 58.5 39.3 3.76 120.7 137.4 128.8 128.9 6.5 358.3
83M.H.A. Beygi et al. / Cement and Concrete Research 66 (2014) 75–90
tabulated in Tables 6 and 7. It should be said that some specimens undertest were disqualified during the test due to premature failure outsidethe notched cross-section of the beam. The defects (cracks) created dur-ing the construction aswell as the handling process account for such ab-normal failure. Specimens with notch depth of a0 = 0.4d are moresusceptible to such defect. Considering the corrected peak loads inTables 6 and 7 and also Eq. (4) the linear regression analysis was carriedout. One of the linear regression results is plotted in Fig. 14. In this curve,slope and intercept of regression equation were obtained as A =0.0046mm−1 MPa−2 and C= 0.1199MPa−2. In addition, variation co-efficients of slope (wA) and intercept (wc) were 0.05 and 0.25 respec-tively. In order to achieve acceptable accuracy in SEM, the range ofbeam sizes used in regression analysis must be adequately large in rela-tion to the inevitable random scatter of material properties and testmeasurements for typical scatter of concrete the minimum size rangeis 1:4. However, in this research, for more certainty, the ratio of 1:8was adapted. RILEM-TC 89 [34] recommends that relativewidth of scat-tering band (m), variation coefficients of slope and intercept should notexceed 0.2, 0.1 and 0.2 respectively. In this research, almost all valuessatisfy the abovementioned condition and for some cases the differenceis negligible which can be acceptable considering the adopted size ratio(1:8). Then, two major fracture parameters in SEM, namely initial frac-ture energy (Gf) and effective length of fracture process zone (Cf), be-side other applicable parameters such as fracture toughness (KIc) andthe effective crack tip opening displacement at the peak load (δc)were obtained according to thementioned equations and the regressionanalysis for each mix and the results are depicted in Tables 8 and 9.
Table 6Corrected maximum loads for mixes in series I.
Series fc (MPa) a0/d Depth d(mm)
GM9 38.2 0.2 28.557.0114.0228.0
GM12 44.9 0.2 38.176.2152.4304.8
GM19 48 0.2 57.1114.3228.6457.2
GH9 75.9 0.2 28.557.0114.0228.0
GH12 76.9 0.2 38.176.2152.4304.8
GH19 80 0.2 57.1114.3228.6457.2
NT = specimens not tested.
Fig. 15 shows Gf variations versus maximum coarse aggregate size forSCC with various values of dmax for mixes of series M and H. It can beseen from Fig. 15 that the fracture energy in each series increases withincrease of dmax. The same trend was reported by Jenq and Shah [60]in which Gf increased by 68% with increase of dmax from 4.75 mm to19 mm. As it was previously outlined for fracture energy variation,this can be attributed to the fact that, with increase of dmax, the strengthof ITZ is reduced and consequently larger aggregates are pulled out in-stead of being fractured. This results in an increase in roughness in thefracture surface and thus more energy is consumed. Since researchershave demonstrated a clear relation between initial fracture energy,compressive strength and maximum coarse aggregate size, in this re-search, according to the results obtained from regression analysis, a re-lation has been proposed for the fracture energy based on compressivestrength and maximum coarse aggregate size as:
Gf ¼ 9:26 d0:31max
fc10
� �0:42N=mð Þ ð12Þ
where fc is the compressive strength in MPa, dmax is the maximumaggregate size in mm and Gf is the initial fracture energy in N/m. Theabove equation can be used to predict the fracture energy of SCC withknown compressive strength and dmax. Prediction values obtainedfrom Eq. (12) for different mixes have been plotted against experimen-tal values of the present research and also the experimental results re-ported by other researches for NVC, HPC and SCC (Fig. 16).Considering Fig. 16, it can be observed that the prediction values are
Corrected maximum load P0 (N)
Beam 1 Beam 2 Beam 3
1085 1136 11292072 1784 20782530 2542 27294293 4848 46501758 NT 18983038 2564 27264390 4063 47777533 7672 73893733 3752 NT5246 4543 46208014 9253 782713942 13890 154581548 1512 16482810 2921 26564175 3671 40435903 6205 59922623 2557 25013395 3528 33395752 5884 59619821 10089 94794409 4353 41117519 6736 674310199 10320 11420NT 20258 NT

Table 7Corrected maximum loads for mixes in series II.
Series fc (MPa) a0/d Depth d(mm)
Corrected maximum load P0 (N)
Beam 1 Beam 2 Beam 3
G30 55.3 0.2 38.1 1699 1685 160076.2 3108 3274 3178152.4 4668 4469 4521304.8 6949 6949 7003
G40 54.2 0.2 38.1 1891 1997 206476.2 2843 2887 2909152.4 5176 4712 5113304.8 7590 8178 7888
G50 57.8 0.2 38.1 1913 1924 192476.2 2593 2774 2733152.4 4649 5021 4929304.8 NT 8193 8075
G60 55.8 0.2 38.1 1813 2093 181076.2 2950 2891 3046152.4 4863 5227 4535304.8 NT 9146 8653
GB30 57.1 0.4 38.1 1251 NT NT76.2 1710 1743 1839152.4 3145 NT 2879304.8 4351 4399 4310
GB40 58.5 0.4 38.1 1262 1299 NT76.2 1784 1946 1824152.4 2986 2879 3214304.8 4561 5352 NT
GB50 58.4 0.4 38.1 1177 1214 126976.2 1835 1824 NT152.4 3346 3026 2916304.8 5399 4932 5535
GB60 60.7 0.4 38.1 1192 1208 118176.2 1582 1979 NT152.4 3500 3273 3295304.8 5793 5237 5292
NT = specimens not tested.
84 M.H.A. Beygi et al. / Cement and Concrete Research 66 (2014) 75–90
sufficiently close to experimental values. Fig. 17 shows the relation be-tween Gf and volume percentage of coarse aggregate. As it can beseen, with increase of volume percentage of coarse aggregate from30% to 60% Gf increases by 62%. This increase is due to more pull outof coarse aggregate from the matrix. In other words, in this case, crackbridging is increasedwhich also increases roughness in the fracture sur-face resulting in increase of fractal dimension. Considering Table 8, var-iation trend of parameters with increase of dmax, signifies higher valuefor d0 which is corresponding to lower brittleness of concrete. Lowerbrittleness is also reflected in higher values of Cf and δc in SCC. Moseleyet al. [27] showed that concrete ductility increaseswith increase of dmax.The parameter Cf, like Lch, is related to concrete brittleness and with in-crease of Cf, concrete brittleness is decreased. Bazant and Kazemi [39]stated that the value of Cf, in NVC, often varies between 10 mm and
y = 0.0046x + 0.1199R² = 0.97
0
0.2
0.4
0.6
0.8
1
1.2
1.4
10 60 110 160 210 260
( 1/ σ n
) 2
(MPa
-2)
Specimen depth , d (mm)
Fig. 14. Linear regression for size effect parameters.
25mm. Eskandari et al. [52] reported the value Cf in SCCwithmaximumaggregate size of 16 mm to vary between 13 mm and 41 mm whileBeygi et al. [46] reported that Cf is between 14 mm and 29 mm in SCCwith maximum aggregate size of 12.7 mm. In the present study, ascan be seen from Table 8 and Fig. 18, increasing aggregate size from9.5 mm to 19 mm in series M and H, causes Cf to increase from9.4 mm to 35.7 mm and from 4.9 mm to 31.7 mm respectively indicat-ing that concrete ductility increases with increase of dmax. This is, asmentioned before, due to strength reduction of ITZ and change of ITZ'smicrostructure with increase of dmax and consequently increase of frac-tal dimensions due to debounding of coarse aggregate and elongation offracture path. Fig. 19 also shows the variation of Cf against the increaseof coarse aggregate volume. As can be seen, when the coarse aggregatevolume increases from 30% to 60%, the value of Cf increases linearly. Thereason for this increase is the tortuosity of the fracture path due to in-crease of aggregate debounded from the matrix, increase of aggregatebridging in the crack and also increase of other mechanisms of energyabsorption in FPZ. A graphical comparison has been presented inFig. 20 between normalized mechanical properties and major fractureparameters in SEM for SCCwith various percentages of coarse aggregatevolume. As can be seen, with increase of coarse aggregate volume per-centage, in regard to the volume percentage of 30%, Gf and Cf increasesignificantly while mechanical properties remain roughly the same.Such trend was previously reported by Petersson [16]. This shows thatvariation of coarse aggregate volume has much more noticeable effecton fracture parameters than on other mechanical properties of SCC.Figs. 21 and 22 show respectively the variation of fracture toughness(KIC) versus dmax and the percentage of coarse aggregate volume inSCCmixes. As can be seen from Fig. 21, with increase of dmax, the valuesof fracture toughness in bothM andH groups increase by 20%. The sametrend has been reported by Chen and Liu [32] for NVC with w/c ratio of0.37 in which increase of dmax from 10 mm to 20 mm results in a 13%
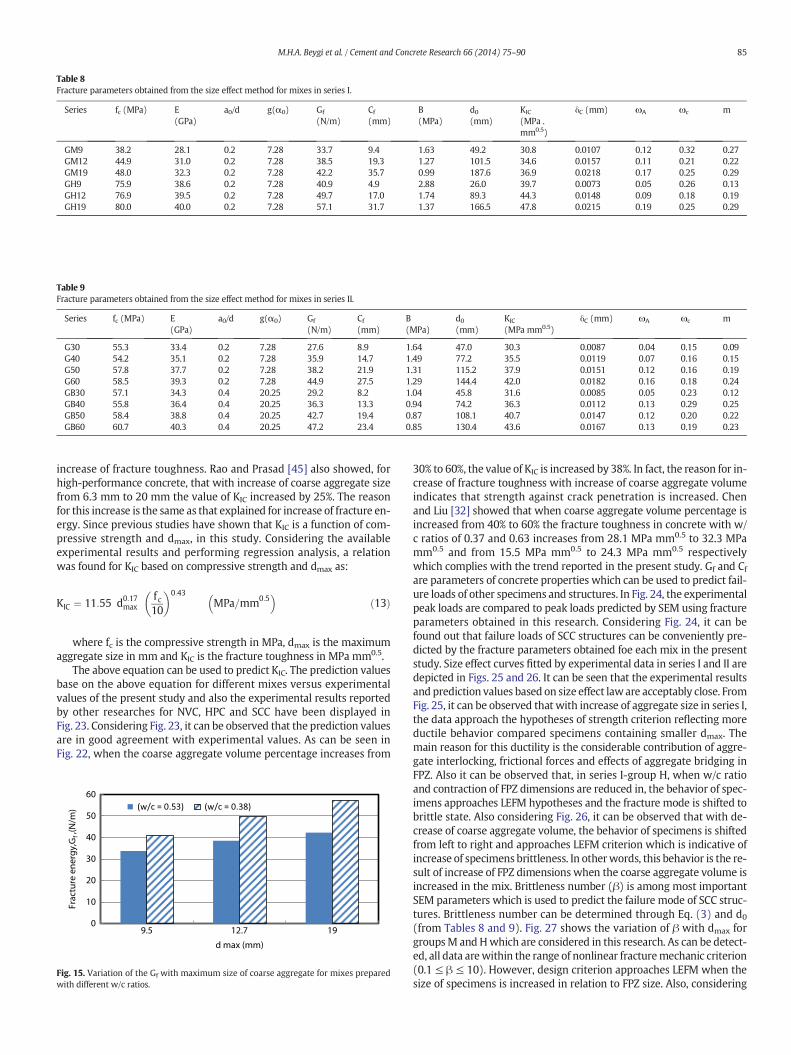
Table 8Fracture parameters obtained from the size effect method for mixes in series I.
Series fc (MPa) E(GPa)
a0/d g(α0) Gf
(N/m)Cf(mm)
B(MPa)
d0(mm)
KIC
(MPa .mm0.5)
δC (mm) ωA ωc m
GM9 38.2 28.1 0.2 7.28 33.7 9.4 1.63 49.2 30.8 0.0107 0.12 0.32 0.27GM12 44.9 31.0 0.2 7.28 38.5 19.3 1.27 101.5 34.6 0.0157 0.11 0.21 0.22GM19 48.0 32.3 0.2 7.28 42.2 35.7 0.99 187.6 36.9 0.0218 0.17 0.25 0.29GH9 75.9 38.6 0.2 7.28 40.9 4.9 2.88 26.0 39.7 0.0073 0.05 0.26 0.13GH12 76.9 39.5 0.2 7.28 49.7 17.0 1.74 89.3 44.3 0.0148 0.09 0.18 0.19GH19 80.0 40.0 0.2 7.28 57.1 31.7 1.37 166.5 47.8 0.0215 0.19 0.25 0.29
Table 9Fracture parameters obtained from the size effect method for mixes in series II.
Series fc (MPa) E(GPa)
a0/d g(α0) Gf
(N/m)Cf(mm)
B(MPa)
d0(mm)
KIC
(MPa mm0.5)δC (mm) ωA ωc m
G30 55.3 33.4 0.2 7.28 27.6 8.9 1.64 47.0 30.3 0.0087 0.04 0.15 0.09G40 54.2 35.1 0.2 7.28 35.9 14.7 1.49 77.2 35.5 0.0119 0.07 0.16 0.15G50 57.8 37.7 0.2 7.28 38.2 21.9 1.31 115.2 37.9 0.0151 0.12 0.16 0.19G60 58.5 39.3 0.2 7.28 44.9 27.5 1.29 144.4 42.0 0.0182 0.16 0.18 0.24GB30 57.1 34.3 0.4 20.25 29.2 8.2 1.04 45.8 31.6 0.0085 0.05 0.23 0.12GB40 55.8 36.4 0.4 20.25 36.3 13.3 0.94 74.2 36.3 0.0112 0.13 0.29 0.25GB50 58.4 38.8 0.4 20.25 42.7 19.4 0.87 108.1 40.7 0.0147 0.12 0.20 0.22GB60 60.7 40.3 0.4 20.25 47.2 23.4 0.85 130.4 43.6 0.0167 0.13 0.19 0.23
85M.H.A. Beygi et al. / Cement and Concrete Research 66 (2014) 75–90
increase of fracture toughness. Rao and Prasad [45] also showed, forhigh-performance concrete, that with increase of coarse aggregate sizefrom 6.3 mm to 20 mm the value of KIC increased by 25%. The reasonfor this increase is the same as that explained for increase of fracture en-ergy. Since previous studies have shown that KIC is a function of com-pressive strength and dmax, in this study. Considering the availableexperimental results and performing regression analysis, a relationwas found for KIC based on compressive strength and dmax as:
KIC ¼ 11:55 d0:17max
fc10
� �0:43MPa=mm0:5
� �ð13Þ
where fc is the compressive strength in MPa, dmax is the maximumaggregate size in mm and KIC is the fracture toughness in MPa mm0.5.
The above equation can be used to predict KIC. The prediction valuesbase on the above equation for different mixes versus experimentalvalues of the present study and also the experimental results reportedby other researches for NVC, HPC and SCC have been displayed inFig. 23. Considering Fig. 23, it can be observed that the prediction valuesare in good agreement with experimental values. As can be seen inFig. 22, when the coarse aggregate volume percentage increases from
0
10
20
30
40
50
60
9.5 12.7 19
Frac
ture
ene
rgy,
Gf ,(
N/m
)
d max (mm)
(w/c = 0.53) (w/c = 0.38)
Fig. 15. Variation of the Gf with maximum size of coarse aggregate for mixes preparedwith different w/c ratios.
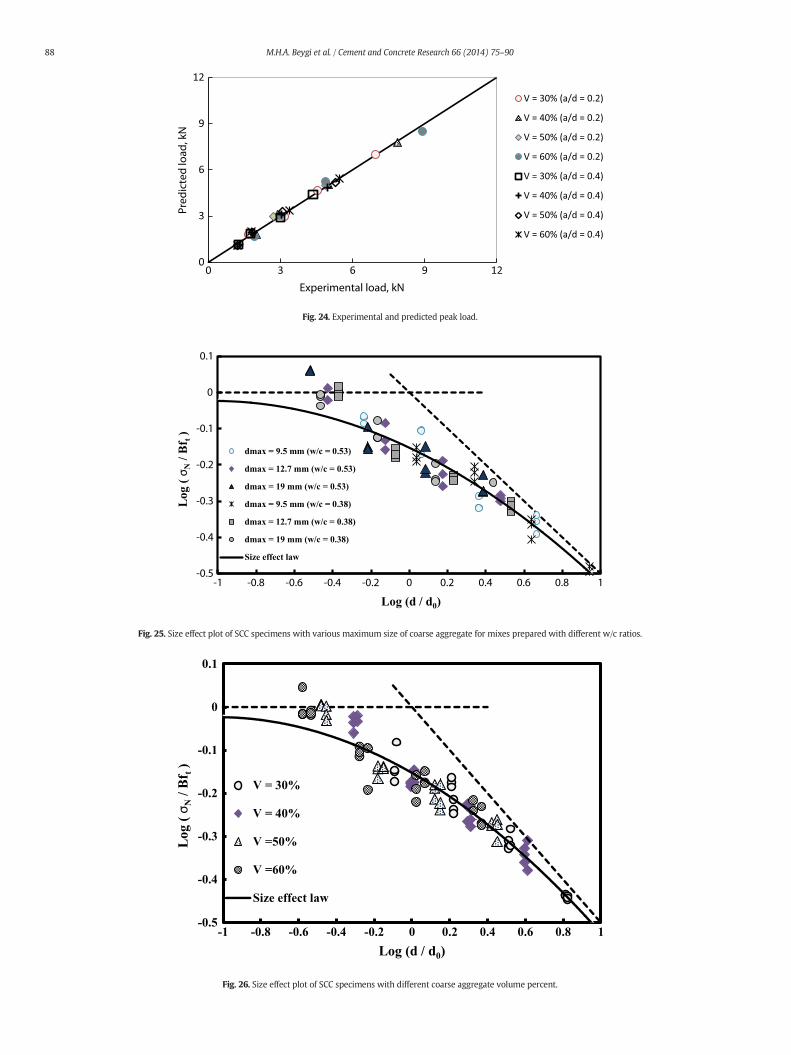
30% to 60%, the value of KIC is increased by 38%. In fact, the reason for in-crease of fracture toughness with increase of coarse aggregate volumeindicates that strength against crack penetration is increased. Chenand Liu [32] showed that when coarse aggregate volume percentage isincreased from 40% to 60% the fracture toughness in concrete with w/c ratios of 0.37 and 0.63 increases from 28.1 MPa mm0.5 to 32.3 MPamm0.5 and from 15.5 MPa mm0.5 to 24.3 MPa mm0.5 respectivelywhich complies with the trend reported in the present study. Gf and Cfare parameters of concrete properties which can be used to predict fail-ure loads of other specimens and structures. In Fig. 24, the experimentalpeak loads are compared to peak loads predicted by SEM using fractureparameters obtained in this research. Considering Fig. 24, it can befound out that failure loads of SCC structures can be conveniently pre-dicted by the fracture parameters obtained foe each mix in the presentstudy. Size effect curves fitted by experimental data in series I and II aredepicted in Figs. 25 and 26. It can be seen that the experimental resultsand prediction values based on size effect laware acceptably close. FromFig. 25, it can be observed that with increase of aggregate size in series I,the data approach the hypotheses of strength criterion reflecting moreductile behavior compared specimens containing smaller dmax. Themain reason for this ductility is the considerable contribution of aggre-gate interlocking, frictional forces and effects of aggregate bridging inFPZ. Also it can be observed that, in series I-group H, when w/c ratioand contraction of FPZ dimensions are reduced in, the behavior of spec-imens approaches LEFM hypotheses and the fracture mode is shifted tobrittle state. Also considering Fig. 26, it can be observed that with de-crease of coarse aggregate volume, the behavior of specimens is shiftedfrom left to right and approaches LEFM criterion which is indicative ofincrease of specimens brittleness. In otherwords, this behavior is the re-sult of increase of FPZ dimensions when the coarse aggregate volume isincreased in the mix. Brittleness number (β) is among most importantSEM parameters which is used to predict the failure mode of SCC struc-tures. Brittleness number can be determined through Eq. (3) and d0
(from Tables 8 and 9). Fig. 27 shows the variation of β with dmax forgroupsM and Hwhich are considered in this research. As can be detect-ed, all data arewithin the range of nonlinear fracturemechanic criterion(0.1 ≤ β ≤ 10). However, design criterion approaches LEFM when thesize of specimens is increased in relation to FPZ size. Also, considering

10
20
30
40
50
60
70
10 30 50 70
Pred
icte
d G
f (N
/m)
Experimental Gf (N/m)
Test results
Bazant and Oh [21]
Bazant and Pfeiffer [38]
Beygi et al. [46]
Bharatkumar et al.[50]
Eskandari et al.[52]
Einsfeld and Velasco [53]
Jenq and Shah [60]
Fig. 16. Comparison of the experimental results versus predicted values from the proposed relation for Gf in the NVC, HPC and SCC [21,38,46,50,52,53,60].
86 M.H.A. Beygi et al. / Cement and Concrete Research 66 (2014) 75–90
the slope of the plotted lines, it can be observed that in specimens withsmall dmax and lowerw/c ratio, compared to specimenswith larger dmax
and the higher w/c ratio, LEFM relations can be used in the design ofdeeper beams with less error. Fig. 28 shows the variation of β versuspercentage of coarse aggregate volume. It can be observed that, with
R² = 0.95
10
20
30
40
50
60
20 30 40 50 60 70
Frac
ture
ene
rgy
, Gf,
(N/m
)
Coarse aggregate volume (%)
Fig. 17. Variation of the Gf of SCC with different coarse aggregate volume percent.
0
10
20
30
40
7 10 13 16 19
Effec
tive
leng
th o
f FPZ
,Cf,
(mm
)
d max (mm)
w/c = 0.53
w/c = 0.38
Fig. 18.Variation of theCfwithmaximumsize of coarse aggregate formixes preparedwithdifferent w/c ratios.
decrease of coarse aggregate volume and consequently reduction ofFPZ dimension compared to the structure size, failure mode and designcriterion approach LEFMmode andmore beams with greater depth canbe designed with less error based on LEFM hypotheses. Bazant andKazemi [39] showed that the fracture energies, GF, obtained from
R² = 0.96
0
10
20
30
40
20 30 40 50 60 70
Effec
tive
leng
th o
f FPZ
,Cf,
(mm
)
Coarse aggregate volume (%)
Fig. 19. Variation of the Cf of SCC with different coarse aggregate volume percent.
0.5
1.0
1.5
2.0
2.5
3.0
3.5
20 30 40 50 60 70
Rela
tive
valu
e
Coarse aggregate volume (%)
Compressive strength Modolus of elasticity
Fracture energy Effective length of FPZ
Fig. 20. Variation of properties with different coarse aggregate volume percent.

0
10
20
30
40
50
60
9.5 12.7 19Frac
ture
toug
hnes
s,K IC
,(MPa
. mm
0.5 )
d max (mm)
(w/c = 0.53) (w/c = 0.38)
Fig. 21. Variation of the KIC with maximum size of coarse aggregate for mixes preparedwith different w/c ratios.
R² = 0.95
20
30
40
50
60
20 30 40 50 60 70
Frac
ture
toug
hnes
s ,K
IC(M
Pa.m
m0.
5 )
Coarse aggregate volume (%)
Fig. 22. Variation of KIC with different coarse aggregate volume percent.
87M.H.A. Beygi et al. / Cement and Concrete Research 66 (2014) 75–90
WFMandGf yielded from SEM are two different properties for concrete.Gf is always smaller thanGF and is equal to the area under initial slope ofthe softening curve of concrete. Studies by Bazant and Kazemi [39]showed that GF can be estimated from the value of Gf. However, variousresearchers believe that these two energies are weakly correlated andsuffer high lack of certainty [53]. Major reasons for this lack of certaintyare attributed to dependency of GF on the specimen size and the proce-dure of the test. As mentioned before, precise calculation of the wholearea under load–displacement curve which is related to the
15
30
45
60
15
Pred
icte
d K
IC (M
Pa.m
0.5 )
Test results
Walsh [20]
Chen and Liu [32]
Bazant and Pfeiffer [38]
Beygi et al.[46]
Bharatkumar et al.[50]
Einsfeld and Velasco [53]
Jenq and Shah [60]
Karihaloo and Nallathambi [61]
Tang et al. [62]
Catalano and Ingraffea [63]
Refai and Swartz [64]
Fig. 23. Comparison of the experimental results versus predicted values from the prop
determination of GF, specially in the tail end portion of the load–dis-placement curve, suffers high uncertainty. However, determining Gf,using the size effect method, only peak loads are involved and thusthere is less uncertainty. Since determination of Gf in SEM has highercertainty and is much simpler than GF, researchers [39,49] recommend-ed that estimation of GF from Gf is more accurate and this way bilinearsoftening curve of concrete used in finite element analysis of structuresbased on cohesive crack model can be calibrated. Planas et al. [65],based on experimental investigations into NVC, estimated that thevalue of GF/Gf vary between 2 and 2.5 while Bazant and Becq-Giraudon [49], conducting a full scale analytical investigation into re-sults from previous studies on different concrete mixes, determinedthe value of GF/Gf, with a rough approximation, to be 2.5. Einsfeld andVelasco [53], conducting extensive experimental studies on HPC, ob-tained the value of 2.88 for GF/Gf ratio with variation coefficient of38.1%. In the present study, considering the results obtained in series Iand II, the ratio of GF/Gf for each SCC mix has been found to be 3.11with variation coefficient of 14.8%. Although high variation coefficientof 40% has been reported for GF/Gf ratio [49], it can be said that the resultobtained in this research is very close to the results obtained for normalconcrete. It is worth saying that Beygi et al. [46], investigating the effectof w/c ratio on SCC, reported the value of 2.92 for GF/Gf ratio with vari-ation coefficient of 12.5% which is compatible with the results obtainedin the present study.
5. Conclusions
In the present study, the effects of maximum size and volume ofcoarse aggregate on fracture characteristics of SCC using notchedbeams of different sizes according to RILEM recommendation were in-vestigated and the results can be summarized as follows:
(1) The results obtained through both WFM and SEM indicated thatdecrease of aggregate size, in SCC mixtures, from 19 mm to9.5 mm caused a notable drop in fracture energy.
(2) The results obtained through both WFM and SEM indicated thataddition of coarse aggregate, in a range varying from 30% to 60%,to the concrete mixture caused the fracture energy to increase lin-early which complies with previous studies by Akcay et al. [30] forNVC.
(3) Since characteristic length, Lch, inWFMand effective length of pro-cess zone, Cf, in SEM increase significantly with increase of coarseaggregate size and w/c ratio, it can be concluded that a more duc-tile SCC with lower w/c ratio can be made from coarser aggregate.
30 45 60Experimental KIC (MPa.m 0.5)
osed relation for KIC in the NVC, HPC and SCC [20,32,38,46,50,53,60,61,62,63,64].
0
3
6
9
12
0 3 6 9 12
Pred
icte
d lo
ad, k
N
Experimental load, kN
V = 30% (a/d = 0.2)
V = 40% (a/d = 0.2)
V = 50% (a/d = 0.2)
V = 60% (a/d = 0.2)
V = 30% (a/d = 0.4)
V = 40% (a/d = 0.4)
V = 50% (a/d = 0.4)
V = 60% (a/d = 0.4)
Fig. 24. Experimental and predicted peak load.
-0.5
-0.4
-0.3
-0.2
-0.1
0
0.1
-1 -0.8 -0.6 -0.4 -0.2 0 0.2 0.4 0.6 0.8 1
Log
( σ N
/ Bf t
)
Log (d / d0)
dmax = 9.5 mm (w/c = 0.53)
dmax = 12.7 mm (w/c = 0.53)
dmax = 19 mm (w/c = 0.53)
dmax = 9.5 mm (w/c = 0.38)
dmax = 12.7 mm (w/c = 0.38)
dmax = 19 mm (w/c = 0.38)
Size effect law
Fig. 25. Size effect plot of SCC specimens with various maximum size of coarse aggregate for mixes prepared with different w/c ratios.
-0.5
-0.4
-0.3
-0.2
-0.1
0
0.1
-1 -0.8 -0.6 -0.4 -0.2 0 0.2 0.4 0.6 0.8 1
Log
( σN
/ Bf t
)
Log (d / d0)
V = 30%
V = 40%
V =50%
V =60%
Size effect law
Fig. 26. Size effect plot of SCC specimens with different coarse aggregate volume percent.
88 M.H.A. Beygi et al. / Cement and Concrete Research 66 (2014) 75–90

0
10
20
0 250 500 750 1000 1250 1500 1750 2000
β
d (mm)
dmax = 9.5 mm (w/c = 0.53)
dmax = 12.7 mm (w/c = 0.53)
dmax = 19 mm (w/c = 0.53)
dmax = 9.5 mm (w/c = 0.38)
dmax = 12.7 mm (w/c = 0.38)
dmax = 19 mm (w/c = 0.38)
nonlinear fracture mechanic criteria
linear fracture mechanic criteria
Fig. 27. Variation of βwith depth of beam for various maximum size of coarse aggregate for mixes prepared with different w/c ratios.
89M.H.A. Beygi et al. / Cement and Concrete Research 66 (2014) 75–90
(4) The characteristic length, Lch and the effective length of processzone, Cf, linearly increasewith increase of coarse aggregate volumeand size.
(5) Fracture toughness, KIC, increases linearly when the coarse aggre-gate volume is increased from 30% to 60% which is consistentwith previous studies by Chen and Liu [32] for NVC.
(6) Fracture toughness is influenced by coarse aggregate size, increas-ing from 30.8 MPa mm0.5 to 36.9 MPa mm0.5 for w/c = 0.53 andfrom 39.7 MPa mm0.5 to 47.8 MPa mm0.5 for w/c = 0.38 whenthe coarse aggregate size increases from 9.5 mm to 19 mm.
(7) Formixeswith the samemaximumaggregate size, SCCmixeswithlower w/c ratios show higher values of GF, Gf and KIC which com-pare well with the results reported by Beygi et al. [46].
(8) The experimental results obtained in this study for the trend offracture energy variation with increase of coarse aggregate sizecompare well with other results reported in the literature.
(9) The size effect curve shows the fracture behavior of concrete con-taining smaller aggregate size and lower w/c ratio approaches thelinear elastic fracture mechanic.
(10) Considering the size effect curve, nominal strength of SCCbeams shift from left to the right with decreasing volume ofthe coarse aggregate, implying that the failure mechanism of
0
10
0 250 500 750
β
d (mm)
linear fracture mech
Fig. 28. Variation of β with depth of beam for d
the concrete used in the present study shift toward the regionof LEFM criterion.
(11) Considering the range of brittleness number obtained in this study,it can be concluded that nonlinear fracture mechanic principlescan be appropriately used to design normal size SCC members.
(12) The ratio of GF/Gf (where GF and Gf are obtained from WFM andSEM respectively) was found to be approximately equal to 3.11for the SCC mixes with variation coefficient of 14.8%. These valuesare consistent with the earlier predictions by Bazant and Besq-Giradon [49], Einsfeld andVelasco [53] and Beygi et al. [46] respec-tively for NVC, HPC and SCC.
(13) For mixes with the same maximum aggregate size, the character-istic length, Lch, and the effective length of process zone, Cf, as ma-terial brittleness indexes respectively in WFM and SEM, increasewith increase of w/c ratio which complies with other results re-ported in literature.
Acknowledgment
The authors wish to acknowledge the financial support of the BabolUniversity of Technology that made this research possible.
1000 1250 1500
V = 30%
V = 40%
V= 50%
V = 30%
nonlinear fracture mechanic criteria
anic criteria
ifferent coarse aggregate volume percent.

90 M.H.A. Beygi et al. / Cement and Concrete Research 66 (2014) 75–90
References
[1] A. Castel, T. Vidal, R. François, Bond and cracking properties of self-consolidatingconcrete, Constr. Build. Mater. 24 (2010) 1222–1231.
[2] H. Okamura, M. Ouchi, Self-compacting concrete, J. Adv. Concr. Technol. 1 (2003)5–15.
[3] W. Zhu, J.C. Gibbs, Use of different limestone and chalk powders in self-compactingconcrete, Cem. Concr. Res. 35 (2005) 1457–1462.
[4] Z.P. Bazant, J. Planas, Fracture and Size Effect in Concrete and Other Quasi-brittleMaterials, CRC Press, 1998.
[5] J. Xiao, H. Schneider, C. Donnecke, G. Konig, Wedge splitting test on fracture behav-ior of ultra-high strength concrete, Constr. Build. Mater. 18 (2004) 359–365.
[6] M. Issa, M.A. Issa, M.A. Islam, A. Chudnovsky, Size effects in concrete fracture—PartII: analysis of test results, Int. J. Fract. 102 (2000) 25–42.
[7] B. Craeye, G. De Schutter, B. Desmet, J. Vantomme, G. Heirman, L. Vandewalle, O.Cizer, S. Aggoun, E.H. Kadri, Effect of mineral filler type on autogenous shrinkageof self-compacting concrete, Cem. Concr. Res. 40 (2010) 908–913.
[8] J. Tragardh,Microstructural Features and Related Properties of Self-compacting Con-crete, in: A. Skarendhal, O. Petersson (Eds.), Proceedings of First International RILEMSymposium on Self-compacting Concrete, Stockholm, 1999, pp. 175–186.
[9] C. Yang, W. Chong, Y. Tao, Y. Wang, Z. Wang, J. Ye, Y. Lin, Analysis on ITZ structure ofself–compacting concrete, Second International Symposium on Design, Performanceand Use of Self–compacting Concrete SCC 2009, China (June 2009), Beijing, China,2009, pp. 426–434.
[10] T. Akcaoglu, M. Tokyay, T. Celik, Effect of coarse aggregate size andmatrix quality onITZ and failure behavior of concrete under uniaxial compression, Cem. Concr.Compos. 26 (2004) 633–638.
[11] G. Giaccio, R. Zerbino, Failuremechanism of concrete: combined effects of coarse ag-gregates and strength level, Adv. Cem. Based Mater. 7 (1998) 41–48.
[12] M.C. Torrijos, G. Giaccio, R. Zerbino, Mechanical and transport properties of 10 yearsold concretes prepared with different coarse aggregates, Constr. Build. Mater. 44(2013) 706–715.
[13] S.P. Shah, S. Chandra, Critical stress, volume change and micro cracking of concrete,ACI Mater. J. 65 (1968) 770–781.
[14] P. Acker, C. Boulay, P. Rossi, On the importance of initial stresses in concrete and ofthe resulting mechanical effects, Cem. Concr. Res. 17 (1987) 755–764.
[15] G. Giaccio, G.R. Sensale, R. Zerbino, Failure mechanism of normal and high-strengthconcrete with rice-husk ash, Cem. Concr. Compos. 29 (2007) 566–574.
[16] P.E. Petersson, Fracture energy of concrete: practical performance and experimentalresults, Cem. Concr. Res. 10 (1980) 91–101.
[17] A. Hillerborg, Results of three comparative test series for determining the fractureenergy GF of concrete, Mater. Struct. 18 (1985) 407–413.
[18] F.E. Amparano, Y. Xi, Y.S. Roh, Experimental study on the effect of aggregate contenton fracture behavior of concrete, Eng. Fract. Mech. 67 (2000) 65–84.
[19] H. Mihashi, N. Nomura, S. Niiseki, Influence of aggregate size on fracture processzone of concrete detected with 3D acoustic emission technique, Cem. Concr. Res.21 (1991) 737–744.
[20] P.F. Walsh, Fracture of plain concrete, Indian Concr. J. 46 (1972) 469–476.[21] Z.P. Bazant, B.H. Oh, Crack band theory for fracture of concrete, Mater. Struct. 16
(1983) 155–177.[22] Z. Zhao, S.H. Kwon, S.P. Shah, Effect of specimen size on fracture energy and soften-
ing curve of concrete. Part I. Experiments and fracture energy, Cem. Concr. Res. 38(2008) 1049–1060.
[23] B. Trunk, F.H. Wittmann, Influence of element size on fracture mechanics parame-ters of concrete, Dam Eng. 9 (1998) 3–23.
[24] F.P. Zhou, B.I.G. Barr, F.D. Lydon, Fracture properties of high strength concrete withvarying silica fume content and aggregates, Cem. Concr. Res. 25 (1995) 543–552.
[25] B.I.G. Barr, E.B.D. Hasso, V.J. Weiss, Effect of specimen and aggregate sizes up on thefracture characteristics of concrete, Int. J. Cem. Compos. Light. Concr. 8 (1986)109–119.
[26] S.Wolinski, D.A. Hordijk, H.W. Reinhardt, H.A.W. Cornelissen, Influence of aggregatesize on fracture mechanics parameters of concrete, Int. J. Cem. Compos. Light. Concr.9 (1987) 95–103.
[27] M.D. Moseley, R.P. Ojdrovic, H.J. Petroski, Influence of aggregate size on fracturetoughness of concrete, Theor. Appl. Fract. 7 (1987) 207–210.
[28] A. Yan, K.R. Wu, D. Zhang, W. Yao, Effect of fracture path on the fracture energy ofhigh-strength concrete, Cem. Concr. Res. 31 (2001) 1601–1606.
[29] V.S. Gopalaratnam, S.P. Shah, Softening response of plain concrete in direct tension,ACI Mater. J. 82 (1985) 310–323.
[30] B. Akcay, A.S. Ozbek, F. Bayramov, H.N. Atahan, C. Sengul, M.A. Tasdemir, Interpreta-tion of aggregate volume fraction effects on fracture behavior of concrete, Constr.Build. Mater. 28 (2012) 437–443.
[31] N.Q. Feng, X.H. Ji, Q.F. Zhuang, J.T. Ding, Effect of concrete materials on fracture per-formance, in: F.H. Wittmann (Ed.), Fracture mechanics of concrete structures, Proc.of FRAMCOS-2.D-79104Aedificatio Publishers, Freiburg, 1995, pp. 119–124.
[32] B. Chen, J. Liu, Effect of aggregate on the fracture behavior of high strength concrete,Constr. Build. Mater. 18 (2004) 585–590.
[33] RILEM FMC-50, Determination of the fracture energy of mortar and concrete bymeans of three-point bend tests on notched beams, Mater. Struct. 18 (1985)287–290.
[34] RILEM FMT 89, Size-effect method for determining fracture energy and process zonesize of concrete, Mater. Struct. 23 (1990) 461–465.
[35] M. Elices, G.V. Guinea, J. Planas, On the measurement of concrete fracture energyusing three-point bend tests, Mater. Struct. 30 (1997) 375–376.
[36] RILEM TC 187-SOC, Final Report of RILEM Technical Committee TC 187-SOC: ‘Exper-imental Determination of the Stress Crack Opening Curve for Concrete in Tension’,2007.
[37] A. Hillerborg, M. Modeer, P.E. Petersson, Analysis of crack formation and crackgrowth in concrete by means of fracture mechanics and finite elements, Cem.Concr. Res. 6 (1976) 773–782.
[38] Z.P. Bazant, P.A. Pfeiffer, Determination of fracture energy from size effect and brit-tleness number, ACI Mater. J. 84 (1987) 463–480.
[39] Z.P. Bazant, M.T. Kazemi, Determination of fracture energy, process zone length andbrittleness number from size effect, with application to rock and concrete, Int. J.Fract. 44 (1990) 111–131.
[40] EFNARC, Specification & Guidelines for Self-compacting Concrete, English ed.European Federation for Specialist Construction Chemicals and Concrete Systems,Norfolk, UK, 2002.
[41] BS EN 12390, Part 3: Testing Hardened Concrete, Method of Determination of Com-pressive Strength of Concrete Cubes, British Standards Institution, 2000.
[42] ASTM C 469, Standard Test Method for Static Modulus of Elasticity and Poisson’sRatio of Concrete in Compression, American Society of Testing Materials, 2002.
[43] ASTM C 496, Standard Test Method for Splitting Tensile Strength of Cylindrical Con-crete Specimens, American Society of Testing Materials, 2002.
[44] K.M. El-Sayed, G.V. Guinea, C. Rocco, J. Planas, M. Elices, Influence of aggregate shapeon the fracture behavior of concrete, Fracture Mechanics of Concrete Structures,Proceedings of the FRAMCOS-3AEDIFICATIO Publishers, Freiburg, Germany, 1998.
[45] G.A. Rao, B.K.R. Prasad, Fracture energy and softening behavior of high-strength con-crete, Cem. Concr. Res. 32 (2002) 247–252.
[46] M.H.A. Beygi, M.T. Kazemi, I.M. Nikbin, J. Vaseghi Amiri, The effect of water to ce-ment ratio on fracture parameters and brittleness of self-compacting concrete,Mater. Des. 50 (2013) 267–276.
[47] H.K. Hilsdorf, W. Brameshuber, Size effects in the experimental determination offracture mechanics parameters, in: S.P. Shah (Ed.), Application of Fracture Mechan-ics to Cementitious Composites, NATO-ARW, Northwestern University, Evanston,USA, 1984, pp. 361–397.
[48] CEB-FIP Model Code 1990-Final Draft, Comite Euro-International du Beton, Bulletind’Information, 203, 1991.
[49] Z.P. Bazant, E. Becq-Giraudon, Statistical prediction of fracture parameters of con-crete and implications for choice of testing standard, Cem. Concr. Res. 32 (2002)529–556.
[50] B.H. Bharatkumar, B.K. Raghuprasad, D.S. Ramachandramurthy, R. Narayanan, S.Gopalakrishnan, Effect of fly ash and slag on the fracture characteristics of high per-formance concrete, Mater. Struct. 38 (2005) 63–72.
[51] G. Giaccio, R. Rocco, R. Zerbino, The fracture energy (GF) of high strength concrete,Mater. Struct. 26 (1993) 381–386.
[52] H. Eskandari, S. Muralidhara, B.K.R. Prasad, B. Venkataramareddy, Size effect in self-consolidating concrete beams with and without notches, Sadhana 35 (2010)303–317.
[53] R.A. Einsfeld, M.S.L. Velasco, Fracture parameters for high-performance concrete,Cem. Concr. Res. 36 (2006) 576–583.
[54] F.H. Wittmann, Crack formation and fracture energy of normal and high strengthconcrete, Sadhana 27 (2002) 413–423.
[55] S. Mindess, The effect of specimen size on the fracture energy of concrete, Cem.Concr. Res. 14 (1984) 431–436.
[56] P.E. Petersson, Crack Growth and Development of Fracture Zone in Plain Concreteand Similar Materials, Report No. TVBM-1006, , Division of Building MaterialsLund Institute of Technology, Lund, Sweden, 1981.
[57] P. Rossi, E. Bruhwiler, S. Chhuy, Y.S. Jenq, S.P. Shah, Fracture properties of concrete asdetermined by means of wedge splitting tests and tapered double cantilever beamtests, in: S.P. Shah, A. Carpinteri (Eds.), Fracture Mechanics Test Methods for Con-crete, Chapman & Hall, London, 1991, pp. 87–128.
[58] J.L. Malvar, G.E. Warren, Fracture energy for three-point-bend tests on single-edge-notched beams: proposed evaluation, Mater. Struct. 20 (1987) 448–454.
[59] M. Hassanzadeh, The influence of the type of coarse aggregates on the fracture me-chanical properties of high-strength concrete, FractureMechanics of Concrete Struc-tures, Proceedings of the FRAMCOS-3AEDIFICATIO Publishers, Freiburg, Germany,1998, pp. 161–170.
[60] Y.S. Jenq, S.P. Shah, A fracture toughness criterion for concrete, Eng. Fract. Mech. 21(1985) 1055–1069.
[61] B.L. Karihaloo, P. Nallathambi, Fracture toughness of plain concrete from three-pointbend specimens, Mater. Struct. 22 (1989) 185–193.
[62] T. Tang, Z.P. Bazant, Y. Sungchul, D. Zollinger, Variable-notch one size method forfracture energy and process zone length, Eng. Fract. Mech. 55 (1996) 383–404.
[63] D.M. Catalano, A.R. Ingraffea, Concrete Fracture: A Linear Elastic Fracture MechanicsApproach, Report No. 82-1, , Department of Structural Engineering, Cornell Univer-sity, 1982. 161.
[64] M.E. Refai, S.E. Swartz, Fracture Behavior of Concrete Beams in Three-Point BendingConsidering the Influence of size Effects, Report No. 190, , Engineering ExperimentalStation, Kansas State University, 1987.
[65] J. Planas, M. Elices, G.V. Guinea, Measurement of the fracture energy using three-point bend tests. Part 2. Influence of bulk energy dissipation, Mater. Struct. 25(1992) 305–312.