The Influence of a Thin Electrolyte Layer on the Corrosion Process of Zinc in Chloride-Containing...
10
Corrosion Science, Vol. 33, No. 8~ pp. 1243-1252, 1992 0010-938X/92 $5.00 + 0.00 Printed in Great Britain. (~) 1992 Pergamon Press Ltd THE INFLUENCE OF A THIN ELECTROLYTE LAYER ON THE CORROSION PROCESS OF ZINC IN CHLORIDE-CONTAINING SOLUTIONS M. KEDDAM,A. HUGOT-LE-GOFF,H. TAKENOUTI, D. TH1ERRY* and M. C. AREVALOt UPR 15 du CNRS, Physique des Liquides et Electrochimie, Universit6 P. et M. Curie, Tour 22, Place Jussieu, F-75252 Paris, France *Swedish Corrosion Institute, Roslagsv/igen 101, Hus 25, S-104 05 Stockholm, Sweden t Department of Physical Chemistry, University of La Laguna, Tenerife, Spain Abstract--The corrosion of zinc in a neutral chloride solution was investigated under a thin electrolyte layer by both electrochemical (complex impedance) and spectroscopic (FFIR and RAMAN) techniques. It was established that confinement of a thin electrolyte layer on top of the corroding zinc sample leads to a specific impedance distribution obeying the transmission line model of a porous electrode. After correcting for this effect, increase of the charge transfer resistance and shift of the corrosion potential in the cathodic direction are consistent with oxygen depletion when the layer thickness is reduced. Corrosion products are identified by comparison to FTIR spectra of reference compounds: zinc hydroxychloride, zinc hydroxycarbonate and zinc oxide. In agreement with the chemistry changes shown by the impedance data, confinement of the corroding area is found to promote the formation of hydroxycarbonate while only hydroxychloride is detected during corrosion in bulk conditions. No chloride-containing products are detected with thicknesses below 1 mm. In situ RAMAN spectra performed across the thin layer and a glass window confirmed totally these conclusions. INTRODUCTION MOST OF THE zinc used for corrosion protection in galvanized steels is covered by organic coatings, especially in the car industry. Many situations relevant to zinc corrosion alone or as a sacrificial anode take place in highly occluded situations produced by paint delamination, precipitation of corrosion products or both. An understanding of the physicochemical processes occurring under these conditions is of basic importance in any attempt to improve the efficiency of the protection. This paper is aimed at contributing to this goal by combining in situ electrochemi- cal and spectroscopic techniques. The use of non-steady state electrochemical techniques in this particular cell geometry raises some serious difficulties in the separation of field distribution and kinetic contributions. Impedance methods are now well-suited for this purpose and have been used in this work together with FFIR and RAMAN spectroscopy. EXPERIMENTAL METHOD The electrochemical cell used the thin layer device that has been described in detail elsewhereJ It consists basically of two cylindrical halves made of an insulating material (polyvinyl difluoride). The bottom part embedding the working electrode is fixed whereas the upper part can be moved vertically so that the thickness of the thin electrolyte layer is known with an accuracy of about 10/~m. The reference electrode (Luggin Capillary and Saturated Calomel Electrode) and the counter electrode (large platinum Manuscript received 30 September 1991; in amended form 25 October 1991. 1243
-
Upload
independent -
Category
Documents
-
view
2 -
download
0
Transcript of The Influence of a Thin Electrolyte Layer on the Corrosion Process of Zinc in Chloride-Containing...
Corrosion Science, Vol. 33, No. 8~ pp. 1243-1252, 1992 0010-938X/92 $5.00 + 0.00 Printed in Great Britain. (~) 1992 Pergamon Press Ltd
T H E I N F L U E N C E O F A T H I N E L E C T R O L Y T E L A Y E R O N T H E C O R R O S I O N P R O C E S S O F Z I N C I N
C H L O R I D E - C O N T A I N I N G S O L U T I O N S
M. KEDDAM, A. HUGOT-LE-GOFF, H. TAKENOUTI, D. TH1ERRY* and M. C. AREVALOt
UPR 15 du CNRS, Physique des Liquides et Electrochimie, Universit6 P. et M. Curie, Tour 22, Place Jussieu, F-75252 Paris, France
* Swedish Corrosion Institute, Roslagsv/igen 101, Hus 25, S-104 05 Stockholm, Sweden t Department of Physical Chemistry, University of La Laguna, Tenerife, Spain
Abstract--The corrosion of zinc in a neutral chloride solution was investigated under a thin electrolyte layer by both electrochemical (complex impedance) and spectroscopic (FFIR and RAMAN) techniques. It was established that confinement of a thin electrolyte layer on top of the corroding zinc sample leads to a specific impedance distribution obeying the transmission line model of a porous electrode. After correcting for this effect, increase of the charge transfer resistance and shift of the corrosion potential in the cathodic direction are consistent with oxygen depletion when the layer thickness is reduced. Corrosion products are identified by comparison to FTIR spectra of reference compounds: zinc hydroxychloride, zinc hydroxycarbonate and zinc oxide. In agreement with the chemistry changes shown by the impedance data, confinement of the corroding area is found to promote the formation of hydroxycarbonate while only hydroxychloride is detected during corrosion in bulk conditions. No chloride-containing products are detected with thicknesses below 1 mm. In situ RAMAN spectra performed across the thin layer and a glass window confirmed totally these conclusions.
I N T R O D U C T I O N
MOST OF THE zinc used for corrosion protection in galvanized steels is covered by organic coatings, especially in the car industry. Many situations relevant to zinc corrosion alone or as a sacrificial anode take place in highly occluded situations produced by paint delamination, precipitation of corrosion products or both. An understanding of the physicochemical processes occurring under these conditions is of basic importance in any attempt to improve the efficiency of the protection.
This paper is aimed at contributing to this goal by combining in situ electrochemi- cal and spectroscopic techniques. The use of non-steady state electrochemical techniques in this particular cell geometry raises some serious difficulties in the separation of field distribution and kinetic contributions. Impedance methods are now well-suited for this purpose and have been used in this work together with FFIR and RAMAN spectroscopy.
E X P E R I M E N T A L M E T H O D
The electrochemical cell used the thin layer device that has been described in detail elsewhereJ It consists basically of two cylindrical halves made of an insulating material (polyvinyl difluoride). The bottom part embedding the working electrode is fixed whereas the upper part can be moved vertically so that the thickness of the thin electrolyte layer is known with an accuracy of about 10/~m. The reference electrode (Luggin Capillary and Saturated Calomel Electrode) and the counter electrode (large platinum
Manuscript received 30 September 1991; in amended form 25 October 1991.
1243
1244 M. KEDDAM et al.
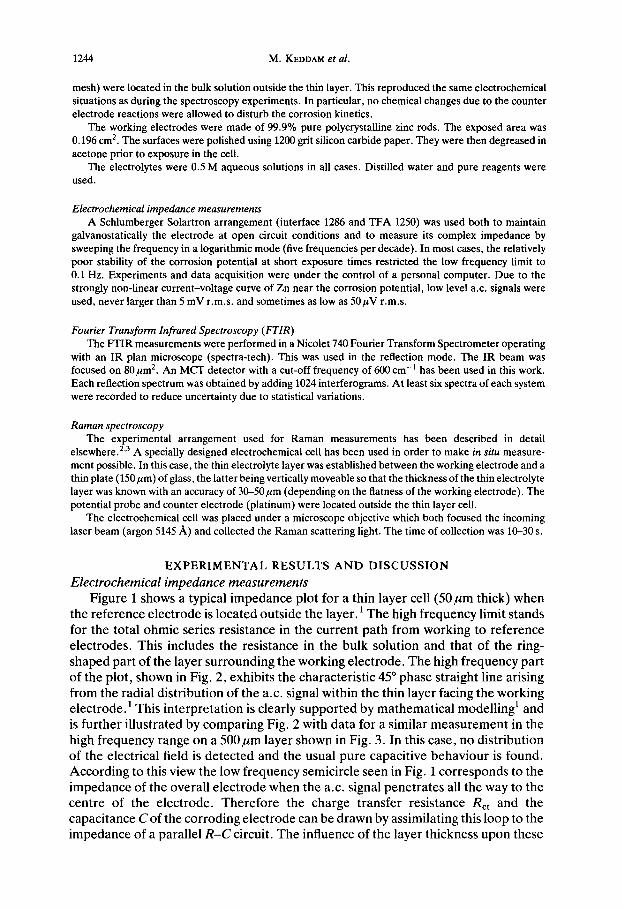
mesh) were located in the bulk solution outside the thin layer. This reproduced the same electrochemical situations as during the spectroscopy experiments. In particular, no chemical changes due to the counter electrode reactions were allowed to disturb the corrosion kinetics.
The working electrodes were made of 99.9% pure polycrystalline zinc rods. The exposed area was 0.196 cm z. The surfaces were polished using 1200 grit silicon carbide paper. They were then degreased in acetone prior to exposure in the cell.
The electrolytes were 0.5 M aqueous solutions in all cases. Distilled water and pure reagents were used.
Electrochemical impedance measurements A Schlumberger Solartron arrangement (interface 1286 and TFA 1250) was used both to maintain
galvanostatically the electrode at open circuit conditions and to measure its complex impedance by sweeping the frequency in a logarithmic mode (five frequencies per decade). In most cases, the relatively poor stability of the corrosion potential at short exposure times restricted the low frequency limit to 0.1 Hz. Experiments and data acquisition were under the control of a personal computer. Due to the strongly non-linear current-voltage curve of Zn near the corrosion potential, low level a.c. signals were used, never larger than 5 mV r.m.s, and sometimes as low as 50/zV r.m.s.
Fourier Transform Infrared Spectroscopy ( FTIR) The FTIR measurements were performed in a Nicolet 740 Fourier Transform Spectrometer operating
with an IR plan microscope (spectra-tech). This was used in the reflection mode. The IR beam was focused on 80/.tm 2. An MCT detector with a cut-off frequency of 600 cm- i has been used in this work. Each reflection spectrum was obtained by adding 1024 interferograms. At least six spectra of each system were recorded to reduce uncertainty due to statistical variations.
Raman spectroscopy The experimental arrangement used for Raman measurements has been described in detail
elsewhere. 2'3 A specially designed electrochemical cell has been used in order to make in situ measure- ment possible. In this case, the thin electrolyte layer was established between the working electrode and a thin plate (150/~m) of glass, the latter being vertically moveable so that the thickness of the thin electrolyte layer was known with an accuracy of 30-50/~m (depending on the flatness of the working electrode). The potential probe and counter electrode (platinum) were located outside the thin layer cell.
The electrochemical cell was placed under a microscope objective which both focused the incoming laser beam (argon 5145 ,~) and collected the Raman scattering light. The time of collection was 10-30 s.
E X P E R I M E N T A L R E S U L T S A N D D I S C U S S I O N
Electrochemical impedance measurements Figure 1 shows a typical impedance plot for a thin layer cell (50/~m thick) when
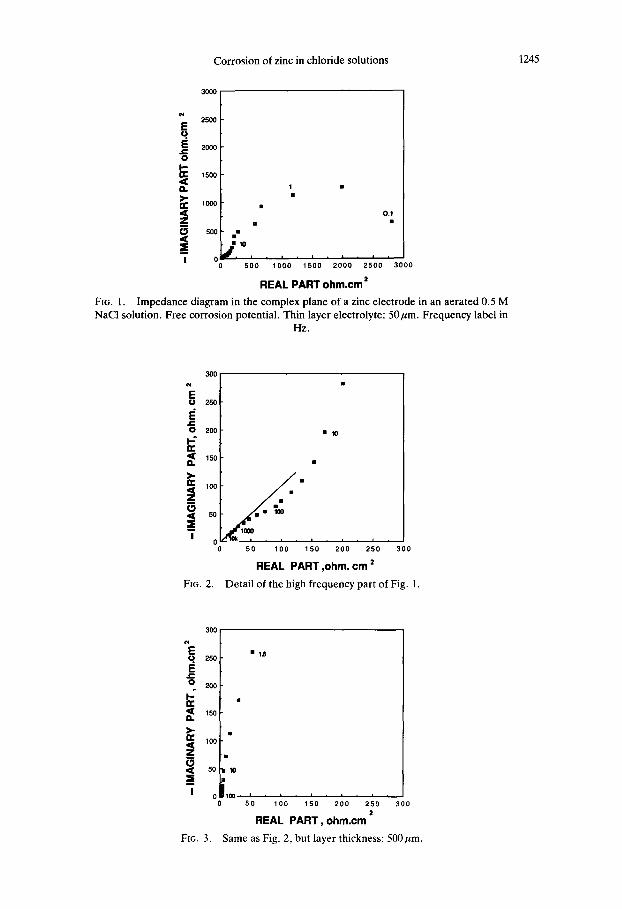
the reference electrode is located outside the layer. 1 The high frequency limit stands for the total ohmic series resistance in the current path from working to reference electrodes. This includes the resistance in the bulk solution and that of the ring- shaped part of the layer surrounding the working electrode. The high frequency part of the plot, shown in Fig. 2, exhibits the characteristic 45 ° phase straight line arising from the radial distribution of the a.c. signal within the thin layer facing the working electrode, t This interpretation is clearly supported by mathematical modelling I and is further illustrated by comparing Fig. 2 with data for a similar measurement in the high frequency range on a 500/~m layer shown in Fig. 3. In this case, no distribution of the electrical field is detected and the usual pure capacitive behaviour is found. According to this view the low frequency semicircle seen in Fig. 1 corresponds to the impedance of the overall electrode when the a.c. signal penetrates all the way to the centre of the electrode. Therefore the charge transfer resistance Rct and the capacitance C of the corroding electrode can be drawn by assimilating this loop to the impedance of a parallel R-C circuit. The influence of the layer thickness upon these
Corrosion of zinc in chloride solutions 1245
e,i 2 5 0 0
E q E 20o0 , -
0
E 1500
o. >- I Z : lOOO
_z O
I
111 •
Ii O.1
m m
500 i II
5 0 0 1 0 0 0 1500 2 0 0 0 2 5 0 0 3 0 0 0
2 REAL PART o h m . c m
FIG. 1. Impedance diagram in the complex plane of a zinc electrode in an aerated 0.5 M NaCl solution. Free corrosion potential• Thin layer electrolyte: 50/~m. Frequency label in
Hz.
E 2 oi
0 200
n- 150 ~
O.
> -
~ " lOO
z
~ 50
I 0
FIG. 2.
m 10
i I mm
, i , i , s , i ,
5o lOO 15o 200 25o 3oo
REAL PART ,ohm. c m 2
Detail of the high frequency part of Fig. 1.
3 0 0
q 25o E e,,
o 200
<: lSO
>- h,- 100 ,< z 0 ,¢[ 50
! 0
FXG. 3.
I ~ i , t , i . = • , .
50 100 150 2 0 0 250 3 0 0 2
REAL PART, o h m . c m
Same as Fig. 2, but layer thickness: 500~um.
1246 M. KEDDAM et al.
FxG. 4.
q E 6,,. 0
O C
N "N
C
0
U
3000
2000
1000
A
A
&
A A & A
& &
i i i i
-2 -1 0 1 2 3
Layer thickness, mm (Log)
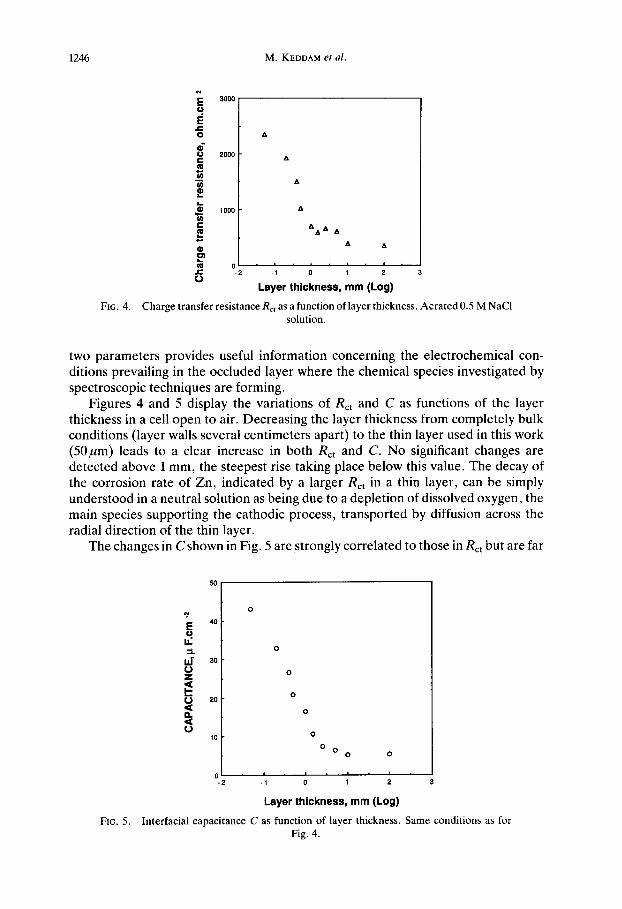
Charge transfer resistance Re, as a function of layer thickness. Aera ted 0.5 M NaCI solution.
two parameters provides useful information concerning the electrochemical con- ditions prevailing in the occluded layer where the chemical species investigated by spectroscopic techniques are forming.
Figures 4 and 5 display the variations of Rct and C as functions of the layer thickness in a cell open to air. Decreasing the layer thickness from completely bulk conditions (layer walls several centimeters apart) to the thin layer used in this work (50#m) leads to a clear increase in both Rct and C. No significant changes are detected above 1 mm, the steepest rise taking place below this value. The decay of the corrosion rate of Zn, indicated by a larger Rct in a thin layer, can be simply understood in a neutral solution as being due to a depletion of dissolved oxygen, the main species supporting the cathodic process, transported by diffusion across the radial direction of the thin layer.
The changes in C shown in Fig. 5 are strongly correlated to those in Rct but are far
FIc. 5.
50
E 40 q I.I. =L
3o 0
U O.
O
20
10
0 -2
0
0
0
0
o o 0 0
i i i A
-1 0 1 2
Layer thickness, mm (Log)
Interracial capacitance C as function of layer thickness. Same conditions as for Fig. 4.
Corrosion of zinc in chloride solutions 1247
FIG. 6.
d
E m
o 0 . r .
o
o
-1060
.1070
-1080
-1090
-11Q0
[ ]
ia nl [ ]
in [ ]
m
g
-1110 z I I I -2 "1 0 1 2
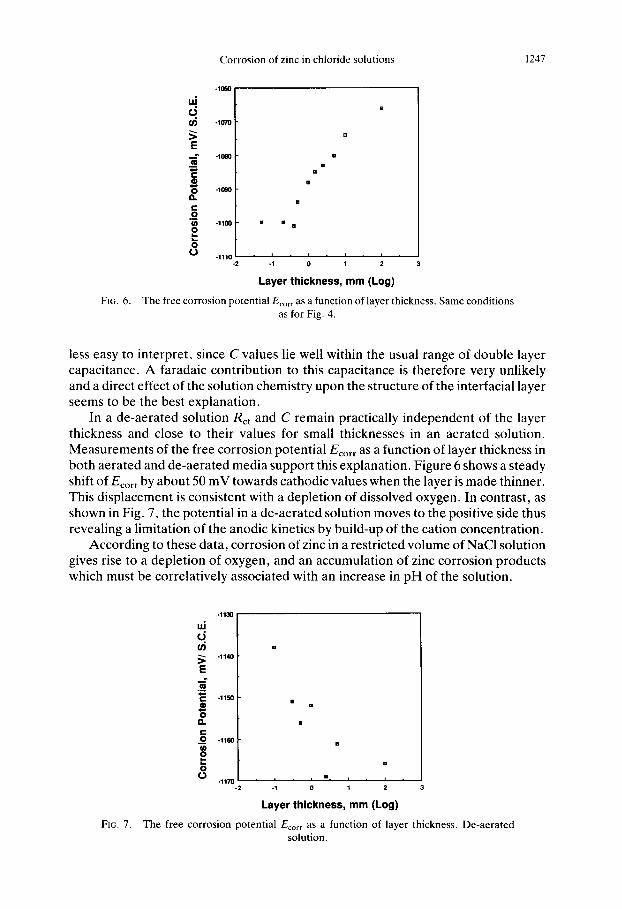
Layer thickness, mm (Log)
The free corrosion potential Ecorr as a function of layer thickness. Same conditions as for Fig. 4.
less easy to interpret, since C values lie well within the usual range of double layer capacitance. A faradaic contribution to this capacitance is therefore very unlikely and a direct effect of the solution chemistry upon the structure of the interfacial layer seems to be the best explanation.
In a de-aerated solution Rct and C remain practically independent of the layer thickness and close to their values for small thicknesses in an aerated solution. Measurements of the free corrosion potential Ecorr as a function of layer thickness in both aerated and de-aerated media support this explanation. Figure 6 shows a steady shift of Ecorr by about 50 mV towards cathodic values when the layer is made thinner. This displacement is consistent with a depletion of dissolved oxygen. In contrast, as shown in Fig. 7, the potential in a de-aerated solution moves to the positive side thus revealing a limitation of the anodic kinetics by build-up of the cation concentration.
According to these data, corrosion of zinc in a restricted volume of NaCI solution gives rise to a depletion of oxygen, and an accumulation of zinc corrosion products which must be correlatively associated with an increase in pH of the solution.
FIG. 7.
(n
E
. u .i.-, C
o n
0
o 0
-1130
-1140
-1150
-1160
II [ ]
-1170 I I -2 -1 0
[]
[ ]
I D I i
1 2
Layer thickness, mm (Log)
The free corrosion potential Ecorr as a function of layer thickness. De-aerated solution.
1248 M. KEDDAM et al.
FIG. 8.
c
4000 3000 2000 1500 1000 500
W A V E N U M B E R , c m -1
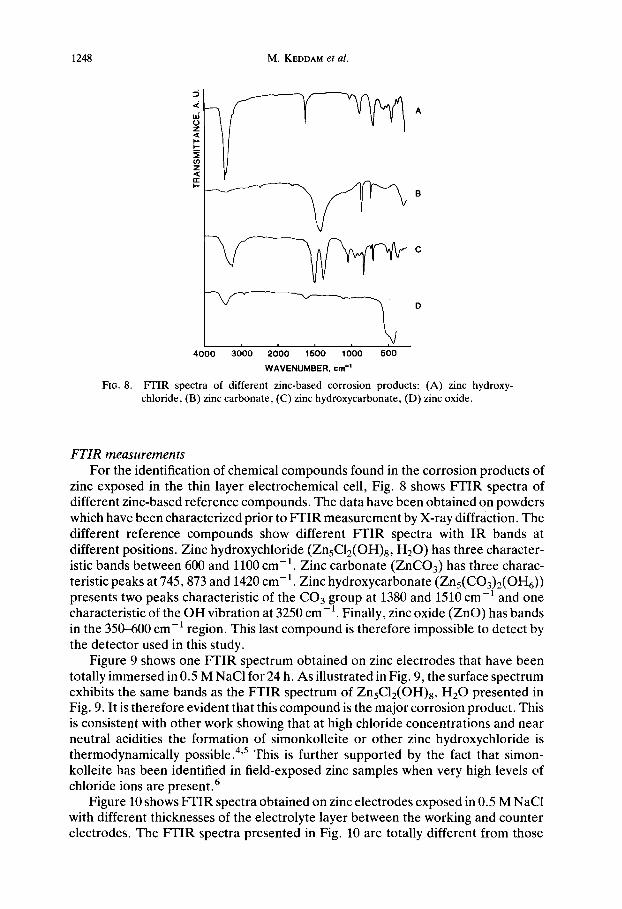
FTIR spectra of different zinc-based corrosion products: (A) zinc hydroxy- chloride, (B) zinc carbonate, (C) zinc hydroxycarbonate, (D) zinc oxide.
F T I R measurements
For the identification of chemical compounds found in the corrosion products of zinc exposed in the thin layer electrochemical cell, Fig. 8 shows FTIR spectra of different zinc-based reference compounds. The data have been obtained on powders which have been characterized prior to FTIR measurement by X-ray diffraction. The different reference compounds show different FFIR spectra with IR bands at different positions. Zinc hydroxychloride (ZnsCI2(OH)s, H20) has three character- istic bands between 600 and 1100 cm -l. Zinc carbonate (ZnCO3) has three charac- teristic peaks at 745,873 and 1420 cm -t. Zinc hydroxycarbonate (Zns(CO3)2(OH6)) presents two peaks characteristic of the CO3 group at 1380 and 1510 cm -i and one characteristic of the OH vibration at 3250 cm -1. Finally, zinc oxide (ZnO) has bands in the 350--600 cm -1 region. This last compound is therefore impossible to detect by the detector used in this study.
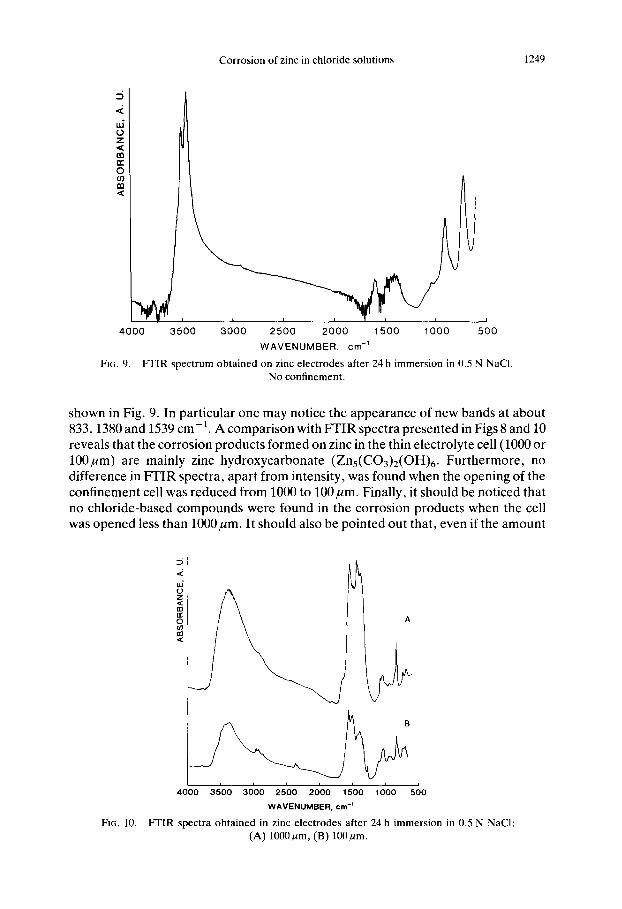
Figure 9 shows one F-FIR spectrum obtained on zinc electrodes that have been totally immersed in 0.5 M NaCI for 24 h. As illustrated in Fig. 9, the surface spectrum exhibits the same bands as the FTIR spectrum of ZnsCI2(OH)8, H20 presented in Fig. 9. It is therefore evident that this compound is the major corrosion product. This is consistent with other work showing that at high chloride concentrations and near neutral acidities the formation of simonkolleite or other zinc hydroxychloride is thermodynamically possible. 4'5 This is further supported by the fact that simon- kolleite has been identified in field-exposed zinc samples when very high levels of chloride ions are present. 6
Figure 10 shows FTIR spectra obtained on zinc electrodes exposed in 0.5 M NaCI with different thicknesses of the electrolyte layer between the working and counter electrodes. The FTIR spectra presented in Fig. 10 are totally different from those
Corrosion of zinc in chloride solutions 1249
o Z
n- O
m
4 0 0 0 3 5 0 0
FIG. 9.
\ I I
3 0 0 0 2 5 0 0 2 0 0 0 1 5 0 0 1000 500
W A V E N U M B E R , cm -1
FTIR spectrum obtained on zinc electrodes after 24 h immersion in 0.5 N NaCI. No confinement.
shown in Fig. 9. In particular one may notice the appearance of new bands at about 833, 1380 and 1539 cm -t . A comparison with FTIR spectra presented in Figs 8 and 10 reveals that the corrosion products formed on zinc in the thin electrolyte cell (1000 or 100/~m) are mainly zinc hydroxycarbonate (Zns(CO3)2(OH)6. Furthermore, no difference in F-FIR spectra, apart from intensity, was found when the opening of the confinement cell was reduced from 1000 to 100/~m. Finally, it should be noticed that no chloride-based compounds were found in the corrosion products when the cell was opened less than 1000/~m. It should also be pointed out that, even if the amount
Fro. 10.
ui t) Z <: co [I: O
<:
A
0' ' ' 4 0 0 0 3 5 0 0 3 0 0 0 2 5 0 0 2 0 0 1 5 0 0 1 0 0 0 5 0 0
WAVENUMBER, cm -1
FTIR spectra obtained in zinc electrodes after 24 h immersion in 0.5 N NaCI: (A) 1000ktm, (B) 100ktm.
1250 M. KEDDAM et al.
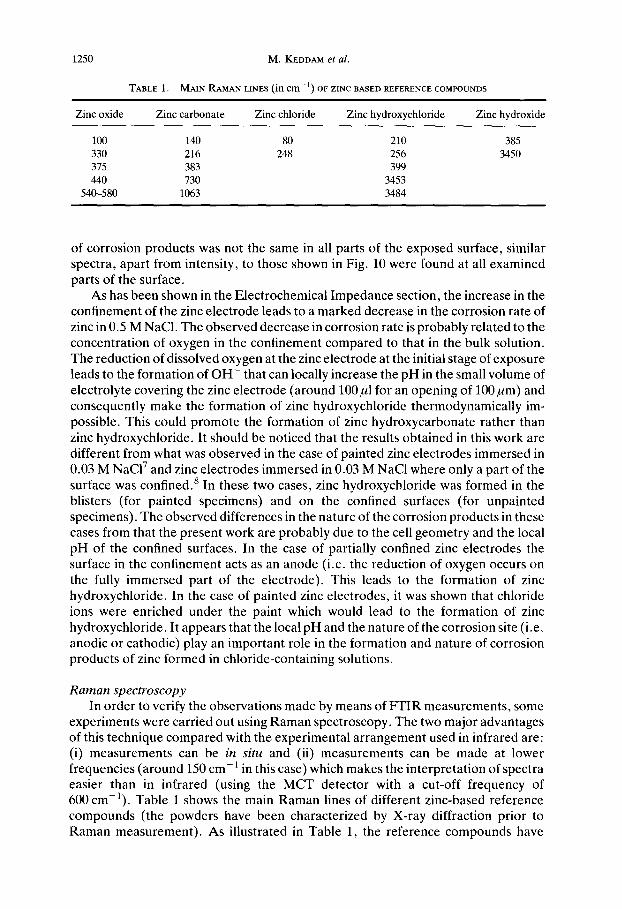
TABLE 1. MAIN RAMAN LINES (in c m - 1 ) OF ZINC BASED REFERENCE COMPOUNDS
Zinc oxide Zinc carbonate Zinc chloride Zinc hydroxychloride Zinc hydroxide
100 140 80 210 385 330 216 248 256 3450 375 383 399 440 730 3453
540-580 1063 3484
of corrosion products was not the same in all parts of the exposed surface, similar spectra, apart from intensity, to those shown in Fig. 10 were found at all examined parts of the surface.
As has been shown in the Electrochemical Impedance section, the increase in the confinement of the zinc electrode leads to a marked decrease in the corrosion rate of zinc in 0.5 M NaCI. The observed decrease in corrosion rate is probably related to the concentration of oxygen in the confinement compared to that in the bulk solution. The reduction of dissolved oxygen at the zinc electrode at the initial stage of exposure leads to the formation of O H - that can locally increase the pH in the small volume of electrolyte covering the zinc electrode (around 100/~1 for an opening of 100 ktm) and consequently make the formation of zinc hydroxychloride thermodynamically im- possible. This could promote the formation of zinc hydroxycarbonate rather than zinc hydroxychloride. It should be noticed that the results obtained in this work are different from what was observed in the case of painted zinc electrodes immersed in 0.03 M NaCi 7 and zinc electrodes immersed in 0.03 M NaC1 where only a part of the surface was confined, s In these two cases, zinc hydroxycbloride was formed in the blisters (for painted specimens) and on the confined surfaces (for unpainted specimens). The observed differences in the nature of the corrosion products in these cases from that the present work are probably due to the cell geometry and the local pH of the confined surfaces. In the case of partially confined zinc electrodes the surface in the confinement acts as an anode (i.e. the reduction of oxygen occurs on the fully immersed part of the electrode). This leads to the formation of zinc hydroxychloride. In the case of painted zinc electrodes, it was shown that chloride ions were enriched under the paint which would lead to the formation of zinc hydroxychloride. It appears that the local pH and the nature of the corrosion site (i.e. anodic or cathodic) play an important role in the formation and nature of corrosion products of zinc formed in chloride-containing solutions.
Raman spectroscopy In order to verify the observations made by means of FTIR measurements, some
experiments were carried out using Raman spectroscopy. The two major advantages of this technique compared with the experimental arrangement used in infrared are: (i) measurements can be in situ and (ii) measurements can be made at lower frequencies (around 150 cm- l in this case) which makes the interpretation of spectra easier than in infrared (using the MCT detector with a cut-off frequency of 600 cm-l ) . Table 1 shows the main Raman lines of different zinc-based reference compounds (the powders have been characterized by X-ray diffraction prior to Raman measurement). As illustrated in Table 1, the reference compounds have
Corrosion of zinc in chloride solutions 1251
Fro. 11.
i X SIT
Z
I
i i I I I I I I I
1200 1100 1000 900 800 600 500 400 300 200
WAVENUMBER, cm -~
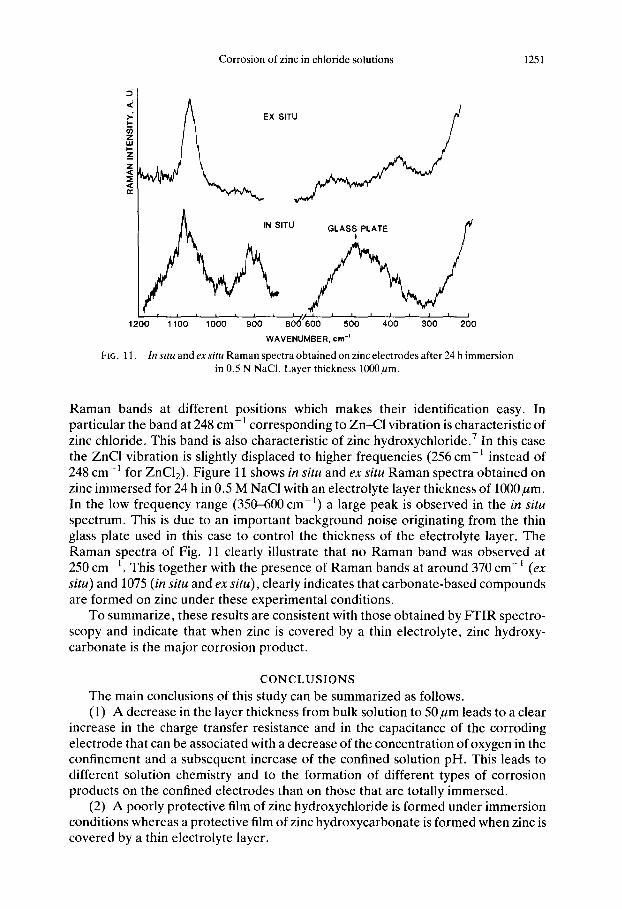
In situ and ex situ Raman spectra obtained on zinc electrodes after 24 h immersion in 0.5 N NaCI. Layer thickness 1000~m.
Raman bands at different positions which makes their identification easy. In particular the band at 248 cm -1 corresponding to Zn-C1 vibration is characteristic of zinc chloride. This band is also characteristic of zinc hydroxychloride. 7 In this case the ZnCI vibration is slightly displaced to higher frequencies (256 cm - I instead of 248 cm -1 for ZnCI2). Figure 11 shows in situ and ex situ Raman spectra obtained on zinc immersed for 24 h in 0.5 M NaC1 with an electrolyte layer thickness of 1000/~m. In the low frequency range (350-600 cm -1) a large peak is observed in the in situ spectrum. This is due to an important background noise originating from the thin glass plate used in this case to control the thickness of the electrolyte layer. The Raman spectra of Fig. 11 clearly illustrate that no Raman band was observed at 250 c m - ~. This together with the presence of Raman bands at around 370 c m - ~ (ex situ) and 1075 (in situ and ex situ), clearly indicates that carbonate-based compounds are formed on zinc under these experimental conditions.
To summarize, these results are consistent with those obtained by F T I R spectro- scopy and indicate that when zinc is covered by a thin electrolyte, zinc hydroxy- carbonate is the major corrosion product.
CONCLUSIONS The main conclusions of this study can be summarized as follows. (1) A decrease in the layer thickness from bulk solution to 5 0 # m leads to a clear
increase in the charge transfer resistance and in the capacitance of the corroding electrode that can be associated with a decrease of the concentration of oxygen in the confinement and a subsequent increase of the confined solution pH. This leads to different solution chemistry and to the formation of different types of corrosion products on the confined electrodes than on those that are totally immersed.
(2) A poorly protective film of zinc hydroxychloride is formed under immersion conditions whereas a protective film of zinc hydroxycarbonate is formed when zinc is covered by a thin electrolyte layer.

1252 M. KEDDAM et al.
R E F E R E N C E S 1. C. FIAUD, M. KEDDAM, A. KADRI and H. TAKENOUTI, Electrochim. Acta 32, 45-448 (1987). 2. D. THIERRY, D. PERSSON, C. LEYGRAF, D. DELICHERE, S. JOIRET, C. PALLOTA and A. HUGOT-LE-GOFF,
J. electrochem. Soc. 135,305 (1988). 3. D. THIERRY, D. PERSSON, C. LEYGRAF, N. BOUCHERIT and A. HUGOT-LE-GOFF, Corros. Sci. 32, 273
(1991). 4. W. FEITKNECHT, Chem. Ind. (September 1959). 5. T. E. GRAEDEL, J. electrochem. Soc. 136,193c (1989). 6. D. MASSXNON, D. DAUCHELLE and J. C. CHARBONNIER, Mere. Etud. Scien. Rev. Metall. 87,223 (1990). 7. D. THIERRY, D. MASSINON and A. HUGOT-LE-GOFF, J. electrochem. Soc. 138, 879 (1991). 8. M. C. BERNARD, A. HUGOT-LE-GOFF, D. MASSINON, N. PHILLIPS and D. THIERRY, in Proc. Electro-
chemical Methods in Corrosion Research, Helsinki (1991); Mater. Sci. Forum. Trans. Tech. Pub. (in press).