The impact of the COVID-19 outbreak on the Indian stock market
14
“The impact of the COVID-19 outbreak on the Indian stock market – A sectoral analysis” AUTHORS Rahul Kumar Prince Bhatia Deeksha Gupta ARTICLE INFO Rahul Kumar, Prince Bhatia and Deeksha Gupta (2021). The impact of the COVID-19 outbreak on the Indian stock market – A sectoral analysis. Investment Management and Financial Innovations, 18(3), 334-346. doi:10.21511/imfi.18(3).2021.28 DOI http://dx.doi.org/10.21511/imfi.18(3).2021.28 RELEASED ON Wednesday, 15 September 2021 RECEIVED ON Thursday, 10 June 2021 ACCEPTED ON Thursday, 09 September 2021 LICENSE This work is licensed under a Creative Commons Attribution 4.0 International License JOURNAL "Investment Management and Financial Innovations" ISSN PRINT 1810-4967 ISSN ONLINE 1812-9358 PUBLISHER LLC “Consulting Publishing Company “Business Perspectives” FOUNDER LLC “Consulting Publishing Company “Business Perspectives” NUMBER OF REFERENCES 43 NUMBER OF FIGURES 3 NUMBER OF TABLES 7 © The author(s) 2021. This publication is an open access article. businessperspectives.org
-
Upload
khangminh22 -
Category
Documents
-
view
1 -
download
0
Transcript of The impact of the COVID-19 outbreak on the Indian stock market

“The impact of the COVID-19 outbreak on the Indian stock market – A sectoralanalysis”
AUTHORS
Rahul Kumar
Prince Bhatia
Deeksha Gupta
ARTICLE INFO
Rahul Kumar, Prince Bhatia and Deeksha Gupta (2021). The impact of the
COVID-19 outbreak on the Indian stock market – A sectoral analysis. Investment
Management and Financial Innovations, 18(3), 334-346.
doi:10.21511/imfi.18(3).2021.28
DOI http://dx.doi.org/10.21511/imfi.18(3).2021.28
RELEASED ON Wednesday, 15 September 2021
RECEIVED ON Thursday, 10 June 2021
ACCEPTED ON Thursday, 09 September 2021
LICENSE
This work is licensed under a Creative Commons Attribution 4.0 International
License
JOURNAL "Investment Management and Financial Innovations"
ISSN PRINT 1810-4967
ISSN ONLINE 1812-9358
PUBLISHER LLC “Consulting Publishing Company “Business Perspectives”
FOUNDER LLC “Consulting Publishing Company “Business Perspectives”
NUMBER OF REFERENCES
43
NUMBER OF FIGURES
3
NUMBER OF TABLES
7
© The author(s) 2021. This publication is an open access article.
businessperspectives.org

334
Investment Management and Financial Innovations, Volume 18, Issue 3, 2021
http://dx.doi.org/10.21511/imfi.18(3).2021.28
Abstract
This paper aims to examine the impact of the COVID-19 outbreak on Indian firms listed on the NSE and analyze its impact on various sectors. In addition, a sub-sample analysis based on market capitalization was performed to understand the effect of size during extreme events. The sample consisted of 1,335 firms listed on the NSE India. A standard event study outlined by Brown and Warner (1985) was employed to analyze the price impact on the COVID-19 outbreak. The event windows from -10 days to +10 days were selected. The estimation window is 250 days. The Nifty 50 has been chosen as a proxy for market return. The sample firms witnessed a negative impact of the COVID-19 outbreak with a negative CAAR in different event windows. In addition, various sectors are classified according their responsiveness towards the COVID-19 outbreak into three groups: highly negatively affected, moderately negatively affected, and slightly negatively affected. The paper also points out that the pandemic substan-tially affects the above-median market capitalized firms than the below-median mar-ket capitalized firms, which contradicts the size effect phenomenon. The results assist shareholders in managing their portfolios and mitigate the systematic risk of their in-vestments during extreme events such as a pandemic, wars, and others. This study is the first comprehensive analysis of the impact of the COVID-19 outbreak on different sectors in India. It is also the first study to investigate the size effect anomalies during extreme events.
Rahul Kumar (India), Prince Bhatia (India), Deeksha Gupta (India)
The impact of the COVID-19
outbreak on the Indian
stock market – A sectoral
analysis
Received on: 10th of June, 2021Accepted on: 9th of September, 2021Published on: 15th of September, 2021
INTRODUCTION
The world is witnessing an unrecoverable loss due to the outbreak of the novel coronavirus, which has shuddered the entire world’s eco-nomic and social terrain. The consequences of the pandemic are dev-astating as millions of lives are falling into poverty, ventures are facing existential threats, the workforce is at risk of losing jobs, and society is undergoing a paradigm shift. The crisis and its impact are also re-flected in the stock market. Hence, the COVID-19 outbreak event is critical to examine stock price volatility.
Stock prices are the pertinent measure of a firm’s performance and return to stakeholders. The financial theories and theory of behavio-ral finance on the capital market suggest that stock price movement is the function of the market and firm-based factors. Any economic or environmental event has an impact on the investors’ perception, which in turn affects stock prices. According to Lee and Jiang (2002), investor optimism condenses the return volatility, whereas a pessimist attitude intensifies the earnings volatility. The COVID-19 pandemic is also fetching an impact on different industries and potentially de-stroying some of the industries around the world. Most industries are
© Rahul Kumar, Prince Bhatia, Deeksha Gupta, 2021
Rahul Kumar, MBA (FM) and Doctoral Student, Indian Institute of Management Ranchi, Suchana Bhawan, Audrey House Campus, India. (Corresponding author)
Prince Bhatia, CMA and Doctoral Student, Indian Institute of Management Ranchi, Suchana Bhawan, Audrey House Campus, India.
Deeksha Gupta, MBA (FM) and Doctoral Student, Indian Institute of Management Ranchi, Suchana Bhawan, Audrey House Campus, India.
This is an Open Access article, distributed under the terms of the Creative Commons Attribution 4.0 International license, which permits unrestricted re-use, distribution, and reproduction in any medium, provided the original work is properly cited.
www.businessperspectives.org
LLC “СPС “Business Perspectives” Hryhorii Skovoroda lane, 10, Sumy, 40022, Ukraine
BUSINESS PERSPECTIVES
JEL Classification G01, G10, G14, G32
Keywords event studies, price effect, India, extreme events, industry analysis, investor behavior
Conflict of interest statement:
Author(s) reported no conflict of interest

335
Investment Management and Financial Innovations, Volume 18, Issue 3, 2021
http://dx.doi.org/10.21511/imfi.18(3).2021.28
withering away due to the crises. At the same time, the situation has also provided an opportunity for various industries to flourish, such as manufacturing and logistics. According to the International Labour Organisation (ILO) report on various sectors, the pandemic has become a tight spot for the au-tomobile industry. The catastrophic crisis is also reflected in the intense volatility of the global financial market, where emerging markets have observed an outflow of $90 billion investment1. The capital mar-kets are the best indicators of the investor’s perception regarding future trends, and they can reflect on what lies ahead. Viewing the investors’ movement, the impact of outbreaks on stock prices portrays the sentiments of the investors.
The consequences of COVID-19 are not restricted to only selected domains but apparent in all spheres of society, which is anticipated to have a prolonged effect on the economy. However, the degree of the impact may vary from sector to sector and from country to country. In response to the slow economic activities, the stock markets around the world have reacted noticeably. The possible explanation for the reactions is attributed to government restrictions on mobilities and commercial activities, which have impacted the service sector (Baker et al., 2020). Adopting an event study approach, considering the lock-down announcement as an event, the study intends to examine the impact of the COVID-19 outbreak on stock prices of various Indian industries. Therefore, the stock prices of those industries that react to the pandemic of Novel Coronavirus (COVID-19) have been analyzed.
1 The impact of COVID-19 on capital markets | McKinsey.
1. LITERATURE REVIEW
The aberrant circumstances typically hit the cap-ital market by disturbing the investors’ sentiment, consequently affecting stock prices. Thus, it can be argued that the stock market reacts to major events. For instance, catastrophe (Kalra et al., 1993), calam-ities (Kowalewski & Śpiewanowski, 2020), sports (Buhagiar et al., 2018), tragic news (Nikkinen et al., 2008; Li, 2018), environmental issues (Alsaifi et al., 2020; Guo et al., 2020) and political events (Bash & Alsaifi, 2019; Shanaev & Ghimire, 2019). The stock market volatility has been studied extensively with reference to various major events. Aggarwal et al. (1999), in their study of volatility in emerging stock markets, examined various types of events such as local or global that lead to stock market volatility. They investigated the market reaction due to the re-turns in local currency and dollar-adjusted return during 1985–1995 and found significant volatility in the global stock markets. Another widely studied event in the literature is the terrorist activities and stock market reactions. Essaddam and Karagianis (2014) suggested that terrorism is a significant af-fair in explaining the volatility of stock returns. They investigated the American firms targeted by terrorist attacks and found that volatility increases on the day of the attack and persists for fifteen days following the attack. Similarly, Arin et al. (2008),
Aslam and Kang (2015), and Chaudhry et al. (2018) also found a significant association between terror-ist activities and volatility in stock markets. There is another global issue of oil price shock that has been observed to be reflected in the stock markets. For instance, Degiannakis et al. (2014) examine the effects of oil price shocks on stock market volatil-ity in Europe, where the supply and demand-side shocks do not impact volatility. However, stock market volatility is affected by changes in the oil price, which lead by aggregate demand shocks. On a similar line, Broadstock and Filis (2014) and Kang et al. (2015) also found a relationship between oil prices and stock market returns. Some of the stud-ies have analyzed that local or global political ac-tivities impact the different industries at a different rate. Thus, a diverse degree of reaction is observed in various industries. Kaplanski and Levy (2010) examined that aviation accidents impact stock pric-es and proved that unstable stock prices are more susceptible. Carter and Simkins (2004) also inves-tigated the repercussions of the September 11th in-cident on the stock price of the air-transport indus-try. Their finding suggests that the market reacted differently towards the large and small airlines due to the financial distress and impact on the cash re-serve of individual airline firms. Ragin and Halek (2016) studied 43 major disasters and their impact on stock returns of firms of the insurance indus-

336
Investment Management and Financial Innovations, Volume 18, Issue 3, 2021
http://dx.doi.org/10.21511/imfi.18(3).2021.28
try and observed abnormal returns on the day of the event. Other studies are based on the events such as financial crisis (Al Rjoub, 2009; Kontonikas et al., 2013); natural disasters (Worthington & Valadkhani, 2004; Wang & Kutan, 2013; Bourdeau-Brien & Kryzanowski, 2017), rare events like con-sumption disasters (Wachter, 2013), and others.
Research on stock market volatility has been gain-ing momentum since COVID-19 affected the world with its consequences. Although research already exists on past pandemics such as influen-za and SARS (Mei-Ping et al., 2018), Mctier et al. (2011), in their study of the US stock market and its volatility, saw a decrease in trade activities and returns due to the spread of flu.
Table 1 summarizes recent studies on the impact of the COVID-19 pandemic on stock markets around the world.
The purpose of the study is to analyze the associ-ation between the COVID-19 outbreak and stock market price volatility. The analysis is conducted
on Indian firms listed on the NSE, and also the impact of the COVID-19 outbreak on various sec-tors is investigated. The prime novelty of the paper is to examine the size effect during extreme events. Therefore, a sub-sample analysis based on market capitalization is performed.
An event-based methodology is extensively used in finance to study the market reactions to certain events. Therefore, in this paper, an event study method proposed by Fama et al. (1969) is used to study the impact of the pandemic on various in-dustries. The paper substantiates the stock mar-ket reaction based on the prevailing literature on the relationship between crises and stock price fluctuations.
2. DATA
Since the end of December 2019, news of the COVID-19 outbreak in Wuhan, China, circulated on an online platform. However, India saw an in-crease in the spread of COVID-19 in March 2020.
Table 1. Recent research on the impact of COVID-19 on stock markets
Authors Context Findings
Choi and Jung,
2021Korean stock market
The finding suggests that a rise in confirmed cases increases volatility of returns and negatively affects stock returnsThe result is substantiated by the observation of a further decrease in return during the second wave, mainly hitting the food & beverage sector
Onali, 2020 US stock market The study finds no evidence of the impact of COVID-19 on market returns
Baker et al., 2020 US stock market
The study concluded that the US stock market reacted forcefully to COVID-19The possible explanation is attributed to the government restrictions on commercial activity, mobility, and social distancing
He et al., 2020 Chinese stock market
(sectoral study)
The sectoral study concluded that all the sectors did not show an equal reactionThe transportation, mining, electricity & heating, and environment industries experienced the adverse impact of COVID-19Manufacturing, information technology, education, and healthcare industries did not show a significant reaction
Al-Awadhi et al., 2020
Chinese stock marketThe findings suggest that the increase in the number of daily confirmed cases and demises caused by COVID-19 has a significant and negative impact on stock returns
Ashraf, 2020 Global (64 countries)The rise in confirmed cases negatively responded to the stock market returnFurther investigation suggests that markets reacted more proactively to an increase in confirmed cases as compared to the growth in the number of deaths
Liu et al., 2020 Global The outcome of the pandemic considerably and directly affects stock markets globallyThe Asian countries have been impacted more and observed greater negative abnormal returns as compared to other countries
Verma et al., 2020 Indian stock market (NSE) The opposite result shows that the increase in the number of COVID cases does not significantly affect stock market returns
Singh et al., 2020 G-20 countriesThe result suggests that since the COVID-19 pandemic, stock markets around the world have shown a grave performance and negative returnsHowever, the stocks seem to recover gradually over a period of time
Topcu and Gulal, 2020
Emerging stock marketsThe results indicate a negative impact, but markets recovered graduallyAlso, the highest impact is observed in Asian markets and low in European emerging markets

337
Investment Management and Financial Innovations, Volume 18, Issue 3, 2021
http://dx.doi.org/10.21511/imfi.18(3).2021.28
Thus, this paper considers the announcement of lockdown in India by the government as the event day. The sample firms selected for the study are taken from the National Stock Exchange (NSE), where 1,949 companies are listed. The firms whose price data were unavailable or partially available during the study period were excluded. The final sample consists of 1,335 National Stock Exchange (NSE)-listed firms. The individual securities price data in daily frequency related to these firms were gathered from the Centre for Monitoring Indian Economy (CMIE) Prowess database for this study. Data is gathered for the time interval from January 2018 to December 2020. To capture market move-ments for the study, the Nifty 50 index was used. A holistic event study was conducted using all of the 1,335 firms. Further, industry wise event studies were conducted, where 19 major industries were chosen for study (more than 10 firms), namely tex-tile (64 firms), media (22 firms), financial services (128 firms), healthcare services (11 firms), drugs and pharma (65 firms), plastic (31 firms), banking (31 firms), metal (98 firms), agriculture (46 firms), automobile (67 firms), electrical goods (49 firms), chemical (109 firms), tourism (19 firms), trans-portation services (26 firms), computers (60 firms), FMCG (51 firms), paper (21 firms), construction (131 firms), and electricity (17 firms).
3. METHODOLOGY
To explore the effect of the COVID-19 outbreak on the Indian stock market, this paper applies an event study methodology. The event study meth-odology is used to capture the short-term price effect that occurred after a specific event. There are mainly three methods for calculating the ab-normal price effect, namely average adjusted re-turn rate method, market model, and market in-dex adjusted return rate models. Dyckman et al. (1984) investigated all the above three models and concluded that the OLS-based market mod-el gives improved results. Hence, the OLS market model is used for calculating the normal return. The event study methodology outlined by Brown and Warner (1985) was employed, which uses the market model method. To know the significance of the results, the parametric test, a cross-section-al t-test proposed by Brown and Warner (1980) is conducted.
Before conducting an event study, it is essential to determine the event window, event date, estima-tion period, and event of interest. The event stud-ied in this paper is the impact of the COVID-19 outbreak in India on the Indian stock market. A 250-day estimation window is considered, and the period starts from 260 days before the event day to 10 days before the event day. An event window of 21 days is used for the study. The event window comprises an event day, twenty days a pre-event day, and twenty days post-event day. The following are the steps for calculating the abnormal return.
Estimate the normal market return:
,it mt
ER Rα β= + (1)
where α and β are the intercept and slope coef-ficients obtained from the OLS regression, mt
R is the return of the Nifty 50 index on trading day .t
Estimate abnormal return: To calculate abnormal returns, the normal market return is deducted from the stock’s actual return on trading day .t The abnormal return is calculated as follows:
,it it it
AR R ER= − (2)
where itER is the normal market return, and it
R is the i actual stock return on trading day .t The following formula calculates the actual return:
1
ln ,itit
it
PR
P −
= (3)
where itR is the stock return for firm i on day t
and itP is the share price for day .t
Estimate the cumulative abnormal return (CAR): the CAR is calculated to know the total abnormal return observed during the event window. The formula to calculate CAR is:
( )
10
10, 10
10
,it
i
CAR AR− +=−
= ∑ (4)
Estimate the cumulative average abnormal return (CAAR): the CAAR is calculated to determine the time-series aggregation observed during the event window. The formula to calculate CAR is:
1
,p
p it
i
CAAR AAR=
=∑ (5)
338
Investment Management and Financial Innovations, Volume 18, Issue 3, 2021
http://dx.doi.org/10.21511/imfi.18(3).2021.28
where p is the number of days used to cumulate the average abnormal return. it
AAR is an average abnormal return. The formula to calculate average abnormal return (AAR) is:
1
1.
N
t it
i
AAR ARN =
= ∑ (6)
4. EMPIRICAL RESULTS
AND FINDINGS
4.1. Impact of COVID-19
on the NSE-listed firms
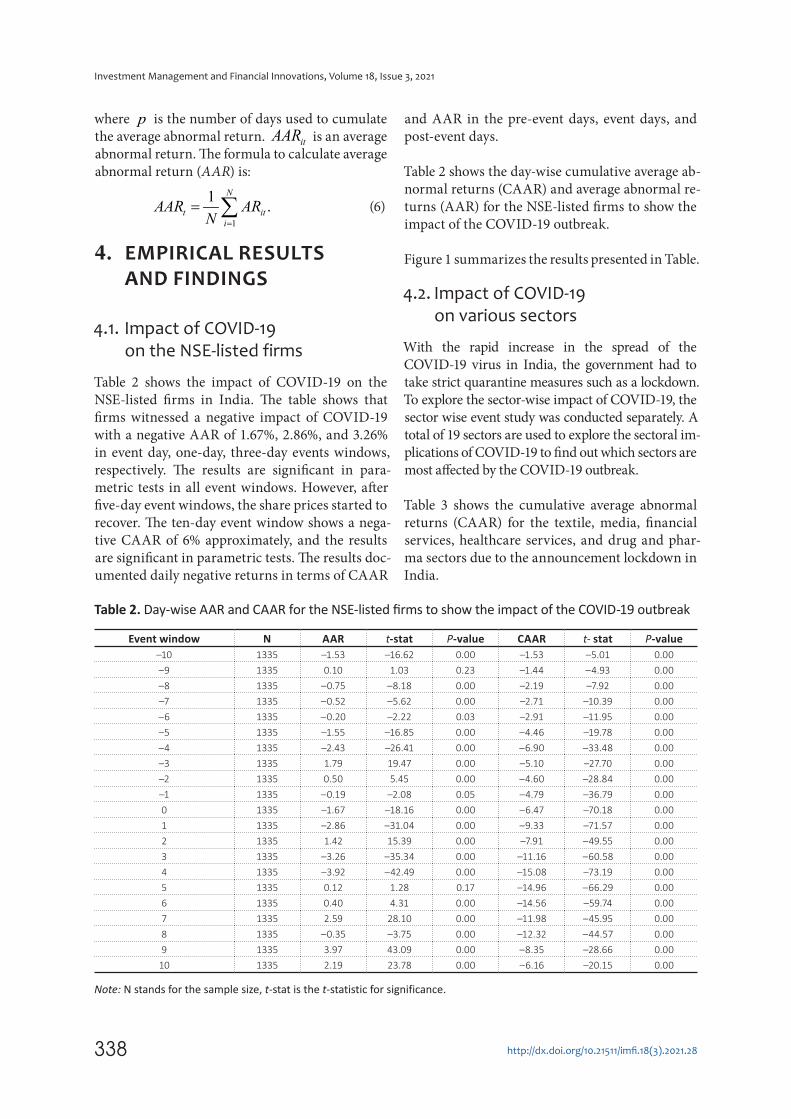
Table 2 shows the impact of COVID-19 on the NSE-listed firms in India. The table shows that firms witnessed a negative impact of COVID-19 with a negative AAR of 1.67%, 2.86%, and 3.26% in event day, one-day, three-day events windows, respectively. The results are significant in para-metric tests in all event windows. However, after five-day event windows, the share prices started to recover. The ten-day event window shows a nega-tive CAAR of 6% approximately, and the results are significant in parametric tests. The results doc-umented daily negative returns in terms of CAAR
and AAR in the pre-event days, event days, and post-event days.
Table 2 shows the day-wise cumulative average ab-normal returns (CAAR) and average abnormal re-turns (AAR) for the NSE-listed firms to show the impact of the COVID-19 outbreak.
Figure 1 summarizes the results presented in Table.
4.2. Impact of COVID-19
on various sectors
With the rapid increase in the spread of the COVID-19 virus in India, the government had to take strict quarantine measures such as a lockdown. To explore the sector-wise impact of COVID-19, the sector wise event study was conducted separately. A total of 19 sectors are used to explore the sectoral im-plications of COVID-19 to find out which sectors are most affected by the COVID-19 outbreak.
Table 3 shows the cumulative average abnormal returns (CAAR) for the textile, media, financial services, healthcare services, and drug and phar-ma sectors due to the announcement lockdown in India.
Table 2. Day-wise AAR and CAAR for the NSE-listed firms to show the impact of the COVID-19 outbreak
Event window N AAR t-stat P-value CAAR t- stat P-value
–10 1335 –1.53 –16.62 0.00 –1.53 –5.01 0.00–9 1335 0.10 1.03 0.23 –1.44 –4.93 0.00–8 1335 –0.75 –8.18 0.00 –2.19 –7.92 0.00–7 1335 –0.52 –5.62 0.00 –2.71 –10.39 0.00–6 1335 –0.20 –2.22 0.03 –2.91 –11.95 0.00–5 1335 –1.55 –16.85 0.00 –4.46 –19.78 0.00–4 1335 –2.43 –26.41 0.00 –6.90 –33.48 0.00–3 1335 1.79 19.47 0.00 –5.10 –27.70 0.00–2 1335 0.50 5.45 0.00 –4.60 –28.84 0.00–1 1335 –0.19 –2.08 0.05 –4.79 –36.79 0.000 1335 –1.67 –18.16 0.00 –6.47 –70.18 0.001 1335 –2.86 –31.04 0.00 –9.33 –71.57 0.002 1335 1.42 15.39 0.00 –7.91 –49.55 0.003 1335 –3.26 –35.34 0.00 –11.16 –60.58 0.004 1335 –3.92 –42.49 0.00 –15.08 –73.19 0.005 1335 0.12 1.28 0.17 –14.96 –66.29 0.006 1335 0.40 4.31 0.00 –14.56 –59.74 0.007 1335 2.59 28.10 0.00 –11.98 –45.95 0.008 1335 –0.35 –3.75 0.00 –12.32 –44.57 0.009 1335 3.97 43.09 0.00 –8.35 –28.66 0.00
10 1335 2.19 23.78 0.00 –6.16 –20.15 0.00
Note: N stands for the sample size, t-stat is the t-statistic for significance.

339
Investment Management and Financial Innovations, Volume 18, Issue 3, 2021
http://dx.doi.org/10.21511/imfi.18(3).2021.28
It can be observed from Table 3 that financial services are the most affected sectors with more than 10% negative CAAR in post-event windows. Moreover, textile and healthcare services have seen the moderate impact of COVID-19 with a negative CAAR of less than 10% but more than 5% in the post-event day window. However, the drug & pharma, and media sectors have seen a low im-pact with less than 5% of the negative CAAR dur-ing the post-event period.
Table 4 shows the cumulative average abnormal returns (CAAR) for plastic, banking, metal, agri-culture, and automobile sectors on the announce-ment lockdown in India.
It can be observed from Table 4 that all the sec-tors are highly affected by the COVID-19 outbreak with a negative CAAR of more than 10%. The re-sults are significant, and in the post-event period, sectors have seen more than 15% negative abnor-mal returns. The metal sector was worst affected as it has experienced a negative CAAR of more than 18% in the post-event windows.
Table 5 shows the cumulative average abnormal returns (CAAR) for electrical goods, chemical, tourism, transportation services, and comput-ers industries on the announcement lockdown in India.
Figure 1. Day-wise AAR and CAAR for the NSE-listed firms to show the impact of the COVID-19 outbreak
-20
-15
-10
-5
0
5
-15 -10 -5 0 5 10 15
CA
AR
/AA
R
Event windows
CAAR AAR
Table 3. CAAR for the textile, media, financial services, healthcare services, and drug & pharma sectors to show the impact of the COVID-19 outbreak in different event windows
Event windowTextile Media Financial services
N CAAR t-stats N CAAR t-stats N CAAR t-stats
(–5,0) 64 –1.57 –1.54 22 –4.95 –2.70 128 –6.21 –8.07(–1,0) 64 –0.73 –1.23 22 –2.88 –2.72 128 –3.48 –7.83(–1,1) 64 –4.02 –5.58 22 –3.81 –2.94 128 –7.14 –13.12(0,1) 64 –3.69 –6.27 22 –1.55 –1.46 128 –5.80 –13.06(0,5) 64 –9.45 –9.28 22 –4.59 –2.50 128 –12.21 –15.86
Event windowHealthcare services Drug and Pharma
N CAAR t-stats N CAAR t-stats
(–5,0) 11 –10.34 –4.96 65 –1.96 –1.76(–1,0) 11 –5.93 –4.93 65 –1.29 –2.01(–1,1) 11 –7.20 –4.88 65 –2.23 –2.85(0,1) 11 –4.33 –3.60 65 –1.31 –2.04(0,5) 11 –9.14 –4.39 65 –3.02 –2.73
Note: N stands for the sample size, t-stats is the t-statistic for significance.

340
Investment Management and Financial Innovations, Volume 18, Issue 3, 2021
http://dx.doi.org/10.21511/imfi.18(3).2021.28
It can be observed from Table 5 that the electri-cal goods and transportation sectors have wit-nessed the highest negative impact of COVID-19 with a negative CAAR of more than 10% in the post-event period. Hence, these sectors are sig-nificantly affected by COVID-19. To a certain extent, the chemical, computer & its accessories and tourism sectors were also moderately nega-tively impacted by COVID-19 with a CAAR of more than 5% but less than 10% in post-event windows.
Table 6 shows the cumulative average abnormal returns (CAAR) for FMCG, paper, construction, and electricity sectors on the announcement lock-down in India.
It can be observed from Table 6 that the con-struction sector has seen the highest impact of COVID-19 with a negative CAAR of more than 10%. Besides the construction sector, FMCG, pa-per, and the electricity sector have also seen nega-tive CAAR of more than 5% but less than 10% in post-event windows.
Figure 2 assists in the discussion about the impact of COVID-19 on different sectors. It depicts the impact of COVID -19 on various sectors using CAAR in a ten-day event window. The sector-spe-cific price effect on the event of the COVID-19 outbreak can be classified into three groups: high-ly negatively affected sectors, moderately negative-ly affected sectors, and low affected sectors.
Table 4. CAAR for the plastic, banking, metal, agriculture, and automobile sectors to show the impact of the COVID-19 outbreak in different event windows
Event windowPlastic Banking Metal
N CAAR t-stats N CAAR t-stats N CAAR t-stats
(–5,0) 31 1.39 1.00 31 22.02 15.61 98 0.04 0.05(–1,0) 31 0.21 0.27 31 6.99 8.58 98 –0.70 –1.43(–1,1) 31 –4.82 –4.93 31 –0.73 –0.73 98 –4.52 –7.46(0,1) 31 –6.44 –8.07 31 –6.04 –7.42 98 –5.18 –10.47(0,5) 31 –12.53 –9.07 31 –15.69 –11.12 98 –16.26 –18.98
Event windowAgriculture Automobile
N CAAR t-stats N CAAR t-stats
(–5,0) 46 –6.24 –5.43 67 –6.37 –7.02(–1,0) 46 –3.52 –5.30 67 –2.84 –5.43(–1,1) 46 –5.64 –6.95 67 –5.06 –7.89(0,1) 46 –4.78 –7.22 67 –4.22 –8.05(0,5) 46 –10.96 –9.54 67 –10.64 –11.72
Note: N stands for the sample size, t-stat is the t-statistic for significance.
Table 5. CAAR for the electrical goods, chemical, tourism, transportation services, and computers sectors to show the impact of the COVID-19 outbreak in different event windows
Event windowElectrical goods Chemical Tourism
N CAAR t-stats N CAAR t-stats N CAAR t-stats
(–5,0) 49 –4.01 –3.67 109 –5.27 –7.84 19 –11.73 –6.25(–1,0) 49 –3.47 –5.50 109 –1.77 –4.56 19 –6.31 –5.82(–1,1) 49 –5.81 –7.52 109 –3.14 –6.61 19 –7.41 –5.58(0,1) 49 –5.66 –8.99 109 –3.34 –8.61 19 –5.17 –4.77(0,5) 49 –12.31 –11.28 109 –8.87 –13.21 19 –8.21 –4.37
Event windowTransportation services Computers
N CAAR t-stats N CAAR t-stats
(–5,0) 26 –6.15 –3.71 60 –12.38 –10.29(–1,0) 26 –1.72 –1.79 60 –4.44 –6.40(–1,1) 26 –6.56 –5.59 60 –5.93 –6.97(0,1) 26 –5.75 –6.01 60 –4.78 –6.88(0,5) 26 –11.87 –7.16 60 –7.39 –6.14
Note: N stands for the sample size, t-stat is the t-statistic for significance.

341
Investment Management and Financial Innovations, Volume 18, Issue 3, 2021
http://dx.doi.org/10.21511/imfi.18(3).2021.28
The highly negatively affected sectors are financial services, metal, plastic, banking, automobile, elec-trical goods, transportation services, agriculture, and construction sectors. These sectors witnessed the highest negative impact of COVID-19 with a negative CAAR of more than 10% post-event win-dows. The prime sector impacted by COVID-19 restrictions during the lockdown period was transportation services. Therefore, the shares of transportation services companies show a nega-tive return in every event window. The share pric-es of the metal and mining sectors continued to decline as the metal and mining sector is heavi-ly dependent on transportation and logistics sec-
tors. The financial services sector’s share prices drop significantly because of high liquidity pres-sure and the Franklin Templeton fiasco, which triggered the panic selling in debt instruments. At the same time, construction sectors that require significant labor resources were impacted because of the shortage of labor force as labor migrated to their homeland. Hence, share prices declined in the sectors mentioned above.
The moderately negatively affected sectors are tex-tile, chemical, healthcare services, tourism, pa-per, computer and related accessories, electricity, Fast Moving Consumer Goods (FMCG) sectors.
Table 6. CAAR for the FMCG, paper, construction, and electricity sectors to show the impact of the COVID-19 outbreak in different event windows
Event windowFMCG Paper Construction
N CAAR t-stats N CAAR t-stats N CAAR t-stats
(–5,0) 51 –5.11 –4.59 21 0.83 0.42 131 –0.93 –1.34(–1,0) 51 –1.73 –2.69 21 –0.02 –0.02 131 –0.68 –1.70(–1,1) 51 –3.39 –4.31 21 –2.88 –2.07 131 –4.37 –8.93(0,1) 51 –2.80 –4.36 21 –3.49 –3.07 131 –4.95 –12.39(0,5) 51 –6.26 –5.62 21 –8.07 –4.10 131 –13.29 –19.22
Event windowElectricity
N CAAR t-stats
(–5,0) 17 –4.12 –2.23(–1,0) 17 –0.82 –0.77(–1,1) 17 –1.67 –1.28(0,1) 17 –2.61 –2.44(0,5) 17 –6.65 –3.60
Note: N stands for the sample size, t-stat is the t-statistic for significance.
Figure 2. Impact of COVID-19 on different sectors
-18,00 -16,00 -14,00 -12,00 -10,00 -8,00 -6,00 -4,00 -2,00 0,00
Metal
Banking
Construction
Plastic
Electrical Goods
Financial Services
Transportation Services
Agriculture
Automobile
Textile
Healthcare Services
Chemical
Tourism
Paper
Computers
Electricity
FMCG
Media
Drug and Pharma
CAAR
Industries

342
Investment Management and Financial Innovations, Volume 18, Issue 3, 2021
http://dx.doi.org/10.21511/imfi.18(3).2021.28
These sectors witnessed the moderate negative impact of COVID-19 with a negative CAAR be-tween 5% to 10% in post-event windows. India took quarantine measures such as lockdown to restrain against the spread of the virus on the eve of the COVID-19 outbreak. The migrant work-ers returned to their homeland, which created a scarcity of labor forces, resulting in reduced op-erations of factories in various sectors such as plastic, chemicals, and textiles. However, these sectors get opportunities to produce masks, san-itizers, personal protective equipment (PPE) kits, face shields, and others that were incentivized by the government of India. Hence, these opportuni-ties lower the impact of the COVID-19 outbreak on the sectors as mentioned above. The pandem-ic also had a significant effect on the agricultural sectors because of the shortage of labor forces and rural investment, which immediately reflected in the share prices of the concerned sector. The outbreak of COVID-19 moderately affected the electrical goods and FMCG sectors. These sectors faced a demand decline, which resulted in lower sales, and hence, the price of shares declined im-mediately after quarantine measures were taken by the government of India.
The slightly negatively affected sectors are media and drug & pharma. These sectors witnessed a neg-ative CAAR of less than 5% in post-event windows. Despite the overall crackdown of the stock market on the outbreak of COVID-19 in India, some sec-tors have shown slightly negative abnormal returns against the trend showing strong resistance against the pandemic. COVID-19 created an opportunity for the drug and pharma sectors. With the increase in patients, the sales continue to grow, translating into share prices in multiple event windows. In the media sector, there is a less negative price effect as there is no impact on print or electronic media, and no quarantine measures are applied to them. They worked as usual. Thus, advertising revenues for media houses have not declined.
4.3.Further study
Companies with different sizes have different abil-ities to retrain the external shocks. Companies with different sizes often have an asymmetry in their price reactions (Gaunt et al., 2000). Banz (1981) provides evidence that small market capi-talization firms have more abnormal returns than high market capitalization firms due to the size ef-
Table 7. Day wise CAAR for both above-median and below-median market capitalization firms on the COVID-19 outbreak in different event windows
Event windowBelow median Above median
N CAAR t-stat P-value N CAAR t-stat P-value
–10 666 –1.95 –3.91 0.00 666 –1.10 –3.09 0.00–9 666 –1.94 –4.08 0.00 666 –0.90 –2.66 0.01–8 666 –3.18 –7.05 0.00 666 –1.19 –3.71 0.00–7 666 –3.92 –9.22 0.00 666 –1.51 –4.98 0.00–6 666 –3.81 –9.59 0.00 666 –2.02 –7.11 0.00–5 666 –4.85 –13.19 0.00 666 –4.08 –15.53 0.00–4 666 –7.50 –22.33 0.00 666 –6.29 –26.21 0.00–3 666 –5.50 –18.31 0.00 666 –4.70 –21.89 0.00–2 666 –4.60 –17.70 0.00 666 –4.59 –24.68 0.00–1 666 –4.41 –20.79 0.00 666 –5.18 –34.13 0.000 666 –5.45 –36.31 0.00 666 –7.49 –69.84 0.001 666 –9.08 –42.74 0.00 666 –9.58 –63.14 0.002 666 –6.11 –23.50 0.00 666 –9.73 –52.37 0.003 666 –9.70 –32.30 0.00 666 –12.67 –59.04 0.004 666 –14.40 –42.89 0.00 666 –15.81 –65.87 0.005 666 –14.60 –39.70 0.00 666 –15.36 –58.45 0.006 666 –14.08 –35.44 0.00 666 –15.06 –53.05 0.007 666 –11.08 –26.09 0.00 666 –12.86 –42.38 0.008 666 –11.36 –25.21 0.00 666 –13.29 –41.28 0.009 666 –6.24 –13.15 0.00 666 –10.45 –30.78 0.00
10 666 –2.95 –5.93 0.00 666 –9.38 –26.35 0.00
Note: N stands for the sample size, t-stat is the t-statistic for significance.

343
Investment Management and Financial Innovations, Volume 18, Issue 3, 2021
http://dx.doi.org/10.21511/imfi.18(3).2021.28
fect phenomenon. To investigate this mechanism in the COVID-19 scenario, a sub-sample study based on market capitalization was conducted. The samples are divided based on the median of the market capitalization into the above-median and below-median companies.
Table 7 shows the cumulative average abnormal returns (CAAR) for both above-median and be-low-median market capitalization firms on India’s announcement lockdown.
Table 7 shows that during the COVID-19 out-break, abnormal returns of above-median market capitalized firms were significantly negative and showed a greater decline in share prices, while below-median market capitalized firms showed
a comparatively lower negative price reactions. The results contradict the size effect phenomenon as larger firms have more institutional owner-ship. With the COVID-19 outbreak and Franklin Templeton’s fiasco, institutional investors started to liquidate their position, which created panic selling in the capital market. Therefore, firms ob-served a higher negative impact on larger firms af-ter the COVID-19 outbreak due to liquidity pres-sures. The situation mentioned above confirms that the COVID-19 outbreak has a significant impact on the above-median market capitalized firms, which indicates that higher-sized firms are more prone to shocks or crash risks. Figure 3 com-pares the impact of COVID-19 on the above and below median market capitalization firms using CAAR in post-event windows.
CONCLUSION
The study shows that NSE-listed firms negatively responded to the COVID-19 outbreak, with more than 6% negative CAAR in 10-day event windows. Next, the price response of various sectors to the outbreak of the pandemic is analyzed. The highly negatively affected sectors have experienced a negative abnor-mal return of more than 10% in 10-day event windows, including financial services, metal, automobile, transportation services, construction sectors, and rest. In addition, moderately negatively affected sec-tors have seen negative CAAR of 5% to 10% in the 10-day event window, including electricity, textile, plastic, chemical, Fast Moving Consumer Goods (FMCG) sectors, and others. However, few sectors are slightly negatively affected with a negative abnormal return of less than 5% in 10-day event windows, and these sectors are media and drug & pharma sectors. Also, the findings revealed that the Covid-19 outbreak impacted larger firms more negatively than smaller firms in each event window, which is con-trary to the findings of prior literature.
Figure 3. Day wise CAAR for both above-median and below-median market capitalization firms on the COVID-19 outbreak in different event windows
-18,00
-16,00
-14,00
-12,00
-10,00
-8,00
-6,00
-4,00
-2,00
0,00
-15 -10 -5 0 5 10 15
CA
AR
Event Windows
Below Median Above Median

344
Investment Management and Financial Innovations, Volume 18, Issue 3, 2021
http://dx.doi.org/10.21511/imfi.18(3).2021.28
To a large extent, the stock market reflects the economic condition of a large number of companies, whereas the capital market represents a complete state of a country’s economy. Therefore, any fluctua-tion in economic activities can be analyzed through the movement of the stock market. In India, about 43 percent of the stock market participants are retail investors, which sets India apart from other emerg-ing markets. Hence, this study better reflects investor behavior during extreme events. Thus, the study contributes to the literature on extreme events and investor behavior with some practical implications.
This study also improves understanding of the response of various industries to the pandemic. Furthermore, since the size of a firm acts as a substantial determinant in absorbing the impact of ex-treme events, this study also helps us understand the impact of the pandemic on firms with varying sizes.
The conclusions drawn in the paper help to understand the stocks’ responses to extreme events in the context of emerging countries. The results show the role of information in influencing the stock market in emerging countries such as India. From a practical perspective, the finding suggests that portfolio managers should consider a proper mix of low and high beta stocks with an appropriate mix of sectors. The study has shown that smaller stocks are less impacted by panic selling after extreme events. Hence, it would be prudent for portfolio managers to give due consideration to smaller stocks. These suggestions would help maximize returns and protect investment from capital erosion in extreme events.
AUTHOR CONTRIBUTIONS
Conceptualization: Rahul Kumar, Prince Bhatia, Deeksha Gupta.Data curation: Rahul Kumar, Prince Bhatia, Deeksha Gupta.Formal analysis: Rahul Kumar, Prince Bhatia, Deeksha Gupta.Investigation: Rahul Kumar, Prince Bhatia, Deeksha Gupta.Methodology: Rahul Kumar, Deeksha Gupta.Project administration: Rahul Kumar.Software: Rahul Kumar, Prince Bhatia, Deeksha Gupta.Supervision: Rahul Kumar.Validation: Rahul Kumar, Prince Bhatia, Deeksha Gupta.Writing – original draft: Rahul Kumar, Prince Bhatia, Deeksha Gupta.Writing – review & editing: Rahul Kumar, Deeksha Gupta.
REFERENCES
1. Aggarwal, R., Inclan, C., & Leal, R. (1999). Volatility in emerging stock markets. Journal of Financial and Quantitative Analysis, 33-55. https://www.cambridge.org/core/journals/journal-of-financial-and-quantitative-analysis/article/abs/volatility-in-emerging-stock-markets/F5D16CFDA7A152F-6FD28912D9857148B
2. Al-Rjoub, S. A. (2009). Business cycles, financial crises, and stock volatility in Jordan stock exchange. Financial Crises, and Stock Volatility in Jordan Stock Exchange (August 25, 2009).
3. Al-Awadhi, A. M., Alsaifi, K., Al-Awadhi, A., & Alhammadi,
S. (2020). Death and contagious infectious diseases: Impact of the COVID-19 virus on stock market returns. Journal of Behavioral and Experimental Finance, 27, 100326.
4. Alsaifi, K., Elnahass, M., & Salama, A. (2020). Market responses to firms’ voluntary carbon disclosure: Empirical evidence from the United Kingdom. Journal of Cleaner Production, 262, 121377. https://doi.org/10.1016/j.jclepro.2020.121377
5. Arin, K. P., Ciferri, D., & Spagnolo, N. (2008). The price of terror: The effects of terrorism on stock market
returns and volatility. Economics Letters, 101(3), 164-167.
6. Ashraf, B. N. (2020). Stock markets’ reaction to COVID-19: Cases or fatalities?. Research in International Business and Finance, 54, 101249. https://doi.org/10.1016/j.ribaf.2020.101249
7. Aslam, F., & Kang, H. G. (2015). How different terrorist attacks affect stock markets. Defence and Peace Economics, 26(6), 634-648. https://econpa-pers.repec.org/scripts/redir.pf?u=https%3A%2F%2Fdoi.org%2F10.1080%252F10242694.2013.832555;h=repec:taf:defpea:v:26:y:2015:i:6:p:634-648

345
Investment Management and Financial Innovations, Volume 18, Issue 3, 2021
http://dx.doi.org/10.21511/imfi.18(3).2021.28
8. Baker, S. R., Bloom, N., Davis, S. J., Kost, K. J., Sammon, M. C., & Viratyosin, T. (2020). The unprecedented stock market impact of COVID-19 (No. w26945). National Bureau of Economic Research.
9. Banz, R. W. (1981). The relationship between return and market value of common stocks. Journal of Financial Economics, 9(1), 3-18. https://doi.org/10.1016/0304-405X(81)90018-0
10. Bash, A., & Alsaifi, K. (2019). Fear from uncertainty: An event study of Khashoggi and stock market returns. Journal of Behavioral and Experimental Finance, 23, 54-58.
11. Bourdeau-Brien, M., & Kry-zanowski, L. (2017). The impact of natural disasters on the stock returns and volatilities of local firms. The Quarterly Review of Economics and Finance, 63, 259-270. https://doi.org/10.1016/j.qref.2016.05.003
12. Broadstock, D. C., & Filis, G. (2014). Oil price shocks and stock market returns: New evidence from the United States and China. Journal of International Financial Markets, Institutions and Money, 33, 417-433. https://doi.org/10.1016/j.intfin.2014.09.007
13. Brown, S. J., & Warner, J. B. (1980). Measuring security price performance. Journal of Financial Economics, 8(3), 205-258. https://doi.org/10.1016/0304-405X(80)90002-1
14. Brown, S. J., & Warner, J. B. (1985). Using daily stock returns: The case of event studies. Journal of Financial Economics, 14(1), 3-31. https://doi.org/10.1016/0304-405X(85)90042-X
15. Buhagiar, R., Cortis, D., & Newall, P. W. (2018). Why do some soccer bettors lose more money than others?. Journal of Behavioral and Experimental Finance, 18, 85-93. http://dx.doi.org/10.1016/j.jbef.2018.01.010
16. Carter, D. A., & Simkins, B. J. (2004). The market’s reaction to unexpected, catastrophic events: the case of airline stock
returns and the September 11th attacks. The Quarterly Review of Economics and Finance, 44(4), 539-558.
17. Chaudhry, N., Roubaud, D., Akhter, W., & Shahbaz, M. (2018). Impact of terrorism on stock markets: Empirical evidence from the SAARC region. Finance Research Letters, 26, 230-234. https://doi.org/10.1016/j.frl.2018.02.024
18. Chen, M. P., Lee, C. C., Lin, Y. H., & Chen, W. Y. (2018). Did the SARS epidemic weaken the integration of Asian stock markets? Evidence from smooth time-varying cointegration analysis. Economic research-Ekonomska istraživanja, 31(1), 908-926. https://doi.org/10.1080/1331677X.2018.1456354
19. Choi, C., & Jung, H. (2021). COVID-19’s impacts on the Korean stock market. Applied Economics Letters, 1-5. https://doi.org/10.1080/13504851.2021.1904099
20. Degiannakis, S., Filis, G., & Kizys, R. (2014). The effects of oil price shocks on stock market volatility: Evidence from European data. The Energy Journal, 35(1).
21. Essaddam, N., & Karagianis, J. M. (2014). Terrorism, country attributes, and the volatility of stock returns. Research in International Business and Finance, 31, 87-100. https://ideas.repec.org/a/eee/riibaf/v31y-2014icp87-100.html
22. Francis, F. S., & Ambilikumar, D. V. (2021). Impact of Covid-19 cases on Global Stock Market. Journal of Contemporary Issues in Business and Government, 27(3), 898-917. https://www.statista.com/top-ics/6170/impact-of-covid-19-on-the-global-financial-markets/
23. Gaunt, C., Gray, P., & McIvor, J. (2000). The impact of share price on seasonality and size anomalies in Australian equity returns. Accounting & Finance, 40(1), 33-50. https://doi.org/10.1111/1467-629X.00034
24. Guo, M., Kuai, Y., & Liu, X. (2020). Stock market response to
environmental policies: Evidence from heavily polluting firms in China. Economic Modelling, 86, 306-316. https://doi.org/10.1016/j.econmod.2019.09.028
25. He, P., Sun, Y., Zhang, Y., & Li, T. (2020). COVID–19’s impact on stock prices across different sectors – An event study based on the Chinese stock market. Emerging Markets Finance and Trade, 56(10), 2198-2212. https://doi.org/10.1080/1540496X.2020.1785865
26. Kalra, R., Henderson Jr, G. V., & Raines, G. A. (1993). Effects of the Chernobyl nuclear accident on utility share prices. Quarterly Journal of Business and Economics, 52-77.
27. Kang, W., Ratti, R. A., & Yoon, K. H. (2015). The impact of oil price shocks on the stock market return and volatility relationship. Journal of International Financial Markets, Institutions and Money, 34, 41-54. https://doi.org/10.1016/j.in-tfin.2014.11.002
28. Kaplanski, G., & Levy, H. (2010). Sentiment and stock prices: The case of aviation disasters. Journal of Financial Economics, 95(2), 174-201. https://papers.ssrn.com/sol3/papers.cfm?abstract_id=1084533
29. Kontonikas, A., MacDonald, R., & Saggu, A. (2013). Stock market reaction to fed funds rate surprises: State dependence and the financial crisis. Journal of Banking & Finance, 37(11), 4025-4037. https://doi.org/10.1016/j.jbankfin.2013.06.010
30. Kowalewski, O., & Śpiewanowski, P. (2020). Stock market response to potash mine disasters. Journal of Commodity Markets, 20, 100124.
31. Lee, W. Y., Jiang, C. X., & Indro, D. C. (2002). Stock market volatility, excess returns, and the role of investor sentiment. Journal of Banking & Finance, 26(12), 2277-2299. https://doi.org/10.1016/S0378-4266(01)00202-3
32. Li, K. (2018). Reaction to news in the Chinese stock market: A study on Xiong’an New Area Strategy. Journal of Behavioral and Experimental Finance, 19, 36-38. https://doi.org/10.1016/j.jbef.2018.03.004

346
Investment Management and Financial Innovations, Volume 18, Issue 3, 2021
http://dx.doi.org/10.21511/imfi.18(3).2021.28
33. Liu, H., Manzoor, A., Wang, C., Zhang, L., & Manzoor, Z. (2020). The COVID-19 outbreak and affected countries stock markets response. International Journal of Environmental Research and Public Health, 17(8), 2800. https://doi.org/10.3390/ijerph17082800
34. McTier, B. C., Tse, Y., & Wald, J. K. (2013). Do stock markets catch the flu?. Journal of Financial and Quantitative Analysis, 979-1000.
35. Nikkinen, J., Omran, M. M., Sahlström, P., & Äijö, J. (2008). Stock returns and volatility following the September 11 attacks: Evidence from 53 equity markets. International Review of Financial Analysis, 17(1), 27-46. https://doi.org/10.1016/j.irfa.2006.12.002
36. Ragin, M. A., & Halek, M. (2016). Market expectations following catastrophes: An examination of
insurance broker returns. Journal
of Risk and Insurance, 83(4), 849-876.
37. Shanaev, S., & Ghimire, B. (2019). Is all politics local? Regional political risk in Russia and the panel of stock returns. Journal
of Behavioral and Experimental
Finance, 21, 70-82.
38. Singh, B., Dhall, R., Narang, S., & Rawat, S. (2020). The Outbreak of COVID-19 and Stock Market Responses: An Event Study and Panel Data Analysis for G-20 Countries. Global Business Review, 0972150920957274. https://doi.org /10.1177%2F0972150920957274
39. Topcu, M., & Gulal, O. S. (2020). The impact of COVID-19 on emerging stock markets. Finance
Research Letters, 36, 101691. https://doi.org/10.1016/j.frl.2020.101691
40. Verma, D., & Sinha, P. K. (2020). Has COVID-19 Infected Indian Stock Market Volatility? Evidence from NSE. AAYAM: AKGIM Journal of Management, 10(1), 25-35.
41. Wachter, J. A. (2013). Can time-varying risk of rare disasters explain aggregate stock market volatility?. The Journal of Finance, 68(3), 987-1035. https://doi.org/10.3386/w14386
42. Wang, L., & Kutan, A. M. (2013). The impact of natural disasters on stock markets: Evidence from Japan and the US. Comparative Economic Studies, 55(4), 672-686.
43. Worthington*, A., & Valadkhani, A. (2004). Measuring the impact of natural disasters on capital markets: an empirical application using intervention analysis. Applied
Economics, 36(19), 2177-2186. https://doi.org/10.1080/0003684042000282489