The impact of resuspension on sediment mercury dynamics, and methylmercury production and fate: A...
16
The impact of resuspension on sediment mercury dynamics, and methylmercury production and fate: A mesocosm study Eun-Hee Kim a , Robert P. Mason a, ⁎ , Elka T. Porter b , Heather L. Soulen b a Department of Marine Sciences, University of Connecticut, Groton, CT 06340, USA b Chesapeake Biological Laboratory, University of Maryland, Center for Environmental Science (UMCES), P.O. Box 38, Solomons, MD 20688, USA Received 30 January 2006; received in revised form 18 May 2006; accepted 30 May 2006 Available online 7 July 2006 Abstract The objective of this study was to investigate the effects of resuspension on the fate and bioaccumulation of mercury (THg) and methylmercury (MeHg) in shallow estuarine environments, using mesocosms. Two 4-week experiments were conducted in July (Experiment 1) and October (Experiment 2) of 2001 with Baltimore Harbor sediments. Hard clams, Mercenaria mercenaria, were introduced into sediments for Experiment 2. Tidal resuspension (4 h on and 2 h off cycles) was simulated, with 3 replicate tanks for each treatment—resuspension (R) and non-resuspension (NR). Sediment cores were collected during the experiments for THg, MeHg, organic content and AVS analyses, and for the determination of methylation/demethylation using Hg stable isotopes ( 199 Hg(II) and CH 3 199 Hg(II)). Zooplankton samples were collected once a week while clams were taken before and after Experiment 2 for THg and MeHg analyses. Our results suggest that the interplay between Hg methylation and MeHg degradation determines the overall MeHg pool in sediments. Sediment resuspension does not appear to directly impact the Hg transformations but can lead to changes in the association to Hg binding phases, influencing Hg methylation. The bioaccumulation results indicate that sediment resuspension can play an important role in transferring sediment MeHg into organisms. © 2006 Elsevier B.V. All rights reserved. Keywords: Mercury; Methylmercury; Mercury stable isotopes; Bioaccumulation; Sediment resuspension 1. Introduction Sediments are the main repository of mercury (Hg) in estuaries (Benoit et al., 1998; Wang et al., 1998) and can be a significant source to the overlying water column via various processes including diffusion, resuspension, and bioturbation (Gagnon et al., 1997; Bloom et al., 1999; Mason and Lawrence, 1999; Mason et al., in press). The mobility and bioavailability of Hg and methylmercury (MeHg) depends upon the nature and concentration of the binding phases in the sediment, which are controlled by sediment redox status. Hg associates primarily with parti- culate organic matter or iron/manganese oxides through adsorption and coprecipitation reactions in oxidized sedi- ments (Gagnon et al., 1997), with organic matter typically being the overriding controlling solid phase (Miller, 2006). In anoxic sediments, Hg is adsorbed onto and coprecipitated with sulfide minerals (Gobeil and Cossa, 1993; Gagnon et al., 1997; Wang et al., 1998). When Marine Chemistry 102 (2006) 300 – 315 www.elsevier.com/locate/marchem ⁎ Corresponding author. Tel.: +1 860 405 9129; fax: +1 860 405 9153. E-mail address: [email protected] (R.P. Mason). 0304-4203/$ - see front matter © 2006 Elsevier B.V. All rights reserved. doi:10.1016/j.marchem.2006.05.006
-
Upload
independent -
Category
Documents
-
view
3 -
download
0
Transcript of The impact of resuspension on sediment mercury dynamics, and methylmercury production and fate: A...

(2006) 300–315www.elsevier.com/locate/marchem
Marine Chemistry 102
The impact of resuspension on sediment mercury dynamics, andmethylmercury production and fate: A mesocosm study
Eun-Hee Kim a, Robert P. Mason a,⁎, Elka T. Porter b, Heather L. Soulen b
a Department of Marine Sciences, University of Connecticut, Groton, CT 06340, USAb Chesapeake Biological Laboratory, University of Maryland, Center for Environmental Science (UMCES),
P.O. Box 38, Solomons, MD 20688, USA
Received 30 January 2006; received in revised form 18 May 2006; accepted 30 May 2006Available online 7 July 2006
Abstract
The objective of this study was to investigate the effects of resuspension on the fate and bioaccumulation of mercury (THg) andmethylmercury (MeHg) in shallow estuarine environments, using mesocosms. Two 4-week experiments were conducted in July(Experiment 1) and October (Experiment 2) of 2001 with Baltimore Harbor sediments. Hard clams, Mercenaria mercenaria, wereintroduced into sediments for Experiment 2. Tidal resuspension (4 h on and 2 h off cycles) was simulated, with 3 replicate tanks foreach treatment—resuspension (R) and non-resuspension (NR). Sediment cores were collected during the experiments for THg,MeHg, organic content andAVS analyses, and for the determination of methylation/demethylation usingHg stable isotopes (199Hg(II)and CH3
199Hg(II)). Zooplankton samples were collected once a week while clams were taken before and after Experiment 2 for THgand MeHg analyses. Our results suggest that the interplay between Hg methylation and MeHg degradation determines the overallMeHg pool in sediments. Sediment resuspension does not appear to directly impact the Hg transformations but can lead to changes inthe association to Hg binding phases, influencing Hg methylation. The bioaccumulation results indicate that sediment resuspensioncan play an important role in transferring sediment MeHg into organisms.© 2006 Elsevier B.V. All rights reserved.
Keywords: Mercury; Methylmercury; Mercury stable isotopes; Bioaccumulation; Sediment resuspension
1. Introduction
Sediments are the main repository of mercury (Hg) inestuaries (Benoit et al., 1998; Wang et al., 1998) and canbe a significant source to the overlying water column viavarious processes including diffusion, resuspension, andbioturbation (Gagnon et al., 1997; Bloom et al., 1999;
⁎ Corresponding author. Tel.: +1 860 405 9129; fax: +1 860 4059153.
E-mail address: [email protected] (R.P. Mason).
0304-4203/$ - see front matter © 2006 Elsevier B.V. All rights reserved.doi:10.1016/j.marchem.2006.05.006
Mason and Lawrence, 1999; Mason et al., in press). Themobility and bioavailability of Hg and methylmercury(MeHg) depends upon the nature and concentration of thebinding phases in the sediment, which are controlled bysediment redox status. Hg associates primarily with parti-culate organic matter or iron/manganese oxides throughadsorption and coprecipitation reactions in oxidized sedi-ments (Gagnon et al., 1997), with organic matter typicallybeing the overriding controlling solid phase (Miller,2006). In anoxic sediments, Hg is adsorbed onto andcoprecipitated with sulfide minerals (Gobeil and Cossa,1993; Gagnon et al., 1997; Wang et al., 1998). When

301E.-H. Kim et al. / Marine Chemistry 102 (2006) 300–315
metal oxides are reduced, Hg can potentially be releasedinto porewater (and eventually to overlying water viadiffusion). Hg can also be released as a result of themicrobial degradation of organic matter and by chemicaldissolution of sulfides due to redox changes duringdiagenesis.
Under anoxic conditions, dissolved sulfide mayprecipitatewith Fe2+ ions, which are released by reductionof iron (hydr)oxides. Iron sulfide can then adsorb andcoprecipitate with divalent metals. Many toxic metals,and especially Hg (Miller, 2006) can form highlyinsoluble sulfide minerals and adsorb/coprecipitate withpyrite and acid volatile sulfide (AVS), making them lessbioavailable to aquatic organisms (Allen, 1995). Cooperand Morse (1996) concluded that sulfide-associated tracemetals could becomemore bioavailable following amajoroxidation event, such as that caused by dredging,resuspension, and seasonal migration of the redoxcline.During such an oxidation event, metal sulfides may beoxidized and thereby could release the dissolvedmetals tothe overlying water, and thus be a potential source of Hgand other toxic metals to the water column, therebypossibly increasing bioavailability. The released metalcould, however, quickly be scavenged or coprecipitatedwith iron and manganese hydroxides or be complexed byorganic matter (Simpson et al., 1998).
As mentioned above, sediment resuspension is oneprocess that can induce a change in sediment redoxstatus, which can be an important factor determining therate of methylation of Hg in sediments. Hg methylationdepends upon environmental factors that control theoverall metabolic activity of the methylating organisms(e.g. sulfate reducing bacteria) and the bioavailability ofHg in the matrix where methylation occurs. As thesupply of organic carbon enhances Hg methylation rate(Choi and Bartha, 1994), the distribution of methylationactivity depends upon the distribution of biodegradableorganic matter. In coastal systems, sulfate limitation doesnot occur. Thus, maximal methylation rates are oftenobserved in biologically active surface sediments nearthe sediment–water interface (Korthals and Winfrey,1987; Benoit et al., 2003; Heyes et al., in press) when thesupply of organic matter is high and where the redoxchanges discussed above are likely to be occurring.
While sulfate can stimulate both sulfate reduction andHg methylation by sulfate reducing bacteria at relativelylow sulfate concentrations (Gilmour and Henry, 1991),the higher concentrations of sulfate typically found inestuarine and marine environments can lead to enhancedporewater dissolved sulfide, which has been shown toinhibit Hg methylation (Compeau and Bartha, 1983;Compeau and Bartha, 1987; Gilmour et al., 1998; Benoit
et al., 1998). Porewater sulfide levels in estuarinesediments depend not only on the rate of sulfate reduction,and the processes of sulfide oxidation, but also on the ironlevels, which dictate the degree of sulfide removal to thesolid phase.
Sunderland et al. (2004) found different patterns forMeHg and Hg methylation between two contrastingphysical regions: well-mixed sediments (from Passama-quoddy Bay, a semi-enclosed macrotidal estuary at themouth of the Bay of Fundy) and unmixed sediments (fromthe St. Croix River, the mouth of a freshwater tributary).MeHg production, measured using Hg stable isotopes,was observed throughout the 15 cm active surface layer ofthe well-mixed sediments. In contrast, in the unmixedsediments, MeHg concentration and production was ob-served in a narrowly constrained subsurface layer (2–4 cmsediment). Similar results were observed in the estuarineturbidity maximum (ETM) region of the Hudson RiverEstuary in that Hg methylation (assayed using Hg stableisotopes) was occurring throughout the upper 25 cm sedi-ment layer (Heyes et al., 2004).
The techniques for the measurement of Hg methyla-tion and MeHg demethylation rates, and the associatedrate constants, have been improved by the use of stableHgisotopes combined with Inductively Coupled Plasma-Mass Spectrometer (ICP-MS), as an isotope-specific de-tector. Advantages over conventional radioactive isotopeprocedures, used by others (Korthals and Winfrey, 1987;Gilmour and Riedel, 1995; Stordal and Gill, 1995; Hineset al., 2000; Marvin-DiPasquale et al., 2000), are thatstable isotopes can be spiked at concentrations near am-bient levels of Hg andMeHg due to the high sensitivity ofICP-MS. This results in Hg bioavailability to themethylating organisms being similar to ambient levelsand avoids any artifacts associated with the addition ofexcess Hg (Heyes et al., in press). Additionally, differentstable isotopes can be simultaneously added into the samesamples for assaying both Hg methylation and MeHgdemethylation (Hintelmann andEvans, 1997;Hintelmannet al., 2000; Lambertsson et al., 2001; Sunderland et al.,2004; Heyes et al., 2004, in press).
Although sedimentary dynamics and bioavailability ofHg have been actively studied, there are few studies thathave investigated how resuspension affects the fate andbioavailability of Hg in the sediment, its net methylation,and the possible release of Hg and MeHg to the watercolumn. Additionally, most previous studies were con-ducted on a small scale and/or for a short duration.Therefore, the objective of this study was to investigatethe effects of tidal sediment resuspension over a 4-weekperiod on the fate of total mercury (THg) and MeHg andtheir bioaccumulation, using the new STORM (high

302 E.-H. Kim et al. / Marine Chemistry 102 (2006) 300–315
bottom Shear realistic water column Turbulence Resus-pension Mesocosms) 1 m3 tank facility that we designedand developed (Porter, 1999; Porter et al., 2004a).
The STORMsystem can simulate both realistic bottomshear stress andwater column turbulence levels in a singlesystem, mimicking benthic–pelagic coupling processesrealistically, including tidal or episodic sediment resus-pension, over long time periods. Two 4-week experimentswere conducted in 2001: one in July without clams(Experiment 1) and the other in October with hard clams,Mercenaria mercenaria (Experiment 2). Hard clams werechosen because they are suspension feeders, are commonin the eastern coastal and estuarine regions of USA(Stanley, 1985) and there is little information on Hg(especiallyMeHg) bioaccumulation into these organisms.This paper discusses the effects of sediment resuspensionon the sedimentary dynamics of THg and MeHg, theirfate, transport and bioaccumulation. A companion paper(Kim et al., 2004) discussed the impact of sedimentresuspension on water column THg andMeHg dynamics.
2. Material and methods
2.1. Mesocosm and experimental set-up
Muddy sediment fromBaltimore Harbor was collectedin the spring of 2001 and transferred to a fiberglass hol-ding tank at CBL and prepared for each experiment follo-wing techniques developed in Porter (1999) and Porteret al. (2004b). The details of the experimental set-up aredescribed in Kim et al. (2004). Briefly, the sediment wastransferred into 6 cylindrical STORM tanks (1 m2 ofsurface area and 1 m deep) after defaunation. The sedi-ment was thoroughly mixed and flattened. Filtered am-bient water from the mouth of the Patuxent River (atributary of the Chesapeake Bay, Maryland, USA) wasadded into the tanks without any disturbance of the sedi-ment layer to a depth of 20 cm above the sediment surface.After a 2-week sediment equilibration period, to re-esta-blish realistic porewater gradients (Porter, 1999), unfil-tered ambient water was added to the tanks (as “seedwater”). There were 3 resuspension (R) tanks (T1, T2, andT3) and 3 non-resuspension (NR) tanks (T4, T5, and T6)for each experiment. In both systems, water columnturbulence intensities were similar. However, high instan-taneous bottom shear, which induced sediment resuspen-sion in the R systems, was induced using a specific paddledesign, whereas bottom shear velocity was low in the NRsystems (Crawford and Sanford, 2001; Porter et al.,2004a). Tidal resuspension (4 h-on and 2 h-off cycles) wasmaintained over the 4-week period. After Experiment 1,the sediment was transferred back to the holding tank and
stored until Experiment 2. Then, the sediment was re-distributed into the mesocosm tanks, mixed, and flattenedfor Experiment 2, as described above.
As mentioned earlier, in Experiment 2, a scaled popu-lation of about 50–40 mm long hard clams were placedinto the sediment individually by hand after the sedimentequilibration period. Five clams were also placed in aplastic basket hanging at 50 cm below the water surfacenear the wall of each tank (so-called “suspended clams”).Since the clams buried themselves in the sediment and itwas not possible to observe them (especially in the Rtanks due to turbidity), these suspended clams in the watercolumn helped confirm whether or not the clams werefeeding. Given that some negative effects (i.e. inhibitionof feeding rate, burrowing, growth and survival of juve-niles and adults) can occur to clams exposed to salinitiesbelow 15 (Grizzle et al., 2001 and references therein),salinity adjustment was necessary in Experiment 2. Theaverage salinity for all the tanks was approximately 19throughout the experiment period. The salinity of theinput water (Patuxent River water) was around 13.
2.2. Sample collection
Sediment cores for THg, MeHg, and AVS were takenat the start of Experiment 1 (initial sediment cores wereincubated in a separate benthic chamber setup, asdiscussed below), around the mid point of Experiment 1(day 16), and at the end of the experiment (day 29 for theR tanks and day 36 for the NR tanks) during the “on-cycle” (resuspension actively occurring). The samplingtook place a week apart between the R and NR tanks atthe end of Experiment 1 as flux experiments werecompleted in between. While the flux experiment for theR system was conducted, the NR tanks were maintainedin the same manner as it had been during Experiment 1.In Experiment 2, sediment cores were collected at thebeginning and the end of the experiment (days 25 and 26for the R and NR tanks, respectively). There was no midpoint sampling in Experiment 2.
All the sediment cores, sampling equipment, and con-tainers were acid-cleaned prior to use according to EPAprotocols (EPA, 1998). The sediment cores were generallyabout 9 cm deep, taken in acrylic tubes (3.5 cm diameterand 25 cm long), and sliced immediately at the followingintervals: 0–0.5, 0.5–1, 1–2, 2–3, 3–5, and 5–7 cm. Thesliced sediment was then quickly stored frozen untilanalysis. The initial cores were taken from benthicchambers (13.5 cm diameter, 35 cm long). These cham-bers were set up separately in a flow-through water bath inthe dark for initial Hg and AVS measurements so that thesediment surface in the tanks was not disturbed before the

303E.-H. Kim et al. / Marine Chemistry 102 (2006) 300–315
experiments began. The separate cores underwent a 2-week equilibration period indoors in the same manner asthe STORM tanks (Kim et al., 2004), representing a similarinitial condition as in the tanks.
Clams were shipped on ice from Cherrystone AquaFarms, Cheriton, Virginia. They were kept in a holdingtank with a constant water circulation (filtered water fromthe mouth of the Patuxent River supplemented with seasalts) until Experiment 2 began. Clams were acclimated,from a salinity of 21, at which they were cultured, to 18–19, our experimental condition (i.e. decreasing salinity by1 per day). For water quality assurance, levels ofammonia, nitrate, nitrite, salinity, and pH were measuredon a daily basis. Algae paste (Aquaculture Supply USA)was fed to clams once a day until the experiment. Ten to15 clams from the holding tank were sacrificed for initialHg measurements. Clams were retrieved from all 6 tanksat the end of the experiment. In general, for Hg analysis,tissue samples from 10 to 15 clams in each tank wereground homogeneously and kept frozen until analysis.
Zooplankton samples for Hg analysis were collectedduring Experiment 2 roughly once a week. A samplinghose attached to a PVC rod was continuously moving inthe water column while water was being withdrawn tosample zooplankton as homogeneously as possible. Forsampling, a diaphragm pump was used to pump water ata rate of 22 L/min (40 L water from each tank) throughpolypropylene nets of 210 μm. Then, zooplankton wastransferred from the nets to Teflon vials and filtered ontopolycarbonate filters. The filters were then stored in Petridishes, double bagged, and frozen until Hg analysis.
2.3. Stable isotope spike addition incubationmethylation/demethylation assays
Acrylic tubes were used for stable isotope spike addi-tion methylation/demethylation incubation experimentsusing sediments from only one tank of each system (i.e. T1for R and T4 for NR tanks in Experiment 1; T2 for R andT5 for NR tanks in Experiment 2). This sampling wasmade in accordance with other sediment core sampling forHg and AVS analysis for the initial, mid (Experiment 1only), and final conditions. Four sediment cores wereobtained from each tank and transferred to the laboratoryimmediately. Hg stable isotope (199Hg(II)), from the OakRidge National Laboratory (purity of 92%), stock solutionwas diluted using the overlying water from the mesocosmtanks and allowed to equilibrate before injection. The goalwas to increase the background concentration 20% abovethat found in Baltimore Harbor sediments (Mason andLawrence, 1999; Mason et al., 2004). The 199Hg (II) so-lution (100 μL) was, then, injected into two cores at 1 cm
intervals to determine the methylation rate. MeHg stableisotope (CH3
199Hg (II)) was synthesized from the 199Hg(II), using a methylcobalamin reaction followed bymethy-lene chloride extraction. The CH3
199Hg (II) was equilibrat-ed using the overlying water from the mesocosm tanksprior to injection. The target concentration was that es-timated to be double the MeHg concentration in situ(Mason and Lawrence, 1999). Then, 100 μL of theCH3
199Hg (II) was injected into the other two cores toobtain the demethylation rate. After a 2 h-incubation atroom temperature, the cores were sliced, as describedabove, and immediately frozen until analysis. All the Hgisotope amended samples were analyzed using ICP-MS asthe isotope-specific detector.
2.4. Sample analyses
2.4.1. Total mercurySediment samples were split, freeze-dried, and ana-
lyzed for total Hg using a Milestone DMA 80 DirectMercury Analyzer. Biota samples were thawed and diges-ted in 5.0 mL of 3:7 (v/v) acid mixture of concentratedsulfuric acid (18M)/nitric acid (16M) in Teflon vials in anoven at 60 °C overnight prior to bromine chloride oxida-tion (1.5–1 h). Then, excess oxidant was neutralized with2.0 mL of 2.0 M hydroxylamine hydrochloride prior toanalysis (Bloom and Crecelius, 1983). The samples werethen reduced by 0.5 mL of 0.5 M stannous chloride,sparged, and the elemental Hg trapped on a gold trap. Thegold trap was heated with argon flowing and quantifica-tion was done by Cold Vapor Atomic Florescence detec-tion (CVAFS) (Bloom and Fitzgerald, 1988) in accordancewith protocols outlined in EPAmethod 1631 (EPA, 1998).For Hg isotope analysis, samples were prepared in thesame manner, as described above, and ICP-MS was usedin place of CVAFS (Hintelmann and Evans, 1997; Lam-bertsson et al., 2001). Standard calibration curves with r2
of >0.99 for THg were achieved daily. Analysis ofstandard referencematerial, estuarine sediment IAEA-405(3.9–4.3 nmol g−1), typically gave a 90% recovery forCVAFS, and a 83% recovery for ICP-MS. For the DMA,average recovery of standard reference material, marinesediment MESS-3 (0.4–0.5 nmol g−1), was 101%. Anal-ysis of duplicate samples generally yielded a relativepercent difference (RPD) of less than 15% for bothCVAFS and ICP-MS, and less than 5.0% for DMA.Detection limitswere based on 3 standard deviations of thedigestion blankmeasurements. ForDMAandCVAFS, thedetection limits for THg were 0.1 pmol g−1, respectively.For ICP-MS, the detection limit was 0.5 pmol g−1 forsediments amended with the Hg isotopes. All the datapresented here are on a dry weight basis.

Table 1A summary of the water column data from Experiments 1 and 2 (Kimet al., 2004)
Parameter Experiment1
Experiment2
R NR R NR
TSS (mg L−1) 150±27 10±0.2 63±22 4.5±0.6Chl a (μg L−1) 24±2 13±0.9 6.7±0.3 3.6±0.1Part. Hg (nmol g−1) 2.3±0.1 1.1±0.05 2.3±0.2 1.4±0.05Part. MeHg(pmol g−1)
11±2.0 34±5.0 6.0±1.0 26±5.0
%MeHg 0.3±0.09 3.1±2.0 0.3±0.2 2.1±1.7Total diss. Hg (pM) 5.5±1.0 5.5±1.0 8.0±0.5 6.0±0.3Diss. MeHg (pM) 0.3±0.2 0.3±0.1 0.2±0.05 0.2±0.05%MeHg 5.9±12 4.9±8.3 1.8±1.7 2.9±5.2
Data are shown as the average and standard deviation of 3 replicate tanks.
304 E.-H. Kim et al. / Marine Chemistry 102 (2006) 300–315
2.4.2. MethylmercuryDetails of the analytical protocols are given elsewhere
(Mason et al., 1999;Mason and Lawrence, 1999). Briefly,sediment and biota samples were diluted to 25 mL ofdeionized water and distilled with 1.0 mL of 9.0 Msulfuric acid and 0.5 mL of 3.0 M potassium chloridesolution (Horvat et al., 1993). A 1.0% (w/v) sodiumtetraethylborate (0.1 mL) solution was added to thedistillate to convert the nonvolatile MeHg to gaseousmethylethylmercury (Bloom, 1989). The volatile adductwas then purged from solution and recollected on a solidphase column (Tenax) at room temperature. Themethylethylmercury was thermally desorbed from thecolumn and separated by a gas chromatographic (GC)column. All Hg species were converted to elemental Hgin a pyrolytic column at the GC outlet and analyzed byCVAFS. Samples for CH3
199Hg (II) were distilled in thesame manner, as described above, and analyzed by ICP-MS in place of CVAFS (Hintelmann and Evans, 1997;Lambertsson et al., 2001). A calibration curve with an r2
of >0.99 was achieved on a daily basis. Analysis ofduplicate samples typically gave a RPD of less than20%. Detection limits were based on 3 standarddeviations of the distillation blank measurements. ForCVAFS, detection limits for MeHg were 0.02 pmol g−1
for sediments and 0.005 pmol g−1 for biota. For ICP-MS, the detection limit for CH3
199Hg (II) was 0.009 pmolg−1 for sediment samples. For both ICP-MS andCVAFS, analysis of IAEA-405 (25–30 pmol g−1)generally gave a 90% recovery. Spike recoveries yielded87% for CVAFS, and 94% for ICP-MS. The data werenot corrected for less than 100% spike recovery. All dataare reported on a dry weight basis.
2.4.3. Acid volatile sulfide (AVS) and percent organicmatter
A subsample of sediment was weighed and added intoa tared 3 neck flask. The flaskswere attached immediatelyto a gas manifold with nitrogen gas purging in order tominimize exposure to oxygen. Van Griethuysen et al.(2002) found that losses of AVS due to air-sample contact(less than 15 min) did not occur. While gassing, 20 mL of6.0 M deoxygenated HCl was added into each flask. Thesamples then were distilled for 1.5–2 h at room temper-ature under nitrogen gas flow. Sulfide volatilized duringdistillation was collected in traps filled with SAOB (sul-fide antioxidant buffer) solution (EPA, 1996). Totalsulfide in the traps was measured using an ion specificsulfide electrode (Baumann, 1974; Allen et al., 1991;EPA, 1996). A calibration curve with an r2 of at least 0.99was achieved daily. Analysis of duplicate samples yieldeda RPD of less than 20%. Spike recovery averaged 95%.
The detection limit was 0.4 μM. Percent organic contentin each interval of sediment samples was determined asloss on ignition to 550 °C overnight.
2.4.4. Statistical analysisIn order to examine correlation between two variables,
Pearson's product-moment correlation coefficient (r) andassociated significant probability (P) were obtained for thedata. All the statistical results were reported as significantat a level of p<0.05. We used JMP®, version 4 by SASinstitute Inc., Cary, NC,USA for all the statistical analyses.Repeated measures ANOVAwas tested using SAS PROCMIXED to see if there was a significant effect on Hgconcentration in biota between treatments (R vs. NR) aswell as between each time point within the treatments.
3. Results and discussion
3.1. Water column data
The concentrations and distributions, and changes withtime, for Hg, MeHg and ancillary parameters in thedissolved and particulate phases in the water column werediscussed in detail in Kim et al. (2004). A brief summary ofthese data are included here (Table 1). As seen in the table,the concentrations of dissolved Hg and MeHg were verysimilar between the R and NR tanks within an experiment.In contrast, particulate Hg levels were significantly higherin the R tanks and particulate MeHg levels weresignificantly higher in the NR tanks, so that there was astrong difference in %MeHg for particulate between the Rand NR treatments. The differences in particulate Hg andMeHg can be attributedmainly to differences in theHg andMeHg burdens in sediment compared to living tissue(zooplankton have a much higher %MeHg than sediment,and a lower Hg concentration, as discussed below) and

Table 3Average concentrations of THg, MeHg, AVS, and % organic content inExperiment 2
Depth(cm)
THga
(nmol g−1)MeHga
(pmol g−1)AVSb
(μmol g−1)%Organicmatterb
Initial 0–0.5 2.7 – 39 120.5–1 2.9 5.0 (0.17) 86 121–2 3.1 4.4 (0.14) 75 132–3 3.1 4.6 (0.15) 72 133–5 3.0 3.3 (0.12) 94 135–7 3.1 3.6 (0.10) 94 12
Final-R(day 25)
0–0.5 2.9 4.3 (0.15) 28±9.4 13±0.30.5–1 3.0 4.0 (0.14) 66±19 13±0.31–2 3.0 3.1 (0.10) 55±13 13±0.12–3 3.1 3.0 (0.10) 79±16 13±0.33–5 3.1 4.1 (0.13) 82±25 13±0.15–7 3.1 3.3 (0.11) 90±20 13±0.2
Final-NR(day 26)
0–0.5 2.8 4.2 (0.15) 24±1.0 14±0.30.5–1 2.9 3.6 (0.12) 57±13 13±0.1
305E.-H. Kim et al. / Marine Chemistry 102 (2006) 300–315
the same is likely true for phytoplankton. Interestingly,chlorophyll a (Chl a) was higher in the R tanks even giventhe high turbidity of these systems, reflecting the impactof resuspension on nutrient dynamics (Porter et al., inreview-a).
3.2. Overall sediment trends
Table 2 shows average THg and MeHg (% MeHg inparenthesis) from the sediment cores taken in the tankswhich were not used for the methylation/demethylationassays (T2, 3, 5, and 6) in Experiment 1. Overall, as ex-pected, there was little variation in THg concentrationswith depth and over time between theR andNR tanks. Therange of THg in the surface sediment in these experimentsagreed well with concentrations previously measured inBaltimore Harbor by Mason and Lawrence (1999) in the
Table 2Average concentrations of THg, MeHg, AVS, and % organic content inExperiment 1
Depth(cm)
THga
(nmol g−1)MeHga
(pmol g−1)AVSb
(μmol g−1)%Organicmatterb
Initial 0–0.5 2.8 3.6 (0.13) 36 120.5–1 2.9 4.1 (0.14) 132 121–2 2.9 4.7 (0.16) 114 132–3 3.0 4.3 (0.14) 81 133–5 3.0 4.7 (0.16) 122 13
Mid-R(day 16)
0–0.5 2.8 4.6 (0.17) 12±2.6 12±0.60.5–1 2.8 4.7 (0.17) 34±4.1 12±1.01–2 2.9 3.4 (0.12) 42±21 12±0.12–3 2.9 2.5 (0.09) 69±20 12±0.43–5 2.7 3.9 (0.15) 94±10 12±0.15–7 2.8 3.4 (0.12) 94 12±0.8
Final-R(day 29)
0–0.5 2.8 3.9 (0.14) 31±5.5 13±0.50.5–1 2.9 2.9 (0.10) 57±8.2 13±0.91–2 2.8 5.0 (0.17) 66±17 13±0.42–3 2.9 2.1 (0.07) 85±12 13±0.63–5 2.9 1.8 (0.06) 85±14 12±0.045–7 3.0 3.0 (0.10) 103±17 12±0.1
Mid-NR(day 16)
0–0.5 2.8 4.7 (0.17) 18±6.0 13±0.30.5–1 2.9 2.7 (0.09) 49±5.9 12±0.51–2 2.8 2.6 (0.09) 58±12 12±0.12–3 2.7 1.9 (0.07) 60±4.2 12±0.23–5 2.7 0.6 (0.02) 75±30 12±0.25–7 2.8 3.4 (0.12) 69±10 12±0.5
Final-NR(day 36)
0–0.5 2.8 2.1 (0.08) 8.0±7.2 15±0.30.5–1 2.9 2.4 (0.08) 31±12 14±0.71–2 2.9 2.9 (0.10) 53±7.1 13±0.32–3 3.1 2.9 (0.09) 71±5.0 13±0.23–5 2.9 2.6 (0.09) 72±8.7 13±0.15–7 2.8 3.9 (0.14) 82±11 12±0.4
a THg and MeHg data from non-isotope spiked cores in the R tanks(T2,3) and the NR tanks (T5,6). Percent MeHg are in parentheses.b AVS and % organic content are shown in average of 3 replicate
tanks and standard deviation. See the text for details.
1–2 2.9 2.7 (0.09) 58±11 13±0.22–3 2.9 3.0 (0.10) 73±13 13±0.33–5 2.9 3.5 (0.12) 81±6.2 13±0.35–7 3.0 3.8 (0.13) 85±3.4 12±0.2
a THg and MeHg data from non-isotope spiked cores in the R tanks(T1,3) and the NR tanks (T4,6). Percent MeHg are in parenthesis.b AVS and % organic content are shown in average of 3 replicate
tanks and standard deviation. See the text for details.
vicinity of the sample collection site (average of 2.3 nmolg−1). THg concentration in Experiment 2 shows a similartrend with that of Experiment 1 (Table 3). As seen inTable 2, MeHg concentration appeared to be higher in thetop 2 cm sediment than down core in Experiment 1 (exceptthe NR final cores). Overall, MeHg concentration and %MeHgnear the sediment surface in theR tanks appeared tobe slightly higher, compared to the NR tanks in Exper-iment 1. In Experiment 2, however, a similar pattern wasobserved in MeHg concentration between the R and NRtanks (Table 3). The fraction of the Hg as MeHg wasgenerally low (<0.5% of THg concentration) for bothexperiments, which was similar to % MeHg in estuarinesediments found by others (Gobeil and Cossa, 1993;Gagnon et al., 1996; Benoit et al., 1998; Heyes et al.,2004), and to that measured in Baltimore Harbor pre-viously (Mason and Lawrence, 1999).
Tables 2 and 3 show the average AVS concentrationand standard deviation from the 3 replicate tanks withineach treatment. AVS concentration fell within the lowerrange of AVS values found in surface sediments (top2 cm) of Baltimore Harbor (e.g. AVS concentration wasmostly <100 μmol g−1 but was as high as 800 μmol g−1)(Mason and Lawrence, 1999). Overall, increasing AVSwith depth can be explained by sulfate reduction, whichis a major pathway for the oxidation of organic matter in

Fig. 1. Percent methylation in sediment cores: (A) mid cores(Experiment 1); (B) final cores (Experiment 1); (C) final cores(Experiment 2). Average of duplicate cores are presented in solid line(R tank) and dotted line (NR tank), respectively.
306 E.-H. Kim et al. / Marine Chemistry 102 (2006) 300–315
anoxic estuarine sediments (Van Den Berg et al.,1998; Lin et al., 2002). In contrast, percent organiccontent showed little difference between the treat-ments over time and with depth for both Experiments1 and 2 (Tables 2 and 3).
The overall results showed no distinct seasonal dif-ference in sediment MeHg concentration between Experi-ments 1 and 2. As mentioned earlier, Hg methylation isdriven by environmental factors (e.g. microbial activity,sulfate/sulfide levels, and sediment organic content). Givensimilar ranges of AVS and % sediment organic contentbetween the two experiments, a significant difference inHgmethylation was not expected. Additionally, averagetemperatures of water column were not markedly different(25 and 20 °C in Experiments 1 and 2, respectively; Kim etal., 2004), indicating that microbial activity due totemperature changes was not large. Similarly, Heyes et al.(2004) found for the Hudson River (NY) sediment thatMeHg concentration was comparable between June andOctober, but the Hg methylation rates in June were higherby a factor of four, compared to February.
3.3. Mercury isotope incubation experiments
Fig. 1 presents % methylation of the duplicate cores inboth Experiments 1 and 2. In Experiment 1, it appearedthat average % methylation (solid line) in the R tank onday 16 was relatively high at the top 0–1 cm sediment,compared to the NR tank (dotted line) (Fig. 1A). At theend of Experiment 1, average%methylation in the R tankwas mostly lower down core than the NR tank, except thetop 0.5 cm sediment (Fig. 1B). In Experiment 2, average% methylation in both R and NR tanks showed a similarpattern, being higher near the surface (0–2 cm) than downcore (Fig. 1C). However, it should be noted that con-centrations were variable between the duplicate coreswithin each tank, making it difficult to discern any effectof sediment resuspension onHgmethylation above that ofnatural variability.
Given total suspended solids in the water column(average of 150 mg L−1 for Experiment 1) (Table 1) and asediment density of 1.5 g cm−3 (Wainright and Hopkin-son, 1997; Chang, 1999), the amount of sediment sus-pended to the water column is estimated to be comparableto less than 0.5 mm of the sediment. Thus, the directphysical impact of resuspension on sediment geochem-istry is small and any impact must be due to secondaryeffects. Heyes et al. (2004) similarly concluded from theHudson River data that sediment resuspension likely in-fluenced Hg methylation through a secondary effect, asonly a small amount of sediment material was frequentlyresuspended.
In addition, biological mixing may have influencedMeHg dynamics. Macroinfauna (e.g. polychaetes,amphipods) densities evolved in the NR tanks, but notthe R tanks, over the course of the two experiments(especially in Experiment 1), even though both experi-ments began with defaunated sediments (Porter et al., inreview-a). These communities developed from larval
307E.-H. Kim et al. / Marine Chemistry 102 (2006) 300–315
planktonic stages that must have been present in the seedwater for the tanks, added at the beginning of the ex-periment. Also, in Experiment 2, clams were introducedinto the sediment for the bioaccumulation study. Thus,the effects of macroinfauna abundance on Hg methyl-ation need to be considered.
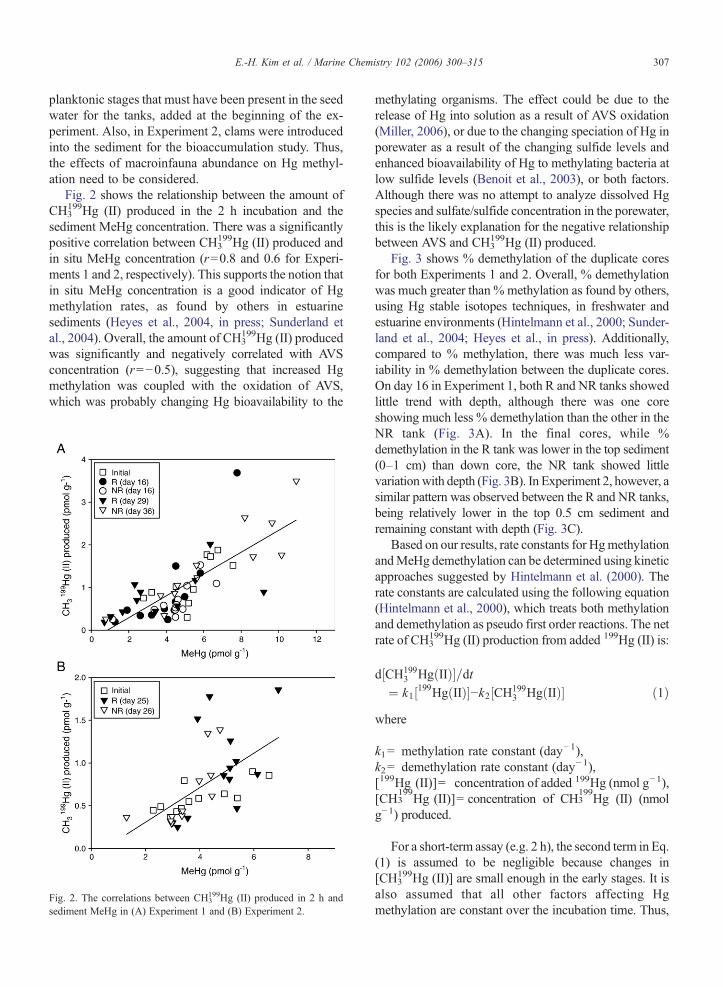
Fig. 2 shows the relationship between the amount ofCH3
199Hg (II) produced in the 2 h incubation and thesediment MeHg concentration. There was a significantlypositive correlation between CH3
199Hg (II) produced andin situ MeHg concentration (r=0.8 and 0.6 for Experi-ments 1 and 2, respectively). This supports the notion thatin situ MeHg concentration is a good indicator of Hgmethylation rates, as found by others in estuarinesediments (Heyes et al., 2004, in press; Sunderland etal., 2004). Overall, the amount of CH3
199Hg (II) producedwas significantly and negatively correlated with AVSconcentration (r=−0.5), suggesting that increased Hgmethylation was coupled with the oxidation of AVS,which was probably changing Hg bioavailability to the
Fig. 2. The correlations between CH3199Hg (II) produced in 2 h and
sediment MeHg in (A) Experiment 1 and (B) Experiment 2.
methylating organisms. The effect could be due to therelease of Hg into solution as a result of AVS oxidation(Miller, 2006), or due to the changing speciation of Hg inporewater as a result of the changing sulfide levels andenhanced bioavailability of Hg to methylating bacteria atlow sulfide levels (Benoit et al., 2003), or both factors.Although there was no attempt to analyze dissolved Hgspecies and sulfate/sulfide concentration in the porewater,this is the likely explanation for the negative relationshipbetween AVS and CH3
199Hg (II) produced.Fig. 3 shows % demethylation of the duplicate cores
for both Experiments 1 and 2. Overall, % demethylationwas much greater than % methylation as found by others,using Hg stable isotopes techniques, in freshwater andestuarine environments (Hintelmann et al., 2000; Sunder-land et al., 2004; Heyes et al., in press). Additionally,compared to % methylation, there was much less var-iability in % demethylation between the duplicate cores.On day 16 in Experiment 1, both R and NR tanks showedlittle trend with depth, although there was one coreshowing much less % demethylation than the other in theNR tank (Fig. 3A). In the final cores, while %demethylation in the R tank was lower in the top sediment(0–1 cm) than down core, the NR tank showed littlevariationwith depth (Fig. 3B). In Experiment 2, however, asimilar pattern was observed between the R and NR tanks,being relatively lower in the top 0.5 cm sediment andremaining constant with depth (Fig. 3C).
Based on our results, rate constants for HgmethylationandMeHg demethylation can be determined using kineticapproaches suggested by Hintelmann et al. (2000). Therate constants are calculated using the following equation(Hintelmann et al., 2000), which treats both methylationand demethylation as pseudo first order reactions. The netrate of CH3
199Hg (II) production from added 199Hg (II) is:
d½CH1993 HgðIIÞ�=dt
¼ k1½199HgðIIÞ�−k2½CH1993 HgðIIÞ� ð1Þ
where
k1= methylation rate constant (day−1),k2= demethylation rate constant (day−1),[199Hg (II)]= concentration of added 199Hg (nmol g−1),[CH3
199Hg (II)]= concentration of CH3
199Hg (II) (nmol
g−1) produced.
For a short-term assay (e.g. 2 h), the second term in Eq.
(1) is assumed to be negligible because changes in[CH3199Hg (II)] are small enough in the early stages. It isalso assumed that all other factors affecting Hgmethylation are constant over the incubation time. Thus,

Fig. 3. Percent demethylation in sediment cores: (A) mid cores(Experiment 1), (B) final cores (Experiment 1) and (C) final cores(Experiment 2).
308 E.-H. Kim et al. / Marine Chemistry 102 (2006) 300–315
after integrating Eq. (1), the methylation rate constant isobtained as below:
k1 ¼ ½CH1993 HgðIIÞ�=ð½199HgðIIÞ� tÞ ð2Þ
In a similar way, the demethylation rate constants werecalculated fromEq. (1). At the beginning of the incubation
experiment after addition of CH3199Hg (II), as there is no
excess [199Hg (II)], then by integration,
k2 ¼ ð1=tÞlnð½CH1993 HgðIIÞ�0=½CH199
3 HgðIIÞ�Þ ð3Þwhere [CH3
199Hg (II)]0 is the initial concentration ofCH3
199Hg (II) in the sediment.Overall, demethylation rate constants were 2–3 orders
of magnitude higher thanmethylation rate constants. Addi-tionally, the results from isotope spike incubation experi-ments appear to be reasonably consistent with ambient Hgpools in sediments. That is, at a steady state, if equalfractions of added spike isotopes are bioavailable for trans-formation, then Eq. (1) leads to [MeHg]/[Hg]= k1/k2. Thisrelationship was tested by examining the ratios of in situTHg andMeHg concentrations to that of the rate constants.The ratios were of the same order of magnitude for both theR and NR tanks (Table 4), suggesting that the MeHgisotope added must be similarly available in sediments fordemethylation as inorganic Hg is for methylation.
Moreover, the characteristic time to equilibrium (1/(k1+k2)) was 1–3 h, suggesting that MeHg turnover occurredvery rapidly in the sediment. Thus, the methylation pro-cess seems to play an important role in determiningMeHgconcentration in sediments as, in the absence of continuousmethylation, bioavailable MeHg would be rapidly deplet-ed. Our preliminaryMeHgmass balance for these systems(Kim et al., 2004) suggested that net MeHg productionwithin the mesocosm tanks was higher in the R tanks thanin the NR tanks. While the mass balance indicated anoverall net formation of MeHg in the R tanks, the resultsfor the NR tanks were equivocal given the errors asso-ciated with the mass balance estimates.
Table 5 presents ratios of the methylation and deme-thylation rate constants and in situ MeHg/Hg concentra-tions across ecosystems for comparison. As seen in Table 5,the ratio of the methylation and demethylation rate con-stants are generally in good agreement with the ratios of insitu Hg and MeHg concentrations, similar to the resultsfrom this study. It should, however, be noted that since thestable isotope (CH3
199Hg (II) or 199Hg (II)) was added insolution, there is the possibility, even though it was pre-quilibrated, that the spiked isotope could have been morequickly methylated/demethylated when it was injected intocores, compared to the in situ Hg or MeHg. Others haveprofessed similar concerns that the rates determined fromsuch short term rate measurements (e.g. Hintelmann et al.,2000; Benoit et al., 2003) may be higher than thoseoccurring in situ. However, the results of this study suggestthat the rate constants for methylation and demethylationmeasured using stable isotope spike experiments provide agood measure of the potential for transformation within asediment. Thus, it is reasonable to use these rate constants

Table 4Comparison of methylation and demethylation rate constants with ratios of in situ MeHg and THg concentrations for sediments from Experiments 1and 2
Depth (cm) k1 (×10−2) (d−1) k2 (d
−1) k1/k2 (×10−3) [MeHg]tot /[Hg]tot (×10
−3)
Experiment 1 (Mid-day 16) R 0–0.5 7.7 15 5.1 7.10.5–1 4.2 23 1.8 5.21–2 2.6 12 2.3 1.02–3 7.6 23 3.3 1.43–5 3.1 29 1.1 1.35–7 4.9 26 1.9 1.5
NR 0–0.5 1.7 14 1.2 2.80.5–1 3.4 8.4 4.0 3.61–2 2.6 23 1.1 2.52–3 6.4 18 3.5 4.23–5 3.5 18 2.0 3.45–7 3.6 13 2.7 4.1
Experiment 1 (Final-days 29 and 36) R 0–0.5 5.5 8.6 6.4 2.10.5–1 2.5 17 1.5 4.11–2 4.7 24 2.0 2.22–3 2.2 25 0.9 2.13–5 3.3 31 1.1 0.75–7 3.5 19 1.9 1.6
NR 0–0.5 4.1 32 1.3 2.90.5–1 7.6 31 2.5 4.71–2 7.1 34 2.1 3.82–3 3.5 32 1.1 4.33–5 7.2 28 2.6 3.25–7 1.1 24 0.5 1.3
Experiment 2 (Final-days 25 and 26) R 0–0.5 2.0 16 1.2 3.60.5–1 3.3 25 1.3 3.71–2 9.2 24 3.8 2.82–3 1.8 30 0.6 3.83–5 4.8 30 1.6 3.65–7 3.8 30 1.3 4.1
NR 0–0.5 2.7 16 1.7 4.40.5–1 7.1 29 3.8 6.81–2 5.0 28 1.8 4.52–3 3.5 27 1.3 2.93–5 3.5 27 1.3 3.65–7 3.4 27 1.3 3.6
Data are shown in average of duplicate cores.
309E.-H. Kim et al. / Marine Chemistry 102 (2006) 300–315
to compare across ecosystems the propensity of a particularenvironment to methylate Hg or demethylate MeHg. Thecomparison shows that while the rate constant determinedfor Hg methylation in the mesocosms is somewhat higherthan those measured in other environments, it is thedemethylation rate constant that is substantially higher thanthat found by others using other methods and in otherecosystems (Table 5).
3.4. Impact of resuspension on Hg methylation/demethylation
The results of this study show that in situ MeHg con-centration is a good indicator of Hg methylation activityand the ratio of in situ THg andMeHg concentrations are in
good agreement with the ratio of the methylation anddemethylation rate constants. The negative relationshipbetween AVS and CH3
199Hg (II) produced suggests thatsediment resuspension can have an impact by changing theassociation of Hg with binding phases, thereby influencingHg methylation. As mentioned above, sulfate reducingbacteria are the primary agents for methylating Hg. Maxi-mal methylation occurs in environments where sulfate issufficient to stimulate sulfate reduction and, as a result, Hgmethylation, but where there is relatively low sulfide, sothat methylation is not limited (Choi and Bartha, 1994;Benoit et al., 1998, 2003). Additionally, bioavailability ofHg is an important factor in Hg methylation. Benoit et al.(1999a) developed a chemical equilibriummodel to test thehypothesis that the bioavailability of Hg to sulfate reducing

Table 5Comparison of methylation and demethylation rate constants with ratios of in situ MeHg and THg concentrations across ecosystems for the uppersediments
Location type and methoda k1 (×10−2) (day−1) k2 (day
−1) k1/k2 (×10−3) [MeHg]tot/[Hg]tot (×10
−3) References
Hudson River (E/S) 0.009 0.64 0.1 2.0 Heyes et al. (in press)Bay of Fundy (E/S) 0.2 0.2 10 3.3 Sunderland et al. (2004)San Pablo Bay (EW/R) 1.4 0.3 56 18 Marvin-DiPasquale et al. (2003)115 Wetland (FW/S) 3.2 5.0 6.4 78 Heyes (unpublished)Ontario Lakes (L/S) 1.4 0.5 30 24 Hintelmann et al. (2000)Everglades (W/S+R) 1–4 0.04 250–1000 1–40 Benoit et al. (2003)/Marvin-DiPasquale
and Oremland (1998)b
Lake Sediment (L/R) 0.2 1–3 0.7–1 – Pak and Bartha (1998)a Type: E=Estuarine; L=Lake; F=Freshwater; W=Wetland. Method: S=Stable isotopes used; R=Radioisotopes used.b Methylation study used stable isotopes; demethylation study used radioisotopes.
310 E.-H. Kim et al. / Marine Chemistry 102 (2006) 300–315
bacteria is a function of the concentration of neutral Hgsulfide complexes that can readily diffuse across the bac-terial membrane. The model results suggest that as sulfideincreases, the dominantHg speciation changes fromneutraldissolvedHg complexes (e.g. HgS0 (aq)) to charged sulfidecomplexes. Octanol–water partition experiments (Benoit etal., 1999b) and culture experiments (Benoit et al., 2001)supported this hypothesis. More recent studies (Miller,2006) indicate that the relationship is not straightforward asthere is an interaction between neutral Hg sulfide com-plexes and organic matter in solution that reduces theoverall neutral Hg sulfide concentration below that pre-dicted by earlier models, such as Benoit et al. (1999a).Overall, sediment resuspension can enhance methylationby decreasing sulfide levels, but it may also limit methy-lation if sediments become too oxic by limiting the activityof sulfate reducing bacteria.
The demethylation of MeHg has received relativelyless attention until recently, compared to Hg methyla-tion. MeHg demethylation can proceed by biotic andabiotic pathways. Abiotic pathways such as photode-gradation have been reported in the water column(Weber, 1993; Sellers et al., 1996). Although environ-mental factors controlling demethylation rates are not yetfully understood, Marvin-DiPasquale et al. (2000) foundthat reductive demethylation (RD), which yields Hg0 asthe main product, was a major pathway in extremelycontaminated sediments (i.e. ppm levels of THg con-centration), while oxidative demethylation (OD) wasdominant in less contaminated sediments (natural en-vironments). In addition, both sulfate reducing bacteriaand methanogens have been shown to be the primaryagents for OD (Oremland et al., 1991, 1995; Pak andBartha, 1998). Thus, in environments where ODdominates, the end product, Hg(II) may be re-meth-ylated or associated with reduced sulfur species. Ourstudy suggests that recycling of Hg appears to beimportant and the balance between methylation and
demethylation ultimately determines MeHg concentra-tion in sediments.
As mentioned earlier, a macroinfaunal communityunexpectedly developed in the NR tank, not the R tanks,over the course of the experiments. It was found thatpolychaete larvae were significantly higher in the watercolumn of the R tanks, compared to theNR tanks, but theywere not able to settle due to the continual sedimentresuspension (Porter et al., in review-a). Additionally, inExperiment 2, the combination of introducing clams to thesediment, andmacrofauna that developed in theNR tanks,may be an explanation for similar trends in Hg meth-ylation and MeHg demethylation between the R and NRtanks. Overall, invertebrate activity could have stimulatedsediment mixing in the NR tanks, mimicking throughbiological processes the impact of physical mixing in theR tanks. Sunderland et al. (2004) showed that physicalmixing in the Bay of Fundy resulted in a relatively deepactive sediment layer (15 cm) in the oxic-transitory range.They observed that MeHg production occurred through-out the active sediment layer, which was facilitated byanoxic organic rich “mottles” or “pockets”. Thus, de-pending on macrofauna abundance and their movement,the presence of organisms may result in similar sedimentconditions that can be favorable to Hgmethylation. Thereis, however, very little information on the impact ofinfaunal abundance on MeHg production and demethyla-tion. As one example, Benoit et al. (in press) showed adefinite impact of macrofauna burrow density on MeHgdistribution in sediments of Boston Harbor. Studies are,therefore, needed to further investigate the effects of in-faunal abundances in the sediment onHgmethylation andMeHg demethylation.
3.5. Mercury bioaccumulation
THg and MeHg concentrations in zooplankton weremeasured only during Experiment 2. THg in zooplankton
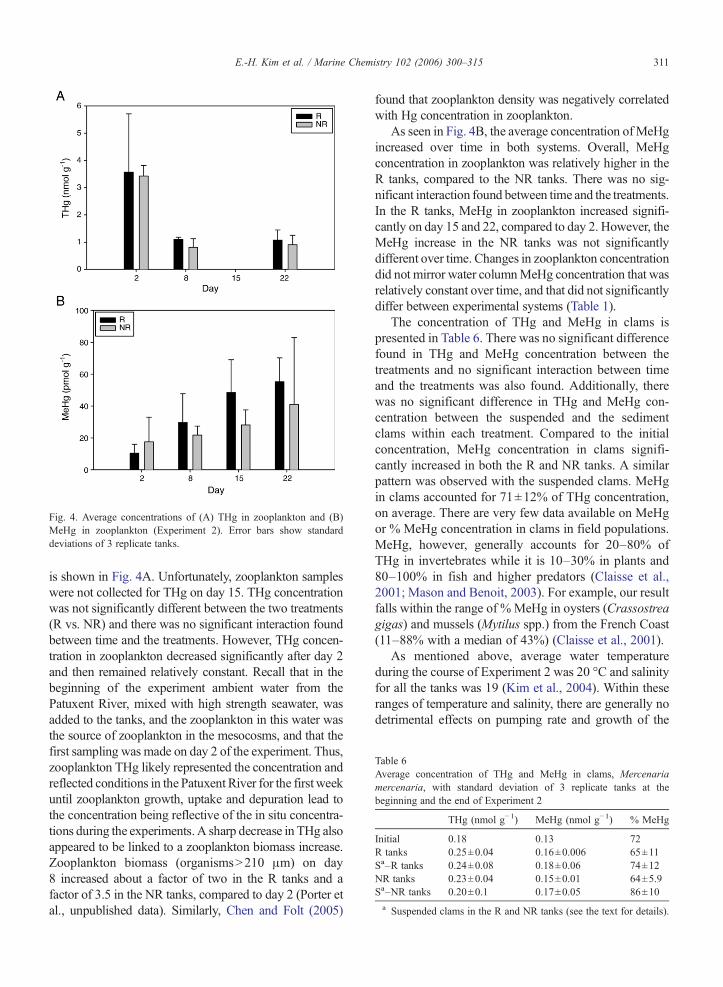
Fig. 4. Average concentrations of (A) THg in zooplankton and (B)MeHg in zooplankton (Experiment 2). Error bars show standarddeviations of 3 replicate tanks.
Table 6Average concentration of THg and MeHg in clams, Mercenariamercenaria, with standard deviation of 3 replicate tanks at thebeginning and the end of Experiment 2
THg (nmol g−1) MeHg (nmol g−1) % MeHg
Initial 0.18 0.13 72R tanks 0.25±0.04 0.16±0.006 65±11Sa–R tanks 0.24±0.08 0.18±0.06 74±12NR tanks 0.23±0.04 0.15±0.01 64±5.9Sa–NR tanks 0.20±0.1 0.17±0.05 86±10
a Suspended clams in the R and NR tanks (see the text for details).
311E.-H. Kim et al. / Marine Chemistry 102 (2006) 300–315
is shown in Fig. 4A. Unfortunately, zooplankton sampleswere not collected for THg on day 15. THg concentrationwas not significantly different between the two treatments(R vs. NR) and there was no significant interaction foundbetween time and the treatments. However, THg concen-tration in zooplankton decreased significantly after day 2and then remained relatively constant. Recall that in thebeginning of the experiment ambient water from thePatuxent River, mixed with high strength seawater, wasadded to the tanks, and the zooplankton in this water wasthe source of zooplankton in the mesocosms, and that thefirst sampling was made on day 2 of the experiment. Thus,zooplankton THg likely represented the concentration andreflected conditions in the Patuxent River for the first weekuntil zooplankton growth, uptake and depuration lead tothe concentration being reflective of the in situ concentra-tions during the experiments. A sharp decrease in THg alsoappeared to be linked to a zooplankton biomass increase.Zooplankton biomass (organisms>210 μm) on day8 increased about a factor of two in the R tanks and afactor of 3.5 in the NR tanks, compared to day 2 (Porter etal., unpublished data). Similarly, Chen and Folt (2005)
found that zooplankton density was negatively correlatedwith Hg concentration in zooplankton.
As seen in Fig. 4B, the average concentration ofMeHgincreased over time in both systems. Overall, MeHgconcentration in zooplankton was relatively higher in theR tanks, compared to the NR tanks. There was no sig-nificant interaction found between time and the treatments.In the R tanks, MeHg in zooplankton increased signifi-cantly on day 15 and 22, compared to day 2. However, theMeHg increase in the NR tanks was not significantlydifferent over time. Changes in zooplankton concentrationdid not mirror water columnMeHg concentration that wasrelatively constant over time, and that did not significantlydiffer between experimental systems (Table 1).
The concentration of THg and MeHg in clams ispresented in Table 6. There was no significant differencefound in THg and MeHg concentration between thetreatments and no significant interaction between timeand the treatments was also found. Additionally, therewas no significant difference in THg and MeHg con-centration between the suspended and the sedimentclams within each treatment. Compared to the initialconcentration, MeHg concentration in clams signifi-cantly increased in both the R and NR tanks. A similarpattern was observed with the suspended clams. MeHgin clams accounted for 71±12% of THg concentration,on average. There are very few data available on MeHgor % MeHg concentration in clams in field populations.MeHg, however, generally accounts for 20–80% ofTHg in invertebrates while it is 10–30% in plants and80–100% in fish and higher predators (Claisse et al.,2001; Mason and Benoit, 2003). For example, our resultfalls within the range of % MeHg in oysters (Crassostreagigas) and mussels (Mytilus spp.) from the French Coast(11–88% with a median of 43%) (Claisse et al., 2001).
As mentioned above, average water temperatureduring the course of Experiment 2 was 20 °C and salinityfor all the tanks was 19 (Kim et al., 2004). Within theseranges of temperature and salinity, there are generally nodetrimental effects on pumping rate and growth of the

312 E.-H. Kim et al. / Marine Chemistry 102 (2006) 300–315
clams (Grizzle et al., 2001 and references therein.).Actually, the R tanks seem to be beneficial to feeding ofclams in that Chl a concentration was higher and therewas less zooplankton biomass (i.e. less competition),compared to the NR tanks. In a successive experiment inJuly of 2002, a clam gape monitor (Porter et al., inreview-b) was developed and used to measure clam gapeactivity (closing/opening) during the experiment and itwas found that clams in the R tanks were open 62% oftime at TSS levels of 106 mg L−1, a similar amount to theclams in the NR tanks, suggesting that hard clams werecoping with the turbid environment and were activelyfeeding. This observation is in contrast to what had beenpreviously found (Bricelj and Malouf, 1984; Turner andMiller, 1991). Our overall data from a number of ex-periments (Kim, 2004; Bergeron, 2005) support theobservations of the clam gape experiments that clamswere feeding at high turbidity as the ratio of phytoplankton(Chl a) to POM was lower with increasing clam density,indicating that phytoplankton was removed by the clams.
Riisgård et al. (2003) found that filter feedingbivalves reduced their opening state and finally ceasedfiltering within a few hours when algal concentrationsfell below 0.5 μg L−1. Chl a in Experiment 2 was abovethis value and was significantly higher in the R tanksthan NR tanks, averaging 6.7±0.3 and 3.6±0.1 μg L−1,respectively (Table 1). Under the experiment conditions,it is therefore likely that filtration rates of clams in bothR and NR tanks were similar. Clams in the R tanks werein the turbid environment where filtration rates mayhave been negatively affected but food concentrationwas relatively higher (compared to the NR tanks). Incontrast, clams in the NR tanks likely faced food lim-itation due to a lower standing stock of phytoplankton.
A bioaccumulation modeling study showed thatoverall biomass and MeHg burden in biota were highlysensitive to varying phytoplankton production and thefiltration rate of filter feeders, whose biomass was dom-inant in the system (Kim, 2004). In addition, increasingbiomass resulted in a decrease in MeHg burden in biota(dilution effect). In support of this observation, Pickhardtet al. (2002) found that an algal bloom reduced MeHguptake by zooplankton because increasing algal densitydecreased MeHg accumulation, resulting in lower dietaryinputs to zooplankton. Other studies have found similarresults in that contaminant burden in algae decreased asbiomass increased (Ashley, 1998; Winkels et al., 1998).Additionally, the modeling study showed that sedimentresuspension played an important role in transporting theelevated MeHg to the water column, resulting in a higherMeHg burden in biota. Similarly, other studies haveshowed that sediment resuspension contributed to in-
creasing concentrations of contaminants (e.g. PCB,Hg) inbenthic organisms such as bivalves and polychaetes dueto the transfer from the sediment to the water column(Sunderland et al., 2004; Charles et al., 2005).
4. Summary
Our results suggest that sediment resuspension plays arole in Hg methylation by changing the association of Hgwith sediment binding phases. However, other factors,such as macrofauna abundance, may be as important asphysical mixing in controlling conditions that arefavorable toHgmethylation.Demethylation rate constantswere found to be similar between the R and NR systems,suggesting that continual Hg methylation was required tomaintain the MeHg pool in sediments. In addition, sed-iment resuspension can play a large role in transferringsediment MeHg to organisms in shallow water systems.
Acknowledgement
We would like to thank Melissa Bonner, SandraFernandes, Matt Reardon and the crew ofAquaris at CBLfor their help. We'd also like to extend our gratitude to theHudson River Foundation (HRF) for their support (GrantNo.009-01A), Cherrystone Aqua Farms for providingclams, and the Analytical Service at CBL for analyzingsamples. Our research was also partially supported byGrantNo. R 824850-01-0 fromUSEPASTARprogram aspart of the Multiscale Experimental Ecosystem ResearchCenter (MEERC) at the University of Maryland Centerfor Environmental Science (UMCES). This is Contribu-tion No. 3827 from UMCES.
References
Allen, H.E., 1995. Metal Contaminated Aquatic Sediments. AnnArbor Press, Inc.
Allen, H.E., Fu, G., Boothman, W., Di Toro, D.M., Mahoney, J.D.,1991. Determination of Acid Volatile Sulfide and SelectedSimultaneously Extractable Metals in Sediments. Office of WaterRegulations and Standards, US EPA, Washington, DC.
Ashley, J.T.F., 1998. Habitat use and trophic status as determinants ofhydrophobic organic contaminant bioaccumulation within shallowsystems. PhD dissertation, Marine Estuarine EnvironmentalSciences (MEES), University of Maryland, College Park.
Baumann, E.W., 1974. Determination of parts per billion sulfide inwater with the sulfide-selective electrode. Analytical Chemistry46, 1345–1347.
Benoit, J.M., Shull, D.H., Robinson, P., Ucran, L.R., in press. Infaunalburrow densities and sediment monomethyl mercury distributionsin Boston Harbor, Massachusetts. Marine Chemistry.
Benoit, J.M., Gilmour, C.C., Mason, R.P., Riedel, G.S., Riedel, G.F.,1998. Behavior of mercury in the Patuxent River estuary.Biogeochemistry 40 (2–3), 249–265.
313E.-H. Kim et al. / Marine Chemistry 102 (2006) 300–315
Benoit, J.M., Gilmour, C.C., Mason, R.P., Heyes, A., 1999a. Sulfidecontrols on mercury speciation and bioavailability to methylatingbacteria in sediment pore waters. Environmental Science and Tech-nology 33 (6), 951–957.
Benoit, J.M.,Mason, R.P., Gilmour, C.C., 1999b. Estimation of mercury-sulfide speciation in sediment pore waters using octanol-waterpartitioning and implications for availability to methylating bacteria.Environmental Toxicology and Chemistry 18 (10), 2138–2141.
Benoit, J.M., Gilmour, C.C., Mason, R.P., 2001. Aspects ofbioavailability of mercury for methylation in pure cultures ofDesulfobulbus propionicus (1pr3). Applied and EnvironmentalMicrobiology 67 (1), 51–58.
Benoit, J., Gilmour, C.C., Heyes, A., Mason, R., Miller, C., 2003.Geochemical and biological controls over methylmercury produc-tion and degradation in aquatic systems. In: Chai, Y., Braids, O.C.(Eds.), Biochemistry of Environmental Important Trace Elements.American Chemical Society, Washington, DC, pp. 262–297.
Bergeron, C., 2005. The impact of sediment resuspension on mercurycycling and the bioaccumulation of methylmercury into benthicand pelagic organisms. MS thesis, Marine Estuarine Environmen-tal Sciences (MEES), University of Maryland, College Park,pp. 108.
Bloom, N.S., 1989. Determination of picogram levels of methylmercuryby aqueous phase ethylation, followed by cryogenic gas-chroma-tography with cold vapor atomic fluorescence detection. CanadianJournal of Fisheries and Aquatic Sciences 46 (7), 1131–1140.
Bloom, N.S., Crecelius, E.A., 1983. Determination of mercury inseawater at subnanogram per liter levels. Marine Chemistry 14,49–59.
Bloom, N.S., Fitzgerald, W.F., 1988. Determination of volatilemercury species at the picogram level by low-temperature gas-chromatography with cold-vapor atomic fluorescence detection.Analytica Chimica Acta 208 (1–2), 151–161.
Bloom, N.S., Gill, G.A., Cappellino, S., Dobbs, C., McShea, L.,Driscoll, C., Mason, R., Rudd, J., 1999. Speciation and cycling ofmercury in Lavaca Bay, Texas, sediments. Environmental Scienceand Technology 33 (1), 7–13.
Bricelj, V.M., Malouf, R.E., 1984. Influence of algal and suspendedsediment concentrations on the feeding physiology of the hardclam Mercenaria mercenaria. Marine Biology 84, 155–165.
Charles, F., Lopez-Legentil, S., Gremare, A., Amouroux, J., Desmalades,M., Vetion, G., Escoubeyrou, K., 2005. Does sediment resuspensionby storms affect the fate of polychlorobiphenyls (PCBs) in thebenthic food chain? Interactions between changes in POMcharacteristics, adsorption and absorption by the mussel Mytilusgalloprovincialis. Continental Shelf Research 25, 2533–2553.
Chang, M.-L., 1999. Modeling the effects of resuspension anddeposition on early diagenesis of nutrients and contaminants.PhD dissertation, Marine Estuarine Environmental Sciences(MEES), University of Maryland, College Park.
Chen, C.Y., Folt, C.L., 2005. High plankton densities reduce mercurybiomagnification. Environmental Science and Technology 39,115–121.
Choi, S.C., Bartha, R., 1994. Environmental-factors affecting mercurymethylation in estuarine sediments. Bulletin of EnvironmentalContamination and Toxicology 53 (6), 805–812.
Claisse, D., Cossa, D., Bretaudeau-Sanjuan, J., Touchard, G.,Bombled, B., 2001. Methylmercury in molluscs along the FrenchCoast. Marine Pollution Bulletin 42 (4), 329–332.
Compeau, G.C., Bartha, R., 1983. Effects of sea salt anions on theformation and stability of methylmercury. Bulletin of Environ-mental Contamination and Toxicology 31 (4), 486–493.
Compeau, G.C., Bartha, R., 1987. Effect of salinity on mercury-methylating activity of sulfate-reducing bacteria in estuarine sedi-ments. Applied and Environmental Microbiology 53 (2), 261–265.
Cooper, D.C.,Morse, J.W., 1996. The chemistry of Offatts Bayou, Texas:A seasonally highly sulfidic basin. Estuaries 19 (3), 595–611.
Crawford, S.M., Sanford, L.P., 2001. Boundary shear velocities andfluxes in the MEERC experimental ecosystems. Marine Ecology.Progress Series 210, 1–12.
EPA, 1996. Method 9215: Potentiometric Determination of Sulfide inAqueous Samples and Distillates with Ion-Selective Electrode.US EPA.
EPA, 1998. Method 1631: Mercury in Water by Oxidation, Purge andTrap, and Cold Vapor Atomic Fluorescence Spectrometry. US EPA.
Gagnon, C., Pelletier, E., Mucci, A., Fitzgerald, W.F., 1996. Diageneticbehavior of methylmercury in organic-rich coastal sediments. Lim-nology and Oceanography 41 (3), 428–434.
Gagnon, C., Pelletier, E., Mucci, A., 1997. Behaviour of anthro-pogentic mercury in coastal marine sediments. Marine Chemistry59, 159–176.
Gilmour, C.C., Henry, E.A., 1991. Mercury methylation in aquaticsystems affected by acid deposition. Environmental Pollution 71(2–4), 131–169.
Gilmour, C.C., Riedel, G.S., 1995. Measurement of Hg methylation insediments using high specific-activity 203Hg and ambient incuba-tion. Water, Air and Soil Pollution 80, 747–756.
Gilmour, C.C., Riedel, G.S., Ederington, M.C., Bell, J.T., Benoit, J.M.,Gill, G.A., Stordal, M.C., 1998. Methylmercury concentrationsand production rates across a trophic gradient in the northernEverglades. Biogeochemistry 40 (2–3), 327–345.
Gobeil, C., Cossa, D., 1993. Mercury in sediments and sediment pore-water in the Laurentian Trough. Canadian Journal of Fisheries andAquatic Sciences 50 (8), 1794–1800.
Grizzle, R.E., Bricelj, V.M., Shumway, S.E., 2001. Physiologicalecology of Mercenaria mercenaria. In: Kraeuter, J.N., Castagna,M. (Eds.), Biology of the Hard Clam. Elsevier Health Sciences.
Heyes, A., Miller, C., Mason, R.P., 2004. Mercury and methylmercuryin Hudson River sediment: Impact of tidal resuspension onpartitioning and methylation. Marine Chemistry 90 (1–4), 75–89.
Heyes, A., Mason, R.P., Kim, E., Sunderland, E., in press. Mercurymethylation in estuaries: Insights from using measuring rates usingstable mercury isotopes. Marine Chemistry.
Hines, M.E., Horvat, M., Faganeli, J., Bonzongo, J.-C.J., Barkay, T.,Major, E.B., Scott, K.J., Bailey, E.A., Warwick, J.J., Lyons, W.B.,2000. Mercury biogeochemistry in the Idrija River, Slovenia, fromabove the mine into the Gulf of Trieste. Environmental Research83 (2), 129–139.
Hintelmann, H., Evans, R.D., 1997. Application of stable isotopes inenvironmental tracer studies—measurement of monomethylmer-cury (CH3Hg
+) by isotope dilution ICP-MS and detection ofspecies transformation. Fresenius' Journal of Analytical Chemistry358 (3), 378–385.
Hintelmann, H., Keppel-Jones, K., Evans, R.D., 2000. Constants ofmercury methylation and demethylation rates in sediments andcomparison of tracer and ambient mercury availability. Environ-mental Toxicology and Chemistry 19 (9), 2204–2211.
Horvat, M., Bloom, N.S., Liang, L., 1993. Comparison of distillationwith other current isolation methods for the determination ofmethyl mercury-compounds in low-level environmental-samples:1. Sediments. Analytica Chimica Acta 281 (1), 135–152.
Kim, E., 2004. The importance of physical mixing and sedimentchemistry in mercury and methylmercury biogeochemical cyclingand bioaccumulation within shallow estuaries. PhD dissertation,

314 E.-H. Kim et al. / Marine Chemistry 102 (2006) 300–315
Marine Estuarine Environmental Sciences (MEES), University ofMaryland, College Park.
Kim, E., Mason, R.P., Porter, E.T., Soulen, H.L., 2004. The effect ofresuspension on the fate of total mercury and methyl mercury in ashallow estuarine ecosystem: A mesocosm study. Marine Chem-istry 86, 121–137.
Korthals, E.T., Winfrey, M.R., 1987. Seasonal and spatial variationsin mercury methylation and demethylation in an oligotrophiclake. Applied and Environmental Microbiology 53 (10),2397–2404.
Lambertsson, L., Lundberg, E., Nilsson, M., Frech, W., 2001.Applications of enriched stable isotope tracers in combinationwith isotope dilution GC-ICP-MS to study mercury speciestransformation in sea sediments during in situ ethylation anddetermination. Journal of Analytical Atomic Spectrometry 16 (11),1296–1301.
Lin, S., Huang, K.-M., Chen, S.-K., 2002. Sulfate reduction and ironsulfide mineral formation in the southern East China Seacontinental slope sediment. Deep-Sea Research. Part 1. Oceano-graphic Research Papers 49, 1837–1852.
Marvin-DiPasquale, M.C., Oremland, R.S., 1998. Bacterial methyl-mercury degradation in Florida Everglades peat sediment.Environmental Science & Technology 32 (17), 2556–2563.
Marvin-DiPasquale, M., Agee, J., McGowan, C., Oremland, R.S.,Thomas, M., Krabbenhoft, D., Gilmour, C.C., 2000. Methyl-mercury degradation pathways: A comparison among threemercury-impacted ecosystems. Environmental Science and Tech-nology 34 (23), 4908–4916.
Marvin-DiPasquale, M., Agee, J., Bouse, R., Jaffe, B., 2003. Microbialcycling of mercury in contaminated pelagic and wetland sedimentsof San Pablo Bay, California. Environmental Geology 43 (3),260–267.
Mason, R., Benoit, J., 2003. Organomercury compounds in theenvironment. In: Craig, P. (Ed.), Organometallics in the Environ-ment. John Wiley and Sons, New York, pp. 57–99.
Mason, R.P., Lawrence, A.L., 1999. Concentration, distribution, andbioavailability of mercury and methylmercury in sediments ofBaltimore Harbor and Chesapeake Bay, Maryland, USA. Envi-ronmental Toxicology and Chemistry 18 (11), 2438–2447.
Mason, R.P., Lawson, N.M., Lawrence, A.L., Leaner, J.J., Lee, J.G.,Sheu, G.R., 1999.Mercury in the ChesapeakeBay.Marine Chemistry65 (1–2), 77–96.
Mason, R.P., Kim, E., Cornwell, J.C., 2004. Metal accumulation inBaltimore Harbor: Current and past inputs. Applied Geochemistry19 (11), 1801–1825.
Mason, R., Kim, E., Cornwell, J., Heyes, D., in press. Anexamination of the factors influencing the flux of mercury,methylmercury and other constituents from estuarine sediment.Marine Chemistry.
Miller, C., 2006. The role of organic matter in the dissolved phasespeciation and solid phase partitioning of mercury. PhD disserta-tion, Marine Estuarine Environmental Sciences (MEES), Univer-sity of Maryland, College Park, pp. 159.
Oremland, R.S., Culbertson, C.W., Winfrey, M.R., 1991. Methylmer-cury decomposition in sediments and bacterial cultures—involve-ment of methanogens and sulfate reducers in oxidativedemethylation. Applied and Environmental Microbiology 57 (1),130–137.
Oremland, R.S., Miller, L.G., Dowdle, P., Connell, T., Barkay, T.,1995. Methylmercury oxidative-degradation potentials in contam-inated and pristine sediments of the Carson River, Nevada. Appliedand Environmental Microbiology 61 (7), 2745–2753.
Pak, K.R., Bartha, R., 1998. Mercury methylation and demethylationin anoxic lake sediments and by strictly anaerobic bacteria.Applied and Environmental Microbiology 64 (3), 1013–1017.
Pickhardt, R.C., Folt, C.L., Chen, C.Y., Klaue, B., Blum, J.D., 2002.Algal blooms reduce the uptake of toxic methylmercury infreshwater food webs. Proceedings of the National Academy ofSciences of the United States of America 99 (7), 4419–4423.
Porter, E.T., 1999. Physical and biological scaling of benthic–pelagiccoupling in experimental ecosystem studies. PhD dissertation,Marine Estuarine Environmental Sciences (MEES),University ofMaryland, College Park.
Porter, E.T., Sanford, L.P., Gust, G., Porter, F.S., 2004a. Combinedwater-column mixing and benthic boundary-layer flow inmesocosms: Key for realistic benthic–pelagic coupling studies.Marine Ecology. Progress Series 271, 43–60.
Porter, E.T., Cornwell, J.C., Sanford, L.P., 2004b. Effect of oysters(Crassostrea virginica) and bottom shear velocity on benthic–pelagic coupling and estuarine water quality. Marine Ecology.Progress Series 271, 61–75.
Porter, E.T., Mason, R., Sanford, L.P., Soulen, H.L., in review-a. Effectof tidal resuspension on benthic–pelagic coupling in an experi-mental ecosytem study. Limnology and Oceanography.
Porter, E.T., Porter, F.S., Mason, R.P., Matthew, R., in review-b.Design of a bivalve gape monitor and measurement of feeding byMercenaria mercenaria (L.) under induced tidal resuspensiion.Marine Biology.
Riisgård, H.U., Kittner, C., Seerup, D.F., 2003. Regulation of openingstate and filtratioin rate in filter-feeding bivalves (Cardium edule,Mytilus eduliis, Mya arenaria) in response to low algal concentra-tion. Journal of Experimental Marine Biology and Ecology 284,105–127.
Sellers, P., Kelly, C.A., Rudd, J.W.M., MacHutchon, A.R., 1996.Photodegradation of methylmercury in lakes. Nature 38 (6576),694–697.
Simpson, L.S., Apte, S.C., Batley, G.E., 1998. Effect of short-termresuspension events on trace metal speciation in polluted anoxicsediments. Environmental Science and Technology 32 (5), 620–625.
Stanley, J.G., 1985. Species profiles: Life histories and environmentalrequirements of coastal fishes and invertebrates (mid-atlantic)-hardclam. U.S. Fish Wildl. Serv. Biol. Rep. 82(11.41), U.S. ArmyCorps of Engineers, TR EL-82(11.41).
Stordal, M.C., Gill, G.A., 1995. The determination of mercurymethylation rates using 203-hg radiotracer technique. Water, Airand Soil Pollution 80, 725–734.
Sunderland, E., Gobas, F.A.P.C., Heyes, A., Branfireun, B., Bayer, A.,Cranston, R., Parsons, M., 2004. Speciation and bioavailability ofmercury in well-mixed estuarine sediments. Marine Chemistry 90(1–4), 91–105.
Turner, E.J., Miller, D.C., 1991. Behavior and growth of Mercenariamercenaria during simulated storm events. Marine Biology 111,55–64.
Van Den Berg, G.A., Gustav Loch, J.P., Van Der Heudt, L.M.,Zwolsman, J.J.G., 1998. Vertical distribution of acid-volatilesulfide and simultaneously extracted metals in a recent sedimen-tation area of the river Meuse in the Netherlands. EnvironmentalToxicology and Chemistry 17 (4), 758–763.
Van Griethuysen, C., Gillissen, F., Koelmans, A.A., 2002. Measuringacid volatile sulphide in floodplain lake sediments: Effect of reactiontime, sample size and aeration. Chemosphere 47, 395–400.
Wainright, S.C., Hopkinson Jr., C.S., 1997. Effects of sedimentresuspension on organic matter processing in coastal environments:a simulation model. Journal of Marine Systems 11, 353–368.

315E.-H. Kim et al. / Marine Chemistry 102 (2006) 300–315
Wang, W.X., Stupakoff, I., Gagnon, C., Fisher, N.S., 1998.Bioavailability of inorganic and methylmercury to a marinedeposit feeding polychaete. Environmental Science and Techno-logy 32 (17), 2564–2571.
Weber, J.H., 1993. Review of possible paths for abiotic methylation ofmercury(II) in the aquatic environment. Chemosphere 26 (11),2063–2077.
Winkels, H.J., Blom, G., Korrnenberg, S.B., Lijklema, L., 1998.Dilution of riverine heavy metal input concentrations by suspensionof sediments and algal growth in the Ijsselmeer. Water Research 32(10), 2931–2940.