Sunlight-induced rapid and efficient biogenic synthesis of ...
RESEARCH ARTICLE10.1002/2014JC010188
Effects of ocean acidification on the biogenic composition ofthe sea-surface microlayer: Results from a mesocosm studyLuisa Galgani1,2, Christian Stolle3, Sonja Endres1, Kai G. Schulz1,4, and Anja Engel1
1Geomar Helmholtz Centre for Ocean Research, Kiel, Germany, 2Alfred Wegener Institute, Helmholtz Centre for Polar andMarine Research, Bremerhaven, Germany, 3Leibniz Institute for Baltic Sea Research, Rostock, Germany, 4School ofEnvironmental Science and Management, Centre for Coastal Biogeochemistry, Southern Cross University, Lismore, NewSouth Wales, Australia
Abstract The sea-surface microlayer (SML) is the ocean’s uppermost boundary to the atmosphere and incontrol of climate relevant processes like gas exchange and emission of marine primary organic aerosols(POA). The SML represents a complex surface film including organic components like polysaccharides, pro-teins, and marine gel particles, and harbors diverse microbial communities. Despite the potential relevanceof the SML in ocean-atmosphere interactions, still little is known about its structural characteristics and sen-sitivity to a changing environment such as increased oceanic uptake of anthropogenic CO2. Here we reportresults of a large-scale mesocosm study, indicating that ocean acidification can affect the abundance andactivity of microorganisms during phytoplankton blooms, resulting in changes in composition and dynam-ics of organic matter in the SML. Our results reveal a potential coupling between anthropogenic CO2 emis-sions and the biogenic properties of the SML, pointing to a hitherto disregarded feedback process betweenocean and atmosphere under climate change.
1. Introduction
Recent studies have emphasized that the composition of the SML is characterized by high abundance ofmarine gel particles [Cunliffe and Murrell, 2009; Wurl and Holmes, 2008], hydrated organic supramolecularstructures vitally important for microbial processes and carbon cycling in the ocean [Passow, 2002b]. Hydro-gels originate from high molecular weight polymers like polysaccharides and peptides that are released byphytoplankton and bacterioplankton cells during growth and decay [Chin et al., 1998; Engel et al., 2004]. Inan initial step, these polymers assemble to water insoluble colloidal nano and microgels [Chin et al., 1998;Verdugo et al., 2004], and further aggregate to larger particles of several millimeters size [Engel et al., 2004;Verdugo, 2012]. Polysaccharidic gels in the ocean, such as transparent exopolymer particles (TEP), have beenattributed mainly to phytoplankton exudation [Passow, 2002b], while the production of protein-containinggels, such as coomassie stainable particles (CSP) has been related to cell lysis and decomposition, as well asto the absorption of proteins onto nonproteinaceous particles [Long and Azam, 1996]. Physical accumula-tion of gels particles in the SML can result from gels ascending the water column due to their low density,and by adsorption of gels or gel precursors onto rising bubbles [Azetsu and Passow, 2004; Zhou et al., 1998].
Polysaccharidic and proteinaceous gels may be closely associated, but are operationally confined into twodistinct classes according to analytical techniques [Engel, 2009]. In the ocean, and also within the SML,organic gel particles represent substrates for marine phytoplankton and bacterioplankton to attach andgrow upon, facilitating the formation of an active biofilm [Cunliffe et al., 2011; Flemming and Wingender,2010; Long and Azam, 1996; Passow, 2002b]. In addition to gels ascending from the water column, de novoproduction of gels can occur within the SML due to compression of dissolved organic matter (DOM) duringsurface wave action [Wurl et al., 2011b], or as a consequence of photochemical and bacterial breakdown ofparticles [Lechtenfeld et al., 2013]. Waves and turbulent shear may further facilitate the collision and aggre-gation of gels within the SML [Kuznetsova et al., 2005; Wurl and Holmes, 2008].
Organic particles in the SML, such as marine gels, might provide a new source for submicron POA duringthe emission of sea spray to the lower atmosphere [Leck and Bigg, 2005]. Water insoluble organic particlesdominate total submicron marine aerosol mass during bloom periods [O’Dowd et al., 2004]. These particles
Key Points:� Proteinaceous compounds represent
a large fraction of gels in marinemicrolayer� Microbial activity mediates organic
composition of the sea-surfacemicrolayer� Ocean acidification can affect the
organic composition of themicrolayer
Supporting Information:� Readme� Graphical abstract/diagram
Correspondence to:A. Engel,[email protected]
Citation:Galgani, L., C. Stolle, S. Endres,K. G. Schulz, and A. Engel (2014),Effects of ocean acidification on thebiogenic composition of the sea-surface microlayer: Results from amesocosm study, J. Geophys. Res.Oceans, 119, doi:10.1002/2014JC010188.
Received 26 MAY 2014
Accepted 17 OCT 2014
Accepted article online 24 OCT 2014
GALGANI ET AL. VC 2014. American Geophysical Union. All Rights Reserved. 1
Journal of Geophysical Research: Oceans
PUBLICATIONS
originating by bubble bursting events have a polysaccharidic composition [Russell et al., 2010] and are sug-gested to act as cloud condensation nuclei (CCN) in regions such as the high Arctic, where low-level cloudsplay a climate-regulating role by reflecting incoming solar radiation [Leck and Bigg, 2005; Orellana et al.,2011]. Moreover, it has been suggested that amino acids and proteinaceous gels become enriched in SMLand sea-spray aerosols [Kuznetsova et al., 2005]. Marine POA-cloud feedback processes are an emergingissue in present day and future scenarios of surface ocean-lower atmosphere interactions, due to their highpotential of controlling earth’s radiation budget and energy fluxes [Solomon et al., 2007]. Despite their sug-gested role as marine source for POA [Quinn and Bates, 2011], still little is known about the factors control-ling the accumulation, size distribution, and composition of gels in the SML.
The ocean is known to act as a net sink for atmospheric carbon dioxide (CO2) [Sabine et al., 2004]. Therefore,the continuous increase in atmospheric anthropogenic CO2 concentration leads to a progressive decline inocean’s pH [Caldeira and Wickett, 2003; Sabine et al., 2004]. This is known as ocean acidification [Caldeiraand Wickett, 2003], with potential consequences for marine microbial activity [Endres et al., 2014; Engel et al.,2013; Grossart et al., 2006; Piontek et al., 2010]. In the ocean, rising uptake of anthropogenic CO2 mayenhance autotrophic carbon fixation and increase the extracellular release of organic polymers from phyto-plankton [Engel et al., 2013; Hein and Sand-Jensen, 1997]. Thereby, a high production of extracellular poly-mers supports the accumulation of gel particles [Borchard and Engel, 2012; Engel, 2002] that may contributeto surface biofilm formation. Enhanced organic matter production might be counteracted by higher hetero-trophic activity under future ocean conditions [Piontek et al., 2010], and thus changing the balance of auto-trophy versus heterotrophy with possible positive feedbacks on rising atmospheric CO2 [Del Giorgio andDuarte, 2002].
Here we show results from a large-scale pH perturbation experiment with the Kiel Off-Shore Mesocosms forfuture Ocean Simulation (KOSMOS) in Raunefjord, Norway, in the aftermath of a spring bloom. The aim ofthis study was to examine the coupling between phytoplankton bloom development and the accumulation,composition and microbial dynamics of organic matter in the SML in response to CO2 enrichment asexpected for future ocean acidification scenarios.
2. Methods
2.1. Experimental SetupBetween 8 May 2011 and 6 June 2011, we sampled six KOSMOS mesocosms with a water volume of�75 m3. Two mesocosms with a field pCO2 of about 300 matm were used as control and left without CO2
addition (mesocosms 2 and 4), while four mesocosms were adjusted to initial target pCO2 levels of 600(mesocosm 8), 900 (mesocosm 1), 1300 (mesocosm 5), and 2000 matm (mesocosm 7) obtained by the pro-gressive addition of CO2-rich seawater as described in Riebesell et al. [2013] and Endres et al. [2014]. The CO2
addition was finalized on experimental day 5. In the afternoon of experimental day 14 (22 May), nutrientswere added to all mesocosms to a final concentration of 5 mmol L21 nitrate and 0.16 mmol L21 phosphatein order to stimulate a phytoplankton bloom. Median pH values of the whole period at in situ temperatureranged from 8.10 in control (mesocosms 2 and 4) to 7.56 at the highest pCO2 level (mesocosm 7). Watertemperature ranged from 6.8�C at the beginning of the experiment to 10.0�C at the end.
SML sampling started 1 day before the first CO2 addition (termed ‘‘day 21’’) and was repeated every secondday between 7 and 9 am, before the main sampling of the mesocosms water column. Previous studies,including mesocosms experiments, have investigated the time of SML reformation and consistently showthat chemical and biological components as well as microbial activity within the SML reestablish quicklyafter a disruption with observed timescales being typically <1 min [see Cunliffe et al., 2013, for review].
SML samples were collected with a glass plate sampler [Harvey and Burzell, 1972], made of silicate glass(5 mm thickness) and with an effective surface area of 5600 cm2 (considering both sides). For each sample,the glass plate was inserted into the water perpendicular to the surface and withdrawn at a controlled rateof �20 cm s21. The sample, retained on the glass because of surface tension, was removed with the help ofa Teflon wiper. For each sample, the procedure was repeated three times. Samples were collected into acidcleaned (HCl, 10%) and Milli-Q washed glass bottles. Prior to sampling, both glass plate and wiper werewashed with HCl (10%) and intensively rinsed with Milli-Q water. Between samplings, both instrumentswere copiously rinsed with fjord water in order to minimize their contamination with alien material while
Journal of Geophysical Research: Oceans 10.1002/2014JC010188
GALGANI ET AL. VC 2014. American Geophysical Union. All Rights Reserved. 2
handling or transporting the devices. The surface area of each mesocosms was about 31,416 cm2, andallowed only for a limited sampling. Therefore, SML samples from similar pCO2 levels were combined foranalyses: mesocosms 2 and 4, as control, mesocosms 1 and 8, as medium pCO2, and mesocosms 5 and 7 ashigh pCO2.
The SML thickness (d, cm) was estimated as follows:
d5V=A (1)
where V is the SML volume collected, i.e., 60–140 mL, and A is 3 times the sampling area of the glass plate(A 5 16,800 cm2). Assuming a maximum thickness of the SML of 100 3 1024 cm, and considering the sam-pling area of the mesocosms, we choose to standardize our sampling procedure to three dips of the glassplate to avoid dilution with the underlying water. During this study, d ranged from 36 to 89 3 1024 cm,increasing during the development of the phytoplankton blooms. Throughout the whole experiment, theSML thickness was not significantly different between mesocosms (Kruskal-Wallis one way ANOVA on ranks,p 5 0.442). Average values for d were in fact very similar: for the control treatment d 5 61 6 11 3 1024 cm(mesocosm 2) and 64 6 11 3 1024 cm (mesocosm 4), for medium pCO2 treatment d 5 68 6 11 3 1024 cm(mesocosm 8) and 63 6 9 3 1024 cm (mesocosm 1), for high pCO2 treatment d 5 64 6 12 3 1024 cm (mes-ocosm 5) and 64 6 9 3 1024 cm (mesocosm 7).
2.2. Parameters and Statistical AnalysisChlorophyll a (mg L21) from the mesocosms water column (depth-integrated between 0.3 and 23 m) wasdetermined with a TURNER 10-AU fluorometer according to Welschmeyer [1994]. Samples were prepared byfiltering 250–500 mL onto GF/F filters (Whatmann), stored at 280�C for at least 24 h, and homogenized in90% acetone using glass beads (2 and 4 mm) in a cell mill. Results are shown as averages of mesocosms 2and 4 (control), mesocosms 1 and 8 (medium pCO2), and mesocosms 5 and 7 (high pCO2). For a detaileddescription of chlorophyll a in the water column of individual mesocosms, we refer to Endres et al. [2014].
For total hydrolysable amino acids (THAA), 5 mL of sample was filled into precombusted glass vials (8 h,500�C) and stored at 220�C until analysis. Analysis was performed according to Lindroth and Mopper[1979]. Duplicate samples were analyzed with a detection limit of 2 nM on a HPLC system (1260, Agilent).Thirteen different amino acids were separated with a C18 column (Phenomenex Kinetex, 2.6 mm, 150 3
4.6 mm) after in-line derivatization with o-phtaldialdehyde and mercaptoethanol. For total combined carbo-hydrates >1 kDa (TCCHO), 15 mL was filled into precombusted glass vials (8 h, 500�C) and kept frozen at220�C until analysis. The analysis was conducted according to Engel and H€andel [2011] applying HPAEC-PAD on a Dionex ICS 3000. Samples were desalinated by membrane dialysis (1 kDa MWCO, Spectra Por) for5 h at 6�C, hydrolyzed for 20 h at 100�C with 0.8 M HCl final concentration, and neutralized through acidevaporation (N2, 5 h, 50�C) Two replicate samples were analyzed. For bacterial cell numbers, 1 mL samplewas fixed with 100 mL paraformaldehyde (1% final concentration)/glutaraldehyde (0.05% final concentra-tion) for 30 min in the dark, and stored at 280�C until enumeration. Samples were stained with SYBR GreenI (Molecular Probes). Heterotrophic bacteria were enumerated using a flow cytometer (Becton & DickinsonFACScalibur) equipped with a laser emitting at 488 nm and detected by their signature in a plot of side scat-ter (SSC) versus green fluorescence (FL1). Yellow-green latex beads (Polysciences, 0.5 mm) were used asinternal standard. Based on the bacterial abundances, bacterial nitrogen (Nbac) and carbon (Cbac) concentra-tions were calculated, assuming 2.2 6 0.3 fg cell21 N and 9 6 1 fg cell21 C for bacteria in Raunefjord in June[Fagerbakke et al., 1996].
Phytoneuston, i.e., phytoplankton cells collected from the SML, were also determined by flow cytometry fol-lowing the protocol of Marie et al. [2010] and using 1 mL samples. Phytoneuston cells were fixed, and storedas bacteria cells. Cell abundance and size clusters were detected without staining by their signature in aplot of orange versus red fluorescence. Latex beads (3 mm) were used as internal standard.
Incorporation of 3H-methyl-thymidine (3H-TdR, 60.1 Ci mmol21, 50 nM final concentration, Hartmann Ana-lytics) and 14C-leucine (261 mCi mmol21, 50 nM final concentration, Hartmann Analytics) was measured toestimate bacterial biomass production (BP) in 2.5 mL water samples according to the method of Chin-Leoand Kirchman [1988]. Duplicate samples were incubated for 60–90 min at the in situ temperature in thedark. Incorporation was stopped by addition of formaldehyde (10% v/w) and fixation in the dark at 5�C. Athird sample, serving as a blank, was fixed for at least 10 min prior to the addition of substrates. Samples
Journal of Geophysical Research: Oceans 10.1002/2014JC010188
GALGANI ET AL. VC 2014. American Geophysical Union. All Rights Reserved. 3
were filtered first onto 3 mm polycarbonate filters (Millipore) to determine BP of particle-associated bacteria.The filtrate was subsequently filtered onto 0.2 mm polycarbonate filters (Millipore) to determine BP of thefraction <3 mm. Activity of samples was measured in a scintillation counter (Packard) after addition of 4 mLscintillation cocktail. Particle-associated activity was below the detection limit for nearly all samples, indicat-ing very low contribution of the size-fraction >3 mm to total BP. Thus, only BP of the fraction <3 mm is pre-sented here. In order to allow for direct comparison with the chemical data, results of microbial abundanceand BP were combined as follows: control (mesocosms 2 and 4), medium pCO2 (mesocosms 1 and 8), andhigh pCO2 (mesocosms 5 and 7).
Total area, particle numbers, and equivalent spherical diameter (dp) of gel particles were determined bymicroscopy after Engel [2009]. Therefore, 20–30 mL were filtered onto 0.4 mm Nuclepore membranes (What-mann) and stained with 1 mL Alcian Blue solution for polysaccharidic gels and 1 mL Coomassie BrilliantBlue G (CBBG) working solution for proteinaceous gels. Filters were mounted onto CytoclearVC slides andstored at 220�C until microscopy analysis.
The size-frequency distribution of polysaccharidic and proteinaceous gels was described by:
dN=dðdpÞ5kddp (2)
where dN is the number of particles per unit water volume in the size range dp to [dp 1 d(dp)] [Mari and Kiør-boe, 1996]. The factor k is a constant that depends on the total number of particles per volume, and d(d< 0) describes the spectral slope of the size distribution. The less negative is d, the greater is the fractionof larger gels. Both d and k were derived from regressions of log[dN/d(dp)] versus log[dp].
Effects of a treatment, such as pCO2 perturbation, during a mesocosms study can be identified against tem-poral variability by calculating the deviation of each treatment from the overall mean of the mesocosms[Endres et al., 2014; Engel et al., 2013]. Here deviations of each treatment (j) for days (i 5 21, . . ., 29) are
given by yij5ðxij2�y iÞ, with �y i513
X3
j
ðxjÞi , and are reported as mean deviation (MD) of absolute values, or as
total deviation (TD) of values normalized to �y i . We considered every treatment as an independent data setof replicate samples. Statistical tests were performed with SigmaPlot package (Systat Software Inc.). Statisti-cal significance was accepted for p< 0.05. Pearson correlation coefficients and Spearman correlation coeffi-cients were determined for normal and nonnormal distributed data, respectively, on all parameters overtime (Figure 1). Detailed correlations according to the different CO2 treatments are given in Table 1. Statisti-cal significance of a CO2 effect was determined with Kolmogorov-Smirnov tests on nonnormalized dailyanomalies given the data being normal distributed (Table 2). Average values are reported with 61 standarddeviation.
Wind data have been retrieved from the free service provided by the Norwegian Meteorological Institute(http://eklima.met.no/).
3. Results and Discussion
3.1. Temporal Development of Biogenic Properties3.1.1. Autotrophic Community in the Water Column and SMLTwo phytoplankton blooms were observed in the water column of the mesocosms, as derived fromincreases in chlorophyll a concentrations (Figure 1a). In all mesocosms, the first bloom occurred around day3 and was mainly dominated by chlorophyta and diatoms [Endres et al., 2014; J. R. Berm�udez et al., personalcommunication, 2012). On day 3, the average chlorophyll a concentrations were 3.24 6 0.25 mg L21 (con-trol), 3.59 6 0.37 mg L21 (medium pCO2), and 3.58 6 0.22 mg L21 (high pCO2). The second bloom wasinduced by the addition of nutrients, with average chlorophyll a concentrations at day 19 of 4.14 6 0.19 mgL21 (control), 4.62 6 0.04 mg L21 (medium pCO2), and 3.41 6 0.40 mg L21 (high pCO2) (Figure 1a). The mainspecies observed during the second bloom phase were diatoms, cryptophythes, chlorophytes, and hapto-phytes (J. R. Berm�udez et al., personal communication, 2012). Generally, chlorophyll a showed the highestconcentrations in the high pCO2 treatment during the first bloom phase, while after the addition ofnutrients highest values were recorded in the medium treatment. This pattern was also observed in a previ-ous study [Schulz et al., 2013] and suggests that nutrient availability can modify the response of a plankton
Journal of Geophysical Research: Oceans 10.1002/2014JC010188
GALGANI ET AL. VC 2014. American Geophysical Union. All Rights Reserved. 4
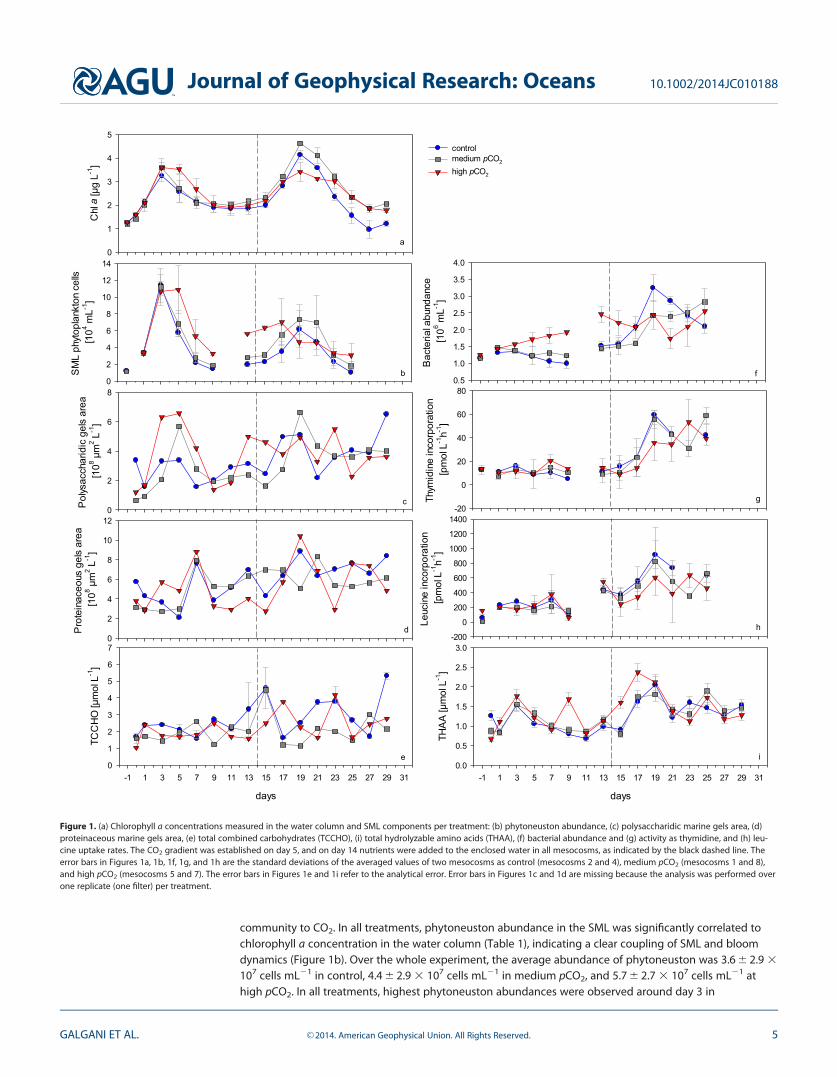
community to CO2. In all treatments, phytoneuston abundance in the SML was significantly correlated tochlorophyll a concentration in the water column (Table 1), indicating a clear coupling of SML and bloomdynamics (Figure 1b). Over the whole experiment, the average abundance of phytoneuston was 3.6 6 2.9 3
107 cells mL21 in control, 4.4 6 2.9 3 107 cells mL21 in medium pCO2, and 5.7 6 2.7 3 107 cells mL21 athigh pCO2. In all treatments, highest phytoneuston abundances were observed around day 3 in
days
-1 1 3 5 7 9 11 13 15 17 19 21 23 25 27 29 31
THA
A [
mol
L-1
]
0.0
0.5
1.0
1.5
2.0
2.5
3.0
Chl
a [
g L-1
]
0
1
2
3
4
5controlmedium pCO2
high pCO2
Pol
ysac
char
idic
gel
s ar
ea
[108
m2 L
-1]
0
2
4
6
8
Pro
tein
aceo
us g
els
area
[1
08m
2 L-1
]
0
2
4
6
8
10
12
days
-1 1 3 5 7 9 11 13 15 17 19 21 23 25 27 29 31
TCC
HO
[m
ol L
-1]
0
1
2
3
4
5
6
7
a
c
d
e
SM
L ph
ytop
lank
ton
cells
[1
04 mL-1
]
0
2
4
6
8
10
12
14
b
Bac
teria
l abu
ndan
ce
[106 m
L-1]
0.5
1.0
1.5
2.0
2.5
3.0
3.5
4.0
Thym
idin
e in
corp
orat
ion
[pm
ol L
-1h-1
]
-20
0
20
40
60
80
Leuc
ine
inco
rpor
atio
n [p
mol
L-1
h-1]
-200
0
200
400
600
800
1000
1200
1400
f
g
h
i
Figure 1. (a) Chlorophyll a concentrations measured in the water column and SML components per treatment: (b) phytoneuston abundance, (c) polysaccharidic marine gels area, (d)proteinaceous marine gels area, (e) total combined carbohydrates (TCCHO), (i) total hydrolyzable amino acids (THAA), (f) bacterial abundance and (g) activity as thymidine, and (h) leu-cine uptake rates. The CO2 gradient was established on day 5, and on day 14 nutrients were added to the enclosed water in all mesocosms, as indicated by the black dashed line. Theerror bars in Figures 1a, 1b, 1f, 1g, and 1h are the standard deviations of the averaged values of two mesocosms as control (mesocosms 2 and 4), medium pCO2 (mesocosms 1 and 8),and high pCO2 (mesocosms 5 and 7). The error bars in Figures 1e and 1i refer to the analytical error. Error bars in Figures 1c and 1d are missing because the analysis was performed overone replicate (one filter) per treatment.
Journal of Geophysical Research: Oceans 10.1002/2014JC010188
GALGANI ET AL. VC 2014. American Geophysical Union. All Rights Reserved. 5

concomitance with the first phytoplankton bloom in the underlying water yielding 11.4 6 1.2 3 107 cellsmL21 (control), 11.2 6 2.2 3 107 cells mL21 (medium pCO2), and 10.6 6 1.3 3 107 cells mL21 (high pCO2).After nutrient addition, highest phytoneuston abundances coincided with the second phytoplankton bloompeak around day 19, but, with generally lower values of 6.2 6 2.2 3 107 cells mL21 (control), 7.3 6 1.8 3 107
cells mL21 (medium pCO2), and 4.6 6 1.9 3 107 cells mL21 (high pCO2).
Bloom development in the underlying water also influenced the organic composition of the SML. Withincreasing pCO2, abundance of polysaccharidic gels in the SML became significantly related to chlorophyll a
Table 1. Correlations Among Different Parameters Measured Within Each Treatment Based on Pearson Correlation Coefficient and Spearman Correlation Coefficient (*)a
Journal of Geophysical Research: Oceans 10.1002/2014JC010188
GALGANI ET AL. VC 2014. American Geophysical Union. All Rights Reserved. 6
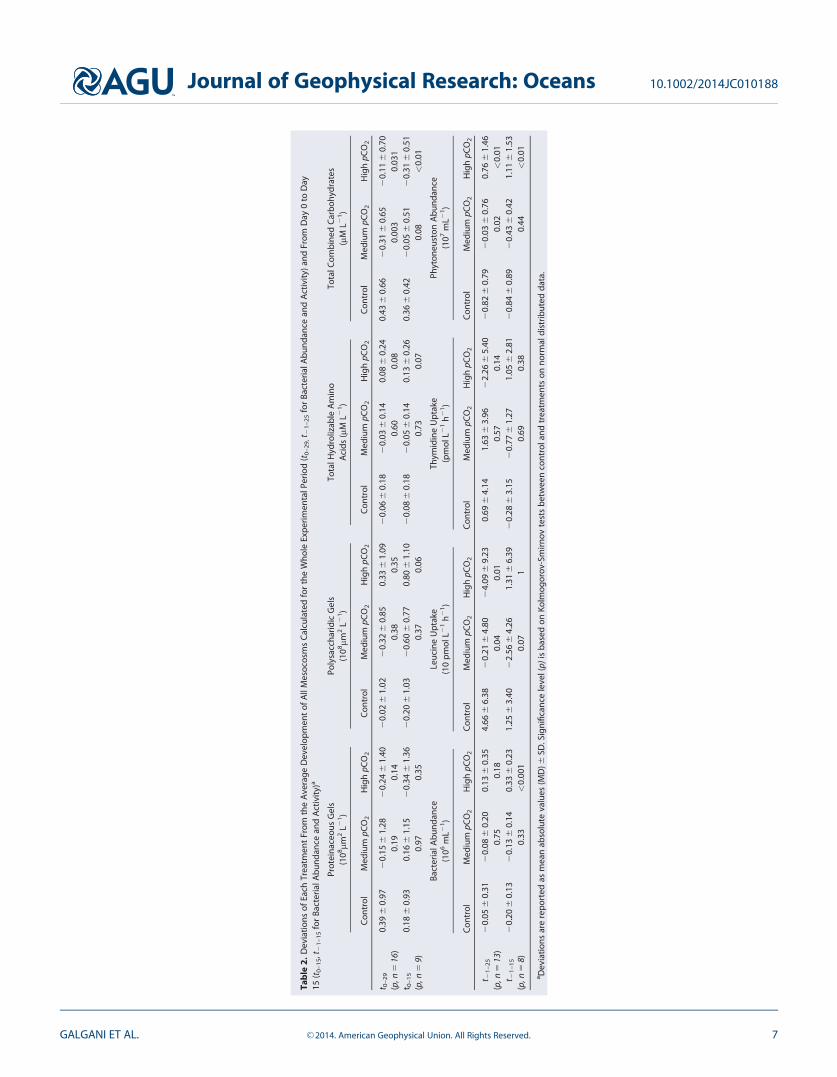
Tab
le2.
Dev
iatio
nsof
Each
Trea
tmen
tFr
omth
eA
vera
geD
evel
opm
ent
ofA
llM
esoc
osm
sC
alcu
late
dfo
rth
eW
hole
Expe
rimen
talP
erio
d(t
0–
29,
t 21
–2
5fo
rBa
cter
ialA
bund
ance
and
Act
ivity
)and
From
Day
0to
Day
15(t
0–
15,
t 21
–1
5fo
rBa
cter
ialA
bund
ance
and
Act
ivity
)a
Prot
eina
ceou
sG
els
(108mm
2L2
1)
Poly
sacc
harid
icG
els
(108mm
2L2
1)
Tota
lHyd
roliz
able
Am
ino
Aci
ds(m
ML2
1)
Tota
lCom
bine
dC
arbo
hydr
ates
(mM
L21)
Con
trol
Med
ium
pCO
2H
igh
pCO
2C
ontr
olM
ediu
mpC
O2
Hig
hpC
O2
Con
trol
Med
ium
pCO
2H
igh
pCO
2C
ontr
olM
ediu
mpC
O2
Hig
hpC
O2
t 0–
29
0.39
60.
972
0.15
61.
282
0.24
61.
402
0.02
61.
022
0.32
60.
850.
336
1.09
20.
066
0.18
20.
036
0.14
0.08
60.
240.
436
0.66
20.
316
0.65
20.
116
0.70
(p,n
516
)0.
190.
140.
380.
350.
600.
080.
003
0.03
1t 0
–1
50.
186
0.93
0.16
61.
152
0.34
61.
362
0.20
61.
032
0.60
60.
770.
806
1.10
20.
086
0.18
20.
056
0.14
0.13
60.
260.
366
0.42
20.
056
0.51
20.
316
0.51
(p,n
59)
0.97
0.35
0.37
0.06
0.73
0.07
0.08
<0.
01
Bact
eria
lAbu
ndan
ce(1
06m
L21)
Leuc
ine
Upt
ake
(10
pmol
L21
h21)
Thym
idin
eU
ptak
e(p
mol
L21
h21)
Phyt
oneu
ston
Abu
ndan
ce(1
07m
L21)
Con
trol
Med
ium
pCO
2H
igh
pCO
2C
ontr
olM
ediu
mpC
O2
Hig
hpC
O2
Con
trol
Med
ium
pCO
2H
igh
pCO
2C
ontr
olM
ediu
mpC
O2
Hig
hpC
O2
t 21
–2
52
0.05
60.
312
0.08
60.
200.
136
0.35
4.66
66.
382
0.21
64.
802
4.09
69.
230.
696
4.14
1.63
63.
962
2.26
65.
402
0.82
60.
792
0.03
60.
760.
766
1.46
(p,n
513
)0.
750.
180.
040.
010.
570.
140.
02<
0.01
t 21
–1
52
0.20
60.
132
0.13
60.
140.
336
0.23
1.25
63.
402
2.56
64.
261.
316
6.39
20.
286
3.15
20.
776
1.27
1.05
62.
812
0.84
60.
892
0.43
60.
421.
116
1.53
(p,n
58)
0.33
<0.
001
0.07
10.
690.
380.
44<
0.01
a Dev
iatio
nsar
ere
port
edas
mea
nab
solu
teva
lues
(MD
)6SD
.Sig
nific
ance
leve
l(p)
isba
sed
onKo
lmog
orov
-Sm
irnov
test
sbe
twee
nco
ntro
land
trea
tmen
tson
norm
aldi
strib
uted
data
.
Journal of Geophysical Research: Oceans 10.1002/2014JC010188
GALGANI ET AL. VC 2014. American Geophysical Union. All Rights Reserved. 7
concentration of the water column (Table 1). Phytoplankton exudation represents a specific source of poly-saccharidic gels such as TEP [Passow, 2002b]. Under high CO2 levels, the release of polysaccharidic precur-sors by phytoplankton has been shown to increase [Borchard and Engel, 2012] leading to higher gel particleabundance [Engel, 2002]. While organic matter composition of the SML is controlled by a variety of proc-esses, a stimulating effect of CO2 on phytoplankton could be one factor leading to a tighter couplingbetween concentrations of polysaccharidic gels in the SML and chlorophyll a in the water column.
3.1.2. Organic Matter: Marine Gels, Carbohydrates, and Amino AcidsOver the whole experiment, polysaccharidic gels in the SML averaged 3.4 6 1.3 3 108 mm2 L21 (control),3.1 6 1.6 3 108 mm2 L21 (medium pCO2), and 3.7 6 1.7 3 108 mm2 L21 (high pCO2). Polysaccharidic gelswere generally less abundant than proteinaceous gels with 5.9 6 1.9 3 108 mm2 L21 (control), 5.4 6 1.7 3
108 mm2 L21 (medium pCO2), and 5.3 6 2.4 3 108 mm2 L21 (high pCO2). Whereas highest concentrations ofpolysaccharidic gels coincided with the first phytoplankton bloom peak (Figure 1c), abundance of proteina-ceous particles was highest 4 days thereafter (Figure 1d). This delay in peak concentrations was notobserved after nutrient addition, when proteinaceous gels as well as chlorophyll a concentrations werehighest around day 19.
Bacterial degradation of organic compounds requires time and the presence of specific extracellularenzymes able to break up larger molecules for bacterial assimilation [Arnosti, 2011]. Extracellular enzymesreleased by marine bacteria as well as protein material derived from cell lysis can contribute to a biofilmmatrix [Flemming and Wingender, 2010] and to proteinaceous gels [Bar-Zeev et al., 2012; Long and Azam,1996]. We therefore suggest that extracellular proteins derived from bacterial decomposition of organicmatter or extracellular enzymes themselves contributed to the built-up of the proteinaceous gel particlespool in the SML, thus explaining a delay of a couple of days. Bacterial abundances increased in the courseof the experiment and were much higher during the second bloom. Thus, the impact of bacteria on theorganic matter pool was likely more immediate at that time (Figure 1f).
After nutrient addition, total combined carbohydrates (TCCHO) in the SML reached higher values but werealso more variable than during the first bloom period (Figure 1e). Average concentrations of TCCHO duringthe whole experiment were 2.8 6 1.1 mmol L21 (control), 2.0 6 0.8 mmol L21 (medium pCO2), and 2.2 6 0.8mmol L21 (high pCO2). In contrast to polysaccharidic gels, TCCHO concentration was not significantly relatedto the chlorophyll a development in any treatment (Table 1).
Average total hydrolysable amino acids (THAA) concentrations during the whole experiment were 1.2 6 0.4,1.3 6 0.4, and 1.4 6 0.5 mmol L21 in control, medium, and high pCO2 treatments, respectively. In contrast toTCCHO, development of THAA concentration in the SML resembled more the chlorophyll a development ofthe water column, with highest concentrations reached around bloom peak days 3 and 19 (Figure 1i). Dur-ing the first phytoplankton bloom, THAA concentration in control treatment was 1.5 6 0.2 mmol L21, inmedium pCO2 was 1.6 6 0.2 mmol L21, and in high was pCO2 1.8 6 0.2 mmol L21 (day 3). During the secondphytoplankton bloom, 2.0 6 0.2 mmol L21 was the concentration of THAA for control (day 19), 1.8 6 0.2mmol L21 in medium pCO2 (day 19), and 2.4 6 0.2 mmol L21 was found in high pCO2 (day 17). Concentra-tions of THAA as well as of TCCHO during this study were in good accordance with previous observations ofthe SML in natural marine systems [Kuznetsova et al., 2005; Wurl and Holmes, 2008].
3.1.3. Heterotrophic Response to Changes in the Organic MatterBacterial abundance and activity (BP) within the SML increased considerably after nutrient addition, showinga clear peak on day 19 concomitant to the second phytoplankton bloom (Figures 1f–1h). Average abundanceswere 1.8 6 0.7 3 106 cells mL21 (control), 1.7 6 0.6 3 106 cells mL21 (medium pCO2), and 1.9 6 0.4 3 106 cellsmL21 (high pCO2) (Figure 1f). Concomitant with bacterial abundance, also BP increased after nutrient addition.Thymidine uptake rates ranged from 5.12 to 20 pmol L21 h21 during the first bloom phase, and from 14 to 62pmol L21 h21 during the second one. Range of leucine uptake rates were 60–546 pmol L21 h21, and 336–916pmol L21 h21 for the first and second bloom phases, respectively (Figures 1g and 1h).
Bacterial abundance and BP were positively correlated to THAA concentrations in the control andmedium pCO2 (Table 1) suggesting a contribution of bacterial biomass to the amino acids pool. Accordingto our estimates of bacterial C and N contents, both Nbac and Cbac significantly correlated to THAA-N andTHAA-C (p< 0.05, n 5 12). The average contributions of Nbac and Cbac to THAA-N and THAA-C were11.3 6 2.3 (%-Nbac) and 22.1 6 4.6 (%-Cbac).
Journal of Geophysical Research: Oceans 10.1002/2014JC010188
GALGANI ET AL. VC 2014. American Geophysical Union. All Rights Reserved. 8

3.1.4. The SML RevealsStrong Temporal VariabilityOrganic films at the sea-surface are suggested toaffect the molecular diffusionof gases by inhibiting thetransfer rates across the air-sea interface [Liss and Duce,2005]. For this purpose, thethickness of the SML is a rel-evant parameter. In our mes-ocosms, we did not detectany significant differences ofthickness between the treat-ments (p 5 0.442). During theexperiment the thickness ofthe SML increased slightly,yielding an average thicknessof the SML in the prenutrientaddition phase of 58 6 6 3
1024 and 69 6 5 3 1024 cmafterward. Average windspeeds were very similar inboth phases, with 5.6 6 2.4 ms21 before nutrient additionand 5.7 6 2.5 m s21 there-after. However, higher windspeeds were observed at cer-tain days reaching 8.9 m s21,particularly during the secondhalf of the experiment (day17). Although it is notstraightforward to establish adirect correlation betweenthe wind speed and thethickness of the SML meas-ured in enclosed bags asmesocosms, it has been pre-viously shown that at higherwind speed the thickness ofopen sea SML collected canalso be larger, depending onthe wave state [Carlson, 1982;Falkowska, 1999]. Thus, somevariability of SML parameters
observed during the second half of the experiment may be due to increased turbulence inside themesocosms.
3.2. Effect of pCO2 on the SML CompositionComparison of the three treatments revealed a potential effect of CO2 on individual components of the SML,and a potential coeffect of nutrient availability. Therefore, we analyzed data for the whole experimentalperiod, as well as for the period prior to nutrient addition separately (Table 2). Statistical significance levels areshown in Table 2. A pCO2 impact on gel particles was not obvious. During the first bloom phase, total area ofpolysaccharidic gels was higher at high pCO2 (Figure 1c), but differences between treatments were not signifi-cant, neither for the prebloom nor for the whole period (Table 2). Nutrient addition clearly coaffected
Bac
teria
l abu
ndan
ce
-3
-2
-1
0
1
2
3
THA
A-2
-1
0
1
2
TCC
HO
-2
-1
0
1
2
controlmedium pCO2
high pCO2
Thym
idin
e up
take
-1.5
-1.0
-0.5
0.0
0.5
1.0
controlmedium pCO2
high pCO2
Leuc
ine
upta
ke
-1.5
-1.0
-0.5
0.0
0.5
1.0
Phy
tone
usto
n ab
unda
nce
-3
-2
-1
0
1
2
3
Pro
tein
aceo
us g
els
area
-2
-1
0
1
2
Pol
ysac
char
idic
gel
s ar
ea
-2
-1
0
1
2
day -1/0 to 15day 17 to 29
Figure 2. Effect of pCO2 in the prenutrient addition phase (t0–15, and t21–15 for bacterialabundance and activity and phytoneuston abundance, black bars) and in the postnutrientaddition phase (t17–29, and t21–25 for bacterial abundance and activity and phytoneustonabundance, white open bars).
Journal of Geophysical Research: Oceans 10.1002/2014JC010188
GALGANI ET AL. VC 2014. American Geophysical Union. All Rights Reserved. 9

polysaccharidic gel abundance in the SML (Figure 2). During the first bloom phase, polysaccharidic gel par-ticles showed a strong positive anomaly, i.e., positive total deviation, in the high pCO2 treatment. After nutri-ent addition, this pattern was reversed and even a slight negative anomaly was observed.
No significant effect of CO2 on proteinaceous gel concentration was revealed either (Table 2). However, pro-teinaceous gel seemed to respond differently to the CO2 treatment compared to polysaccharidic gels. Therewas a steep decrease in total area of proteinaceous gels in the wake of the bloom peaks, particularly pro-nounced at high compared to control and medium pCO2 (Figure 1d). For both bloom phases, TD valuesobserved at high pCO2 for proteinaceous gels were negative, while positive in the control (Figure 2). AlsoTHAA and TCCHO showed a rather opposite behavior with respect to a CO2 response. THAA concentrationsat high pCO2 were generally higher than in the control treatment in both, the total experimental period andprenutrient addition phase, while TCCHO concentrations were significantly lower at higher pCO2 levels(Table 2). Higher THAA concentrations at high pCO2 might be related to higher bacterial biomass contribut-ing to the amino acid pool as bacteria were estimated being up to �22% of THAA-Carbon. Lower TCCHOconcentration at high pCO2 especially in the prenutrient addition phase could reflect the higher bacterialabundance and enhanced heterotrophic degradation activity [Piontek et al., 2010] but may also be relatedto an enhanced formation of polysaccharidic gels within the SML [Engel et al., 2004; Wurl et al., 2011a]. Likefor proteinaceous gels, nutrient addition did not seem to change the response of THAA to the CO2 treat-ment (Figure 2).
Up to day 17, phytoneuston abundance was higher at high pCO2 (Figure 1b), and the analysis of dailyanomalies revealed a positive effect of CO2 on phytoneuston abundances in both prenutrient addition andpostnutrient addition phases (Figure 2 and Table 2). Bacterial abundances in the SML were higher at highpCO2 before nutrient addition and significantly different to the control (Figure 2 and Table 2). This observa-tion agrees well with earlier findings of increased bacterial abundance at high CO2 in the water column ofprevious mesocosm experiments [Engel et al., 2014; Grossart et al., 2006] and of the present experiment[Endres et al., 2014]. After the addition of nutrients on day 14, higher bacterial abundances in the SML wereobserved in the control and medium CO2 mesocosms (Figures 1f and 2). This decrease of bacterial abundan-ces at high pCO2 during the later phase of the experiment may be related to the observed decrease of poly-saccharidic gels, being a substrate of bacteria to attach and grow upon. Despite the stimulating effect ofhigh pCO2 on bacterial abundance during the first bloom phase, BP was not enhanced (Figure 2 and Table2). After nutrient addition, BP rather decreased with increasing CO2, yielding overall lower rates in the highpCO2 treatment compared to the control, as revealed from Leucine uptake (Figure 2 and Table 2). It hasbeen suggested that ascending polysaccharidic gels may act as a vehicle for bacterial transport from thewater column to the SML [Azetsu and Passow, 2004]. Thus, an increment in polysaccharidic gels during thefirst bloom phase could be one factor for increasing bacterial abundance in the SML of high pCO2. A passivetransport of gel particles and bacteria to the SML may also explain the observed differences between bacte-rial abundance and activity (BP).
In the first bloom phase, as bacterial abundance in the SML benefited from increasing pCO2, proteinaceousgels were found in lower concentrations (Figure 2). This observation corroborates previous findings of highrates of extracellular peptide hydrolysis [Kuznetsova and Lee, 2001], and high bacterial uptake rates of aminoacids [Donderski et al., 1998] in the SML, suggesting a preferential degradation of proteins as valuable nutri-tional substrate. Thus bacteria thriving under high pCO2 could be responsible for a decrease of proteinaceous
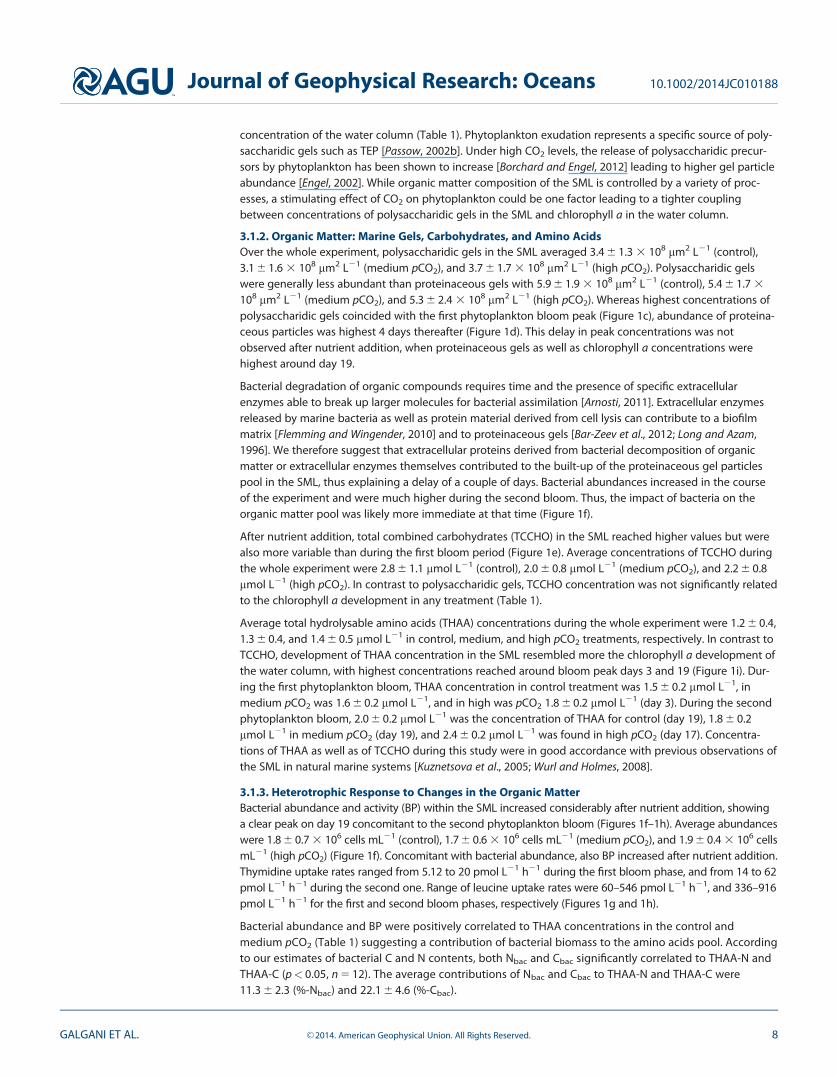
Table 3. Size Frequency Distribution Coefficients k and d and Average Diameter (dp, mm) for Marine Gel Particles From Day 0 to Day 15in Each Treatmenta
y 5 kxd
Proteinaceous Gels Polysaccharidic Gels
Control Medium pCO2 High pCO2 Control Medium pCO2 High pCO2
Average k 20.1 6 15.1 27.4 6 14.4 36.6 6 8.7* 75.7 6 34.6 54.2 6 29.5 87.6 6 49.1d 21.50 6 0.23 21.63 6 0.19 21.77 6 0.15* 22.24 6 0.15 22.19 6 0.11 22.24 6 0.18
Average dp (mm) 2.0 6 0.5 2.0 6 0.4 1.5 6 0.2* 1.2 6 0.2 1.2 6 0.3 1.2 6 0.3
aThe size distribution of marine gels followed the equation y 5 kxd, with y (mL21) being the particles number per size class x (mm),and k (mL21), and d as the spectral slope of the curve. After day 15, combined effects of nutrient addition and CO2 are difficult to discern.Stars (*) indicate statistically significant differences determined with Kolmogorov-Smirnov tests run on nonnormalized anomalies overthe daily average value of all mesocosms until day 15 (* 5 different from control, p< 0.05).
Journal of Geophysical Research: Oceans 10.1002/2014JC010188
GALGANI ET AL. VC 2014. American Geophysical Union. All Rights Reserved. 10
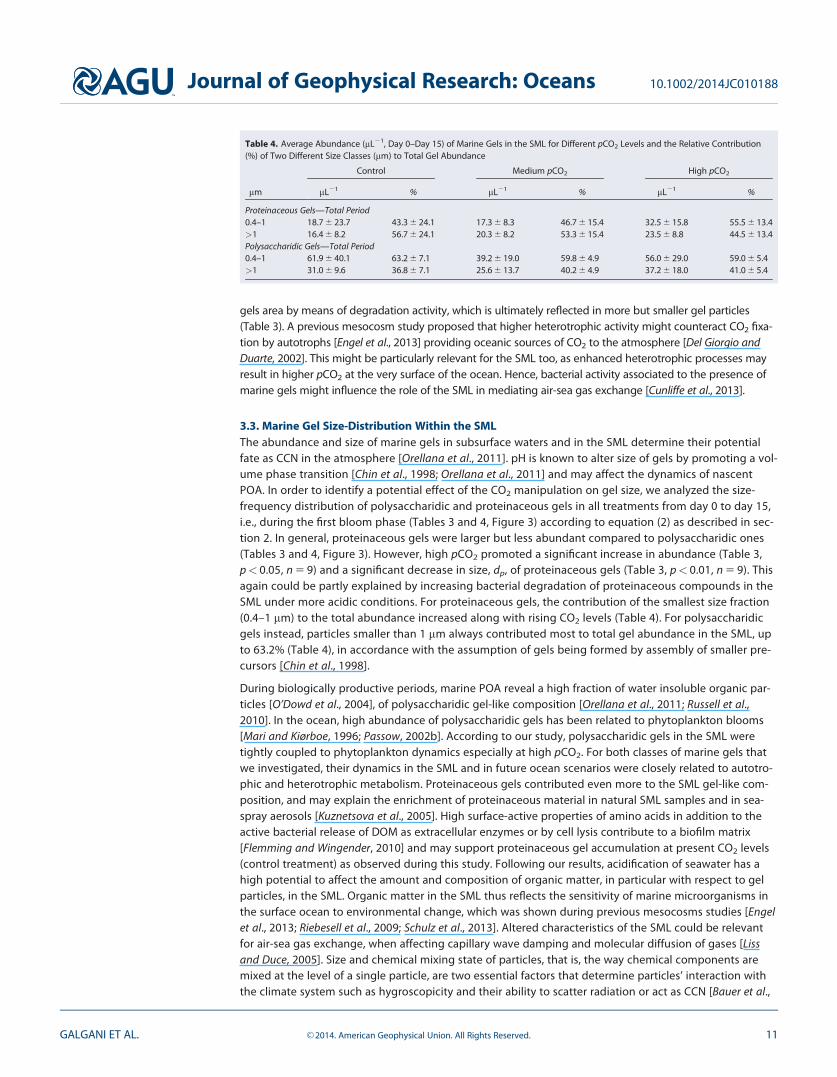
gels area by means of degradation activity, which is ultimately reflected in more but smaller gel particles(Table 3). A previous mesocosm study proposed that higher heterotrophic activity might counteract CO2 fixa-tion by autotrophs [Engel et al., 2013] providing oceanic sources of CO2 to the atmosphere [Del Giorgio andDuarte, 2002]. This might be particularly relevant for the SML too, as enhanced heterotrophic processes mayresult in higher pCO2 at the very surface of the ocean. Hence, bacterial activity associated to the presence ofmarine gels might influence the role of the SML in mediating air-sea gas exchange [Cunliffe et al., 2013].
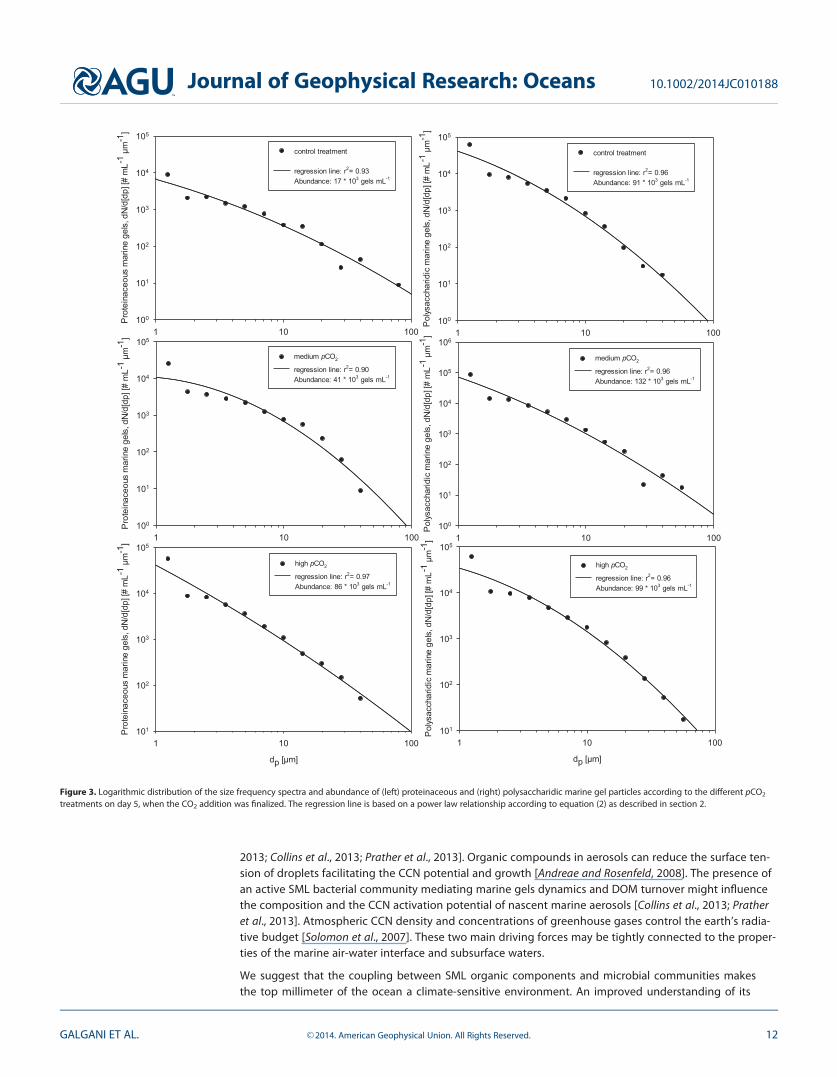
3.3. Marine Gel Size-Distribution Within the SMLThe abundance and size of marine gels in subsurface waters and in the SML determine their potentialfate as CCN in the atmosphere [Orellana et al., 2011]. pH is known to alter size of gels by promoting a vol-ume phase transition [Chin et al., 1998; Orellana et al., 2011] and may affect the dynamics of nascentPOA. In order to identify a potential effect of the CO2 manipulation on gel size, we analyzed the size-frequency distribution of polysaccharidic and proteinaceous gels in all treatments from day 0 to day 15,i.e., during the first bloom phase (Tables 3 and 4, Figure 3) according to equation (2) as described in sec-tion 2. In general, proteinaceous gels were larger but less abundant compared to polysaccharidic ones(Tables 3 and 4, Figure 3). However, high pCO2 promoted a significant increase in abundance (Table 3,p< 0.05, n 5 9) and a significant decrease in size, dp, of proteinaceous gels (Table 3, p< 0.01, n 5 9). Thisagain could be partly explained by increasing bacterial degradation of proteinaceous compounds in theSML under more acidic conditions. For proteinaceous gels, the contribution of the smallest size fraction(0.4–1 mm) to the total abundance increased along with rising CO2 levels (Table 4). For polysaccharidicgels instead, particles smaller than 1 mm always contributed most to total gel abundance in the SML, upto 63.2% (Table 4), in accordance with the assumption of gels being formed by assembly of smaller pre-cursors [Chin et al., 1998].
During biologically productive periods, marine POA reveal a high fraction of water insoluble organic par-ticles [O’Dowd et al., 2004], of polysaccharidic gel-like composition [Orellana et al., 2011; Russell et al.,2010]. In the ocean, high abundance of polysaccharidic gels has been related to phytoplankton blooms[Mari and Kiørboe, 1996; Passow, 2002b]. According to our study, polysaccharidic gels in the SML weretightly coupled to phytoplankton dynamics especially at high pCO2. For both classes of marine gels thatwe investigated, their dynamics in the SML and in future ocean scenarios were closely related to autotro-phic and heterotrophic metabolism. Proteinaceous gels contributed even more to the SML gel-like com-position, and may explain the enrichment of proteinaceous material in natural SML samples and in sea-spray aerosols [Kuznetsova et al., 2005]. High surface-active properties of amino acids in addition to theactive bacterial release of DOM as extracellular enzymes or by cell lysis contribute to a biofilm matrix[Flemming and Wingender, 2010] and may support proteinaceous gel accumulation at present CO2 levels(control treatment) as observed during this study. Following our results, acidification of seawater has ahigh potential to affect the amount and composition of organic matter, in particular with respect to gelparticles, in the SML. Organic matter in the SML thus reflects the sensitivity of marine microorganisms inthe surface ocean to environmental change, which was shown during previous mesocosms studies [Engelet al., 2013; Riebesell et al., 2009; Schulz et al., 2013]. Altered characteristics of the SML could be relevantfor air-sea gas exchange, when affecting capillary wave damping and molecular diffusion of gases [Lissand Duce, 2005]. Size and chemical mixing state of particles, that is, the way chemical components aremixed at the level of a single particle, are two essential factors that determine particles’ interaction withthe climate system such as hygroscopicity and their ability to scatter radiation or act as CCN [Bauer et al.,
Table 4. Average Abundance (mL21, Day 0–Day 15) of Marine Gels in the SML for Different pCO2 Levels and the Relative Contribution(%) of Two Different Size Classes (mm) to Total Gel Abundance
mm
Control Medium pCO2 High pCO2
mL21 % mL21 % mL21 %
Proteinaceous Gels—Total Period0.4–1 18.7 6 23.7 43.3 6 24.1 17.3 6 8.3 46.7 6 15.4 32.5 6 15.8 55.5 6 13.4>1 16.4 6 8.2 56.7 6 24.1 20.3 6 8.2 53.3 6 15.4 23.5 6 8.8 44.5 6 13.4Polysaccharidic Gels—Total Period0.4–1 61.9 6 40.1 63.2 6 7.1 39.2 6 19.0 59.8 6 4.9 56.0 6 29.0 59.0 6 5.4>1 31.0 6 9.6 36.8 6 7.1 25.6 6 13.7 40.2 6 4.9 37.2 6 18.0 41.0 6 5.4
Journal of Geophysical Research: Oceans 10.1002/2014JC010188
GALGANI ET AL. VC 2014. American Geophysical Union. All Rights Reserved. 11
2013; Collins et al., 2013; Prather et al., 2013]. Organic compounds in aerosols can reduce the surface ten-sion of droplets facilitating the CCN potential and growth [Andreae and Rosenfeld, 2008]. The presence ofan active SML bacterial community mediating marine gels dynamics and DOM turnover might influencethe composition and the CCN activation potential of nascent marine aerosols [Collins et al., 2013; Pratheret al., 2013]. Atmospheric CCN density and concentrations of greenhouse gases control the earth’s radia-tive budget [Solomon et al., 2007]. These two main driving forces may be tightly connected to the proper-ties of the marine air-water interface and subsurface waters.
We suggest that the coupling between SML organic components and microbial communities makesthe top millimeter of the ocean a climate-sensitive environment. An improved understanding of its
1 10 100
Pol
ysac
char
idic
mar
ine
gels
, dN
/d[d
p] [#
mL-1
m-1
]
100
101
102
103
104
105
control treatment
regression line: r2= 0.96Abundance: 91 * 103 gels mL-1
dp [ m]
1 10 100
Pol
ysac
char
idic
mar
ine
gels
, dN
/d[d
p] [#
mL-1
m-1
]
100
101
102
103
104
105
106
medium pCO2
regression line: r2= 0.96Abundance: 132 * 103 gels mL-1
dp [ m]
1 10 100
Pol
ysac
char
idic
mar
ine
gels
, dN
/d[d
p] [#
mL-1
m-1
]
101
102
103
104
105
high pCO2
regression line: r2= 0.96Abundance: 99 * 103 gels mL-1
1 10 100
Pro
tein
aceo
us m
arin
e ge
ls, d
N/d
[dp]
[# m
L-1m
-1]
100
101
102
103
104
105
control treatment
regression line: r2= 0.93Abundance: 17 * 103 gels mL-1
1 10 100
Pro
tein
aceo
us m
arin
e ge
ls, d
N/d
[dp]
[# m
L-1m
-1]
100
101
102
103
104
105
medium pCO2
regression line: r2= 0.90Abundance: 41 * 103 gels mL-1
dp [ m]
1 10 100
Pro
tein
aceo
us m
arin
e ge
ls, d
N/d
[dp]
[# m
L-1m
-1]
101
102
103
104
105
high pCO2
regression line: r2= 0.97Abundance: 86 * 103 gels mL-1
Figure 3. Logarithmic distribution of the size frequency spectra and abundance of (left) proteinaceous and (right) polysaccharidic marine gel particles according to the different pCO2
treatments on day 5, when the CO2 addition was finalized. The regression line is based on a power law relationship according to equation (2) as described in section 2.
Journal of Geophysical Research: Oceans 10.1002/2014JC010188
GALGANI ET AL. VC 2014. American Geophysical Union. All Rights Reserved. 12
structure and dynamics will help to better estimate ocean-atmosphere interactions in a future high CO2
world.
ReferencesAndreae, M. O., and D. Rosenfeld (2008), Aerosol-cloud-precipitation interactions. Part 1. The nature and sources of cloud-active aerosols,
Earth Sci. Rev., 89(Part 1), 13–41, doi:10.1016/j.earscirev.2008.03.001.Arnosti, C. (2011), Microbial extracellular enzymes and the marine carbon cycle, Annu. Rev. Mar. Sci., 3(1), 401–425, doi:10.1146/annurev-
marine-120709-142731.Azetsu, S. K., and U. Passow (2004), Ascending marine particles: Significance of transparent exopolymer particles (TEP) in the upper ocean,
Limnol. Oceanogr. Methods, 49, 741–748, doi:10.4319/lo.2004.49.3.0741.Bar-Zeev, E., I. Berman-Frank, O. Girshevitz, and T. Berman (2012), Revised paradigm of aquatic biofilm formation facilitated by microgel
transparent exopolymer particles, Proc. Natl. Acad. Sci. U. S. A., 109(23), 9119–9124, doi:10.1073/pnas.1203708109.Bauer, S. E., A. Ault, and K. A. Prather (2013), Evaluation of aerosol mixing state classes in the GISS modelE-MATRIX climate model using
single-particle mass spectrometry measurements, J. Geophys. Res. Atmos., 118, 9834–9844, doi:10.1002/jgrd.50700.Borchard, C., and A. Engel (2012), Organic matter exudation by Emiliania huxleyi under simulated future ocean conditions, Biogeosciences,
9(8), 3405–3423, doi:10.5194/bg-9-3405-2012.Caldeira, K., and M. E. Wickett (2003), Oceanography: Anthropogenic carbon and ocean pH, Nature, 425(6956), 365–365, doi:10.1038/
425365a.Carlson, D. J. (1982), A field evaluation of plate and screen microlayer sampling techniques, Mar. Chem., 11, 189–208, doi:10.1016/0304-
4203(82)90015-9.Chin, W.-C., M. V. Orellana, and P. Verdugo (1998), Spontaneous assembly of marine dissolved organic matter into polymer gels, Nature,
391(6667), 568–572, doi:10.1038/35345.Chin-Leo, G., and D. L. Kirchman (1988), Estimating bacterial production in marine waters from the simultaneous incorporation of thymi-
dine and leucine, Appl. Environ. Microbiol., 54, 1934–1939.Collins, D. B., et al. (2013), Impact of marine biogeochemistry on the chemical mixing state and cloud forming ability of nascent sea spray
aerosol, J. Geophys. Res. Atmos., 118, 8553–8565, doi:10.1002/jgrd.50598.Cunliffe, M., and J. C. Murrell (2009), The sea-surface microlayer is a gelatinous biofilm, ISME J., 3(9), 1001–1003, doi:10.1038/ismej.2009.69.Cunliffe, M., R. C. Upstill-Goddard, and J. C. Murrell (2011), Microbiology of aquatic surface microlayers, FEMS Microbiol. Rev., 35(2), 233–246,
doi:10.1111/j.1574-6976.2010.00246.x.Cunliffe, M., A. Engel, S. Frka, B. Ga�sparovic, C. Guitart, J. C. Murrell, M. Salter, C. Stolle, R. Upstill-Goddard, and O. Wurl (2013), Sea surface
microlayers: A unified physicochemical and biological perspective of the air-ocean interface, Prog. Oceanogr., 109, 104–116, doi:10.1016/j.pocean.2012.08.004.
Del Giorgio, P. A., and C. M. Duarte (2002), Respiration in the open ocean, Nature, 420(6914), 379–384, doi:10.1038/nature01165.Donderski, W., Z. Mudryk, and M. Walczak (1998), Utilization of low molecular weight organic compounds by marine neustonic and plank-
tonic bacteria, Pol. J. Environ. Stud., 7(5), 279–283.Endres, S., L. Galgani, U. Riebesell, K. G. Schulz, and A. Engel (2014), Stimulated bacterial growth under elevated pCO2: Results from an off-
shore mesocosm study, PLoS One, 9(7), e103694, doi:10.1371/journal.pone.0103694.Engel, A. (2002), Direct relationship between CO2 uptake and transparent exopolymer particles production in natural phytoplankton,
J. Plankton Res., 24(1), 49–53, doi:10.1093/plankt/24.1.49.Engel, A. (2009), Determination of marine gel particles, in Practical Guidelines for the Analysis of Seawater, edited by O. Wurl, pp. 125–142,
CRC Press, Boca Raton, Fla.Engel, A., and N. H€andel (2011), A novel protocol for determining the concentration and composition of sugars in particulate and in high
molecular weight dissolved organic matter (HMW-DOM) in seawater, Mar. Chem., 127(1–4), 180–191, doi:10.1016/j.marchem.2011.09.004.
Engel, A., S. Thoms, U. Riebesell, E. Rochelle-Newall, and I. Zondervan (2004), Polysaccharide aggregation as a potential sink of marine dis-solved organic carbon, Nature, 428(6986), 929–932, doi:10.1038/nature02453.
Engel, A., C. Borchard, J. Piontek, K. G. Schulz, U. Riebesell, and R. Bellerby (2013), CO2 increases 14C primary production in an Arctic plank-ton community, Biogeosciences, 10(3), 1291–1308, doi:10.5194/bg-10-1291-2013.
Engel, A., J. Piontek, H. P. Grossart, U. Riebesell, K. G. Schulz, and M. Sperling (2014), Impact of CO2 enrichment on organic matter dynamicsduring nutrient induced coastal phytoplankton blooms, J. Plankton Res., 36(3), 641–657, doi:10.1093/plankt/fbt125.
Fagerbakke, K. M., M. Heldal, and S. Norland (1996), Content of carbon, nitrogen, oxygen, sulfur and phosphorus in native aquatic and cul-tured bacteria, Aquat. Microb. Ecol., 10(1), 15–27, doi:10.3354/ame010015.
Falkowska, L. (1999), Sea surface microlayer: A field evaluation of teflon plate, glass plate and screen sampling techniques. Part 1. Thicknessof microlayer samples and relation to wind speed, Oceanologia, 41(2), 211–221.
Flemming, H.-C., and J. Wingender (2010), The biofilm matrix, Nat. Rev. Microbiol., 8(9), 623–633, doi:10.1038/nrmicro2415.Grossart, H. P., M. Allgaier, U. Passow, and U. Riebesell (2006), Testing the effect of CO2 concentration on the dynamics of marine heterotro-
phic bacterioplankton, Limnol. Oceanogr. Methods, 51(1), 1–11, doi:10.4319/lo.2006.51.1.0001.Harvey, G. W., and L. A. Burzell (1972), A simple microlayer method for small samples, Limnol. Oceanogr., 11, 608–614.Hein, M., and K. Sand-Jensen (1997), CO2 increases oceanic primary production, Nature, 388(6642), 526–527.Kuznetsova, M., and C. Lee (2001), Enhanced extracellular enzymatic peptide hydrolysis in the sea-surface microlayer, Mar. Chem., 73(3–4),
319–332, doi:10.1016/S0304-4203(00)00116-X.Kuznetsova, M., C. Lee, and J. Aller (2005), Characterization of the proteinaceous matter in marine aerosols, Mar. Chem., 96(3–4), 359–377,
doi:10.1016/j.marchem.2005.03.007.Lechtenfeld, O. J., B. P. Koch, B. Ga�sparovic, S. Frka, M. Witt, and G. Kattner (2013), The influence of salinity on the molecular and optical
properties of surface microlayers in a karstic estuary, Mar. Chem., 150(0), 25–38, doi:10.1016/j.marchem.2013.01.006.Leck, C., and E. K. Bigg (2005), Source and evolution of the marine aerosol—A new perspective, Geophys. Res. Lett., 32, L19803, doi:10.1029/
2005GL023651.Lindroth, P., and K. Mopper (1979), High performance liquid chromatographic determination of subpicomole amounts of amino acids by
precolumn fluorescence derivatization with o-phthaldialdehyde, Anal. Chem., 51(11), 1667–1674, doi:10.1021/ac50047a019.Liss, P. S., and R. A. Duce (2005), The Sea Surface and Global Change, Cambridge Univ. Press, Cambridge, U. K.
AcknowledgmentsWe would like to thank all participantsof the Bergen Mesocosms study, inparticular U. Riebesell, J. Czerny,A. Ludwig, M. Meyerhofer, and theKOSMOS team for mesocosmsimplementation and logistics, as well asthe staff of the Marine Biological Stationof Bergen University for hosting theexperiment and technical support. Wethank the captains and crews of R/VHåkon Mosby, R/V Alkor, and R/VHeincke for support during transport,deployment, and recovery of themesocosm facility. Big, special thanksgo to the sampling team: L. Bach,M. Sswatt, and T. Lipsewers. S. Koch-Klavsen is gratefully acknowledged formeasuring chlorophyll concentrations,J. R. Berm�udez for phytoplanktoncharacterization in the water column,R. Flerus and J. Roa for amino acids andcarbohydrates analysis, respectively.Helpful comments and stimulatingdiscussions with C. Borchard andJ. Piontek are also greatly appreciated.Moreover, M. Schartau is greatlyacknowledged for friendly review andsuggestions for data analysis. This workwas supported by BMBF projectSOPRAN II (Surface Ocean Processes inthe Anthropocene, 03F0611C-TP01 and03F0611B-TP02) and BIOACID(03F0608B), and is a contribution to theinternational SOLAS program. All datapresented in this manuscript areavailable upon request and will besubmitted to the PANGAEA database(http://www.pangaea.de).
Journal of Geophysical Research: Oceans 10.1002/2014JC010188
GALGANI ET AL. VC 2014. American Geophysical Union. All Rights Reserved. 13
Long, R. A., and F. Azam (1996), Abundant protein-containing particles in the sea, Aquat. Microb. Ecol., 10(3), 213–221, doi:10.3354/ame010213.
Mari, X., and T. Kiørboe (1996), Abundance, size distribution and bacterial colonization of transparent exopolymeric particles (TEP) duringspring in the Kattegat, J. Plankton Res., 18(6), 969–986, doi:10.1093/plankt/18.6.969.
Marie, D., X. L. Shi, F. Rigaut-Jalabert, and D. Vaulot (2010), Use of flow cytometric sorting to better assess the diversity of small photosyn-thetic eukaryotes in the English Channel, FEMS Microbiol. Ecol., 72(2), 165–178, doi:10.1111/j.1574-6941.2010.00842.x.
O’Dowd, C. D., M. C. Facchini, F. Cavalli, D. Ceburnis, M. Mircea, S. Decesari, S. Fuzzi, Y. J. Yoon, and J.-P. Putaud (2004), Biogenically drivenorganic contribution to marine aerosol, Nature, 431(7009), 676–680, doi:10.1038/nature02959.
Orellana, M. V., P. A. Matrai, C. Leck, C. D. Rauschenberg, A. M. Lee, and E. Coz (2011), Marine microgels as a source of cloud condensationnuclei in the high Arctic, Proc. Natl. Acad. Sci. U. S. A., 108(33), 13,612–13,617, doi:10.1073/pnas.1102457108.
Passow, U. (2002b), Transparent exopolymer particles (TEP) in aquatic environments, Prog. Oceanogr., 55, 287–333, doi:10.1016/S0079-6611(02)00138-6.
Piontek, J., M. Lunau, N. H€andel, C. Borchard, M. Wurst, and A. Engel (2010), Acidification increases microbial polysaccharide degradation inthe ocean, Biogeosciences, 7(5), 1615–1624, doi:10.5194/bg-7-1615-2010.
Prather, K. A., et al. (2013), Bringing the ocean into the laboratory to probe the chemical complexity of sea spray aerosol, Proc. Natl. Acad.Sci. U. S. A., 110(19), 7550–7555, doi:10.1073/pnas.1300262110.
Quinn, P. K., and T. S. Bates (2011), The case against climate regulation via oceanic phytoplankton sulphur emissions, Nature, 480(7375),51–56, doi:10.1038/nature10580.
Riebesell, U., A. Kortzinger, and A. Oschlies (2009), Sensitivities of marine carbon fluxes to ocean change, Proc. Natl. Acad. Sci. U. S. A.,106(49), 20,602–20,609, doi:10.1073/pnas.0813291106.
Riebesell, U., et al. (2013), Technical note: A mobile sea-going mesocosm system—New opportunities for ocean change research, Biogeo-sciences, 10(3), 1835–1847, doi:10.5194/bg-10-1835-2013.
Russell, L. M., L. N. Hawkins, A. A. Frossard, P. K. Quinn, and T. S. Bates (2010), Carbohydrate-like composition of submicron atmosphericparticles and their production from ocean bubble bursting, Proc. Natl. Acad. Sci. U. S. A., 107(15), 6652–6657, doi:10.1073/pnas.0908905107.
Sabine, C. L., et al. (2004), The oceanic sink for anthropogenic CO2, Science, 305(5682), 367–371, doi:10.1126/science.1097403.Schulz, K. G., et al. (2013), Temporal biomass dynamics of an Arctic plankton bloom in response to increasing levels of atmospheric carbon
dioxide, Biogeosciences, 10(1), 161–180, doi:10.5194/bg-10-161-2013.Solomon, S., D. Qin, M. Manning, Z. Chen, M. Marquis, K. B. Averyt, M. Tignor, and H. L. Miller (2007), Climate Change 2007: The Physical Sci-
ence Basis. Contribution of Working Group I to the Fourth Assessment Report of the Intergovernmental Panel on Climate Change, CambridgeUniv. Press, Cambridge, U. K.
Verdugo, P. (2012), Marine microgels, Annu. Rev. Mar. Sci., 4(1), 375–400, doi:10.1146/annurev-marine-120709-142759.Verdugo, P., A. L. Alldredge, F. Azam, D. L. Kirchman, U. Passow, and P. H. Santschi (2004), The oceanic gel phase: A bridge in the DOM–
POM continuum, Mar. Chem., 92(1–4), 67–85, doi:10.1016/j.marchem.2004.06.017.Welschmeyer, N. A. (1994), Fluorometric analysis of chlorophyll a in the presence of chlorophyll b and pheopigments, Limnol. Oceanogr.,
39(8), 1985–1992, doi:10.4319/lo.1994.39.8.1985.Wurl, O., and M. Holmes (2008), The gelatinous nature of the sea-surface microlayer, Mar. Chem., 110(1–2), 89–97, doi:10.1016/
j.marchem.2008.02.009.Wurl, O., L. Miller, and S. Vagle (2011a), Production and fate of transparent exopolymer particles in the ocean, J. Geophys. Res., 116, C00H13,
doi:10.1029/2011JC007342.Wurl, O., E. Wurl, L. Miller, K. Johnson, and S. Vagle (2011b), Formation and global distribution of sea-surface microlayers, Biogeosciences,
8(1), 121–135, doi:10.5194/bg-8-121-2011.Zhou, J., K. Mopper, and U. Passow (1998), The role of surface-active carbohydrates in the formation of transparent exopolymer particles
by bubble adsorption of seawater, Limnol. Oceanogr., 43, 1860–1871, doi:10.4319/lo.1998.43.8.1860.
Journal of Geophysical Research: Oceans 10.1002/2014JC010188
GALGANI ET AL. VC 2014. American Geophysical Union. All Rights Reserved. 14
Copyright © 2022 FDOKUMEN