treatment of pulp and paper mill wastewater using - FES Final ...
Upload
independentCategory
view
2download
0
(This is a sample cover image for this issue. The actual cover is not yet available at this time.)
This article appeared in a journal published by Elsevier. The attachedcopy is furnished to the author for internal non-commercial researchand education use, including for instruction at the authors institution
and sharing with colleagues.
Other uses, including reproduction and distribution, or selling orlicensing copies, or posting to personal, institutional or third party
websites are prohibited.
In most cases authors are permitted to post their version of thearticle (e.g. in Word or Tex form) to their personal website orinstitutional repository. Authors requiring further information
regarding Elsevier’s archiving and manuscript policies areencouraged to visit:
http://www.elsevier.com/copyright
Author's personal copy
Water chemistry and nutrient release during the resuspension of FeS-rich sedimentsin a eutrophic estuarine system
Bree Morgan a,⁎, Andrew W. Rate a, Edward D. Burton b
a School of Earth and Environment, The University of Western Australia, Crawley, WA 6009, Australiab Southern Cross GeoScience, Southern Cross University, Lismore, NSW 2480, Australia
a b s t r a c ta r t i c l e i n f o
Article history:Received 10 January 2012Received in revised form 14 May 2012Accepted 19 May 2012Available online xxxx
Keywords:EutrophicationSedimentResuspensionNutrientsFeSEstuarine
The objective of this study was to investigate the impact of resuspending FeS-rich benthic sediment on estu-arine water chemistry. To address this objective, we conducted (1) a series of laboratory-based sedimentresuspension experiments and (2) also monitored changes in surface water composition during field-basedsediment resuspension events that were caused by dredging activities in the Peel–Harvey Estuary, WesternAustralia. Our laboratory resuspension experiments showed that the resuspension of FeS-rich sediments rap-idly deoxygenated estuarine water. In contrast, dredging activities in the field did not noticeably lower O2
concentrations in adjacent surface water. Additionally, while FeS oxidation in the laboratory resuspensionscaused measurable decreases in pH, the field pH was unaffected by the dredging event and dissolved tracemetal concentrations remained very low throughout the monitoring period. Dissolved ammonium (NH4
+)and inorganic phosphorus (PO4–P) were released into the water column during the resuspension of sedi-ments in both the field and laboratory. Following its initial release, PO4–P was rapidly removed from solutionin the laboratory-based (b1 h) and field-based (b100 m from sediment disposal point) investigations. Incomparison to PO4–P, NH4
+ release was observed to be more prolonged over the 2-week period of the labo-ratory resuspension experiments. However, our field-based observations revealed that elevated NH4
+ con-centrations were localised to b100 m from the sediment disposal point. This study demonstrates thatalongside the emphasis on acidification, deoxygenation and metal release during FeS resuspension, it is im-portant to consider the possibility of nutrient release from disturbed sediments in eutrophic estuaries.
© 2012 Elsevier B.V. All rights reserved.
1. Introduction
Many shallow estuarine environments often require dredging tomaintain access to boating channels and residential canals. In suchenvironments, dredging activities may contribute to the resuspensionof anoxic benthic sediment into overlying oxic surface waters. It hasbeen documented that resuspension of benthic sediments can rapidlydeoxygenate surface waters (Sullivan et al., 2002; Fyfe et al., 2007). Inaddition, sediment resuspension can trigger the oxidation of ironmonosulfide (FeS) minerals and cause pH-dependent release of FeS-associated trace metals (Burton et al., 2006a; Bush et al., 2004;Simpson et al., 1998; Johnston et al., 2003; Wong et al., 2010).
Inmarine and estuarine sediments, sulfate (SO42−) reduction is often
a dominant mechanism for the mineralisation of organic matter(Capone and Kiene, 1988; Jørgensen, 1982; Morgan et al., 2012). In ad-dition to contributing to sedimentary FeS accumulation, mineralisationof organic matter and related sulfur (S) cycling can also induce enrich-ments in porewater ammonium (NH4
+) and phosphate (PO4–P, which
includes ∑PO43−, HPO4
2−, H2PO4−) (Caraco et al., 1989; Smolders et
al., 2003, 2006). Despite this, nutrient release is rarely regarded as animportant environmental concern in relation to the resuspension ofFeS- and organic-rich sediments.
The objective of the current study was to investigate the impact ofestuarine sediment resuspension on surface water chemistry and nu-trient concentrations. This study focuses on a eutrophic estuary inWestern Australia that is known to contain benthic sediments richin FeS (Morgan et al., 2012). We addressed the objective byemploying (1) a laboratory-based (closed-system) set of sedimentresuspension experiments and (2) a field-based (open-system) mon-itoring programme examining surface water composition duringlarge-scale sediment disturbance caused by dredging activities.
2. Materials and methods
2.1. Study site description
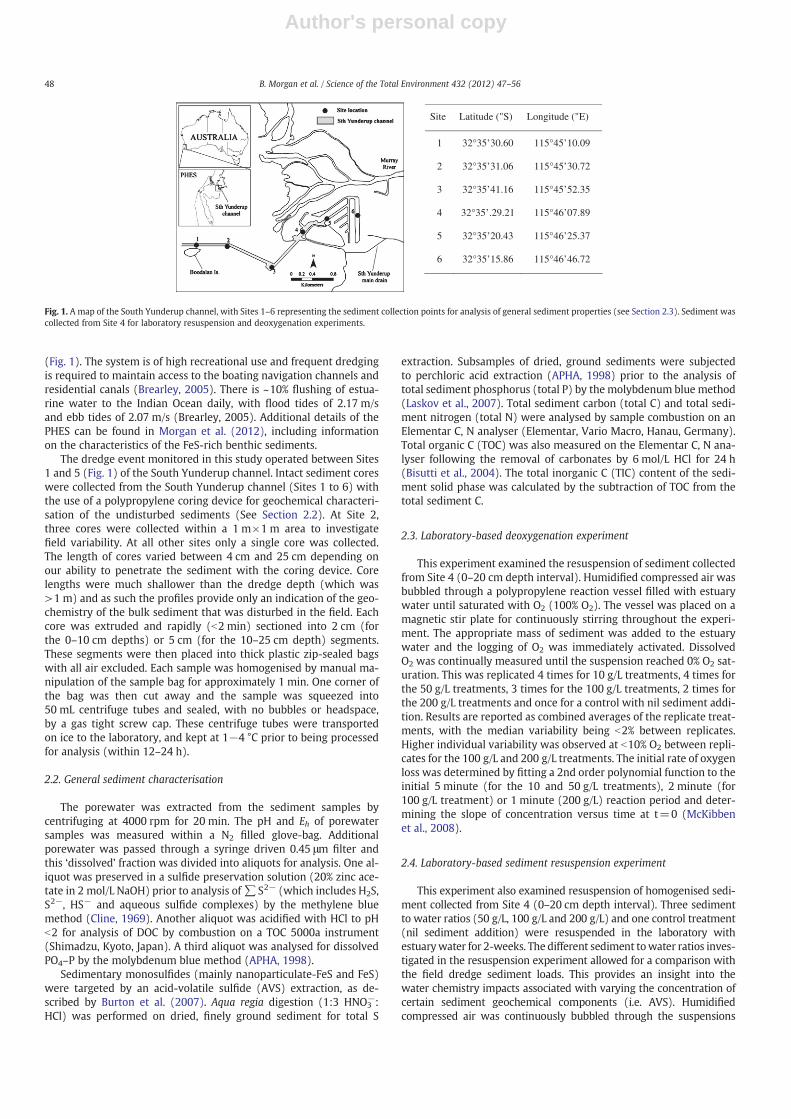
This study investigates the resuspension of sediments from thefrequently-dredged South Yunderup channel in the Peel–Harvey Es-tuarine System (PHES) (Fig. 1). The PHES is located on the Swancoastal plain approximately 80 km south of Perth, Western Australia
Science of the Total Environment 432 (2012) 47–56
⁎ Corresponding author. Fax: +61 8 6488 1050.E-mail address: [email protected] (B. Morgan).
0048-9697/$ – see front matter © 2012 Elsevier B.V. All rights reserved.doi:10.1016/j.scitotenv.2012.05.065
Contents lists available at SciVerse ScienceDirect
Science of the Total Environment
j ourna l homepage: www.e lsev ie r .com/ locate /sc i totenv
Author's personal copy
(Fig. 1). The system is of high recreational use and frequent dredgingis required to maintain access to the boating navigation channels andresidential canals (Brearley, 2005). There is ~10% flushing of estua-rine water to the Indian Ocean daily, with flood tides of 2.17 m/sand ebb tides of 2.07 m/s (Brearley, 2005). Additional details of thePHES can be found in Morgan et al. (2012), including informationon the characteristics of the FeS-rich benthic sediments.
The dredge event monitored in this study operated between Sites1 and 5 (Fig. 1) of the South Yunderup channel. Intact sediment coreswere collected from the South Yunderup channel (Sites 1 to 6) withthe use of a polypropylene coring device for geochemical characteri-sation of the undisturbed sediments (See Section 2.2). At Site 2,three cores were collected within a 1 m×1 m area to investigatefield variability. At all other sites only a single core was collected.The length of cores varied between 4 cm and 25 cm depending onour ability to penetrate the sediment with the coring device. Corelengths were much shallower than the dredge depth (which was>1 m) and as such the profiles provide only an indication of the geo-chemistry of the bulk sediment that was disturbed in the field. Eachcore was extruded and rapidly (b2 min) sectioned into 2 cm (forthe 0–10 cm depths) or 5 cm (for the 10–25 cm depth) segments.These segments were then placed into thick plastic zip-sealed bagswith all air excluded. Each sample was homogenised by manual ma-nipulation of the sample bag for approximately 1 min. One corner ofthe bag was then cut away and the sample was squeezed into50 mL centrifuge tubes and sealed, with no bubbles or headspace,by a gas tight screw cap. These centrifuge tubes were transportedon ice to the laboratory, and kept at 1−4 °C prior to being processedfor analysis (within 12–24 h).
2.2. General sediment characterisation
The porewater was extracted from the sediment samples bycentrifuging at 4000 rpm for 20 min. The pH and Eh of porewatersamples was measured within a N2 filled glove-bag. Additionalporewater was passed through a syringe driven 0.45 μm filter andthis ‘dissolved’ fraction was divided into aliquots for analysis. One al-iquot was preserved in a sulfide preservation solution (20% zinc ace-tate in 2 mol/L NaOH) prior to analysis of∑S2− (which includes H2S,S2−, HS− and aqueous sulfide complexes) by the methylene bluemethod (Cline, 1969). Another aliquot was acidified with HCl to pHb2 for analysis of DOC by combustion on a TOC 5000a instrument(Shimadzu, Kyoto, Japan). A third aliquot was analysed for dissolvedPO4–P by the molybdenum blue method (APHA, 1998).
Sedimentary monosulfides (mainly nanoparticulate-FeS and FeS)were targeted by an acid-volatile sulfide (AVS) extraction, as de-scribed by Burton et al. (2007). Aqua regia digestion (1:3 HNO3
−:HCl) was performed on dried, finely ground sediment for total S
extraction. Subsamples of dried, ground sediments were subjectedto perchloric acid extraction (APHA, 1998) prior to the analysis oftotal sediment phosphorus (total P) by the molybdenum blue method(Laskov et al., 2007). Total sediment carbon (total C) and total sedi-ment nitrogen (total N) were analysed by sample combustion on anElementar C, N analyser (Elementar, Vario Macro, Hanau, Germany).Total organic C (TOC) was also measured on the Elementar C, N ana-lyser following the removal of carbonates by 6 mol/L HCl for 24 h(Bisutti et al., 2004). The total inorganic C (TIC) content of the sedi-ment solid phase was calculated by the subtraction of TOC from thetotal sediment C.
2.3. Laboratory-based deoxygenation experiment
This experiment examined the resuspension of sediment collectedfrom Site 4 (0–20 cm depth interval). Humidified compressed air wasbubbled through a polypropylene reaction vessel filled with estuarywater until saturated with O2 (100% O2). The vessel was placed on amagnetic stir plate for continuously stirring throughout the experi-ment. The appropriate mass of sediment was added to the estuarywater and the logging of O2 was immediately activated. DissolvedO2 was continually measured until the suspension reached 0% O2 sat-uration. This was replicated 4 times for 10 g/L treatments, 4 times forthe 50 g/L treatments, 3 times for the 100 g/L treatments, 2 times forthe 200 g/L treatments and once for a control with nil sediment addi-tion. Results are reported as combined averages of the replicate treat-ments, with the median variability being b2% between replicates.Higher individual variability was observed at b10% O2 between repli-cates for the 100 g/L and 200 g/L treatments. The initial rate of oxygenloss was determined by fitting a 2nd order polynomial function to theinitial 5 minute (for the 10 and 50 g/L treatments), 2 minute (for100 g/L treatment) or 1 minute (200 g/L) reaction period and deter-mining the slope of concentration versus time at t=0 (McKibbenet al., 2008).
2.4. Laboratory-based sediment resuspension experiment
This experiment also examined resuspension of homogenised sedi-ment collected from Site 4 (0–20 cm depth interval). Three sedimentto water ratios (50 g/L, 100 g/L and 200 g/L) and one control treatment(nil sediment addition) were resuspended in the laboratory withestuarywater for 2-weeks. The different sediment towater ratios inves-tigated in the resuspension experiment allowed for a comparison withthe field dredge sediment loads. This provides an insight into thewater chemistry impacts associated with varying the concentration ofcertain sediment geochemical components (i.e. AVS). Humidifiedcompressed air was continuously bubbled through the suspensions
Site Latitude ("S) Longitude ("E)
1 32°35’30.60 115°45’10.09
2 32°35’31.06 115°45’30.72
3 32°35’41.16 115°45’52.35
4 32°35’.29.21 115°46’07.89
5 32°35’20.43 115°46’25.37
6 32°35’15.86 115°46’46.72
Fig. 1. A map of the South Yunderup channel, with Sites 1–6 representing the sediment collection points for analysis of general sediment properties (see Section 2.3). Sediment wascollected from Site 4 for laboratory resuspension and deoxygenation experiments.
48 B. Morgan et al. / Science of the Total Environment 432 (2012) 47–56
Author's personal copy
throughout the duration of the experiment. Each treatment was runwith a replicate.
When monitoring the suspensions, the samples were collectedand parameters were measured during the daytime, although thetreatments were exposed to diurnal conditions throughout the exper-iment. Prior to sediment addition (0 h) the alkalinity (HCO3
−) of thefiltered (0.45 μm) porewater and surface water for the resuspensionswas measured according to a method by Sarazin et al. (1999). The pHand Eh of the suspensions were also measured prior to sediment addi-tion (0 h), as well as at 1, 2, 3, 4, 24, 48, 72, 96, 168 and 336 h aftersediment addition. Homogenised sediment/water suspension sam-ples were collected at these time intervals, along with additional sam-pling times of 0.33 h and 0.66 h. Each sample was immediatelycentrifuged (under N2) at 4000 rpm for 3 min to separate the aqueousand solid phases. The aqueous phase was passed through a 0.45 μmfilter (Acrodisc supor membrane) and analysed for PO4–P by the mo-lybdenum blue method (APHA, 1998) and NH4
+ by a SAN plus seg-mented flow autoanalyser (Skalar, Breda, The Netherlands).
The solid phase was subjected to an acid-volatile sulphide (AVS)extraction for determination of the FeS content (Burton et al., 2007).Sulfur speciation at 0, 24 and 72 h was also investigated using S K-edge X-ray absorption near-edge spectroscopy (XANES) at the Tai-wan Synchrotron facility (Burton et al., 2009; Prietzel et al., 2011)with full methodology described by Morgan et al. (2012).
2.5. Field dredge event
The South Yunderup approach channel (2.6 km) was dredged andthe sediment (~28000 m3 in total) disposed of in two separate loca-tions. Here, we investigate the disposal of 70% of the sediment in asubmerged area of the estuary between the 30th June and 23rd Octo-ber 2008. Dredging took place in daylight hours and although sched-uled to occur daily, this was dictated by weather and equipmentlimitations. As such dredging was sometimes halted for severalhours, to several days. The sediment was pumped from the estuaryfloor and transported to the sediment disposal point by large pipes.The water monitoring events from this study only took place whenthe dredge was in operation. Five water monitoring events were con-ducted between July 2008 and September 2008 to investigate the im-pact of the large scale sulfidic sediment disturbance on the waterchemistry of the estuary. Site A was located outside of the plume,100 m up-current from the disposal point, as a reference forundisturbed estuary conditions. Site B was at the point of sedimentdisposal into the estuary. The remaining sites (C, D, E and F) weresampled approximately every 100 m in a transect across the dredgeplume, moving away from the sediment disposal point. The turbidity,Eh, pH, and dissolved O2 were recorded at each site. Also, the approx-imate depth of visibility was recorded at each site using a secchi discwith marked depth intervals. Additionally, a water sample was col-lected from each site. Following filtration (0.45 μm) an aliquot waspreserved in 50% (v/v) HNO3 for the analysis of metals (As, Cd, Co,Cr, Cu, Fe, Mn, Mo, Ni, Pb, Zn) and S by ICP-OES (Perkin–Elmer Optima7300DV, Connecticut, USA). Detection limits for all metals were
b0.003 mg/L while the detection limit for S was 0.3 mg/L. A further al-iquot was frozen prior to the analysis of NH4
+ by a segmented flowautoanalyser and PO4–P by the molybdenum blue method.
2.6. General methods
All glassware and sampling equipment was soaked in 10% HCl forat least 24 h, and was then rinsed a minimum of three times withMilli-Q water (18.2 MΩ.cm) prior to use. All chemicals used were an-alytical reagent grade and all reagents and standards were preparedin Milli-Q water. The water content of the homogenised sedimentwas determined by weight loss over 24 h at 105 °C and sedimentproperties are reported herein on a dry weight basis. The pH(Cyberscan electrode) and Eh (TPS electrode) were recorded when asteady state was obtained (generally 10 min for Eh and b1 min forpH). The Eh probe was calibrated against Zobell's solution and cleanedregularly with 0.1 mol/L HCl and micro abrasive paper to prevent sul-fide contamination of the platinum electrode. Eh readings arereported in mV relative to the standard hydrogen electrode (SHE).Dissolved O2 was measured with a TPS oxygen probe calibrated inair at 100% O2.
3. Results
3.1. Sediment properties for the South Yunderup channel
The selected sediment porewater parameters (pH, Eh, ∑S2−,NH4
+, PO4–P and DOC) are presented in Table 1. The pHwas generallyneutral to near-neutral, ranging between pH 7 and 8, which is typicalof anoxic marine fine-grained sediments (Morse, 1999). The redoxconditions of all sediments were reducing (Eh between 100 and−100 mV, SHE) to highly reducing (Ehb−100 mV, SHE) (Table 1).The porewater ∑S2− concentrations were high (median=3.5 mmol/L;range=0.1−6.4 mmol/L), as were the porewater DOC concentrations(median=5.4 mmol/L; range=0.8–14.9 mmol/L). Porewater NH4
+ con-centrations (median=6.3 mmol/L, range 0.01–24.4 mmol/L) and PO4–Pconcentrations (median=0.3 mmol/L, range=0.001–1.5 mmol/L) werealso very high compared to most estuarine systems (Kemp et al., 1990;Morin and Morse, 1999).
The sediment AVS, total S, total N, total P, TOC and TIC concentra-tions are presented in Table 2. In general, the AVS concentrationswere elevated (median=191 μmol/g; range=34–335 μmol/g) rela-tive to typical estuarine sediments which contain AVS at b100 μmol/g(Burton et al., 2005; Morgan et al., 2012). The total S concentrationsranged between 193 and 677 μmol/g, with a median concentration of470 μmol/g. The median sediment TIC content ranged from 0.3−2.2 mmol/g across all sites. The TOC in the sediment samples examinedhere was very high, with a median of 3.6 mmol/g (range=0.5−6.7 mmol/g). Concentrations were also high for the solid phase N and P,with a median total N concentration of 552 μmol/g (65–1071 μmol/g)and a median total P of 21.5 μmol/g (2.1–36.0 μmol/g).
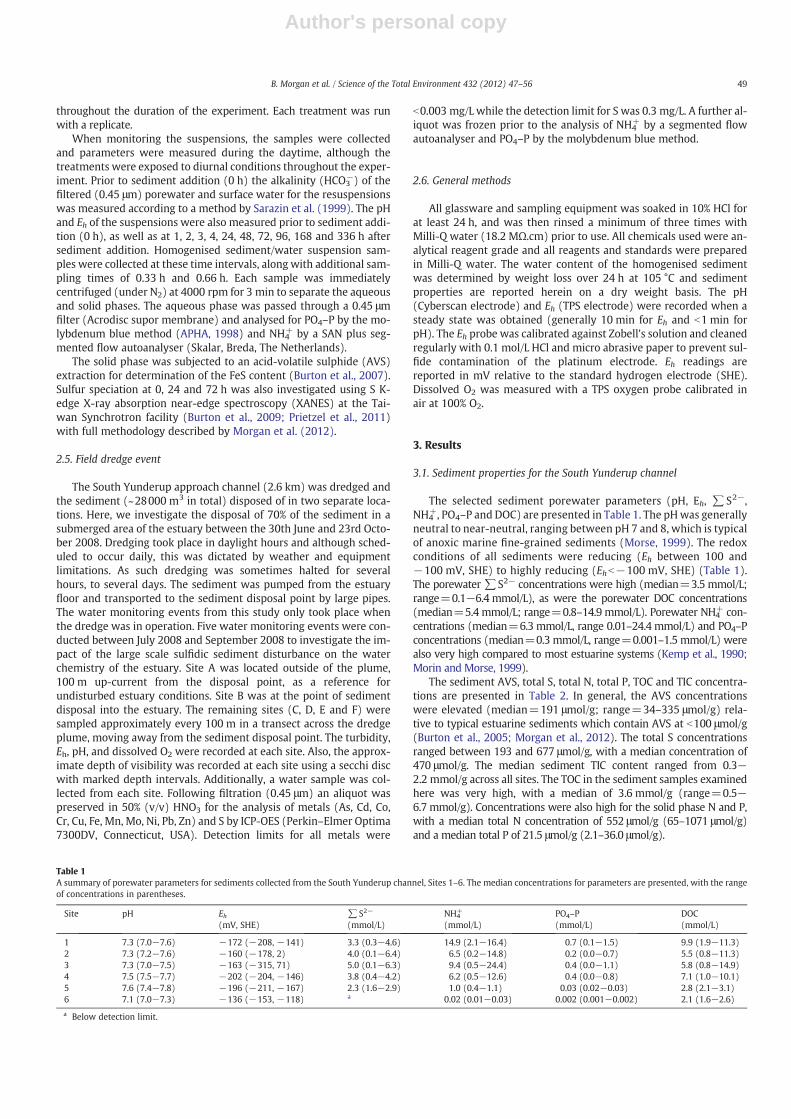
Table 1A summary of porewater parameters for sediments collected from the South Yunderup channel, Sites 1–6. The median concentrations for parameters are presented, with the rangeof concentrations in parentheses.
Site pH Eh(mV, SHE)
∑S2−
(mmol/L)NH4
+
(mmol/L)PO4–P(mmol/L)
DOC(mmol/L)
1 7.3 (7.0−7.6) −172 (−208, −141) 3.3 (0.3−4.6) 14.9 (2.1−16.4) 0.7 (0.1−1.5) 9.9 (1.9−11.3)2 7.3 (7.2−7.6) −160 (−178, 2) 4.0 (0.1−6.4) 6.5 (0.2−14.8) 0.2 (0.0−0.7) 5.5 (0.8−11.3)3 7.3 (7.0−7.5) −163 (−315, 71) 5.0 (0.1−6.3) 9.4 (0.5−24.4) 0.4 (0.0−1.1) 5.8 (0.8−14.9)4 7.5 (7.5−7.7) −202 (−204, −146) 3.8 (0.4−4.2) 6.2 (0.5−12.6) 0.4 (0.0−0.8) 7.1 (1.0−10.1)5 7.6 (7.4−7.8) −196 (−211, −167) 2.3 (1.6−2.9) 1.0 (0.4−1.1) 0.03 (0.02−0.03) 2.8 (2.1−3.1)6 7.1 (7.0−7.3) −136 (−153, −118) a 0.02 (0.01−0.03) 0.002 (0.001−0.002) 2.1 (1.6−2.6)
a Below detection limit.
49B. Morgan et al. / Science of the Total Environment 432 (2012) 47–56
Author's personal copy
3.2. Laboratory-based deoxygenation experiment
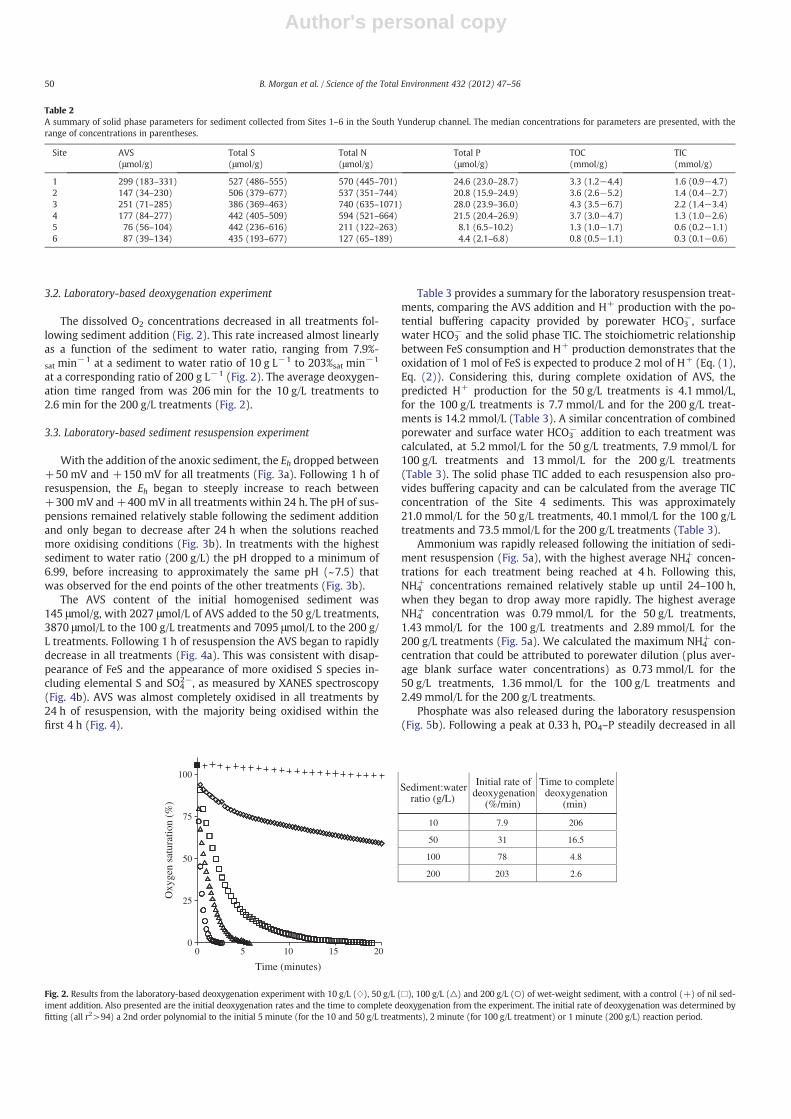
The dissolved O2 concentrations decreased in all treatments fol-lowing sediment addition (Fig. 2). This rate increased almost linearlyas a function of the sediment to water ratio, ranging from 7.9%-sat min−1 at a sediment to water ratio of 10 g L−1 to 203%sat min−1
at a corresponding ratio of 200 g L−1 (Fig. 2). The average deoxygen-ation time ranged from was 206 min for the 10 g/L treatments to2.6 min for the 200 g/L treatments (Fig. 2).
3.3. Laboratory-based sediment resuspension experiment
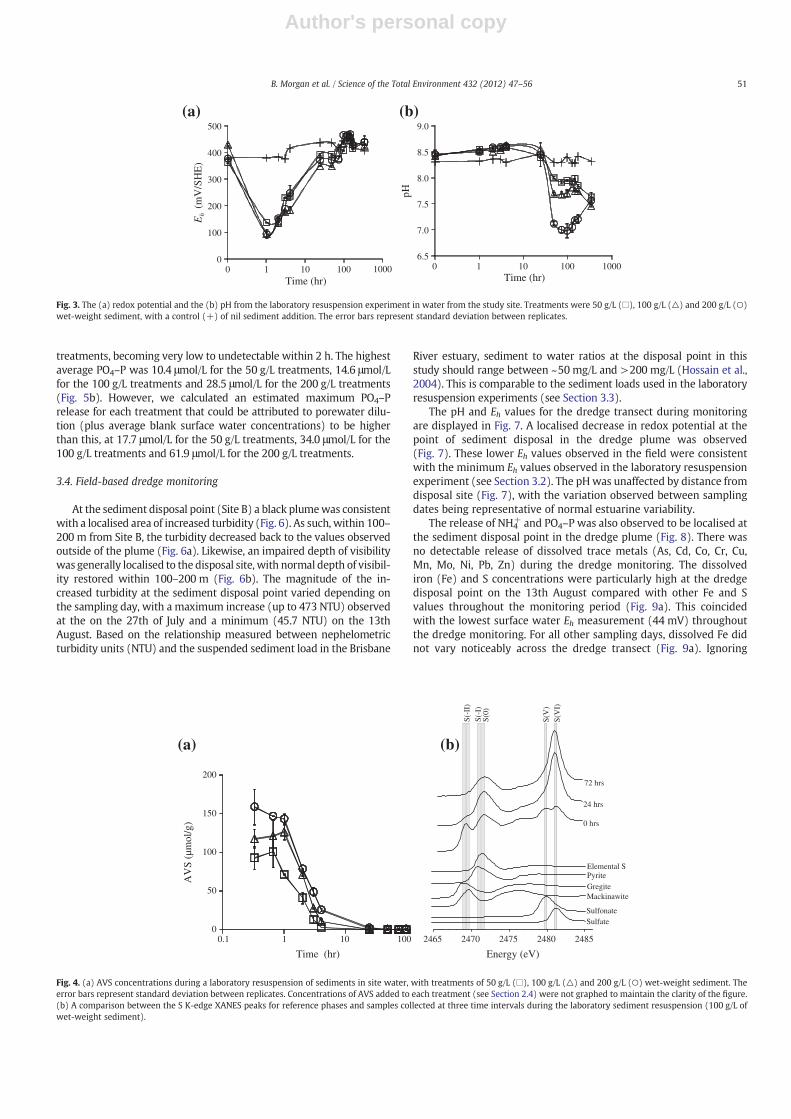
With the addition of the anoxic sediment, the Eh dropped between+50 mV and +150 mV for all treatments (Fig. 3a). Following 1 h ofresuspension, the Eh began to steeply increase to reach between+300 mV and +400 mV in all treatments within 24 h. The pH of sus-pensions remained relatively stable following the sediment additionand only began to decrease after 24 h when the solutions reachedmore oxidising conditions (Fig. 3b). In treatments with the highestsediment to water ratio (200 g/L) the pH dropped to a minimum of6.99, before increasing to approximately the same pH (~7.5) thatwas observed for the end points of the other treatments (Fig. 3b).
The AVS content of the initial homogenised sediment was145 μmol/g, with 2027 μmol/L of AVS added to the 50 g/L treatments,3870 μmol/L to the 100 g/L treatments and 7095 μmol/L to the 200 g/L treatments. Following 1 h of resuspension the AVS began to rapidlydecrease in all treatments (Fig. 4a). This was consistent with disap-pearance of FeS and the appearance of more oxidised S species in-cluding elemental S and SO4
2−, as measured by XANES spectroscopy(Fig. 4b). AVS was almost completely oxidised in all treatments by24 h of resuspension, with the majority being oxidised within thefirst 4 h (Fig. 4).
Table 3 provides a summary for the laboratory resuspension treat-ments, comparing the AVS addition and H+ production with the po-tential buffering capacity provided by porewater HCO3
−, surfacewater HCO3
− and the solid phase TIC. The stoichiometric relationshipbetween FeS consumption and H+ production demonstrates that theoxidation of 1 mol of FeS is expected to produce 2 mol of H+ (Eq. (1),Eq. (2)). Considering this, during complete oxidation of AVS, thepredicted H+ production for the 50 g/L treatments is 4.1 mmol/L,for the 100 g/L treatments is 7.7 mmol/L and for the 200 g/L treat-ments is 14.2 mmol/L (Table 3). A similar concentration of combinedporewater and surface water HCO3
− addition to each treatment wascalculated, at 5.2 mmol/L for the 50 g/L treatments, 7.9 mmol/L for100 g/L treatments and 13 mmol/L for the 200 g/L treatments(Table 3). The solid phase TIC added to each resuspension also pro-vides buffering capacity and can be calculated from the average TICconcentration of the Site 4 sediments. This was approximately21.0 mmol/L for the 50 g/L treatments, 40.1 mmol/L for the 100 g/Ltreatments and 73.5 mmol/L for the 200 g/L treatments (Table 3).
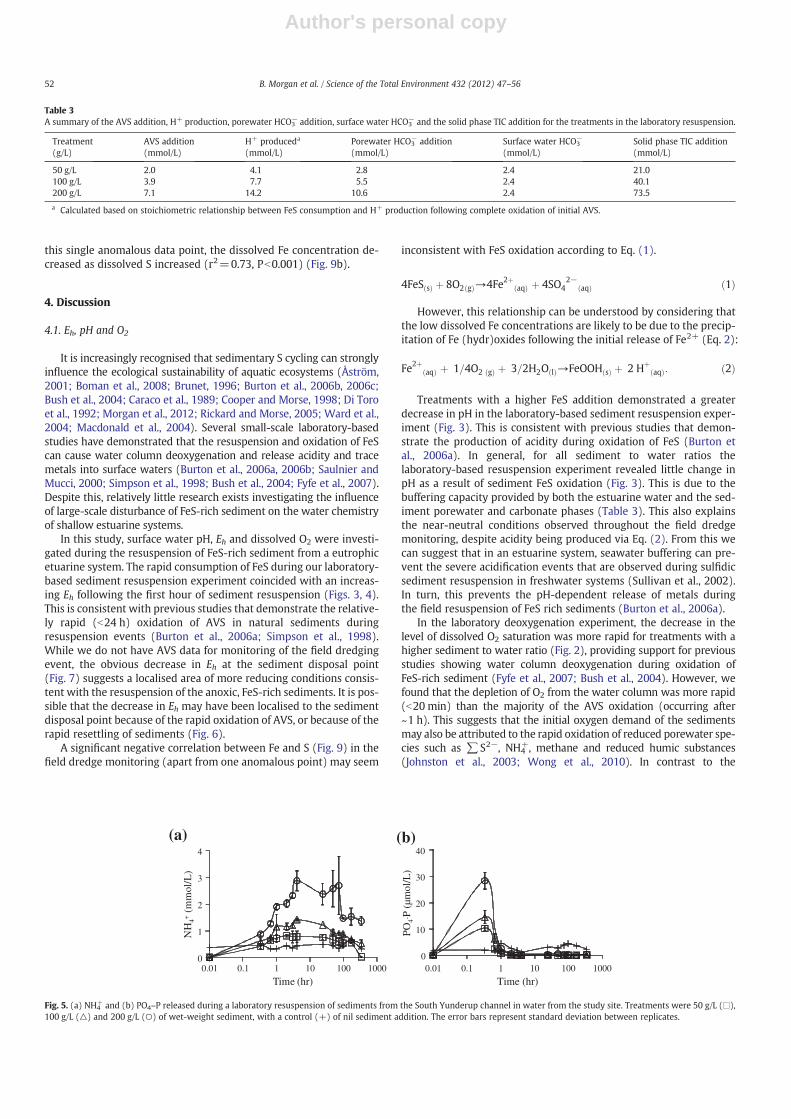
Ammonium was rapidly released following the initiation of sedi-ment resuspension (Fig. 5a), with the highest average NH4
+ concen-trations for each treatment being reached at 4 h. Following this,NH4
+ concentrations remained relatively stable up until 24–100 h,when they began to drop away more rapidly. The highest averageNH4
+ concentration was 0.79 mmol/L for the 50 g/L treatments,1.43 mmol/L for the 100 g/L treatments and 2.89 mmol/L for the200 g/L treatments (Fig. 5a). We calculated the maximum NH4
+ con-centration that could be attributed to porewater dilution (plus aver-age blank surface water concentrations) as 0.73 mmol/L for the50 g/L treatments, 1.36 mmol/L for the 100 g/L treatments and2.49 mmol/L for the 200 g/L treatments.
Phosphate was also released during the laboratory resuspension(Fig. 5b). Following a peak at 0.33 h, PO4–P steadily decreased in all
Table 2A summary of solid phase parameters for sediment collected from Sites 1–6 in the South Yunderup channel. The median concentrations for parameters are presented, with therange of concentrations in parentheses.
Site AVS(μmol/g)
Total S(μmol/g)
Total N(μmol/g)
Total P(μmol/g)
TOC(mmol/g)
TIC(mmol/g)
1 299 (183–331) 527 (486–555) 570 (445–701) 24.6 (23.0–28.7) 3.3 (1.2−4.4) 1.6 (0.9−4.7)2 147 (34–230) 506 (379–677) 537 (351–744) 20.8 (15.9–24.9) 3.6 (2.6−5.2) 1.4 (0.4−2.7)3 251 (71–285) 386 (369–463) 740 (635–1071) 28.0 (23.9–36.0) 4.3 (3.5−6.7) 2.2 (1.4−3.4)4 177 (84–277) 442 (405–509) 594 (521–664) 21.5 (20.4–26.9) 3.7 (3.0−4.7) 1.3 (1.0−2.6)5 76 (56–104) 442 (236–616) 211 (122–263) 8.1 (6.5–10.2) 1.3 (1.0−1.7) 0.6 (0.2−1.1)6 87 (39–134) 435 (193–677) 127 (65–189) 4.4 (2.1–6.8) 0.8 (0.5−1.1) 0.3 (0.1−0.6)
0 5 10 15 200
25
50
75
100
Time (minutes)
Oxy
gen
satu
ratio
n (%
)
Sediment:water ratio (g/L)
Initial rate of deoxygenation
(%/min)
Time to complete deoxygenation
(min)
10 7.9 206
50 31 16.5
100 78 4.8
200 203 2.6
Fig. 2. Results from the laboratory-based deoxygenation experiment with 10 g/L (⋄), 50 g/L (□), 100 g/L (△) and 200 g/L (○) of wet-weight sediment, with a control (+) of nil sed-iment addition. Also presented are the initial deoxygenation rates and the time to complete deoxygenation from the experiment. The initial rate of deoxygenation was determined byfitting (all r2>94) a 2nd order polynomial to the initial 5 minute (for the 10 and 50 g/L treatments), 2 minute (for 100 g/L treatment) or 1 minute (200 g/L) reaction period.
50 B. Morgan et al. / Science of the Total Environment 432 (2012) 47–56
Author's personal copy
treatments, becoming very low to undetectable within 2 h. The highestaverage PO4–P was 10.4 μmol/L for the 50 g/L treatments, 14.6 μmol/Lfor the 100 g/L treatments and 28.5 μmol/L for the 200 g/L treatments(Fig. 5b). However, we calculated an estimated maximum PO4–Prelease for each treatment that could be attributed to porewater dilu-tion (plus average blank surface water concentrations) to be higherthan this, at 17.7 μmol/L for the 50 g/L treatments, 34.0 μmol/L for the100 g/L treatments and 61.9 μmol/L for the 200 g/L treatments.
3.4. Field-based dredge monitoring
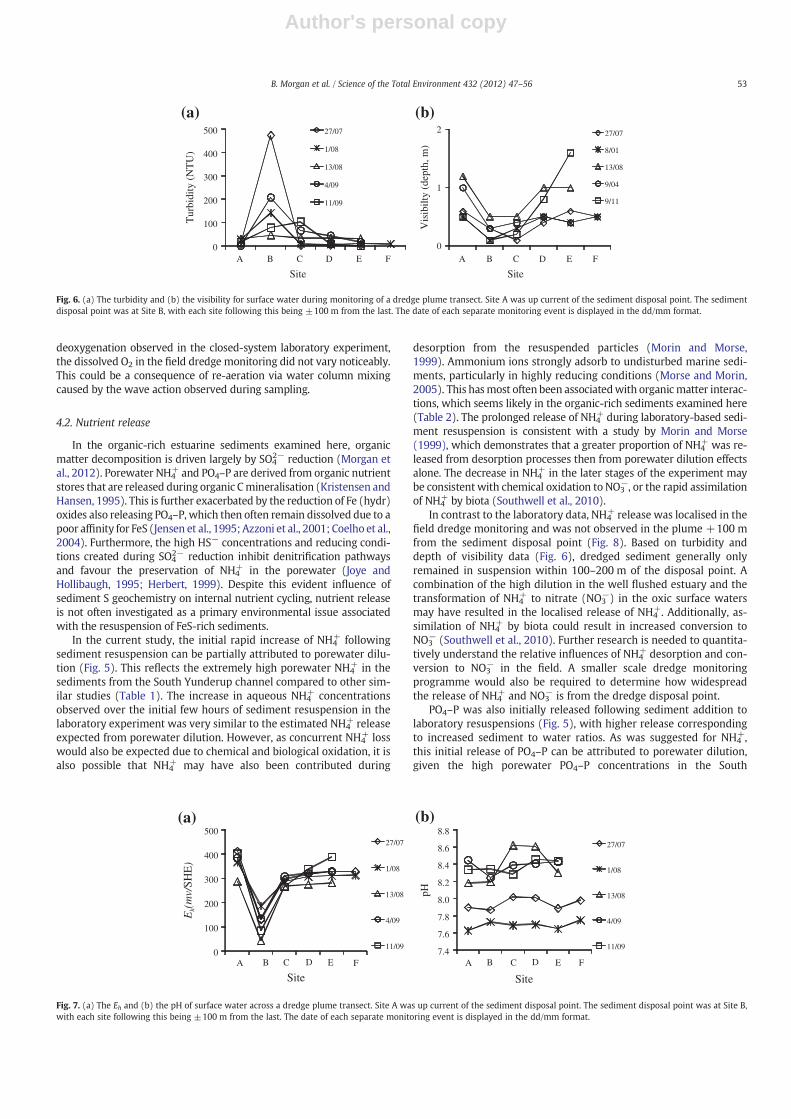
At the sediment disposal point (Site B) a black plumewas consistentwith a localised area of increased turbidity (Fig. 6). As such, within 100–200 m from Site B, the turbidity decreased back to the values observedoutside of the plume (Fig. 6a). Likewise, an impaired depth of visibilitywas generally localised to the disposal site, with normal depth of visibil-ity restored within 100–200 m (Fig. 6b). The magnitude of the in-creased turbidity at the sediment disposal point varied depending onthe sampling day, with a maximum increase (up to 473 NTU) observedat the on the 27th of July and a minimum (45.7 NTU) on the 13thAugust. Based on the relationship measured between nephelometricturbidity units (NTU) and the suspended sediment load in the Brisbane
River estuary, sediment to water ratios at the disposal point in thisstudy should range between ~50 mg/L and >200 mg/L (Hossain et al.,2004). This is comparable to the sediment loads used in the laboratoryresuspension experiments (see Section 3.3).
The pH and Eh values for the dredge transect during monitoringare displayed in Fig. 7. A localised decrease in redox potential at thepoint of sediment disposal in the dredge plume was observed(Fig. 7). These lower Eh values observed in the field were consistentwith the minimum Eh values observed in the laboratory resuspensionexperiment (see Section 3.2). The pHwas unaffected by distance fromdisposal site (Fig. 7), with the variation observed between samplingdates being representative of normal estuarine variability.
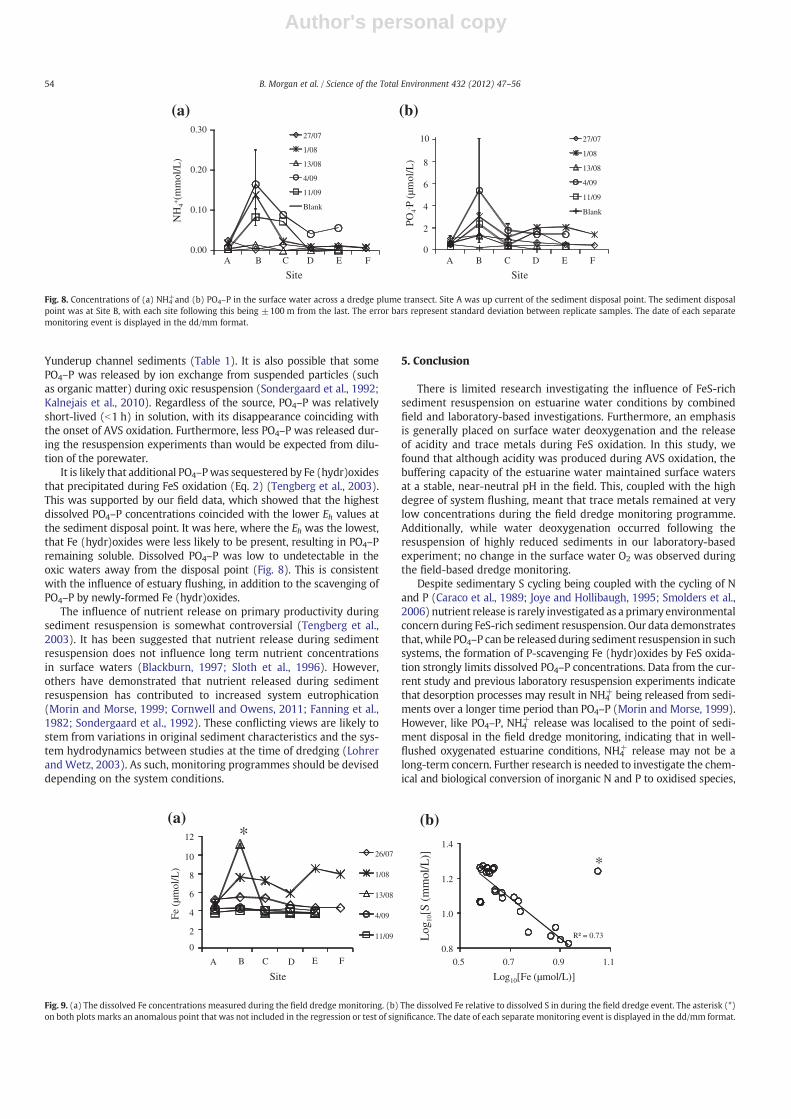
The release of NH4+ and PO4–P was also observed to be localised at
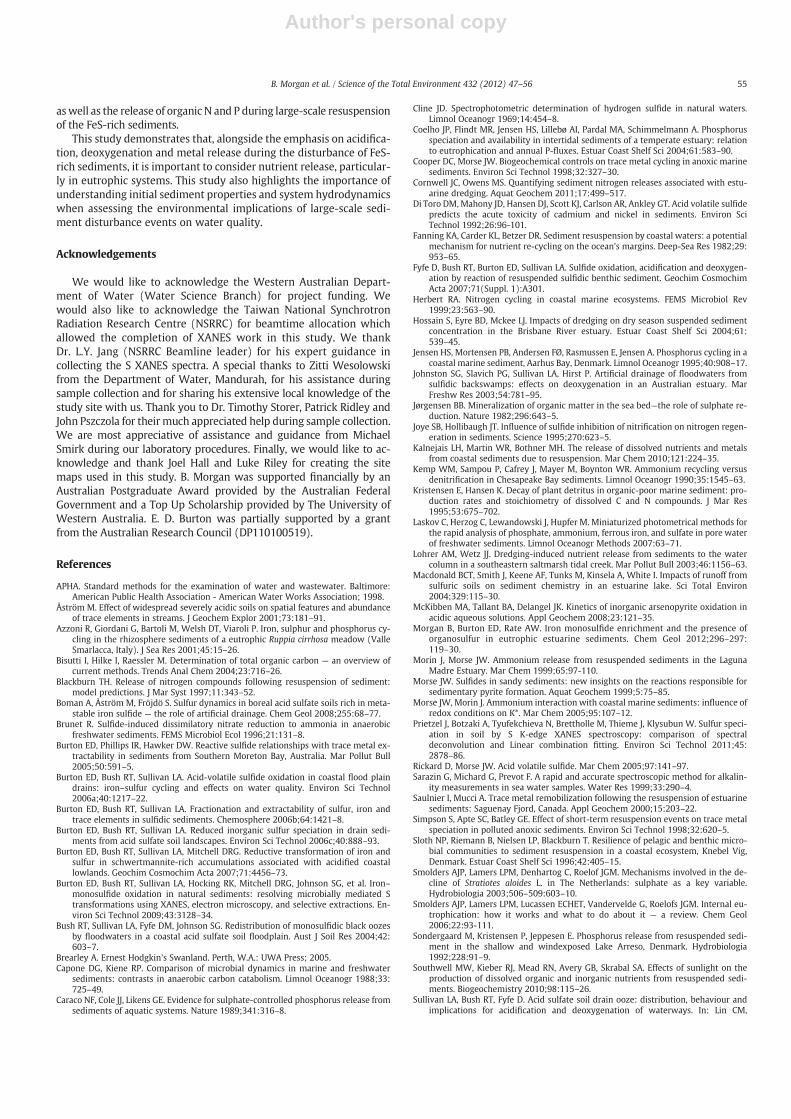
the sediment disposal point in the dredge plume (Fig. 8). There wasno detectable release of dissolved trace metals (As, Cd, Co, Cr, Cu,Mn, Mo, Ni, Pb, Zn) during the dredge monitoring. The dissolvediron (Fe) and S concentrations were particularly high at the dredgedisposal point on the 13th August compared with other Fe and Svalues throughout the monitoring period (Fig. 9a). This coincidedwith the lowest surface water Eh measurement (44 mV) throughoutthe dredge monitoring. For all other sampling days, dissolved Fe didnot vary noticeably across the dredge transect (Fig. 9a). Ignoring
(a) (b)
0
100
200
300
400
500
0 1 10 100 1000
Eh
(mV
/SH
E)
Time (hr)
6.5
7.0
7.5
8.0
8.5
9.0
0 1 10 100 1000
pH
Time (hr)
Fig. 3. The (a) redox potential and the (b) pH from the laboratory resuspension experiment in water from the study site. Treatments were 50 g/L (□), 100 g/L (△) and 200 g/L (○)wet-weight sediment, with a control (+) of nil sediment addition. The error bars represent standard deviation between replicates.
0
50
100
150
200
0.1 1 10 100
AV
S (µ
mol
/g)
Time (hr)
0 hrs
24 hrs
72 hrs
2465 2470 2475 2480 2485
GregitePyriteElemental S
SulfateSulfonate
Energy (eV)
Mackinawite
S(-I
I)
S(0)
S(-I
)
S(V
)S(
VI)
(a) (b)
Fig. 4. (a) AVS concentrations during a laboratory resuspension of sediments in site water, with treatments of 50 g/L (□), 100 g/L (△) and 200 g/L (○) wet-weight sediment. Theerror bars represent standard deviation between replicates. Concentrations of AVS added to each treatment (see Section 2.4) were not graphed to maintain the clarity of the figure.(b) A comparison between the S K-edge XANES peaks for reference phases and samples collected at three time intervals during the laboratory sediment resuspension (100 g/L ofwet-weight sediment).
51B. Morgan et al. / Science of the Total Environment 432 (2012) 47–56
Author's personal copy
this single anomalous data point, the dissolved Fe concentration de-creased as dissolved S increased (r2=0.73, Pb0.001) (Fig. 9b).
4. Discussion
4.1. Eh, pH and O2
It is increasingly recognised that sedimentary S cycling can stronglyinfluence the ecological sustainability of aquatic ecosystems (Åström,2001; Boman et al., 2008; Brunet, 1996; Burton et al., 2006b, 2006c;Bush et al., 2004; Caraco et al., 1989; Cooper and Morse, 1998; Di Toroet al., 1992; Morgan et al., 2012; Rickard and Morse, 2005; Ward et al.,2004; Macdonald et al., 2004). Several small-scale laboratory-basedstudies have demonstrated that the resuspension and oxidation of FeScan cause water column deoxygenation and release acidity and tracemetals into surface waters (Burton et al., 2006a, 2006b; Saulnier andMucci, 2000; Simpson et al., 1998; Bush et al., 2004; Fyfe et al., 2007).Despite this, relatively little research exists investigating the influenceof large-scale disturbance of FeS-rich sediment on the water chemistryof shallow estuarine systems.
In this study, surface water pH, Eh and dissolved O2 were investi-gated during the resuspension of FeS-rich sediment from a eutrophicetuarine system. The rapid consumption of FeS during our laboratory-based sediment resuspension experiment coincided with an increas-ing Eh following the first hour of sediment resuspension (Figs. 3, 4).This is consistent with previous studies that demonstrate the relative-ly rapid (b24 h) oxidation of AVS in natural sediments duringresuspension events (Burton et al., 2006a; Simpson et al., 1998).While we do not have AVS data for monitoring of the field dredgingevent, the obvious decrease in Eh at the sediment disposal point(Fig. 7) suggests a localised area of more reducing conditions consis-tent with the resuspension of the anoxic, FeS-rich sediments. It is pos-sible that the decrease in Eh may have been localised to the sedimentdisposal point because of the rapid oxidation of AVS, or because of therapid resettling of sediments (Fig. 6).
A significant negative correlation between Fe and S (Fig. 9) in thefield dredge monitoring (apart from one anomalous point) may seem
inconsistent with FeS oxidation according to Eq. (1).
4FeS sð Þ þ 8O2 gð Þ→4Fe2þ aqð Þ þ 4SO42−
aqð Þ ð1Þ
However, this relationship can be understood by considering thatthe low dissolved Fe concentrations are likely to be due to the precip-itation of Fe (hydr)oxides following the initial release of Fe2+ (Eq. 2):
Fe2þ aqð Þ þ 1=4O2 gð Þ þ 3=2H2O lð Þ→FeOOH sð Þ þ 2 Hþaqð Þ: ð2Þ
Treatments with a higher FeS addition demonstrated a greaterdecrease in pH in the laboratory-based sediment resuspension exper-iment (Fig. 3). This is consistent with previous studies that demon-strate the production of acidity during oxidation of FeS (Burton etal., 2006a). In general, for all sediment to water ratios thelaboratory-based resuspension experiment revealed little change inpH as a result of sediment FeS oxidation (Fig. 3). This is due to thebuffering capacity provided by both the estuarine water and the sed-iment porewater and carbonate phases (Table 3). This also explainsthe near-neutral conditions observed throughout the field dredgemonitoring, despite acidity being produced via Eq. (2). From this wecan suggest that in an estuarine system, seawater buffering can pre-vent the severe acidification events that are observed during sulfidicsediment resuspension in freshwater systems (Sullivan et al., 2002).In turn, this prevents the pH-dependent release of metals duringthe field resuspension of FeS rich sediments (Burton et al., 2006a).
In the laboratory deoxygenation experiment, the decrease in thelevel of dissolved O2 saturation was more rapid for treatments with ahigher sediment to water ratio (Fig. 2), providing support for previousstudies showing water column deoxygenation during oxidation ofFeS-rich sediment (Fyfe et al., 2007; Bush et al., 2004). However, wefound that the depletion of O2 from the water column was more rapid(b20 min) than the majority of the AVS oxidation (occurring after~1 h). This suggests that the initial oxygen demand of the sedimentsmay also be attributed to the rapid oxidation of reduced porewater spe-cies such as ∑S2−, NH4
+, methane and reduced humic substances(Johnston et al., 2003; Wong et al., 2010). In contrast to the
Table 3A summary of the AVS addition, H+ production, porewater HCO3
− addition, surface water HCO3− and the solid phase TIC addition for the treatments in the laboratory resuspension.
Treatment(g/L)
AVS addition(mmol/L)
H+ produceda
(mmol/L)Porewater HCO3
− addition(mmol/L)
Surface water HCO3−
(mmol/L)Solid phase TIC addition(mmol/L)
50 g/L 2.0 4.1 2.8 2.4 21.0100 g/L 3.9 7.7 5.5 2.4 40.1200 g/L 7.1 14.2 10.6 2.4 73.5
a Calculated based on stoichiometric relationship between FeS consumption and H+ production following complete oxidation of initial AVS.
(a) (b)
0
1
2
3
4
0.01 0.1 1 10 100 1000
NH
4+ (
mm
ol/L
)
Time (hr)
0
10
20
30
40
0.01 0.1 1 10 100 1000
PO4- P
(µm
ol/L
)
Time (hr)
Fig. 5. (a) NH4+ and (b) PO4–P released during a laboratory resuspension of sediments from the South Yunderup channel in water from the study site. Treatments were 50 g/L (□),
100 g/L (△) and 200 g/L (○) of wet-weight sediment, with a control (+) of nil sediment addition. The error bars represent standard deviation between replicates.
52 B. Morgan et al. / Science of the Total Environment 432 (2012) 47–56
Author's personal copy
deoxygenation observed in the closed-system laboratory experiment,the dissolved O2 in the field dredge monitoring did not vary noticeably.This could be a consequence of re-aeration via water column mixingcaused by the wave action observed during sampling.
4.2. Nutrient release
In the organic-rich estuarine sediments examined here, organicmatter decomposition is driven largely by SO4
2− reduction (Morgan etal., 2012). Porewater NH4
+ and PO4–P are derived from organic nutrientstores that are released during organic Cmineralisation (Kristensen andHansen, 1995). This is further exacerbated by the reduction of Fe (hydr)oxides also releasing PO4–P, which then often remain dissolved due to apoor affinity for FeS (Jensen et al., 1995; Azzoni et al., 2001; Coelho et al.,2004). Furthermore, the high HS− concentrations and reducing condi-tions created during SO4
2− reduction inhibit denitrification pathwaysand favour the preservation of NH4
+ in the porewater (Joye andHollibaugh, 1995; Herbert, 1999). Despite this evident influence ofsediment S geochemistry on internal nutrient cycling, nutrient releaseis not often investigated as a primary environmental issue associatedwith the resuspension of FeS-rich sediments.
In the current study, the initial rapid increase of NH4+ following
sediment resuspension can be partially attributed to porewater dilu-tion (Fig. 5). This reflects the extremely high porewater NH4
+ in thesediments from the South Yunderup channel compared to other sim-ilar studies (Table 1). The increase in aqueous NH4
+ concentrationsobserved over the initial few hours of sediment resuspension in thelaboratory experiment was very similar to the estimated NH4
+ releaseexpected from porewater dilution. However, as concurrent NH4
+ losswould also be expected due to chemical and biological oxidation, it isalso possible that NH4
+ may have also been contributed during
desorption from the resuspended particles (Morin and Morse,1999). Ammonium ions strongly adsorb to undisturbed marine sedi-ments, particularly in highly reducing conditions (Morse and Morin,2005). This hasmost often been associatedwith organicmatter interac-tions, which seems likely in the organic-rich sediments examined here(Table 2). The prolonged release of NH4
+ during laboratory-based sedi-ment resuspension is consistent with a study by Morin and Morse(1999), which demonstrates that a greater proportion of NH4
+ was re-leased from desorption processes then from porewater dilution effectsalone. The decrease in NH4
+ in the later stages of the experiment maybe consistent with chemical oxidation to NO3
−, or the rapid assimilationof NH4
+ by biota (Southwell et al., 2010).In contrast to the laboratory data, NH4
+ release was localised in thefield dredge monitoring and was not observed in the plume +100 mfrom the sediment disposal point (Fig. 8). Based on turbidity anddepth of visibility data (Fig. 6), dredged sediment generally onlyremained in suspension within 100–200 m of the disposal point. Acombination of the high dilution in the well flushed estuary and thetransformation of NH4
+ to nitrate (NO3−) in the oxic surface waters
may have resulted in the localised release of NH4+. Additionally, as-
similation of NH4+ by biota could result in increased conversion to
NO3− (Southwell et al., 2010). Further research is needed to quantita-
tively understand the relative influences of NH4+ desorption and con-
version to NO3− in the field. A smaller scale dredge monitoring
programme would also be required to determine how widespreadthe release of NH4
+ and NO3− is from the dredge disposal point.
PO4–P was also initially released following sediment addition tolaboratory resuspensions (Fig. 5), with higher release correspondingto increased sediment to water ratios. As was suggested for NH4
+,this initial release of PO4–P can be attributed to porewater dilution,given the high porewater PO4–P concentrations in the South
(a) (b)
0
100
200
300
400
500
A B C D E F
Tur
bidi
ty (
NT
U)
Site
27/07
1/08
13/08
4/09
11/09
0
1
2
A B C D E F
27/07
8/01
13/08
9/04
9/11
Vis
ibilt
y (d
epth
, m)
Site
Fig. 6. (a) The turbidity and (b) the visibility for surface water during monitoring of a dredge plume transect. Site A was up current of the sediment disposal point. The sedimentdisposal point was at Site B, with each site following this being ±100 m from the last. The date of each separate monitoring event is displayed in the dd/mm format.
(a) (b)
0
100
200
300
400
500
Eh(
mv/
SHE
)
Site
27/07
1/08
13/08
4/09
11/097.4
7.6
7.8
8.0
8.2
8.4
8.6
8.8
pH
Site
27/07
1/08
13/08
4/09
11/09
A B C D E F A B C D E F
Fig. 7. (a) The Eh and (b) the pH of surface water across a dredge plume transect. Site A was up current of the sediment disposal point. The sediment disposal point was at Site B,with each site following this being ±100 m from the last. The date of each separate monitoring event is displayed in the dd/mm format.
53B. Morgan et al. / Science of the Total Environment 432 (2012) 47–56
Author's personal copy
Yunderup channel sediments (Table 1). It is also possible that somePO4–P was released by ion exchange from suspended particles (suchas organic matter) during oxic resuspension (Sondergaard et al., 1992;Kalnejais et al., 2010). Regardless of the source, PO4–P was relativelyshort-lived (b1 h) in solution, with its disappearance coinciding withthe onset of AVS oxidation. Furthermore, less PO4–P was released dur-ing the resuspension experiments than would be expected from dilu-tion of the porewater.
It is likely that additional PO4–Pwas sequestered by Fe (hydr)oxidesthat precipitated during FeS oxidation (Eq. 2) (Tengberg et al., 2003).This was supported by our field data, which showed that the highestdissolved PO4–P concentrations coincided with the lower Eh values atthe sediment disposal point. It was here, where the Eh was the lowest,that Fe (hydr)oxides were less likely to be present, resulting in PO4–Premaining soluble. Dissolved PO4–P was low to undetectable in theoxic waters away from the disposal point (Fig. 8). This is consistentwith the influence of estuary flushing, in addition to the scavenging ofPO4–P by newly-formed Fe (hydr)oxides.
The influence of nutrient release on primary productivity duringsediment resuspension is somewhat controversial (Tengberg et al.,2003). It has been suggested that nutrient release during sedimentresuspension does not influence long term nutrient concentrationsin surface waters (Blackburn, 1997; Sloth et al., 1996). However,others have demonstrated that nutrient released during sedimentresuspension has contributed to increased system eutrophication(Morin and Morse, 1999; Cornwell and Owens, 2011; Fanning et al.,1982; Sondergaard et al., 1992). These conflicting views are likely tostem from variations in original sediment characteristics and the sys-tem hydrodynamics between studies at the time of dredging (Lohrerand Wetz, 2003). As such, monitoring programmes should be deviseddepending on the system conditions.
5. Conclusion
There is limited research investigating the influence of FeS-richsediment resuspension on estuarine water conditions by combinedfield and laboratory-based investigations. Furthermore, an emphasisis generally placed on surface water deoxygenation and the releaseof acidity and trace metals during FeS oxidation. In this study, wefound that although acidity was produced during AVS oxidation, thebuffering capacity of the estuarine water maintained surface watersat a stable, near-neutral pH in the field. This, coupled with the highdegree of system flushing, meant that trace metals remained at verylow concentrations during the field dredge monitoring programme.Additionally, while water deoxygenation occurred following theresuspension of highly reduced sediments in our laboratory-basedexperiment; no change in the surface water O2 was observed duringthe field-based dredge monitoring.
Despite sedimentary S cycling being coupled with the cycling of Nand P (Caraco et al., 1989; Joye and Hollibaugh, 1995; Smolders et al.,2006) nutrient release is rarely investigated as a primary environmentalconcern during FeS-rich sediment resuspension. Our data demonstratesthat, while PO4–P can be released during sediment resuspension in suchsystems, the formation of P-scavenging Fe (hydr)oxides by FeS oxida-tion strongly limits dissolved PO4–P concentrations. Data from the cur-rent study and previous laboratory resuspension experiments indicatethat desorption processes may result in NH4
+ being released from sedi-ments over a longer time period than PO4–P (Morin and Morse, 1999).However, like PO4–P, NH4
+ release was localised to the point of sedi-ment disposal in the field dredge monitoring, indicating that in well-flushed oxygenated estuarine conditions, NH4
+ release may not be along-term concern. Further research is needed to investigate the chem-ical and biological conversion of inorganic N and P to oxidised species,
(a)
0.00
0.10
0.20
0.30
NH
4+(m
mol
/L)
Site
27/07
1/08
13/08
4/09
11/09
Blank
0
2
4
6
8
10
A B C D E F
Site
27/07
1/08
13/08
4/09
11/09
Blank
PO4- P
(µm
ol/L
)
A B C D E F
(b)
Fig. 8. Concentrations of (a) NH4+and (b) PO4–P in the surface water across a dredge plume transect. Site A was up current of the sediment disposal point. The sediment disposal
point was at Site B, with each site following this being ±100 m from the last. The error bars represent standard deviation between replicate samples. The date of each separatemonitoring event is displayed in the dd/mm format.
(a) (b)
0
2
4
6
8
10
12
Fe (
µmol
/L)
26/07
1/08
13/08
4/09
11/09 R² = 0.73
0.8
1.0
1.2
1.4
0.5 0.7 0.9 1.1
Log
10[S
(mm
ol/L
)]
Log10[Fe (µmol/L)]
*
*
A B C D E F
Site
Fig. 9. (a) The dissolved Fe concentrations measured during the field dredge monitoring. (b) The dissolved Fe relative to dissolved S in during the field dredge event. The asterisk (*)on both plots marks an anomalous point that was not included in the regression or test of significance. The date of each separate monitoring event is displayed in the dd/mm format.
54 B. Morgan et al. / Science of the Total Environment 432 (2012) 47–56
Author's personal copy
aswell as the release of organic N and P during large-scale resuspensionof the FeS-rich sediments.
This study demonstrates that, alongside the emphasis on acidifica-tion, deoxygenation and metal release during the disturbance of FeS-rich sediments, it is important to consider nutrient release, particular-ly in eutrophic systems. This study also highlights the importance ofunderstanding initial sediment properties and system hydrodynamicswhen assessing the environmental implications of large-scale sedi-ment disturbance events on water quality.
Acknowledgements
We would like to acknowledge the Western Australian Depart-ment of Water (Water Science Branch) for project funding. Wewould also like to acknowledge the Taiwan National SynchrotronRadiation Research Centre (NSRRC) for beamtime allocation whichallowed the completion of XANES work in this study. We thankDr. L.Y. Jang (NSRRC Beamline leader) for his expert guidance incollecting the S XANES spectra. A special thanks to Zitti Wesolowskifrom the Department of Water, Mandurah, for his assistance duringsample collection and for sharing his extensive local knowledge of thestudy site with us. Thank you to Dr. Timothy Storer, Patrick Ridley andJohn Pszczola for their much appreciated help during sample collection.We are most appreciative of assistance and guidance from MichaelSmirk during our laboratory procedures. Finally, we would like to ac-knowledge and thank Joel Hall and Luke Riley for creating the sitemaps used in this study. B. Morgan was supported financially by anAustralian Postgraduate Award provided by the Australian FederalGovernment and a Top Up Scholarship provided by The University ofWestern Australia. E. D. Burton was partially supported by a grantfrom the Australian Research Council (DP110100519).
References
APHA. Standard methods for the examination of water and wastewater. Baltimore:American Public Health Association - American Water Works Association; 1998.
Åström M. Effect of widespread severely acidic soils on spatial features and abundanceof trace elements in streams. J Geochem Explor 2001;73:181–91.
Azzoni R, Giordani G, Bartoli M, Welsh DT, Viaroli P. Iron, sulphur and phosphorus cy-cling in the rhizosphere sediments of a eutrophic Ruppia cirrhosa meadow (ValleSmarlacca, Italy). J Sea Res 2001;45:15–26.
Bisutti I, Hilke I, Raessler M. Determination of total organic carbon — an overview ofcurrent methods. Trends Anal Chem 2004;23:716–26.
Blackburn TH. Release of nitrogen compounds following resuspension of sediment:model predictions. J Mar Syst 1997;11:343–52.
Boman A, Åström M, Fröjdö S. Sulfur dynamics in boreal acid sulfate soils rich in meta-stable iron sulfide — the role of artificial drainage. Chem Geol 2008;255:68–77.
Brunet R. Sulfide-induced dissimilatory nitrate reduction to ammonia in anaerobicfreshwater sediments. FEMS Microbiol Ecol 1996;21:131–8.
Burton ED, Phillips IR, Hawker DW. Reactive sulfide relationships with trace metal ex-tractability in sediments from Southern Moreton Bay, Australia. Mar Pollut Bull2005;50:591–5.
Burton ED, Bush RT, Sullivan LA. Acid-volatile sulfide oxidation in coastal flood plaindrains: iron–sulfur cycling and effects on water quality. Environ Sci Technol2006a;40:1217–22.
Burton ED, Bush RT, Sullivan LA. Fractionation and extractability of sulfur, iron andtrace elements in sulfidic sediments. Chemosphere 2006b;64:1421–8.
Burton ED, Bush RT, Sullivan LA. Reduced inorganic sulfur speciation in drain sedi-ments from acid sulfate soil landscapes. Environ Sci Technol 2006c;40:888–93.
Burton ED, Bush RT, Sullivan LA, Mitchell DRG. Reductive transformation of iron andsulfur in schwertmannite-rich accumulations associated with acidified coastallowlands. Geochim Cosmochim Acta 2007;71:4456–73.
Burton ED, Bush RT, Sullivan LA, Hocking RK, Mitchell DRG, Johnson SG, et al. Iron–monosulfide oxidation in natural sediments: resolving microbially mediated Stransformations using XANES, electron microscopy, and selective extractions. En-viron Sci Technol 2009;43:3128–34.
Bush RT, Sullivan LA, Fyfe DM, Johnson SG. Redistribution of monosulfidic black oozesby floodwaters in a coastal acid sulfate soil floodplain. Aust J Soil Res 2004;42:603–7.
Brearley A. Ernest Hodgkin's Swanland. Perth, W.A.: UWA Press; 2005.Capone DG, Kiene RP. Comparison of microbial dynamics in marine and freshwater
sediments: contrasts in anaerobic carbon catabolism. Limnol Oceanogr 1988;33:725–49.
Caraco NF, Cole JJ, Likens GE. Evidence for sulphate-controlled phosphorus release fromsediments of aquatic systems. Nature 1989;341:316–8.
Cline JD. Spectrophotometric determination of hydrogen sulfide in natural waters.Limnol Oceanogr 1969;14:454–8.
Coelho JP, Flindt MR, Jensen HS, Lillebø AI, Pardal MA, Schimmelmann A. Phosphorusspeciation and availability in intertidal sediments of a temperate estuary: relationto eutrophication and annual P-fluxes. Estuar Coast Shelf Sci 2004;61:583–90.
Cooper DC, Morse JW. Biogeochemical controls on trace metal cycling in anoxic marinesediments. Environ Sci Technol 1998;32:327–30.
Cornwell JC, Owens MS. Quantifying sediment nitrogen releases associated with estu-arine dredging. Aquat Geochem 2011;17:499–517.
Di Toro DM, Mahony JD, Hansen DJ, Scott KJ, Carlson AR, Ankley GT. Acid volatile sulfidepredicts the acute toxicity of cadmium and nickel in sediments. Environ SciTechnol 1992;26:96-101.
Fanning KA, Carder KL, Betzer DR. Sediment resuspension by coastal waters: a potentialmechanism for nutrient re-cycling on the ocean's margins. Deep-Sea Res 1982;29:953–65.
Fyfe D, Bush RT, Burton ED, Sullivan LA. Sulfide oxidation, acidification and deoxygen-ation by reaction of resuspended sulfidic benthic sediment. Geochim CosmochimActa 2007;71(Suppl. 1):A301.
Herbert RA. Nitrogen cycling in coastal marine ecosystems. FEMS Microbiol Rev1999;23:563–90.
Hossain S, Eyre BD, Mckee LJ. Impacts of dredging on dry season suspended sedimentconcentration in the Brisbane River estuary. Estuar Coast Shelf Sci 2004;61:539–45.
Jensen HS, Mortensen PB, Andersen FØ, Rasmussen E, Jensen A. Phosphorus cycling in acoastal marine sediment, Aarhus Bay, Denmark. Limnol Oceanogr 1995;40:908–17.
Johnston SG, Slavich PG, Sullivan LA, Hirst P. Artificial drainage of floodwaters fromsulfidic backswamps: effects on deoxygenation in an Australian estuary. MarFreshw Res 2003;54:781–95.
Jørgensen BB. Mineralization of organic matter in the sea bed—the role of sulphate re-duction. Nature 1982;296:643–5.
Joye SB, Hollibaugh JT. Influence of sulfide inhibition of nitrification on nitrogen regen-eration in sediments. Science 1995;270:623–5.
Kalnejais LH, Martin WR, Bothner MH. The release of dissolved nutrients and metalsfrom coastal sediments due to resuspension. Mar Chem 2010;121:224–35.
Kemp WM, Sampou P, Cafrey J, Mayer M, Boynton WR. Ammonium recycling versusdenitrification in Chesapeake Bay sediments. Limnol Oceanogr 1990;35:1545–63.
Kristensen E, Hansen K. Decay of plant detritus in organic-poor marine sediment: pro-duction rates and stoichiometry of dissolved C and N compounds. J Mar Res1995;53:675–702.
Laskov C, Herzog C, Lewandowski J, Hupfer M. Miniaturized photometrical methods forthe rapid analysis of phosphate, ammonium, ferrous iron, and sulfate in pore waterof freshwater sediments. Limnol Oceanogr Methods 2007:63–71.
Lohrer AM, Wetz JJ. Dredging-induced nutrient release from sediments to the watercolumn in a southeastern saltmarsh tidal creek. Mar Pollut Bull 2003;46:1156–63.
Macdonald BCT, Smith J, Keene AF, Tunks M, Kinsela A, White I. Impacts of runoff fromsulfuric soils on sediment chemistry in an estuarine lake. Sci Total Environ2004;329:115–30.
McKibben MA, Tallant BA, Delangel JK. Kinetics of inorganic arsenopyrite oxidation inacidic aqueous solutions. Appl Geochem 2008;23:121–35.
Morgan B, Burton ED, Rate AW. Iron monosulfide enrichment and the presence oforganosulfur in eutrophic estuarine sediments. Chem Geol 2012;296–297:119–30.
Morin J, Morse JW. Ammonium release from resuspended sediments in the LagunaMadre Estuary. Mar Chem 1999;65:97-110.
Morse JW. Sulfides in sandy sediments: new insights on the reactions responsible forsedimentary pyrite formation. Aquat Geochem 1999;5:75–85.
Morse JW, Morin J. Ammonium interaction with coastal marine sediments: influence ofredox conditions on K*. Mar Chem 2005;95:107–12.
Prietzel J, Botzaki A, Tyufekchieva N, Brettholle M, Thieme J, Klysubun W. Sulfur speci-ation in soil by S K-edge XANES spectroscopy: comparison of spectraldeconvolution and Linear combination fitting. Environ Sci Technol 2011;45:2878–86.
Rickard D, Morse JW. Acid volatile sulfide. Mar Chem 2005;97:141–97.Sarazin G, Michard G, Prevot F. A rapid and accurate spectroscopic method for alkalin-
ity measurements in sea water samples. Water Res 1999;33:290–4.Saulnier I, Mucci A. Trace metal remobilization following the resuspension of estuarine
sediments: Saguenay Fjord, Canada. Appl Geochem 2000;15:203–22.Simpson S, Apte SC, Batley GE. Effect of short-term resuspension events on trace metal
speciation in polluted anoxic sediments. Environ Sci Technol 1998;32:620–5.Sloth NP, Riemann B, Nielsen LP, Blackburn T. Resilience of pelagic and benthic micro-
bial communities to sediment resuspension in a coastal ecosystem, Knebel Vig,Denmark. Estuar Coast Shelf Sci 1996;42:405–15.
Smolders AJP, Lamers LPM, Denhartog C, Roelof JGM. Mechanisms involved in the de-cline of Stratiotes aloides L. in The Netherlands: sulphate as a key variable.Hydrobiologia 2003;506–509:603–10.
Smolders AJP, Lamers LPM, Lucassen ECHET, Vandervelde G, Roelofs JGM. Internal eu-trophication: how it works and what to do about it — a review. Chem Geol2006;22:93-111.
Sondergaard M, Kristensen P, Jeppesen E. Phosphorus release from resuspended sedi-ment in the shallow and windexposed Lake Arreso, Denmark. Hydrobiologia1992;228:91–9.
Southwell MW, Kieber RJ, Mead RN, Avery GB, Skrabal SA. Effects of sunlight on theproduction of dissolved organic and inorganic nutrients from resuspended sedi-ments. Biogeochemistry 2010;98:115–26.
Sullivan LA, Bush RT, Fyfe D. Acid sulfate soil drain ooze: distribution, behaviour andimplications for acidification and deoxygenation of waterways. In: Lin CM,
55B. Morgan et al. / Science of the Total Environment 432 (2012) 47–56

Author's personal copy
Melville MD, Sullivan LA, editors. Acid sulfate soils in Australia and China, Beijing,Science Press; 2002, p. 91–9.
Tengberg A, Almroth E, Hall P. Resuspension and its effects on organic carbon recyclingand nutrient exchange in coastal sediments: in situ measurements using new ex-perimental technology. J Exp Mar Biol Ecol 2003;285–286:119–42.
Ward NJ, Sullivan LA, Fyfe DM, Bush RT, Ferguson AJP. The process of sulfide oxidationin some acid sulfate soil materials. Aust J Soil Res 2004;42:449–58.
Wong VNL, Johnston SG, Bush RT, Sullivan LA, Clay C, Burton ED, et al. Spatial and tem-poral changes in estuarine water quality during a post-flood hypoxic event. EstuarCoast Shelf Sci 2010;87:73–82.
56 B. Morgan et al. / Science of the Total Environment 432 (2012) 47–56
Copyright © 2022 FDOKUMEN