
The impact of news on the exchange rate of the lira and long-term interest rates
44
Temi di discussione del Servizio Studi The Impact of News on the Exchange Rate of the Lira and Long-Term Interest Rates by F. Fornari, C. Monticelli, M. Pericoli and M. Tivegna Number 358 - October 1999
-
Upload
independent -
Category
Documents
-
view
0 -
download
0
Transcript of The impact of news on the exchange rate of the lira and long-term interest rates

Temididiscussionedel Servizio Studi
The Impact of News on the Exchange Rateof the Lira and Long-Term Interest Rates
by F. Fornari, C. Monticelli, M. Pericoli and M. Tivegna
Number 358 -- October 1999

The purpose of the “ Temi di discussione” seriesistopromote the circulationof workingpapers prepared within the Bank of Italy or presented in Bank seminars by outsideeconomistswith the aim of stimulating commentsand suggestions.
The views expressed in the articles are those of the authors and do not involve theresponsibility of theBank.
Editorial Board:MASSIMO ROCCAS, FABRIZIO BALASSONE, GIUSEPPE PARIGI, ROBERTO RINALDI, DANIELE
TERLIZZESE, PAOLO ZAFFARONI; RAFFAELA BISCEGLIA (Editorial Assistant).
SINTESI
Il contenuto di questo lavoro esprime solamente le opinioni degli autori; pertanto
non rappresenta la posizione ufficiale della Banca d’Italia.
Il lavoro fornisce un contributo alla letteratura economica empirica sui prezzi delle
attività finanziarie nel filone della “finanza comportamentale” (behavioural finance) con
uno studio dal carattere innovativo sugli effetti del “rumore” politico e del rilascio di dati
economici sulle variazioni del tasso di cambio e del tasso di interesse a lungo termine. La
“finanza comportamentale” analizza l’interazione tra variabili finanziarie e azioni degli
agenti economici dal punto di vista microeconomico; in questo ambito, la diffusione di
notizie inattese dal mercato (cosiddette politico-economiche) o la pubblicazione di valori
di variabili macroeconomiche diversi da quelli attesi provocano una variazione
dell’insieme di informazioni disponibili agli agenti economici determinando un
mutamento del processo di generazione delle variabili monetarie e finanziarie.
Il lavoro analizza l’impatto delle notizie di carattere politico ed economico su alcune
variabili del mercato valutario e finanziario italiano (tasso di cambio della lira rispetto al
dollaro, tasso di rendimento del Btp decennale e prezzo del corrispondente contratto
futures), con particolare attenzione all’effetto sulla variabilità. Il periodo in esame,
comprendente episodi di elevata turbolenza finanziaria e politica, è caratterizzato dal
succedersi di tre governi. Esso copre il periodo che va dal marzo 1994, che coincide con
la fine di una serie di governi “tecnici”, al novembre 1996, mese in cui si pose fine alla
sospensione della partecipazione della lira agli Accordi Europei di Cambio.
Le notizie politiche ed economiche (raccolte dai maggiori quotidiani nazionali e
internazionali nonché dalla Reuters) sono classificate secondo la prevedibilità del loro
rilascio: inattesa (perlopiù notizie politiche, come dichiarazioni di fonti governative e
dirigenti politici che forniscono informazioni rilevanti riguardo allo scenario economico e
politico) e attesa (rilascio periodico a date prefissate di dati macroeconomici ritenuti
variabili fondamentali dagli agenti economici, come il tasso di inflazione, i prezzi della
produzione industriale, i tassi all’emissione dei titoli pubblici ecc.). Prima del novembre
1996 in Italia l’influenza delle notizie politiche sui prezzi delle attività finanziarie è stata
più marcata di quella registrata negli altri paesi industriali presumibilmente a causa della
profonda trasformazione che si stava verificando nell’assetto politico italiano.
Ugualmente, il deterioramento del disavanzo pubblico, che ha coinciso con la crisi in
Messico del marzo 1995, ha reso i mercati finanziari italiani particolarmente sensibili alla
diffusione di dati relativi al deficit pubblico, al tasso di emissione dei titoli del Tesoro a
breve termine, al tasso delle operazioni pronti contro termine condotte dalla Banca
centrale, al tasso di inflazione osservato preliminarmente nelle città campione.
L’analisi è divisa in due parti. La prima esamina l’impatto di ogni singola notizia politica
ed economica sulle variazioni percentuali di ogni variabile finanziaria e sulla loro
variabilità condizionale. Nella seconda fase, le notizie che sono risultate significative
sono aggregate in alcune variabili dummy composte e sono utilizzate in un modello
multivariato a varianza condizionale autoregressiva generalizzata (Generalized
Autoregressive Conditional Heteroskedastic model, Garch). Si esamina inoltre la
persistenza di una notizia negativa sulla variazione del prezzo delle attività finanziarie
tramite una funzione di risposta a un impulso.
I risultati mostrano che le notizie influenzano sia la media sia la variabilità condizionale
delle variazioni giornaliere del tasso di cambio della lira rispetto al dollaro, del
rendimento del Btp decennale e del corrispondente contratto futures. Inoltre, si evidenzia
che esiste un significativo cambiamento di regime nella variabilità non condizionale delle
variabili finanziarie durante i tre governi che si sono succeduti nel periodo in esame.
Infine, diversamente dall’opinione diffusa, l’impatto delle notizie politiche e dei dati
macroeconomici è stato più pronunciato sulla variabilità condizionale del tasso di cambio
della lira rispetto al dollaro che su quella del tasso di interesse sul Btp decennale.

* Bank of Italy, Research Department.** University of Teramo and LUISS-Guido Carli, Roma.
THE IMPACT OF NEWS ON THE EXCHANGE RATEOF THE LIRA AND LONG-TERM INTEREST RATES
by Fabio Fornari*, Carlo Monticelli*, Marcello Pericoli* and Massimo Tivegna**
Abstract
This paper analyzes the impact of news on several Italian financial variables, payingparticular attention to the effect on the conditional volatility of these variables. The analysisspans a period of great financial and political turbulence in Italy, including the rapidsuccession of three governments. News releases (articles on political and economic eventscollected daily from both the Italian and international economic press) are classified asunscheduled (mostly political) and scheduled (i.e. economic and monetary statistics whoseannouncement is expected by market participants). The analysis is divided into two phases:first, we estimate the impact of each single political and economic news item on asset pricechanges and their conditional variance; second, those items that are identified as significant inthe first stage are then aggregated into six dummies according to their nature and origin andemployed as exogenous variables in a trivariate Garch scheme. Results show that i) newsaffects both the first and the second moment of the daily changes in the analyzed variables; ii)there is a significant regime shift of the unconditional variance of the analyzed variables acrossthe three different governments; iii) the conditional variances display a significant — albeitrather small — seasonal dayweek pattern; iv) contrary to the conventional view, the impact ofnews on the conditional variance is more pronounced for exchange rates than for Italian long-term interest rates.
Contents
1. Introduction........................................................................................................................72. News ...............................................................................................................................10 2.1 Unscheduled news.......................................................................................................11 2.2 Scheduled news..........................................................................................................113. Univariate preliminary analysis..........................................................................................12 3.1 The model...................................................................................................................12 3.2 Results........................................................................................................................14 3.2.1 Unscheduled news..............................................................................................14 3.2.2 Scheduled news..................................................................................................154. Multivariate analysis..........................................................................................................17 4.1 Multivariate Garch models..........................................................................................19 4.2 Baseline model............................................................................................................23 4.3 Regime shifts in the unconditional and the conditional variance...................................25 4.4 Seasonality..................................................................................................................26 4.5 Reaction of the conditional variance to adverse events.................................................275. Conclusions......................................................................................................................29Tables and figures.................................................................................................................31Appendix..............................................................................................................................39References............................................................................................................................42
1. Introduction1
This paper contributes to the behavioural finance2 literature on asset pricing with an
original novel study on the impact of political noise and economic data releases on exchange
and interest rates. It provides a quantitative assessment of the impact of news, both expected
and unexpected, on the Italian financial markets between 1994 — just after political elections
were held under a new bi-partisan institutional setup — and 1996, when the Italian lira re-
entered the European Exchange Rate Mechanism (ERM).
The Italian economic and political environment providing the background to our
analysis is quite extraordinary in relation to experiences typically investigated by the literature
in this field. Before the Italian lira re-entered the European exchange rate mechanism (ERM),
the influence of political news on asset prices in Italy was much stronger than in the recent
experience of any other developed country, mainly due to the severity of the various episodes
of political crisis and to the resulting deep transformations in Italian politics (see the
Appendix). Throughout this paper, the influence of unscheduled and scheduled news are kept
separate, since the effects on the market can be expected to be very different. Political news
is, by its very nature, unscheduled; inflation news, on the contrary, is generally scheduled in
terms of official announcements, though we also considered news items relevant to price
developments that are unscheduled, such as nation-wide wage settlements or news on
commodity prices. Following this approach, interest rate news related to T-Bill auctions is
scheduled, while the rate on repo operations by the Bank of Italy is not strictly scheduled,
even though its timing can be generally anticipated with accuracy. News on public finance, so
important for the outlook on Italian economic conditions, is generally unscheduled. For
scheduled news, we used surprise variables, defined by the difference between actual and
expected values, a quite common practice in the literature (e.g. Balduzzi, Elton and Green,
1998). In this paper expected values are proxied by the preceding value of the relevant series,
1 The authors wish to thank all the participants at the Link Fall meeting held in Rio de Janeiro, 14-18September 1998, especially Jorge Braga de Macedo and Cesar Fuentes, as well as the participants at theQMF98 conference held in Sydney, 14-17 December 1998. Our gratitude goes also to the referee and toGwyneth Schaefer.
2 The literature on behavioral finance highlights, among other things, the role of information arrival inthe mechanism of asset pricing, among other things; for an extensive introduction see Thaler (1993).

8
which amounts to assuming a static mechanism for the process according to which
expectations are formed; this is also consistent with the hypothesis of unit root in the
generating process of macroeconomic variables. The impact of news on exchange and interest
rates is measured within a multivariate Var-Garch scheme (i.e. a vector autoregressive model
with conditionally heteroskedastic errors), a novel approach in this literature.
Several studies have already investigated the role of economic news in the
determination of financial asset prices — particularly with reference to the North American
and Japanese financial markets. News items typically considered in the literature concerns
economic activity (unemployment, industrial production, GDP growth, retail sales, business
climate), inflation (CPI, PPI, wage developments), balance of payments (trade and current
account) and changes in official interest rates; in studies which focus more specifically on the
stock market, news items regarding individual firms are also collected (e.g. Mitchell and
Mulherin, 1994). These analyses find that excess returns and return variability are directly
related to the diffusion of news. For example, Ederington and Lee (1993) evidence that a
systematic pattern can be found in the conditional volatility of financial prices, i.e. a
significant increase (decrease) the day before which (the very day in which) scheduled news is
received by market participants; they also find that the announcement of unscheduled news
increases price variability. In a recent work, Balduzzi, Elton and Green (1998) use
expectations data to calculate surprise economic announcements, thus differentiating their
analysis from previous studies which focused on price volatility only and used dummy
variables as regressors. They find that several economic surprises have a significant impact on
US bond prices, with Nonfarm Payroll being the most prominent; they also find that price
adjustment is extremely quick, completed on average within a few minutes. Almeida,
Goodhart and Paine (1998) perform an intradaily analysis of the Deutsche Mark-US dollar
reaction to publicly announced macroeconomic information emanating from the two
countries; they find that most announcements affect the movements of the exchange rate for
fifteen minutes and that this effect decreases as the interval over which it is measured
increases. The literature on the relation between news and exchange rates follows the
monetary model scheme of exchange rate determination. Edwards (1983a, 1983b) is the first
author to propose a news-driven scheme, deriving it from a structural monetary model. In this
framework news is made up by the error terms of a reduced form monetary model. His

9
approach has been replicated in various papers, either within purely autoregressive models
aimed at generating the expected values of the relevant macroeconomic variables (Copeland,
1984; Edwards, 1983a; Bomhoff and Korteweg, 1983) or for the same purpose within
structural VAR models of the economy (Branson, 1983; Edwards, 1983a; MacDonald, 1983;
Fiorentini, 1994). A different kind of literature — closer in its approach to this paper — uses
the differences between market expectations (polled and published by various organizations)
and the actual values of the relevant variables within a reduced-form model of the exchange
rate determination. In these studies, the data frequency utilized is either daily (Deravi,
Gregorowicz and Hegi, 1988; Hardouvelis, 1988; Irwin, 1989; Hogan, Melvin and Roberts,
1991; Doukas and Lifeland, 1994) or intradaily (Ito and Roley, 1988; Ederington and Lee,
1996; Baestaens and Van den Bergh, 1996). Other less directly related works are Agmont
and Findlay (1982), Diamonte, Liew and Stevens (1996), Erb, Harvey and Viskanta (1986),
which study the relation between political risk and stock prices, and Allvine and O’Neil
(1980), Hobbs and Riley (1984) which study the impact of presidential elections on stock
markets. Finally, Tivegna (1996a, 1996b) does some first explanatory work in the
investigation of the relationship between Italian political news and the Lira exchange rate.
More recently, the deep financial crises in a number of Southern American and Far Eastern
Asian economies have led to papers which assess the domestic and cross-border impact of
economic and political news, thus adopting a methodology similar in spirit to the one in this
paper (Calvo, 1996; Baig and Goldfajn, 1998).
Since most recent studies generally use intradaily frequencies, the reader may be
puzzled by the fact that our paper uses daily observations, especially since the effects of
scheduled news are reportedly short-lived, in some cases lasting only a few hours, and the
aggregation imposed by the use of daily observations might therefore seriously hide the
impact of such news on price changes. Balduzzi, Elton and Green (1998) are the only authors
who compare the two situations, namely the effect of news in intradaily and daily settings. In
their paper, despite what one might assume, five out of the ten news announcements found to
be significant at an intradaily level remain so with daily data.3 Utilizing daily observations is
strongly motivated by the frequency with which political news is made available and by the
3 Consumer prices, initial jobless claims, housing starts, producer prices and M2 lose their significantimpact on note and bond price changes.
10
importance of considering such information. In fact, despite the abundance of analyses, very
few works focus on the impact of political events or, more generally, the impact of political
noise on financial asset prices; the collection of papers on noise in financial markets edited by
Thaler (1993) includes only one paper (Cutler, Poterba and Summers, 1993) explaining the
effect of political news on the US stock market.
This paper is organized as follows. Section 2 discusses the distinction between
scheduled and unscheduled news as well as the methodology adopted for the definition of the
event variables which are key to our quantitative analysis (also see the Appendix for this
classification). In Section 3 the significance of these variables is individually tested in an
univariate Garch setting for the exchange rate of the lira vis-à-vis the Deutsche mark. In
Section 4 the event dummies are aggregated into six variables that are then employed in a
trivariate Garch model of the mark/dollar exchange rate, the lira/mark exchange rate and the
interest rate of the Italian ten-year Government bonds (BTP); in another specification of the
same model, this last variable is replaced by the price of its futures contract. In this setup,
regime shifts of both the unconditional and the conditional variance as well as dayweek
seasonality are explicitly taken into account. Next, the multivariate model is employed to
simulate — by means of an impulse response framework — the effect of shocks hitting the
mean and the variance of financial asset prices. Section 5 concludes.
2. News
This section classifies news according to its different sources. During a typical workday,
investors, dealers and traders are hit by a massive amount of information: news in general,
releases of macroeconomic data, rumours concerning political and economic events.
Following Ederington and Lee (1996) news is classified into two categories: news that is not
expected or whose time of release is uncertain, henceforth unscheduled, and news whose
release is expected by the market, henceforth scheduled. To provide an example, a
declaration made by the Treasury Minister in a TV-interview on the tax treatment of bonds is
unexpected and will almost certainly affect the market, with an impact on both bond prices

11
and their volatility. Conversely, there is news4 concerning macroeconomic data or the results
of financial auctions whose announcement is scheduled (typically with a fair degree of
precision) and thus expected by market participants. For example, a sharp unexpected
variation in the preliminary consumer price index is important insofar as it can change the
stance of monetary policy.
2.1 Unscheduled news
Unscheduled news is an economic or institutional event, declaration or disclosure that is
either totally unexpected or, if expected, then occurring at an unknown time. This news is
therefore not likely to be fully embodied in observed prices. The acquisition and analysis of
the latest available information is central to the daily activity of trading financial assets. Such
keen attention to the latest available information stands in sharp contrast to standard theories
of asset pricing that hinge on the relationship between prices and fundamental variables.
However, as the emerging approach of behavioural finance has brought to the fore, market
participants prefer to follow information coming from the latest news rather than forecasting
future developments in fundamental economic variables, at least in a short-term perspective.
In order to define variables expressing the release of unscheduled news, reference is
made to headlines from the Financial Times and Il Sole-24 Ore, the leading Italian financial
newspaper, as well as the Reuters terminal. A detailed description of the methodology used
for the specification of the news variables (henceforth also referred to as dummies) is
provided in the Appendix.
2.2 Scheduled news
Scheduled news encorporates time series of Italian macroeconomic data that are
described in Table 1.5 Since repo operations are the instrument used by the central bank to
fine tune liquidity conditions, their announcement provides a clear signal of the Bank of
4 The word news is slightly inappropriate in this context since scheduled news in our classification is apublic release of economic data or of the results of a scheduled T-bill auction or of the interest rate resultingfrom a semi-scheduled (but widely expected by the market) repo operation by the central bank.
5 Each series equals nil when there is no release or the value of the relevant variable when data arereleased.

12
Italy’s short-term monetary intentions. The average rate observed at the auction of three-
month T-bills is the pivot rate at this maturity. Preliminary data on CPI comes from a sample
group of Italian towns and are commonly used as a leading indicator of inflation.6 Similarly,
final data on the PPI index are followed as a leading indicator of the CPI, which is the
principle measure of inflation.
3. Univariate preliminary analysis
3.1 The model
The variables representing both scheduled and unscheduled news, discussed in the
previous section and in the Appendix, are inserted in the specification of a standard univariate
Garch model of the lira vis-à-vis the Deutsche mark exchange rate; here, the daily logarithmic
changes of the exchange rate (dmit) are modelled as a first order autoregressive process with
autoregressive conditional variance. In order to avoid having the same regressor in both the
mean and the variance equations, the dummy variables are used as a predetermined regressor
in the mean and in the variance equations in turn.7 Denoting by xt the logarithmic change in
the exchange rate, these two Garch models are defined as:
the mean model
ln( / ) ln( / ) ln( / )dmit dmit x x BTdmit dmit BTdmus dmus
News Newst t t t t t t t
t t t
− − − − − −
+ −
= = + + + ++ +
1 0 1 1 1 1 2 1 1
1 2
µ φ θ θµ µ ε
ε σt t t
I N| ( , )− ∼1
20
σ ω αε βσt t t
2
1
2
1
2= + +− − ,
6 In 1997 the number of cities included in the sample group was increased from 10 to 11. Thispreliminary index accounts for over 80 percent of the final CPI. Hence its figures are often confirmed in thefinal release.
7 We report some evidence in favour of conditional heteroskedasticity. The daily rates of change ofexchange rates, of the BTP (Buoni del Tesoro Poliennali) yield and the BTP futures price exhibit a remarkableclustering of anomalous observations. Their squares show significant autocorrelation up to the 20-th lag. Thedistributions of the rates of change of the four series is leptokurtic; analogous indications come from thecoefficients of skewness and kurtosis and from the Jarque-Bera test, omitted for brevity.
13
or
the variance model
ln( / ) ln( / ) ln( / )dmit dmit x x BTdmit dmit BTdmus dmust t t t t t t t t− − − − − −= = + + + +
1 0 1 1 1 1 2 1 1µ φ θ θ ε
ε σt t t
I N| ( , )− ∼1
20
σ ω αε βσ λ λt t t t t
News News2
1
2
1
2
1 2= + + + +− −
+ − ,
where BTdmit denotes the exchange rate of the lira vis-à-vis the Deutsche mark observed by
Bankers Trust at 20.00 GMT in New York and dmit denotes the same rate as observed by
Banca d’Italia at 13.15 GMT in Italy. Analogous notation holds for BTdmus and dmus which
record the Deutsche mark-US dollar exchange rate observed by Bankers Trust and Banca
d’Italia respectively. In the case of unscheduled news, News+ is a dummy which equals 1 if the
news is supposed to have had a negative impact on the exchange rates and 0 otherwise; News-
is a dummy which equals -1 if the news is supposed to have had a positive effect and 0
otherwise. Regarding scheduled news, News+ (News-) is a dummy which equals the difference
between the current and the previous value of the variable, the latter being an approximation,
as previously discussed, of the best forecast made by rational agents, and is nil when no data
are released; It is the information set available at time t.
The specification of the two models is best appreciated with reference to the timing of
events described in Figure 1. The endogenous variable, namely ln(dmitt/dmitt-1), spans the
segment AC; its lagged value the segment CD; the revisions of the exchange rate, namely
ln(BTdmitt-1/dmitt-1), span the segment BC, overlapping with the endogenous variable. For
this reason, exchange rate revisions are included as an additional regressor in order to clean
the information set of what occurred the afternoon of the previous day in the US market. This
permits a clearer interpretation of the relationship between news and the exchange rate over
the morning of day t, insofar as it prevents attributing to news released on day t effects which
instead originate from news released the previous afternoon and already incorporated in the
quotations of New York. Similarly, the variable ln(BTdmust-1/dmust-1) cleans the information
set from events concerning the mark-dollar exchange rate that occurred the previous
afternoon in the US market.

14
3.2 Results
3.2.1 Unscheduled news
In the estimation of the mean model and the variance model each single dummy has
been inserted, in turn, in the equation for changes in the lira-mark exchange rate and in the
equation for the conditional variance of such changes.8 The estimated coefficients are stable
across equations and similar for the two models (Table 2a; results will be commented mostly
qualitatively in the text). The constant of the mean equation is not statistically different from
zero, indicating the absence of a positive drift in the daily returns; the lagged dependent
variable is on average not significant. The lagged difference between the exchange rate
observed in New York at 20.00 GMT of the previous day and in Rome at 13.15 GMT is very
significant, with a coefficient slightly below 1; this follows naturally from the considerations
put forward in the previous section (see Figure 1). The daily change in the lira-mark exchange
rate is negatively correlated with the lagged difference between the quotation of the mark-US
dollar exchange rate observed in New York at 20.00 GMT and in Rome at 13.15 GMT; this
negative correlation is consistent with the empirical evidence of a relationship between the
strengthening of the lira against the mark and the strengthening of the dollar against the mark
(the estimate of θ2 implies an elasticity of -6.5 percent). Results support the utilization of the
Generalised Autoregressive Conditionally Heteroskedastic process of the first order for the
variance equation: the parameters of the latter the ω’s, α’s and β’s estimated for each
univariate model are all statistically significant, and the persistence of the model, measured
by the average value of (α + β), equals 0.97, thus implying a half-life for shocks of close to
22 days.9
In the mean model, the coefficient µ1 records the impact of bad news and µ2 the impact
of good news on the daily change in the lira-mark exchange rate, with a positive sign
8 In econometric practice it is customary to estimate a single-equation model in a top-down procedure. Inpractice one starts by estimating the full model and sequentially eliminates the unsignificant variables.However we are only interested in measuring that part of the variance of a financial series that can beattributed to each specific news items. This is the reason why we abandon the classical approach and follow,instead, a sequential estimation procedure. The individual variances due to individual news items will then beaggregated into an overall dummy. We thank a referee for raising this point.
9 Half-life is a concept typically encountered in the stochastic volatility literature. It is defined as minusln(2)/ln(α+β) with α and β denoting the parameters of a Garch(1,1) model and is employed to evaluate theperiod of time it takes half of a shock of size εt hitting the conditional variance at time t to be absorbed.

15
expected for the coefficients of both variables given the opposite sign used in the definition of
the variables themselves. Estimates show that all of the bad news items have the correct sign,
though only one half of them are statistically different from zero. Significant bad news
includes public finance issues, institutional conflicts, political conflicts during the first
government in our analysis, EMU issues and the debate on political corruption. Good-news
dummies with statistically significant coefficients include public finance issues, consumer
prices, political conflicts during the first government, electoral results and political events
occurring during the second government and since the beginning of 1996. Bad news about
inflation does not seem to have an impact on the exchange rate, but good news does.
Electoral results and the easing of political tensions in 1995 positively affected the daily
exchange rate return. Political events occurring in January-February 1996 and events relating
to the second government in 1995 are associated with a positive effect on the exchange rate
but not with a negative one. Bad news on EMU impacts negatively on exchange rates, but
good news does not. In analogy with the results for the mean, the variance shows a
remarkable asymmetry between the effects of bad and good news. Most good news items do
not seem to have an impact on the volatility of the daily exchange rate return, with the
exception of electoral results, easing of political tensions and news related to the second of
the three governments. For bad news, public finance, consumer prices, institutional conflicts,
political conflicts, the second government and the dismissal of the Justice Minister in the
second government are all highly significant. The estimation of the mean and the variance
models evidences that, in line with expectations, both bad and good news have an impact on
the exchange rate, but only bad news has a significant impact on volatility.
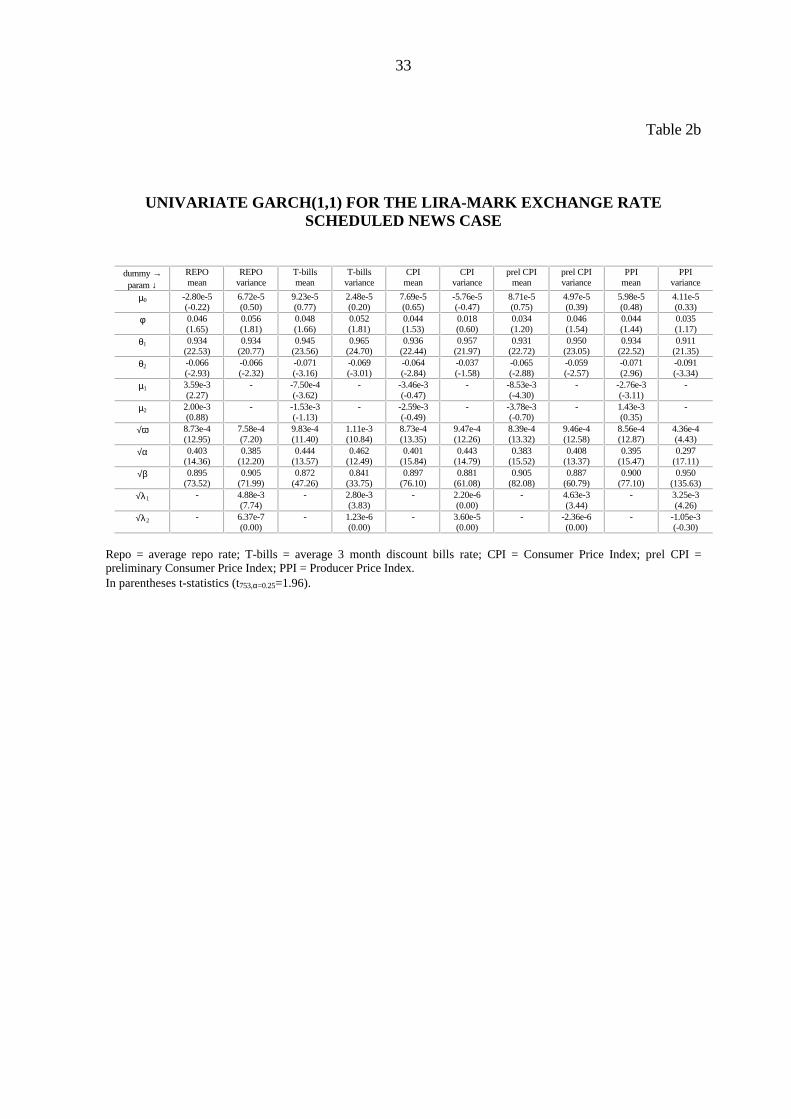
3.2.2 Scheduled news
Scheduled news resembles unscheduled news concerning the impact on the conditional
mean and the conditional variance (Table 2b; as in the case of unscheduled news, the results
are commented upon mainly qualitatively in the text). In the model for the conditional mean,
positive changes in the repo rate weaken the lira-mark exchange rate, while negative changes
do not affect it. This contrasts with the traditional Mundell-Fleming scheme, according to
which higher domestic interest rates lead to an appreciation in the exchange rate and could
support an increased-risk-premium argument for Italian financial assets (whereas higher rates
16
bring about an increase in the interest payment on public debt). This effect could instead
derive by lower than expected official interest rate moves. The latter effect, i.e. negative repo
rate changes being neutral with respect to the lira-mark exchange rate, could reveal that such
moves have been already fully discounted by the market. In the case of the average T-bills
rate, increases are found to strengthen the lira; once again, negative changes do not affect the
exchange rate. It is important to recall that seeking traditional relations among economic
variables in a high-frequency context does not per se lead to conclusive results since a relation
may be positive and significant at a daily frequency and negative or not significant on a
monthly or quarterly basis. In any case, the findings concerning the relation between interest
and exchange rates above are not new to the high frequency approach to international
finance: the positive relation between changes in the repo rate and exchange rate is generally
assumed to follow traders’ expectations, whereas the negative relation between the T-bill rate
and the exchange rate can be attributed to portfolio adjustments of long-term investors.
Neither positive nor negative changes in the final consumer price index affect, when
released, the exchange rate, possibly because final CPI data can be accurately anticipated on
the basis of the preliminary release, which occurs approximately 15 days earlier. In contrast,
preliminary CPI and PPI releases do have an impact on the exchange rate.10
In the conditional variance equation similar results are obtained. CPI releases do not
affect the volatility of the exchange rate, but when preliminary data on CPI and PPI are
released and when they signal that inflation is rising, volatility increases. Releases of
decelerating preliminary CPI and PPI data do not have any impact on the exchange rate. The
same results hold true for the repo and T-bill interest rates: positive changes increase the
volatility of the exchange rate; negative changes do not.
The comparison of the results obtained for the mean and the variance models points out
that only increases in inflation, as signalled in the release of preliminary CPI data and final PPI
data, have an impact on the change and the volatility of the lira-mark exchange rate. The same
holds true for changes in the repo and T-bill interest rates: only positive figures count;
10 This seemingly confusing result could be the econometric proof of the well-known financial marketrule buy the noise, sell the fact. This means that, in short term trading, market participants are likely to act onmarket rumours and to unwind their position as soon as the fact, to which the rumours refer, materializes.

17
negative changes have no effect. CPI releases are ineffective in both models since they are
anticipated by market participants on the basis of their preliminary values.
So far, this analysis has excluded the presence of any regime shift in the conditional and
the unconditional variance among the three different governments as well as that of any
seasonal dayweek pattern in foreign exchange and interest rates. In the traditional financial
literature, this phenomenon is reported to be highly significant, especially with respect to
stock returns, and it will be analyzed in detail in the following section.
4. Multivariate analysis
This section is devoted to the estimation of a multivariate Garch model that includes not
only the lira-mark exchange rate but also the mark-dollar exchange rate and the yield on
Italian long-term government bonds (BTP). Moving from a univariate to a multivariate model
is necessary for many reasons: first, exchange rates are determined simultaneously in the
market and this is especially true for lira exchange rates which are well-known to be driven by
movements in the mark-dollar rate. Hence, though a reduced-form approach is adopted
throughout this paper, a seemingly unrelated regression model is the appropriate tool to
accommodate non-scalar covariance matrices. Second, given the heteroskedastic nature of
financial data, one cannot guarantee that the correlation matrix remains fixed through time, a
requisite that can be appropriately tested within a multivariate Garch scheme. Last, it is only
within a multivariate framework that one can carry out causality tests or evidence the
presence of common factors in a set of individual variance series.
An initial step of the analysis is devoted to reducing the number of news variables, so as
to keep the dimension of the multivariate system within manageable limits. This is important
for two main reasons: first, an increase in the number of explanatory variables would slow the
maximization algorithm as well as affect its accuracy; second, since dummies have many zero
entries, multicollinearity could play a prominent role in the significance of the estimates, albeit
the correlation matrix of the news variables has no entry larger than 0.36 in absolute value.
The dummies found to be statistically significant in the univariate analysis of the lira-
mark exchange rate were aggregated into six variables: two summarise the effect of

18
unscheduled news, both positive and negative, on exchange rate levels; another two
summarise the effect of unscheduled news on the variance of the latter; the last two
summarise the effect of (positive) scheduled news on the level and the variance of the
exchange rate. With regard to the latter two variables, the distinction between positive and
negative news events is maintained under the hypothesis that a positive news item raises the
variance less than a negative news item of comparable importance. For this to hold, since both
dummies in the variance equations take unit values, the difference between their respective
coefficients must be significant, revealing an asymmetric reaction of the absolute price
changes, as originally proposed by Black (1976).
Following this approach, the six dummies used in the multivariate analysis are defined
on the basis of the estimates of µ and λ in the univariate framework, namely $µ and $λ . With
reference to the k-th univariate equation (with k=1,2,...,12 for DL and DV and k=1,2,..,5 for
QL and QV), the synthetic dummies are defined as:
DL Newsk kk
+ +
=
= ∑ $µ 11
12
with $µ k1=0 if not significantly different from zero in the univariate case;
DL Newsk kk
− −
=
= ∑ $µ 21
12
with $µ k2=0 if not significantly different from zero in the univariate case;
DV Newsk kk
+ +
=
= ∑ $λ 11
12
with $λ k1=0 if not significantly different from zero in the univariate case;
DV Newsk kk
− −
=
= ∑ $λ 21
12
with $λ k2=0 if not significantly different from zero in the univariate case;
QL Newsk kk
+ +
=
= ∑ $µ 11
5
with $µ k1=0 if not significantly different from zero in the univariate case;
QV Newsk kk
+ +
=
= ∑ $λ 11
5
with $λ k1=0 if not significantly different from zero in the univariate case.
The variables defined above (QL- and QV- were not evaluated since the five individual
components were identically zero) are inserted in the specification of a trivariate system
where the logarithmic change in the mark-dollar (dmus) and lira-mark (dmit) exchange rates,
and the changes in the BTP yield (btpy) are modelled as a Vector autoregression where the

19
variance of the error of each equation follows a Garch process. The synthetic dummies DL+,
DL-, DV+, DV-, QL+, QV+, already identified with respect to the lira/mark exchange rate, were
employed also as a measure of the impact of news on the BTP price and yield changes.
In a subsequent phase, so as to account for the presence of regime shifts in the level of
the unconditional variance, the multivariate Garch models were estimated again, introducing
three dummies (each of them equalling unity in the time interval spanned by one government
and zero in the time interval spanned by the remaining two) in the specification of the
intercept in the equations for the conditional variance (see equations (6) and (7) reported in
the model presentation (1)-(10) below). The same dummies were employed to evidence
changes in the coefficients of the conditional variance equations, a signal of the modifications
of the latter following the arrival of news. To identify the presence of seasonal
heteroskedasticity, the individual dummies in the univariate Garch models presented in the
last section have been replaced by the residual of a regression of each individual dummy on
the five weekday dummies; the new synthetic dummies for the conditional mean (DL+_R, DL-
_R, QL+_R), which are immune from seasonality, are, as before, obtained as aggregation of
the individual seasonally-adjusted dummies with weights provided by the associated
coefficient in the new univariate Garch model. The multivariate schemes are then estimated
again employing the seasonally-adjusted dummies in the conditional mean equations; as for
the conditional variance equations, four dayweek dummies are employed along with the
synthetic dummies DV+, DV-, QV+ evaluated before.
4.1 Multivariate Garch models
The estimation of multivariate Garch schemes becomes very difficult when the
dimension of the system is increased to five variables. Though most of the results referred to
multivariate schemes revealed an almost perfect diagonality in the C, A, B matrices defined
below, the full non-diagonal specification is employed to carry out a preliminary identification
of the model and to test the hypothesis that the conditional correlation coefficients are stable
over time, a situation which would simplify the estimation.
According to the formulation put forward by Engle and Kroner (1995), the multivariate
Garch(1,1) can be written as:

20
yt = µ + θ⋅DL+t + π⋅DL-
t + γ⋅QL+t + Πt
Πt It-1 ∼ MN(0,Ht)
Ht = C’ ⋅C + A’⋅εt-1⋅εt-1’ ⋅A + B’⋅Ht-1⋅B
where C, A and B are n⋅n matrices and C’, A’ and B’ are their transposes; Ht is the n⋅n time-
varying covariance matrix; Πt is the n⋅1 error term; θ, π and γ are n⋅1 vectors; DL+, DL- and
QL+ are the synthetic dummies of the mean equation as defined before. The synthetic
dummies DV+, DV- and QV+ are not inserted in the conditional covariance equations, since, at
this stage, the analysis aims only at identifying the structure of the model, regardless of the
effect of the temporary shocks induced by the occurrence of news on the conditional
variance. For the trivariate model where yt, the vector of independent variables, is made up of
the (log) changes in the mark/dollar and the lira/mark exchange rates as well as the BTP yield
changes, the assumption of diagonality cannot be rejected, since the off-diagonal terms of the
C, A, B matrices were not statistically different from zero. The estimated matrices are
reported below together with t-statistics (only the significant coefficients are reported; θ, π
and γ are not shown since they are not relevant at this stage of the analysis):
A =
. ( . )
. ( . )
. ( . )
205 1494 0 0
0 255 25 47 0
0 0 210 8 26
B =
. ( . )
. ( . )
. ( . )
979 38571 0 0
0 969 368 21 0
0 0 963 124 4
C = ⋅⋅
−
−
0 0 0
0 217 10 182 0
0 0 153 10 556
4
3
. ( . )
. ( . )
.
Figures 2 to 4 show the estimates of the conditional correlations, the conditional
covariances and the conditional standard deviations. The conditional covariances (Figure 3)
unambiguously vary over time, with especially large changes around September 1994 and in
the period from April to September 1995. However, the conditional correlations are rather
stable through time, since variances change significantly when covariances do, lending
21
support to the hypothesis that they vary proportionally to the conditional standard deviations
(as one can appreciate comparing Figures 3 and 4). On the basis of these results, that hold
also when the BTP yield is replaced by the BTP futures price, a trivariate diagonal Garch
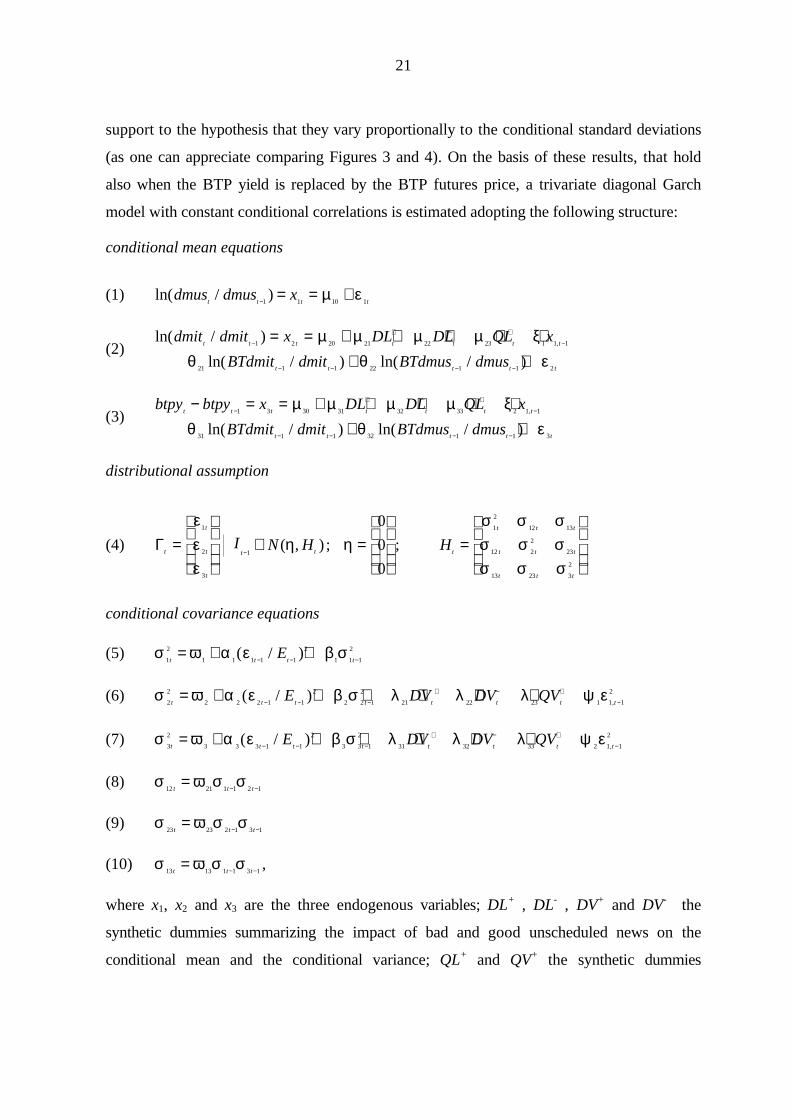
model with constant conditional correlations is estimated adopting the following structure:
conditional mean equations
(1) ln( / )dmus dmus xt t t t− = = +
1 1 10 1µ ε
(2)ln( / )
ln( / ) ln( / ),
dmit dmit x DL DL QL x
BTdmit dmit BTdmus dmust t t t t t t
t t t t t
−
+ − +
−
− − − −
= = + + + + ++ +
1 2 20 21 22 23 1 1 1
21 1 1 22 1 1 2
µ µ µ µ ξθ θ ε
(3)btpy btpy x DL DL QL x
BTdmit dmit BTdmus dmust t t t t t t
t t t t t
− = = + + + + ++ +
−
+ − +
−
− − − −
1 3 30 31 32 33 2 1 1
31 1 1 32 1 1 3
µ µ µ µ ξθ θ ε
,
ln( / ) ln( / )
distributional assumption
(4) Γt
t
t
t
t tI N H=
∼−
εεε
η1
2
3
1( , ) ; η =
0
0
0
; Ht
t t t
t t t
t t t
=
σ σ σσ σ σσ σ σ
1
2
12 13
12 2
2
23
13 23 3
2
conditional covariance equations
(5) σ ω α ε β σ1
2
1 1 1 1 1
2
1 1 1
2
t t t tE= + +− − −( / )
(6) σ ω α ε β σ λ λ λ ψ ε2
2
2 2 2 1 1
2
2 2 1
2
21 22 23 1 1 1
2
t t t t t t t tE DV DV QV= + + + + + +− − −
+ − +
−( / ),
(7) σ ω α ε β σ λ λ λ ψ ε3
2
3 3 3 1 1
2
3 3 1
2
31 32 33 2 1 1
2
t t t t t t t tE DV DV QV= + + + + + +− − −
+ − +
−( / ),
(8) σ ω σ σ12 21 1 1 2 1t t t
= − −
(9) σ ω σ σ23 23 2 1 3 1t t t
= − −
(10) σ ω σ σ13 13 1 1 3 1t t t
= − − ,
where x1, x2 and x3 are the three endogenous variables; DL+ , DL- , DV+ and DV- the
synthetic dummies summarizing the impact of bad and good unscheduled news on the
conditional mean and the conditional variance; QL+ and QV+ the synthetic dummies

22
summarizing the impact of bad scheduled news on the conditional mean and the conditional
variance;11 ε1, ε2 and ε3 three error terms conditionally jointly distributed as a multivariate
normal with mean η and conditional variance Ht, which is a 3×3 symmetric positive definite
matrix; finally E is a variable recording the number of days elapsed between subsequent
observations. Equations (8) to (10) are the conditional covariances between the logarithmic
rates of change of the mark-dollar and the lira-mark exchange rates, between the logarithmic
change in the lira/mark exchange rate and the BTP yield, and between the logarithmic change
in the mark-dollar exchange rate and the BTP yield, respectively. They are built so as to keep
the conditional correlation coefficients fixed at ω21, ω23 and ω13 respectively (Bollerslev,
1990). It is important to point out that equations (2)-(3) and (6)-(7) are structured in such a
way as to allow the conditional means and the conditional variances of the lira/mark exchange
rate and of the BTP yield (or the BTP futures price when (3) is replaced by (3’)) to be
Granger-caused by the conditional mean and variance of the mark/dollar exchange rate. This
assumption allows us to test whether the frequently reported evidence that the Italian financial
market is led — over long horizons — by developments in the US and German markets, also
holds at shorter frequencies. The parameters are estimated by the numerical maximization of
the likelihood function of the system.
The same multivariate analysis is replicated replacing the daily rates of change in the
BTP with the daily logarithmic rates of change in the price of the BTP futures traded on
LIFFE (btpf). This model permits the testing of the hypothesis that the futures market is more
efficient than the spot market in processing information. The model is analogous to the
previous model but replaces equation (3) with:
(3’)ln( / )
ln( / ) ln( / ) .,
btpf btpf x x DL DL QL x
BTdmit dmit BTdmus dmust t t t t t t t
t t t t t
− −
+ − +
−
− − − −
= = + + + + + ++ +
1 3 30 3 3 1 31 32 33 3 1 1
31 1 1 32 1 1 3
µ φ µ µ µ ξθ θ ε
In this case all the parameters regarding the first two variables (the mark/dollar and the
lira/mark exchange rates) have been kept equal to the values they had in the previous
11 In the univariate model the release of good news — i.e. the single dummies associated to thecoefficients µ- and λ- — is not significant: hence the dummies DL- and DV- are nil and eliminated from theanalysis.

23
specification (XXY; see Section 4.2) in order to avoid the misleading circumstance of having
two sets of coefficients for the same equation.
4.2 Baseline model
We report hereafter the results of the model described in the previous section (Table 3,
lines a)). One model is for the lira-mark and the mark-dollar exchange rates as well as the first
difference of the 10-year Government bond yield (BTP). The other model replaces BTP yield
with the daily rates of change in the price of its futures contract traded at LIFFE while — as
previously stated — leaving the parameters concerning the first two variables unchanged. The
two models are henceforth called mark-dollar/lira-mark/BTP-yield (XXY) and mark-
dollar/lira-mark/BTP-futures (XXF).
There is no causal relation between the conditional mean and variance of the
mark/dollar exchange rate and the conditional variance of the lira/mark rate and the BTP yield
or the BTP futures: the coefficients ξ1, ξ2, ξ3, ψ1 and ψ2 were not statistically significant, and
were not shown in Table 2 in order to save space. Given the small t-statistics, such causal
links were omitted from all subsequent modifications of the baseline model, though we
preserved the trivariate nature of the econometric scheme.
In the XXY model, all the coefficients of the conditional variances are highly
significant, lending support to the appropriateness of the Garch(1,1) scheme; in all cases the
persistence of conditional variances is rather high, 0.955 for the BTP yield, 0.953 for the BTP
futures, 0.904 for the mark/dollar and 0.990 for the lira/mark.12 As concerns the mean
equations, the lira-mark exchange rate yields coefficients that are similar to those obtained in
the univariate case, with the exception of the lagged variable ln(BTdmus/dmus) whose
coefficient is now not significantly different from zero. Unscheduled news, both positive and
12 A wide body of literature has examined the properties of the integrated Garch(1,1) model, a particularcase of the traditional Garch(1,1) scheme, in which the sum of α and β (see equation (6)), is unity. Thismodel is generally thought to be non stationary, since forecasts would tend to explode as long as the timehorizon increases. Nelson (1990) has shown that the limiting behavior of σt
2 is determined by the intercept ofthe variance equation as well as by the sign of E[ln(β+αzt
2)] where E(⋅) is the expectations operator and zt isan i.i.d. variable. In any case, the ergodicity condition differes from the stationarity condition. In any case, weare not interested in forecasts of the conditional variance; hence the issue concerning the presence of a unitroot in its generating process is ignored in this paper.

24
negative, has a significant impact on the conditional mean of the lira/mark rates of change,
while BTP yield changes are only affected by the occurrence of negative unscheduled news.
Scheduled news affects the conditional variance of the lira/mark exchange rate; unscheduled
news affects it only in the case of bad news. Positive unscheduled news affects the conditional
variance of the BTP yield changes, negative news does not; scheduled news affects the
variance of the BTP yield.
In the case of the XXF model it is important to recall that the futures are quoted in
terms of price rather than yield and thus some of the coefficients have the opposite sign when
compared to the XXY model. As concerns the futures price changes, unscheduled news
affects the conditional mean, in the case of both good and bad news; positive scheduled news
has no influence on it. The conditional variance is only affected by positive unscheduled news.
The multivariate analysis evidences a positive and sizeable relationship between the lira-
mark exchange rate and the revision of the same variable which took place in the US
(Btdmit/dmit). The same variable is also highly significant and sizeable in the case of BTP
yield changes, with a coefficient close to 1, implying that the afternoon revision of the
lira/mark exchange rate has full impact on the bond market; this link may be hard to explain
with standard economic arguments. As in the univariate analysis, there exists a negative
correlation between changes in the lira-mark exchange rate and changes in the previous
afternoon’s value of the mark-dollar exchange rate, as revealed by the coefficient θ2; this
implies that a weakening mark against the dollar in the (East Coast time) afternoon results in
a strengthening lira against the mark throughout the next day (central Europe time).
Figures 5-7 show, for each of the three assets, the overall conditional standard deviation
and the part due to the effect of the news. The contribution of news to the overall variability
is not negligible in the case of the lira/mark exchange rate, especially in the period between
March and May 1995; it is less so in the case of the BTP yield, averaging 5 percent, i.e. one
third of the overall conditional standard deviation; it becomes very low in the case of the BTP
futures price, averaging 2 percent, i.e. one fifth of the overall variability of the series, which
could support the theory of greater informational efficiency in the futures market. To
summarise, these results imply that news has a significant effect on the conditional means of
the three variables. Concerning the conditional second moments, news has a relevant impact
on the conditional second moment of the lira/mark exchange rate, a much less pronounced
25
effect in the case of the BTP yield and a marginal influence in the case of the futures price,
which could be informationally superior.
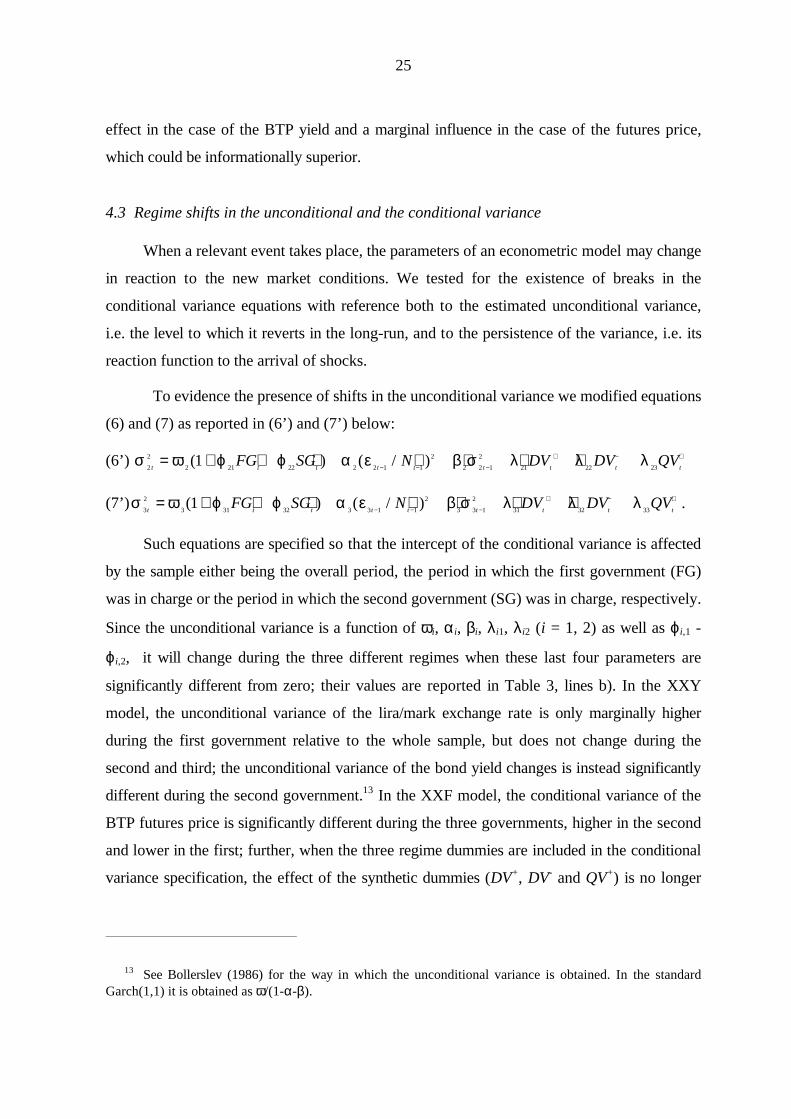
4.3 Regime shifts in the unconditional and the conditional variance
When a relevant event takes place, the parameters of an econometric model may change
in reaction to the new market conditions. We tested for the existence of breaks in the
conditional variance equations with reference both to the estimated unconditional variance,
i.e. the level to which it reverts in the long-run, and to the persistence of the variance, i.e. its
reaction function to the arrival of shocks.
To evidence the presence of shifts in the unconditional variance we modified equations
(6) and (7) as reported in (6’) and (7’) below:
(6’) σ ω ϕ ϕ α ε β σ λ λ λ2
2
2 21 22 2 2 1 1
2
2 2 1
2
21 22 231
t t t t t t t t tFG SG N DV DV QV= + + + + + + +− − −
+ − +( ) ( / )
(7’) σ ω ϕ ϕ α ε β σ λ λ λ3
2
3 31 32 3 3 1 1
2
3 3 1
2
31 32 331
t t t t t t t t tFG SG N DV DV QV= + + + + + + +− − −
+ − +( ) ( / ) .
Such equations are specified so that the intercept of the conditional variance is affected
by the sample either being the overall period, the period in which the first government (FG)
was in charge or the period in which the second government (SG) was in charge, respectively.
Since the unconditional variance is a function of ωi, αi, βi, λi1, λi2 (i = 1, 2) as well as ϕi,1 -
ϕi,2, it will change during the three different regimes when these last four parameters are
significantly different from zero; their values are reported in Table 3, lines b). In the XXY
model, the unconditional variance of the lira/mark exchange rate is only marginally higher
during the first government relative to the whole sample, but does not change during the
second and third; the unconditional variance of the bond yield changes is instead significantly
different during the second government.13 In the XXF model, the conditional variance of the
BTP futures price is significantly different during the three governments, higher in the second
and lower in the first; further, when the three regime dummies are included in the conditional
variance specification, the effect of the synthetic dummies (DV+, DV- and QV+) is no longer
13 See Bollerslev (1986) for the way in which the unconditional variance is obtained. In the standardGarch(1,1) it is obtained as ω/(1-α-β).

26
significant, a further indication of the superior informational efficiency of the derivatives
market, once one moves towards a more adequate specification of the model.
To test whether the persistence of the system is affected by the occurrence of news, the
specification of the Garch schemes has instead been changed by replacing equations (6) and
(7) with the following:
(6’’’) σ ω α ε β γ σ λ λ λ2
2
2 2 2 1 1
2
2 1 2 1
2
21 22 231
t t t t t t t tN Ind DV DV QV= + + + ⋅ + + +− − −
+ − +( / ) ( )
(7’’’) σ ω α ε β γ σ λ λ λ3
2
3 3 3 1 1
2
3 2 3 1
2
31 32 331
t t t t t t t tN Ind DV DV QV= + + + ⋅ + + +− − −
+ − +( / ) ( ) ,
where the coefficients β2 and β3 have been modified so as to allow for the presence of a shift
coinciding with the occurrence of a news release. The variable Indt is built so as to be unity at
the time of release of a news item (scheduled or unscheduled) and nil when there is no news.
The results, reported in Table 3, lines d), show that the volatility of the lira/mark exchange
rate is higher on days when both scheduled and unscheduled news occurs; in these cases the
persistence of the model increases by 0.03. The generating process of the variance of the BTP
yield and of the price of the BTP futures are again only marginally higher, by 0.01 and 0.06
respectively, when news occurs; however, the t-ratios of γ1 and γ2 are not significant.
4.4 Seasonality
In this section the multivariate Garch scheme is estimated again so as to account for the
presence of a weekday seasonality. Compared to the model reported in (1)-(10), equations
(2), (3), (6) and (7) have been replaced by the following (2’’), (3’’), (6’’) and (7’’):
(2’’)ln( / ) _ _ _
ln( / ) ln( / )
dmit dmit x DL R DL R QL R
BTdmit dmit BTdmus dmust t t t t t
t t t t t
−+ − +
− − − −
= = + + + ++ +
1 2 20 21 22 23
21 1 1 22 1 1 2
µ µ µ µθ θ ε
(3’’)btpy btpy x DL R DL R QL R
BTdmit dmit BTdmus dmust t t t t t
t t t t t
− = = + + + ++ +
−
+ − +
− − − −
1 3 30 31 32 33
31 1 1 32 1 1 3
µ µ µ µθ θ ε
_ _ _
ln( / ) ln( / )
(6’’)σ ω α ε β σ λ λ λγ γ γ γ
2
2
2 2 2 1 1
2
2 2 1
2
21 22 23
1 1 2 2 3 3 4 4
t t t t t t t
t t t t
N DV DV QV
D D D D
= + + + + + ++ + +
− − −
+ − +( / )
, , , ,
(7’’)σ ω α ε β σ λ λ λγ γ γ γ
3
2
3 3 3 1 1
2
3 3 1
2
31 32 33
5 1 6 2 7 3 8 4
t t t t t t t
t t t t
N DV DV QV
D D D D
= + + + + + ++ + +
− − −
+ − +( / )
, , , ,
27
where, as before, x1, x2 and x3 are the three endogenous variables; DL+_R, DL-_R, QL+_R the
synthetic seasonally-adjusted dummies summarizing the occurrence of bad and good news on
the conditional mean; DV+, DV- and QV+ are the same synthetic conditional variance dummies
as before; D1, D2, D3 and D4 are four dummies equal to one on Monday, Tuesday,
Wednesday and Friday, respectively, and nil elsewhere (the seasonal effect of Thursday is
obtained from the difference between the intercepts ω2 and ω3 and the four dummies). The
results of this estimation, reported in Table 3, lines c), evidence that a higher-than-average
volatility is observed on Monday with respect to the lira/mark exchange rate, and on
Wednesday and Friday with respect to the BTP yield; BTP futures are not subject to a
statistically significant weekday seasonal pattern. Even though significant, the seasonal
coefficients are so small that they do not represent an important component of the conditional
variances. Despite this, it is interesting to note that the introduction of seasonal dummies
eliminates the impact of news on the conditional mean of the BTP yield and reduces the
impact exercised by the afternoon movements of the exchange rates; however, it adds
something to the coefficients of the synthetic variables in the conditional variance equation.
These results may signal that part of the impact of news on the conditional mean and variance
of the BTP yield changes can be attributed to a fixed seasonal effect (however being
impossible to discriminate between seasonality and the presence of a given news item
occurring systematically in a specific day of the week), hence lowering the component of
volatility specifically related to news.
4.5 Reaction of the conditional variance to adverse events
The multivariate Garch model can be used to assess the short term reaction of the
conditional covariance matrix of the exchange and long-term interest rates to the occurrence
of shocks — news or large destabilizing events in general. To this end we adopt an impulse
response framework referred not to the level of the three variables but to their conditional
second moments.
In the case of unscheduled news, the system estimated before (the baseline model) and
specified in equations (1)-(10) is perturbed by two simultaneous negative shocks equal to five

28
times the maximum of the historical standard deviations of the synthetic dummies DL- and
DV- respectively — hence a rare event corresponding to the diffusion of very bad news.14
The effects of the shocks are assessed by evaluating equations (1)-(10) recursively, keeping
the parameters fixed at their full-sample values — and examining the path of conditional
variances and covariances for fifty out-of-sample daily simulations. In order to measure the
impact of a shock coming from scheduled news, since the variable QV- was identically nil over
the sample, the QV+ variable was employed in its place (hence assuming no leverage effect);
obviously, since QL- was nil, there is no shock on the conditional mean of the exchange and
long term interest rates in this case.
Figure 8 shows the effects of the shock on the conditional standard deviation of the
lira/mark exchange rate and the BTP yield, as well as on the covariance between these two
variables. The standard deviation of the exchange rate increases from 4.2 to 5.4 percent on
the day in which the extreme news is recorded, a jump of nearly 20 percent, reasonably small
compared to the dimension of the shock. After the initial impact, volatility starts to decline
gradually, reaching the new equilibrium level in about one month; convergence to the new
equilibrium of the BTP yield variance and of the covariance between the latter and the
exchange rate is faster. The conclusions are basically unchanged for the impulse response
functions in the case of scheduled news, as reported in Figure 9.15
14 The size chosen for the shock, five times the maximum historical standard deviation of the overalldummies, may seem a very rare occurrence. However, a wide body of literature has unambiguously shown thatthe distribution of financial price log-changes is leptokurtic (Bollerslev, Engle and Nelson, 1994), so thattraditional inference is not adequate. In other words, the traditional (µ-3σ,µ+3σ) interval around the mean ofa series does not contain, as usually happens, 99 percent of observations.
15 Since this paper focuses mainly on the relation between news and the conditional variance of financialprice changes, there is no attempt to quantify the impact of news on the conditional mean of such pricechanges. This strategy, as a referee has observed, may lead the reader towards the conclusion that there is nosignificant impact of news on the first moment of financial prices. The papers which deal with identifyingsuch effect have employed, at least very recently, intradaily data and have evidenced that the impact of newsvanishes within one hour (see also the Introduction to this paper); also for this circumstance we focused on thesecond rather than the first order conditional moments. The interested reader can nonetheless recover theelasticity between news and price changes from the coefficients reported in Table 3. To provide a benchmark,when the five-standard-deviation shock hits the system (1)-(10), the difference between the simulated and theobserved level of the lira/mark exchange rate is close to 1 percent (more or less 10 lire given the actual fixedparity in the euro).

29
5. Conclusions
This paper provides a quantitative assessment of the impact of the diffusion of news on
the daily volatility of the lira exchange rate and long-term interest rates. The analysis spans a
period — March 1994 to November 1996 — that was particularly turbulent in Italy for both
political and economic reasons.
In this econometric analysis news is divided into two categories: scheduled
(macroeconomic data released on dates and times known by market participants) and
unscheduled (declarations by government officials and political leaders providing relevant new
information about the economic and political outlook). Each unscheduled news item is
transformed into a dummy variable taking the value plus (minus) one on the day of release
according to whether it can be expected to affect negatively (positively) the economic
outlook.
The first part of the econometric analysis is devoted to the identification of the
scheduled and unscheduled news items that had a significant impact on the exchange rate (T-
bill auctions, repo operations, preliminary information on CPI and PPI, final CPI figures and a
number of other unscheduled news items were found to be significant) via a simple Garch
model of the exchange rate of the lira vis-à-vis the Deutsche mark. In these models scheduled
and unscheduled news were added either to the equation for changes in the exchange rate or
to the equation for its time-varying second moment.
In the second part of the analysis, a trivariate Garch model is estimated for the lira/mark
and mark/dollar exchange rates and, alternatively, for the long-term interest rates or the price
of the futures contract on the corresponding benchmark government bond; this scheme is the
main tool by which the impact of news is measured. An impulse response analysis of the
conditional variance of the three dependent variables (exchange rates and BTP yield) to a
very large shock (5 times the standard deviation of the dummies) to the arrival of news is also
carried out on the basis of the estimates of the Garch model. The estimated models and the
results of the impulse response analysis concord that news has a significant impact on the
fluctuations in the lira exchange rate and long-term interest rates; seasonality and regime
shifts are also evidenced in the time series of the conditional variance, effects which, once
accounted for, decrease the overall effect of news. Contrary to widely-held views, the impact

30
of news on the conditional second moments was quite small in size albeit statistically different
from zero. This suggests that market participants react to the diffusion of news, generally
regarding it as informative of permanent changes in fundamental variables rather than as
erratic episodes of instability that permanently add to the uncertainty in price formation of
lira-denominated assets.
31
Table 1
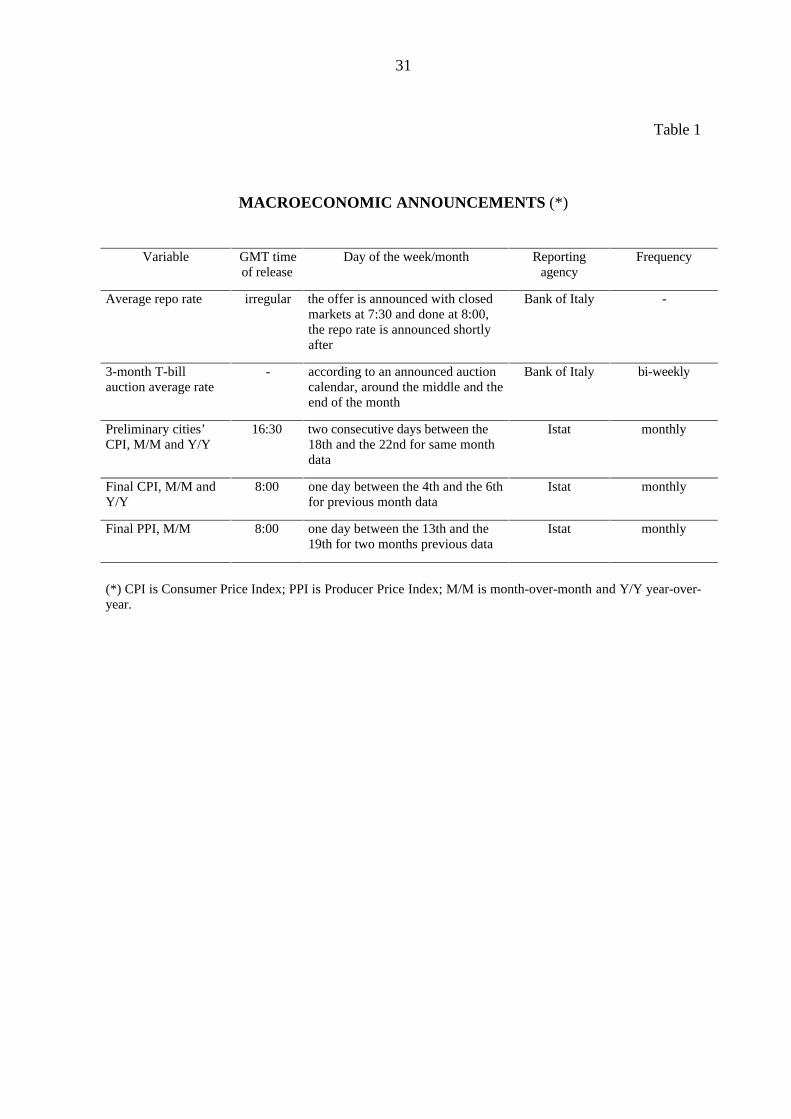
MACROECONOMIC ANNOUNCEMENTS (*)
Variable GMT timeof release
Day of the week/month Reportingagency
Frequency
Average repo rate irregular the offer is announced with closedmarkets at 7:30 and done at 8:00,the repo rate is announced shortlyafter
Bank of Italy -
3-month T-billauction average rate
- according to an announced auctioncalendar, around the middle and theend of the month
Bank of Italy bi-weekly
Preliminary cities’CPI, M/M and Y/Y
16:30 two consecutive days between the18th and the 22nd for same monthdata
Istat monthly
Final CPI, M/M andY/Y
8:00 one day between the 4th and the 6thfor previous month data
Istat monthly
Final PPI, M/M 8:00 one day between the 13th and the19th for two months previous data
Istat monthly
(*) CPI is Consumer Price Index; PPI is Producer Price Index; M/M is month-over-month and Y/Y year-over-year.

32
Table 2a
UNIVARIATE GARCH(1,1) FOR THE LIRA-MARK EXCHANGE RATEUNSCHEDULED NEWS CASE
dummy →param ↓
PFmean
PFvariance
CPmean
CPvariance
ICmean
ICvariance
PCmean
PCvariance
ERmean
ERvariance
PEmean
PEvariance
µ0 -1.61e-5(-0.12)
4.49e-5(0.35)
1.13e-4(1.00)
6.76e-5(0.55)
3.80e-6(0.03)
3.56e-5(0.30)
1.49e-5(0.12)
-4.42e-6(-0.03)
5.08e-5(0.42)
7.46e-6(0.06)
5.77e-5(0.49)
5.68e-5(0.48)
φ 0.059(2.35)
0.048(1.53)
0.048(1.82)
0.046(1.54)
0.040(1.38)
0.044(1.51)
0.031(1.18)
0.047(1.78)
0.032(1.17)
0.037(1.27)
0.043(1.46)
0.046(1.52)
θ1 0.900(22.06)
0.933(21.00)
0.914(22.57)
0.937(22.98)
0.926(21.90)
0.934(22.34)
0.900(22.13)
0.914(21.52)
0.926(22.32)
0.917(22.89)
0.931(22.62)
0.936(22.87)
θ2 -0.113(-4.81)
-0.067(-2.54)
-0.099(-4.35)
-0.066(-2.92)
-0.075(-3.29)
-0.068(-2.99)
-0.070(-2.95)
-0.075(-2.83)
-0.072(-3.23)
-0.085(-3.10)
-0.067(-3.03)
-0.066(-2.99)
µ1 8.27e-4(2.59)
- -2.04e-4(-0.27)
- 1.69e-3(3.03)
- 1.75e-3(4.58)
- 5.92e-4(0.40)
- 9.33e-4(0.28)
-
µ2 7.62-4(2.06)
- 1.51e-3(3.00)
- 1.98e-3(0.52)
- 3.08e-3(4.40)
- 1.83e-3(3.88)
- 2.61e-3(2.27)
-
√ω 7.05e-4(14.76)
6.01e-4(5.36)
6.65e-4(14.64)
8.59e-4(12.19)
8.69e-4(12.99)
7.92e-4(13.07)
6.46e-4(9.03)
5.84e-4(6.46)
7.58e-4(12.64)
7.94e-4(9.16)
8.56e-4(13.49)
8.83e-4(13.55)
√α 0.348(18.67)
0.382(15.26)
0.355(18.21)
0.390(14.20)
0.397(15.07)
0.381(14.95)
0.338(16.45)
0.356(17.15)
0.367(16.81)
0.362(15.14)
0.396(15.96)
0.398(15.74)
√β 0.924(123.83)
0.918(86.29)
0.925(123.53)
0.898(73.64)
0.898(73.44)
0.909(85.02)
0.931(107.79)
0.927(102.69)
0.915(100.15)
0.908(73.77)
0.900(78.19)
0.895(73.73)
√λ1 - -1.32e-3(-6.22)
- 1.41e-3(2.85)
- -1.10e-3(-2.29)
- -1.33e-3(-6.15)
- 2.76e-6(0.00)
- -2.28e-3(-0.76)
√λ2 - -1.15e-6(0.00)
- -5.76e-4(-1.07)
- 3.00e-6(0.00
- 6.25e-7(0.00)
- -2.82e-3(-5.88)
- 1.76e-3(1.99)
dummy→param ↓
GD1mean
GD1variance
S1mean
S1*variance
QUMmean
QUMvariance
CGmean
CGvariance
DU17mean
DU17variance
MAmean
MAvariance
µ0 7.76e-5(0.64)
3.45e-5(0.30)
8.27e-5(0.66)
4.65e-5(0.36)
-7.09e-5(-0.78)
6.68e-5(0.51)
-3.42e-5(-0.28)
5.34e-5(0.44)
3.95e-5(0.33)
2.23e-5(0.18)
4.47e-5(0.38)
5.07e-5(0.43)
φ 0.038(1.30)
0.032(1.11)
0.036(1.29)
0.049(1.56)
0.015(1.30)
0.061(1.92)
0.032(1.12)
0.044(1.51)
0.037(1.28)
0.042(1.47)
0.047(1.61)
0.046(1.56)
θ1 0.918(20.93)
0.927(20.32)
0.919(22.67)
0.943(21.72)
0.918(22.78)
0.965(21.89)
0.920(22.81)
0.936(22.68)
0.916(22.18)
0.923(22.77)
0.938(22.97)
0.933(22.43)
θ2 -0.066(-2.98)
-0.075(-3.14)
-0.083(-3.74)
-0.073(-3.06)
-0.118(-4.85)
-0.094(-3.71)
-0.074(-3.39)
-0.066(-2.91)
-0.075(-3.12)
-0.078(-3.24)
-0.072(-3.22)
-0.072(-3.26)
µ1 6.68e-4(1.31)
- 8.81e-4(1.67)
- 1.75e-3(2.70)
- 2.26e-3(3.63)
- 2.34e-2(10.86)
- 2.72e-3(1.80)
-
µ2 3.13e-3(4.32)
- 2.03e-3(3.29)
- -2.97-4(-0.43)
- 1.99e-2(0.00)
- - - 4.80e-3(3.86)
-
√ω 8.25e-4(14.03)
1.04e-3(14.11)
8.56e-4(13.30)
9.44e-4(12.29)
1.29e-4(14.16)
1.01e-3(12.09)
8.70e-4(13.72)
8.76e-4(13.36)
9.28e-4(12.26)
1.04e-3(14.05)
9.39e-4(13.40)
9.28e-4(13.82)
√α 0.385(13.37)
0.325(8.40)
0.400(15.85)
0.440(14.63)
0.325(20.95)
0.466(14.47)
0.415(15.46)
0.399(15.39)
0.390(15.11)
0.399(15.72)
0.429(15.65)
0.408(15.51)
√β 0.906(78.83)
0.882(54.97)
0.897(76.42)
0.885(62.17)
0.954(223.42)
0.874(55.21)
0.892(71.67)
0.898(74.85)
0.893(69.90)
0.876(70.31)
0.881(64.12)
0.886(66.96)
√λ1 - -4.42e-3(-6.80)
- -1.11e-4(-0.02)
- -2.77e-6(-0.02)
- -3.60e-6(0.00)
- -1.58e-2(-5.52)
- 2.51e-3(3.00)
√λ2 - 3.43e-3(5.12)
- -2.91e-6(0.00)
- 3.74e-6(0.00)
- -4.50e-2(0.00)
- - - -3.88e-3(-1.77)
PF = Public Finance, CP = Consumer Prices, IC = Institutional Conflicts, PC = Political Conflicts, ER = Electoral results,PE = Easing of political tensions; GD1 = Mr. Dini government, S1 = Political opposition easing, QUM = EMU issues,QUMIN = EMU and international environment, CG = Bribesville’s debate, DU17 = Black Friday, 17 March 1995, MA =Justice Minister Mancuso removal.In parantheses t-statistics (t654,α=0.25=1.96).* Only from December 21, 1995 onwards.
33
Table 2b
UNIVARIATE GARCH(1,1) FOR THE LIRA-MARK EXCHANGE RATESCHEDULED NEWS CASE
dummy →param ↓
REPOmean
REPOvariance
T-billsmean
T-billsvariance
CPImean
CPIvariance
prel CPImean
prel CPIvariance
PPImean
PPIvariance
µ0 -2.80e-5(-0.22)
6.72e-5(0.50)
9.23e-5(0.77)
2.48e-5(0.20)
7.69e-5(0.65)
-5.76e-5(-0.47)
8.71e-5(0.75)
4.97e-5(0.39)
5.98e-5(0.48)
4.11e-5(0.33)
φ 0.046(1.65)
0.056(1.81)
0.048(1.66)
0.052(1.81)
0.044(1.53)
0.018(0.60)
0.034(1.20)
0.046(1.54)
0.044(1.44)
0.035(1.17)
θ1 0.934(22.53)
0.934(20.77)
0.945(23.56)
0.965(24.70)
0.936(22.44)
0.957(21.97)
0.931(22.72)
0.950(23.05)
0.934(22.52)
0.911(21.35)
θ2 -0.066(-2.93)
-0.066(-2.32)
-0.071(-3.16)
-0.069(-3.01)
-0.064(-2.84)
-0.037(-1.58)
-0.065(-2.88)
-0.059(-2.57)
-0.071(2.96)
-0.091(-3.34)
µ1 3.59e-3(2.27)
- -7.50e-4(-3.62)
- -3.46e-3(-0.47)
- -8.53e-3(-4.30)
- -2.76e-3(-3.11)
-
µ2 2.00e-3(0.88)
- -1.53e-3(-1.13)
- -2.59e-3(-0.49)
- -3.78e-3(-0.70)
- 1.43e-3(0.35)
-
√ω 8.73e-4(12.95)
7.58e-4(7.20)
9.83e-4(11.40)
1.11e-3(10.84)
8.73e-4(13.35)
9.47e-4(12.26)
8.39e-4(13.32)
9.46e-4(12.58)
8.56e-4(12.87)
4.36e-4(4.43)
√α 0.403(14.36)
0.385(12.20)
0.444(13.57)
0.462(12.49)
0.401(15.84)
0.443(14.79)
0.383(15.52)
0.408(13.37)
0.395(15.47)
0.297(17.11)
√β 0.895(73.52)
0.905(71.99)
0.872(47.26)
0.841(33.75)
0.897(76.10)
0.881(61.08)
0.905(82.08)
0.887(60.79)
0.900(77.10)
0.950(135.63)
√λ1 - 4.88e-3(7.74)
- 2.80e-3(3.83)
- 2.20e-6(0.00)
- 4.63e-3(3.44)
- 3.25e-3(4.26)
√λ2 - 6.37e-7(0.00)
- 1.23e-6(0.00)
- 3.60e-5(0.00)
- -2.36e-6(0.00)
- -1.05e-3(-0.30)
Repo = average repo rate; T-bills = average 3 month discount bills rate; CPI = Consumer Price Index; prel CPI =preliminary Consumer Price Index; PPI = Producer Price Index.In parentheses t-statistics (t753,α=0.25=1.96).
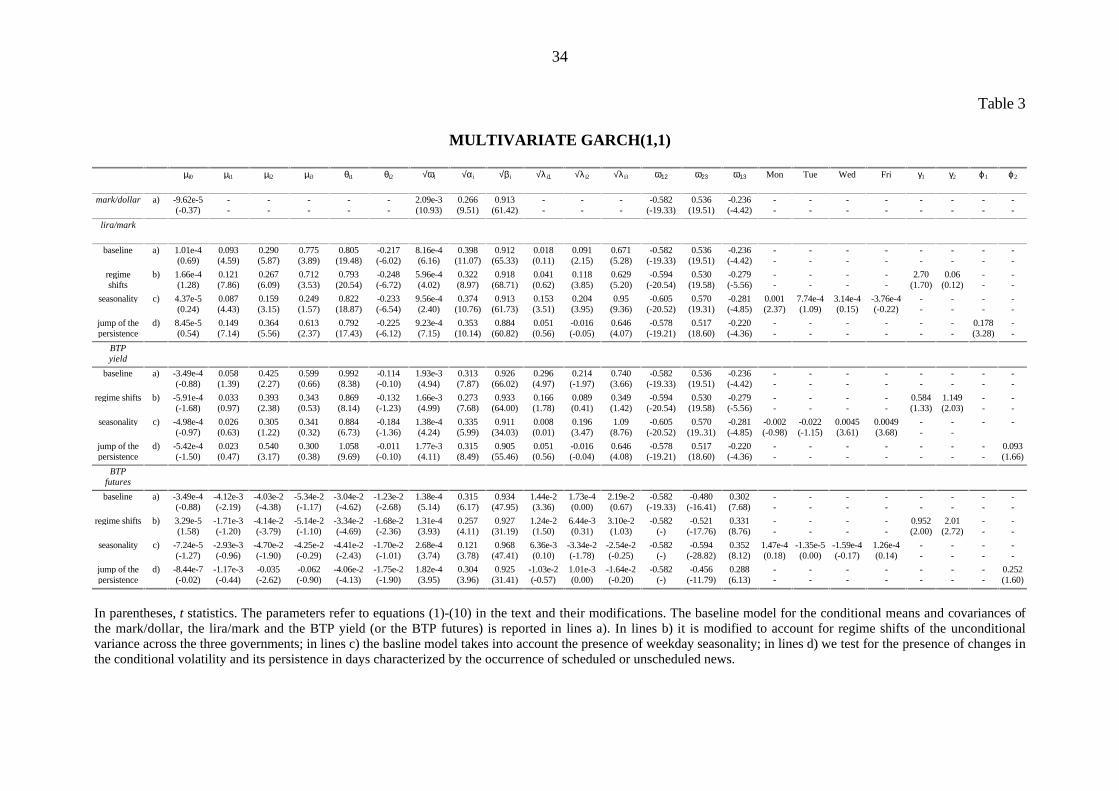
34
Table 3
MULTIVARIATE GARCH(1,1)
µi0 µi1 µi2 µi3 θi1 θi2 √ωi √αi √βi √λi1 √λi2 √λi3 ω12 ω23 ω13 Mon Tue Wed Fri γ1 γ2 ϕ1 ϕ2
mark/dollar a) -9.62e-5(-0.37)
--
--
--
--
--
2.09e-3(10.93)
0.266(9.51)
0.913(61.42)
--
--
--
-0.582(-19.33)
0.536(19.51)
-0.236(-4.42)
--
--
--
--
--
--
--
--
lira/mark
baseline a) 1.01e-4(0.69)
0.093(4.59)
0.290(5.87)
0.775(3.89)
0.805(19.48)
-0.217(-6.02)
8.16e-4(6.16)
0.398(11.07)
0.912(65.33)
0.018(0.11)
0.091(2.15)
0.671(5.28)
-0.582(-19.33)
0.536(19.51)
-0.236(-4.42)
--
--
--
--
--
--
--
--
regimeshifts
b) 1.66e-4(1.28)
0.121(7.86)
0.267(6.09)
0.712(3.53)
0.793(20.54)
-0.248(-6.72)
5.96e-4(4.02)
0.322(8.97)
0.918(68.71)
0.041(0.62)
0.118(3.85)
0.629(5.20)
-0.594(-20.54)
0.530(19.58)
-0.279(-5.56)
--
--
--
--
2.70(1.70)
0.06(0.12)
--
--
seasonality c) 4.37e-5(0.24)
0.087(4.43)
0.159(3.15)
0.249(1.57)
0.822(18.87)
-0.233(-6.54)
9.56e-4(2.40)
0.374(10.76)
0.913(61.73)
0.153(3.51)
0.204(3.95)
0.95(9.36)
-0.605(-20.52)
0.570(19.31)
-0.281(-4.85)
0.001(2.37)
7.74e-4(1.09)
3.14e-4(0.15)
-3.76e-4(-0.22)
--
--
--
--
jump of thepersistence
d) 8.45e-5(0.54)
0.149(7.14)
0.364(5.56)
0.613(2.37)
0.792(17.43)
-0.225(-6.12)
9.23e-4(7.15)
0.353(10.14)
0.884(60.82)
0.051(0.56)
-0.016(-0.05)
0.646(4.07)
-0.578(-19.21)
0.517(18.60)
-0.220(-4.36)
--
--
--
--
--
--
0.178(3.28)
--
BTPyield
baseline a) -3.49e-4(-0.88)
0.058(1.39)
0.425(2.27)
0.599(0.66)
0.992(8.38)
-0.114(-0.10)
1.93e-3(4.94)
0.313(7.87)
0.926(66.02)
0.296(4.97)
0.214(-1.97)
0.740(3.66)
-0.582(-19.33)
0.536(19.51)
-0.236(-4.42)
--
--
--
--
--
--
--
--
regime shifts b) -5.91e-4(-1.68)
0.033(0.97)
0.393(2.38)
0.343(0.53)
0.869(8.14)
-0.132(-1.23)
1.66e-3(4.99)
0.273(7.68)
0.933(64.00)
0.166(1.78)
0.089(0.41)
0.349(1.42)
-0.594(-20.54)
0.530(19.58)
-0.279(-5.56)
--
--
--
--
0.584(1.33)
1.149(2.03)
--
--
seasonality c) -4.98e-4(-0.97)
0.026(0.63)
0.305(1.22)
0.341(0.32)
0.884(6.73)
-0.184(-1.36)
1.38e-4(4.24)
0.335(5.99)
0.911(34.03)
0.008(0.01)
0.196(3.47)
1.09(8.76)
-0.605(-20.52)
0.570(19..31)
-0.281(-4.85)
-0.002(-0.98)
-0.022(-1.15)
0.0045(3.61)
0.0049(3.68)
--
--
- -
jump of thepersistence
d) -5.42e-4(-1.50)
0.023(0.47)
0.540(3.17)
0.300(0.38)
1.058(9.69)
-0.011(-0.10)
1.77e-3(4.11)
0.315(8.49)
0.905(55.46)
0.051(0.56)
-0.016(-0.04)
0.646(4.08)
-0.578(-19.21)
0.517(18.60)
-0.220(-4.36)
--
--
--
--
--
--
--
0.093(1.66)
BTPfutures
baseline a) -3.49e-4(-0.88)
-4.12e-3(-2.19)
-4.03e-2(-4.38)
-5.34e-2(-1.17)
-3.04e-2(-4.62)
-1.23e-2(-2.68)
1.38e-4(5.14)
0.315(6.17)
0.934(47.95)
1.44e-2(3.36)
1.73e-4(0.00)
2.19e-2(0.67)
-0.582(-19.33)
-0.480(-16.41)
0.302(7.68)
--
--
--
--
--
--
--
--
regime shifts b) 3.29e-5(1.58)
-1.71e-3(-1.20)
-4.14e-2(-3.79)
-5.14e-2(-1.10)
-3.34e-2(-4.69)
-1.68e-2(-2.36)
1.31e-4(3.93)
0.257(4.11)
0.927(31.19)
1.24e-2(1.50)
6.44e-3(0.31)
3.10e-2(1.03)
-0.582(-)
-0.521(-17.76)
0.331(8.76)
--
--
--
--
0.952(2.00)
2.01(2.72)
--
--
seasonality c) -7.24e-5(-1.27)
-2.93e-3(-0.96)
-4.70e-2(-1.90)
-4.25e-2(-0.29)
-4.41e-2(-2.43)
-1.70e-2(-1.01)
2.68e-4(3.74)
0.121(3.78)
0.968(47.41)
6.36e-3(0.10)
-3.34e-2(-1.78)
-2.54e-2(-0.25)
-0.582(-)
-0.594(-28.82)
0.352(8.12)
1.47e-4(0.18)
-1.35e-5(0.00)
-1.59e-4(-0.17)
1.26e-4(0.14)
--
--
--
--
jump of thepersistence
d) -8.44e-7(-0.02)
-1.17e-3(-0.44)
-0.035(-2.62)
-0.062(-0.90)
-4.06e-2(-4.13)
-1.75e-2(-1.90)
1.82e-4(3.95)
0.304(3.96)
0.925(31.41)
-1.03e-2(-0.57)
1.01e-3(0.00)
-1.64e-2(-0.20)
-0.582(-)
-0.456(-11.79)
0.288(6.13)
--
--
--
--
--
--
--
0.252(1.60)
In parentheses, t statistics. The parameters refer to equations (1)-(10) in the text and their modifications. The baseline model for the conditional means and covariances ofthe mark/dollar, the lira/mark and the BTP yield (or the BTP futures) is reported in lines a). In lines b) it is modified to account for regime shifts of the unconditionalvariance across the three governments; in lines c) the basline model takes into account the presence of weekday seasonality; in lines d) we test for the presence of changes inthe conditional volatility and its persistence in days characterized by the occurrence of scheduled or unscheduled news.
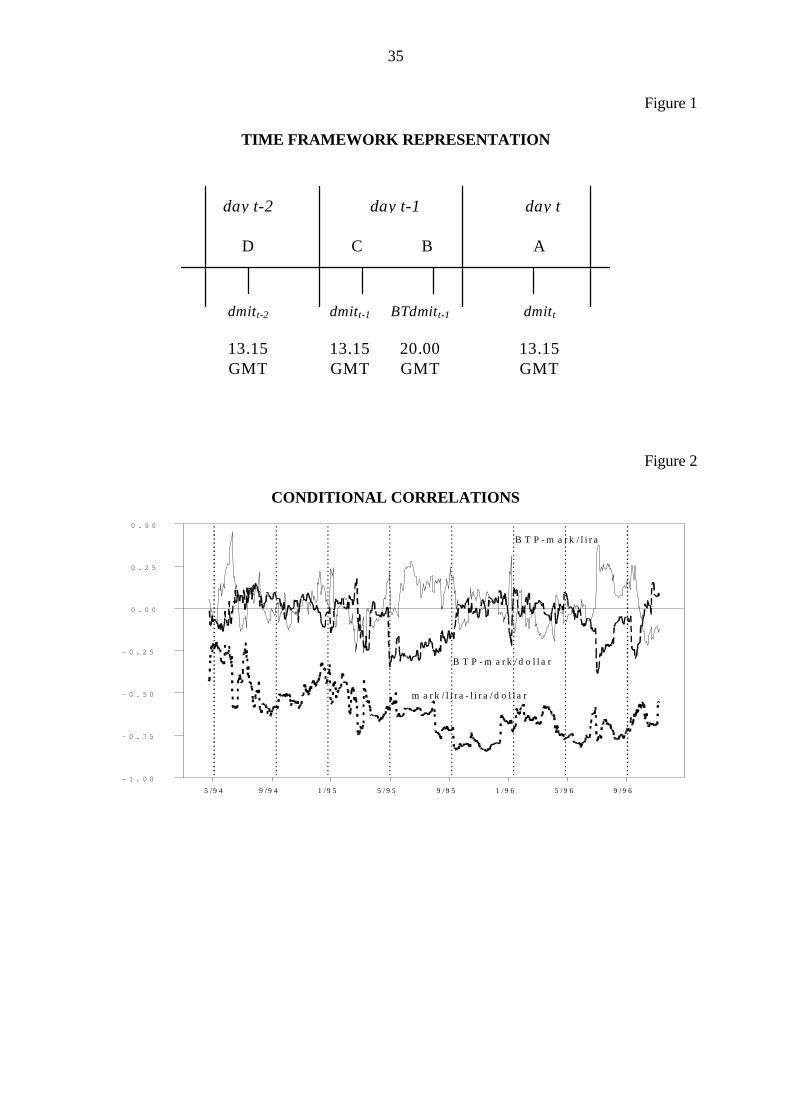
35
Figure 1
TIME FRAMEWORK REPRESENTATION
day t-2 day t-1 day t
D C B A
dmitt-2 dmitt-1 BTdmitt-1 dmitt
13.15GMT
13.15GMT
20.00GMT
13.15GMT
Figure 2
CONDITIONAL CORRELATIONS
5 / 9 4 9 / 9 4 1 / 9 5 5 / 9 5 9 / 9 5 1 / 9 6 5 / 9 6 9 / 9 6
- 1 . 0 0
- 0 . 7 5
- 0 . 5 0
- 0 . 2 5
0 . 0 0
0 . 2 5
0 . 5 0
B T P - m a r k / l i r a
B T P - m a r k / d o l l a r
m a r k / l i r a - l i r a / d o l l a r

36
Figure 3
CONDITIONAL COVARIANCES
- 0 . 0 0 0 1 4
- 0 . 0 0 0 1 2
- 0 . 0 0 0 1 0
- 0 . 0 0 0 0 8
- 0 . 0 0 0 0 6
- 0 . 0 0 0 0 4
- 0 . 0 0 0 0 2
0 . 0 0 0 0 0
0 . 0 0 0 0 2
0 . 0 0 0 0 4
5 /9 4 9 /9 4 1 /9 5 5 /9 5 9 /9 5 1 /9 6 5 /9 6 9 /9 6
m a r k / l i r a - B T P
m a r k / d o l la r -B T Pm a r k / l i r a - m a rk /d o l la r
Figure 4
CONDITIONAL STANDARD DEVIATIONS(percent value on a yearly basis)
0
5
1 0
1 5
2 0
2 5
3 0
3 5
B T P
l i r a /m a r k
m a r k /d o l l a r
5 /9 4 9 /9 4 1 /9 5 5 /9 5 9 /9 5 1 /9 6 5 /9 6 9 /9 6

37
Figure 5
CONDITIONAL STANDARD DEVIATION OF LIRA/MARK EXCHANGE RATE(overall and component due to scheduled and unscheduled news; percent values)
0 . 0
2 . 5
5 . 0
7 . 5
1 0 . 0
1 2 . 5
1 5 . 0
1 7 . 5
2 0 . 0
2 2 . 5
o v e r a l l
4 / 9 4 1 0 / 9 4 7 / 9 5 4 / 9 6
Figure 6CONDITIONAL STANDARD DEVIATION OF THE BTP YIELD
(overall and component due to scheduled and unscheduled news; percent values)
0
5
1 0
1 5
2 0
2 5
3 0
o v e r a l l
4 / 9 4 1 0 / 9 6 7 / 9 5 4 / 9 6
Figure 7CONDITIONAL STANDARD DEVIATION OF THE BTP FUTURES
(overall and component due to scheduled and unscheduled news; percent values)
0
2
4
6
8
1 0
1 2
1 4
1 6
1 8
1 0 / 9 44 / 9 4 7 / 9 5 4 / 9 6
o v e r a l l

38
Figure 8IMPULSE ANALYSIS OF THE MULTIVARIATE GARCH MODEL:
UNSCHEDULED NEWS
L ira-M ark exchange rate standard dev iation
3 . 5
4 . 0
4 . 5
5 . 0
5 . 5
6 . 0
6 . 5
B TP y ie ld standard dev iation
1 0
1 1
1 2
1 3
1 4
1 5
1 6
L ira-M ark exchange rate and B TP y ie ld covariance
4 . 4 04 . 8 0
5 . 2 0
5 . 6 06 . 0 06 . 4 0
6 . 8 0
7 . 2 0
B TP fu tures standard dev iation
6 . 57 . 07 . 58 . 08 . 59 . 09 . 5
1 0 . 01 0 . 51 1 . 0
L ira-M ark exchange rate and B TP fu tures covariance
- 4 . 8 6- 4 . 6 8
- 4 . 5 0- 4 . 3 2
- 4 . 1 4- 3 . 9 6
- 3 . 7 8
- 3 . 6 0
0 15 30 50 periods
Figure 9IMPULSE ANALYSIS OF THE MULTIVARIATE GARCH MODEL:
SCHEDULED NEWSL ira -M ark exchange ra te s tandard dev ia t ion
3 . 5
4 . 0
4 . 5
5 . 0
5 . 5
6 . 0
6 . 5
B T P y ie ld s tandard dev ia t ion
1 0
1 1
1 2
1 3
1 4
1 5
1 6
L ira -M ark exchange ra te and B T P y ie ld covar iance
4 . 4 04 . 8 05 . 2 05 . 6 06 . 0 0
6 . 4 06 . 8 07 . 2 0
B T P fu tu res s tandard dev ia t ion
6 . 57 . 07 . 58 . 08 . 59 . 09 . 5
1 0 . 01 0 . 51 1 . 0
L ira -M ark exchange ra te and B T P fu tu res covar iance
- 5 . 0
- 4 . 8- 4 . 6
- 4 . 4- 4 . 2- 4 . 0- 3 . 8
- 3 . 6
0 15 30 50 periods
Bold lines are observed values, dotted lines are simulated values.
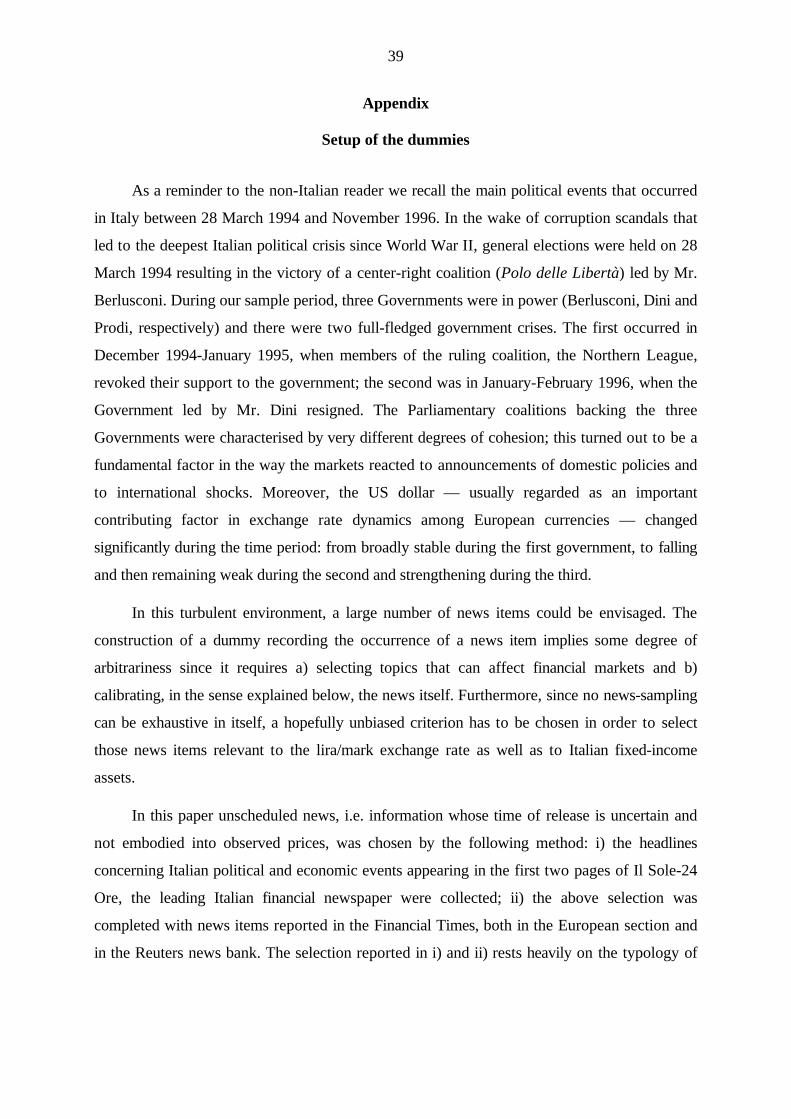
39
Appendix
Setup of the dummies
As a reminder to the non-Italian reader we recall the main political events that occurred
in Italy between 28 March 1994 and November 1996. In the wake of corruption scandals that
led to the deepest Italian political crisis since World War II, general elections were held on 28
March 1994 resulting in the victory of a center-right coalition (Polo delle Libertà) led by Mr.
Berlusconi. During our sample period, three Governments were in power (Berlusconi, Dini and
Prodi, respectively) and there were two full-fledged government crises. The first occurred in
December 1994-January 1995, when members of the ruling coalition, the Northern League,
revoked their support to the government; the second was in January-February 1996, when the
Government led by Mr. Dini resigned. The Parliamentary coalitions backing the three
Governments were characterised by very different degrees of cohesion; this turned out to be a
fundamental factor in the way the markets reacted to announcements of domestic policies and
to international shocks. Moreover, the US dollar — usually regarded as an important
contributing factor in exchange rate dynamics among European currencies — changed
significantly during the time period: from broadly stable during the first government, to falling
and then remaining weak during the second and strengthening during the third.
In this turbulent environment, a large number of news items could be envisaged. The
construction of a dummy recording the occurrence of a news item implies some degree of
arbitrariness since it requires a) selecting topics that can affect financial markets and b)
calibrating, in the sense explained below, the news itself. Furthermore, since no news-sampling
can be exhaustive in itself, a hopefully unbiased criterion has to be chosen in order to select
those news items relevant to the lira/mark exchange rate as well as to Italian fixed-income
assets.
In this paper unscheduled news, i.e. information whose time of release is uncertain and
not embodied into observed prices, was chosen by the following method: i) the headlines
concerning Italian political and economic events appearing in the first two pages of Il Sole-24
Ore, the leading Italian financial newspaper were collected; ii) the above selection was
completed with news items reported in the Financial Times, both in the European section and
in the Reuters news bank. The selection reported in i) and ii) rests heavily on the typology of

40
news used in the literature (see footnote 2) and in the financial press, as well as on
conversations held with asset managers and traders.
Each news items was then scaled according to the following approach: if it was expected
to weaken the exchange rate we assigned it a unit value; if it was expected to strengthen the
exchange rate we assigned it the value -1; nil means no news. Hence, good news about public
finance issues is expected to strengthen the lira-mark exchange rate and the associated dummy
receives a value of -1; if a declaration is expected to weaken the lira-mark exchange rate, the
associated dummy receives a value of 1.
The following categories of unscheduled news were selected:
- Public Finance: all the news in this category describes events likely to affect the
Government deficit directly (e.g. variations in interest rates) and disclosures about it.
- Consumer Prices: here, most news is scheduled but there are also unscheduled events (e.g.
CPI and PPI releases, but also labour costs, raw material costs, indirect taxes news).
- Institutional Conflicts: this is a very Italian-specific kind of news, referring to the balance of
political power between the President of the Republic, Parliament and the Premier in the
newly established Italian bipartisan setup.
- Political Conflicts.
- Electoral results: though electoral results are scheduled, in that they are predetermined,
there is generally a flow of information from declarations made by of political leaders,
concerning the importance of the observed shares, that typically continues for two or three
days after the vote; this is why they are regarded as unscheduled.
- Easing of Political Tensions during the Dini Government (January 16-December 29, 1995):
refers to all political conflicts and easings of tensions in this period between the Government
coalition and the opposition.
- Dini government: this contains a number of news events related to political action by the
Dini government.
- Political debate from the beginning of 1996.
- EMU events directly relevant to Italy: this category refers mostly to European doubt about
Italy’s entrance in the EMU.

41
- EMU and the international environment: this news refers to the international market’s
decoding of events leading to the EMU.
- Debate on judiciary procedures: this news refers to clashes between the Berlusconi
government and the Pool of Milan magistrates who bore responsibility for legal suits against
corrupted politicians and eventually against Berlusconi himself.
- Black Friday, 17 March 1995: this is a vector equal to one on Black Friday and -1 on the
three subsequent working days.
- Justice Minister Mancuso’s actions and his Parliamentary removal.
For scheduled news, we use the difference between the observed and the previous value
of each variable, under the assumption that the latter proxy expectations (here we implicitly
assume that markets have static expectations or that series follow random walks and agents
have rational expectations). Scheduled news regards macroeconomic, financial and monetary
data releases. We choose each of them according to the relative importance market agents
assign to it. We select the average repurchase agreement (repo) rate and the three-month bill
auction rate which generally are considered to have the largest impact on money market rates
and, consequently, on the spot exchange rate market; also we consider in this category the
preliminary and the final consumer price index as well as the final producer price index, which
all affect market perception of a likely swing in the stance of monetary policy.
42
References
Agmon, T. and C. Findlay (1992), “Domestic Political Risk”, Financial Analysts Journal, Vol.38 , pp. 74-77.
Allvine F. C. and D. E. O’Neil (1980), “Stock Market Returns and the Presidential ElectionCycle: Implications for Market Efficiency”, Financial Analysts Journal, Vol. 36, pp.49-56.
Almeida, A., C. Goodhart and R. Paine (1998), “The Effects of Macroeconomic ‘News’ onHigh Frequency Exchange Rate Behaviour”, Journal of Financial and QuantitativeAnalysis, Vol. 33, pp. 1-47.
Baestaens, D. J. E. and W. M. van den Bergh (1996), “Money Market Headline Newsflashes,Effective News and the DEM-USD Swap Rate: An Intraday Analysis in OperationalTime”, Erasmus University, mimeo.
Baig, T. and I. Goldfajn (1998), “Financial Market Contagion in the Asian Crisis”, IMFWorking Paper, No. 98/155.
Balduzzi, P., E. J. Elton and T. C. Green (1998), “Economic News and the Yield Curve:Evidence from the US Treasury Market”, New York University, Salomon Center,Working Paper, No. S-98-5.
Black, F. (1976), “Studies of Stock Price Volatility Changes”, Proceedings of the 1976Meeting of the American Statistical Association, pp. 177-81.
Bollerslev, T. (1986), “Generalized Autoregressive Conditional Heteroskedasticity”, Journalof Econometrics, Vol. 31, pp. 307-27.
___________ (1987), “A Conditionally Heteroskedastic Time-Series Model for Security Pricesand Rates of Return Data”, Review of Economic Studies, Vol. 69, pp. 542-47.
____________ (1990), “Modelling the Coherence in Short-Run Nominal Exchange Rates: AMultivariate Generalized ARCH Model”, Review of Economics and Statistics, Vol. 72,pp. 498-505.
____________, R. Chou and K. Kroner (1992), “ARCH Modeling in Finance: A Review ofthe Theory and Empirical Evidence”, Journal of Econometrics, Vol. 52 , pp. 5-59.
____________, R., Engle and D. Nelson (1994), “ARCH Models”, in R. Engle and D.McFadden (eds.), Handbook of Econometrics: Volume 4, Amsterdam, North-Holland.
Bomhoff, E. J. and P. Korteweg (1983), “Exchange Rate Variability and Monetary Policyunder Rational Expectations: Some Euro-American Experience 1973-1979”, Journal ofMonetary Economics, Vol. 11, pp. 169-206.
Branson, W. H. (1983), “Macroeconomic Determinants of Real Exchange Risk”, in R. J.Herring (ed.), Managing Foreign Exchange Risk, Cambridge, Cambridge UniversityPress.
Calvo, G. (1996), “Capital Flows and Macroeconomic Management: Tequila Lessons”,International Journal of Finance and Economics, Vol. 1, pp. 207-23.
Copeland, L. S. (1984), “The Pound Sterling/US Dollar Exchange Rate and the News”,Economic Letters, Vol. 15, pp. 109-14.

43
Cutler, D. M., J. M. Poterba and L. H. Summers (1993), “What Moves Stock Prices?”, in R.H. Thaler (ed.), Advances in Behavioural Finance, New York, Russel SageFoundation.
Del Giovane, P. and A. F. Pozzolo (1998), “The Behaviour of the Dollar and Exchange Ratesin Europe: Empirical Evidence and Possible Explanations”, Banca d’Italia, Temi didiscussione, No. 328.
Deravi, M. K., P. Gregorowicz and C. E. Hegi (1988), “Balance of Trade Announcements andMovements in Exchange Rates”, Southern Economic Journal, Vol. 55, pp. 279-87.
Diamonte R. L., J. M. Liew and R. L. Stevens (1996), “Political Risk in Emerging andDeveloped Markets”, Financial Analysts Journal, Vol. 52, pp. 71-76.
Doukas, J. and S. Lifeland (1994), “Exchange Rates and the Role of Trade Balance Account”,Managerial Finance, Vol. 20, pp. 67-78.
Ederington, L. and J. H. Lee (1993), “How Markets Process Information: News Releases andVolatility”, Journal of Finance, Vol. 48, pp. 1161-91.
_______________________ (1995), “The Short-Run Dynamics of the Price Adjustment toNew Information”, Journal of Financial and Quantitative Analysis, Vol. 30, pp. 117-34.
______________________ (1996), “The Creation and Resolution of Market Uncertainty: TheImpact of Information Releases on Implied Volatility”, Journal of Financial andQuantitative Analysis, Vol. 31, pp. 513-39.
_________ (1983a), “Exchange Rates and News: A Multicurrency Approach”, in M. Taylorand R. MacDonald (eds.), Exchange Rate Economics, Aldershot, Elgar.
Edwards, S. (1983b), “Floating Exchange Rates, Expectation and New Information”, Journalof Monetary Economics, Vol. 36, pp. 321-36.
Engle, R. F. and K. F. Kroner (1995), “Multivariate Simultaneous Generalized ARCH”,Econometric Theory, Vol. 11, pp. 122-50.
Erb, C. B., C. R. Harvey and T. E. Viskanta (1986), “The Influence of Political, Economic,and Financial Risk on Expected Fixed-Income Returns”, Journal of Fixed Income, Vol.6, pp. 7-30.
Fiorentini, R. (1994), Exchange Rates and News: The Case of the Italian Lira, Quaderni delDipartimento di Scienze Economiche dell’Università di Padova, No. 32.
Hardouvelis, G. (1988), “Economic News, Exchange Rates and Interest Rates”, Journal ofInternational Money and Finance, Vol. 7, pp. 23-36.
Hobbs, G. R. and W. B. Riley (1984), “Profiting from a Presidential Election”, FinancialAnalyst Journal, Vol. 40, pp. 46-52.
Hogan, K., M. Melvin and D. J. Roberts (1991), “Trade Balance News and Exchange Rates: IsThere a Policy Signal?”, Journal of International Money and Finance, Vol. 10, pp.590-99.
Irwin, D. (1989), “Trade Deficit Announcements, Interventions and the Dollar”, EconomicsLetters, Vol. 31, pp. 257-62.

44
Ito, T. and V. Roley (1988), “News from the US and Japan: Which Moves the Yen-DollarExchange Rate?”, NBER Working Paper, No. 1853.
Li, L. and Z. F. Hu (1998), “Responses of the Stock Market to MacroeconomicAnnouncements across Economic States”, IMF Working Paper, No. 79.
MacDonald, R., (1983), “Test of Efficiency and the Impact of News in Three ForeignExchange Markets”, Bullettin of Economic Research, Vol. 35, pp. 123-44.
McQueen, G. and V. Roley (1993), “Stock Prices, News and Business Conditions”, Review ofFinancial Studies, Vol. 6, pp. 683-707.
Mitchell, M. and J. Mulherin (1994), “The Impact of Public Information on the Stock Market”,Journal of Finance, Vol. 49, pp. 923-50.
Nelson, D. (1990), “ARCH Models as Diffusion Approximations”, Journal of Econometrics,Vol. 45, pp. 7-38.
Thaler, R. H. (ed.) (1993), Advances in Behavioral Finance, New York, Russel SageFoundation.
Tivegna, M. (1996a), “Economic and Political News in the Fluctuations of the Lira: TheRecent Experience, March 28 1994-December 29 1995”, Rivista di PoliticaEconomica, Vol. 86, pp. 317-59.
__________ (1996b), “Analisi infragiornaliera del cambio lira-marco in periodi di particolareturbolenza: gennaio 1995-gennaio 1996”, Università di Roma “Tor Vergata”, mimeo.
__________ and G. Chiofi (1998), “News e dinamica dei tassi di cambio. NEWSMETRICS:una banca dati per lo studio delle relazioni tra eventi economico-politici, clima deimercati finanziari e tassi di cambio”, Università di Roma “Tor Vergata”, mimeo.

RECENTLY PUBLISHED “TEMI” (*)
No. 333 —La domanda di finanziamenti bancari in Italia e nelle diverse aree del Paese(1984--1996), by D. FOCARELLI and P. ROSSI (May 1998).
No. 334 —La politica fiscale nei paesi dell’Unione europea negli anni novanta,by P. CASELLI
and R. RINALDI (July 1998).
No. 335 — Signaling Fiscal Regime Sustainability, by F. DRUDI and A. PRATI (September 1998).
No. 336 —Fiscal Consolidations under Fixed Exchange Rates, by P. CASELLI (October 1998).
No. 337 —Investimenti diretti all’estero e commercio: complementi o sostituti?,by A. MORI andV. ROLLI (October 1998).
No. 338 — Nonlinear VAR: Some Theory and an Application to US GNP and Unemployment,by F. ALTISSIMO and G. L. V IOLANTE (October 1998).
No. 339 —The Probability Density Function of Interest Rates Implied in the Price of Options,by F. FORNARI and R. VIOLI (October 1998).
No. 340 —Heterogeneous “Credit Channels” and Optimal Monetary Policy in a MonetaryUnion,by L. GAMBACORTA (October 1998).
No. 341 — “Enemy of None but a Common Friend of All”? An International Perspective on theLender--of--Last--Resort Function,by C. GIANNINI (December 1998).
No. 342 — Energy Consumption, Survey Data and the Prediction of Industrial Production inItaly, by D. J. MARCHETTI and G. PARIGI (December 1998).
No. 343 —What Caused the Asian Currency and Financial Crisis?, by G. CORSETTI,P. PESENTI and N. ROUBINI (December 1998).
No. 344 —Investment and the Exchange Rate, by F. NUCCI and A. F. POZZOLO (December1998).
No. 345 —Reallocation and Learning over the Business Cycle, by F. SCHIVARDI (December1998).
No. 346 —Una ricostruzione omogenea di dati regionali: conti economici e reddito disponibiledelle famiglie 1970--1995, by P. BERRETTONI, R. DELOGU, C. PAPPALARDO and P.PISELLI (February 1999).
No. 347 —Industrial Districts and Local Banks: Do the Twins Ever Meet?, by A. BAFFIGI,M. PAGNINI and F. QUINTILIANI (March 1999).
No. 348 —Orari di lavoro atipici in Italia: un’analisi attraverso l’Indagine dell’uso del tempodell’Istat, by R. TORRINI (March 1999).
No. 349 — Gli effetti economici del nuovo regime di tassazione delle rendite finanziarie, byR. CESARI (March 1999).
No. 350 —The Distribution of Personal Income in Post--War Italy: Source Description, DataQuality, and the Time Pattern of Income Inequality, by A. BRANDOLINI (April 1999).
No. 351 —Median Voter Preferences, Central Bank Independence and Conservatism, by F.LIPPI (April 1999).
No. 352 —Errori e omissioni nella bilancia dei pagamenti, esportazioni di capitali e aperturafinanziaria dell’Italia, by M. COMMITTERI (June 1999).
No. 353 — Is There an Equity Premium Puzzle in Italy? A Look at Asset Returns, Consumptionand Financial Structure Data over the Last Century, by F. PANETTA and R. VIOLI
(June 1999).
No. 354 —How Deep Are the Deep Parameters?, by F. ALTISSIMO, S. SIVIERO andD. TERLIZZESE (June 1999).
No. 355 —The Economic Policy of Fiscal Consolidations: The European Experience, byA. ZAGHINI (June 1999).
No. 356 —What Is the Optimal Institutional Arrangement for a Monetary Union?, byL. GAMBACORTA (June 1999).
No. 357 —Are Model--Based Inflation Forecasts Used in Monetary Policymaking? A Case Studyby S. SIVIERO, D. TERLIZZESE and I. VISCO (September 1999).
� � 5HTXHVWV IRU FRSLHV VKRXOG EH VHQW WR�%DQFD G·,WDOLD �� 6HUYL]LR 6WXGL �� 'LYLVLRQH %LEOLRWHFD H SXEEOLFD]LRQL �� 9LD 1D]LRQDOH� �� �� ����� 5RPH�ID[ ���� �� ����������