The hydrochemical facies and anomalous fluoride content in the Serra Geral aquifer system, southern...
9
ORIGINAL ARTICLE The hydrochemical facies and anomalous fluoride content in the Serra Geral aquifer system, southern Brazil: a GIS approach with tectonic and principal component analysis Arthur Nanni Ari Roisenberg Maria Paula Casagrande Marimon Antonio Pedro Viero Received: 17 August 2008 / Accepted: 21 October 2008 / Published online: 12 November 2008 Ó Springer-Verlag 2008 Abstract Groundwater with high fluoride content and water mixture patterns were studied in Serra Geral aquifer system (SGAS) using three aspects, principal component analysis (PCA), tectonic scenery and hydrochemical inter- pretation from 309 groundwater chemical data information from deep wells. A four-component model is suggested and explains 81% of total variance in the PCA. Six hydro- chemical facies were identified. These facies suggest two different fluoride sources. Tectonic approach shows the relationship between defined hydrochemical facies and regional fracture control. The applied methodology reveals a minimum level to understand hydrochemical mixtures. The fluoride enrichment mechanisms into the groundwater are comprised in advance to guide the future uses of SGAS to the public supply. Keywords Groundwater Geostatistics Tectonics Fluoride Geographic information systems Introduction In the last decades the water consumption has been dramatically increased especially in agriculture, water supply and industrial use. This paper approaches to the fluoride contents in the southernmost region of the frac- tured subcontinental Serra Geral aquifer system (SGAS), which supplies most of the public water consumption in the Rio Grande do Sul State, southern Brazil. In a wide sense, the groundwater in SGAS is potable, but fluoride contents may restrict the use for human consumption. The SGAS covers more than 85% of the Guarani aquifer system (GAS) (Campos 2000) comprising 1,200,000 km 2 shared by Brazil, Uruguay, Argentina and Paraguay (Fig. 1). In Brazil, due to a strategic condition and to the high vulnerability the groundwater resource should be efficiently managed, caring for water potential and quality. The climate in the study area ranges from subtropical to temperate with rainwater precipitation average of 1,550 mm/year. The SGAS reaches its maximum thickness of about 1,800 m along the central axis of the Parana Basin, located in the Sao Paulo State. In the Rio Grande do Sul State, the thickness achieves 1,000 m in the northeastern escarpment bordering the Santa Catarina State. A. Nanni (&) Rio Grande do Sul Environmental Agency, FEPAM/Universidade Federal do Rio Grande do Sul, UFRGS, Av. Bento Gonc ¸alves, 9500, pre ´dio 43126/105, Porto Alegre, RS, Brazil e-mail: [email protected] A. Roisenberg Universidade Federal do Rio Grande do Sul, UFRGS, Av. Bento Gonc ¸alves, 9500, pre ´dio 43126/103, Porto Alegre, RS, Brazil e-mail: [email protected] M. P. C. Marimon Universidade do Estado de Santa Catarina, UDESC-FAED, Av. Madre Benvenuta, 2007, Floriano ´polis, SC, Brazil e-mail: [email protected] A. P. Viero Universidade Federal do Rio Grande do Sul, UFRGS, Av. Bento Gonc ¸alves, 9500, pre ´dio 43126/104, Porto Alegre, RS, Brazil e-mail: [email protected] 123 Environ Geol (2009) 58:1247–1255 DOI 10.1007/s00254-008-1624-2
-
Upload
independent -
Category
Documents
-
view
3 -
download
0
Transcript of The hydrochemical facies and anomalous fluoride content in the Serra Geral aquifer system, southern...
ORIGINAL ARTICLE
The hydrochemical facies and anomalous fluoride contentin the Serra Geral aquifer system, southern Brazil: a GISapproach with tectonic and principal component analysis
Arthur Nanni Æ Ari Roisenberg ÆMaria Paula Casagrande Marimon ÆAntonio Pedro Viero
Received: 17 August 2008 / Accepted: 21 October 2008 / Published online: 12 November 2008
� Springer-Verlag 2008
Abstract Groundwater with high fluoride content and
water mixture patterns were studied in Serra Geral aquifer
system (SGAS) using three aspects, principal component
analysis (PCA), tectonic scenery and hydrochemical inter-
pretation from 309 groundwater chemical data information
from deep wells. A four-component model is suggested and
explains 81% of total variance in the PCA. Six hydro-
chemical facies were identified. These facies suggest two
different fluoride sources. Tectonic approach shows the
relationship between defined hydrochemical facies and
regional fracture control. The applied methodology reveals
a minimum level to understand hydrochemical mixtures.
The fluoride enrichment mechanisms into the groundwater
are comprised in advance to guide the future uses of SGAS
to the public supply.
Keywords Groundwater � Geostatistics � Tectonics �Fluoride � Geographic information systems
Introduction
In the last decades the water consumption has been
dramatically increased especially in agriculture, water
supply and industrial use. This paper approaches to the
fluoride contents in the southernmost region of the frac-
tured subcontinental Serra Geral aquifer system (SGAS),
which supplies most of the public water consumption in
the Rio Grande do Sul State, southern Brazil. In a wide
sense, the groundwater in SGAS is potable, but fluoride
contents may restrict the use for human consumption.
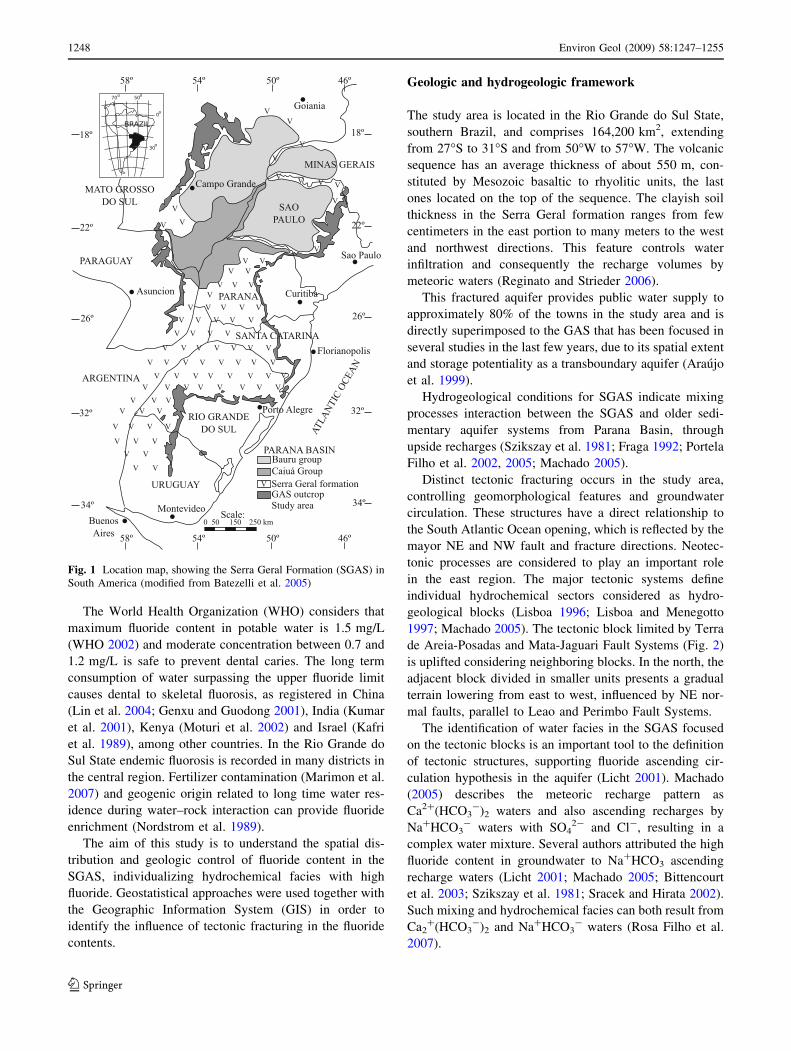
The SGAS covers more than 85% of the Guarani aquifer
system (GAS) (Campos 2000) comprising 1,200,000 km2
shared by Brazil, Uruguay, Argentina and Paraguay
(Fig. 1). In Brazil, due to a strategic condition and to
the high vulnerability the groundwater resource should
be efficiently managed, caring for water potential and
quality.
The climate in the study area ranges from subtropical
to temperate with rainwater precipitation average of
1,550 mm/year.
The SGAS reaches its maximum thickness of about
1,800 m along the central axis of the Parana Basin, located
in the Sao Paulo State. In the Rio Grande do Sul State, the
thickness achieves 1,000 m in the northeastern escarpment
bordering the Santa Catarina State.
A. Nanni (&)
Rio Grande do Sul Environmental Agency,
FEPAM/Universidade Federal do Rio Grande do Sul,
UFRGS, Av. Bento Goncalves, 9500,
predio 43126/105, Porto Alegre, RS, Brazil
e-mail: [email protected]
A. Roisenberg
Universidade Federal do Rio Grande do Sul,
UFRGS, Av. Bento Goncalves, 9500,
predio 43126/103, Porto Alegre, RS, Brazil
e-mail: [email protected]
M. P. C. Marimon
Universidade do Estado de Santa Catarina,
UDESC-FAED, Av. Madre Benvenuta, 2007,
Florianopolis, SC, Brazil
e-mail: [email protected]
A. P. Viero
Universidade Federal do Rio Grande do Sul,
UFRGS, Av. Bento Goncalves, 9500,
predio 43126/104, Porto Alegre, RS, Brazil
e-mail: [email protected]
123
Environ Geol (2009) 58:1247–1255
DOI 10.1007/s00254-008-1624-2
The World Health Organization (WHO) considers that
maximum fluoride content in potable water is 1.5 mg/L
(WHO 2002) and moderate concentration between 0.7 and
1.2 mg/L is safe to prevent dental caries. The long term
consumption of water surpassing the upper fluoride limit
causes dental to skeletal fluorosis, as registered in China
(Lin et al. 2004; Genxu and Guodong 2001), India (Kumar
et al. 2001), Kenya (Moturi et al. 2002) and Israel (Kafri
et al. 1989), among other countries. In the Rio Grande do
Sul State endemic fluorosis is recorded in many districts in
the central region. Fertilizer contamination (Marimon et al.
2007) and geogenic origin related to long time water res-
idence during water–rock interaction can provide fluoride
enrichment (Nordstrom et al. 1989).
The aim of this study is to understand the spatial dis-
tribution and geologic control of fluoride content in the
SGAS, individualizing hydrochemical facies with high
fluoride. Geostatistical approaches were used together with
the Geographic Information System (GIS) in order to
identify the influence of tectonic fracturing in the fluoride
contents.
Geologic and hydrogeologic framework
The study area is located in the Rio Grande do Sul State,
southern Brazil, and comprises 164,200 km2, extending
from 27�S to 31�S and from 50�W to 57�W. The volcanic
sequence has an average thickness of about 550 m, con-
stituted by Mesozoic basaltic to rhyolitic units, the last
ones located on the top of the sequence. The clayish soil
thickness in the Serra Geral formation ranges from few
centimeters in the east portion to many meters to the west
and northwest directions. This feature controls water
infiltration and consequently the recharge volumes by
meteoric waters (Reginato and Strieder 2006).
This fractured aquifer provides public water supply to
approximately 80% of the towns in the study area and is
directly superimposed to the GAS that has been focused in
several studies in the last few years, due to its spatial extent
and storage potentiality as a transboundary aquifer (Araujo
et al. 1999).
Hydrogeological conditions for SGAS indicate mixing
processes interaction between the SGAS and older sedi-
mentary aquifer systems from Parana Basin, through
upside recharges (Szikszay et al. 1981; Fraga 1992; Portela
Filho et al. 2002, 2005; Machado 2005).
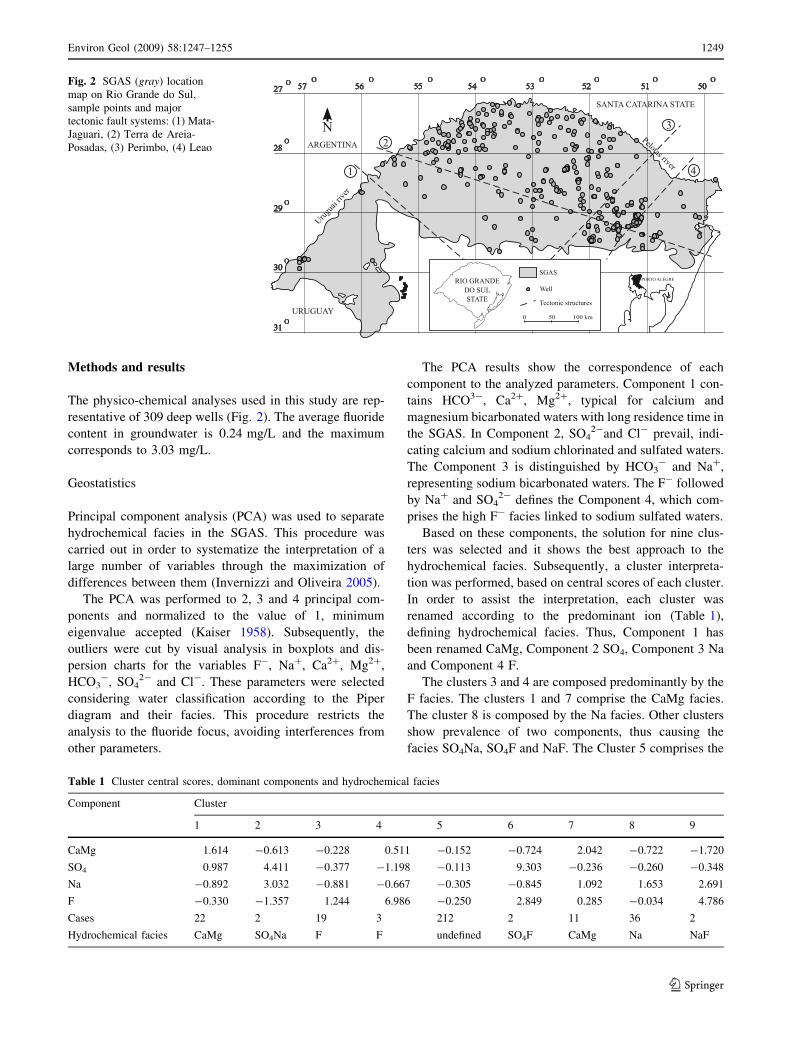
Distinct tectonic fracturing occurs in the study area,
controlling geomorphological features and groundwater
circulation. These structures have a direct relationship to
the South Atlantic Ocean opening, which is reflected by the
mayor NE and NW fault and fracture directions. Neotec-
tonic processes are considered to play an important role
in the east region. The major tectonic systems define
individual hydrochemical sectors considered as hydro-
geological blocks (Lisboa 1996; Lisboa and Menegotto
1997; Machado 2005). The tectonic block limited by Terra
de Areia-Posadas and Mata-Jaguari Fault Systems (Fig. 2)
is uplifted considering neighboring blocks. In the north, the
adjacent block divided in smaller units presents a gradual
terrain lowering from east to west, influenced by NE nor-
mal faults, parallel to Leao and Perimbo Fault Systems.
The identification of water facies in the SGAS focused
on the tectonic blocks is an important tool to the definition
of tectonic structures, supporting fluoride ascending cir-
culation hypothesis in the aquifer (Licht 2001). Machado
(2005) describes the meteoric recharge pattern as
Ca2?(HCO3-)2 waters and also ascending recharges by
Na?HCO3- waters with SO4
2- and Cl-, resulting in a
complex water mixture. Several authors attributed the high
fluoride content in groundwater to Na?HCO3 ascending
recharge waters (Licht 2001; Machado 2005; Bittencourt
et al. 2003; Szikszay et al. 1981; Sracek and Hirata 2002).
Such mixing and hydrochemical facies can both result from
Ca2?(HCO3
-)2 and Na?HCO3- waters (Rosa Filho et al.
2007).
Fig. 1 Location map, showing the Serra Geral Formation (SGAS) in
South America (modified from Batezelli et al. 2005)
1248 Environ Geol (2009) 58:1247–1255
123
Methods and results
The physico-chemical analyses used in this study are rep-
resentative of 309 deep wells (Fig. 2). The average fluoride
content in groundwater is 0.24 mg/L and the maximum
corresponds to 3.03 mg/L.
Geostatistics
Principal component analysis (PCA) was used to separate
hydrochemical facies in the SGAS. This procedure was
carried out in order to systematize the interpretation of a
large number of variables through the maximization of
differences between them (Invernizzi and Oliveira 2005).
The PCA was performed to 2, 3 and 4 principal com-
ponents and normalized to the value of 1, minimum
eigenvalue accepted (Kaiser 1958). Subsequently, the
outliers were cut by visual analysis in boxplots and dis-
persion charts for the variables F-, Na?, Ca2?, Mg2?,
HCO3-, SO4
2- and Cl-. These parameters were selected
considering water classification according to the Piper
diagram and their facies. This procedure restricts the
analysis to the fluoride focus, avoiding interferences from
other parameters.
The PCA results show the correspondence of each
component to the analyzed parameters. Component 1 con-
tains HCO3-, Ca2?, Mg2?, typical for calcium and
magnesium bicarbonated waters with long residence time in
the SGAS. In Component 2, SO42-and Cl- prevail, indi-
cating calcium and sodium chlorinated and sulfated waters.
The Component 3 is distinguished by HCO3- and Na?,
representing sodium bicarbonated waters. The F- followed
by Na? and SO42- defines the Component 4, which com-
prises the high F- facies linked to sodium sulfated waters.
Based on these components, the solution for nine clus-
ters was selected and it shows the best approach to the
hydrochemical facies. Subsequently, a cluster interpreta-
tion was performed, based on central scores of each cluster.
In order to assist the interpretation, each cluster was
renamed according to the predominant ion (Table 1),
defining hydrochemical facies. Thus, Component 1 has
been renamed CaMg, Component 2 SO4, Component 3 Na
and Component 4 F.
The clusters 3 and 4 are composed predominantly by the
F facies. The clusters 1 and 7 comprise the CaMg facies.
The cluster 8 is composed by the Na facies. Other clusters
show prevalence of two components, thus causing the
facies SO4Na, SO4F and NaF. The Cluster 5 comprises the
Fig. 2 SGAS (gray) location
map on Rio Grande do Sul,
sample points and major
tectonic fault systems: (1) Mata-
Jaguari, (2) Terra de Areia-
Posadas, (3) Perimbo, (4) Leao
Table 1 Cluster central scores, dominant components and hydrochemical facies
Component Cluster
1 2 3 4 5 6 7 8 9
CaMg 1.614 -0.613 -0.228 0.511 -0.152 -0.724 2.042 -0.722 -1.720
SO4 0.987 4.411 -0.377 -1.198 -0.113 9.303 -0.236 -0.260 -0.348
Na -0.892 3.032 -0.881 -0.667 -0.305 -0.845 1.092 1.653 2.691
F -0.330 -1.357 1.244 6.986 -0.250 2.849 0.285 -0.034 4.786
Cases 22 2 19 3 212 2 11 36 2
Hydrochemical facies CaMg SO4Na F F undefined SO4F CaMg Na NaF
Environ Geol (2009) 58:1247–1255 1249
123
Meteoric waters and other samples with no relationship to
the four principal components.
Hydrochemistry
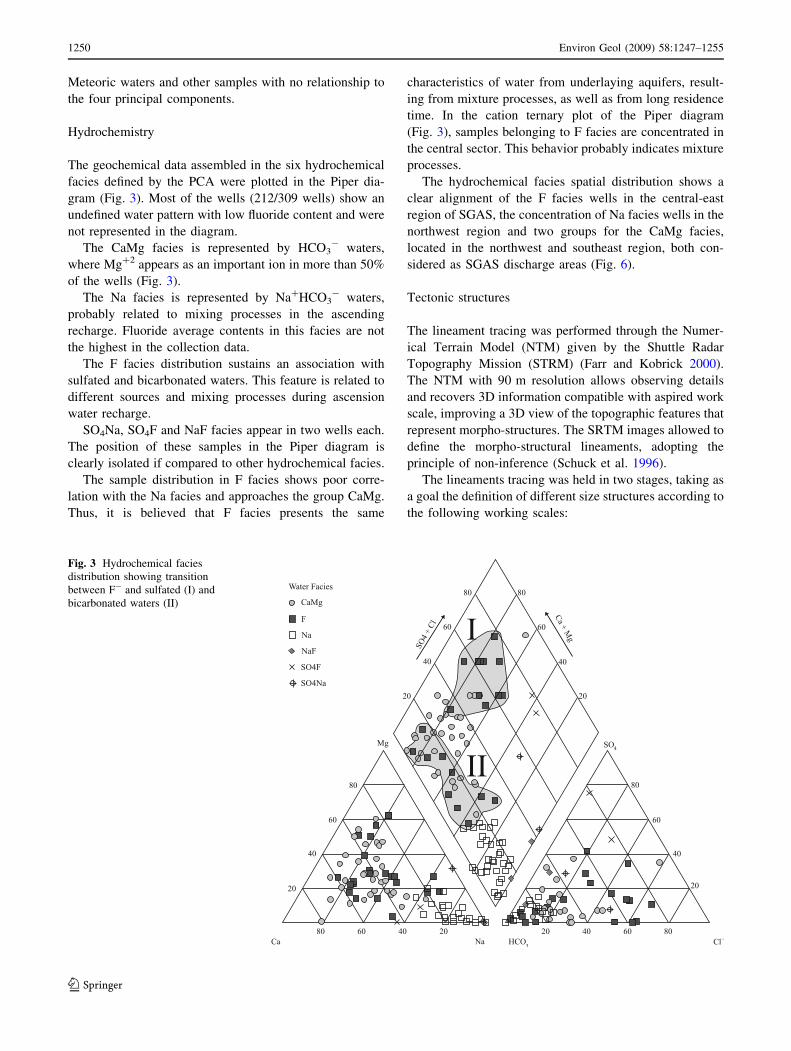
The geochemical data assembled in the six hydrochemical
facies defined by the PCA were plotted in the Piper dia-
gram (Fig. 3). Most of the wells (212/309 wells) show an
undefined water pattern with low fluoride content and were
not represented in the diagram.
The CaMg facies is represented by HCO3- waters,
where Mg?2 appears as an important ion in more than 50%
of the wells (Fig. 3).
The Na facies is represented by Na?HCO3- waters,
probably related to mixing processes in the ascending
recharge. Fluoride average contents in this facies are not
the highest in the collection data.
The F facies distribution sustains an association with
sulfated and bicarbonated waters. This feature is related to
different sources and mixing processes during ascension
water recharge.
SO4Na, SO4F and NaF facies appear in two wells each.
The position of these samples in the Piper diagram is
clearly isolated if compared to other hydrochemical facies.
The sample distribution in F facies shows poor corre-
lation with the Na facies and approaches the group CaMg.
Thus, it is believed that F facies presents the same
characteristics of water from underlaying aquifers, result-
ing from mixture processes, as well as from long residence
time. In the cation ternary plot of the Piper diagram
(Fig. 3), samples belonging to F facies are concentrated in
the central sector. This behavior probably indicates mixture
processes.
The hydrochemical facies spatial distribution shows a
clear alignment of the F facies wells in the central-east
region of SGAS, the concentration of Na facies wells in the
northwest region and two groups for the CaMg facies,
located in the northwest and southeast region, both con-
sidered as SGAS discharge areas (Fig. 6).
Tectonic structures
The lineament tracing was performed through the Numer-
ical Terrain Model (NTM) given by the Shuttle Radar
Topography Mission (STRM) (Farr and Kobrick 2000).
The NTM with 90 m resolution allows observing details
and recovers 3D information compatible with aspired work
scale, improving a 3D view of the topographic features that
represent morpho-structures. The SRTM images allowed to
define the morpho-structural lineaments, adopting the
principle of non-inference (Schuck et al. 1996).
The lineaments tracing was held in two stages, taking as
a goal the definition of different size structures according to
the following working scales:
Fig. 3 Hydrochemical facies
distribution showing transition
between F- and sulfated (I) and
bicarbonated waters (II)
1250 Environ Geol (2009) 58:1247–1255
123
• 1:500.000: allows mapping those well-defined struc-
tures with long continuity, which help to differentiate
extensive areas with the same tectonic meaning;
• 1:250.000: allows to map structures with significant
continuity in a regional scale, helping to recognize
tectonic blocks within restrict extension.
The tectonic structures have been interpreted in GIS
environment with the use of the Spring Software, version
4.3.2 (Camara et al. 1996). In order to assist the lineament
mapping with different directions, the NTM originated
from the SRTM was used producing Geotiff images with
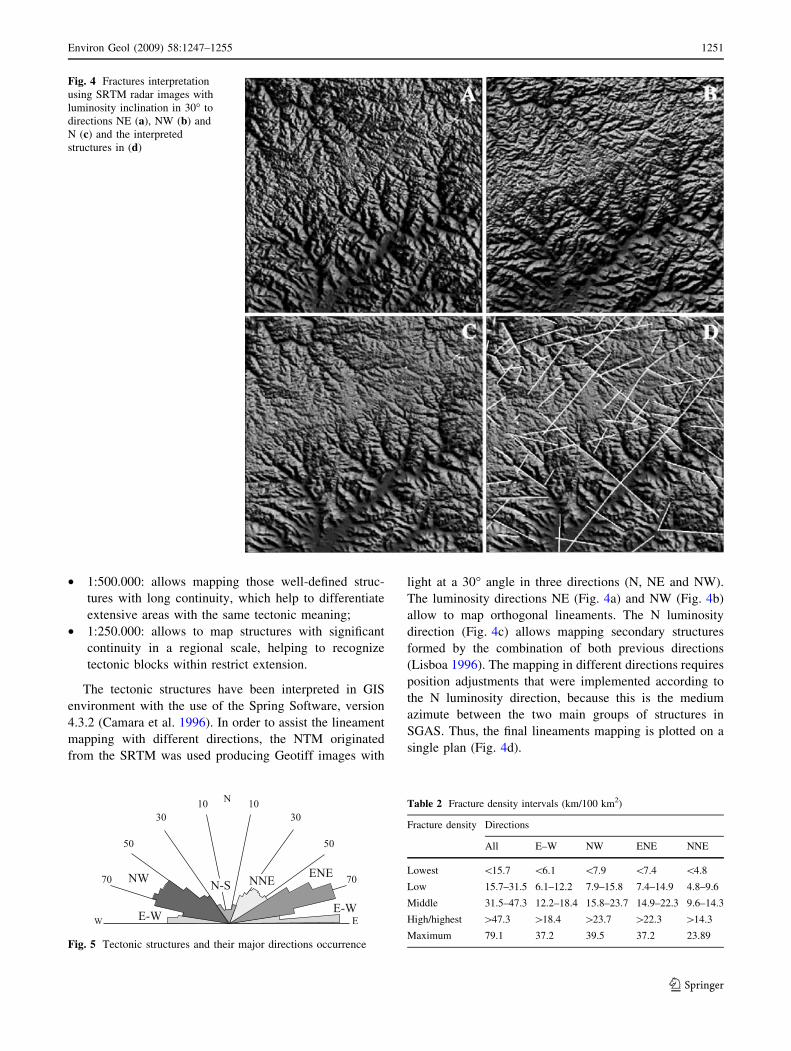
light at a 30� angle in three directions (N, NE and NW).
The luminosity directions NE (Fig. 4a) and NW (Fig. 4b)
allow to map orthogonal lineaments. The N luminosity
direction (Fig. 4c) allows mapping secondary structures
formed by the combination of both previous directions
(Lisboa 1996). The mapping in different directions requires
position adjustments that were implemented according to
the N luminosity direction, because this is the medium
azimute between the two main groups of structures in
SGAS. Thus, the final lineaments mapping is plotted on a
single plan (Fig. 4d).
Fig. 4 Fractures interpretation
using SRTM radar images with
luminosity inclination in 30� to
directions NE (a), NW (b) and
N (c) and the interpreted
structures in (d)
Fig. 5 Tectonic structures and their major directions occurrence
Table 2 Fracture density intervals (km/100 km2)
Fracture density Directions
All E–W NW ENE NNE
Lowest \15.7 \6.1 \7.9 \7.4 \4.8
Low 15.7–31.5 6.1–12.2 7.9–15.8 7.4–14.9 4.8–9.6
Middle 31.5–47.3 12.2–18.4 15.8–23.7 14.9–22.3 9.6–14.3
High/highest [47.3 [18.4 [23.7 [22.3 [14.3
Maximum 79.1 37.2 39.5 37.2 23.89
Environ Geol (2009) 58:1247–1255 1251
123

Considering a complete set of 5,200 lineaments, grids
were generated in the NTM format and as a consequence
images of lineament densities were carried out through the
Spring Software tool lineament analysis.
The calculation to define the fracture density (Fd)
expresses the cumulated lineaments lengths (km) within a
100-km2 cell based on the equation:
Fd ¼P
lin
A
where lin is cumulated length within the cell (km), A is cell
area (km2).
The result illustrates two spatial products: a grid of
lineament densities and a gray shaded image of these
densities. After obtaining the grid, lineaments density iso-
contours were generated to distinguish areas with distinct
fracture and hydrodynamic levels. The final product is a
map of densities that provides an idea of the fragile
deformation magnitude suffered by rocks, suggesting that
greater the fracture density is, higher the chance for water
accumulation and groundwater recharge.
Fractures are concentrated in four main directions NNE,
E–W, ENE and NW (Fig. 5). The NNE and NW fractures
are usually associated with deep river valleys showing
spatial continuity. Structures with ENE direction appear
well marked near the east escarpment. In other sectors of
SGAS the ENE fractures are visible as short fragmented
lines due to interference of NE and NW groups. The E–W
group corresponds to short and scarce tectonic lineaments.
The N–S group is unexpressive according to the structural
control.
The NTM estimated fracture densities assigned to each
cell is in accordance with the cumulative fracture length in
each cell. The value ranges obtained in each analyzed
Fig. 6 Hydrochemical facies distribution and fractures density for All directions, E–W, NW, NNE and ENE directions
1252 Environ Geol (2009) 58:1247–1255
123
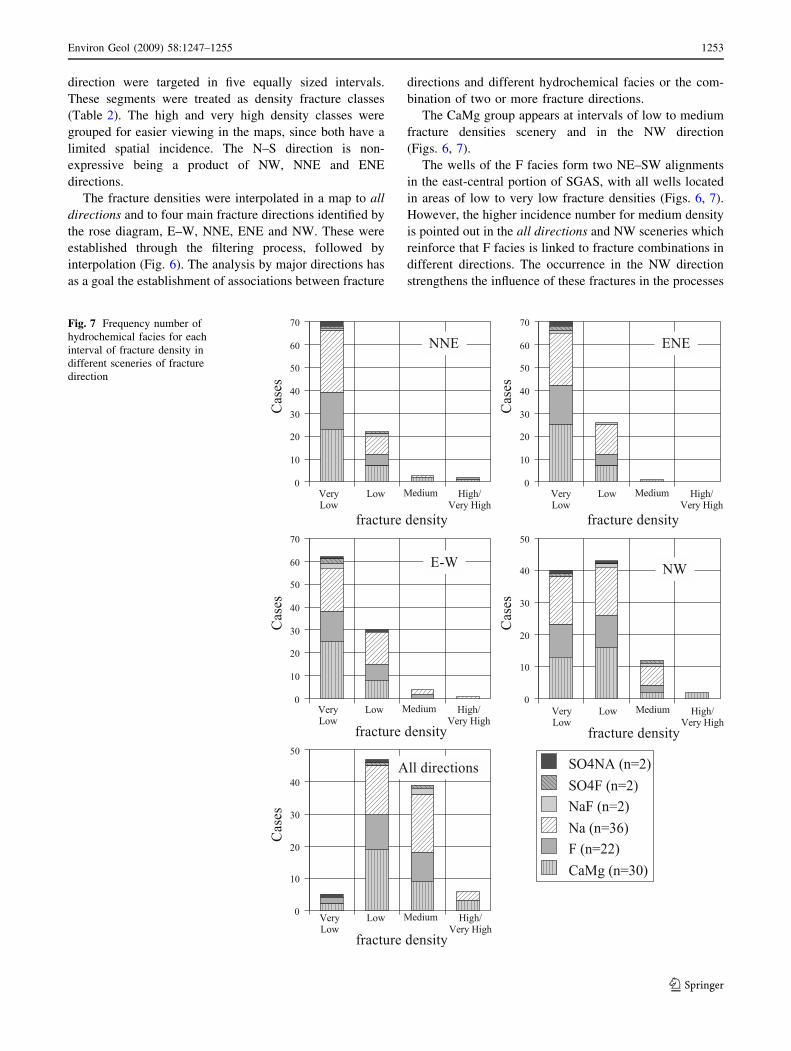
direction were targeted in five equally sized intervals.
These segments were treated as density fracture classes
(Table 2). The high and very high density classes were
grouped for easier viewing in the maps, since both have a
limited spatial incidence. The N–S direction is non-
expressive being a product of NW, NNE and ENE
directions.
The fracture densities were interpolated in a map to all
directions and to four main fracture directions identified by
the rose diagram, E–W, NNE, ENE and NW. These were
established through the filtering process, followed by
interpolation (Fig. 6). The analysis by major directions has
as a goal the establishment of associations between fracture
directions and different hydrochemical facies or the com-
bination of two or more fracture directions.
The CaMg group appears at intervals of low to medium
fracture densities scenery and in the NW direction
(Figs. 6, 7).
The wells of the F facies form two NE–SW alignments
in the east-central portion of SGAS, with all wells located
in areas of low to very low fracture densities (Figs. 6, 7).
However, the higher incidence number for medium density
is pointed out in the all directions and NW sceneries which
reinforce that F facies is linked to fracture combinations in
different directions. The occurrence in the NW direction
strengthens the influence of these fractures in the processes
Fig. 7 Frequency number of
hydrochemical facies for each
interval of fracture density in
different sceneries of fracture
direction
Environ Geol (2009) 58:1247–1255 1253
123

of ascending recharge. Moreover, the NE–SW alignment
for F facies shows the accordance with fault systems
directions already described by other authors. According to
this fact it can not be ruled out the linkage of F facies with
other fracture directions than the NW.
The Na facies appears concentrated in the northwest
portion of the study area and occurs in areas of very low
fracture density for ENE, NNE and E–W directions
(Figs. 6, 7). In the NW direction the incidence is more
expressive in low and medium densities, showing that these
fractures affect the water ascending movement, also rein-
forced by the scenery to all directions (Fig. 7).
The distribution of NaF facies is similar to the Na facies
(Fig. 6). Both are chemically very similar and distin-
guished by a more intensive fluoride participation in the
NaF facies. As a result, it enlightens the relationship
between NaF facies and the interpolated scenery for the
NW direction (Fig. 7).
The SO4F and SO4Na facies are scarce and closely
associated with major regional structures that delineate the
Uruguay River (Fig. 6). The SO4F facies occurs in the
north sector while the SO4Na facies occurs preferentially in
the west sector of the study area. In both cases, it is located
in areas of medium fracture density for the NW direction
(Fig. 7).
All hydrochemical facies show a meaningful relation-
ship with very low and low fractures density intervals.
Ionic enrichment including increasing fluoride content
can result from the interaction of ascending/descending
water recharge due to longer residence time in the Na and
CaMg hydrochemical facies. In SO4F, NaF, F and SO4Na
facies the water interaction is affected by two or more
fracture directions (Fig. 8), where SO42- and fluoride can
ascend.
The Na hydrochemical facies occurs in areas where the
fracture density is lower and clayish soils are thicker. The
combination of these two parameters reduces meteoric
recharge by Ca?(HCO3-)2 waters. In this condition, the
Na?HCO3- water ascending becomes more relevant
(Fig. 8—Condition 1). In areas where soils are thinner,
descending Ca?(HCO3-)2 recharge can prevail (Fig. 8—
Condition 2). Fracture connections make possible the
ascension of fluoride and other ions from deeper aquifers.
Conclusions
Mixture processes of ascending and descending water
recharge are accepted to explain the variability of hydro-
chemical facies in the SGAS. As a result of mixing processes,
different hydrochemical facies can result, according to
specific geological conditions.
The GIS tool was efficient in the interpretation of
fracturing densities improving a better relationship under-
standing between the geologic condition and the hydro-
chemical types.
The PCA allows to discriminate six different hydro-
chemical water facies in the SGAS, but it was not able to
explain facies where intensive mixture processes prevail
(212/309), including meteoric recharge. The distribution of
hydrochemical facies shows a close relationship between
PCA clustering and the specific geological settings.
The prevalence of meteoric water recharge in the SGAS
eastern region is explained by the intense fracturing
reported in this area. Limited CaMg hydrochemical facies
occurs in discharge areas close to the volcanic escarpment,
resulting in conditions of longtime water–rock interaction.
The GIS filtering process to the main fracture directions
reveals, in many cases, a close relationship between med-
ium and high density fracturing and high fluoride and
SO42- water contents.
The PCA clustering results plotted in a piper diagram
pointed out two different water types with high fluoride
contents (bicarbonate and sulfate chloride waters).
The tectonic analysis performed in GIS, associated with
PCA water discrimination results in a useful methodology
to establish hydrochemical patterns in a complex fractured
aquifer system.
Acknowledgment The funding for this study was provided by the
Brazilian National Research Council (CNPq) and Rio Grande do Sul
Environmental Agency (Fepam).
References
Araujo LM, Franca AB, Potter PE (1999) Hydrogeology of the
Mercosul aquifer system in the Parana and Chaco-Parana Basins,
South America, and comparison with the Navajo-Nugget aquifer
system, USA. Hydrogeol J 7(3):313–336
Batezelli A, Saad AR, Fulfaro VJ, Corsi AC, Landim PMB, Perinotto
JAJ (2005) Analise de bacia aplicada as unidades mesozoicas
do triangulo mineiro (sudeste do Brasil): uma estrategia naFig. 8 Water recharge conditions to different geological conditions
1254 Environ Geol (2009) 58:1247–1255
123
prospeccao de recursos hıdricos subterraneos. [Basin analysis
applied to Mineiro triangle mesozoic units (Brazil’s southeast): a
strategy to groundwater prospection]. Aguas Subterr 19(1):61–73
Bittencourt AVL, Rosa Filho EF, Hindi EC, Buchmann Filho AC
(2003) A influencia dos basaltos e de misturas com aguas de
aquıferos sotopostos nas aguas subterraneas do Sistema Aquıfero
Serra- Geral na bacia do rio piquiri, Parana—BR [The influence
of basalts and water mixture from covered aquifers to ground-
waters of Serra Geral Aquifer System in the Piquiri river basin,
Parana—Brazil]. Aguas Subterr 17:67–75
Camara G, Souza RCM, Freitas UM, Garrido J (1996) SPRING:
integrating remote sensing and GIS by object-oriented data
modelling. Comput Graph 20(3):395–403
Campos HCNS (2000) Modelacion conceptual y matematica del
acuıfero guaranı, Cono Sur. [Guarani aquifer mathematical and
conceptual modulation. Guarani aquifer system hydrogeologic
map on 1:250.000 scale]. Acta Geol Leopold XXIII(4):3–50
Farr TG, Kobrick M (2000) Shuttle Radar Topography Mission
produces a wealth of data. http://www2.jpl.nasa.gov/srtm/. Cited
28 Nov 2007
Fraga GC (1992) Fluoride source in groundwaters of Botucatu and
Serra Geral aquifer systems on Parana State. PhD thesis,
University of Sao Paulo, Sao Paulo, Brazil [in Portuguese]
Genxu W, Guodong C (2001) Fluoride distribution in water and
the governing factors of environment in arid north-west China.
J Arid Environ 49:601–614
Invernizzi A, Oliveira S (2005) Hydrochemical characterization of a
watershed through factor analysis. Aguas Subterraneas, America
do Sul, 18 27 09
Kafri U, Arad A, Halicz L (1989) Fluorine occurrence in groundwater
in Israel and its significance. J Hydrol 106:109–129
Kaiser HF (1958) The varimax criterion for analytic rotationing factor
analysis. Psychometrika 23:187–200
Kumar VV, Sai CST, Rao PLKM, Rao CS (2001) Studies on the
distribution of fluoride in drinking water sources in Medchal
Block, Ranga Reddy District, Andhra Pradesh, India. J Fluor
Chem 55:229–236
Licht OAB (2001) Multielements geochemistry at environmental
management—featuring and recognizing natural geochemical
provinces, landscape anthropic alterations, favorable zones to
mining and health risk regions in the Parana State, Brazil. PhD
thesis, Federal University of Parana, Curitiba, Brazil [in
Portuguese]
Lin NF, Tang J, Bian JM (2004) Geochemical environment and health
problems in China. Environ Geochem Health 26:81–88
Lisboa NA (1996) Facies, hydrochemical stratification and its
geological controls in hydrogeologic units of Serra Geral aquifer
system, Parana Basin, Rio Grande do Sul State, PhD thesis,
Federal University of Rio Grande do Sul, Porto Alegre, Brazil [in
Portuguese]
Lisboa NA, Menegotto E (1997) Diferenciacoes hidrogeoquımicas no
sistema aquıfero Serra Geral no Rio Grande do Sul. [Hydro-
chemical differentiations in Serra Geral aquifer system in the Rio
Grande do Sul State.] Paper presented at the XII Simposio
Brasileiro de Recursos Hıdricos, Vitoria, November 1997
Machado JLF (2005) Spatial compartmentation and stratigraphical
framework of Guarani aquifer system on Rio Grande do Sul.
PhD thesis, University of Sinos River Valley, Brazil [in
Portuguese]
Marimon MP, Knoller K, Roisenberg A (2007) Anomalous fluoride
concentration in groundwater—is it natural or pollution? A
stable isotope approach. Isotopes Environ Health Stud
43(2):165–175
Moturi WKN, Tole MP, Davies TC (2002) The contribution of
drinking water towards dental fluorosis: a case study of Njoro
Division, Nakuru District, Kenya. Environ Geochem Health
24:123–130
Nordstrom DK, Ball JW, Donahoe RJ, Whittemore D (1989)
Groundwater chemistry and water–rock interaction at Stripa.
Geochim Cosmochim Acta 53:1727–1740
Portela Filho CV, Ferreira FJF, Rosa Filho EF, Buchmann AC,
Rostirolla SP (2002) Estudo preliminar da conexao entre os
Aquıferos Serra Geral e Guarani com base em dados aero-
magnetometricos e hidroquımicos. [Serra Geral and Guarani
aquifer systems connection preliminary studies based in hydro-
chemical and aeromagnetometric data.] Paper presented at the
XII Congresso Brasileiro de Aguas Subterraneas, 2002, Flori-
anopolis. Aquıferos Transfronteiricos. Sao Paulo: Editora da
ABAS, 2002, vol 1. pp 74–86
Portela Filho CV, Ferreira FJF, Rosa Filho EF, Buchmann AC,
Rostirolla SP (2005) Compartimentacao magnetica-estrutural do
Sistema Aquıfero Serra Geral e sua conectividade com o Sistema
Aquıfero Guarani na regiao central do arco de Ponta Grossa
(Bacia do Parana). [Magnetic-structural compartmentation of
Serra Geral aquifer system and its connectivity to the Guarani
aquifer system in the central region of Ponta Grossa Arc (Parana
Basin).]. Rev Bras Geoci 3:369–381
Reginato PAR, Strieder AJ (2006) Integracao de dados geologicos na
prospeccao de aquıferos fraturados na Formacao Serra Geral.
[Integration of geologic data in the prospection of fracturated
aquifer at the Serra Geral formation.]. Rev Aguas Subterr
20(1):1–14
Rosa Filho EF, Montano JX, Duarte U (2007) Estudo do movimento das
aguas subterraneas do Sistema Aquıfero Guarani (SAG) atraves de
isotopos, no Parana, Sao Paulo e no Uruguai. [Guarani aquifer
system groundwater movement study by isotopes, on Parana, Sao
Paulo and Uruguai.] Rev Lat Am Hidrogeol Esp:109–121
Schuck MTO, Lisboa NA, Eick NC (1996) Analise e interpretacao
lito-estrutural de imagens. Uma aplicacao do conceito ‘‘multi’’
na faixa metamorfica ao sul de Santana da Boa Vista-RS.
[Images interpretation and analysis. An application of ‘‘multi’’
concept at metamorphic terrain of Santana da Boa Vista-RS.]
Paper presented at the II Simposio latino americano de
sensoriamento remoto, Gramado, RS, Brazil Ago 1986
Sracek O, Hirata R (2002) Geochemical and stable isotopic evolution
of the Guarani aquifer system in the state of Sao Paulo, Brazil.
Hydrogeol J 10:643–655
Szikszay M, Teissedre JM, Barner U, Matsui EE (1981) Geochemical
and isotopic characteristics of spring and groundwater in the
state of Sao Paulo, Brazil. J Hydrol 54:23–32
WHO (2002) Fluorides. Environmental Health Criteria 227. United
Nations Environmental Program. International Labour Organi-
zation, World Health Organization, Geneva
Environ Geol (2009) 58:1247–1255 1255
123