Analysis of flowering ability of regenerated Carlina acaulis subsp. simplex plants
Upload
khangminh22Category
view
2download
0
i
CAPACITY OF REGENERATED BONE CHAR IN REMOVAL OF FLUORIDE IN
TREATMENT OF DRINKING WATER
KANYORA AMOS KIMEMIA
Thesis Submitted to the Graduate School in Partial Fulfillment for the Requirements of
the Award of Degree of Master of Science in Chemistry of Egerton University
EGERTON UNIVERSITY
November 2014
ii
DECLARATION AND RECOMMENDATION
DECLARATION
This research is my original work and has not been presented for any award of a
degree in any institution.
Kanyora Amos Kimemia
Signature _________________ Date _________
SM11/2807/10
RECOMMENDATION
This thesis has been submitted for examination with our approval as supervisors
according to Egerton University regulations.
Dr. Kinyanjui.T
Egerton University
Signature _____________________ Date ________________
Prof. Chepkwony. C. K
Egerton University
Signature ____________________ Date ________________

iii
COPYRIGHTS
Copyright©2014 by Kanyora, A. Kimemia. All rights reserved. No part of this
publication may be reproduced, stored in a retrieval system, or transmitted in any form or by
any means, electric, mechanical, photocopying, recording, or otherwise, without the prior
written permission of the author or Egerton University.

iv
DEDICATION
This work is dedicated to my lovely parents Mr. and Mrs. Kanyora, My dear siblings
Beth, Irene, Ruth, and Andrew for their support and encouragement during my studies.
v
ACKNOWLEDGEMENT
I would like to appreciate the following individuals, organizations, and institutions:
1. The Egerton University for funding this project for Master of Science in Chemistry
and chemistry department for facilitating me during my study.
2. Catholic Diocese of Nakuru Defluoridation Company for assisting in fluoride
analysis, providing bone char used and for the technical assistance.
3. My supervisors, Prof C. K. Chepkwony and Dr. T. Kinyanjui for their guidance,
advice, constructive criticism, encouragement, and expertise, which were very useful
during the research.
4. I wish to pay gratitude to the technical staff in the Department of Chemistry; special
thanks to Mr. S. M. Kariuki, Mr. Onyiego, Mr. Mwanyika, Mr. Langat, and Mr.
Kamau for their assistance.
5. My family, friends, and colleagues for their support and encouragement to pursue and
achieve goals during my studies.
6. To Almighty God for the gift of life and health.

vi
ABSTRACT
Reuse of fluoride saturated bone char as a way of reducing fluoride in domestic water
was investigated. The study was aimed at determining the most effective solution (NaOH,
Na2CO3, NaHCO3 or Na3PO4) to use in the regeneration of fluoride saturated bone char.
Effect of temperature on regeneration and removal capacity of regenerated bone char is also
reported. Samples of 40 grams of bone char per 50 mL solution were used in determination of
effectiveness of different sodium solutions. Samples were taken at contact times of 0.5-24
hours for fluoride analysis. Determination of temperature effect was carried out using 40
grams bone char/ 50 mL 1% NaOH solution, one-hour contact time and temperature of 20-
60 . Removal capacity was determined using 40 grams bone char/ 50 mL natural water
containing 5.96-ppm fluoride at contact time of 20 minutes. Fluoride and pH of unknown
samples was analysed using fluoride and pH meter respectively. The data was analysed using
Two Way Analysis of Variance to compare the efficiency of different concentrations of
different solutions. NaOH solution was the most effective with 130.55-186.14 ppm and
lowest was NaHCO3 with 4.35-6.03 ppm of fluoride released from fluoride saturated bone
char. The efficiency of the four solutions was found to follow the order NaHCO3 <
Na2CO3<Na3PO4 < NaOH. Increasing regeneration temperature increased amount of fluoride
released from bone char. Regenerated bone char was able to treat about 6.85 litres of water
before breakthrough of 1.5 ppm as compared to fresh bone char that treated 7.56 litres.
Removal capacities were found to be 0.880 and 0.988 mg/g for regenerated and fresh bone
char respectively. The study confirmed that sodium hydroxide solution is the most effective
solution for regeneration. Regenerated bone char was found to be effective as fresh bone
char. In conclusion, regenerated bone char is a viable option for reducing excess fluoride in
drinking water. However, further investigation will be required to determine the most
effective and economical method for regeneration that is either bucket or continuous. The
findings from this research have potential of increasing the levels of renewable defluoridation
materials available to communities with challenges of excessive fluoride in drinking water.

vii
TABLE OF CONTENTS
DECLARATION AND RECOMMENDATION ............................................................... ii
COPYRIGHTS ................................................................................................................... iii
DEDICATION ................................................................................................................... iv
ACKNOWLEDGEMENT .................................................................................................. v
ABSTRACT ....................................................................................................................... vi
TABLE OF CONTENTS .................................................................................................. vii
LIST OF TABLES .............................................................................................................. x
LIST OF FIGURES ........................................................................................................... xi
LIST OF ABBREVIATIONS AND ACROYNMS .......................................................... xii
CHAPTER ONE ................................................................................................................. 1
INTRODUCTION ............................................................................................................... 1
1.1 Background Information .............................................................................................. 1
1.2 Statement of the Problem ............................................................................................. 2
1.3 Objectives .................................................................................................................... 3
1.3.1 General Objective .................................................................................................. 3
1.3.2 Specific Objectives ................................................................................................ 3
1.4 Hypotheses .................................................................................................................. 3
1.5 Justification ................................................................................................................. 3
CHAPTER TWO ................................................................................................................ 5
LITERATURE REVIEW ................................................................................................... 5
2.1 Occurrence of Fluoride in Environment ....................................................................... 5
2.2 Effects of Prolonged Ingestion of High Fluoride Concentrations .................................. 6
2.2.1 Dental Fluorosis .................................................................................................... 8
2.2.2 Skeletal Fluorosis .................................................................................................. 8
2.2.3 Neurological Complications .................................................................................. 8
2.2.4 Effect of Fluoride in Brain ..................................................................................... 9
2.3 Chemistry of Fluorosis ................................................................................................. 9
2.4 Sources of Fluoride ...................................................................................................... 9
2.5 Fluoride Removal Techniques .................................................................................... 11
2.5.1 Precipitation ........................................................................................................ 11
viii
2.5.2 Adsorption and Ion-Exchange ............................................................................. 12
2.5.3 Membrane Filtration Process ............................................................................... 12
2.5.4 Electrochemical Technique/ Electro coagulation.................................................. 12
2.5.5 Other Technologies ............................................................................................. 12
2.6 Bone char .................................................................................................................. 14
2.6.1 Production of Bone Char ..................................................................................... 15
2.6.2 Regeneration of Bone Char .................................................................................. 15
2.6.3 Challenges of Use of Bone Char as a Defluoridator ............................................. 17
CHAPTER THREE .......................................................................................................... 18
MATERIALS AND METHODS ...................................................................................... 18
3.1 Sample Collection and Preparation of Regenerated Bone Char ................................... 18
3.1.1 1000 ppm Fluoride Solution ................................................................................ 18
3.1.2 Four Percent Sodium Solutions ............................................................................ 18
3.1.3 Preparation of fluoride TISAB Solution ............................................................... 18
3.2 Experimental ............................................................................................................. 19
3.2.1 Normal Saturation of Bone Char.......................................................................... 19
3.2.2 Determining the most Effective Solution for Regeneration .................................. 19
3.2.3 Regeneration ....................................................................................................... 20
3.3 Effect of Temperature on Regeneration .................................................................. 20
3.4 Determination of Fluoride Removal Capacity and Efficiency ..................................... 21
3.4.1 Fluoride Removal Capacity ................................................................................. 22
3.4.2 Removal Efficiency ............................................................................................. 22
3.4.3 Fluoride Ion Measurements ................................................................................. 23
3.5 Data Analysis ............................................................................................................ 23
CHAPTER FOUR ............................................................................................................. 24
RESULTS AND DISCUSSION ........................................................................................ 24
4.1Normal Saturation of Bone Char ................................................................................. 24
4.2 Reactivation of Fluoride Saturated Bone Char ............................................................ 25
4.3 Effect of Temperature in Regeneration ....................................................................... 33
ix
4.4 Determination of efficiency of regenerated bone char ................................................ 35
CHAPTER FIVE .............................................................................................................. 39
CONCLUSIONS AND RECOMMENDATIONS ............................................................ 39
5.1 Conclusions ............................................................................................................... 39
5.2 Recommendations...................................................................................................... 39
REFERENCES .................................................................................................................. 41
APPENDICES ................................................................................................................... 50
APPENDIX 1: Two ANOVA for NaOH solution ............................................................. 50
APPENDIX 2: Two-way ANOVA for efficiency determination...................................... 51
x
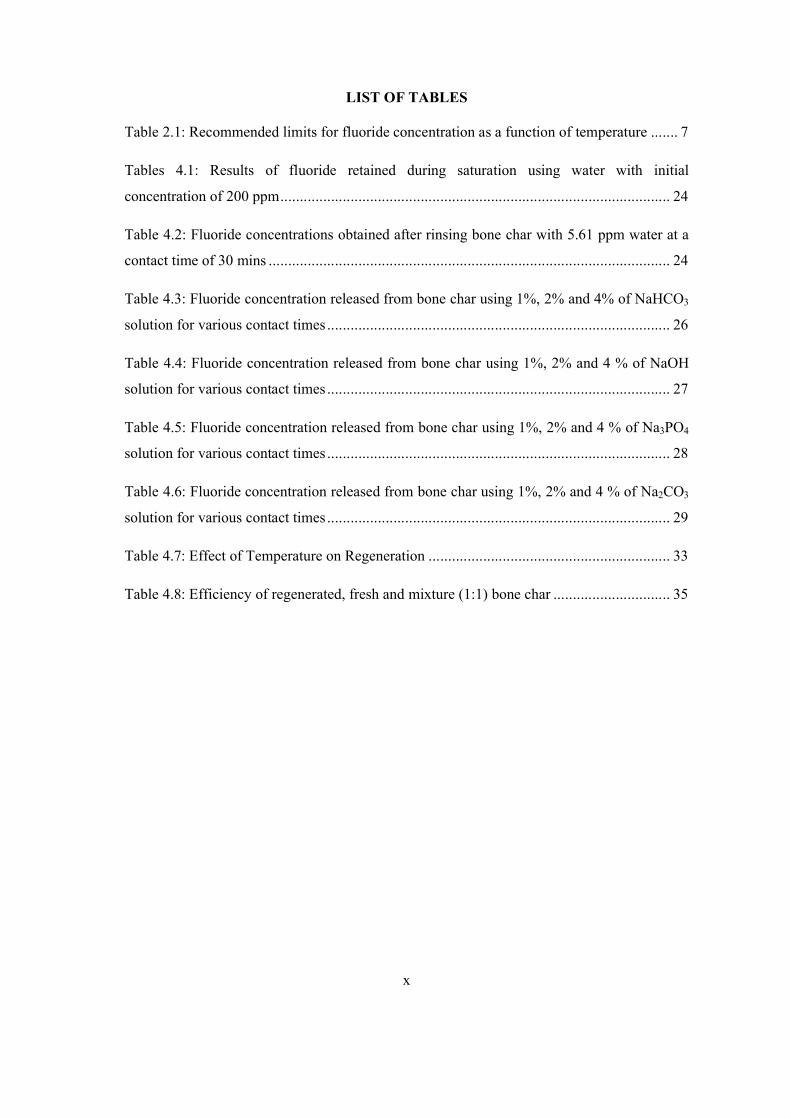
LIST OF TABLES
Table 2.1: Recommended limits for fluoride concentration as a function of temperature ....... 7
Tables 4.1: Results of fluoride retained during saturation using water with initial
concentration of 200 ppm .................................................................................................... 24
Table 4.2: Fluoride concentrations obtained after rinsing bone char with 5.61 ppm water at a
contact time of 30 mins ....................................................................................................... 24
Table 4.3: Fluoride concentration released from bone char using 1%, 2% and 4% of NaHCO3
solution for various contact times ........................................................................................ 26
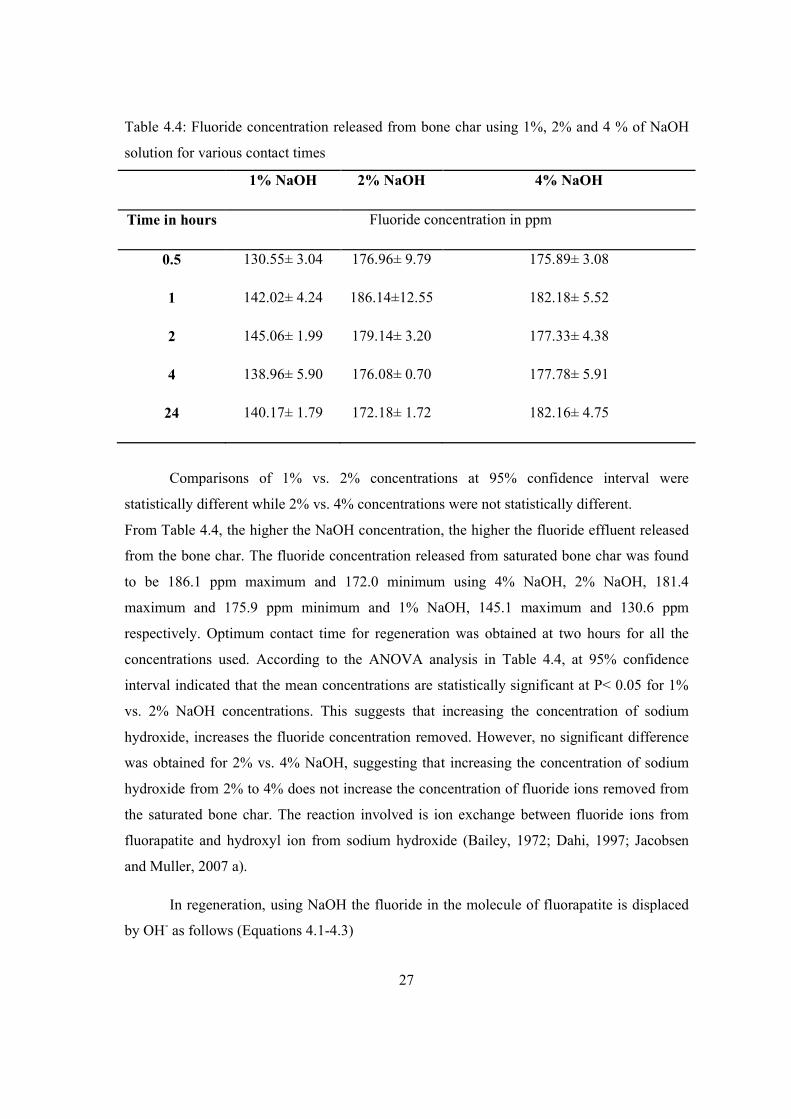
Table 4.4: Fluoride concentration released from bone char using 1%, 2% and 4 % of NaOH
solution for various contact times ........................................................................................ 27
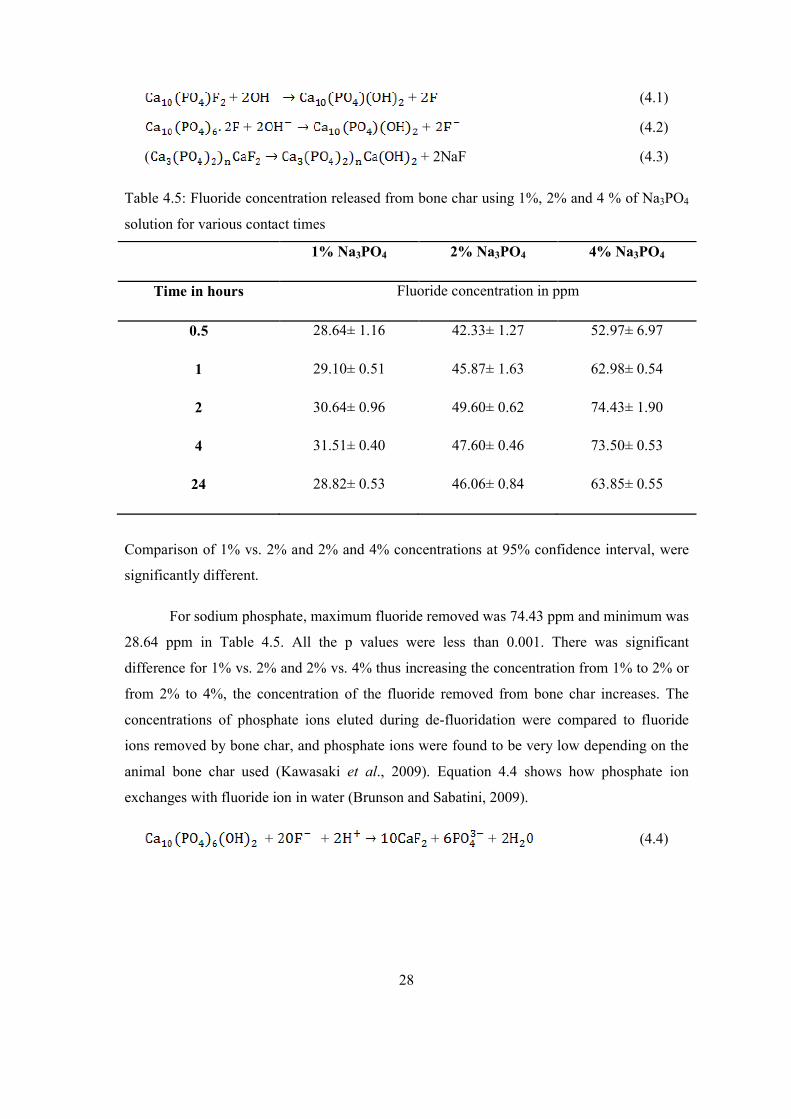
Table 4.5: Fluoride concentration released from bone char using 1%, 2% and 4 % of Na3PO4
solution for various contact times ........................................................................................ 28
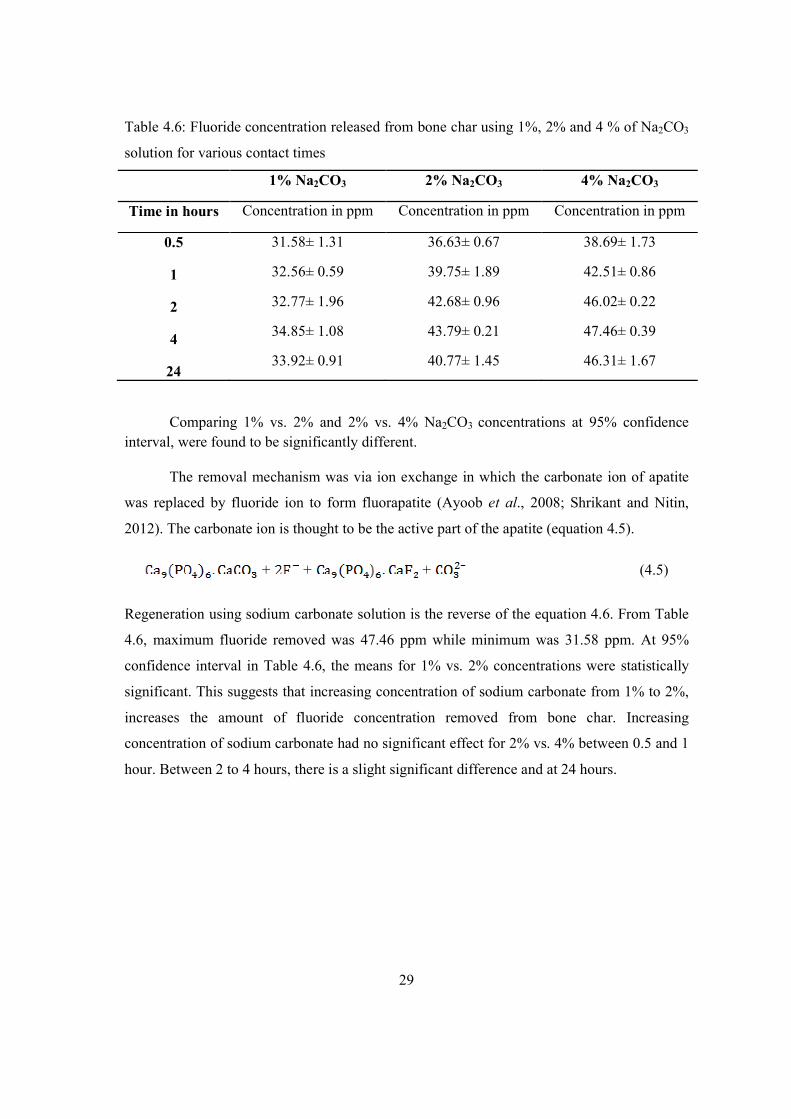
Table 4.6: Fluoride concentration released from bone char using 1%, 2% and 4 % of Na2CO3
solution for various contact times ........................................................................................ 29
Table 4.7: Effect of Temperature on Regeneration .............................................................. 33
Table 4.8: Efficiency of regenerated, fresh and mixture (1:1) bone char .............................. 35

xi
LIST OF FIGURES
Figure 2.1: Location of Countries with Endemic Fluorosis .................................................... 6
Figure 3.1: Sample of bone char .......................................................................................... 18
Figure 3.2: Summary of regeneration procedure .................................................................. 20
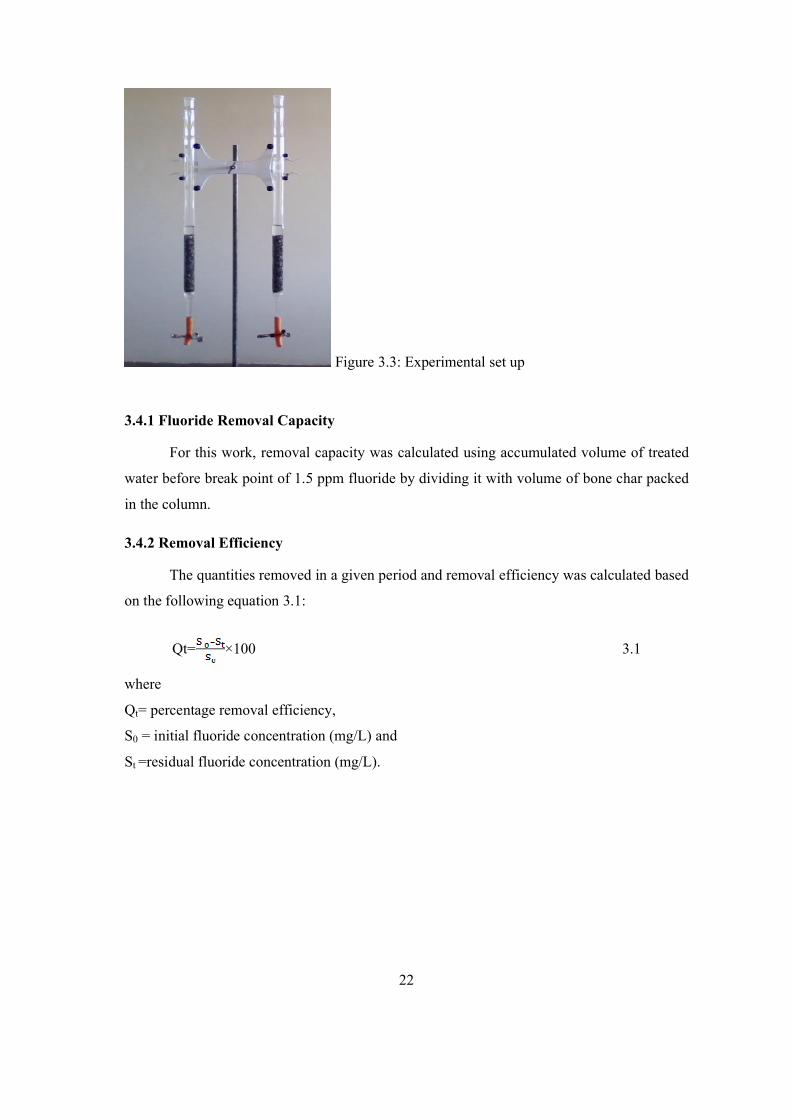
Figure 3.3: Experimental set up ........................................................................................... 22
Figure 4.1: Concentration of fluoride released by different sodium solutions of 4%
concentration. ...................................................................................................................... 30
Figure 4.2: Concentration of fluoride released by different sodium solutions of 2%
concentration....................................................................................................................... 30
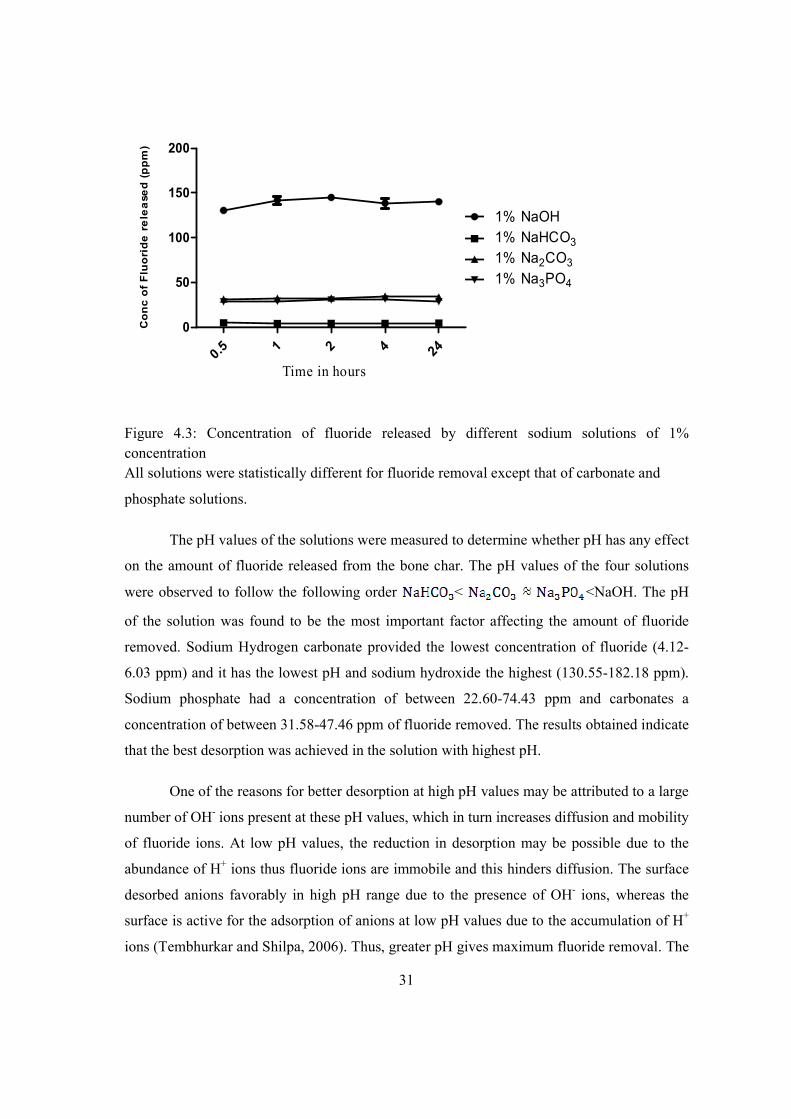
Figure 4.3: Concentration of fluoride released by different sodium solutions of 1%
concentration....................................................................................................................... 31
Figure 4.4: Fluoride concentration released as a function of the amount of treated water. .... 36
xii
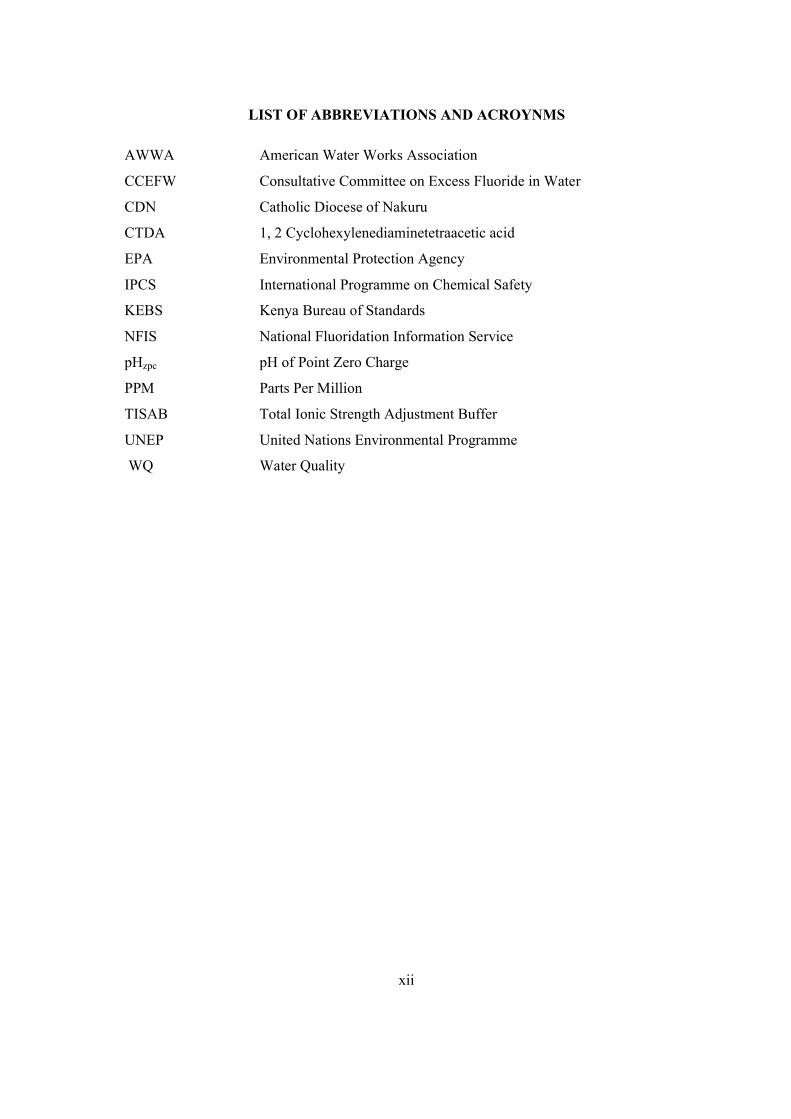
LIST OF ABBREVIATIONS AND ACROYNMS
AWWA American Water Works Association
CCEFW Consultative Committee on Excess Fluoride in Water
CDN Catholic Diocese of Nakuru
CTDA 1, 2 Cyclohexylenediaminetetraacetic acid
EPA Environmental Protection Agency
IPCS International Programme on Chemical Safety
KEBS Kenya Bureau of Standards
NFIS National Fluoridation Information Service
pHzpc pH of Point Zero Charge
PPM Parts Per Million
TISAB Total Ionic Strength Adjustment Buffer
UNEP United Nations Environmental Programme
WQ Water Quality
1
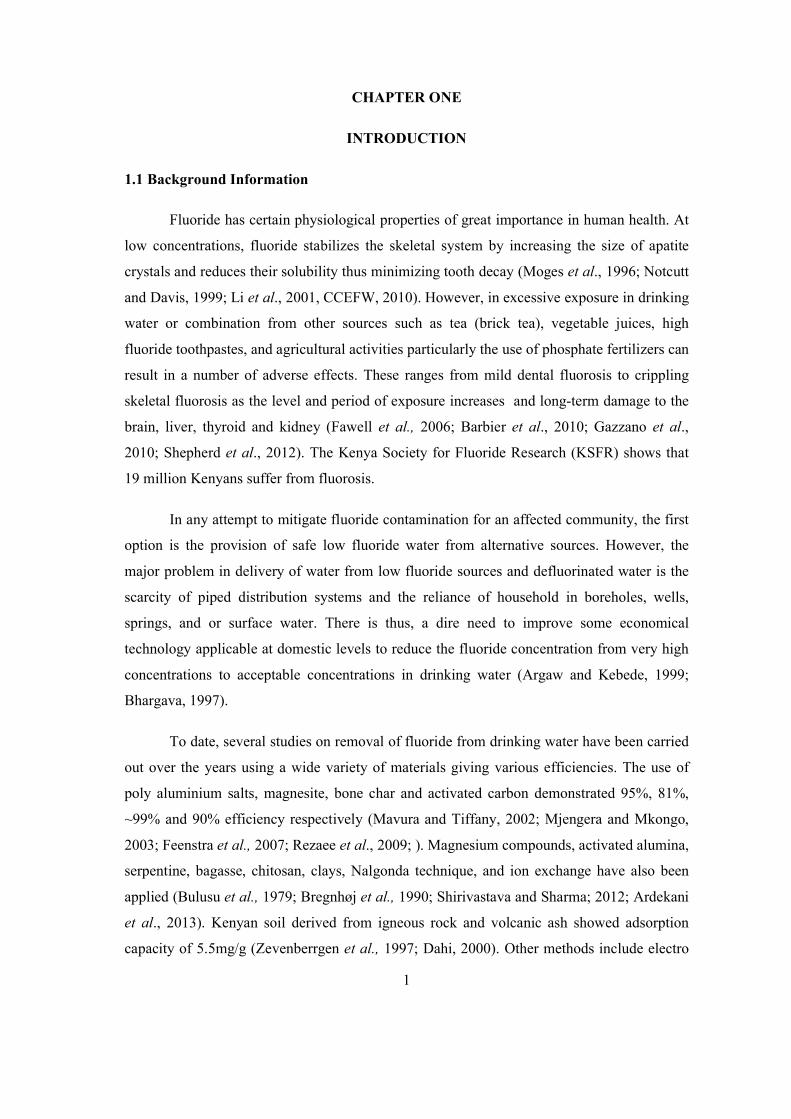
CHAPTER ONE
INTRODUCTION
1.1 Background Information
Fluoride has certain physiological properties of great importance in human health. At
low concentrations, fluoride stabilizes the skeletal system by increasing the size of apatite
crystals and reduces their solubility thus minimizing tooth decay (Moges et al., 1996; Notcutt
and Davis, 1999; Li et al., 2001, CCEFW, 2010). However, in excessive exposure in drinking
water or combination from other sources such as tea (brick tea), vegetable juices, high
fluoride toothpastes, and agricultural activities particularly the use of phosphate fertilizers can
result in a number of adverse effects. These ranges from mild dental fluorosis to crippling
skeletal fluorosis as the level and period of exposure increases and long-term damage to the
brain, liver, thyroid and kidney (Fawell et al., 2006; Barbier et al., 2010; Gazzano et al.,
2010; Shepherd et al., 2012). The Kenya Society for Fluoride Research (KSFR) shows that
19 million Kenyans suffer from fluorosis.
In any attempt to mitigate fluoride contamination for an affected community, the first
option is the provision of safe low fluoride water from alternative sources. However, the
major problem in delivery of water from low fluoride sources and defluorinated water is the
scarcity of piped distribution systems and the reliance of household in boreholes, wells,
springs, and or surface water. There is thus, a dire need to improve some economical
technology applicable at domestic levels to reduce the fluoride concentration from very high
concentrations to acceptable concentrations in drinking water (Argaw and Kebede, 1999;
Bhargava, 1997).
To date, several studies on removal of fluoride from drinking water have been carried
out over the years using a wide variety of materials giving various efficiencies. The use of
poly aluminium salts, magnesite, bone char and activated carbon demonstrated 95%, 81%,
~99% and 90% efficiency respectively (Mavura and Tiffany, 2002; Mjengera and Mkongo,
2003; Feenstra et al., 2007; Rezaee et al., 2009; ). Magnesium compounds, activated alumina,
serpentine, bagasse, chitosan, clays, Nalgonda technique, and ion exchange have also been
applied (Bulusu et al., 1979; Bregnhøj et al., 1990; Shirivastava and Sharma; 2012; Ardekani
et al., 2013). Kenyan soil derived from igneous rock and volcanic ash showed adsorption
capacity of 5.5mg/g (Zevenberrgen et al., 1997; Dahi, 2000). Other methods include electro
2
dialysis, distillation, reverse osmosis, crystalactor, and memstill technology, which are more
effective and can, remove fluoride to a suitable level. However, demand high cost, skilled
labor, and frequent regeneration of ion exchange beds or cleaning of the scaling and fouling
on the membrane further are becoming prohibitive in developing countries (Fawell et al.,
2006; Feenstra et al., 2007; Bhatnagar et al., 2011).
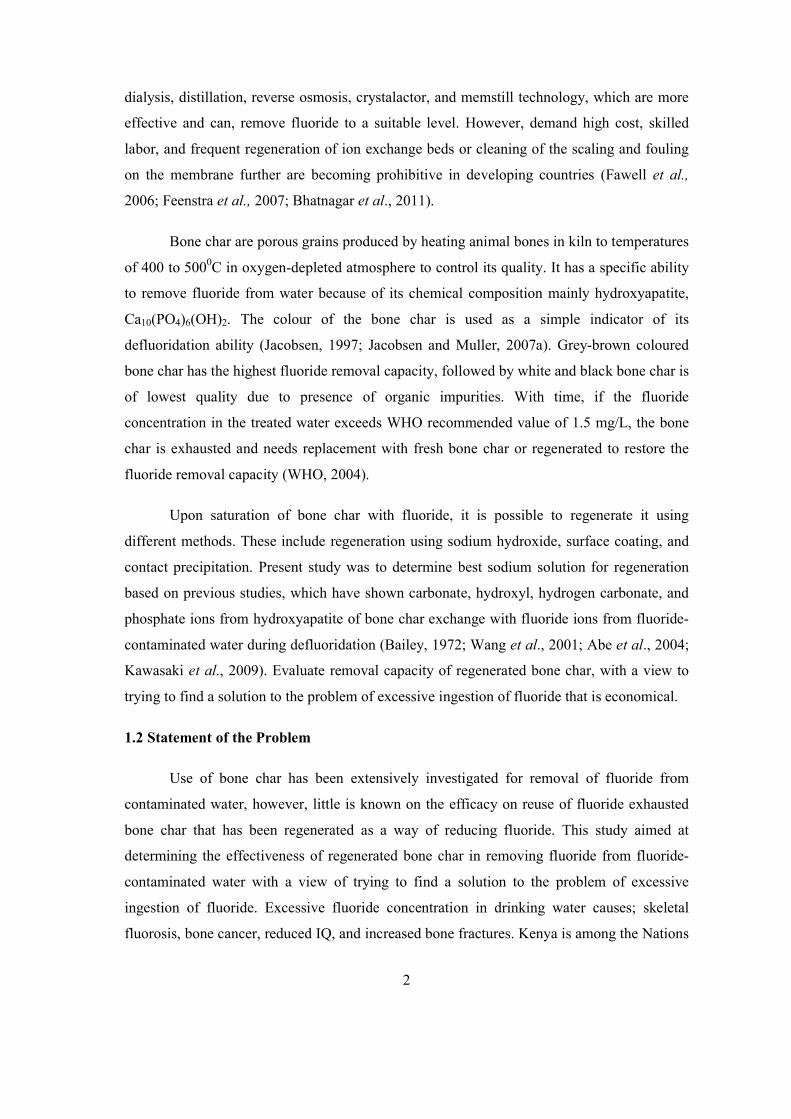
Bone char are porous grains produced by heating animal bones in kiln to temperatures
of 400 to 5000C in oxygen-depleted atmosphere to control its quality. It has a specific ability
to remove fluoride from water because of its chemical composition mainly hydroxyapatite,
Ca10(PO4)6(OH)2. The colour of the bone char is used as a simple indicator of its
defluoridation ability (Jacobsen, 1997; Jacobsen and Muller, 2007a). Grey-brown coloured
bone char has the highest fluoride removal capacity, followed by white and black bone char is
of lowest quality due to presence of organic impurities. With time, if the fluoride
concentration in the treated water exceeds WHO recommended value of 1.5 mg/L, the bone
char is exhausted and needs replacement with fresh bone char or regenerated to restore the
fluoride removal capacity (WHO, 2004).
Upon saturation of bone char with fluoride, it is possible to regenerate it using
different methods. These include regeneration using sodium hydroxide, surface coating, and
contact precipitation. Present study was to determine best sodium solution for regeneration
based on previous studies, which have shown carbonate, hydroxyl, hydrogen carbonate, and
phosphate ions from hydroxyapatite of bone char exchange with fluoride ions from fluoride-
contaminated water during defluoridation (Bailey, 1972; Wang et al., 2001; Abe et al., 2004;
Kawasaki et al., 2009). Evaluate removal capacity of regenerated bone char, with a view to
trying to find a solution to the problem of excessive ingestion of fluoride that is economical.
1.2 Statement of the Problem
Use of bone char has been extensively investigated for removal of fluoride from
contaminated water, however, little is known on the efficacy on reuse of fluoride exhausted
bone char that has been regenerated as a way of reducing fluoride. This study aimed at
determining the effectiveness of regenerated bone char in removing fluoride from fluoride-
contaminated water with a view of trying to find a solution to the problem of excessive
ingestion of fluoride. Excessive fluoride concentration in drinking water causes; skeletal
fluorosis, bone cancer, reduced IQ, and increased bone fractures. Kenya is among the Nations

3
around the globe where health problems occur due to the Great Rift Valley in Africa that has
naturally high concentrations of fluoride in ground water caused by past volcanic activity in
the area, interactions between volcanic sediments and water and lack of calcium in the area.
Various treatment technologies have been investigated. Some of these methods are not
sustainable due to inadequate technology and shortage of financial resources. Thus, there is a
need to examine the use of low cost, locally available materials for defluoridation of water in
these areas.
1.3 Objectives
1.3.1 General Objective
To assess the potential of regenerated bone char in removing fluoride ions from fluoride
contaminated water.
1.3.2 Specific Objectives
1. To determine the best sodium solution among NaOH, NaHCO3, Na3PO4, and Na2CO3
for regenerating fluoride-saturated bone char.
2. To determine the effect of temperature on regeneration process.
3. To compare the abilities regenerated and fresh bone char remove fluoride ions from
fluoride contaminated water.
4. To determine the ratio of regenerated to fresh bone char for optimum fluoride
removal.
1.4 Hypotheses
1. There is no significant difference in fluoride removal by use of different regenerants.
2. Temperature has no effect on regeneration efficacy process.
3. There is no significant difference of fluoride removal capacity and efficiency of
regenerated bone char to that of fresh bone char.
4. There is no significant difference in varying ratios of regenerated bone char to fresh
bone char for optimum fluoride removal.
1.5 Justification
Fluorosis is one of the most common health problems in areas containing high
fluoride concentration in drinking water. It is not curable and therefore treatment is
4
sophisticated and expensive. Thus, efforts should be directed towards attempting to alleviate
some of the symptoms (Fawell et al., 2006; CCFEW, 2010). The available ways for solving
this issue is controlling and eliminating the pollution of fluoride in drinking water,
researching into economic and practical methods of fluoride-removal agents and fluoride-
removal methods. The use of bone char is a cheaper alternative that has high removal power
and people centred approach that requires no daily dosage of chemicals. The materials used
are widely available and affordable to majority of Kenyans. Hence the need for evaluation of
the quality of regenerated bone char in fluoride removal because it can be cheaper in terms of
cost compared to replacement with fresh bone char. It also reduces the problem of emptying,
transportation and refilling of community and institution filters since regeneration is carried
on site.

5
CHAPTER TWO
LITERATURE REVIEW
2.1 Occurrence of Fluoride in Environment
Fluorine (F2) is a greenish diatomic gas, lightest member of halogens, and one of the
most reactive of all chemical elements. It is so reactive and never encountered in its elemental
gaseous state except in some industrial processes. It is the seventeenth in the order of
frequency of occurrence of the elements and represents about 0.06 to 0.09% of the earth’s
crust. Fluorides are found at significant levels in a wide variety of minerals including sellaite
(MgF2), fluorspar (CaF2) cryolite (Na3AlF6), fluorapatite (Ca3(PO4)3F), bastnaesite and
villanmite (NaF) (Bulusu et al., 1979; Murray, 1986). Cryolite is used for production of
aluminium and as a pesticide (USEPA, 1966) while fluorapatite is converted into phosphate
fertilizers.
The dominant controls on fluoride buildup in water are mainly geology, contact times
with fluoride minerals, groundwater chemical composition, and climate. Groundwater flow is
slow and reaction times between water and rocks are therefore enhanced (Redda et al., 2005).
Fluoride build up is less pronounced in the less humid tropics because of high rainfall inputs
and their diluting effects on groundwater chemical composition. Waters with high fluoride
concentrations occur in large and extensive geographical belts associated with a) sediments of
marine origin in mountainous areas b) volcanic rocks and c) granitic and gneissic rocks. A
typical example of the first extends from Iraq and Iran through Syria and Turkey to the
Mediterranean region, and then from Algeria to Morocco. Other important examples come
from the southern parts of the USA, southern Europe and the southern parts of the former
USSR (Fawell et al., 2006).
One of the regions of the world most affected by fluorosis is East Africa, specifically,
the East African Rift Valley possibly because fluorotic minerals are often carried by water. It
is more common to find fluoride rich soils in lowlands and valleys than in nearby highlands.
This phenomenon coupled with the high fluoride volcanic rocks in the East African Rift
result in significant amounts of fluoride in the Rift Valley (Bårdsen, 1997; Jagtap et al.,
2012).
6
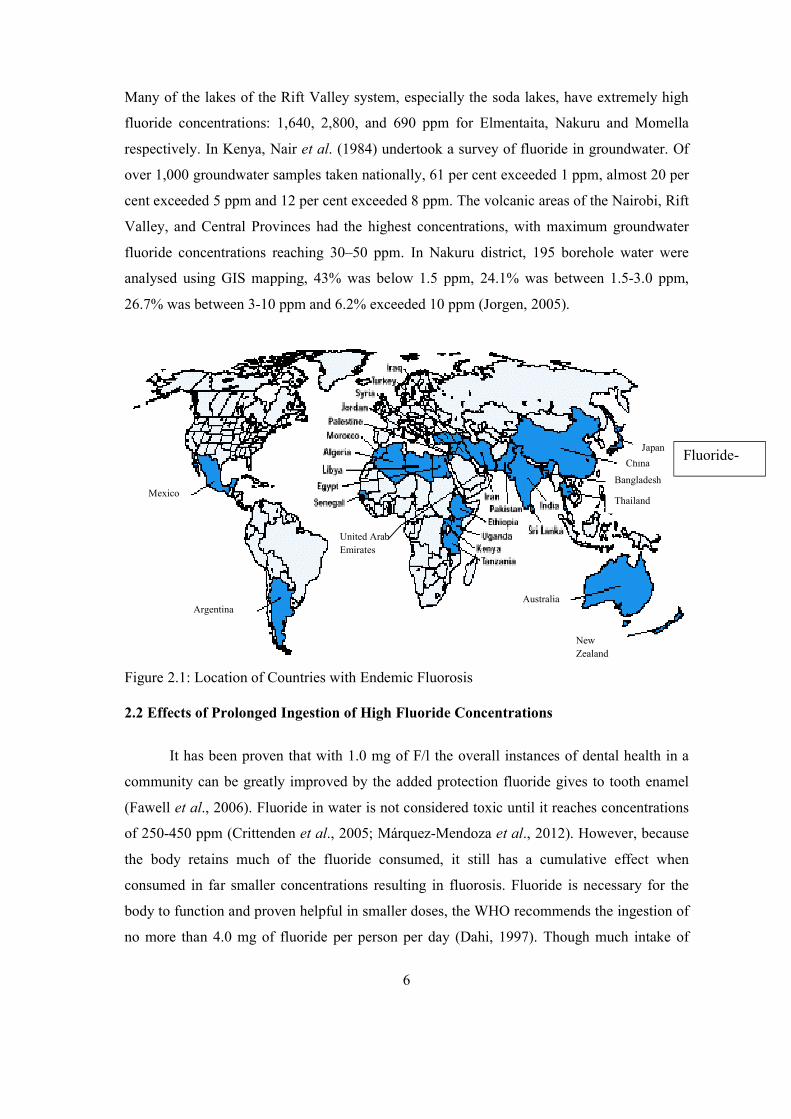
Many of the lakes of the Rift Valley system, especially the soda lakes, have extremely high
fluoride concentrations: 1,640, 2,800, and 690 ppm for Elmentaita, Nakuru and Momella
respectively. In Kenya, Nair et al. (1984) undertook a survey of fluoride in groundwater. Of
over 1,000 groundwater samples taken nationally, 61 per cent exceeded 1 ppm, almost 20 per
cent exceeded 5 ppm and 12 per cent exceeded 8 ppm. The volcanic areas of the Nairobi, Rift
Valley, and Central Provinces had the highest concentrations, with maximum groundwater
fluoride concentrations reaching 30–50 ppm. In Nakuru district, 195 borehole water were
analysed using GIS mapping, 43% was below 1.5 ppm, 24.1% was between 1.5-3.0 ppm,
26.7% was between 3-10 ppm and 6.2% exceeded 10 ppm (Jorgen, 2005).
Figure 2.1: Location of Countries with Endemic Fluorosis
2.2 Effects of Prolonged Ingestion of High Fluoride Concentrations
It has been proven that with 1.0 mg of F/l the overall instances of dental health in a
community can be greatly improved by the added protection fluoride gives to tooth enamel
(Fawell et al., 2006). Fluoride in water is not considered toxic until it reaches concentrations
of 250-450 ppm (Crittenden et al., 2005; Márquez-Mendoza et al., 2012). However, because
the body retains much of the fluoride consumed, it still has a cumulative effect when
consumed in far smaller concentrations resulting in fluorosis. Fluoride is necessary for the
body to function and proven helpful in smaller doses, the WHO recommends the ingestion of
no more than 4.0 mg of fluoride per person per day (Dahi, 1997). Though much intake of
United Arab
Emirates
Argentina
Mexico
New
Zealand
Australia
China
Bangladesh
Thailand
Japan Fluoride-
7
fluoride comes from food, it has been shown that the majority of occurrences of fluorosis
come from the consumption of water with excessive amounts of fluoride (Karthikeyan,
1997). Thus, the WHO limits fluoride concentrations in drinking and cooking water to 1.5
ppm (WHO, 1996). Many consider the limit incomplete; this suggested that the optimum
amount of fluoride in drinking water is approximately 0.5-1.0 ppm (Tekle et al., 1995).
Because it is not so much the concentration of the fluoride that is of concern, but rather the
total fluoride consumed, it has been suggested that a “sliding scale” of acceptable levels of
fluoride should be used based on the average maximum temperature (Bårdsen, 1997).
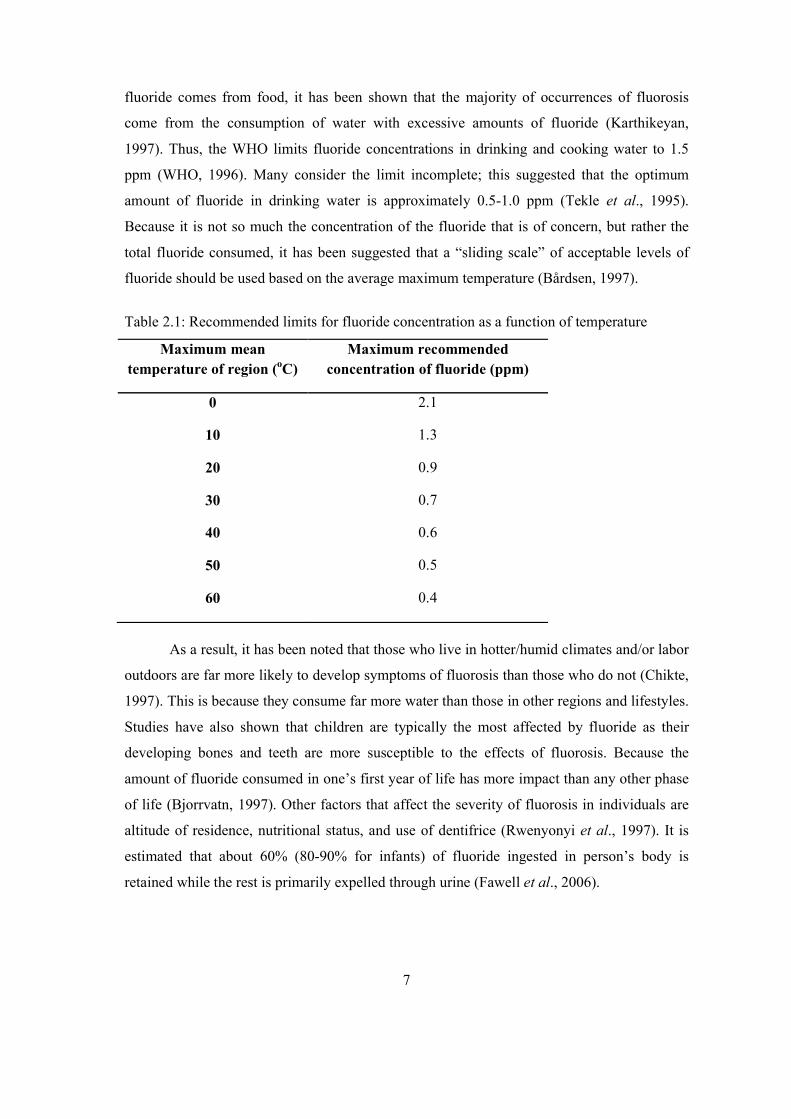
Table 2.1: Recommended limits for fluoride concentration as a function of temperature
Maximum mean
temperature of region (oC)
Maximum recommended
concentration of fluoride (ppm)
0 2.1
10 1.3
20 0.9
30 0.7
40 0.6
50 0.5
60 0.4
As a result, it has been noted that those who live in hotter/humid climates and/or labor
outdoors are far more likely to develop symptoms of fluorosis than those who do not (Chikte,
1997). This is because they consume far more water than those in other regions and lifestyles.
Studies have also shown that children are typically the most affected by fluoride as their
developing bones and teeth are more susceptible to the effects of fluorosis. Because the
amount of fluoride consumed in one’s first year of life has more impact than any other phase
of life (Bjorrvatn, 1997). Other factors that affect the severity of fluorosis in individuals are
altitude of residence, nutritional status, and use of dentifrice (Rwenyonyi et al., 1997). It is
estimated that about 60% (80-90% for infants) of fluoride ingested in person’s body is
retained while the rest is primarily expelled through urine (Fawell et al., 2006).

8
2.2.1 Dental Fluorosis
Dental fluorosis is the most common manifestation of over-consumption of fluoride.
It is visible by white, yellow, and brown streaks on the teeth, characteristic of the hypoplasia
and hypo calcification (WHO, 1984; Mcharo, 1986; Malik et al., 2010).This damage is more
than cosmetic, as it tends to be associated with painful "cavity-like" feelings. Additionally,
there are social stigmas against those suffering from fluorosis. While all teeth are affected,
the incisors (especially the maxillary incisors) and permanent molars are often the teeth most
affected by fluorosis. It is speculated that this is because these are the first teeth to develop.
According to Moturi et al., (2001) results of examination of children’s teeth in Njoro
Division showed that 48.3% of the children suffer from moderate to severe dental fluorosis.
In another study on incidence of dental fluorosis in Kenya, it was found that fluorosis
incidences among populations was 60% in Central, 30% in Rift Valley, 45% in Nairobi and
Eastern while in Coast and Western had 5% (Chibole, 1987).
2.2.2 Skeletal Fluorosis
Though it generally takes far more time, and higher concentrations (typically over 10
ppm) to develop, skeletal fluorosis is far more severe than its dental fluorosis. Skeletal
fluorosis can be detected early using radiological techniques. Skeletal fluorosis is
characterized by deformation of bone structure. Movement of the spine, pelvis, and joints
become increasing difficult as fluoride deposits collect on ligaments and tendons and within
the bones themselves. Fluoride levels beyond 10 mg/L result in crippling fluorosis, which is a
serious bone disorder resembling osteoporosis and characterized by extreme density and
hardness and abnormal fragility of the bones sometimes called “marble bones.” (Water
quality association, 2005)
2.2.3 Neurological Complications
There are increasing accounts of the neurological effects that fluoride can have in the
body. It is suspected that fluorides effects on the spine and compression on the spinal cord
(Meklan et al., 1997) cause neurological complications. Studies have shown that high levels
of fluoride can cause headaches and insomnia (CCEFW, 2010; Sharma and Parul, 2009;
WHO/IPCS, 2002).

9
2.2.4 Effect of Fluoride in Brain
A number of studies have attempted to quantify cognitive capacities in children in
terms of a measure of IQ as a function of the fluoride concentrations in their drinking water.
Most of these studies indicates that in endemic fluorosis areas, drinking water with high
fluoride levels adversely affect the development of children’s intelligence (Seraj et al., 2012;
Xiang et al., 2003; Lu et al., 2000). The ability of fluoride to enter in brain is enhanced by its
ability to form a liquid-soluble complex with aluminium. Aluminium-fluoride complexes
stimulate the guanine nucleotide binding proteins and can produce pharmacological and
toxicological effects in human cells (Lu et al., 2000). Most of these studies however provide
little information on a range of important factors including the validity of test instruments and
presence of potential confounding factors such as levels of parental education and income
(NFIS, 2011)
2.3 Chemistry of Fluorosis
The structural inorganic part of bones and teeth consist mainly of apatite, a mixture of
more hydroxyapatite (HAP), (Ca10(PO4)6(OH)2) and less fluorapatite (FAP), (Ca10(PO4)6F2).
In this structure, F- and OH- are interchangeable. The parts of the apatite molecules, which
are FAP, determine the properties of this hard tissue. At very low FAP ratios, teeth are easily
soluble under acidic conditions, meaning a higher risk of dental carries. At higher FAP ratios,
the solubility reduces. However, too high a ratio causes dental Fluorosis (Kaseva, 2006).
2.4 Sources of Fluoride
Drinking water is the largest single contributor to daily fluoride intake (Murray, 1986;
Vijaya et al., 2010). For a given individual, fluoride exposure (mgKg-1 of body weight per
day) via drinking water is determined by the fluoride level in the water and daily water
consumption (Fawell et al., 2006). Since some fluoride compounds in the earth’s upper crust
are soluble in water, fluoride is found in both surface and ground water. In streaming surface
fresh water, fluoride concentrations are usually lower than in groundwater because of the
shorter contact time between water and rock. The natural concentration of fluoride depends
on the geological, chemical, and physical characteristics of the aquifer, the porosity and
acidity of the soil and rocks, the temperature and the action of other chemical elements
(UNICEF, 2005). Another reason for high fluoride concentration in groundwater can be
absorption of uprising, subterranean gas containing high levels of fluoride.

10
Due to dust, industrial production of phosphate fertilizers, coal ash from the burning
of coal and volcanic activity, fluorides are widely distributed in the atmosphere. However, air
is only responsible for only a small fraction of total fluoride exposure (USNRC, 1993). In
non-industrial areas, the fluoride concentration in air are typically, low (Murray, 1986).
However, in areas where fluoride-containing coal is burned or phosphate fertilizers are
produced and used, the fluoride concentration is elevated leading to increased exposure by
the inhalation route. This has resulted to serious complications of osteo-dental fluorosis
(Ando et al., 2001).
Vegetables and fruits usually have low levels of fluoride and thus contribute little to
exposure, but higher levels have been found in barley, rice, yams, and cassava (Murray,
1986). Tea leaves contain high levels of fluoride (up to 400 mg Kg-1 dry weight) a view
supported by Cao et al., (2004) that tea has natural fluoride levels since the tea plants easily
absorb fluoride from the soil. Tibetans are known to ingest large amounts of fluoride about
14mg per day due to consumption of brick tea (tea made from older leaves that contains high
levels of fluoride than standard tea) as a beverage (Cao et al., 1997). On one hand, in the
study of Malde et al., (2006), the possible effect of original fluoride concentration in the
water on the fluoride release from tea was tested and the possible capacity of commercial tea
leaves to absorb fluoride from high-fluoride water. In low-fluoride water, fluoride is easily
released from tealeaves. Depending upon the fluoride content of the water, dried tealeaves
were also able to absorb fluoride. Thus, if a cup of tea is made from high-fluoride water, the
fluoride concentration of the infusion may actually be lower than the original fluoride
concentration of the water (Malde et al., 2006).
Fluoride contaminated trona has significantly contributed to the prevalence and
severity of dental fluorosis (Mabelya, 1997). Magadi soda, trona, contain fluoride in form of
villiaumite, NaF, kogarkoite, Na2SO4·NaF12,13, and the concentration varies considerably.
The use of Magadi heavily contaminated with fluoride contributes to the high fluoride intake
in fluorosis areas of East Africa. In some regions in China, significant dietary fluoride
exposure occurs due to the consumption of maize polluted by fly ash generated by the
burning of high fluoride coal (Chen, 1991).
11
2.5 Fluoride Removal Techniques
A wide range of defluoridation methods have been investigated and analysed, mainly
in laboratory. However many have been found to be inefficient in fluoride removal,
complicated maintenance and unaffordable costs especially in developing countries.
According to CCEFW (2010), in choosing a technology suitable for the Kenya context, the
following should be considered; Possible negative impacts, such as the consequences of
wrong dosing of chemicals, possible chemical residuals in treated water, cost of
defluoridation methods (both plant investment, and running costs) and scale of defluoridation
/ scale of service. The common methods used for the removal of fluoride from drinking water
can be divided into the following four categories. They include precipitation, adsorption and
ion exchange, membrane filtration process and electrochemical technique (Feenstra et al.,
2007; Malik et al., 2010):
2.5.1 Precipitation
Precipitation processes involve addition of chemicals and formation of fluoride
precipitates. Precipitation can be divided into two categories, those based on co precipitation
of adsorbed fluoride and those based on the precipitation of insoluble fluoride compounds.
Among these are precipitations with calcium and aluminium salts. Precipitation chemicals
must be added daily in batches and precipitation techniques produce a certain amount of
sludge every day. Examples include Nalgonda, poly aluminium chloride (PAC) and contact
precipitation (Fawell et al., 2006). Nalgonda technique is process by which aluminium salts
(aluminium chloride and aluminium sulphate) is added to fluoride contaminated drinking
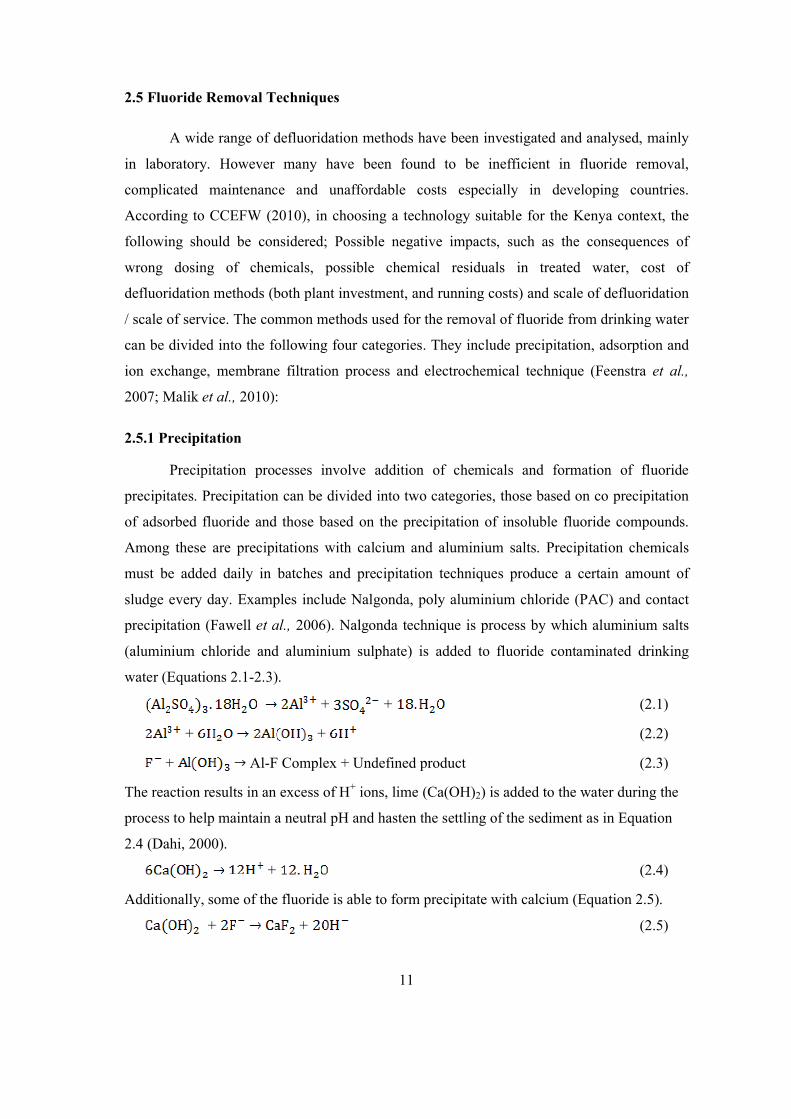
water (Equations 2.1-2.3).
+ + (2.1)
+ + (2.2)
+ Al-F Complex + Undefined product (2.3)
The reaction results in an excess of H+ ions, lime (Ca(OH)2) is added to the water during the
process to help maintain a neutral pH and hasten the settling of the sediment as in Equation
2.4 (Dahi, 2000).
+ (2.4)
Additionally, some of the fluoride is able to form precipitate with calcium (Equation 2.5).
+ + (2.5)
12
2.5.2 Adsorption and Ion-Exchange
Adsorption processes involve the passage of water through a contact bed where
fluoride is removed by ion exchange or surface chemical reaction with the solid bed matrix.
After a period of operation, a saturated column must be refilled or regenerated. The different
adsorbents used for fluoride removal include activated alumina, carbon, bone charcoal, and
synthetic ion exchange resins. Examples include; activated alumina (Al2O3), clay and soils,
and ion exchange resins.
2.5.3 Membrane Filtration Process
Reverse osmosis, Nano filtration and electro dialysis are membrane filtration
processes that can be used for removal of fluoride. Large-scale electro dialysis plants are
already used for making drinking water out of brackish water with high fluoride
concentrations (Zakia et al., 2001; Diawara et al, 2003). In many parts of North Africa, water
is brackish and contains over 1.5 mg/L fluoride. All elements in water can be reduced by
membrane filtration. Thus, this method is proposed to be the best water purification process
available. Nevertheless, 30 % of raw water is lost in the process.
2.5.4 Electrochemical Technique/ Electro coagulation
It is a simple and efficient method for the treatment of potable water. Electro
coagulation (EC) uses aluminium anodes, in EC cell, the aluminiun electrodes sacrifice
themselves to form aluminiun ions first (Mameri et al., 1998; Yang and Dlutty, 2002).
Afterwards the aluminiun ions are transformed to Al(OH)3 before being polymerized to
Al(OH)3 floc, which is believed to adsorb fluoride strongly as illustrated by the equation
(2.6):
+ + (2.6)
The EC operation is completed by an electroflottation in order to separate the formed floc
from water by floating them to the surface cell.
2.5.5 Other Technologies
They include crystalactor, memstill technology, and solar dew collector system
(Fawell et al., 2006).
13
The Solar Dew Collector System
Solar Dew developed a new porous membrane to purify water using solar energy
(Solar, 2007). Water sweats through the membrane, evaporates on the membrane’s surface
and increases the air humidity in the evaporation chamber. Based on a temperature
difference, pure water condenses on the cooler surfaces of the system. The product water
quality is very constant and similar to that of distilled water. The quantity depends on the
intensity of the solar radiation. To avoid crystallization, the brine has to be drained
periodically. The system is able to process: sea brackish, contaminated wastewater with
heavy metals, oil residue, boron, fluoride with an allowable pH range of 5-11 (Feenstra et al.,
2007).
Memstill Technology
The Netherlands Organization of Applied Scientific Research has developed a
membrane based distillation concept, which radically improves the economy and ecology of
existing desalination technology for seawater and brackish water. This "Memstill technology"
combines multistage flash and multi-effect distillation modes into one membrane module
(Hanemaaijer et al., 2007). Cold feed water takes up heat in the condenser channel through
condensation of water vapour, after which a small amount of (waste) heat is added, and flows
counter currently back via the membrane channel. Driven by the small-added heat, water
evaporates through the membrane, and discharged as cold condensate. The cooled brine is
disposed, or extra concentrated in a next module. With the Memstill technology, anions like
fluoride and arsenic are also removed.
Crystalactor
The Crystalactor is a type of contact precipitator that was developed in the
Netherlands (Giessen, 1998). The Crystalactor is a fluidized-bed type crystallizer also called
a pellet reactor. In the reactor, fluoride is removed from the water while calcium fluoride
pellets with a diameter of 1 mm are produced. Cost comparisons show that the total treatment
costs are typically in the range of 25% of the costs for conventional precipitation. However,
the Crystalactor is more suitable for wastewaters with high fluoride concentrations > 10 ppm
(Feenstra et al., 2007).
14
2.6 Bone char
The use of bone char as a defluoridator started in USA in the 1940s through 1960s
where it was commercially available because of its large-scale use in the sugar industry to
absorb colour and inorganic ash impurities from sugar (AWWA, 1971). Today synthetic ion
exchange resins have replaced bone char. Later research carried out by the Intercountry
Centre for Oral Health (ICOH) in 1981 to 1983 in Thailand came up with ICOH filter
(Phantumvanit et al., 1988). Since then bone char use has been tested both in and outside
Thailand. In Kenya, bone char defluoridation was first tested in laboratory in batch and
column in late 1998 (Korir et al., 2009). The technique as developed and marketed by the
Catholic Diocese of Nakuru Water Quality offers four different types of defluoridation filters
ranging from household filters, institutional, community to waterworks filters.
Bone char contains about 10% carbon (C) by weight with the remainder comprising
mainly of hydroxyapatite, (Ca10(PO4)6(OH)2) but also a significant percentage of calcium
carbonate (CaCO3). The carbon, however, accounts for half the total surface area of the
product and CaCO3 gives bone char its alkaline properties (Lewis, 1995; Guedes et al., 2007).
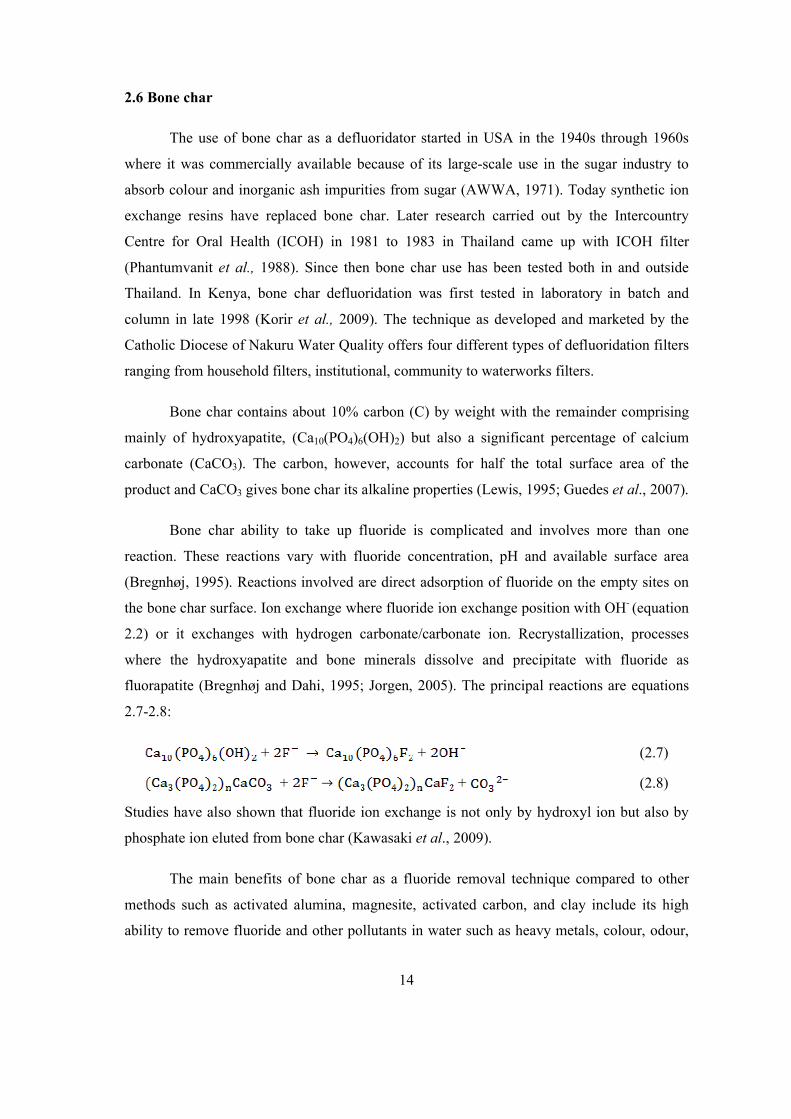
Bone char ability to take up fluoride is complicated and involves more than one
reaction. These reactions vary with fluoride concentration, pH and available surface area
(Bregnhøj, 1995). Reactions involved are direct adsorption of fluoride on the empty sites on
the bone char surface. Ion exchange where fluoride ion exchange position with OH- (equation
2.2) or it exchanges with hydrogen carbonate/carbonate ion. Recrystallization, processes
where the hydroxyapatite and bone minerals dissolve and precipitate with fluoride as
fluorapatite (Bregnhøj and Dahi, 1995; Jorgen, 2005). The principal reactions are equations
2.7-2.8:
+ + (2.7)
+ + (2.8)
Studies have also shown that fluoride ion exchange is not only by hydroxyl ion but also by
phosphate ion eluted from bone char (Kawasaki et al., 2009).
The main benefits of bone char as a fluoride removal technique compared to other
methods such as activated alumina, magnesite, activated carbon, and clay include its high
ability to remove fluoride and other pollutants in water such as heavy metals, colour, odour,
15
and taste (Sudaratn and Thares, 2010). Bone char can be re-used upon saturation by
discarding it as fertilizer and soil conditioner, which is environmentally acceptable (Fawell et
al., 2006). Bone char defluoridation is based on materials that are readily available locally
and affordable (Mavura et al., 2002).
2.6.1 Production of Bone Char
Bones delivered from local butcheries are heated in a kiln to high temperatures of
400-500 0C in an oxygen-depleted atmosphere to control the quality (Jacobsen and Muller,
2007a). The required temperature and duration of heating depend largely on the batch size
and the packing rather than the type or the nature of the bone (Dahi et al., 1997).
The bone char separated manually from the metal pieces and separated according to
its colour, where black ones are stored and added to the next charring batch. Grey-brownish
and white bone char are then separately crushed using crushing machine and sieved to
produce three different particle sizes. Powder and fine fraction (< 0.63 mm) used for the
production of calcium phosphate pellets for contact precipitation. Medium (0.63-2 mm) is
used in community and household filters and coarse (2-4 mm) is used in community filter.
Homogenizing the size of the particles is to optimize both flow rate and removal capacity.
Dust and other impurities from the charring and crushing process are removed by washing
and then the bone char is dried for safe storage and use (Jacobsen and Muller 2007a).
According to Albertus et al., (2000), charring can be carried out in two ways: As
calcinations where bones are heated in the presence of continuous supply of oxygen from
atmospheric air or as pyrolysis where no oxygen is present during heating. In calcinations, the
organic carbon converted to CO2 that is stripped off while in pyrolysis the organic carbon is
converted to inorganic carbon that remains in the bone char. Calcined bones are brown-grey–
white depending on the accessibility of the oxygen while pyrolyzed bones are black.
2.6.2 Regeneration of Bone Char
Upon saturation with fluoride, bone char can be regenerated through; surface coating,
contact precipitation, and use of sodium hydroxide. Christoffersen et al., (1991) studied
surface coating in the laboratory. According to this process, fluoride-saturated bone char is
immersed in an acidic solution of calcium and phosphate or of bone char powder and it takes
up a fresh layer of hydroxyapatite, (Ca10(PO4)6(OH)2) on its surface. The surface coated bone
char behaves as fresh bone char and can absorb a new amount of fluorides.
16
Contact precipitation method involves the addition of calcium and phosphate
compounds to the raw water prior to its flow through the fluoride saturated bone char filter
(Dahi, 1996; Jacobsen and Muller, 2007b; Korir et al., 2009). In a mixed solution of calcium,
phosphate and fluoride, the precipitation of calcium fluoride and/or fluorapatite is
theoretically possible, but practically impossible due to reaction inertness (Fawell et al.,
2006). The precipitation is easily catalysed in a contact bed that acts as the filter for the
precipitate, using calcium chloride and sodium dihydrogen phosphate or “monosodium
phosphate.” Equations 2.9 and 2.10 illustrate that the removal of fluoride; by contact
precipitation involves dissolution and equations 2.11 and 2.12 show precipitations of calcium
fluoride and fluorapatite respectively.
+ + (2.9)
+ + + (2.10)
Calcium fluoride: + (2.11)
Fluorapatite: +10 + (2.12)
Studies on the use of a 1-8% solution of sodium hydroxide for bone char regeneration
before it is used have been reported and the mechanism is assumed to be ion exchange
between fluoride and the hydroxyl ions (equations 2.13 & 2.14) (Horowitz et al., 1972 ;
Mcharo, 1986; Christoffersen et al., 1991; Jacobsen and Muller 2007 a).:
+ + (2.13)
These reactions can be represented by the following equations:
+ + (2.14)
Caustic soda of the calcium phosphate medium is usually followed by an acid rinse to
remove residual caustic. The carbonic acid (dissolved CO2) method for neutralizing excess
residual caustic prolongs the activity of both tricalcium phosphate and hydroxyl apatite.
The exhausted bone char media can also be reactivated by heating (Wang et al., 2001;
Kaseva, 2006).The bone char is then exposed to solution of sodium hydroxide. The
mechanism that takes place is as shown in the following equation 2.15.

17
Ca10(PO4)6F2 + 2OH- Heat Ca10(PO4)6 + 2HF + O2 (2.15)
Conditions necessary for the above regeneration of bone char are temperature and contact
time. The efficiency of bone char was found to improve as the temperature and contact time
were increased.
2.6.3 Challenges of Use of Bone Char as a Defluoridator
Some of the challenges facing defluoridation are; religious beliefs, for instance use of
bone char originating from cows among Hindus, pigs among Muslims. Nevertheless,
according to Fawell et al., (2006), from scientific point of view, all types of bones are equally
good as raw materials, but in such cases, the problem can be solved through information and
production of bone char in accordance with local acceptability. In Kenya, the CDN is trying
to address the problem through education where they target students, teachers, and
community at large; they network with stakeholders in health and water sectors. Other
challenges may be poor quality mainly due to incomplete charring, overheating of bones
especially if oxygen is admitted to the heated bone char, and inhomogeneous heating. All
these can change taste of defluoridated water (Fawell et al., 2006).
The bone char has other uses than fluoride removal, such as in sugar industries, due to
active carbon, which has high surface area and the unique ability to absorb colour and
inorganic impurities from, sugar, used in artistic painting, making pottery (Mameri et al.,
1998; Ghaneian et al., 2012). It has also been used in removal of metals like Mn (II), Pb (II),
Cr (III), As (V) Cu and Zn from wastewater (Wilson et al., 2000; Chen et al., 2008; Brum et
al., 2010). It can also be used as fertilizer (Warren et al., 2009).
18
CHAPTER THREE
MATERIALS AND METHODS
3.1 Sample Collection and Preparation of Regenerated Bone Char
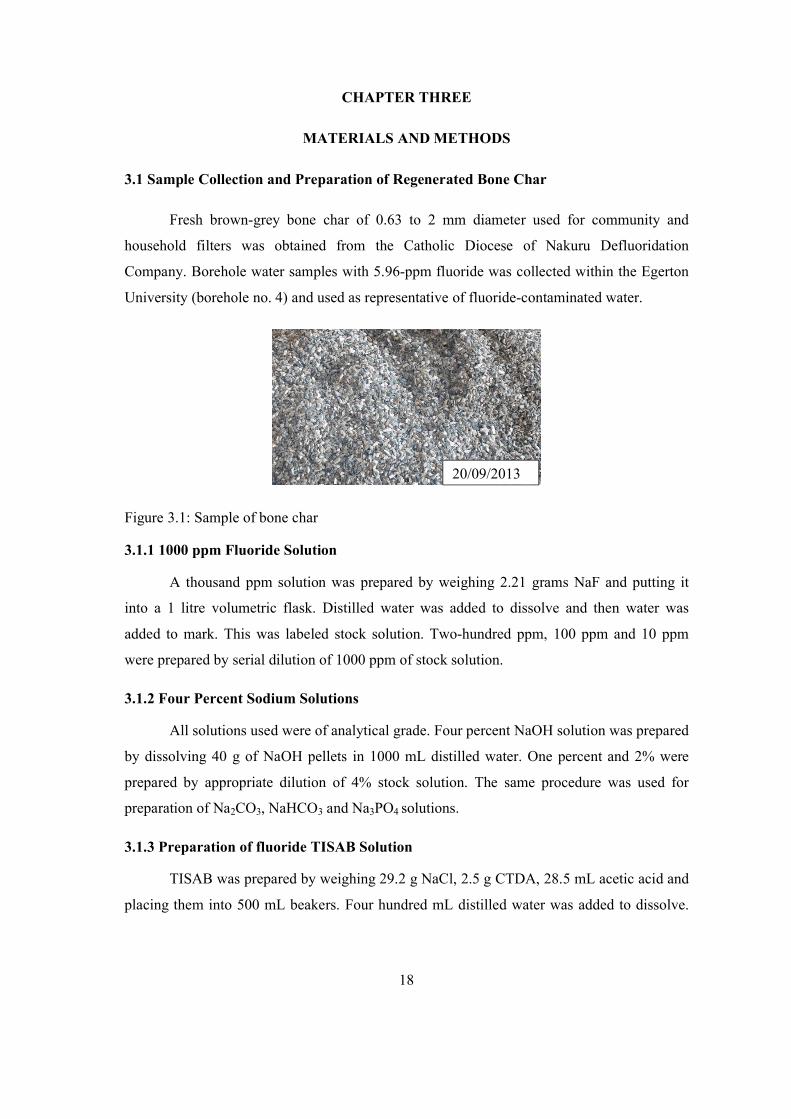
Fresh brown-grey bone char of 0.63 to 2 mm diameter used for community and
household filters was obtained from the Catholic Diocese of Nakuru Defluoridation
Company. Borehole water samples with 5.96-ppm fluoride was collected within the Egerton
University (borehole no. 4) and used as representative of fluoride-contaminated water.
Figure 3.1: Sample of bone char
3.1.1 1000 ppm Fluoride Solution
A thousand ppm solution was prepared by weighing 2.21 grams NaF and putting it
into a 1 litre volumetric flask. Distilled water was added to dissolve and then water was
added to mark. This was labeled stock solution. Two-hundred ppm, 100 ppm and 10 ppm
were prepared by serial dilution of 1000 ppm of stock solution.
3.1.2 Four Percent Sodium Solutions
All solutions used were of analytical grade. Four percent NaOH solution was prepared
by dissolving 40 g of NaOH pellets in 1000 mL distilled water. One percent and 2% were
prepared by appropriate dilution of 4% stock solution. The same procedure was used for
preparation of Na2CO3, NaHCO3 and Na3PO4 solutions.
3.1.3 Preparation of fluoride TISAB Solution
TISAB was prepared by weighing 29.2 g NaCl, 2.5 g CTDA, 28.5 mL acetic acid and
placing them into 500 mL beakers. Four hundred mL distilled water was added to dissolve.
20/09/2013
19
pH was then adjusted to pH 5.5 with 6 M NaOH. It was then transferred into 500 mL
volumetric flask and diluted to mark with distilled water.
3.2 Experimental
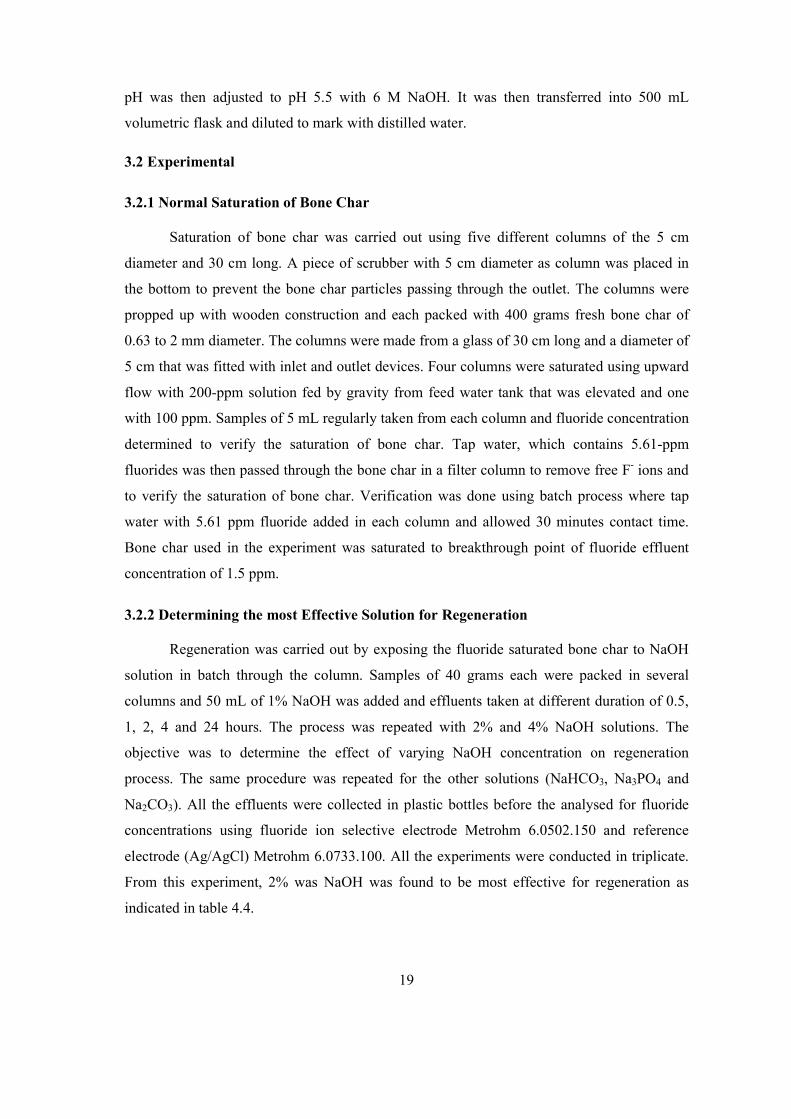
3.2.1 Normal Saturation of Bone Char
Saturation of bone char was carried out using five different columns of the 5 cm
diameter and 30 cm long. A piece of scrubber with 5 cm diameter as column was placed in
the bottom to prevent the bone char particles passing through the outlet. The columns were
propped up with wooden construction and each packed with 400 grams fresh bone char of
0.63 to 2 mm diameter. The columns were made from a glass of 30 cm long and a diameter of
5 cm that was fitted with inlet and outlet devices. Four columns were saturated using upward
flow with 200-ppm solution fed by gravity from feed water tank that was elevated and one
with 100 ppm. Samples of 5 mL regularly taken from each column and fluoride concentration
determined to verify the saturation of bone char. Tap water, which contains 5.61-ppm
fluorides was then passed through the bone char in a filter column to remove free F- ions and
to verify the saturation of bone char. Verification was done using batch process where tap
water with 5.61 ppm fluoride added in each column and allowed 30 minutes contact time.
Bone char used in the experiment was saturated to breakthrough point of fluoride effluent
concentration of 1.5 ppm.
3.2.2 Determining the most Effective Solution for Regeneration
Regeneration was carried out by exposing the fluoride saturated bone char to NaOH
solution in batch through the column. Samples of 40 grams each were packed in several
columns and 50 mL of 1% NaOH was added and effluents taken at different duration of 0.5,
1, 2, 4 and 24 hours. The process was repeated with 2% and 4% NaOH solutions. The
objective was to determine the effect of varying NaOH concentration on regeneration
process. The same procedure was repeated for the other solutions (NaHCO3, Na3PO4 and
Na2CO3). All the effluents were collected in plastic bottles before the analysed for fluoride
concentrations using fluoride ion selective electrode Metrohm 6.0502.150 and reference
electrode (Ag/AgCl) Metrohm 6.0733.100. All the experiments were conducted in triplicate.
From this experiment, 2% was NaOH was found to be most effective for regeneration as
indicated in table 4.4.

20
3.2.3 Regeneration
Regeneration of fluoride bone char to be used in determination of removal capacity
was carried out using 2% sodium hydroxide solution. Samples of the effluent were taken at
different times and analyzed for F- concentration to ensure complete fluoride removal. Fresh
bone char was used as control that is to determine whether all fluoride in bone char has been
completely removed from fluoride saturated bone char. After fluoride removal, bone char was
washed with distilled water to reduce pH and to remove all the free fluoride ions. Further, pH
was reduced by use of 0.02M HCl enriched water in place of the carbonic acid. pH was
determined using a pH meter (Orion Combination pH 91-06).Finally; excess acid was rinsed
using distilled water. Effluent should have a pH of 6.5 to 8.5 according to WHO
recommended values. Bone char was dried for safe storage and use. Regenerated bone char
was obtained and used to study fluoride removal capacity and efficiency.
Figure 3.2: Summary of regeneration procedure
3.3 Effect of Temperature on Regeneration
Most regeneration studies are conducted at room temperature in laboratory settings.
However, in real life situations temperatures above or below 25 °C depending on
Drying
2 % NaOH to remove fluoride from F- saturated bone
char
Rinsing with distilled water to
remove free fluoride ions
Neutralizing using 0.02M
HCl acid
Rinsing excess acid with
distilled water
21
environment are often met. Therefore it is important to understand what impact temperature
has on the regeneration.
Forty grams of fluoride saturated bone char was placed in 150- mL plastic bottle; to it,
50 mL of 1% NaOH was added. Shaken in water bath at 20 for one hour. Thereafter, the
medium was separated by filtration through Whatman No. 42 filter paper and the filtrate
analysed for desorbed fluoride. The procedure was then repeated at different temperatures of
30, 40, 50 and 60 oC. The fluoride released was plotted against temperature.
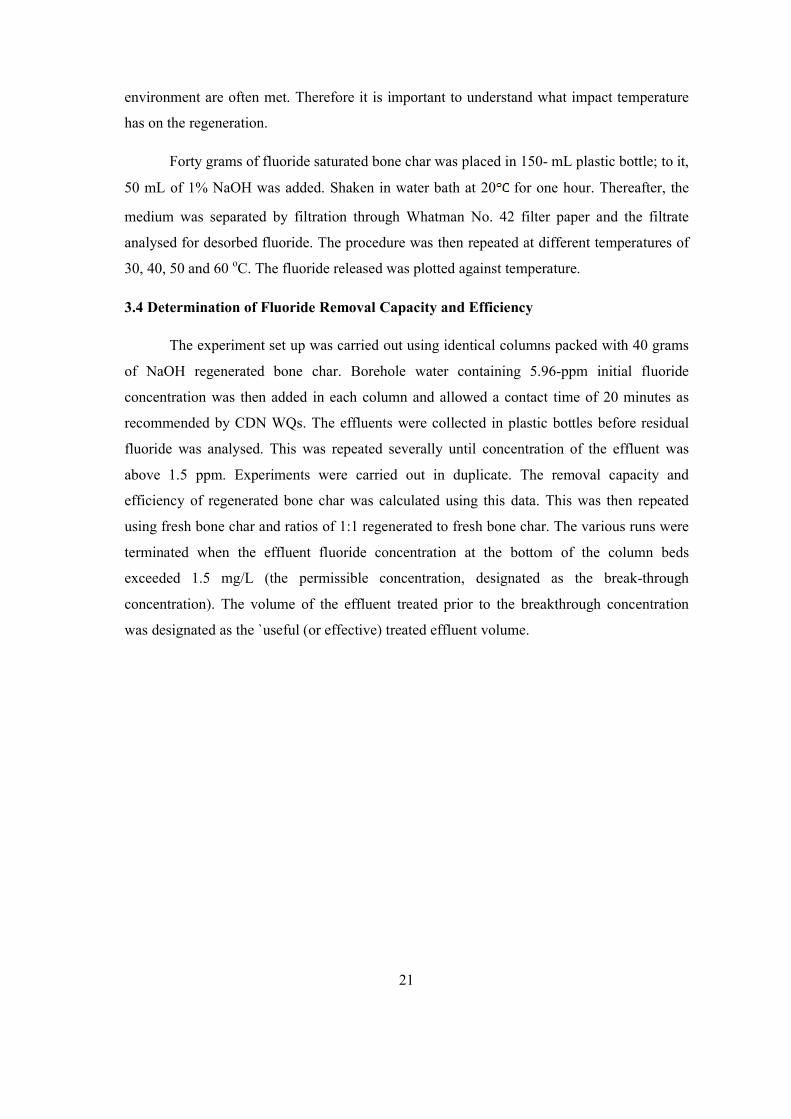
3.4 Determination of Fluoride Removal Capacity and Efficiency
The experiment set up was carried out using identical columns packed with 40 grams
of NaOH regenerated bone char. Borehole water containing 5.96-ppm initial fluoride
concentration was then added in each column and allowed a contact time of 20 minutes as
recommended by CDN WQs. The effluents were collected in plastic bottles before residual
fluoride was analysed. This was repeated severally until concentration of the effluent was
above 1.5 ppm. Experiments were carried out in duplicate. The removal capacity and
efficiency of regenerated bone char was calculated using this data. This was then repeated
using fresh bone char and ratios of 1:1 regenerated to fresh bone char. The various runs were
terminated when the effluent fluoride concentration at the bottom of the column beds
exceeded 1.5 mg/L (the permissible concentration, designated as the break-through
concentration). The volume of the effluent treated prior to the breakthrough concentration
was designated as the `useful (or effective) treated effluent volume.
22
Figure 3.3: Experimental set up
3.4.1 Fluoride Removal Capacity
For this work, removal capacity was calculated using accumulated volume of treated
water before break point of 1.5 ppm fluoride by dividing it with volume of bone char packed
in the column.
3.4.2 Removal Efficiency
The quantities removed in a given period and removal efficiency was calculated based
on the following equation 3.1:
Qt= ×100 3.1
where
Qt= percentage removal efficiency,
S0 = initial fluoride concentration (mg/L) and
St =residual fluoride concentration (mg/L).

23
3.4.3 Fluoride Ion Measurements
Fluoride analysis was done using standard method (ALPHA, 1995). The
concentration of fluoride ions in the solutions was determined using a selective electrode
fluoride ion selective electrode Metrohm 6.0502.150 and reference electrode (Ag/AgCl)
Metrohm 6.0733.100.
Reference standards were made from appropriate dilutions of the stock solution of
sodium fluoride (NaF) 100 mg/L and Total Ion Strength Adjusting Buffer (TISAB) solution.
A water sample of 5 mL was transferred into a 25 mL plastic beaker by means of a measuring
pipette. After rinsing the pipette by distilled water, 5 mL of TISAB was measured and
transferred into the beaker containing the water sample. The electrodes were immersed into
the sample and stirred slowly for 30 s, and then the specific pH ion meter was switched on in
order to read the voltage when a steady state was reached. A TISAB buffer was added a prior
to measurement to attain constant pH and break up fluoride complexes.
3.5 Data Analysis
MSTAT-C, 1993 and Excel-2007 software were used for data analysis. Results were
expressed as mean ± standard deviation. Two-way Analysis of Variance was carried out to
determine significance difference of varying concentrations of various sodium solutions at
selected conditions using a p value of 0.05 and to determine significant differences of the
regenerated bone char compared to that of fresh bone char in terms of fluoride removal
capacity and removal efficiency. The Bonferroni test was used for posttest’s analyses.
24
CHAPTER FOUR
RESULTS AND DISCUSSION
4.1Normal Saturation of Bone Char
Normal saturation in this context is the concentration of fluoride in the effluent water
and this is equal to 1.5-ppm fluoride (WHO recommended value).
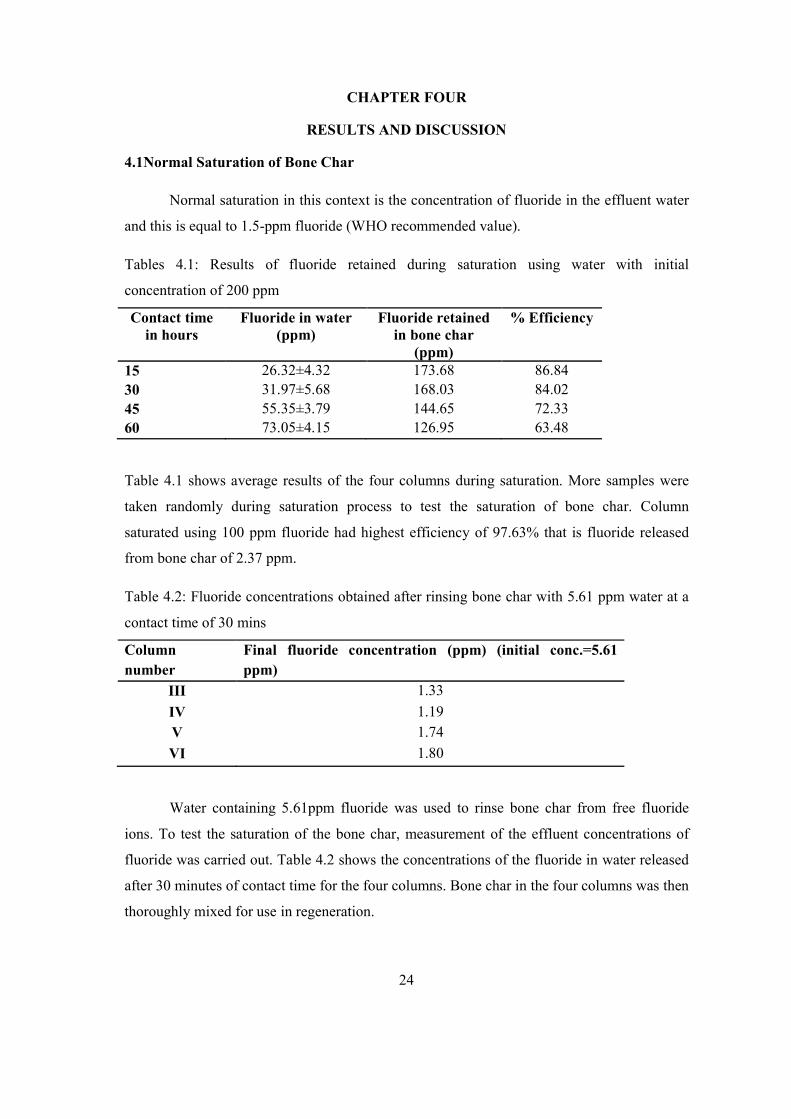
Tables 4.1: Results of fluoride retained during saturation using water with initial
concentration of 200 ppm
Contact time in hours
Fluoride in water (ppm)
Fluoride retained in bone char
(ppm)
% Efficiency
15 26.32±4.32 173.68 86.84
30 31.97±5.68 168.03 84.02
45 55.35±3.79 144.65 72.33
60 73.05±4.15 126.95 63.48
Table 4.1 shows average results of the four columns during saturation. More samples were
taken randomly during saturation process to test the saturation of bone char. Column
saturated using 100 ppm fluoride had highest efficiency of 97.63% that is fluoride released
from bone char of 2.37 ppm.
Table 4.2: Fluoride concentrations obtained after rinsing bone char with 5.61 ppm water at a
contact time of 30 mins
Column
number
Final fluoride concentration (ppm) (initial conc.=5.61
ppm)
III 1.33
IV 1.19
V 1.74
VI 1.80
Water containing 5.61ppm fluoride was used to rinse bone char from free fluoride
ions. To test the saturation of the bone char, measurement of the effluent concentrations of
fluoride was carried out. Table 4.2 shows the concentrations of the fluoride in water released
after 30 minutes of contact time for the four columns. Bone char in the four columns was then
thoroughly mixed for use in regeneration.
25
From the results, the highest removal efficiency was found to be 97.63%, which had
initial fluoride concentration of 100 ppm and a contact time of four hours. Previous studies
indicated that bone char had high efficiency of between 97.4-99.8 % (Mavura and Tiffany,
2002; Korir et al., 2009). The highest efficiency of 97.63% had 2.37 ppm fluoride in water.
This is an indication that the concentration was above the WHO guideline value of 1.5 ppm.
Therefore, even though bone char has very high efficiency, it cannot be used to remove
fluoride from waters with high concentrations up to 100 ppm and above for human
consumption.
During the verification of normal saturation of bone char (Table 4.2), it was found
that columns V and VI had fluoride concentrations of 1.74 and 1.80 ppm respectively slightly
above breakthrough point of 1.5 ppm that is WHO guideline value while that of columns III
and IV were 1.33 and 1.19 ppm respectively. The bone char the four columns was mixed for
use in regeneration step.
4.2 Reactivation of Fluoride Saturated Bone Char
Fluoride ion is known to exchange with hydroxyl, carbonate, hydrogen carbonate, and
phosphate ions of bone char during fluoride removal from water using bone char (Bailey,
1972; Abe et al., 2004; Kawasaki, 2009). The purpose of using different sodium solutions
was to determine whether regeneration is possible. During reactivation of fluoride saturated
bone char, three different concentrations of NaOH were used to determine optimum fluoride
removal: 1%, 2%, and 4% NaOH solution respectively. The same procedure was repeated
using Na2CO3, NaHCO3 and Na3PO4 solutions in order to determine the best solutions of
fluoride regeneration. Tables 4.3 through 4.6 show the results obtained for fluoride released
from fluoride saturated bone char for the four solutions at different concentrations.
26
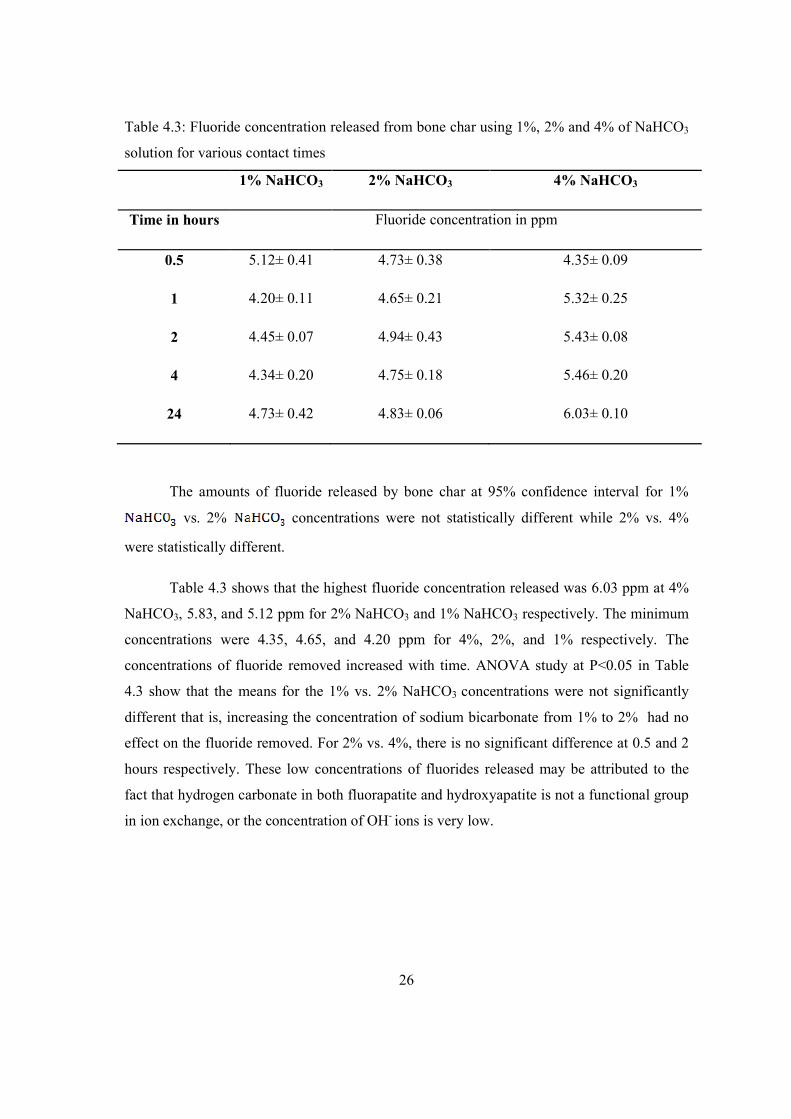
Table 4.3: Fluoride concentration released from bone char using 1%, 2% and 4% of NaHCO3
solution for various contact times
1% NaHCO3 2% NaHCO3 4% NaHCO3
Time in hours Fluoride concentration in ppm
0.5
1
2
4
24
5.12± 0.41
4.20± 0.11
4.45± 0.07
4.34± 0.20
4.73± 0.42
4.73± 0.38
4.65± 0.21
4.94± 0.43
4.75± 0.18
4.83± 0.06
4.35± 0.09
5.32± 0.25
5.43± 0.08
5.46± 0.20
6.03± 0.10
The amounts of fluoride released by bone char at 95% confidence interval for 1%
vs. 2% concentrations were not statistically different while 2% vs. 4%
were statistically different.
Table 4.3 shows that the highest fluoride concentration released was 6.03 ppm at 4%
NaHCO3, 5.83, and 5.12 ppm for 2% NaHCO3 and 1% NaHCO3 respectively. The minimum
concentrations were 4.35, 4.65, and 4.20 ppm for 4%, 2%, and 1% respectively. The
concentrations of fluoride removed increased with time. ANOVA study at P<0.05 in Table
4.3 show that the means for the 1% vs. 2% NaHCO3 concentrations were not significantly
different that is, increasing the concentration of sodium bicarbonate from 1% to 2% had no
effect on the fluoride removed. For 2% vs. 4%, there is no significant difference at 0.5 and 2
hours respectively. These low concentrations of fluorides released may be attributed to the
fact that hydrogen carbonate in both fluorapatite and hydroxyapatite is not a functional group
in ion exchange, or the concentration of OH- ions is very low.
27
Table 4.4: Fluoride concentration released from bone char using 1%, 2% and 4 % of NaOH
solution for various contact times
1% NaOH 2% NaOH 4% NaOH
Time in hours Fluoride concentration in ppm
0.5
1
2
4
24
130.55± 3.04
142.02± 4.24
145.06± 1.99
138.96± 5.90
140.17± 1.79
176.96± 9.79
186.14±12.55
179.14± 3.20
176.08± 0.70
172.18± 1.72
175.89± 3.08
182.18± 5.52
177.33± 4.38
177.78± 5.91
182.16± 4.75
Comparisons of 1% vs. 2% concentrations at 95% confidence interval were
statistically different while 2% vs. 4% concentrations were not statistically different.
From Table 4.4, the higher the NaOH concentration, the higher the fluoride effluent released
from the bone char. The fluoride concentration released from saturated bone char was found
to be 186.1 ppm maximum and 172.0 minimum using 4% NaOH, 2% NaOH, 181.4
maximum and 175.9 ppm minimum and 1% NaOH, 145.1 maximum and 130.6 ppm
respectively. Optimum contact time for regeneration was obtained at two hours for all the
concentrations used. According to the ANOVA analysis in Table 4.4, at 95% confidence
interval indicated that the mean concentrations are statistically significant at P< 0.05 for 1%
vs. 2% NaOH concentrations. This suggests that increasing the concentration of sodium
hydroxide, increases the fluoride concentration removed. However, no significant difference
was obtained for 2% vs. 4% NaOH, suggesting that increasing the concentration of sodium
hydroxide from 2% to 4% does not increase the concentration of fluoride ions removed from
the saturated bone char. The reaction involved is ion exchange between fluoride ions from
fluorapatite and hydroxyl ion from sodium hydroxide (Bailey, 1972; Dahi, 1997; Jacobsen
and Muller, 2007 a).
In regeneration, using NaOH the fluoride in the molecule of fluorapatite is displaced
by OH- as follows (Equations 4.1-4.3)
28
+ + (4.1)
+ + (4.2)
( + 2NaF (4.3)
Table 4.5: Fluoride concentration released from bone char using 1%, 2% and 4 % of Na3PO4
solution for various contact times
1% Na3PO4 2% Na3PO4 4% Na3PO4
Time in hours Fluoride concentration in ppm
0.5
1
2
4
24
28.64± 1.16
29.10± 0.51
30.64± 0.96
31.51± 0.40
28.82± 0.53
42.33± 1.27
45.87± 1.63
49.60± 0.62
47.60± 0.46
46.06± 0.84
52.97± 6.97
62.98± 0.54
74.43± 1.90
73.50± 0.53
63.85± 0.55
Comparison of 1% vs. 2% and 2% and 4% concentrations at 95% confidence interval, were
significantly different.
For sodium phosphate, maximum fluoride removed was 74.43 ppm and minimum was
28.64 ppm in Table 4.5. All the p values were less than 0.001. There was significant
difference for 1% vs. 2% and 2% vs. 4% thus increasing the concentration from 1% to 2% or
from 2% to 4%, the concentration of the fluoride removed from bone char increases. The
concentrations of phosphate ions eluted during de-fluoridation were compared to fluoride
ions removed by bone char, and phosphate ions were found to be very low depending on the
animal bone char used (Kawasaki et al., 2009). Equation 4.4 shows how phosphate ion
exchanges with fluoride ion in water (Brunson and Sabatini, 2009).
+ + + + (4.4)
29
Table 4.6: Fluoride concentration released from bone char using 1%, 2% and 4 % of Na2CO3
solution for various contact times
1% Na2CO3 2% Na2CO3 4% Na2CO3
Time in hours Concentration in ppm Concentration in ppm Concentration in ppm
0.5
1
2
4
24
31.58± 1.31
32.56± 0.59
32.77± 1.96
34.85± 1.08
33.92± 0.91
36.63± 0.67
39.75± 1.89
42.68± 0.96
43.79± 0.21
40.77± 1.45
38.69± 1.73
42.51± 0.86
46.02± 0.22
47.46± 0.39
46.31± 1.67
Comparing 1% vs. 2% and 2% vs. 4% Na2CO3 concentrations at 95% confidence
interval, were found to be significantly different.
The removal mechanism was via ion exchange in which the carbonate ion of apatite
was replaced by fluoride ion to form fluorapatite (Ayoob et al., 2008; Shrikant and Nitin,
2012). The carbonate ion is thought to be the active part of the apatite (equation 4.5).
+ + + (4.5)
Regeneration using sodium carbonate solution is the reverse of the equation 4.6. From Table
4.6, maximum fluoride removed was 47.46 ppm while minimum was 31.58 ppm. At 95%
confidence interval in Table 4.6, the means for 1% vs. 2% concentrations were statistically
significant. This suggests that increasing concentration of sodium carbonate from 1% to 2%,
increases the amount of fluoride concentration removed from bone char. Increasing
concentration of sodium carbonate had no significant effect for 2% vs. 4% between 0.5 and 1
hour. Between 2 to 4 hours, there is a slight significant difference and at 24 hours.

30
0.5 1 2 4 24
0
50
100
150
200
250
4% NaOH
4% NaHCO3
4% Na2CO3
4% Na3PO4
Tim e in Hours
Co
nc
of
Flu
ori
de
re
lea
se
d (
pp
m)
Figure 4.1: Concentration of fluoride released by different sodium solutions of 4%
concentration.
0.5 1 2 4 24
0
50
100
150
200
2% NaOH
2% NaHCO3
2% Na2CO3
2% Na3PO4
Tim e in Hours
Co
nc
of
Flu
ori
de
re
lea
se
d (
pp
m)
Figure 4.2: Concentration of fluoride released by different sodium solutions of 2%
concentration
All the four solutions were found to be statistically different except 2% for carbonate vs.
phosphate solutions.
31
0.5 1 2 4 24
0
50
100
150
200
1% NaOH
1% NaHCO3
1% Na2CO3
1% Na3PO4
Time in hours
Co
nc
of
Flu
ori
de
re
lea
se
d (
pp
m)
Figure 4.3: Concentration of fluoride released by different sodium solutions of 1%
concentration
All solutions were statistically different for fluoride removal except that of carbonate and
phosphate solutions.
The pH values of the solutions were measured to determine whether pH has any effect
on the amount of fluoride released from the bone char. The pH values of the four solutions
were observed to follow the following order < <NaOH. The pH
of the solution was found to be the most important factor affecting the amount of fluoride
removed. Sodium Hydrogen carbonate provided the lowest concentration of fluoride (4.12-
6.03 ppm) and it has the lowest pH and sodium hydroxide the highest (130.55-182.18 ppm).
Sodium phosphate had a concentration of between 22.60-74.43 ppm and carbonates a
concentration of between 31.58-47.46 ppm of fluoride removed. The results obtained indicate
that the best desorption was achieved in the solution with highest pH.
One of the reasons for better desorption at high pH values may be attributed to a large
number of OH- ions present at these pH values, which in turn increases diffusion and mobility
of fluoride ions. At low pH values, the reduction in desorption may be possible due to the
abundance of H+ ions thus fluoride ions are immobile and this hinders diffusion. The surface
desorbed anions favorably in high pH range due to the presence of OH- ions, whereas the
surface is active for the adsorption of anions at low pH values due to the accumulation of H+
ions (Tembhurkar and Shilpa, 2006). Thus, greater pH gives maximum fluoride removal. The
32
other contribution could be the contents of these ions in bone char or their arrangement -
determine the contents) carbonate composition is less, phosphate bonds are stronger and
hydrogen carbonate. Previous studies indicated that lower pH values, bone char will be
positively charged, and thus it should have a higher affinity for fluoride making it a viable
adsorbent for fluoride removal (Abe et al., 2004).
The major regeneration process therefore, involves ion exchange between hydroxyl
ions in solution and fluoride ions from the fluorapatite according to equation 4.6.
+ + (4.6)
This reaction readily occurs because fluoride ion and hydroxide ion have the same charge and
radius (Bregnhøj, 1995; Chidambaram et al., 2003). Regeneration process also involves other
reactions such as diffusion, precipitation and desorption.
Comparing statistically similar concentrations among the four solutions, it was found
that all solutions differ significantly that is p<0.001 except for 1% Na2CO3 vs. 1% Na3PO4
and 2% Na2CO3 vs. Two% Na3PO4 where p-value was p>0.05. This could be attributed to the
pH of 1% Na2CO3 vs. 1% Na3PO4 and 2% Na2CO3 vs. 2% Na3PO4 are almost equal.
Regeneration can be carried out by heating fluoride saturated bone char in the
presence of hydroxide (Kaseva, 2006). Wang et al., 2001 suggested that during fluoride
removal from water, fluoride ion might combine with hydroxyapatite in two ways according
to equations 4.7-4.8.
+ + (Free calcium) (4.7)
+ + + + (Need calcium) (4.8)
In regeneration using sodium hydroxide, the F- in the Ca10(PO4)6(OH)2.2F can be
replaced by OH- (Equations 4.9-4.10). The molecule Ca10(PO4)6.2CaF2 cannot react with OH-
but dissolves and releases fluoride from the molecule heating as shown in equations 4.11-12.
The reaction may be as follows:
a) + + (4.9)
+ (4.10)
b) + + (4.11)
+ + (4.12)

33
4.3 Effect of Temperature in Regeneration
Study on the effect of temperature was conducted by varying it from 20-60 keeping
bone char of 40 g/50 mL and 1hour contact time.
Table 4.7: Effect of Temperature on Regeneration
Effect of temperature on regeneration using 1% NaOH
Temperature (oC) Fluoride effluent (ppm)
60 155.92±3.43
50 159.87±2.62
40 151.14±3.04
30 128.80±2.44
20 113.67±2.25
The effect of temperature on the regeneration of fluoride saturated bone char was
studied at temperatures of 20, 30, 40, 50 and 60°C. It was found that fluoride released was
essentially dependent on temperature as seen in Table 4.7. At 50 °C, it was found to be the
best temperature for regeneration since it provided the highest concentration of fluoride
released 159.87 ppm.
López et al., (2006) showed that temperature appears to play a slight role in the
optimal pH for sorption in that by increasing temperature from 10 °C to 40 °C the pHpzc
decreased from 9.6 to 8.1. This change suggests that increased temperatures either favors
desorption of protons from the surface or hydroxide sorption to the surface, shifting
protonation constants to lower values as shown in the following surface equilibria. As
temperature increased, sorption was shown to be less favored most likely due to increased
deprotonation or hydroxylation of the surface causing more negatively charges sorbant
surfaces.
At higher temperature, the hydroxyl ions move faster and more can penetrate into
cavities of the porous bone char’s structure. This result in more exchange of hydroxyl ions
with the fluoride ions of the bone char is fluorapatite. The amount of fluoride ions that were
desorbed increased at higher temperatures. This result indicated that desorption mechanism of

34
fluoride ion from bone char is an endothermic reaction; that is, the fluoride in bone char
consumes heat in exchanging with a hydroxyl ion. Diffusion of hydroxyl ions seems also to
increase with increased temperature (Meena et al., 2005).

35
4.4 Determination of efficiency of regenerated bone char
Table 4.8: Efficiency of regenerated, fresh and mixture (1:1) bone char
Fresh bone char Regenerated bone char Mixture
Volume of
treated water
in litres
Final fluoride
concentration in
ppm
Efficiency
in %
Final fluoride
concentration
in ppm
Efficiency
in %
Final fluoride
concentration
in ppm
Efficiency
in %
0.25 0.25±0.085 95.81 0.46±0.035 92.37 0.50±0.099 91.61
0.50 0.34±0.000 94.30 0.46±0.007 92.37 0.55±0.035 90.69
0.75 0.31±0.000 94.80 0.45±0.028 92.45 0.38±0.014 93.62
1.00 0.34±0.014 94.30 0.50±0.014 91.61 0.32±0.042 94.63
1.30 0.42±0.035 93.04 0.46±0.064 92.37 0.43±0.007 92.87
1.55 0.45±0.163 92.53 0.53±0.007 91.19 0.36±0.028 93.96
2.05 0.34±0.064 94.38 0.56±0.007 90.69 0.58±0.113 90.27
2.35 0.37±0.042 93.79 0.58±0.000 90.27 0.47±0.057 92.11
2.70 0.38±0.078 93.71 0.60±0.007 90.02 0.44±0.021 92.70
3.05 0.37±0.085 93.79 0.63±0.014 89.43 0.44±0.035 92.70
3.45 0.74±0.021 87.67 0.77±0.021 87.16 0.79±0.212 86.74
3.80 0.74±0.028 87.58 0.83±0.021 86.16 0.78±0.035 87.00
4.80 0.83±0.071 86.07 1.08±0.035 81.96 0.87±0.078 85.49
5.80 1.21±0.021 79.78 1.45±0.092 75.76 1.29±0.042 78.36
6.80 1.34±0.106 77.60 1.55±0.127 73.99 1.57±0.000 73.66
7.30 1.53±0.021 74.41 1.67±0.057 71.98 1.75±0.028 70.64
8.30 1.58±0.163 73.57 1.89±0.035 68.37 1.81±0.071 69.63
8.80 1.86±0.262 68.88 1.99±0.021 66.69 1.84±0.049 69.21
Untreated borehole water had initial fluoride concentration of 5.96 ppm. At 95%
confidence interval, there was no significant different in efficiency between fresh and
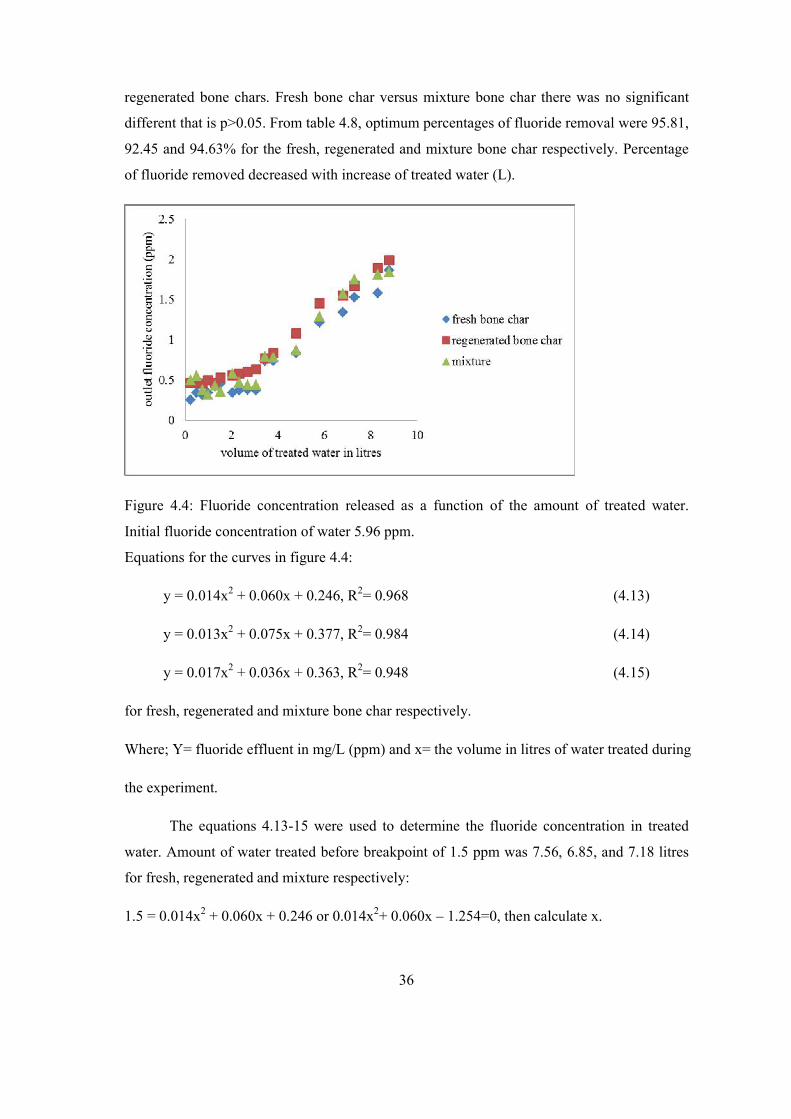
36
regenerated bone chars. Fresh bone char versus mixture bone char there was no significant
different that is p>0.05. From table 4.8, optimum percentages of fluoride removal were 95.81,
92.45 and 94.63% for the fresh, regenerated and mixture bone char respectively. Percentage
of fluoride removed decreased with increase of treated water (L).
Figure 4.4: Fluoride concentration released as a function of the amount of treated water.
Initial fluoride concentration of water 5.96 ppm.
Equations for the curves in figure 4.4:
y = 0.014x2 + 0.060x + 0.246, R2= 0.968 (4.13)
y = 0.013x2 + 0.075x + 0.377, R2= 0.984 (4.14)
y = 0.017x2 + 0.036x + 0.363, R2= 0.948 (4.15)
for fresh, regenerated and mixture bone char respectively.
Where; Y= fluoride effluent in mg/L (ppm) and x= the volume in litres of water treated during
the experiment.
The equations 4.13-15 were used to determine the fluoride concentration in treated
water. Amount of water treated before breakpoint of 1.5 ppm was 7.56, 6.85, and 7.18 litres
for fresh, regenerated and mixture respectively:
1.5 = 0.014x2 + 0.060x + 0.246 or 0.014x2+ 0.060x – 1.254=0, then calculate x.
37
Total amount of fluoride in water before treatment was; 45.06 (5.96 ppm× 7.56 l), 42.79 and
40.83 mg F-. Amount of fluoride in water after treatment was; 5.53, 5.54, and 5.64 mg F-for
fresh, mixture, and regenerated bone char respectively obtained through integration of
equations 4.13-4.15.
The results obtained were plotted as effluent fluoride concentration versus volume of
treated water (Figure 4.8). The data in figure 4.8 indicates that the concentrations of fluoride
removed was high in initial stages, and decreased up to about 6.85, 7.18 and 7.56 litres for
regenerated, mixture of bone char and fresh bone char respectively. The removal rate was fast
at the beginning of the process and then it decreased until equilibrium was reached. This
trend may be due to; initially all the adsorbent sites were vacant and the solute gradient was
high for ion exchange but with time the number of sites decreases. After this, the bone char is
still active but effluent has a fluoride concentration above the WHO recommended value of
1.5 ppm.
From the results obtained, the highest removal efficiency of regenerated bone char,
fresh bone char, and a mixture of bone char was 92.45, 95.81, and 94.63 % respectively. The
efficiency of regenerated bone char was compared to fresh bone char and results have showed
that there was no significant difference that is p>0.05 (Table 4.8). This is in agreement with
previous experiments carried out (Kaseva, 2006). The first regenerated bone char was capable
of removing fluoride from drinking water to meet the Kenyan and WHO recommended
values of 1.5 ppm. This indicated that a large part of the hydroxyapatite structure was not
damaged during the regeneration process. Mixing of regenerated and fresh bone char does not
add any advantage in improving the efficiency of bone char, that is the efficiency of the
mixture and that of regenerated bone char was not statistically different, p>0.05 (Table 4.8b).
From the trend of the effluent fluoride level observed during the defluoridation process, the
fluoride retained in the bone char can be calculated from the equations 4.13 -4.15.
The useful removal capacity of the bone char was defined as the volume of treated
water before the breakthrough point at concentration of 1.5 ppm (Bhargava, 1997). The
amount of fluoride retained in bone char at Co of 5.96 ppm for regenerated bone char, fresh
bone char, and mixture of bone char were 35.19 mg F-, 39.53 mg F-, and 37.25 mgF-
respectively. This corresponds to removal capacities of about 0.880 ( -),
0.988 and 0.932mg/g respectively which is equivalent to 0.880, 0.988 and 0.932 g/kg. This
38
showed that the removal capacity has decreased by 10.93% only. The capacities found in
this experiment were smaller but in the same order of magnitude. This suggests that
results from different tests of bone char may not be directly comparable due to variations in
the design of the experiments. The estimated removal capacities from small-scale
experiments can therefore not be used as an exact determination of the capacities. They are
however; very useful for comparing different types of bone chars and can rank them by
quality for adsorption (Albertus et al., 2000). This work was to compare the regenerated and
fresh bone char with respect to their capacity to remove fluoride. The other factor that may
influence the capacity of bone char is the presence of competitive ions present in the borehole
water such as carbonate, hydrogen carbonate generate basicity that reduces the removal
capacity. Presence of calcium, magnesium ions promote to some extent fluoride removal. pH
of the water, the lower the pH, the higher the amount of fluoride removed. Flow rate of water
during defluoridation, the higher the flow rate, the lower the capacity (Bailey, 1972; Abe et
al., 2004; Mishra et al., 2010). pHzc, production of bone char (Posner, 1987; Brunson and
Sabatini, 2007; Razaee et al., 2009; Moreno et al., 2011).
Some adsorption of fluoride occurs onto the activated carbon although the primary
uptake reaction is believed to be ion exchange between hydroxyapatite and fluoride resulting
in formation of fluorapatite (Bregnhøj and Dahi, 1995; Crittenden et al., 2005).
+ + (4.16)
The main ingredient in the bone char is hydroxyapatite and in water, it combines with
fluoride. The reaction may include two ways involving free calcium and need calcium as in
(Equations 4.7-4.8). The percentage loss could be because of Ca10(PO4)6.2CaF2 molecule that
cannot react with OH- ion during regeneration using sodium hydroxide. Bone char is soluble
in an acid, due to this; some of its efficiency could have been lost during acid neutralization
of sodium hydroxide used for regeneration.
39
CHAPTER FIVE
CONCLUSIONS AND RECOMMENDATIONS
5.1 Conclusions
1. Sodium hydroxide was the most effective among the four solutions tested for
regeneration of fluoride saturated bone char that had the highest pH.
2. Temperature was found to influence the amount of fluoride released from bone char
during regeneration process. Thus, increasing temperature increases the amount of
fluoride removed from fluoride saturated bone char but its influence is low compared
to pH.
3. From the results, obtained regenerated bone char was equally effective as fresh bone
char. There was no significant in removal capacities of regenerated compared to fresh
bone char. That is, for the first regeneration process, the bone char has not lost its
fluoride binding capacity. This implies that the regenerated bone char is a potential
material that can be used in communities where fluoride concentration in the water
system is above the recommended level. Thus making it possible to prevent health
complications like dental fluorosis, skeletal fluorosis, neurological problems,
muscular problems, and allergic manifestations.
4. There was no significant difference between the ratios of regenerated bone char to
unused bone char. Mixing of regenerated bone char with fresh bone char did not
improve the efficiency.
5.2 Recommendations
1. In order to understand regeneration process well, data on thermodynamic should be
obtained.
2. Further studies should be carried out to determine the efficiency of the process of
regeneration in large scale, and the practicability and suitability of the process. A
method of reusing sodium hydroxide that will reduce the amount of fluoride going
back to environment and maximize the use of sodium hydroxide should be devised.
There is also need to compare regeneration using continuous and batch methods to
determine the most effective.

40
3. Since regenerated bone char has shown no significant difference as compared to fresh
bone char for first regeneration, series of regeneration processes should be carried out
to determine when regenerated bone char would no longer be effective that is it has
lost fluoride-binding capacity.

41
REFERENCES
Abe, I., Iwasaki, S., Tokimoto, T., Kawasaki, N., Nakamura, T and Tanada, S. (2004).
Adsorption of fluoride ions onto carbonaceous materials. Journal of Colloid and
Interface Science. 275: 35–39.
Albertus, J., Bregnhøj, H. and Kongpun, M. (2000). Bone Char Quality and Defluoridation
Capacity in Contact Precipitation. 3rd International Workshop on Fluorosis
Prevention and Defluoridation of Water, November 20th-24th 2000, Chaing Mai,
Thailand. Pp.61‐72.
Andol, M., Tadano, M., Yamamoto, S., Tamura, K., Asanuma, S. and Watanabe, T. (2006).
Health effects of fluoride pollution caused by coal burning. Science Total
Environment. 271: 107-16.
APHA. (1995). Standard Methods for the Examination of Water and Wastewater. American
Public Health Association, Washington, DC, USA.
Ardekani, M. M., Kalantary, R. R., Jorfi, S and Nurisepehr, M. (2013). Comparison the
Efficiency of Bagas, Modified Bagas and Chitosan for Fluoride Removal from Water
by Adsorption. Journal of Environmental Treatment Techniques.1: 1-7
Argaw, A. and Kebede, F. (1999). Raw water storage and homemade filter as a method of
treatment for the removal of biological, chemical, and physical impurities. Ethiopia
Journal of Health Science. 9: 72-75.
AWWA. (1971). Defluoridation of water. In: Water Quality and Treatment. 3rd Edition,
McGraw-Hill. Pp. 436-440.
Ayoob, S., Gupta, A. K and Venugopal, T. (2008). A conceptual overview on sustainable
technologies for the defluoridation of drinking water. Critical reviews in
environmental science and technology. 38: 401-470.
Bailey, H. E. (1972). Effects of water composition on fluoride removal. MSc Thesis
(unpublished). University of Arizona. Pp. 204-61.
Barbier, O., Arreola-Mendoza, L and Del Razo L.M. (2010). Molecular mechanisms of
fluoride toxicity. Chemico Biological Interactions. 188: 319–333.
Bårdsen, K. B. (1995). Use of activated clay for defluoridation of water. 1st International
Workshop on Fluorosis Prevention and Defluoridation of Water, Ngurdoto, Tanzania,
the International Society for Fluoride Research.

42
Bhargava, D. S. (1997). Economical technology of fluoride removal using fishbone charcoal
columns at domestic level. 2nd International Workshop on Fluorosis Prevention and
Defluoridation of Water. Pp. 118-122
Bhatnagar, A., Kumar, E., and Sillanpää, M. (2011). Fluoride removal from water by
adsorption—a review. Chemical Engineering Journal. 171: 811–840.
Bjorvatn, A. B. (1997). Dental Fluorosis in Subjects Exposed to Fluoride Containing
Drinking Water at Different Age. 2nd International Workshop on Fluorosis Prevention
and Defluoridation of Water, Nazreth, Ethiopia, the International Society for Fluoride
Research.
Bregnhøj, H and Dahi, E. (1995). Kinetics of Uptake of Fluoride on Bone Char in Batch.
Proceedings of the 1st International Workshop on Fluorosis and Defluoridation of
Water, Ngurdoto, Tanzania. Pp. 96-103
Bregnhøj, H. (1995). Processes and kinetics of defluoridation of drinking water using bone
char, PhD thesis. Institute of Environmental Science and Engineering. Lyngby,
Technical University of Denmark, 112. Pp. 10-16
Bregnhøj, H., Norremark, E. T. and Orio, L. (1990). Field Study Report, Center for
Developing Countries, Technical University of Denmark, Copenhagen. Pp. 84-90
Brum, R. F., Marinuchi, R., Gomes, J. M., Ostroski, I. C., Arroyo P. A., Tavares, C. R. G.
and Barros, M. A. S. (2010). Equilibrium studies of Mn (II), Pb (II) and Cr (III) in
bone char. Chemical Engineering Transactions. 21: 721-726.
Brunson, L. R and Sabatini, D. A. (2009). An Evaluation of Fish Bone Char as an
Appropriate Arsenic and Fluoride Removal Technology for Emerging Regions.
Environmental Engineering Science. 26:1777-1783.
Bulusu, K. R., Sundaresan, B., Pathak, B. N. and Nawlakhe, W. G. (1979). Fluorides in
water, defluoridation methods and their limitations. Journal of the Institution of
Engineers India. 60:1–25.
Cao, J., Bai, X., Zhao, Y., Zhou, D., Fang, S., Jia, M. and Wu, J. (1997). Brick tea
consumption as the cause of dental fluorosis among children from Mongol, Kazak and
Yugu populations in China. Journal of Food and Chemical Toxicology. 35: 827–833.
Cao, J., Luo, S. F., Liu, J. W., and Li, Y. (2004). Safety Evaluation on Fluoride Content in
Black Tea. Food Chemistry. 88: 233-236.
Chen, M. J. (1991). An Investigation of Endemic Fluorine Poisoning Caused by Food
Contaminated by Smoke Containing Fluorine. 25: 171–173.

43
Chen, Y., Chai, L. and Shu, Y. (2008). Study of arsenic (V) adsorption on bone char from
aqueous solution. Journal of Hazardous Materials. 160: 168–172.
Chibole, O. (1987). Epidemiology of dental fluorosis in Kenya. Journal of the Royal Society
of Health. 107: 242-243.
Chidambaram, S., Ramnathan, A. L and Vasudevan, S. (2003). Fluoride Removal Studies in
Water Using Natural Materials. Water South Africa. 29: 339-343
Chikte, A. J. (1997). Fluoride and Fluorosis: The Status of Research in South Africa. 2nd
International Workshop on Fluorosis Prevention and Defluoridation of Water,
Nazreth, Ethiopia, the International Society for Fluoride Research.
Christoffersen, J., Christoffersen, M. R., Larsen, R. and Moller, J. (1991). Regeneration by
surface coating of bone char used for defluoridation of water. Water research. 25:
227-229.
Consultative Committee on Excess Fluoride in Water. (2010). Excess fluoride in water.
Report of the consultative committee Kenya Bureau of Standards, Nairobi. Pp. 8-43,
Crittenden, J. C., Rhodes T., David W. H., Kerry J. H., and George T. (2005). Water
Treatment: Principles and Design, John Wiley and Sons, Inc.
Dahi, E. (1996). Contact Precipitation for Defluoridation of Water. Paper presented at 22nd
WEDC Conference, New Delhi, 9-13 September 1996.
Dahi, E. (2000). The State of the Art of Small Community Defluoridation of Drinking Water.
3rd International Workshop on Fluorosis and Defluoridation of Water. Chiang Mai,
Thailand. Pp. 137‐167.
Dahi, E., Bregnhøj, H. and Orio, L. (1997). Sorption isotherms of fluoride on flocculated
alumina. In: Proceedings of the First International Workshop on Fluorosis and
Defluoridation of Water. 18–22 October 1995, Tanzania, the International Society for
Fluoride Research, Auckland. Pp. 35–39.
Dahi, J. M. (1997). Fluoride Contamination and Mineralogical Composition of East African
Magadi (Trona). 2nd International Workshop on Fluorosis Prevention and
Defluoridation of Water, Nazareth, Ethiopia, the International Society for Fluoride
Research.
Diawara, C., Rumeau, M., Pontie, O and Sarr. (2003). A phenomenological mass transfer
approach in nanofiltration of halide ions for selective defluoridation of blackish
drinking water. Journal of Membrane Science. 219:103-112.
EPA R.E.D. FACTS Cryolite http://www.epa.gov/oppsrrd1/REDs/factsheets/0087fact.pdf(pp
1-5 accessed on 6/8/11)

44
Fawell, J., Bailey, K., Chilton, J., Dahi, E., Fawtrell, L. and Magara, Y. (2006).World Health
Organization (WHO). Fluoride in Drinking water. Pp. 138-167.
Feenstra, L., Vasak, L. and Griffoen, J. (2007). Fluoride in groundwater. International
groundwater resources assessment Centre (IGRAC). Pp. 2-8.
Gazzano, E., Bergandi, L., Riganti. C., Aldieri, E., Doublier, S., Costamagna, C., Bosia, A
and Ghigo, D. (2010). Fluoride effects: the two faces of Janus. Current Medicinal
Chemistry. 17: 2431–2441.
Ghaneian, M. T., Momtaz, M and Dehvari, M. (2012). An Investigation of the Efficacy of
Cuttlefish Bone Powder in the Removal of Reactive Blue 19 Dye from Aqueous
Solutions: Equilibrium and Isotherm Studies. Journal of Community Health Research.
1: 68-78.
Giesen, A. (1998). Fluoride removal at low costs. European Semiconductor. 20: 103-105.
Guedes1, Mansur. M. and Rocha, F. (2007). A Perspective of Bone Char Use in the
Treatment of Industrial Liquid Effluents Containing Heavy Metals.
Hanemaaijer, J.H., van Medevoort, J., Jansen, A., van Sonsbeek, E., Hylkema, H., Biemans,
R., Nelemans, B. and Stikker, A. (2007). Memstill Membrane Distillation: A near
future technology for seawater desalination, Paper presented at the International
Desalination Conference, June 2007, Aruba.
Horowitz, H.S., Heifetz, S.B., and Driscoll, W.S. (1972). Partial Defluoridation of a
Community Water Supply and Dental Fluorosis. Final Evaluation in Britton, S. Dak.
USA. Health Services Reports. 87:451-455.
IPCS (2002). Environmental Health Criteria 227 (Fluoride). Geneva: International
Programme on Chemical Safety, World Health Organization. Pp. 100.
Jacobsen, P. and Dahi, E. (1997). Charcoal packed furnace for low‐tech charring of bone. 2nd
International Workshop on Fluorosis and Defluoridation of Water. Nazareth,
Ethiopia. Pp151‐155.
Jacobsen, P. and Muller, K. (2007a). CDN’s experiences in producing bone char. Technical
Report. Pp. 1-8.
Jacobsen, P. and Muller, K. (2007b). CDN’s experiences on a household scale. Technical
Report. Pp. 1-10.
Jagtap, S., Yenkie, M. K., Labhsetwar, N and Rayalu, S. (2012). Fluoride in drinking water
and defluoridation of water. Chemical Reviews. 112: 2454–2466.

45
Jorgen, N. (2005). GIS Mapping of Fluoride Contaminated Groundwater in Nakuru and
Baringo Districts of Kenya, a Minor Field Study. MSc Thesis, (unpublished) Lulea
University of Technology. Pp. 29-31
Karthikeyan, A. P. (1997). A simple method for determination of total fluoride intake. 2nd
International Workshop on Fluorosis Prevention and Defluoridation of Water,
Nazareth, Ethiopia, The International Society for Fluoride Research.
Kaseva, M. E. (2006). Optimization of regenerated bone char for fluoride removal in drinking
water: a case study in Tanzania. Journal of Water and Health. 4:139-149.
Kawasaki, F., Ogata, F., Tominaga, H and Yamaguchi, I. (2009). Removal of fluoride ion by
bone char produced from animal biomass. Journal of Oleo Science. 58:529-535.
Korir, H., Mueller, K., Korir, I., Wanja, E., Wanjiku, N., Waweru, J., Mattle, M, J.,
Ostwalder, L. and Johnson, C. A. (2009). The development of bone char based filters
for the removal of fluoride from drinking water. 34th WEDC International
Conference, Addis Ababa, Ethiopia, 2009. Water, Sanitation and Hygiene:
Sustainable Development and Multisectoral Approaches. Pp 1-6.
Lewis, J. (1995). The use of bone charcoal in the treatment of rural water supplies. Journal of
the Chartered Institute of Water and Environmental Management. 9: 385–395.
Li, Y., Wang. C., Zhang, X, Liang, J., Wu, D and Welb. (2001). Adsorption of fluoride from
water by amorphous alumina supported in nanotubes. Chemical Physical Letter. 38:
469-476.
López Valdivieso, A., Reyes Bahena, J. L., Song, S and Herrera Urbina, R (2006).
Temperature effect on the zeta potential and fluoride adsorption at the α-
Al2O3/aqueous solution interface. Journal of Colloid and Interface Science. 298: 1-5.
Lu, Y., Sun, Z.R., Wu, L.N., Wang, X., Lu, W., & Liu, S.S. (2000). Effect of high-fluoride
water on intelligence in children. Fluoride. 33: 74-78.
Mabelya, L. (1997). Dental fluorosis and the use of a high fluoride-containing trona tenderize
(magadi). Community Dentistry and Oral Epidemiology. 25: 170–176.
Malde, M. K., Greiner-Simonsen, R., Julshamn, K. and Bjorvatn, K. (2006). Tealeaves may
release or absorb fluoride, depending on the fluoride content of water. Science of the
Total Environment. 366: 915–917.
Malik, A. H., Nasreen, S., Mahmood, Q., Khan, Z. M., Sarwar, R., Jilan, G., and Khan, A.
(2010). Strategies for low cost water defluoridation of drinking water. Journal of
Chemical Society Pakistan. 32: 550-555.
46
Mameri, N., Eddo, A. R., Lounici, H., Belhoucine, D., Grib, H. and Bariou, B. (1998).
Defluoridation of Septentrional Sahara water of North Africa by Electro coagulation
process using bipolar Aluminum electrodes’ Fluoride. Journal of International
Society for Fluoride Research. 31: 227-228.
Márquez-Mendoza, S., Jiménez-Reyes, M., Solache-Ríos, M and Gutiérrez-Segura, E.
(2012). Fluoride Removal from Aqueous Solutions by a Carbonaceous Material from
Pyrolysis of Sewage Sludge. Water Air Soil Pollution. 223:1959–1971
Mavura, W .J. and Tiffany, B. (2002). Fluoride contamination in drinking water in Rift
Valley, Kenya and evaluation of the efficiency of a locally manufactured
defluoridation filter. Journal of Civil Engineering. Jomo Kenyatta University of
Agriculture and Technology. 8:79-88.
Mavura, W. J., Mwanyika, F.T. and Wrensford, G. (2004). Construction and Optimization of
a Cartridge Filter for Removing Fluoride in Drinking Water. Bulletin of Chemical
Society of Ethiopia. 18: 1-6.
Mcharo, A. J. (1986). The occurrence and possibilities of fluoride removal in Arusha area,
Tanzania. MSc Thesis (unpublished). Tampere University of Technology, Tanzania.
Pp. 18-25
Meena, A. K., Mishra, G. K., Rai, P. K., Rajagopal, C., Nagar., P. N. (2005). Removal of
heavy metal ions from aqueous solutions using carbon aerogel as an adsorbent.
adsorbent. doi:10.1016/j.jhazmat.2005.03.024
Meklau, R. T. H and Shifera, G. (1997). Prevalence of Low Back Pain at An Agro-Industrial
Community in the Rift Valley. 2nd International Workshop on Fluorosis Prevention
and Defluoridation of Water, Nazreth, Ethiopia, the International Society for Fluoride
Research.
Mishra, S. P., Das, M and Dash, U. N. (2010). Review on adverse effects of water
contaminants like arsenic, fluoride and phosphate and their remediation. Journal of
Scientific and Industrial Research. 69:249-53.
Mjengera, H. and Mkongo, G. (2003). Appropriate defluoridation technology for use in
fluorotic areas in Tanzania. Physics and Chemistry of the Earth. 28:1097‐1104
Moges, G., Zegwe and Socher, M. (1996). Preliminary investigations on defluoridation of
water using fired clay chips. Journal of Africa Earth Science.21:479-462.
47
Moreno-Piraján1, J., Giraldo, L and García-Cuello, L. S. (2011). Study of the Textural
Properties of Bovine Bones Char under Different Conditions. Journal of Water
Resource and Protection. 3: 176-181
Moturi, W. K. N., Tole, M. P and Davies, T. C. (2001). The contribution of drinking water
towards dental fluorosis: A Case Study of Njoro Division, Nakuru District, Kenya.
Journal of Environmental Geochemistry and Health. 24: 123 – 130.
Murray, J. (1986). Appropriate Use of Fluorides for Human Health, World Health
Organization, Geneva. Of the Harare Symposium, IAHS Publ. 144.Pp 75–86.
Nair, K.R., Manji, F. and Gitonga, J. N. (1984). The occurrence and distribution of fluoride in
ground waters in Kenya. East African Medical Journal. 60: 503-512.
National Fluoridation Information Service (2011): Fluoride Neurotoxicity: Review of
evidence from drinking water studies. National Fluoridation Information Service
Advisory June 2011, Wellington, New Zealand. Pp 1-14
Notcutt, G and Davies, F. (1999). Bio monitoring of volcanogenic fluoride, Furnas caldera,
sao Miguel, Azores. Journal of Volcanicity and Geothermal.92:209-214
Phantumvanit, P., Songpaisan, Y. and Møller, I. J. (1988). A defluoridator for individual
households. World Health Forum. 9: 555-558.
Rao, N. C. R. (2003). “Fluoride and Environment- A Review” in Martin J. Bunch, V. Madha
Suresh and T. Vasantha Kumaran, eds., Proceedings of the Third International
Conference on Environment and Health, Chennai, India, 15-17 December, 2003.
Chennai: Department of Geography, University of Madras, and Faculty of
Environmental Studies, York University. Pp. 386 – 399.
Redda, T., Melaku, Z., Kloos. H., Reimann. C., Fantaye, W., Zerihun, L. and Bjorvatn, K.
(2006). The geographical distribution of fluoride in surface and groundwater in
Ethiopia with an emphasis on the rift valley. Science Total Environment. 36: 182-190.
Rezaee, A., Ghanizadeh, Gh., Behzadiyanneja., Gh., Yazdanbakhsh, A and Siyadat, S. D.
(2009). Adsorption of Endotoxin from Aqueous Solution Using Bone Char. Bulletin
of Environmental Contamination and Toxicology. 82:732–737
Rwenyonyi, M. C., Birkeland, J. M and Haugejorden, O. (1997). Dental Fluorosis in Relation
to Altitude and Fluoride in Drinking Water In Uganda. 2nd International Workshop on
Fluorosis Prevention and Defluoridation of Water, Nazreth, Ethiopia, the International
Society for Fluoride Research.
48
Sharma, D. S and Parul J. (2009). "Prevalence of Neurological Manifestations in a Human
Population Exposed to Fluoride in Drinking Water." International Society for
Fluoride Research. 42: 127-132
Shepherd J. H., Shepherd, D V and Best, S. M. (2012). Substituted hydroxyapatites for bone
repair. Journal of Materials Science Materials in Medicine. 23:2335–2347
Shrivastava, A. K and Sharma, M. K. (2012). An Innovative Technique for Removal of
Fluoride from Drinking Water. Scientific reviews and chemical communication. 2:
133-140.
Solar. D. (2007).The Solar Dew Collector System. http://www.solardew.com/index2.htmL
(page accessed on 8/10/2011).
Sudaratn, L. and Thares, S. (2010). Comparison of Lead Removal by Various Types of Swine
Bone Adsorbents. Environment Asia. 3: 32-38.
Tekle-Haimanot, A. F., Bushera, B and Mekonnen, B. (1995). Fluoride levels in water and
endemic fluorosis in Ethiopian Rift Valley. 1st International Workshop on Fluorosis
Prevention and Defluoridation of Water, Ngurdoto, Tanzania, The International
Society for Fluoride Research.
Tembhurkar, A. R and Shilpa. D. (2006). Studies on fluoride removal using adsorption
process. Journal of Environmental Science and Engineering. 48: 151-156.
UNICEF.(2005). UNICEF’s Position on Water Fluoridation, Water environment and
sanitation, fluoride in water. URL: http://www.nofluoride.com/Unicef_fluor.htm
(1/14/11)
USNRC.(1993). Health Effects of Ingested Fluoride. National Research Council, National
Academy Press, Washington D.C.
Vijaya, Y., Venkata Subbaiah, M., Subba Reddy, A., and Krishnaiah, A. (2010). Equilibrium
and kinetic studies of fluoride adsorption by chitosan coated perlite. Desalination and
Water Treatment. 20: 272–280
Wang Lian — fang, Zhan Ling, Wang Shen — ling and Yang Yang. (2001). Studies on
Hyperthermy Regeneration of Bone — salt Reagent for Defluoridation. Endemic
Diseases Bulletin.16: 21-24
Warren, G. P., Robinson, J. S and Someus, S. (2009).Dissolution of phosphorus from animal
bone chars in 12 soils. Nutrients Cycling Agro ecosystems. 84:167–178

49
Water quality association. (2005). Technical application bulletin: Fluoride recognized
treatment techniques for meeting drinking water regulations for the reduction of
fluoride using point-of-use and point-of-entry (POU/POE) devices and systems. Pp 1-4
WHO, (1996).Guidelines for Drinking-water Quality. Volume 2.Health Criteria and Other
Supporting Information. Second edition. World Health Organization, Geneva.
WHO. (1984). Fluorine and Fluorides, Environmental Health Criteria 36. World Health
Organization, Geneva.
WHO. (2004). Fluoride in Drinking water: Background document for development of WHO
Guidelines for Drinking-water Quality. (Pg. 2 accessed on 22/7/ 2011).
Wilson, J. A., Dennis, J., Pulford, D. and Thomas, S. (2000). Adsorption of heavy metals by
natural charcoal (bone charcoal). Environmental Geochemistry and Health. 23: 291-
295.
Xiang, Q., Liang, Y., Chen, L., Wang, C., Chen, B., Chen, X. and Zhou, M. (2003).
Effect of fluoride in drinking water on children’s intelligence. Fluoride. 36: 84-94.
Yang, Cc and Ddluhy, R. (2002). Electrochemical generation of aluminium sorbent for
fluoride absorption. Journal of Hazardous Materials. 94: 239-253.
Zakia, A., Bernard, B., Nabil, M., Mohammed, T., Stephen, N. and Azzedine, E. (2001).
Fluoride removal from brackish water by electrodialysis. Desalination. 133: 215-233.
Zevenberrgen, C., Reeuwijik, L. P., Franpport, G., Louws, R. J. and Schiling, R. D. (1996). A
simple method for defluoridation of drinking water at a village level by adsorption on
andol soil in Kenya. The Science of the Total Environment. 188: 225-232
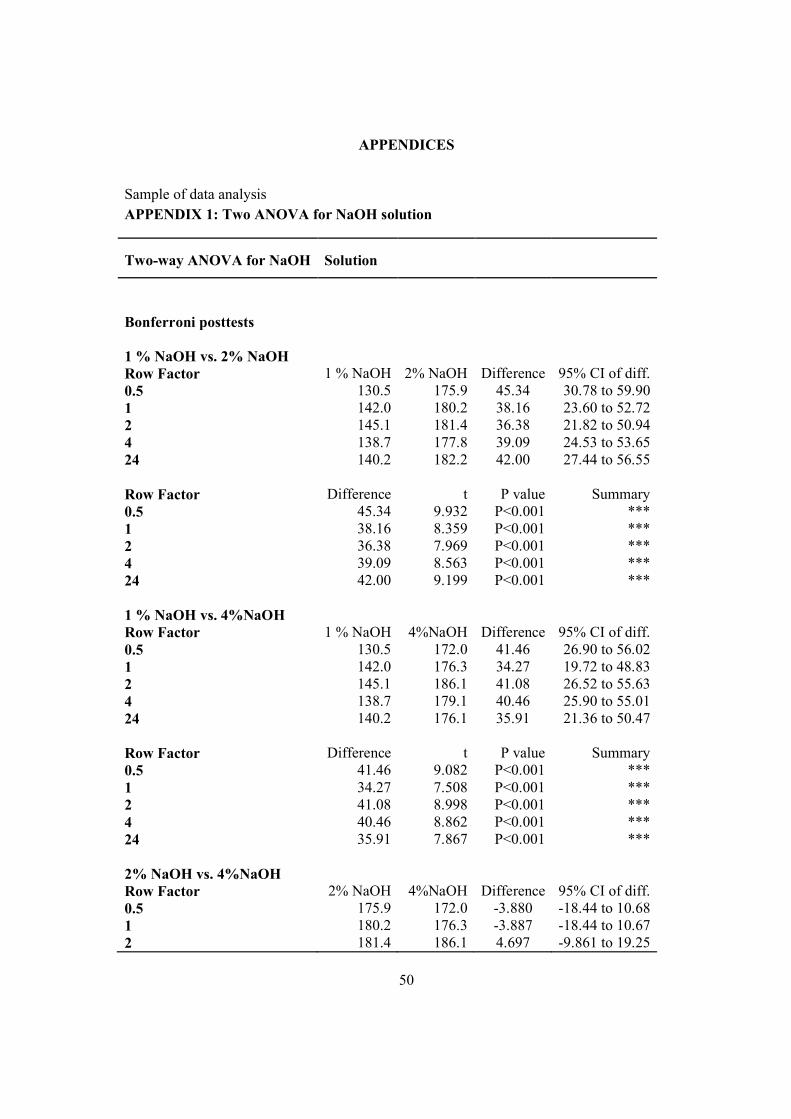
50
APPENDICES
Sample of data analysis
APPENDIX 1: Two ANOVA for NaOH solution
Two-way ANOVA for NaOH Solution
Bonferroni posttests 1 % NaOH vs. 2% NaOH Row Factor 1 % NaOH 2% NaOH Difference 95% CI of diff. 0.5 130.5 175.9 45.34 30.78 to 59.90 1 142.0 180.2 38.16 23.60 to 52.72 2 145.1 181.4 36.38 21.82 to 50.94 4 138.7 177.8 39.09 24.53 to 53.65 24 140.2 182.2 42.00 27.44 to 56.55 Row Factor Difference t P value Summary 0.5 45.34 9.932 P<0.001 *** 1 38.16 8.359 P<0.001 *** 2 36.38 7.969 P<0.001 *** 4 39.09 8.563 P<0.001 *** 24 42.00 9.199 P<0.001 *** 1 % NaOH vs. 4%NaOH Row Factor 1 % NaOH 4%NaOH Difference 95% CI of diff. 0.5 130.5 172.0 41.46 26.90 to 56.02 1 142.0 176.3 34.27 19.72 to 48.83 2 145.1 186.1 41.08 26.52 to 55.63 4 138.7 179.1 40.46 25.90 to 55.01 24 140.2 176.1 35.91 21.36 to 50.47 Row Factor Difference t P value Summary 0.5 41.46 9.082 P<0.001 *** 1 34.27 7.508 P<0.001 *** 2 41.08 8.998 P<0.001 *** 4 40.46 8.862 P<0.001 *** 24 35.91 7.867 P<0.001 *** 2% NaOH vs. 4%NaOH Row Factor 2% NaOH 4%NaOH Difference 95% CI of diff. 0.5 175.9 172.0 -3.880 -18.44 to 10.68 1 180.2 176.3 -3.887 -18.44 to 10.67 2 181.4 186.1 4.697 -9.861 to 19.25
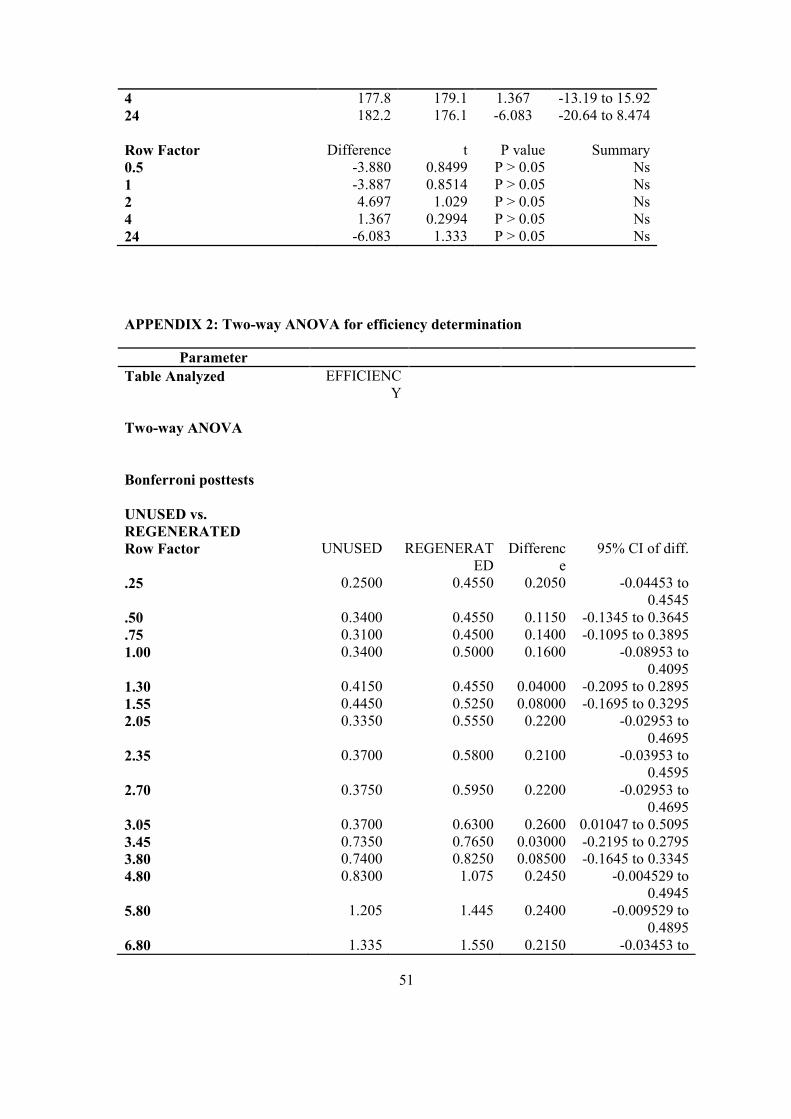
51
4 177.8 179.1 1.367 -13.19 to 15.92 24 182.2 176.1 -6.083 -20.64 to 8.474 Row Factor Difference t P value Summary 0.5 -3.880 0.8499 P > 0.05 Ns 1 -3.887 0.8514 P > 0.05 Ns 2 4.697 1.029 P > 0.05 Ns 4 1.367 0.2994 P > 0.05 Ns 24 -6.083 1.333 P > 0.05 Ns APPENDIX 2: Two-way ANOVA for efficiency determination
Parameter Table Analyzed EFFICIENC
Y
Two-way ANOVA Bonferroni posttests UNUSED vs. REGENERATED
Row Factor UNUSED REGENERATED
Difference
95% CI of diff.
.25 0.2500 0.4550 0.2050 -0.04453 to 0.4545
.50 0.3400 0.4550 0.1150 -0.1345 to 0.3645
.75 0.3100 0.4500 0.1400 -0.1095 to 0.3895 1.00 0.3400 0.5000 0.1600 -0.08953 to
0.4095 1.30 0.4150 0.4550 0.04000 -0.2095 to 0.2895 1.55 0.4450 0.5250 0.08000 -0.1695 to 0.3295 2.05 0.3350 0.5550 0.2200 -0.02953 to
0.4695 2.35 0.3700 0.5800 0.2100 -0.03953 to
0.4595 2.70 0.3750 0.5950 0.2200 -0.02953 to
0.4695 3.05 0.3700 0.6300 0.2600 0.01047 to 0.5095 3.45 0.7350 0.7650 0.03000 -0.2195 to 0.2795 3.80 0.7400 0.8250 0.08500 -0.1645 to 0.3345 4.80 0.8300 1.075 0.2450 -0.004529 to
0.4945 5.80 1.205 1.445 0.2400 -0.009529 to
0.4895 6.80 1.335 1.550 0.2150 -0.03453 to

52
0.4645 7.30 1.525 1.670 0.1450 -0.1045 to 0.3945 8.30 1.575 1.885 0.3100 0.06047 to 0.5595 8.80 1.855 1.985 0.1300 -0.1195 to 0.3795 Row Factor
Difference
t
P value
Summary
.25 0.2050 2.770 P > 0.05 ns
.50 0.1150 1.554 P > 0.05 ns
.75 0.1400 1.891 P > 0.05 ns 1.00 0.1600 2.162 P > 0.05 ns 1.30 0.04000 0.5404 P > 0.05 ns 1.55 0.08000 1.081 P > 0.05 ns 2.05 0.2200 2.972 P > 0.05 ns 2.35 0.2100 2.837 P > 0.05 ns 2.70 0.2200 2.972 P > 0.05 ns 3.05 0.2600 3.513 P < 0.05 * 3.45 0.03000 0.4053 P > 0.05 ns 3.80 0.08500 1.148 P > 0.05 ns 4.80 0.2450 3.310 P < 0.05 * 5.80 0.2400 3.242 P < 0.05 * 6.80 0.2150 2.905 P > 0.05 ns 7.30 0.1450 1.959 P > 0.05 ns 8.30 0.3100 4.188 P<0.01 ** 8.80 0.1300 1.756 P > 0.05 ns
UNUSED vs. MIXTURE (1:1)
Row Factor UNUSED MIXTURE Difference
95% CI of diff.
.25 0.2500 0.5000 0.2500 0.0004707 to 0.4995
.50 0.3400 0.5550 0.2150 -0.03453 to 0.4645
.75 0.3100 0.3800 0.07000 -0.1795 to 0.3195 1.00 0.3400 0.3200 -0.02000 -0.2695 to 0.2295 1.30 0.4150 0.4250 0.01000 -0.2395 to 0.2595 1.55 0.4450 0.3600 -0.08500 -0.3345 to 0.1645 2.05 0.3350 0.5800 0.2450 -0.004529 to
0.4945 2.35 0.3700 0.4700 0.1000 -0.1495 to 0.3495 2.70 0.3750 0.4350 0.0600 -0.1895 to 0.3095 3.05 0.3700 0.4350 0.0650 -0.1845 to 0.3145

53
3.45 0.7350 0.7900 0.05500 -0.1945 to 0.3045 3.80 0.7400 0.7750 0.03500 -0.2145 to 0.2845 4.80 0.8300 0.8650 0.03500 -0.2145 to 0.2845 5.80 1.205 1.290 0.08500 -0.1645 to 0.3345 6.80 1.335 1.570 0.2350 -0.01453 to
0.4845 7.30 1.525 1.750 0.2250 -0.02453 to
0.4745 8.30 1.575 1.810 0.2350 -0.01453 to
0.4845 8.80 1.855 1.835 -0.02000 -0.2695 to 0.2295 Row Factor Difference t P value Summary .25 0.2500 3.378 P < 0.05 * .50 0.2150 2.905 P > 0.05 ns .75 0.07000 0.9457 P > 0.05 ns 1.00 -0.02000 0.2702 P > 0.05 ns 1.30 0.01000 0.1351 P > 0.05 ns 1.55 -0.08500 1.148 P > 0.05 ns 2.05 0.2450 3.310 P < 0.05 * 2.35 0.1000 1.351 P > 0.05 ns 2.70 0.0600 0.8106 P > 0.05 ns 3.05 0.0650 0.8782 P > 0.05 ns 3.45 0.05500 0.7431 P > 0.05 ns 3.80 0.03500 0.4729 P > 0.05 ns 4.80 0.03500 0.4729 P > 0.05 ns 5.80 0.08500 1.148 P > 0.05 ns 6.80 0.2350 3.175 P < 0.05 * 7.30 0.2250 3.040 P > 0.05 ns 8.30 0.2350 3.175 P < 0.05 * 8.80 -0.02000 0.2702 P > 0.05 ns
Copyright © 2022 FDOKUMEN