The human antibody response to Giardia intestinalis
141
Copyright is owned by the Author of the thesis. Permission is given for a copy to be downloaded by an individual for the purpose of research and private study only. The thesis may not be reproduced elsewhere without the permission of the Author.
-
Upload
khangminh22 -
Category
Documents
-
view
0 -
download
0
Transcript of The human antibody response to Giardia intestinalis

Copyright is owned by the Author of the thesis. Permission is given for a copy to be downloaded by an individual for the purpose of research and private study only. The thesis may not be reproduced elsewhere without the permission of the Author.

Massey University Library Thesis Copyright Form
Title of thesis: "The Human An ti body Response To Giardia intestinalis"
(1) (a) I give permission for my thesis to be made available to readers in Massey University Library under conditions determined by the Librarian.
(b) I do not wis,ffiY-..thesis to be made available to readers without my wri~ CQ!_l_sent for . . . months.
(2) (a) I agree that my thesis, or a copy, may be sent to another institution under conditions determined by the Librarian.
(b) I do not wish my thesis, or a copy, to be sent to another institution without my written consent for ... months.
(3) (a) I agree that my thesis may be copied for Library use.
(b) I do not wi~hesis to be copied for Library use for ... months. ·
S. d (ufv7~~ "J.L.P.C\-'Q() 1gne ( ''-
Date ·1 I I ( Cf I
The copyright of this thesis belongs to the author. Readers must sign their name in the space below to show that they recognise this. They are asked to add their permanent address.
NAME AND ADDRESS
~1u.ty cHAN is . JMrrrJ ss 1.2/ n Df\Mf<,\ISf\R-A .1tiVA, > 15
P~.TA£.iN6 J,-;'1fl . sr:.1..t;M«rr().., 1,r.AlA~£/rr ~

The Human Antibody Response To Giardia intestinalis
A thesis presented in partial fulfilment of the requirements,
for the degree,
of Masters of Science in Microbiology
at Massey University
Judy Lai Peng Chan 1991

11
Abstract
Giardiasis is usually diagnosed in the laboratory by microscopic
examination of faeces for the presence of cysts and / or
trophozoites. However in principle, it is possible that Giardia
infection could be diagnosed serologically. To investigate this
possibility an Enzyme Immunoassay (EIA) was developed using
Giardia-specific mouse serum as antibody.
The efficiency of different Giardia antigen preparations to detect
antibody in this test was investigated. The antigens included live
trophozoites, frozen and thawed trophozoites, sonicated trophozoites,
trophozoite membranes and cysts. Antibody titres were low and
no marked differences were detected when the four different
antigens were compared. However, since following a natural
infection the immune response to surface proteins probably
predominates, we concluded that live trophozoites or cysts
represented the most appropriate antigens to use in an EIA test to
detect Giardia-specific antibody in human serum.
Live trophozoites adsorbed to polystyrene microtitre wells were
removed by the washing procedure, thus giving an insensitive test
and inconsistent results. This problem was overcome by precoating
the microtitre wells with poly-I-lysine following which trophozoites
and cysts adhered to the wells strongly enough to resist the
washing procedures. The EIA test was optimised with Giardia
specific mouse serum as antibody and the same system was used to
detect antibody in human serum.

lll
IgG, IgM, and IgA antibody were assayed in "current infection",
"convalescent" and "negative control" human sera. IgG antibody
titres were slightly elevated in "convalescent" sera as compared to
the other two groups. IgM antibody titres were slightly elevated
m "current infection" sera and IgA antibody levels were not found
to be elevated.
Since IgM antibody is present early in an infection but does not
persist, its presence or absence could, m principle, be used to
distinguish a current from a previous infection of Giardia.
However, only slightly elevated levels of Giardia-specific IgM
antibody in "current infection" sera were detected in our tests so
this approach to diagnosis will need further development if it is to
be used for diagnostic purposes.
Giardia IS not an invasive orgamsm and it is possible that some
antigens may play a major role in eliciting an immune response in
humans. Thus, potential Giardia antigens were investigated by
"immunoblotting" total Giardia proteins with human sera from
clinically diagnosed cases of giardiasis.
It was found that the human antibody response to Giardia vanes
between individuals and many Giardia proteins reacted with the
Immune human sera. However, IgG antibody found m many of
the serum samples reacted with a 200 kDa, 62 kDa and 42 kDa
protein. IgA and IgM antibodies also reacted with a 62 kDa
protein which may be similar to a 55 kDa structural protein
(tubulin) found in Giardia.

IV
Acknowledgements
Many thanks to my supervisor, Dr.Mary Nulsen for her guidance
and wisdom in the outworking of this project.
I am also truly grateful to Associate Professor John Clarke for his
expert help and input in the writing up of this thesis.
I would also like to thank Associate Professor Tim Brown for his
enthusiasm in heading the Giardia research group and whose
positive attitude has been a great influence to the group. To my
fellow comrades in the group, I thank you for your support.
Thank you also to the Department of Microbiology and Genetics
for the use of her facilities and to Dr.George Ionas for technical
assistance.
And to you, Mitch, I thank God for your friendship and for
adding sparkle to my life at Massey.
Ming and Jeanne, thanks for helping me with the awful (!) word
processor. Both of you have been such faithful friends and your
kindness knows no bounds.
Luke, much thanks for your endurance in typing up this thesis. It
truly has been a labour of love and all I can say is .............. you're
the greatest!
Lastly but not least, Mum and Dad, and to my family, thanks for
your love and support which have brought me this far.

Table of Contents.
Page
TITLE PAGE .......................................................................... i
ABSTRACT .............................................................................. ii
ACKNOWLEDGEMENTS ......................................................... iv
TABLE OF CONTENTS .......................................................... v
LIST OF TABLES ................................................................... viii
LIST OF FIGURES ................................................................. xi
1.0 Introduction ..................................................... 1
1.1 The biology of Giardia ...................................... 1
1.2 Pathogenicity, disease and symptoms ................... 3
1.3 Presence and detection of Giardia-specific
antibody in Giardia infection......................... 4
1.4 Diagnosis of giardiasis ........................................ 5
1.5 Giardia antigens and immunoassays.................... 7
2.0 Materials and Methods ...................................... 18
2.1 Retrieval of frozen cultures of trophozoites... .... 18
2.2 Subculture of Giardia trophozoites. .... ........ ....... 19
2.3 Harvesting Giardia trophozoites. .... .. ...... .. .. . ....... 20
2.4 Procedure for in vitro encystation of
Giardia intestinalis trophozoites...................... 21
2.5 Cryopreservation of Giardia trophozoites.... .... .. 22
2.6 Percoll gradient centrifugation........................... 23
2.7 Antisera production: Inoculation of New Zealand
white rabbits and Balb/C mice....................... 24

Page
2.8 Indirect Immunofluorescence Test for Giardia... 27
2.9 An Enzyme Immunoassay for the detection of
Giardia-specific antibodies.............................. 29
2.10 Protein determination of sample for use m
sodium dodecyl sulphate polyacrylan1ide gel
electrophoresis (SDS-PAGE) ............................. 31
2.11 SDS-PAGE ........................................................ 32
2.12 Immunoblotting .................................................. 37
2.12.1 Setting up of the immunoblot apparatus ......... 37
2.12.2 Wet electrophoretic transfer of
immunoblots ..................................................... 39
2.12.3 Development of immunoblots .......................... 39
3.0 Results ............................................................. 4 2
3.1 Enzyme immunoassay .......................................... 42
3.1.1 Recovery of Giardia cysts prepared
zn vitro ........................................................... 42
3.1.2 Determination of cyst viability ......................... 42
3.1.3 Titration of Giardia antisera by the
Indirect Immunofluorescence Test ..................... 47
3.1.4 Preliminary development of an EIA ................. 49
3.1.5 Detection of different immunoglobulin
classes of antibody to Giardia in
human sera ....................................................... 54
3.2 Detection of Giardia antibody to individual
antigen using immunoblots ................................ 55
3.2.1 Separation of Giardia proteins by SDS-PAGE. 55

Page
3.2.2 Development of immunoblots usmg rabbit
antisera ... .......................................................... 55
3.2.3 Immunoblotting of human sera using
Giardia proteins.............................................. 65
4. Discussion ........................................................... 80
5. Appendix ............................................................ 87
6. Bibliography..................................................... 102

List of Tables.
Tables Pa2e
Table 1 A survey of enzyme immunoassays developed
by other investigators which used Giardia intestinalis
cysts as antigen ......................................................... 10,11
Table 2 A survey of enzyme immunoassays developed by
other investigators which used Giardia intestinalis
trophozoites as antigen .............................................. 12-14
Table 3 Reaction of Giardia-specific antibodies from
laboratory animals with Giardia proteins ................. 15,16
Table 4 Reaction of Giardia-specific antibodies from
human sera with Giardia proteins........................... 17
Table 5a First Percoll gradient centrifugation of Giardia cysts:
Cyst recovery at specific gravity interfaces .............. 43
Table Sb Second Percoll gradient centrifugation of Giardia cysts:
Cyst recovery at specific gravity interfaces .............. 44
Table 6 Viability determination of cysts recovered from the
upper Percoll band at the interface of sp.gr. 1.020
and sp.gr. l.045 ....................................................... 45

Tables Pa~e
Table 7 Staining of cysts recovered from the lower
Percoll band at the interface of sp.gr. 1.045
and sp.gr. 1.090 ....................................................... 46
Table 8 Indirect immunofluorescence test of Giardia antisera
prepared in rabbits ................................................... 48
Table 9 Indirect immunofluorescence test of Giardia antisera
prepared in mice ...................................................... 48
Table 10 Enzyme Immunoassay with different Giardia
antigen preparations .................................................. 49
Table 11 Trophozoite adherence to wells coated with
poly-L-lysine ............................................................ 50
Table 12 Enzyme Immunoassay with and without
poly-L-lysine ............................................................. 51
Table 13a EIA of human sera with Giardia trophozoites as test
antigen. Group one: "Convalescent" sera ................... 56
Table 13b EIA of human sera with Giardia trophozoites as test
antigen. Group two: "Current infection" sera ........... 57

Tables Pa2e
Table 13c EIA of human sera with Giardia trophozoites as test
antigen. Group three: "Negative control" sera .......... 58
Table 14a EIA of human sera with Giardia cysts as test
antigen. Group one: "Convalescent" sera .................. 60
Table 14b EIA of human sera with Giardia cysts as test
antigen. Group two: "Current infection" sera .......... 61
Table 14c EIA of human sera with Giardia cysts as test
antigen. Group three: "Negative control" sera .......... 62
Table 15 The mean absorbances obtained in EIA
tests for Giardia-specific antibody using cysts and
trophozoites ............................................................... 64
Table 16 Irnmunoblots with "convalescent" human sera ............ 65
Table 17 Irnmunoblots with "current infection" human sera .... 66
Table 18 Immunoblots with "negative control" human sera ..... 67

List of Figures
Figures Page
Figure 1 Giardia trophozoites attached by poly-L-lysine
to the polystyrene micro titre well ............................. 52
Figure 2 Microtitre wells not treated with poly-L-lysine.
No trophozoites were attached to the well after
washing ..................................................................... 52
Figure 3 Giardia cysts attached by poly-L-lysine to the
microtitre well .......................................................... 53
Figure 4 Histogram of the absorbance readings in EIA
tests for Giardia-specific antibody of different
immunoglobulin classes in human sera, using
Giardia trophozoites as antigen............................... 59
Figure 5 Histogram of the absorbance readings in EIA tests
for Giardia-specific antibody of different
immunoglobulin classes in human sera , using
Giardia cysts as antigen.......................................... 63
Figure 6 Total Giardia trophozoite proteins electrophoresed
m a 5% polyacrylamide gel.. ................................... 69

Fi~ures Page
Figure 7 Total Giardia trophozoite proteins electrophoresed
m a 10% polyacrylamide gel.. ................................. 70
Figure 8 Total Giardia trophozoite proteins electrophoresed
m a 12.5% polyacrylamide gel.. .............................. 71
Figure 9 SDS-P AGE of total Giardia trophozoite protein m
parallel with high and low molecular weight protein
markers ..................................................................... 72
Figure 10 Irnmunoblotting of total Giardia trophozoite
proteins with rabbit sera.
(i) Rabbit anti-cyst sera
(ii) Rabbit anti-trophozoite sera
(iii) Normal rabbit sera ............................................. 73
Figure 11 Immunoblotting of Giardia trophozoite
proteins with human IgG antibody from
clinically diagnosed cases of giardiasis ....................... 7 4
Figure 12 Irnmunoblotting of Giardia proteins with human
IgG antibody from "negative control" sera ................ 7 5
Figure 13 Immunoblotting of Giardia trophozoite
proteins with IgA antibody from
clinically diagnosed cases of giardiasis ....................... 76

Figures
Figure 14 Imrnunoblotting of Giardia trophozoite
proteins with human IgA antibody from
" · l" 77 negative contra sera .............................................. .
Figure 15 Imrnunoblotting of Giardia trophozoite
proteins with human IgM antibody from
clinically diagnosed cases of giardiasis ....................... 78
Figure 16 Immunoblotting of Giardia trophozoite
proteins with human IgM from
"negative control" sera .............................................. 79

1
1.0 Introduction.
1.1 The biology of Giardia.
The protozoa Giardia is a member of the order Diplomonadiae.
This includes a variety of binucleate flagellate parasites typically
inhabiting the intestinal tract of mammals, birds and reptiles.
The three mam species, as proposed by Filice m 1952, are
Giardia intestinalis, Giardia muris and Giardia agilis. This
proposition is based on the morphology of its median bodies. The
median body structure is unique to Giardia and is composed
mainly of microtubules. The function of the median body is still
unknown.
Giardia intestinalis (syn. Giardia lamblia, Giardia duodenalis) is
found in humans, mammals and birds and has a pointed elongate
median body located transversely to the cell. It is often described
as "hammer claw" in shape. Giardia muris found in rodents,
other mammals and birds, has two small round median bodies.
Giardia agilis is found m amphibian hosts and has a teardrop
shaped median body.
Kulda and Nohynkova (1978) proposed more than forty different
species based on the host animal from which Giardia was isolated.
However this system has not been widely accepted.

2
Erlandsen and Bemrick (1987) proposed another species, Giardia
psittaci which was isolated from a parakeet. This differentiation
was based on evidence obtained from scanning electron n1icroscopy.
Morphological differences were observed when compared with other
known species. Giardia ardeae isolated from a great blue heron
by Erlandsen et al (1990) appeared to be yet another new species,
based on the morphological criteria and chromosomal migration
patterns.
The median body of Giardia ardeae appears to be ple01norphic
and this observation, along with the fact that the median body of
Giardia psittaci resembles that of Giardia muris, led Erlandsen
et al (1990) to conclude that the determination of Giardia at
species level based on median body structure should no longer be
considered an adequate taxonomic tool.
Giardia intestinalis exists m two fom1s in its life cycle; namely
the trophozoite and the cyst. The trophozoite is binucleate, has
four pairs of flagella and 1s bilaterally symmetrical (Filice 1952).
Multiplication occurs at this stage by binary fission. The
trophozoites colonise the upper two thirds of the small intestine (ie.
the duodenum and jejunum) by attaching to the microvillus border
with their ventral adhesive discs (Meyer and Jarroll 1980). The
trophozoites detach and encyst as they travel down the intestinal
tract of the host. The cyst form is subsequently excreted with the
faeces.

3
The cyst form is the infective stage in the life cycle and infection
in a new host occurs through the ingestion of Giardia cysts which
excyst in the duodenum. The resulting trophozoite undergoes
mitotic division to establish infection.
1. 2 Pathogenicity, disease and symptoms.
The mode of pathogenicity in giardiasis is still unclear. Invasion
of the mucosal and submucosal layers of the intestine by Giardia
trophozoites are unusual in giardiasis, but damage to the microvilli
does occur. Scanning electron microscopy of the intestinal
epithelium from murine models for giardiasis (Erlandsen and Chase,
197 4) and of human intestinal biopsies from giardiasis patients
(Erlandsen and Feely, 1974) show disc shaped lesions on the
microvillus border created by the ventral disc of the trophozoite.
These lesions could disrupt the functional integrity of the
microvillus border and cause deficiencies in dissacharidase, peptide
hydrolase, enteropeptidase activity and vitamin B 12 absorption
(Wolfe, 1978; Burke, 1975). Mechanical obstruction to food
absorption in the intestine due to the adherence of millions of
trophozoites to the microvillus border has also been postulated as a
disease mechanism (Wolfe 1978).
Giardiasis may range from an acute gastro-intestinal illness to being
virtually asymptomatic. Symptoms vary and may include nausea,
fever, abdominal cramps, anorexia, abdominal distention followed by
foul fulminant diarrhoea and flatulence. Diarrhoea usually lasts for
at least six weeks (Walzer et al, 1971; Brodsky et al, 1974).

4
Most patients recover after appropriate drug therapy although
spontaneous recovery from giardiasis does occur while 1nany
individuals recover from giardiasis after appropriate drug therapy.
Sometimes the condition may become chronic, lasting three years
or more (Wolfe, 1978; Chester et al, 1985). The number of
cysts excreted by patients may also vary widely. Numbers ranged
from barely detectable to over ten million per gram of stool in
one untreated patient (Boucher and Gillin, 1990).
1.3 Presence and detection of Giardia-specific antibody in
Giardia infection.
Antibody responses m giardiasis are present and detectable both in
sera and m other bodily fluids. The indirect immunofluorescence
test and the enzyme Immunoassay (EIA) are the two main methods
used to investigate the nature of the Giardia-specific antibody
response in humans (Ridley and Ridley, 1976; Radulescu et al,
1976; Visveswara et al, 1980; Table 1.).
Various researchers have reported the presence of elevated
Giardia-specific serum IgG levels in giardiasis patients (Ridley and
Ridley, 1976; Radulescu et al, 1976; Visveswara et al, 1980;
Smith et al, 1981; Goka et al, 1986; Miotti et al, 1986; aNash
et al, 1987; Janoff et al, 1988) Giardia-specific serum Igfv1
levels were investigated by Goka et al (1986), Nash et al (1987),
and Gandhi et al (1989). They found Giardia-specific serum
IgM levels to be elevated but this antibody did not persist for
more than a few weeks.

5
There are differing reports on the presence of elevated Giardia
specific serum IgA antibody in Giardia infected individuals.
Ridley and Ridley (1976) could not detect the presence of
Giardia-specific serum IgA in giardiasis patients but Birkhead et
al (1989), Janoff et al (1988), and aNash et al (1987) have
reported elevated Giardia-specific serum IgA levels in Giardia
infected patients.
Giardia-specific secretory IgA has also been reported to be present
in the breast milk of Giardia infected mothers (Nayak et al,
1987) and in the intestinal secretions of Giardia infected volunteers
(aNash et al 1987).
1. 4 Diagnosis of giardiasis
There are two mam techniques available for diagnosis of a
Giardia intestinalis infection in humans. Cyst and trophozoite
detection in faecal samples by microscopic examination ren1ains the
method of choice by most medical laboratories. The second option
is by detecting Giardia antigens in the faeces of the host with a
commercially available test kit. Alternative diagnostic n1ethods,
such as DNA probes, are still very much in their infancy (Butcher
and Farthing, 1988).
Cyst and trophozoite detection m faecal san1ples 1s tedious,
requiring microscopic examination of faecal smears and a well
trained technician to detect Giardia cysts and possibly trophozoites
in diarrhoeic stools.

6
The sensitivity of cyst detection in faecal samples by microscopic
examination is only twenty to fifty percent in a single sample
(Burke, 1977; Wolfe, 1978; Healy, 1979) or fifty to seventy
percent in multiple samples (Burke, 1975; Burke, 1977; Healy,
1979).
Examination of at least three separate faecal samples are
recommended before a final diagnosis 1s made. This is because
Giardia cysts are shed intermittently m faeces. Examination of
faecal samples on alternate days have been shown to give an
increased positive yield over specimens collected on three
consecutive days (Wolfe, 1984).
Two types of Giardia-specific antigen detection tests are available
commercially. The indirect immunofluorescence test detects
Giardia cysts present in faeces and environmental samples using
monoclonal antibodies directed against the Giardia cyst. This test
aids in the identification of Giardia cysts and one commercial test
kit boasts of a test sensitivity of 97.4% (Merifluor™, Meridian
Diagnostics Inc.).
The ProSpecT/Giardia® test (Alexon Biomedical Inc.) is an
enzyme immunoassay available commercially. It detects a Giardia
specific antigen of 65 kilodaltons (k.Da) in faecal samples and is
reported to be 30% more sensitive than conventional microscopic
detection of cysts and trophozoites in faecal smears (Rosoff et al,
1989).

7
Less common techniques include the duodenal biopsy, duodenal
aspirate and the string test (Enterotest®). These procedures may be
necessary if other methods give an inconclusive diagnosis.
Two methods have been used to detect cyst antigens usmg the EIA
test. The cyst antigens are detected by either capturing the whole
Giardia cyst or by detecting soluble Giardia-specific cyst antigens
in the faecal sample (Ungar et al, 1984; bNash et al, 1987;
Stibbs et al, 1988; Green et al, 1988; Knisley et al, 1989;
Janoff et al, 1989; Rosoff et al, 1989).
The sensitivity of the EIA capture technique ranges from eighty
seven to ninety eight percent for antigen detection in faeces (Table
1.) and ninety six percent for direct EIAs detecting Giardia
specific antibodies in sera (Table 2.)
1. 5 Giardia antigens and EIAs in research.
Two approaches have been employed in the development of enzyme
immunoassays (EIA) for Giardia diagnosis and research. EIAs
have either been used to detect Giardia-specific trophozoite
antibodies in sera or Giardia-specific cyst antigens in faecal
samples. The work by different researchers has been tabulated
(Table 1 and 2).
Giardia intestinalis proteins which are potential antigens m a
natural infection have been investigated by Smith et al (1982) and

8
Moore et al (1982). Smith et al (1982) used strains from four
different geographical locations. The sodium dodecyl sulphate
polyacrylamide gel electrophoresis (SDS-PAGE) patterns were found
to be similar in the four strains and the molecular weights of the
protein bands ranged between 12 kDa to 140 kDa. The
electrophoretic migration patterns in the SDS-PAGE showed twenty
six protein bands. Moore et al (1982) demonstrated a minimum
of 20 distinct protein bands following SDS-PAGE separation of
total Giardia trophozoite protein.
Most reports on the study of Giardia intestinalis antigens have
found Giardia surface proteins to provoke an immune response.
(Edson et al, 1986; Ortega Pierres et al, 1988; Wenman et al,
1986; Taylor and Wenman, 1987)
There have been two approaches to this area of antigen
determination in G iardia research. The antigens specific to
Giardia intestinalis have been elucidated either by using human
anti-Giardia sera from giardiasis patients, or by using immune
anti-Giardia sera from laboratory animals.
There seems to be a heterogeneous collection of Giardia proteins
of different molecular weights which were reactive with Giardia
specific antibody in sera.. Giardia proteins of approximately 31,
55, 63 and 88 kDa appear to be the main antigens which elicited
an immune response (Torian et al, 1984; Edson et al, 1986;
Wenman et al, 1986; Taylor and Wenman, 1987; Nash et al,
1988; Ortega Pierres et al, 1988; Reiner et al, 1989) A survey
of the work by other investigators on the identification of Giardia

9
antigens which elicited an munune response m humans and animals
are shown in Tables 3 and 4.

Table 1. A survey of enzy1ne immunoassays developed by other investigators which used Giardia intestinalis cyst as antigen.
Reference. Giardia strain.
1) Ungar et a4 1984 Portland-1 WB
2) bNash et a4 1987 GS/M and lsr WB strain
3) Stibbs et a4 1988 H-2 and H-3
4) Green et a4 1988 Human strain.
Method.
Indirect double antibody EIA.
Indirect double antibody EIA.
Ag. capture.
Ag. capture.
Anti-Giardia antibody source.
%Sensitivity/ Type of Specificity. antigen
Goat and rabbit 92/-anti-Giardiatrophs. sern (P-1 and WB)
Goat polyclonal 94.5/-anti-Giardia WB sera (cyst or trophs.?)
1 ° antibody -mouse 92/-anti-Giardia cyst. 2° antibody -rabbit anti-Giardia cyst.
Pooled rabbit anti- 98/100
Whole cyst and soluble ag. in S/N.
Soluble Giardia ag. in faeces solution (S/N).
Ag. in cell free stool eluate.
Soluble Giardia ag. trophs. and cyst sera in faeces supernatant
Abbreviations: Ag. = Antigen. I O = PrimarJ 2° = Secondaty. SIN = Supernatant. Trophs. = Trophozoites.

Table 1. A survey of enzyme immunoassays developed by other investigators which used Giardia intestinalis cyst as antigen. (cont.)
Reference. Giardia strain. Method.
5) Knisley et al, 1988 Portland- I Ag. capture.
6) Stibbs 1989 H-2 and H-3 Ag. capture.
7) Janoff et al, 1989 Portland- I Ag. capture
Anti-Giardia antibody source.
%Sensitivity/ Type of Specificity. antigen
Rabbit antiGiardia troph. sera Goat anti-Giardia troph. sera
92/87
87/91
1 ° antibody -mouse 97 /-monoclonal. 2° antibody -rabbit 82/-,mti-Giardiacyst IgG
Rabbit antiGiardia 94/95 troph. sera
Soluble Giardiaag. in S/N.
Cyst wall. in formalinised stool Cyst in nonformalinised stool.
Soluble Giardia ag. in S/N.
8) Rosoff et al, 1989 ------ ProSpecT/Giardia® Giardia specific 96/100 GSA 65 diagnostic test. antigen 65 kDa. in stool samples. (Ag. capture) (GSA 65)
Abbreviations: Ag. = Antigen. l O = Primary. 2° = Secondary. SIN = Supernatant. Trophs. = Trophozoites.
,~ . .m W\WA»W~w"""""' . """A'''"""%" ~~---··~--

Table 2. A survey of enzyme immunoassays developed by other investigators which used Giardia intestinalis trophozoite as antigen .
. Reference.
1) Smith et al, 1981
2) Miotti et al, 1986
3) Goka et al, 1986
Giardia strain. Method. An ti-Giardia antibody source.
1 Human strain Wells coated with Human sera from intact trophozoites. patients 2 weeks to
15 months from disease.
Not stated
Portland-I
Wells coated with Human sera from live trophs (2xlot general population. per well).
Wells coated with prefrozen 2x 1 a-1-
trophs/well.
Human sera from patients < 6 weeks from onset of disease.
%Sensitivity/ Giardia-Specificity. specific
96/96
antibody levels.
1' serum IgG in 80% of patients.
1' Giardia specific lgG in some sera.
1' serum lgM.
Abbreviations: Ag. = Antigen I O = Primary 2° = Secondary. S/N = Supernatant. Trophs. = Trophozoites.

Table 2. A survey of enzyme immunoassays developed by other investigators which used Giardia intestinalis trophozoite as antigen (cont.) .
. Reference.
4) aNash et a4 1987
Giardia strain. Method. Antiviardia antibody source.
GS/M and Isr Wells coated with- a)Human sera
(Human strains) a)l0 5 Frozen/ thawed 14-21 days trophozoites. from infection.
b)l0 6 Frozen/ thawed b)Jejunal fluid. trophozoites.
5) Nayak et a4 1987 Not Stated Wells coated with sonicated trophs.
Human milk from infected mothers.
6) Janoff et a4 1988 WB Wells coated with Human sera from
2xl0 5 trophs/ml. AIDS patients and Frozen & thawed 3x. Control sera from
immunocompetent patients.
%Sensitivity/ Specificity.
Giardia-s pecific antibody leveis.
1' serum IgM 100% 1' serum IgG 70%
1' serum IgA 60% 1' secretory IgA 50%
1' secretory IgA in infected mothers.
Normal levels
1' serum IgA, lgG and IgM.
Abbreviations: Ag. = Antigen. 1 ° = Primary. 2° = Secondary. SIN = Supernatant. Trophs. = Trophozoites.

Table 2. A survey of enzyme im1nunoassays developed by other investigators which used Giardia intestinalis trophozoite as antigen (cont.) .
. Reference. Giardia strain. Method. An ti--Giardia antibody source.
7) Knisley et a4 1988 Portland-I Wells coated with Rabbit or goat
8) Gandhi et a4 1989
sonicated trophs.
Multiple Anti-Giardia human strains. antibody coated
onto beads.
9) Birkhead et a4 1989 WB Wells coated with 1 µg trophozoite
proteins.
antiGiardia sera.
Human sera from patients with giardiasis for more than 2 months.
Human sera from patients with giardiasis for 3 to 6 weeks.
%Sensitivity/ Giardia-specific Specificity. antibody levels.
-/97%
1' Antibody levels to Giarciia.
t serum lgM In 33% of cases.
t serum IgA
Abbreviations: Ag. = Antigen. 1 ° = Primary. 2° = Secondary. SIN = Supernatant. Trophs. = Trophozoites.

Table 3. Reaction of Giardia intestinalis antibodies fro1n laboratory animals with Giardia proteins.
References
1) Moore et al, 1982
2) Torian et al, 1984
3) Edson et al, 1986
4) Wenman et al, 1986
Giardia intestinalis Antigen strain recognised
Not stated
Portland-I ,WB RS, LT
Portland- I
MW (kDa)
High molecular weight fraction
170, 155, 53, 55 (Tubulin) Giardia cytoskeleton.
88
WB (ATCC 30957); 62, 52, 38, 31. 4 animal strains; 1 human strain
Localisation
Surface Ag. (trophs)
52 & 31 kDa. Surface Ag. of trophs.
Source of antibody
Rabbit and human anti- sera.
Murine monoclonal to Portland- I Rabbit anti-Giardia Portland- I sera.
Technique employed
SDS-PAGE EIA
Imm uno fluorescence Immunoblot, EIA
Murine monoclonal. Mouse monoclonal antibody.
Rabbit anti-troph. (WB strain) sent.
Immunoblot
Abbreviations: Ag. = Antigen. l O = Primary. 2° = Secondary. SIN = Supernatant. Trophs. = TrophozoiteI
-------------------------

Table 3. Reaction of Giardia intestinalis antibodies from laboratory animals with Giardia proteins (cont.).
References
5) Reiner et al 1989
Giarclia intestinalis Antigen strain recognised
MW (kDa)
WB (ATCC 30957) 21 to 39 kDa poly disperse complex; 66, 78, 92, 103.
Localisation Source of Technique employed antibody
Cyst Ag. Rabbit anti-cyst Rabbit anti-cyst sera sera. used in immunoblot.
Abbreviations: Ag. = Antigen. l O = Primary. 2° = Secondary. SIN = Supernatant. Trophs. = Trophozoite,\:
_______ . .., _ _,..,.. ... ..,,,.~~~~-~ .. -.,.,.._ __ ,,, ... , __ ._,,,.,~,-•'l"'>"'•""'!'l_,_....."_'_,,;_._",~'''-"',._ ___ ,,,,,_,,w,•••••'"..___~~ .. ,flll,_,!' __ ll'WJ1", __ ~\--"''--•-""--'_,",--~J?O"/Jt~-/f,l'/'j""'~'I--•-(<•--"-•-------------

Table 4. Reaction of Giardia intestinalis antibodies from hu1nan sera with Giardia proteins.
References
1) Edson et a4 1986
Giardia intestinalis strain. MW (kDa)
Portland-I
2) Taylor and Wenman, WB (ATCC 30957) 1987
3) Orlega Pierreset a4 Portland-I 1988
Antigen recognised
88
31, 27, 28.
55
82, 63, 55.
Localisation. Technique employed.
Surface Ag. (troph). Immunoprecipitation test.
Surface Ag. (troph) Immunoblot. "Giardin"* Giardia tubulin of Immunoblot. flagella and ventral disc.
Surface Ag. (troph) Immunoprecipitation test.
(*Crossley and Holberton, 1983)
Abbreviations: Ag. = Antigen. I O = Primary. 2° = Secondary. SIN = Supernatant. Trophs. = Trophozoites.

2.0 Materials and Methods. COMPONENTS OF MEDIA , BUFFERS AND REAGENTS
ARE LISTED IN THE APPENDICES.
2 .1 Retrieval of frozen cultures of trophozoites.
il Axenic Culture Production.
18
One strain of Giardia intestinalis was used for all the experiments
described in this thesis: Bris/83/HEPU/106. Source: Duodenal biopsy
of an infected symptomatic child (courtesy of Dr. P.F.L. Boreham,
Queensland Institute of Medical Research) where 83 is the year of
recovery; HEPU is the laboratory where the strain was isolated and
cultivated; 106 is the laboratory sample number.
ill Method.
(a) The trophozoites were retrieved from cultures stored at -80°C
by quickly thawing the cultures in a 37°C waterbath and
transferring them to sterile Kimax™ tubes (13x100mm
borosilicate screw tops).
(b) The Kimax™ tubes were immediately filled with TYl-S-33
growth media and incubated at 37°C for 15 to 25 minutes.
( c) Healthy trophozoites attached to the glass during this time.

19
(d)The media was discarded and filled with fresh TYl-S-33 and
the Kimax™ tubes were allowed to stand for 4 hours to ensure
that all the dimethyl sulphoxide (DMSO) had diffused out of
the trophozoites into the media.
(e) The tubes were refilled agam with TYl-S-33 and all au
bubbles were carefully excluded from the tube to minin1ise
exposure of trophozoites to oxygen.
(f) The tubes were incubated at 37°C for five days or until a
monolayer of trophozoites was observed.
(g) The culture was then subcultured.
2. 2 Subculture of Giardia trophozoites.
il Method.
(a) Giardia trophozoites at a late log. phase of growth were
subcultured by chilling the culture flask (Nunc™) in an ice
waterbath for 30 minutes. This detached the trophozoites.
(b) The flask was inverted several times to obtain a homogeneous
suspension of trophozoites and one ml. of culture was
transferred to a new flask.
(c) The new 50ml flask was filled to the top with TYl-S-33
growth media and all air bubbles were removed.

20
(d) The flask was incubated at 37°C for four days or until a
monolayer of trophozoites was present.
(e) This procedure was repeated to maintain Giardia intestinalis m
culture.
2.3 Harvesting Giardia trophozoites.
il Trophozoites at a late log. phase of growth were harvested as
follows:
(a) Flasks of culture were placed into an ice water bath for thirty
minutes.
(b) The culture was decanted into 50ml centrifuge tubes (Falcon TM)
and the trophozoites were pelleted in a centrifuge at 700xG
for five minutes.
( c) The supernatant was discarded and the pellet resuspended and
washed in phosphate-buffered saline (PBS) and centrifuged at
700xG for five minutes. This step was repeated twice more.
( d) The total number of trophozoites were counted and adjusted to
the required concentration.

21
2.4 Procedure for in vitro encystation of Giardia
intestinalis trophozoites .
.U Method.
(a) A culture flask containing Giardia intestinalis trophozoites at a
late log. phase of growth was decanted and a monolayer of
trophozoites was left in the flask
(b) The culture flask was refilled with fresh bile enriched TYl-S-
33 encystation media and left to incubate at 37°C for 48
hours.
(c) After 48 hours the contents of the flask, which were now a
mixed culture of cysts and trophozoites were decanted into
50ml centrifuge tubes and centrifuged at 700XG for five
minutes.
( d) The supernatant was discarded and the pellet was resuspended
in sterile distilled water. The distilled water lysed the
trophozoites but the cysts remained intact. The cell suspens10n
was stored at 4 °C.

22
2. S Cryopreservation of Giardia trophozoites
These cultures served as a backup source for the orgamsm.
i) The cryopreservation procedure was as follows:-
(a) Giardia trophozoites were harvested at a late log. phase of
growth and the cell suspension was adjusted to 1.2 to 1.5x10⁶
trophozoites per ml with TYI-S-33 growth medium.
(b) 0.25ml of this suspens10n was pipetted into each NuncTM
Cryotube and 0.25ml of dimethyl sulphoxide (DMSO) was
added slowly to each tube ..
(c) The tubes were mixed gently and wrapped in tissue-paper (to
avoid rapid freezing of the trophozoites) and placed into a
polystyrene container.
( d) The whole container was then placed into a -80°C freezer.
After 24 hours, the tubes containing the frozen cultures were
removed from the container, unwrapped, and stored in a rack
at -80°C.
e) For the retrieval of frozen trophozoite cultures, please refer to
section 2.1 (ii) of this chapter.

23
2. 6 Percoll gradient centrifugation .
.U In vitro derived Giardia intestinalis cysts were purified as
follows:
(a) The mixed suspention of in vitro cysts and lysed trophozoites
in water (Refer to section 2.4) was pelleted at l000XG for
five minutes in a 50ml conical centrifuge tube (Falcon™).
(b) The supernatant was then discarded and the pellet was
resuspended in 15ml of Percoll (Pharmacia™) [specific gravity
(sp. gr.) 1.090].
(c) The 15ml of Percoll/cyst-trophozoite suspens10n was overlaid
with 15ml of Percoll of 1.045 sp.gr. followed by 15ml of
Percoll of 1.020 sp.gr. To do this the conical centrifuge
tube was placed at a slant and the 1.045 sp.gr. and the 1.020
sp.gr. Percoll layers were overlaid dropwise with a pasteur
pipette.
d) The Percoll gradients were centrifuged at l000XG for 30
minutes without braking.
e) Pure cysts were retrieved from the 1.090 sp.gr. and 1.045
sp.gr. interface.
f) This procedure was repeated once more usmg the sample
retrieved from the 1.090 sp.gr. and 1.045 sp.gr. interface to
ensure the cyst sample was devoid of lysed trophozoites.

24
2. 7 Antisera production: Inoculation of New Zealand
white rabbits and Balb/C mice.
il Preparation of trophozoite membranes as an inoculum.
(a) A 2ml aliquot of harvested trophozoites (lxl07 trophozoites/ml)
was placed in a bijou bottle (Please refer to section 2.3 ).
(b) This was frozen to -20°C and thawed. This procedure was
repeated twice more.
( c) A sample of the culture was checked microscopically to ensure
that the freezing and thawing had ruptured the cell
membranes. Only irregularly shaped, motionless structures were
seen with no "normal" trophozoites viewed.
( d) The ruptured cells were then washed by pelleting the cell
suspension using an EppendorfTM Centrifuge 5414S at full speed
for five minutes, discarding the supernatant and resuspending
the pellet in PBS. This procedure was repeated twice more.
(e) The remammg membranes were resuspended m 2ml of PBS
and stored at -20°C.

25
ill Preparation of cysts as an inoculum.
(a) In vitro cysts were purified by Percoll gradient centrifugation.
(Please refer to section 2.6).
(b) The cysts were collected from the 1.090 sp.gr. and 1.045
sp.gr. interface, washed and adjusted to 4xl07 cysts per ml in
distilled water.
(iii) Immunisation programme for New Zealand white rabbits.
Day 1.- Two rabbits were each immunised with 4x0.25n1l of
Giardia membranes or Giardia cysts subcutaneously.
(Emulsified in Freunds Complete Adjuvant (Difeo™) at a
ratio of 3:5). This inoculation was equivalent to 4xl06
trophozoites or cysts per rabbit.
Dav 14.-Each rabbit was boosted with 0.25ml of Giardia
membranes or cysts ( emulsified m Incomplete Freunds
Adjuvant (Difeo™) at a ratio of 3:5) subcutaneously.
This was equivalent to 4xl06 trophozoites or cysts per
rabbit.
Day 28.-The procedure was repeated as for Day 14. Three days
after the second booster the rabbits were bled from the
ear vem and the Giardia-specific antibody titre was
determined using the indirect immunofluorescence test.

26
Day 35. The procedure was repeated as for Day 14.
Seven days after the third booster the rabbits were bled by cardiac
puncture. Serum was obtained by centrifuging the clotted blood
with Serasieve® at l000XG for ten minutes. The serum was
stored at -80°C.
[Note: This experiment was approved by the Massey
University Animal Ethics Committee (881130 Amended).]
(iv) Immunisation programme for Balb/C mice.
Day 1- Ten mice were each immunised with 4x0.2ml Giardia
membranes or Giardia cysts (emulsified in Freunds
Complete Adjuvant (Difeo™) in a ratio of 3:5)
subcutaneously. This inoculation was equivalent to 5x10⁴
trophozoites per mouse.
Day 14- The mice were boosted with 0.2ml of Giardia me1nbranes
or Giardia cysts (in PBS) intraperitoneally.
Day 28- The mice were boosted agam with 0.2ml of Giardia
membranes or Giardia cysts (in PBS) was given
intraperitoneally.
Five days later, the mice were bled and their antisera was obtained
by centrifuging the clotted blood with Serasieve® at l000XG for
10 minutes and stored at -80°C. The immune sera were used in
27
the indirect immunofluorescence test and enzyme immunoassay.
[Note: This experiment was approved by the Massey
University Animal Ethics Committee (87161 Amended).]
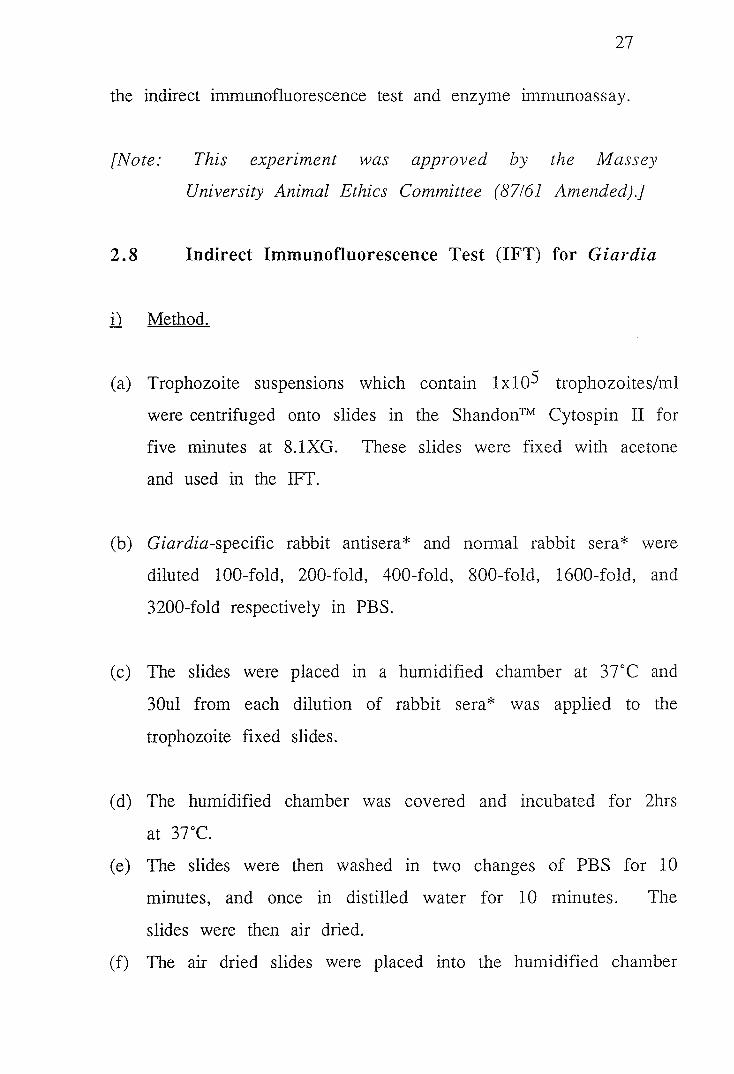
2.8 Indirect Immunofluorescence Test (IFT) for Giardia
i) Method.
(a) Trophozoite suspensions which contain lxl05 trophozoites/ml
were centrifuged onto slides in the Shandon ™ Cytospin II for
five minutes at 8.lXG. These slides were fixed with acetone
and used in the IFT.
(b) Giardia-specific rabbit antisera * and non11al rabbit sera * were
diluted 100-fold, 200-fold, 400-fold, 800-fold, 1600-fold, and
3200-fold respectively in PBS.
(c) The slides were placed in a humidified chamber at 37°C and
30ul from each dilution of rabbit sera* was applied to the
trophozoite fixed slides.
( d) The humidified chamber was covered and incubated for 2hrs
at 37°C.
( e) The slides were then washed in two changes of PBS for 10
minutes, and once in distilled water for 10 minutes. The
slides were then air dried.
(f) The air dried slides were placed into the humidified chamber

28
at 37°C and 30ul of an 80-fold dilution of fluorescein
conjugated goat-anti-rabbit IgG* (Sigma™) in PBS was applied
to each trophozoite fixed slide and incubated for two hours.
(g) The slides were then washed in two changes of PBS for 10
minutes, and once in distilled water for 10 minutes.
(h) The slides were air dried and mounted under the mounting
fluid at pH 8.5 (9 parts glycerol: 1 part 0.5M carbonate
buffer pH 9.5).
(i) The slides were stored overnight at 4 °C in a humidified
chamber until examined microscopically under ultra-violet light.
* Mouse anti-Giardia serum was also tested uszng the
immunofluorecence test. Mouse serum was used in place of
rabbit serum at the following serum dilutions: 10-fold, 50-
fold, 100-fold, 500-fold, 1000-fold and 5000-fold. A
fluorescein conjugated goat anti-mouse antibody was used.
29
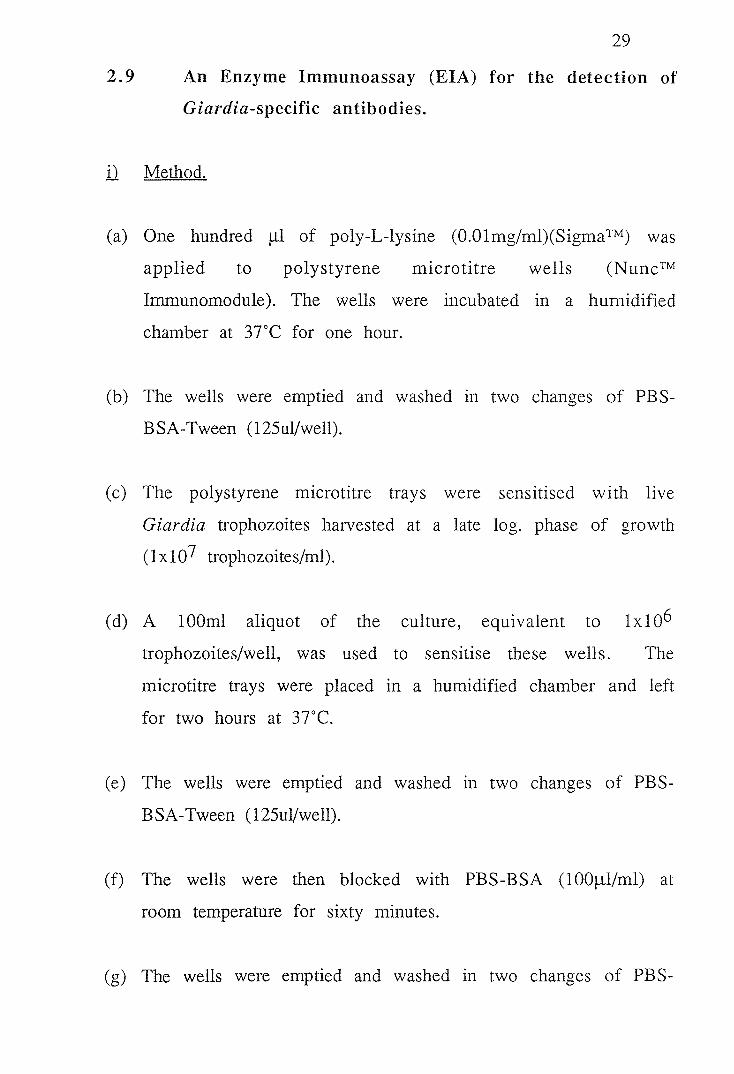
2.9 An Enzyme Immunoassay (EIA) for the detection of
Giardia-specific antibodies.
il Method.
(a) One hundred µl of poly-L-lysine (0.0lmg/ml)(Sigma™) was
applied to polystyrene microtitre wells (Nunc™
Immunomodule ). The wells were incubated in a humidified
chamber at 37°C for one hour.
(b) The wells were emptied and washed m two changes of PBS
B SA-Tween (125ul/well).
(c) The polystyrene microtitre trays were sensitised with live
Giardia trophozoites harvested at a late log. phase of growth
(lx107 trophozoites/ml).
(d) A 100ml aliquot of the culture, equivalent to lxl06
trophozoites/well, was used to sensitise these wells. The
microtitre trays were placed in a humidified chamber and left
for two hours at 37°C.
(e) The wells were emptied and washed m two changes of PBS
BSA-Tween (125ul/well).
(f) The wells were then blocked with PBS-BSA (100µ1/ml) at
room temperature for sixty minutes.
(g) The wells were emptied and washed m two changes of PBS-

30
BSA-Tween. After washing, effort was made to ensure that
the wells were totally emptied of buffer.
(h) Serum samples which were to be tested were serially diluted
in PBS-BSA-Tween.
(i) A l00ul aliquot of each serum dilution was added to each
well in duplicate and the wells were incubated at 37°C for
two hours.
U) The wells were emptied and washed in two changes of PBS
BSA-Tween and the fluid was removed by tapping the plates
on a paper towel.
(k) A l00ul aliquot of conjugate (alkaline phosphatase labelled
anti-immunoglobulin IgG, IgM or IgA (SigmaTM) diluted 1000-
fold in PBS-BSA-Tween) was added to all the wells and
incubated at 37°C for one hour.
(1) The wells were washed m two changes of PBS-BSA-Tween.
(m) A l00ul aliquot of substrate solution (p-nitrophenyl phosphate
at lmg/ml in substrate diluent) was added to the wells and
incubated at room temperature for 30 minutes in the dark.
(n) A 50ul aliquot of 3M NaOH was added to the wells to stop
the enzyme reaction. The absorbance of each well was read
at 410nm using a Dynatech™ Microelisa Minireader MR500.

31
2.10 Protein determination of san1ple for use in sodium
dodecyl sulphate polyacrylamide gel electrophoresis
(SDS-P AGE).
il Protein determination of Giardia intestinalis was based on a
modified method of Bradford (1976).
The procedure was as follows:-
(a) Bovine Serum Albumin (BSA) (Sigma™) was prepared from 0
to l00ug per 0.1ml in 0.2M NaOH.
(b) The BSA solutions were heated at l00°C for three minutes
simulating the sodium dodecyl sulphate (SDS) treatment used in
solubilising total Giardia intestinalis proteins.
(c) The BSA solutions were cooled at room temperature and 5ml
of Coomassie Blue-G reagent (Sigma™) was added to each
0.1ml dilution of the different BSA concentrations.
(d) The tubes were mixed by inversion and 3n1l aliquots of the
BSA and Coomassie Blue-G reagent mixture were placed into
disposable plastic cuvettes and their absorbances were measured
at 595nm using a Cecil™ CE599 spectrophotometer.
(e) A standard curve for the estimation of total proteins was
derived from these absorbance values. There was a linear
relationship between absorbances and protein concentration.
The graph was used to determine unknowns.

32
2.11 SDS-PAGE
The SDS-PAGE system used was based on the method of Ionas
(1989) which was a modification of the SDS- discontinuous system
by Laemmli (1970).
A brief description of the procedure follows:
(i) Materials
(a) Glass plate x 1 (13 x 17 cm)
(b) Glass plate x 1 (13 x 17 cm with a notch 2 cm deep and
10 cm long cut along the 13 cm edge)
(c) Perspex spacers x 2 (16 x 1.5 x 0.15 cm)
(d) Perspex spacer x 1 (13 x 1.5 x 0.15 cm)
(e) Petroleum jelly
(f) 11 Bulldog 11 clips
(g) Reservoir gel tank
(h) Perspex stand
(a) A thread of petroleum jelly was piped along the three
straight edges of the notched glass plate.
(b) The three perspex spacers were positioned in accordance
with the length of the glass edges and pressed onto the
petroleum jelly. Care was taken to align the spacers with
the edges of the glass. Another thread of petroleum jelly
was then piped onto the perspex spacers and the remaining
glass plate was pressed into place. The petroleum jelly
forms a seal between the glass and the spacers.

33
(c) The glass mould was set vertically into position on a
perspex stand and secured with clips. The notch was
positioned on top and facing outwards.
(iii) Preparation of the polyacrylamide runnm£ gel
(a) Varying concentrations of acrylamide gels were prepared by
mixing the different solutions in the order given below:-
Acrylamide concentrations
7.5% 10.0% 12.5%
Lower tris buffer 5.0 ml 5.0 ml 5.0 ml
Running gel solution 5.0 ml 6.7 ml 8.3 ml
Distilled water 10.0 ml 8.3 ml 6.7 ml
Ammonium persulphate solution 0.1 ml 0.1 ml 0.1 ml
N,N,N',N' Tetramethyethylenediamine(TEMED ®) 0.01ml 0.01ml 0.01ml
(b) The " running " acrylamide mixture was polyn1erised between
two glass plates measuring 13cm by 17 cm set apart by
perspex spaces.
(c) The runnmg acrylamide mixture was poured into the mould to
about 3cm from the edge of the notch and the mixture was
overlaid with 5ml of distilled water.
(d) The polymerisation process took forty five to sixty minutes to
complete and could be gauged by the appearance of an
interface between the gel and the water.

34
(iv) Preparation of the stacking gel.
(a) The 4.5% stacking gel mixture was prepared by m1x1ng the
different solutions in the order given below:-
Upper tris buffer
Stacking gel solution
Distilled water
Ammonium persulphate solution
2.5 ml
1.5 ml
6.0 ml
0.05ml
N,N ,N',N' Tetramethylethylenediamine(TEM ED@) 0.01 ml
(b) After the runmng gel mixture has polymerised, the layer of
water was removed and replaced by the stacking gel mixture.
(c) The stacking gel mixture was filled to about 0.5cm from the
edge of the notch and a perspex comb (with teeth 0.75cm
wide, 3 mm apart and 17 mm long) was carefully inserted
between the glass plates into the stacking gel mixture. The
trapping of air bubbles around the comb was avoided.
(d) The stacking gel mixture took ten to fifteen minutes to
polymerise. After polymerisation was completed, the perspex
comb was removed and the wells created by the perspex
comb were washed in Tris-Glycine Reservoir Buffer.
(e) The glass plate / gel apparatus was then removed from the
vertical stand and the bottom spacer was withdrawn.

35
(f) The upper reserv01r edge of the gel electrophoresis apparatus
which would be in contact with the gel slab (ie. the notch of
the glass plate) was lined with a thread of petroleum jelly.
This is to provide a liquid-tight seal between the upper and
lower reservoir thus ensuring that the current would flow
through the gel.
(g) The glass plate / gel slab was then pressed vertically into position
onto the gel electrophoresis apparatus with the notch facing
inwards toward the upper reservoir. The whole assembly was
secured by clips.
(h) The upper and lower reservo1rs were filled with Tris-Glycine
Reservoir buffer.
hl Giardia intestinalis protein sample for SDS-PAGE.
(a) Giardia intestinalis trophozoites were harvested at a late log.
phase of growth and washed twice more in phosphate buffered
saline (PBS).
(b) The supernatant was discarded and the pellet was resuspended.
A 1 00ul aliquot of the trophozoite pellet was solubilised with
25ul of SDS-Sample Buffer and 12.Sul of Bromophenol Blue
Tracking Dye. The mixture was heated at 100°C for five
minutes and cooled at room temperature.
(c) The solubilised sample equivalent to 20, 40, 60, 80, 100, 120,
or l 40ug of protein ( or 300ug of protein for immunoblots) as

36
determined by the protein assay was applied to the wells cast
in the stacking gel and electrophoresed at 15mA until the dye
front of the sample had travelled 0.5cm into the running gel.
( d) The protein samples were then electrophoresed at 1 0mA until
the dye front has progressed 10cm into the running gel.
(iv) Staining and destaining of protein bands m the gel.
(a) Immediately after electrophoresis the gel was removed from
the apparatus and gently agitated in Coomassie Blue stain
overnight.
(b) The gel was then destained in several changes of 10% acetic
acid and the process was completed when all the stain had
diffused out of the gel and only the protein bands were visibly
stained.
(c) The gel was finally washed m distilled water and
photographed.

37
2.12 Immunoblotting.
Proteins for use in the immunoblots were separated by SDS-PAGE.
The immunoblot procedure was basically that of Ionas (1989) with
slight modifications.
2.12.1 Setting up of the immunoblot apparatus.
ill Materials:-
(a) Perspex Gel Holder (Bio-Rad™)
(b) Rectangular tray 4cm deep.
(c) 6 sheets of Whatman™ 3mm chromatography paper (21x16cm).
(d) Two support pads (21x16xlcm).
(e) 0.45um Pure Nitrocellulose paper (Bio-Rad™ or Scheicher and
Schuell, Germany) cut to the size of the protein gel.
(f) Trans-blot (Bio-Rad™) gel tank.
(g) Bio-Rad™ 250/2.5 power pack.
(ii) Method of assembly.
(a) The perspex gel holder consisted of two different coloured
perspex panels (transparent and grey) joined by a hinge which
could be clamped together by a perspex clasp. The holder
was left open and the grey panel was placed horizontally into
a tray was filled with transfer buffer. The transparent panel
was left leaning at a right angle to the grey panel.
38
(b) A support pad was placed on the grey panel followed by
three sheets of Whatman TM 3mm chromatography paper which
were all submerged in the transfer buffer. The layers were
gently pressed down at the middle and by slowly sliding
outwards, any air bubbles trapped between the sheets were
eased to the edge and released.
(c) In the mean time, the polyacrylamide gel electrophoresis of the
protein samples were completed and a strip of the protein
sample from the gel was stained for total protein bands. This
step was to ensure proper separation of the protein samples in
the SDS-P AGE.
(d) The remammg gel was carefully layered onto the Whatman™
3mm chromatography paper from step (b). A sheet of
0.45um pure nitrocellulose cut to the size of the
polyacrylamide gel was positioned on the gel. (The
nitrocellulose sheet was presoaked by capillary action m
transfer buffer. This was done by carefully floating the
nitrocellulose sheet on the buffer for a few minutes and then
submerging the whole sheet.)
(e) Three more sheets of Whatman™ 3mm chromatography paper
were placed on top of the nitrocellulose sheet followed by
another support pad, excluding all air bubbles in the same
manner as in step (b).

39
(f) The transparent perspex panel was pushed down onto the
whole assembly and was securely clamped together; all the
time submerged in transfer buffer.
2.12.2 Wet electrophoretic transfer of the immunoblot.
(a) The " Trans-blot " gel tank was filled with transfer buffer and
the whole transfer assembly was slotted into position at the
middle of the tank with the grey perspex panel facing the
cathode end (black electrode) and the transparent panel facing
the anode end (red electrode).
(b) The immunoblot was transferred overnight at 30 volts usmg
the Bio-Rad™ 250/2.5 power pack and increased to 60 volts
for another two hours the next day.
(c) After transfer was completed the power supply was
disconnected and the transfer sandwich disassembled. The
nitrocellulose sheet was immersed in Tris-Buffered Saline
(TBS) and agitated. The polyacrylamide gel was stained with
Coomassie Blue to verify transfer.
2.12.3 Development of Immunoblot.
(a) The nitrocellulose sheet was transferred from the TBS to
100ml of 0.1 % Tween Tris Buffered Saline (TTBS)-3% gelatin.
The nitrocellulose sheet was blocked at 28°C with agitation
for four hours. After this the nitrocellulose sheet was

40
washed twice for five minutes m TTBS with agitation.
(b) The blocked nitrocellulose sheet was then placed into a plastic
bag made to the size of the nitrocellulose sheet along with
5ml of immune serum (diluted 20-fold in TTBS-1 % gelatin).
Air bubbles caught in the bag were eased out of the bag and
the bag was sealed.
(c) The sealed bag was then incubated overnight at 28°C with
agitation.
(d) The immunoblot was then washed twice m TTBS and
transferred to 100ml of TTBS-1 % gelatin containing 33ul of
horseradish peroxidase conjugated anti IgG, M, or A which
was a 3000-fold dilution of the conjugate.
(e) The blot and conjugate were incubated for an hour at 28°C
with agitation, washed twice in TTBS for five minutes each
and once in TBS for five minutes with agitation.
(f) While the nitrocellulose sheet was being washed, the
horseradish
prepared.
peroxidase colour
The immunoblot
development
was placed
solution was
1n 100ml of
horseradish peroxidase colour development substrate solution
and agitated. Protein bands started to appear after about five
minutes but the colour reaction was left for up to thirty
minutes until the bands were suitably darkened.

41
(g) The reaction was stopped by rmsmg the immunoblot in distilled
water.

42
3.0 Results
3.1 Enzyme immunoassay
Recovery of Giardia cysts prepared zn vitro
Giard i a cysts prepared zn vitro are contaminated with
trophozoites. This preparation was added to a "stepped" Percoll
gradient and centrifuged. Two bands were observed. The upper
band was at the interface of specific gravity (sp.gr.) 1.020 and
sp.gr. 1.045 and contained both cysts and lysed trophozoites. The
lower band at the interface of sp. gr. 1.045 and sp. gr. 1.090
contained only cysts. The percentage of cysts recovered in each
fraction is shown in Table Sa.
The two fractions were recentrifuged in Percoll gradients. Cysts
and lysed trophozoites from the upper band were again found in
the upper fraction. Similarly, those from the lower fraction were
detected in the lower fraction. (Table 5b ).
Determination of cyst viability
The cysts obtained from different density reg10ns following Percoll
Gradient centrifugation were stained with fluorescein diacetate
(claimed to stain living cysts only) and propidium iodide (claimed
to stain dead cysts only). The results are shown in Table 6 and
Table 7.

Table 5a. First Percoll gradient centrifugation of Giardia cysts:
Sample
One
Two
Three
Cyst recovery at specific gravity interfaces
Initial cyst count / 10ml Sp. gr. interface
4.08 X 10⁷
7.2 X 10⁷
1.4 X 10⁷
(i) 1.020/1 .045
(ii) 1.045/1.090
(i) 1.020/1 .045
(ii) 1.045/1.090
(i) 1.020/1.045
(ii) 1.045/1.090
No. of cysts recovered at interface fraction
3.02 X 10⁷
6.60 X 10⁵
4.70 X 10⁷
3.20 X 10⁶
9.90 X 10⁶
1.30 X 10⁶
% Recovery
74.0
1.6
65.0
4.4
70.7
9.2
The above table shows the recovery of Giardia cysts prepared in vitro from the upper and
lower Percoll sp.gr. fractions. The sample from each fraction was recentrifuged in a second
Percoll Gradient and the recovery of Giardia cysts was recorded in Table 5b.

Table 5b. Second Percoll gradient centrifugation of Giardia cysts: Cyst recovery at specific gravity intei·faces.
Sample Fraction Sp .gr .interface No. of cysts recovered % Recovery
One (i) 1.020/1.045 sp.gr.
(ii) 1.045/1.090 Sp.gr.
Two (i) 1.020/1.045 sp.gr.
(ii) 1.045/1.090 Sp.gr.
Three (i)l.020/1.045 sp.gr.
(ii) 1.045/1.090 sp.gr.
1.020/1.045
1.045/1.090
1.020/1.045
1.045/1.090
1.020/1.045
1.045/1.090
1.020/1.045
1.045/1.090
1.020/1.045
1.045/1.090
1.020/1.045
1.045/1.090
at interface fraction.
2.30 X 10⁷
4.30 X 10⁵
1.40 X 10⁵
4.30 X 10⁵
3.16 X 10⁷
2.54 X 10⁶
3.52 X 10⁵
2.17 X 10⁶
7.17 X 10⁶
2.48 X 10⁵
2.33 X 10⁵
9.26 X 10⁵
76.2
1.4
21.2
65.2
67.3
5.4
11.0
67.7
72.4
2.5
17.9
71.2
This table shows the number of cysts recovered from the upper (1.020/1.045 sp.gr.) and lower (1.045/1.090 sp.gr.) Percoll
gradient interfaces after the upper and lower Percoll bands were recentrifuged in a second Percoll gradient.

Table 6. Viability detennination of cysts recovered fro1n the upper Percoll band at the interface of sp.gr. 1.020 and sp.gr. 1.045
.s.lliiu
Propidium iodide
Fluoresein diacetate
Treatment
Untreated
Heat treated b
Untreated
Heat treated
a Mean of three count
Fluorescent cysts
18
21
0 0
NUMBER OF CYSTS COUNTED IN 0.1µ1 a Non-Fluorescent cysts
60 52
85 81
% Fluorescing
23
29
0 0
b "Heat treated" indicates Giardia cysts were heated at 100 'C for 15 minutes.

Table 7. Viability determination of cysts recovered from the lower Percoll band at the interface of sp.gr. 1.045 and sp.gr 1.020.
NUMBER OF CYSTS COUNTED IN O. lµla
Stain Treatment Fluorescent cysts Non-Fluorescent cysts % Fluorescing
Propidium iodide Untreated 36 58 38 Heat treatedb 25 40 38
Fluorescein diacetate Untreated 9 46 16 Heat treated 0 48 ()
a Mean of three count
b "Heat treated" indicates Giardia cysts were heated at JOO <C for 15 minutes.

47
This investigation was not primarily concerned with the viability or
otherwise of in vitro Giardia cysts. We conclude, however, that
propidium iodide is not a reliable method of estimating viability
since no change in staining occurred after heating.
Fluorescein diacetate stained 16% in vitro cysts before heating and
none after heating. While the percentage stained is low (16%) this
figure probably represents a minimum estimate of viability. We
conclude that the lower band contains cysts which better represent
m vivo derived Giardia cysts than do cysts from the upper band.
In vitro cysts purified by Percoll centrifugation and collected from
the lower band were subsequently used in all experimental
applications which require Giardia cysts in this thesis.
3.1.3 Titration of Giard i a antisera by the Indirect
Immunofluorescence Test.
Antibody was prepared m rabbits and mice usmg Giard i a
trophozoites or cysts as immunising antigen. These antisera were
used to develop an EIA test and for immunoblotting to investigate
the relative antibody response to different antigens. Preliminary
titration of the antisera were undertaken usmg an indirect
immunofluorescence test. The results (Table 8 and Table 9) show
that both antisera stained cysts in the immunofluorescence test.

48
Table 8. Indirect immunofluorescence test of Giardia antisera prepared in rabbits.
Test antigen Serum dilution Anti-cvst sera Anti-tro2hozoite Normal
sera Rabbit sera
Giardia cysts 100-fold +a + b
200-fold + + 400-fold + + 800-fold + +
1600-fold
3200-fold
a = Fluorescent staining detected.
b = Fluorescent staining not detected.
Table 9. Indirect immunofluorescence test of Giardia antisera prepared in mice.
Test antigen
mouse
Giardia
trophozoites
Serum dilution Anti-trophozoite sera
10-fold +a
50-fold + 100-fold + 500-fold +
1000-fold + 5000-fold
a = Fluorescent staining detected.
b = Fluorescent staining not detected.
Normal
+ _b

49
Preliminary development of an EIA
To establish an EIA to detect Giardia specific antibodies, different
preparations of Giardia trophozoite antigen were used to coat
polystyrene microtitre wells. EIA tests were repeated three times
for each antigen preparation and the results were tabulated (Table
10.).
Table 10. Enzyme Immunoassay with different
Giardia antigen preparations*.
Anti2:en preparation Assav 1 Assav 2
I .Frozen and thawed trophozoites 0.145 0.380 2.Trophozoite membranes 0.175 0.300 3.Live trophozoites 0.140 0.290 4.Sonicated trophozoites 0.210 0.170
* A I Of old dilution of Giardia-specific mouse antis era
was used in all the assays.
Assay 3
0.225 0.440 0.170 0.140
It can be seen that tests usmg the four antigen preparations gave
inconsistent results. Most investigators use trophozoites as antigen
but it was observed in our tests that after the first wash m the
EIA procedure, few if any trophozoites remained adsorbed to the
microtitre well (Fig. 2).
inconsistent results.
This could account for the low and

50
Several methods could be used to attach Giardia trophozoites onto
the microtitre well. Giardia antibodies could be used to capture
the Giardia trophozoites or the trophozoites could be attached by
poly-L-lysine. The latter was investigated. Microtitre wells were
treated with poly-L-lysine, a large excess of trophozoites was added
to each of the wells, and the time needed for trophozoites to
attach is shown in Table 11.
Table 11. Trophozoite adherence to wells coated with poly-L-lysine
Incubation time (minutes) 15 30 45 60 90
120 180
% Area with adhered trophozoite* 40 40 40 40 40 40 40
*Note. Area estimated visually uszng 40x magnification
After fifteen minutes about forty percent of the microtitre well had
trophozoites attached, and remained attached following the initial
washing. and that the number of attached trophozoites did no.t
mcrease with increased time of contact in the well. The
trophozoites remained attached throughout subsequent steps in the
EIA (Fig. 1).

51
Giardia cysts in tum failed to attach to the microtitre well in the
sense that none were observed after the first wash in the EIA
procedure. Poly-I-lysine was then used to coat the wells and was
found to promote cyst attachment (Fig 3.) which withstood washing
Giardia cysts attached using poly-I-lysine were used in subsequent
EIA tests.
The results of the EIA tests with and without pretreatment of the
microtitre wells with poly-I-lysine are shown in Table 12.
Table 12. Enzyme Immunoassay with and without poly-L-lysine.
Absorbance ( 410nm)
Antigen source Treatment Assay 1 Assay 2 Assay 3
Cysts i)No poly-L-lysine 0.120 0.190 0.250
Live
trophozoites
ii)Poly-L-lysine 0.690 0.710 0.725
i)No poly-L-lysine
ii)Poly-L-lysine
0.140
0.760
0.290
0.790
0.170
0.750
We conclude that attachment of trophozoites and cysts by poly-L
lysine gives more consistent results and increases the sensitivity of
the test. This method was subsequently used to assay Giardia
antibody in human sera.

52
Figure.I
Figure.2
Giardia trophozoites attached by poly-L-lysine to the polystyrene microtitre well.
Microtitre wells not treated with poly-L-lysine. No trophozoites were attached to the well after washing.


53
Figure.3 Giardia cysts attached by poly-L-lysine to the microtitre well..
Note: No cysts were observed in wells that were not treated with poly-I-lysine


54
3.1.5 Detection of different immunoglobulin classes of antibody
to Giardia in human sera
Using an EIA with Giardia trophozoites or cysts attached by poly
L-lysine as antigen, human sera were tested for Giardia-specific
antibody of the three immunoglobulin classes: IgG, IgM and IgA.
Serum samples were allotted to one of three groups: convalescent
patients; patients with current infections and "negative control".
Serum samples from patients who had receivec drug therapy for
giardiasis were considered as "convalescent" sera. "Current
infection" sera were from patients who had not yet received any
therapy for giardiasis and "negative control" sera were obtained
from volunteers who had no history of giardiasis.
Each serum sample was tested for antibody at three dilutions; 10-
fold, 100-fold, and 1000-fold. The results are shown in Tables
13(a) to 14(b) and are also illustrated in histograms (Fig.4 and 5).
A 100-fold dilution of serum was found to be the optimum
dilution for comparing the Giardia-specific antibody levels in the
three groups of sera based on the histograms.
The mean absorbances obtained in the EIA are shown in Table 15
and Giardia-specific IgM titres of "current" serum samples were
slightly elevated as compared to the "convalescent" and "negative
control" serum samples. Giardia-specific serum IgG titres were

55
slightly elevated in "convalescent" sera when compared to antibody
levels in the other two groups. Giardia-specific IgA titres in all
three groups were low in the two assays and no significant
difference was apparent between the groups. Due to the small
sample size, the results for all three immunoglobulin classes showed
no statistically significant differences between the groups of patients.
3.2 Detection of Giardia antibody to individual
antigens using immunoblots.
3 .2.1 Separation of Giardia proteins by SDS-P AGE.
To optimise the separation of Giard i a proteins pnor to
immunoblotting, different protein concentrations and different
polyacrylamide gel concentrations were compared. The results are
shown in Figure 6, Figure 7 and Figure 8. The optimum separation
corresponded to a concentration of 10% polyacrylamide and a protein
load of l00ug per lane. About 30 Giardia trophozoite protein
bands were detected (Figure 9). Most of these bands fell within the
31 to 200 kilodalton range.
3.2.2 Development of immunoblots usmg rabbit antisera.
To establish the immunoblotting technique, total Giardia trophozoite
proteins separated by SDS-PAGE were "immunoblotted" with rabbit
sera raised against Giardia trophozoites and cysts. The results are
shown in Figure 9(i) and Figure 9(ii). Rabbit antisera to either

Iable lJ(a}.EIA Qf human sera ll:itb Giardia trouboz;oites as test anth:en. QrQUJl one; "Convalescent" sera.
Human serum SERUM SAMPLE DILUTIONS* sam12le no. 10-fold 100-fold 1000-fold
IgG IgM IgA IgG IgM IgA IgG IgM IgA 09004 0.275 0.385 0.010 0.275 0.290 0.010 0.130 0.120 0 09009 0.250 0.410 0 0.230 0.345 0 0.170 0.145 0 09012 0.120 0.335 0 0.220 0.275 0 0.165 0.120 0 JH(306) 0.480 0.440 0.020 0.405 0.355 0.010 0.205 0.140 0 MH(307) 0.330 0.310 0 0.305 0.180 0 0.145 0.060 0 PB(305) 0.260 0.400 0 0.305 0.300 0 0.195 0.160 0 MR(300) 0.385 0.460 0.005 0.315 0.315 0 0.155 0.115 0 CS(202) 0.305 0.290 0 0.195 0.175 0 0.100 0.090 0 VO(314) 0.290 0.500 0 0.285 0.395 0 0.190 0.190 0
Mean 0.299 0.392 0.004 0.282 0.282 0.002 0.160 0.120 0
*Absorbance readings at 410nm (Tests were performed in duplicate).

Table 13(b).EIA of human sera with Giardia troghozoites as test anti~en. Groun two: "Current infection" sera.
Human serum SERUM SAMPLE DILUTIONS* sJun12le no. 10-fold 100-fold 1000-fold
IgG IgM IgA IgG IgM IgA IgG IgM IgA 09002 0.115 0.645 0.010 0.205 0.505 0.010 0.165 0.200 0 09003 0.190 0.260 0 0.240 0.140 0 0.180 0.075 0 09005 0.255 0.500 0.010 0.255 0.400 0 0.150 0.190 0 09006 0.280 0.420 0.010 0.220 0.305 0 0.130 0.130 0 09007 0.320 0.415 0 0.275 0.385 0 0.135 0.135 0 09008 0.170 0.365 0 0.190 0.285 0 0.125 0.130 0 09010 0.240 0.390 0 0.240 0.240 0 0.170 0.115 0 09011 0.205 0.395 0 0.265 0.325 0 0.190 0.205 0
Mean 0.222 0.424 0.004 0.236 0.323 0.001 0.156 0.148 0
*Absorbance readings at 410nm (Tests were performed in duplicate).

Table 13(c).EIA of human sera with Giardia trophozoites as test antigen.
Human serum sample no.
348 349 350 351 352 353 354 BG JT JC Gl
Group three: "Negative control" sera.
IgG 0.410 0.140 0.130 0.165 0.190 0.220 0.120 0.150 0.145 0.185
0.135
l0=fold IgM 0.33 0.325 0.400 0.275 0.320 0.345 0.440 0.300 0.275 0.380 0.415
SERUM SAMPLE DILUTIONS* lQ0-fold
IgA 0.010 0 0
0 0 0.005 0
0 0.010 0.010 0.200
IgG 0.185 0.095 0.080 0.140 0.210 0.105 0.080 0.255 0.225 0.255 0.210
IgM 0.220 0.230 0.285 0.220 0.185 0.210 0.340 0.215 0.205 0.240
0.330
IgA 0.010 0 0
0 0 0 0 0 0 0.01
0.010
IgG 0.105 0.015 0.020 0.015 0.090 0.120 0.135 0.185 0.155 0.145 0.120
1000-fold IgM 0.145 0.130 0.115 0.125 0.025 0.170 0.205 0.115 0.125 0.115 0.155
IoA ~
0 0
0 0 0 0 0
0 0 0 0
Mean 0.181 0.364 0.012 0.167 0.244 0.003 0.100 0.130 0
*Absorbance readings at 410nm (Tests were performed in duplicate).

59
Figure.4 Histogram of the absorbance readings in EIA tests for Giardia antibody of different immunoglobulin classes in human sera, using Giardia trophozoites as antigen.
Figure.4(a) Human sera diluted 10-fold. Figure.4(b) Human sera diluted 100-fold Figure.4(c) Human sera diluted 1000-fold.

Figure 4.
a) 12
. 10
8
6
4
2
0 ABSORBANCE
0.2 0.4 0.6 0.0 0.2 0.4 0.6 0.0 0.2 0.4 0.6 b) 12 IgM IgG IgA
Cl) 10 C)
-a E
8 ell Cl)
E ::I ...
6 Q) Cl)
'-'-< 0
0 4 z
2
0 ABSORBANCE
0.2 0.4 0.6 0.0 0.2 0.4 0.6 0.0 0.2 0.4 0.6 c) 12 IgM IgG IgA
10
t:~~~~ 8
6
4
2
0 ABSORBANCE
0.0 0.2 0.4 0.6 0.0 0.2 0.4 0.6 0.0 0.2 0.4 0.6 IgM IgG IgA
Key: m ~~:~~:~;:itrol
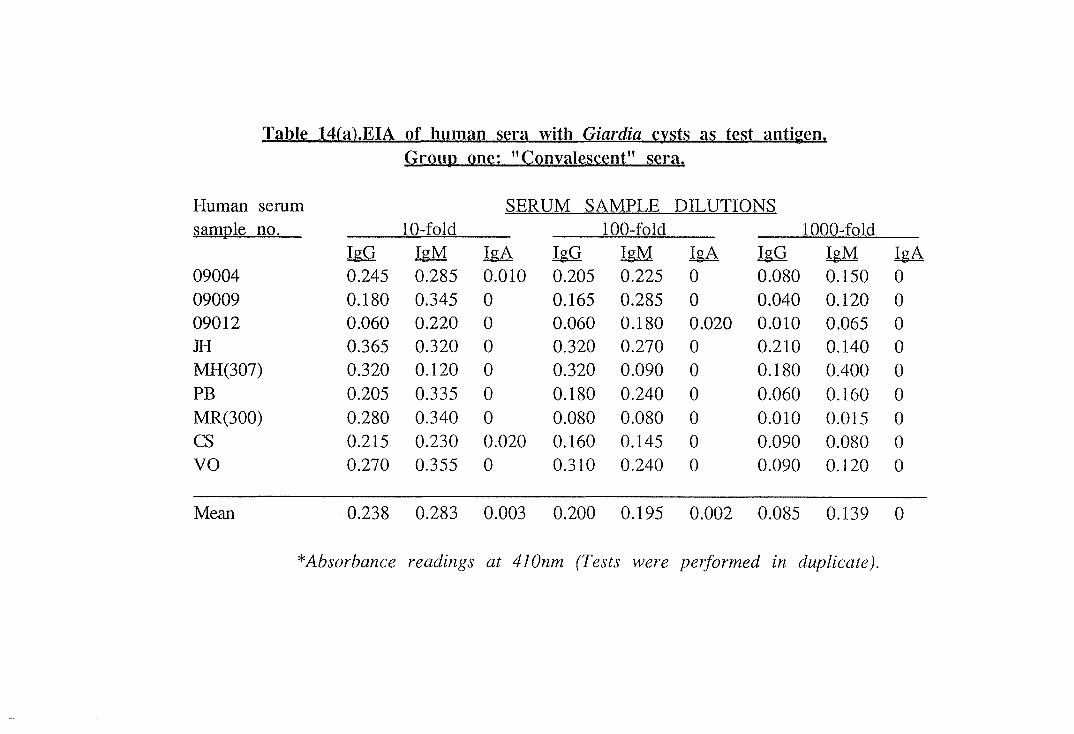
Table l4(a):EIA of hyman sera l;Yith Giardia cl'.sts as test anti~en. Groyp one: "Convalescent" sera.
Human serum SERUM SAMPLE DILUTIONS sam:Ple no. 10-fold 100-fold 1000-fold
IgG IgM IgA IgG IgM IgA IgG IgM IgA 09004 0.245 0.285 0.010 0.205 0.225 0 0.080 0.150 0 09009 0.180 0.345 0 0.165 0.285 0 0.040 0.120 0 09012 0.060 0.220 0 0.060 0.180 0.020 0.010 0.065 0 JH 0.365 0.320 0 0.320 0.270 0 0.210 0.140 0 MH(307) 0.320 0.120 0 0.320 0.090 0 0.180 0.400 0 PB 0.205 0.335 0 0.180 0.240 0 0.060 0.160 0 MR(300) 0.280 0.340 0 0.080 0.080 0 0.010 0.015 0 cs 0.215 0.230 0.020 0.160 0.145 0 0.090 0.080 0 VO 0.270 0.355 0 0.310 0.240 0 0.090 0.120 0
Mean 0.238 0.283 0.003 0.200 0.195 0.002 0.085 0.139 0
*Absorbance readings at 410nm (Tests were performed in duplicate).

Table 14(b).EIA of human sera with Giardia c_yst as test anti~en. Group two: "Current infection" sera.
Human serum SERUM SAMPLE DILUTIONS* sam12le no. 10-fold 100-fold 1000-fold
IgG IgM IgA IgG IgM IgA IgG IgM IgA 09002 0.080 0.460 0 0.120 0.200 0 0.060 0.100 0 09003 0.120 0.230 0.010 0.200 0.275 0 0.140 0.050 0 09005 0.300 0.340 0.040 0.160 0.200 0.020 0.070 0.140 0 09006 0.295 0.450 0 0.210 0.380 0 0.110 0.205 0 09007 0.280 0.190 0.010 0.240 0.120 0.010 0.140 0.090 0 09008 0.120 0.280 0 0.180 0.290 0 0.110 0.145 0 09010 0.180 0.410 0 0.210 0.385 0 0.135 0.225 0 09011 0.215 0.335 0 0.205 0.320 0 0.175 0.150 0
Mean 0.199 0.337 0.008 0.191 0.271 0.004 0.118 0.138 0
*Absorbance readings at 410nm (Tests were performed in duplicate).

Table 14(c}.EIA of human sera with Giardia Cl'.::ltS as te~t antigen . .G1~o~up three: "Negative control" ~sera.
Human serum SERUM SAMPLE DILUTIONS* sami;2le no. 10-fold 100-fold 1000-fold
IgG IgM IgA IgG IgM IgA IgG IgM IgA 348 0.310 0.215 0 0.205 0.135 0 0.080 0.150 0 349 0.160 0.285 0 0.140 0.185 0 0.065 0.090 0 350 0.150 0.370 0 0.095 0.280 0 0.035 0.170 0 351 0.145 0.285 0.010 0.135 0.265 0 0.070 0.125 0 352 0.180 0.160 0.020 0.160 0.100 0.020 0.075 0.050 0 353 0.285 0.310 0.010 0.190 0.205 0 0.080 0.125 0 354 0.100 0.210 0 0.080 0.170 0 0.020 0.065 0 BG 0.170 0.205 0 0.125 0.170 0 0.090 0.060 0 JT 0.165 0.245 0 0.090 0.155 0 0.035 0.110 0 JC 0.130 0.110 0 0.120 0.085 0 0.070 0.025 0 GI 0.190 0.185 0 0.125 0.140 0 0.080 0.065 0
Mean 0.180 0.235 0.004 0.133 0.172 0.002 0.064 0.094 0'1
*Absorbance readings at 410nm (Tests were performed in duplicate).

63
Figure.5 Histogram of the absorbance readings in EIA tests for Giardia antibody of different immunoglobulin classes in human sera, using Giardia cysts as antigen.
Figure.5(a) Human sera diluted 10-fold. Figure.5(b) Human sera diluted 100-fold Figure.5(c) Human sera diluted 1000-fold.

Figure 5.
a) 12
10
8
6
4
2
0 ABSORBANCE
0.2 0.4 0.6 0.0 0.2 0.4 0.6 0.0 0.2 0.4 0.6 b) 12 IgM IgG IgA
10 U'.l 0
i3. 8 8 co U'.l
8 6 :::i .... 0 U'.l
'--< 0 4 ci z
2
0 ABSORBANCE
0.2 0.4 0.6 0.0 0.2 0.4 0.6 0.0 0.2 0.4 0.6 c) 12 IgM IgG IgA
10
8
6
4
2
0 ABSORBANCE
0.0 0.2 0.4 0.6 0.0 0.2 0.4 0.6 0.0 0.2 0.4 0.6 IgM IgG IgA
Key:~ ~~~:~:~~~:rtrol

Table 15. The mean absorbances obtained in EIA tests_forGiardia-specific antibody using cysts or trophozoites as antigen.
EIA with tro12hozoites SERUM SAMPLE DILUTIONS as antigen. 10-fold 100-fold 1000-fold
IgG IgM IgA IgG IgM IgA IgG IgM IgA
"Convalescent" sera 0.299 0.392 0.004 0.282 0.282 0.002 0.160 0.120 0 "Current infection" sera 0.222 0.424 0.004 0.236 0.323 0.001 0.156 0.148 0 "Negative control" sera 0.181 0.364 0.012 0.167 0.244 0.003 0.100 0.130 0
EIA with c;:sts as SERUM SAMPLE DILUTIONS antigen. 10-fold 100-fold 1000-fold
IgG IgM IgA IgG IgM IgA IgG IgM IgA
"Convalescent" sera 0.238 0.283 0.003 0.200 0.195 0.002 0.085 0.139 0 "Current infection" sera 0.199 0.337 0.008 0.191 0.271 0.004 0.118 0.138 0 "Negative control" sera 0.180 0.235 0.004 0.133 0.172 0.002 0.064 0.094 0
--------------

65
cysts or trophozoites reacted with most of the trophozoite protein
bands. These sera were subsequently used as a positive control
when testing human sera. Two faint bands were detected (Figure
9(iii)) using "normal" rabbit sera.
3.2.3 Immunoblotting of human sera usmg Giardia proteins
Human serum samples from clinically diagnosed cases of giardiasis
were tested in immunoblots to identify Giardia proteins which
elicited an immune response in patients. Results indicating a
positive or negative reaction for IgM, IgG and IgA antibody are
shown in Table 16, 17 and 18.
Human
09004
09009 09012 306 307 305 300 314
Note.
Table 16. Immunoblots with "convalescent"
human sera. *
serum sample Antibod):: reaction to trophozoite faG IgM IgA +a + +
+ _b
+ + +
+ + + + +
a = At least one protein band reacted in the immunoblot.
b = No protein band reacted in the irnmunoblot.
proteins
* "convalescent sera" were from patients who had
received some form of drug therapy for giardiasis.

66
Table 17. hnmunoblots with "current sera". *
Human serum sample Antibody reaction to trophozoite protein
09002 09005 09006 09007 09008 09010 09011
IgG fa:M IgA a
+b
+ + + + +
+
+
+
a = At least one protein band reacted in the immunoblot.
b = No protein band reacted in the immunoblot
Note * "Current sera" were from patients who had not yet
received any therapy for giardiasis.
Thirteen of fifteen (87%) human serum samples from clinically
diagnosed cases of giardiasis had IgG antibody which reacted with
trophozoite proteins as compared to four of ten ( 40%) samples
from the "negative control" sera group. IgM antibody was
detected in three of fifteen (20%) samples fron1 clinically diagnosed
cases of giardiasis but was also detected in four of ten ( 40%)
samples of the "negative control" sera group. Five of fifteen
samples (33%) from clinically diagnosed giardiasis cases had IgA
antibody to trophozoite proteins compared to two of ten (20%)
"negative control" serum samples.
IgA antibody in clinically diagnosed giardiasis samples did not react
with any particular protein band and the reaction was weak. Two
of five samples which had a positive reaction reacted with a 62
kDa protein. A 62 kDa and 66 kDa protein were also reactive in

67
two "negative control" serum samples.
IgM antibody reaction with trophozoite protein from clinically
diagnosed giardiasis samples were also varied. Four of ten
negative control serum samples consistently reacted with the 62 kDa
protein.
Table 18. Immunoblot with "negative control sera".*
Human serum sam:ple. Antibod;: reaction to trophozoite protein IgG lgM IgA
348 +a _b
349 + 350 + + + 351 + 352 353 + 354 + 355 + 356 + 357
a = At least one protein band reacted in the immunoblot.
b = No protein band reacted in the immunoblot.
Note. * "negative control sera" were from volunteers who had
no history of giardiasis.
Figures 11 to 16 show the protein bands that reacted with antibody
in human sera. Antibody in human sera reacted with fewer bands
than did the rabbit immune serum. The in1mune response of
humans to Giardia infection is clearly complex and varies between

68
individuals.
Giardia proteins which elicited an antibody response 1n some
patyents did not invariably do so in other patients. However,
three proteins (200 kDa, 62 kDa, and 42 kDa) elicited an IgG
antibody response in many of the clinically diagnosed samples. In
contrast, the negative control sera did not react with the 200 kDa
protein. However, four of ten "negative control" serum samples
reacted with the 62 kDa protein and two reacted with the 4 2 kDa
protein.

69
Figure.6 Total Giardia trophozoite protein electrophoresed m 5% polyacry lamide gel.
The trophozoite protein was electrophoresed at different protein concentrations in each lane.
(From left to right) 10, 20, 40, 60, 80, 100, 120,140, 160, 180, 200, 220, 240, 260 µg of protein per track. Note that the gel front is darkly stained which indicates that it contains many low molecular weight proteins which were not separated at this concentration.


70
Figure 7 Total Giardia trophozoite proteins electrophoresed m 10% polyacrylamide gel.
The total proteins were electrophoresed at different concentrations in each lane.
(From left to right) 10, 20, 40, 60, 80, 100, 120, 140, 160, 180, 200, 220, 240, 260 µg of protein per track. Note that this gel concentration gave good differentiation of the proteins. The arrow shows the optimal protein concentration which gave the best resolution of the protein bands. About 30 protein bands were separated in the gel.

l

71
Figure8 Total Giardia trophozoite proteins electrophoresed m a 12.5% polyacrylamide gel.
The total proteins were electrophoresed at different protein concentrations in each lane.
(From left to right) 10, 20, 40, 60, 80, 100, 120,140, 160, 180, 200, 220, 240, 260 µg of protein per track.
Note that high molecular weight proteins were not well differentiated.


72
Figure 9 SDS-PAGE of total Giardia trophozoite protein in parallel with high and low molecular weight protein markers

Mw/kDa
200
116
97.4
-
-66.2 -
45 -
31 -

73
Figure 10 Immunoblotting of total Giardia trophozoite proteins with rabbit sera.
Figure.lO(i) Rabbit anti-cyst sera.
Figure.I O(ii) Rabbit anti-trophozoite sera
Figure. I O(iii) Normal rabbit sera.

(i) (ii) (iii)

74
Figure.11 Immunoblotting of Giardia trophozoite proteins with human IgG antibody from clinically diagnosed cases of giardiasis.
Each lane represents the reaction of a different serum sample. (From left to right) 09009; 300; 09007; 09012; 306; 314; 09011; 09010; 305; 09006; 09004; 09005; 09008.
Note the lack of uniformity of the human IgG response to Giardia infection.

3:: I 1 ~ ro 0 ·C 0 (0 lO s~ C\I (0
""" ... a. a.
<C

75
Figure.12 Immunoblotting of Giardia proteins with hun1an IgG antibody from "negative control" sera.
Each lane represents the reaction of a different serumsample. (From left to right) 350; 351; 348; 349.
Note that IgG antibody was detected in a few "negative" control samples but the reaction was with fewer proteins as compared to the serum samples from clinically diagnosed cases of giardiasis.

l> "O "O
0) ... .i:,. 7-'o 01 0)
0~
I Q) 3: =E

76
Figure.13 Immunoblotting of Giardia trophozoite proteins with IgA antibody from clinically diagnosed cases of giardiasis.
Each lane represents the reaction of a different serum sample. (From left to right) 09012; 314; 09007; 09010; 09004.
Note that the lgA antibody reacted only with a few bands and the reaction was weak.

Approximately 66 kDa -

77
Figure.14 Immunoblotting of G iardia trophozoite proteins with human lgA antibody from "negative control" sera.
Each lane represents the reaction of a different serum sample. (From left to right) 355; 350.

Approximately 66 kDa
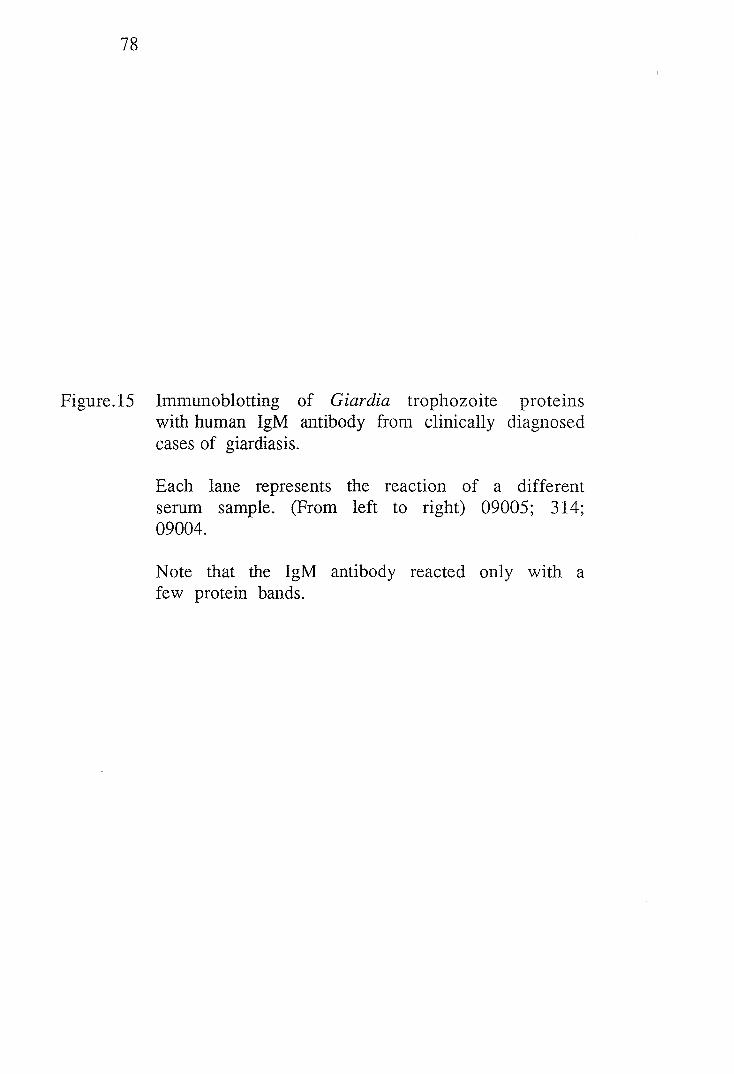
78
Figure.15 Immunoblotting of Giardia trophozoite proteins with human IgM antibody from clinically diagnosed cases of giardiasis.
Each lane represents the reaction of a different serum sample. (From left to right) 09005; 314; 09004.
Note that the IgM antibody reacted only with a few protein bands.


79
Figure.16 Immunoblotting of Giardia trophozoite proteins with human IgM antibody from "negative control" sera.
Each lane represents the reaction of a different serum sample. (From left to right) 356; 350; 354; 353.
Note that all four sera reacted with a 62kDa protein but the reaction was weak.

Approximately
66 kDa -

80
4. Discussion.
Laboratory diagnosis of infectious diseases usually involves one of
two general methods. It can involve the demonstration of the
causative organism or associated antigens or imn1unological methods
can be used. In the latter case, the detection of an antibody rise
or alternatively a raised level of IgM antibody can give an
affirmative diagnosis.
The first of these approaches is used for giardiasis by most
diagnostic laboratories. It typically involves . .
a m1croscop1c
examination of stools for the presence of Giardia trophozoites
and/or cysts. The method requires experienced personnel, is labour
intensive and has only a sensitivity of twenty to fifty percent
(Burke, 1977; Wolfe, 1978; Healy, 1979). This low sensitivity may
be due to the fact that Giardia cysts are shed intermittently. To
increase the rate of detection, examination of three stool san1ples
taken on alternate days is recomn1ended (Burke, 1975; Burke,
1977; Healy, 1979; Wolfe, 1984).
The detection of Giardia antigens m stool samples as a diagnostic
method has recently been the focus of investigations (Table 1) and
a diagnostic test, the "ProSpecT" test detects a Giardia-specific
antigen (GSA 65). This test is available commercially but it is
not yet clear how sensitive and specific it will prove to be.
The present investigation represents a different approach to
diagnosis of giardiasis and attempts to develop a serological test for

81
this purpose. Methods used by other investigators to detect
Giardia-specific antibodies include the immunoprecipitation test, the
indirect immunofluorescence test, the EIA test and immunoblotting
(Table 2 and Table 4). These methods have not been entirely
successful as far as diagnosis of infection is concerned. However,
we decided to investigate the use of the EIA test, since this test is
potentially sensitive, accurate, quantitative and relatively easy to
perform. It 1s also able to distinguish between different
immunoglobulin classes and can be completed in a few hours.
Initial investigations were concentrated on the most appropriate
antigen to use. Frozen and thawed trophozoites, sonicated
trophozoites, trophozoite membranes and live trophozoites were
compared. Trophozoite membranes and sonicated trophozoites gave
inconsistent results and, furthermore, the antibody titres were low
(Table 10). Frozen and thawed trophozoites and live trophozoites
also gave low antibody titres and inconsistent results although most
investigators use these as antigen.
In the course of our work, it was observed that few trophozoites
remained attached to the microtitre well following the first wash in
the EIA procedure. Another investigator (Smith et al, 1981)
reported the same observation following the use of live trophozoites
but did not suggest a solution to the problem.
The inability of the trophozoites to remam adsorbed to the wells
following washing could account for our inadequate result.
Consequently, a method was required to ensure that the

82
trophozoites remained attached. Poly-L-lysine 1s known to promote
cell adsorption to surfaces so we investigated its ability to promote
trophozoite attachment. Wells were coated with poly-L-lysine
before addition of trophozoites. This caused the trophozoites to
remain attached throughout the EIA procedure and consequently this
method was used in subsequent tests. This resulted in an mcrease
in the sensitivity and reproducibility of the assay (Table 12).
Since it appeared possible that different antigens predominate on
trophozoites and cysts, we also investigated Giardia cysts as
antigen in an EIA test. Giardia cysts like trophozoites also failed
to remain adsorbed to the microtitre well in the EIA test so poly-
I-lysine was used to coat the wells. This was successful in
ensuring that the cysts withstood washing. EIA tests with Giardia
cysts were relatively sensitive and reproducible (Table.12).
The above preliminary experiments were conducted with
hyperimmune sera prepared in mice. Having established a protocol
we then used it to detect antibody in human sera.
Human sera was collected from patients who were clinically
diagnosed as having giardiasis. These sera were arbitrarily
grouped as "convalescent" or "current infection" sera.
"Convalescent" sera were from patients who had been diagnosed
some time before serum was collected and had already been treated
for giardiasis whereas "current infection" sera were from patients
who had just then been diagnosed and had not yet been treated for
the disease. In addition, "negative control" sera were obtained
from volunteers who had no history of giardiasis. However, these

83
sera probably included some persons with earlier subclinical and
thus undiagnosed infections.
Giardia-specific antibody was assayed usmg both trophozoites and
cysts as antigen because different antigens. may predominate at the
two stages and this may affect the immune response. Serological
tests using Giardia cysts have not been reported by other workers.
Since whole cysts and live trophozoites were used m this
investigation, the test detected antibody directed against surface
antigens. The antibody titres obtained in the EIA tests were
similar, which suggests that Giardia cysts and trophozoites share
many surface antigens.
The IgG antibody titre m "convalescent" sera showed a slight
elevation (not statistically significant) as compared to "current
infection" sera and "negative control" sera (Table 13(a) to 14(c);
Fig 4 and 5; Table 15). Increased IgG antibody has been reported
by other investigators (Ridley and Ridley 1975; Radulescu et al,
1976; Visveswara et al, 1980; Smith et al, 1981; Goka et al,
1986; Miotti et al, 1986; Nash et al, 1987; Janoff et al, 1988)
and the presence of IgG antibody in convalescent sera is not
surprising since this antibody is present at a later stage of most
infections and tends to persist.
The IgM antibody titres of "current infection" sera were slightly
raised as compared to sera from the other two groups. This
confirms the observation of other investigators. Goka et al
(1986) and Gandhi et al (1989) detected raised IgM levels in the

84
sera of giardiasis patients but this only persisted for six weeks. It
is interesting to note that the "current infection" sera used in this
test were from patients who had been diagnosed with having
giardiasis for six weeks or less; so this study is consistent with the
earlier observation.
IgA antibody was not detected in any of the human sera used in
this investigation. There have been conflicting reports by other
investigators (Ridley and Ridley, 1976) on the Giardia-specific
serum IgA antibody titres in patients but recent investigations by
Nash et al (1987) Janoff et al (1988) and Birkhead et al (1989)
showed an increase of Giardia-specific IgA antibody in the sera of
patients.
The role played by serum IgA antibody m giardiasis 1s still
unclear. Since Giardia causes a surface infection and 1s not
invasive, it might be expected that IgA antibody production would
play a critical role in controlling infection. If so, the IgA
antibody must be produced and released locally since the serum
titres were low.
A maJor aim of this investigation was to find if serological
diagnosis of G iardia is a practical proposition. The slightly
elevated IgM antibody titres (Fig 4 and 5; Table 15) detected m
the serum of persons currently infected with Giardia cannot be
used to reliably distinguish a current from a previous infection of
Giardia. More research in this area is justified and it should be
stressed that this project was handicapped by the lack of availability

85
of an adequate number of human sera particularly from acute
giardiasis cases.
A complex orgamsm like Giardia inevitably produces many
proteins. SDS-PAGE of total Giardia proteins (Fig. 8) indicated
that the organism has at least thirty proteins and it has probably
many more because its total genomic DNA IS about 8.0xl04
kilo bases.
All Giardia proteins are m theory, potential antigens for the
natural host or following immunisation of any mammalian species
with the organism. Thus when rabbits were immunised with
trophozoites and sera were used in immunoblots, it was observed
that about thirty proteins elicited the production of detectable
antibody (Fig. 9).
Giardia 1s not an invasive orgamsm, however, and it n1ight be
expected that in a natural infection only a small number of antigens
(mainly surface antigens) will elicit an antibody response. This
point was investigated by Taylor and Wenman (1987) who used
"current infection" human sera to identify the antigens which were
most effective in producing an antibody response in humans. They
identified four major antigens of molecular weights 27kDa, 28kDa,
3 lkDa and 55kDa. The 3 lkDa protein elicited the strongest
antibody response and was found to be of the same molecular
weight as a Giardia protein found in the ventral disc and
designated "giardin" by Crossley and Holberton (1985). The 55kDa
protein may be Giardia tubulin (Torian et al, 1984) which is a
structural protein of both Giardia flagella and the ventral disc.

86
Our experiments with immunoblotting of human sera were
undertaken to confirm these results. Our results indicate, however,
that the rmmune response to Giardia infection vanes greatly
between individuals although the most consistent IgG antibody
response was to three proteins: 200 kDa, 62 kDa and 42 kDa.
On the assumption that our 62 kDa protein does not represent
Giardia tubulin (55 kDa), none of our hun1an sera showed a
marked immune response to "giardin" or to any of the antigens
found by Taylor and Wenman (1987). We therefore conclude that
the human immune response to a natural infection of Giardia is
complex and more work is needed to clarify the major antigens
involved in the immune response.
A low percentage of human sera from clinically diagnosed patients
had IgA and IgM antibody which reacted to Giardia proteins in
an immunoblot. IgA and IgM antibody, however, were also
detected in "control" sera. In particular, a 62kDa protein reacted
both with sera from patients and "control" sera.The presence of
antibody in the "negative control" sera 1s probably due to
subclinical Giardia infections.

87
5. Appendices. Media. buffers and rea£ents used 1n this thesis.
5.1 Appendix I
General media and reagents.
(i) Percoll in O.lM Phosphate Buffer*.
Specific gravity
1.020 1.045 1.090
Stock percoll (Pharmacia™) sp.gr 1.130 8.3ml 29.17ml 66.7ml
0.lM Phosphate Buffer 91.7ml 70.83ml 33.3ml
*Based on Schaefer et al, 1986
(ii) O.lM Phosphate Buffer*. (Specific gravity 1.010)
Solution A: 27.6g NaH2PO4.H2O/1000ml solution.
Solution B: 71.7g Na2HPO4.12H2O/1000ml solution.
To prepare
50 ml 100 ml 200 ml
Solution A (ml) 7 14 28
Solution B (ml) 18 36 72
0.01 % Tween 20 Ill 25 50 100
distilled water (ml)
500 ml
70
180
250
*Based on Schaefer et al, 1986

88
(iii) Phosphate Buffered Saline (PBS).
Dulbecco's PBS is free of calcium and magnesmm, smce these
cations promote cell clumping.
NaCl
KCl
Na2HPO4
KH2PO4
8.0g
0.2g
1.15g
0.2g
The components were dissolved sequentially in 800ml of distilled
water and the pH was adjusted to 7.3 with lM HCl or NaOH.
The volume was then made up to 1000ml with distilled water and
the solution was sterilised at 121 °C for fifteen minutes. Store at
4°C.
(iv) TYl-S-33 Encystation Medium (Bile enriched)
The bile concentration was increased to 5.0g/litre m place of
0.8g/litre contained in TYl-S-33 growth medium.
The encystation medium was then prepared usmg the same method
as for TYl-S-33 growth medium.

(v) TYl-S-33 Growth Medium
Trypticase Soy Broth (BBL. No. 11768)
Yeast Extract Powder (Difeo No. 0127-01-7)
Glucose
NaCl
K2HPO4
KH2PO4
L-Cysteine Monohydrochloride (Sigma No.C-7880)
Ferric Ammonium Citrate (Brown Pearls)
L-Ascorbic Acid
Bile Bacteriological (Sigma No. B-8381)
Benzyl Penicillin
Gentamycin Sulphate
Vancomycin
aBovine Serum
bNCTC 135 (Sigma No. N3262)
Distilled water to
20.0g
10.0g
10.0g
2.0g
1.0g
0.6g
1.5g
0.023g
0.2g
0.8g
0.06g
0.05g
0.02g
100.0ml
100.0ml
1000.0ml
89
The components were dissolved in distilled water to give a final
volume of one litre. The medium was adjusted to pH 7 .0-7 .2
with 5M NaOH and clarified by positive pressure filtration through
six pieces of Whatman™ filter paper followed by non-sterile 0.2µm
nitrocellulose membrane filter.
A final sterile filtration of the clarified medium was then
performed by filtering through a sterile 0.2µm nitrocellulose

90
membrane filter (sterilised at 121 °C for fifteen minutes within the
filter unit).
The sterile medium was stored at 4 ° C until used. (Maxin1um length
of storage - 14 days.)
Notes: a Bovine serum was prepared in the laboratory by the
centrifugation of blood obtained from the AFFCO Meat
Export Works in Feilding.
b NCTC 135 (Sigma) The medium was prepared as per
manufacturers instructions.
5.2 Appendix 2.
Solutions and reagents used m the EIA.
(i) Phosphate Buffered Saline (PBS)
NaCl
KCl
Na2HPO4
KH2PO4
8.0g
0.2g
1.15g
0.2g
The components were dissolved sequentially in 800ml of distilled
water and the pH was adjusted to 7 .3 with lM HCl or Na OH.

91
The volume was then made up to 1000ml with distilled water and
the solution was sterilised at 121 °C for fifteen minutes. Store at
4°C.
(ii) Phosphate Buffered Saline - Bovine Serum Albumin
(PBS - BSA).
PBS with 1 % w/v Bovine Serum Albumin (Sigma)
Bovine Serum Albumin
PBS
Preserved with 0.02% NaN3 (0.2g/litre)
Store at 4 °C.
(iii) PBS-BSA-Tween
PBS with 1 % w/v BSA and 0.5% v/v Tween 20
Bovine Serum Albumin
Tween 20
PBS
Preserve with 0.02% NaN3 (0.2g/litre)
Store at 4°C.
10.0g
1000.0ml
10g
5g
1000.0ml

(iv) Carbonate-Bicarbonate Buffer (0.0SM)
Na2CO3 (anhydrous)
NaHCO3
NaN3
1.38g
3.llg
0.2 g
92
Distilled water was added to a total volume of 1000ml and
adjusted to pH 9.5 with SM NaOH. Store at 4°C.
(v) Substrate Diluent
9.7% v/v diethylamine (BDH) in distilled water. pH adjusted to
9.8 with concentrated HCL Preserve with NaN3 to 0.02% final
concentration.
(vi) Substrate Solution
Constitute required volume to a ratio of 1mg p-nitrophenyl
phosphate per 1ml of substrate diluent.

5.3 Appendix III
Solutions and reagents used m the immunoblotting
procedure.
(i) Horseradish Peroxidase (HRP) Substrate Solution
93
This solution is composed of two parts and was used
immediately after m1xmg.
Part A:
60mg of 4-chloro-1-naphthol (stored at -20°C) was added to
20ml of cold methanol (AR grade). This solution was dispensed
into a dark bottle and stored at -20°C for a few minutes until
required.
Part B:
60µ1 of hydrogen peroxide (30% w/v) was added to 100ml of
lxTBS at room temperature*.
Parts A and B were then mixed immediately to produce the
working solution and this was used immediately.
*Note: If the working solution (part A plus part B) is stored at
0-4 °C, the substrate will precipitate out of the solution and the
sensitivity of the working solution may be substantially decreased.
At the time the solutions were mixed (part A and part B ), the
substrate (Part A) was at -20°C and the lxTBS-hydrogen peroxide
solution was at room temperature, which maximises their activity

and prolongs their useful life.
(ii) Transfer Buffer
Tris (Hydroxymethyl) Aminomethane
Glycine
Methanol (Analytical Grade)
Distilled water to
12.12g
57.60g
800.0ml
4000.0ml
94
Note: This solution does not reqmre adjustment to pH 8.3 and
the addition of HCI for minor pH corrections should be
avoided as it will cause an ion imbalance
(iii) Tris Buffered Saline (lxTBS)
Tris (Hydroxymethyl) Aminomethane
NaCl
12N HCI adjust to
Distilled water to
Stored at room temperature.
4.84g
58.48g
pH 7.5
2000.0ml

(iv) Tween-20 Tris Buffered Saline (lxTTBS)
Tris (Hydroxymethyl) Aminomethane
NaCl
12N HCl adjust to
Tween-20 (polyoxethylene sorbitan monolaurate)
Distilled water to
Stored at room temperature.
(v) lxTTBS-1 % Gelatine (Antibody Buffer)
Tris (hydroxymethyl) aminomethane
NaCl
12N HCl adjust to
Tween-20
Gelatin (EIA purity reagent, Bio-Rad™)
Distilled water to
4.84g
58.48g
pH 7.5
1.0ml
2000.0ml
0.48g
5.84g
pH 7.5
0.10ml
2.00g
200.ml
95
This solution was made immediately pnor to use. The gelatin was
dissolved in pre-warmed (37°C) lxTTBS and cooled to 28°C before
use.

(vi) lxTTBS-3 % Gelatin (Blocking Solution)
Tris (hydroxymethyl) aminomethane
NaCl
12N HCl adjust to
Gelatin (EIA purity reagent, Bio-Rad™)
Tween-20
Distilled water to
0.24g
2.92g
pH 7.5
3.0 g
0.05ml
100.0 ml
96
This solution was made immediately pnor to use. The gelatin was
dissolved in pre-warmed (37°C) lxTTBS and cooled to 28°C before
use.
5.4 Appendix IV
Solutions and reagents used m the SDS-P AGE.
(i) Ammonium Persulphate Solution
Ammonium Persulphate
Distilled water
This solution was made fresh before use.
0.lg
1.0ml
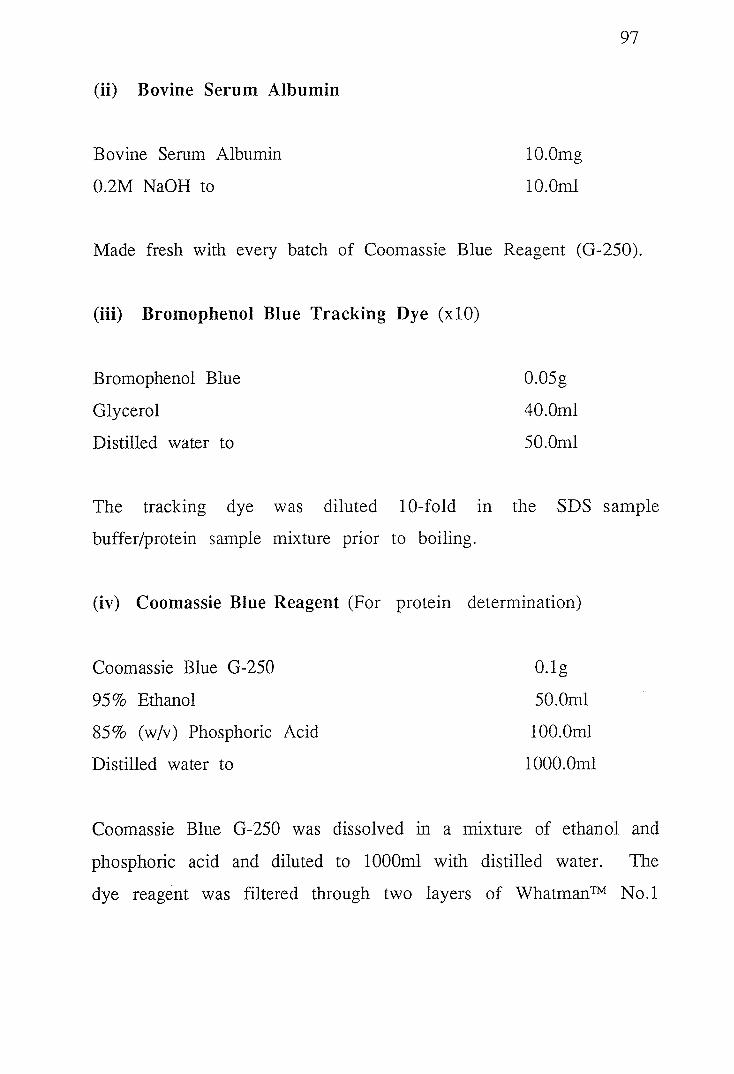
(ii) Bovine Serum Albumin
Bovine Serum Albumin
0.2M NaOH to
10.0mg
10.0ml
97
Made fresh with every batch of Coon1assie Blue Reagent (G-250).
(iii) Bromophenol Blue Tracking Dye (x 10)
Bromophenol Blue
Glycerol
Distilled water to
0.05g
40.0ml
50.0ml
The tracking dye was diluted 10-fold m the SDS sample
buffer/protein sample mixture prior to boiling.
(iv) Coomassie Blue Reagent (For protein determination)
Coomassie Blue G-250
95% Ethanol
85% (w/v) Phosphoric Acid
Distilled water to
O.lg
50.0ml
100.0ml
1000.0ml
Coomassie Blue G-250 was dissolved in a mixture of ethanol and
phosphoric acid and diluted to 1000ml with distilled water. The
dye reagent was filtered through two layers of Whatman™ No.I

filter paper and stored at room temperature m a dark bottle.
(v) Coomassie Blue Stain. (For SDS-PAGE protein gel)
Coomassie Brilliant Blue R-250
Isopropanol
Glacial Acetic Acid
Distilled water to
0.4g
250.0ml
100.0ml
1000.0ml
98
The stain was filtered through two layers of Whatman™ No. l
filter paper before being stored at room temperature.
(vi) Lower Tris Buffer (pH 8.8)
Trizma Base (Sigma)
10% SDS Solution m distilled water
12N HCl to
Distilled water to
18.17 g
4.0ml
pH 8.8
100.0ml
Trizma Base was added to 70ml of distilled water and the reaction
adjusted to the required pH with 12N HCl. The 10% SDS
solution was then added and the volume was made up to 100ml.
The buffer was filtered' through two layers of Whatman™ No. l
filter paper and stored at 4°C.

(vii) Running Gel Solution.
Acrylamide
Methylene-bis-Acrylamide
Distilled water to
30.0g
0.5g
100.0ml
99
Acrylamide was dissolved in 70ml of distilled water and allowed to
return to room temperature. Methylene-bis-Acrylamide was dissolved
in the acrylamide solution and the volume was made to 100ml.
The solution was filtered through a double layer of Whatman™
No.l filter paper and stored at 4 °C for no more than six weeks.
(viii) SOS-Sample Buffer (x4)
B-mercaptoethanol
SDS
Upper Tris Buffer
Distilled water to
10.0ml
6.0g
25.0ml
100.0ml
This solution was diluted 4-fold when added to the protein sample.
I MASSEY UNIVERSITY LIBRARY

(ix) Stacking Gel Solution
Acrylamide
Methylene-bis-Acy lamide
Distilled water to
30.0g
1.6g
100.0ml
100
Acrylamide was dissolved in 70ml of distilled water and allowed to
return to room temperature. Methylene-bis-Acrylamide was dissolved
in the acrylamide solution and the volume was made to 100ml.
The solution was filtered through a double layer of Whatman™
No.I filter paper and stored at 4°C for no more than six weeks.
(x) Tris-Glycine Reservoir Buffer (pH 8.3)
Trizma Base (Sigma)
Glycine
SDS
Distilled water to
This solution was stored at room temperature.
(xi) Upper Tris Buffer (pH 6.8)
Trizma Base (Sigma)
10% Solution of SDS m distilled water
12N HCl to
Distilled water to
6.07g
28.8g
2.0g
2000.0ml
6.06g
4.0ml
pH 6.8
100.0ml

101
Trizma Base was added to 70ml of distilled water and the reaction
adjusted to the required pH with 12N HCI. The SDS was then
added and the volume was made up to I 00ml. The buffer was
filtered through two layers of Whatman™ No.I filter paper and
stored at 4 °C.

102
6. Bibliography
Birkhead, G., Janoff, E.N. ,Vogt, R.L. and Smith, P.D.
(1989)
Elevated levels of immunoglobulin A to Giardia lamblia
during a waterborne outbreak of gastroenteritis. Journal of
Clinical Microbiology 27: 1707-1710.
Boucher, S.M. and Gillin, F.D. (1990)
Excystation of in vitro-derived Giardia lamblia cysts.
Infection and Immunity 58: 3516-3522.
Bradford, M.M. (1976)
A rapid and sensitive method for the quantitation of
microgram quantities of proteins utilizing the principle of
protein-dye binding. Analytical Biochemistry 72: 248-254.
Brodsky, R.E., Spencer, H.C., and Schultz, M.G. (1974)
Giardiasis in American travellers to the Soviet Union.
Journal of Infectious Diseases 130: 319-323.
Burke, J.A. (1975)
Giardiasis m childhood. American J oumal of Diseases of
Children 129: 1304-1310.
Burke, J .A. (1977)
The clinical and laboratory diagnosis of giardiasis. Critical
Review in Clinical Laboratory Science 7: 373-391.

103
Butcher, P.D. and Farthing, M.J.G. (1988)
DNA probes for the faecal diagnosis of Giardia lamblia
infections m man. Biochemical Society Transactions 17: 363-
364.
Chester, A.C., Macmurray, F.G., Restifo, M.D. and
Mann, 0. (1985)
Giardiasis as a chronic disease.
Sciences 30: 215-218.
Digestive Diseases and
Edson, C.M., Farthing, M.J.G., Thorley-Lawson, D.A. and
Keusch, G.T. (1986)
An 88,000-Mr Giardia lamblia surface protein which is
immunogenic in humans. Infection and Immunity 54: 621-625.
Erlandsen, S.L. and Chase, D.G. (1974)
Micrological alterations in the microvillus border of villus
epithelial cells produced by intestinal . .
m1 croorgan1sms.
American Journal of Clinical Nutrition 27: 1277-1286.
Erlandsen, S.L. and Feely, D.E. (1984)
Trophozoite motility and the mechanism of attachment. In:
Giardia and giardiasis (edited by Erlandsen, S.L., and Meyer,
E.A.). Plenum Press, New York. pp. 33-63.

104
Erlandsen, S.L., Bemrick, W .J. (1987)
Scanning Electron Microscopy evidence for a new species,
Giardia psittaci. Journal of Parasitology 73: 623-629.
Erlandsen, S.L., Bemrick, W .J ., Wells, C.L., Feely, D.E.,
Knudson, L., Cambell, S.R., van Keulen, H. and Jarroll,
E.L. (1990)
Axenic culture and characterization of Giardia ardeae from
the great blue heron (Ardea
Parasitology 76: 717-724.
Filice, F.P. (1952)
herodias). Journal of
Studies on the Cytology and life history of a Giardia from
the laboratory rat. University of California Press, Berkeley
and Los Angeles. Vol. 57. pp. 53-146.
Ghan di, B.M., Buch, P ., Sharma, M.P ., Irshad, M. and
Samantray, S.C. (1989)
ELISA for anti-Giardia IgM (letter). Lancet 2: 685.
Goka, A.K.J., Rolston, D.D.K., Mathan, V.I. and
Farthing, M.J.G. (1986)
Diagnosis of giardiasis by specific IgM antibody enzyme-linked
immunosorbent assay. Lancet 2: 184-186

105
Green, E.L., Miles, M.A. and Warhurst, D.C. (1985)
Immunodiagnostic detection of Giardia antigen in faeces by
rapid visual enzyme-linked immunosorbent assay. Lancet 2:
691-693.
Healy, G .R. (1978)
The presence and absence of Giardia lamblia in studies on
parasite prevalence in the U.S.A. In: Waterborne transmission
of Giardiasis (edited by Jakubowski, W. and Hoff, J.C.). U.S.
Envoronmental Protection Agency, Cinn., Ohio. pp. 92-
103.
Ionas, G. (1989).
A study of the heterogeneity of Mycoplasma ovipneumoniae
isolates by examination of the proteins and deoxyribonucleic
acid. Ph.D Thesis (Published by Massey University).
Janoff, E.N., Craft, J.C., Pickering, L.K., Novotny, T.,
Blaser, M.J., Knisley, C.V. and Reller, L.B. (1989)
Diagnosis of Giardia
parasite-specific antigens.
431-435.
lamblia infections by detection of
Journal of Clinical Microbiology 27:
Janoff, E.N., Smith, P.D. and Blaser, M.J. (1988)
Acute antibody responses to Giardia lamblia are depressed m
patients with AIDs. Journal of Infectious Diseases 157: 798-
804.

106
Knisley, C. V., Engelkirk, P.G., Pickering, L.K., West,
M.S. and Jan off, E.N. (1988)
Rapid detection of Giardia antigen m stool with the use of
enzyme 1mmunoassays. American J oumal of Tropical Medicine
and Hygiene 91: 704-708.
Kulda, J. and Nohynkova, E. (1978)
Flagellates of the human intestine and of intestines of other
species. In: Protozoa of Veterinary and Medical Interest.
Academic Press, New York, London. Vol. II, pp. 69-104.
Laemmli, U.K. (1980)
Cleavage of structural proteins during the assembly of the head
of bacteriophage T4. Nature 227: 680-685.
Meyer, E.A. and Jarroll, E.L. (1980)
Giardiasis. Journal of Epidemiology 111: 1-12.
Miotti, P.G., Gilman, R.H., Santosham, M., Ryder, R.W.
and Y olken, R.H. (1986)
Age-related rate of seropositivity of antibody to Giardia
lamblia in four diverse populations. Journal of Clinical
Microbiology 24: 972-975.

107
Moore, G.W., Sogandares-Bernal, F. and Dennis, M.V.
(1982)
Characterisation of Giardia lamblia trophozoite antigens usmg
polyacrylamide gel electrophoresis, high-perforn1ance liquid
chromatography, and enzyme-labelled immunosorbent assay.
Veterinary Parasitology 10: 229-237.
aNash, T.E., Herrington, D.A, Losonsky, G.A. and
Levine, M.M. (1987)
Experimental human infections with Giardia lamblia. I ournal
of Infectious Diseases 156: 974-984.
bNash, T.E., Herrington, D.A. and Levine, M.M. (1987)
Usefulness of an enzyme-linked immunosorbent assay for
detection of Giardia antigen in faeces. Journal of Clinical
Microbiology 25: 1169-1171.
Nayak, N., Ganguly, N.K., Walia, B.N.S., Wahi, V.,
Kanwar, S.S and Mahajan, R.C. (1987)
Specific secretory IgA in the milk of Giardia lamblia-infected
and uninfected women. Journal of Infectious Diseases 155:
724-727.
Ortega Pierres, M.G., Lascurain, R., Garcia, R.A.,
Vazquez R.C., Acosta, G. and Santos, J.I. (1988)
The response of humans to antigens of Giardia lamblia. In:
Advances in Giardia research (edited by Wallis, P.M. and
Hammond, B.R.). University of Calgary Press, Calgary. pp.
177-180.

108
Radulescu, S., Iancu, L., Simionescu, 0. and Meyer,
E.A. (1976)
Serum antibodies m giardiasis. Journal of Clinical Pathology
29:863.
Reiner, D.S., Douglas, H. and Gillin, F.D (1989)
Identification and localisation of cyst-specific antigens of
Giardia lamblia. Infection and Immunity 57: 963-968.
Ridley, M.J. and Ridley, D.S. (1976)
Serum antibodies and jejunal histology in giardiasis associated
with malabsorption. Journal of Clinical Pathology 29: 30-34.
Rosoff, J .D., Sanders, C.A., Sonnad, S.S., De Lay, P.R.,
Hadley, W.K., Vincenzi, F.F., Yajko, D.M. and O'Hanley,
P.D. (1989)
Stool diagnosis of giardiasis usmg a commercially available
enzyme immunoassay to detect Giardia-specific antigen 65
(GSA 65). Journal of Clinical Microbiology 27: 1997-2002.
Schaefer, F.W., III, Sauch, J.F. and Jakubowski, W.
(1986).
Proposed methods for detecting Giardia cysts in large
volumes of water. Health Effects Research Laboratory, U. S.
Environmental Protection Agency, Cincinnati, Ohio 45268.

109
S1nith, P.D., Gillin, F.D., Brown, W.R. and Nash, T.E.
(1981)
IgG antibody to Giardia lamblia detected by enzyme-linked
immunosorbent assay. Gastroenterology 80: 1476-1480.
S1nith, P.D., Gillin, F.D., Kaushal, N.A. and Nash, T.E.
(1982)
Antigenic analysis of Giardia lamblia from Afghanistan, Puerto
Rico, Ecuador and Oregon. Infection and Immunity 36: 714-
719.
Stibbs, H.H. (1989)
Monoclonal antibody-based enzyme immunoassay for Giardia
lamblia antigen in human stool. Journal of Clinical
Microbiology 27: 2582-2588.
Stibbs, H.H., Samadpour, M. and Manning, J.F. (1988)
Enzyme immunoassay for the detection of Giardia lamblia cyst
antigens in formalin-fixed and unfixed human stool. Journal
of Clinical Microbiology 26: 1665-1669.
Taylor, G.D. and Wenman, W.M. (1987)
Human immune response to Giardia lamblia infection. J oumal
of Infectious Diseases 155: 137-140.

110
Torain, B.E., Barnes, R.C., Stephens, R.S. and Stibbs,
H.H. (1984)
Tubulin and high-molecular-weight polypeptides as Giardia
lamblia antigens. Infection and Immunity 46: 152-158.
Ungar, B.L.P., Yolken, R.H., Nash, T.E. and Quinn,
T.C. (1984)
Enzyme-linked immunosorbent assay for the detection of
Giardia lamblia in fecal samples. Journal of Infectious
Diseases 149: 90-96.
Visveswara, G.S., Smith, P.D., Healy, G.R. and Brown,
W.R. (1980)
An immunofluorescence test to detect serum antibodies to
Giardia lamblia. Annuals of Internal Medicine 93: 802-805.
Walzer, P.D., Wolfe, M.S. and Schultz, M.G. (1971)
Giardiasis in travellers. J oumal of Infectious Diseases 124:
235-237.
Wenman, W.M., Meuser, R.U. and Wallis, P.M. (1986)
Antigenic analysis of Giardia duodenalis strains isolated rn
Alberta. Canadian Journal of Microbiology 32: 926-929
Wolfe, M.S. (1978)
Current concepts in pathology: Giardiasis. The New England
Journal of Medicine 298: 319-321.

111
Wolfe, M.S. (1984)
Symtomatology, diagnosis and treatment. In: Giardia and
giardiasis (edited by Erlandsen, S.L. and Meyer, E.A.).
Plenum Press, New York. pp. 147-161.