
The hippocampal rate code: anatomy, physiology and theory
19
The Hippocampal Rate Code: Anatomy, Physiology and Theory Omar J. Ahmed and Mayank R. Mehta Department of Neuroscience, Brown University, Providence, RI 02912 Abstract Since the days of Cajal, the CA1 pyramidal cell has arguably received more attention than any other neuron in the mammalian brain. Hippocampal CA1 pyramidal cells fire spikes with remarkable spatial and temporal precision, giving rise to the hippocampal rate and temporal codes. However, little is known about how different inputs interact during spatial behavior to generate such robust firing patterns. Here, we review the properties of the rodent hippocampal rate code, and synthesize work from several disciplines to understand the functional anatomy and excitation- inhibition balance that can produce the rate coded outputs of the CA1 pyramidal cell. We argue that both CA3 and entorhinal inputs are crucial for the formation of sharp, sparse CA1 place fields and that precisely timed and dominant inhibition is an equally important factor. Introduction A CA1 pyramidal cell in the hippocampus only fires when an animal is at a selective spatial location and hence is called a place cell [1]. The region of space where a place cell has a high probability of firing is called the cell's place field. This spatially selective increase in firing rate is the hippocampal rate code: the number of spikes fired by the cell encodes information about the rat's position. Although there are over 400,000 pyramidal cells in the rat CA1, it is possible to accurately estimate the rat's position in space by observing the rate coded output of just 50 simultaneously recorded place cells [2], potentially indicating a tremendous redundancy in the rate code. Embedded within the rate coded output of a CA1 cell is the hippocampal temporal code. When a rat runs, the local field potential (LFP) from the CA1 region reveals an approximately 8 Hz theta oscillation. As a rat enters the place field of a CA1 place cell, the first spikes fired by the cell occur late in a theta cycle. In subsequent cycles, the spikes occur earlier and earlier in each cycle. By the last theta cycle within the same place field, the spikes precess almost to the beginning of the cycle. This advancement of spike times with respect to theta is called phase precession. By observing the precise phase of spikes within a single theta cycle, the percentage of the cell's place field traversed by the rat can be estimated [3-8]. The theta-phase as a function of the rat's position is called a temporal code because information about space is encoded in the spike-timing and not the number of spikes. To fully understand the origin of the temporal code it is instructive to first understand the hippocampal rate code. Here, we synthesize research ranging from electron microscopy to behavioral electrophysiology to try to answer the question of how these rate coded outputs come to be. What is the functional anatomy of the inputs to a CA1 cell? Which of these inputs are necessary to turn the cell into a place cell? How do inhibitory and excitatory inputs interact to ensure that a CA1 pyramidal neuron fires in a given location? We discuss Corresponding authors: Ahmed, O.J. ([email protected]); Mehta, M.R. ([email protected]). NIH Public Access Author Manuscript Trends Neurosci. Author manuscript; available in PMC 2011 March 30. Published in final edited form as: Trends Neurosci. 2009 June ; 32(6): 329–338. doi:10.1016/j.tins.2009.01.009. NIH-PA Author Manuscript NIH-PA Author Manuscript NIH-PA Author Manuscript
Transcript of The hippocampal rate code: anatomy, physiology and theory
The Hippocampal Rate Code: Anatomy, Physiology and Theory
Omar J. Ahmed and Mayank R. MehtaDepartment of Neuroscience, Brown University, Providence, RI 02912
AbstractSince the days of Cajal, the CA1 pyramidal cell has arguably received more attention than anyother neuron in the mammalian brain. Hippocampal CA1 pyramidal cells fire spikes withremarkable spatial and temporal precision, giving rise to the hippocampal rate and temporal codes.However, little is known about how different inputs interact during spatial behavior to generatesuch robust firing patterns. Here, we review the properties of the rodent hippocampal rate code,and synthesize work from several disciplines to understand the functional anatomy and excitation-inhibition balance that can produce the rate coded outputs of the CA1 pyramidal cell. We arguethat both CA3 and entorhinal inputs are crucial for the formation of sharp, sparse CA1 place fieldsand that precisely timed and dominant inhibition is an equally important factor.
IntroductionA CA1 pyramidal cell in the hippocampus only fires when an animal is at a selective spatiallocation and hence is called a place cell [1]. The region of space where a place cell has ahigh probability of firing is called the cell's place field. This spatially selective increase infiring rate is the hippocampal rate code: the number of spikes fired by the cell encodesinformation about the rat's position. Although there are over 400,000 pyramidal cells in therat CA1, it is possible to accurately estimate the rat's position in space by observing the ratecoded output of just 50 simultaneously recorded place cells [2], potentially indicating atremendous redundancy in the rate code.
Embedded within the rate coded output of a CA1 cell is the hippocampal temporal code.When a rat runs, the local field potential (LFP) from the CA1 region reveals anapproximately 8 Hz theta oscillation. As a rat enters the place field of a CA1 place cell, thefirst spikes fired by the cell occur late in a theta cycle. In subsequent cycles, the spikes occurearlier and earlier in each cycle. By the last theta cycle within the same place field, thespikes precess almost to the beginning of the cycle. This advancement of spike times withrespect to theta is called phase precession. By observing the precise phase of spikes within asingle theta cycle, the percentage of the cell's place field traversed by the rat can beestimated [3-8]. The theta-phase as a function of the rat's position is called a temporal codebecause information about space is encoded in the spike-timing and not the number ofspikes.
To fully understand the origin of the temporal code it is instructive to first understand thehippocampal rate code. Here, we synthesize research ranging from electron microscopy tobehavioral electrophysiology to try to answer the question of how these rate coded outputscome to be. What is the functional anatomy of the inputs to a CA1 cell? Which of theseinputs are necessary to turn the cell into a place cell? How do inhibitory and excitatoryinputs interact to ensure that a CA1 pyramidal neuron fires in a given location? We discuss
Corresponding authors: Ahmed, O.J. ([email protected]); Mehta, M.R. ([email protected]).
NIH Public AccessAuthor ManuscriptTrends Neurosci. Author manuscript; available in PMC 2011 March 30.
Published in final edited form as:Trends Neurosci. 2009 June ; 32(6): 329–338. doi:10.1016/j.tins.2009.01.009.
NIH
-PA Author Manuscript
NIH
-PA Author Manuscript
NIH
-PA Author Manuscript

the implications of recent papers [9-11] that attempt to assess the relative contributions ofthe entorhinal cortex and CA3 in determining the output of a CA1 cell.
A majority of CA1 pyramidal cells are silent cellsAs many hippocampal electrophysiologists will attest to, CA1 cells can be notoriouslyreluctant to fire on a track. More than two-thirds of all CA1 pyramidal cells that are activeunder anesthesia or during slow-wave sleep do not have place fields in a given environment[12]. These cells are often called silent cells, and they rarely fire more than a handful ofspikes in an hour long recording session on a track [12]. Some silent cells have place fieldsin other tested environments, but most do not [12]. The small proportion of cells active atany given point in time suggests that the hippocampal rate code is also a sparse code (Box1).
It is important that an understanding of the inputs to a CA1 pyramidal cell explain theexistence of both place cells and silent cells. Silent cells will be discussed at numerouspoints in this review, and although they are silent, they reveal a lot about the mechanismsunderlying the emergence of the hippocampal rate code. We begin by looking at theanatomical roadmap of the hippocampal-entorhinal system.
Functional anatomy of the entorhinal-hippocampal networkMore than 400 years ago, the Italian anatomist, Arantius, was the first to use the term‘hippocampus’ in reference to the human dentate gyrus (DG) in 1587 [13,14]. The literaltranslation of this Greek word is ‘horse-caterpillar’, and it refers both to a sea-horse and to amythical Greek creature resembling a horse-mermaid [13]. Arantius is thought to have hadthe sea-horse in mind when he used the term, although the curvature of the structure alsoreminded him of a ‘white silk-worm’ [13,14]. In 1732, Winslow described the hippocampusas resembling a ram's horns, and in 1742 de Garengeot coined the term Cornu Ammonis(Ammon's horn), in reference to the Egyptian god often depicted as having the head of a ram[13]. The acronym for this Latin phrase (CA) is the root of the names assigned to thehippocampal subfields (CA1, CA2 [15,16] and CA3) by Lorenté de Nó in 1934 [17].
The hippocampus starts at a dorsal and septal (medial) part of the brain. Arching in theshape of a ram's horn, it ends up at a ventral and temporal (lateral) location. This is the longaxis of the hippocampus. It is also sometimes called the septo-temporal or dorso-ventral axis[18]. Most place cell recordings are made in the dorsal-most part. However, ventral CA1pyramidal cells also show spatial modulation, but have place fields that are 4-5 times largerthan their dorsal counterparts [19,20]. Indeed, recent recordings on an 18 meter linear trackhave shown that place field size increases 10 fold along the entire dorso-ventral axis of CA3[21], ranging from 1 meter at the dorsal most part to 10 meters at the ventral most tip of thehippocampus. It should be pointed out that the absolute size of place fields can also scalewith the size of the environment [22,23]. This can potentially explain why most studies onshorter tracks report dorsal place fields that are about 20 cm long, whereas 1 meter longplace fields were seen in the dorsal hippocampus on the 18 meter track [21]. Unlikereceptive fields in the sensory cortices, hippocampal pyramidal cells do not show fine-grained topographic organization: anatomically contiguous cells in CA1 can fire at verydifferent locations on the track [24].
The main source of cortical input to the hippocampus is the entorhinal cortex (EC). The ECis usually divided into the medial entorhinal cortex (MEC) and lateral entorhinal cortex(LEC) [25]. Further, three bands cut across the MEC/LEC divide: the dorsolateral,intermediate and ventromedial bands [26] (Figure 1). Multi-peaked, spatially periodic place
Ahmed and Mehta Page 2
Trends Neurosci. Author manuscript; available in PMC 2011 March 30.
NIH
-PA Author Manuscript
NIH
-PA Author Manuscript
NIH
-PA Author Manuscript

cells, also known as grid cells, are found in layer II of all bands of MEC [27,28]. The gridfield size increases with increasing depth along the dorso-ventral axis of the MEC [29].
The topography of projections from the MEC bands to the long axis of the hippocampussuggests that the increases in place and grid field size are related. The dorsolateral band ofthe MEC projects to the dorsal half of the hippocampus, the intermediate band to the nextquarter, and the ventromedial band to the most ventral quarter of the hippocampus [26](Figure 1). Thus, there exists a clear anatomical pathway for grid cell inputs to shape theoutput of hippocampal place cells.
A theoretical study [30] suggests that the linear summation of less than 50 grid fields ofvarying sizes can give rise to place fields in hippocampal pyramidal cells. This study isideally suited to understanding CA3, not CA1, place fields [30]: in the rat, layer II of ECprojects almost exclusively to the DG and to CA3 (Figure 1C, but see Table 2 and Box 2.4for a discussion of mouse anatomy). CA1, on the other hand, receives its inputs from layerIII of the EC [25,31]. To further complicate matters, the proximal (close to CA3; Figure 1)half of the CA1 region, receives inputs primarily from layer III MEC cells [25] (Figure 1B).The distal half (distant from CA3) of CA1 receives its inputs from layer III of the LEC [25](Figure 1A). There is a significant difference between the firing patterns of layer III MECand LEC cells. MEC layer III cells show a multitude of spatially modulated firing: some ofthese cells are grid cells, others are head-direction cells, whereas another subgroupconjunctively encodes both grid and head-direction information [32]. LEC cells, on the otherhand, show extremely weak spatial modulation [33], which might reflect the different inputsthey receive [34].
In summary, cells in DG and CA3 receive a mixture of inputs from the parts of EC that haveabundant grid cells (MEC layer II) as well as parts that show poor spatial modulation (LEClayer II; Figure 1C). Proximal CA1 cells receive inputs from parts of EC with a combinationof grid and head-direction cells (MEC layer III; Figure 1B) and distal CA1 cells receiveinputs from parts of EC with poor spatial tuning (LEC layer III; Figure 1A). A carefuldelineation of sparseness and spatial information ratios across the distal and proximal CA1regions would help decipher the functional anatomy of this circuit (Box 2.1).
In addition to the spatially modulated inputs from layer III of MEC, proximal CA1 cellsreceive intrahippocampal inputs from CA3 pyramidal cells [18] (Figure 1E). Since CA3inputs are also spatially modulated [35], it is not clear who is primarily responsible for thespatial output of these CA1 cells. Is it MEC or CA3? We next discuss recent lesion andinactivation experiments that have investigated this question.
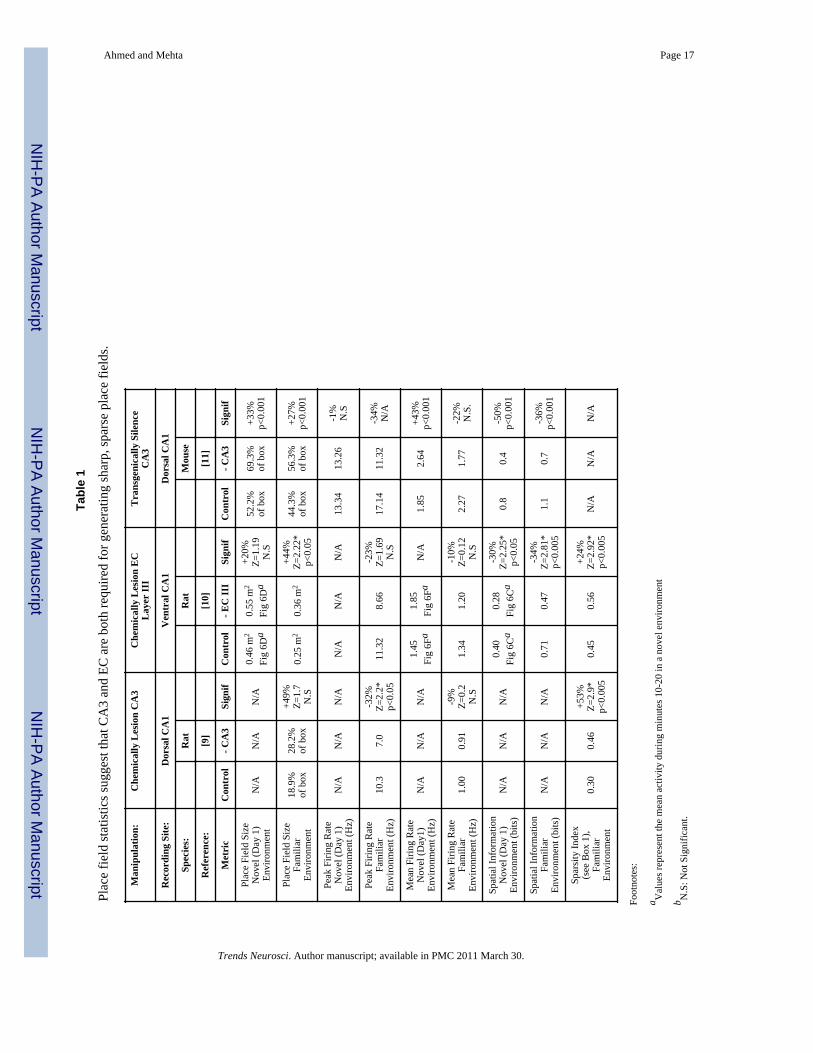
The relative contribution of CA3 versus MEC in governing CA1 place fieldsTo study the importance of CA3 in shaping the output of CA1 place cells, Brun et al. [9]bilaterally lesioned CA3 inputs to CA1. Almost all the CA3 inputs to CA1 were successfullyremoved. CA1 pyramidal cells continued to have place fields in the absence of CA3 inputs,suggesting that MEC inputs are sufficient to drive the spatial output of the CA1 cell. CA1cells did not turn into grid cells since they still receive inputs from multiple MEC grid cellswith different spatial tuning, as well as from head-direction and conjunctive cells [25,32]. Asum of such inputs is expected to give rise to place fields [30]. However, there weresignificant differences between the rate codes produced by CA1 cells in the CA3 lesionedversus control rats. Most importantly, compared to the sharp place fields in control rats, CA1place cells in lesioned animals fired more diffusely, had larger place fields, and had a lowerpeak firing rate within their place fields (Table 1). Lesioned rats had impaired spatial recall,suggesting that the combination of CA3 and EC inputs is necessary for spatial learning andmemory.
Ahmed and Mehta Page 3
Trends Neurosci. Author manuscript; available in PMC 2011 March 30.
NIH
-PA Author Manuscript
NIH
-PA Author Manuscript
NIH
-PA Author Manuscript

Recently, Nakashiba et al. [11] have used transgenic techniques to reversibly inactivate CA3inputs to CA1 in mice. They, too, found that the loss of CA3 lead to larger, diffuse CA1place fields with decreased peak firing rates (Table 1). However, contrary to the Brun et al.study [9], they found no deficits in recall on the Morris water maze in these mice. Thisbehavioral difference between the two studies could be due to species specific anatomicaldifferences between rats and CB57L/6 mice (Table 2 and Box 2.4).
To understand the contribution of EC inputs to the hippocampus, a recent study [10] usedchemical lesions of EC layer III to see if CA3 inputs alone can sustain CA1 place fields.Since the chemical lesions preferentially targeted the ventromedial and intermediate bandsof the MEC, and these regions project to the ventral and intermediate hippocampus, theirrecordings were restricted to cells at an intermediate location along the dorso-ventral axis ofCA1. As discussed earlier, place fields are larger and hence less sparse in this region (Table1). Surprisingly, the removal of EC inputs had the same effects: CA1 place fields becamelarger and had a decreased peak firing rate. The detailed statistical results of all three studiesare compared in Table 1, and suggest that the main physiological results from all threestudies are similar in nature.
These findings indicate that CA3 inputs alone or EC inputs alone can give rise to spatialselectivity in a CA1 cell, although this selectivity is impaired in both cases when comparedto controls. The decrease in peak rate in both lesion conditions makes sense: the netexcitatory input to CA1 is decreased by the removal of either set of inputs. But why does theabsence of CA3 or EC inputs lead to more diffuse, less sparse place fields? To answer thisquestion, and to understand how EC inputs alone can possibly drive a CA1 cell's firing, wenow discuss the organization of synaptic inputs to a single CA1 pyramidal cell.
Synaptic inputs to a single CA1 cell: source, number, strength and rateThe cell bodies of CA1 pyramidal cells are restricted to a single layer, the stratumpyramidale (S-P). The basal dendrites of these cells extend into the stratum oriens (S-O),with the apical dendrites occupying the stratum radiatum (S-R) and stratum lacunosum-moleculare (S-LM). Note the distinction between the proximal CA1 region and proximalCA1 dendrites. The proximal CA1 region refers to CA1 cells that are close to CA3 and DGin a transverse slice of the hippocampus. CA1 proximal dendrites are the dendrites of asingle CA1 cell that are closest to the cell body. Dendrites in S-LM are the most distal(Figure 2).
CA3 represents the largest source of excitatory synapses onto a CA1 pyramidal cell, formingabout 30000 synapses onto the spines of dendrites in S-R and S-O, although some of thesemay come from other sources such as the medial septum [36] (Figure 2I). EC makes farfewer synapses: at most 1800, all of them restricted to the distal dendrites in S-LM [36].There are also about 1700 GABAergic, inhibitory inputs distributed over the CA1 cell bodyand dendritic tree [36] (Figure 2D). The functional significance of these inhibitory inputswill be addressed shortly.
Glutamatergic synapses onto a CA1 pyramidal neuron are of two types: perforated and non-perforated. Perforated synapses express more AMPA receptors and generate larger EPSPsthan non-perforated synapses [37]. EC inputs onto distal CA1 dendrites have a higherpercentage of perforated synapses (Figure 2J). However, this is not as advantageous as itmay seem. The number of AMPA receptors per perforated synapse, indicative of thesynaptic strength, peaks at the distal S-R dendrites [38,39] (Figure 2K). Electron microscopystudies have shown that this number then falls dramatically at S-LM synapses [39] (Figure2K). Thus, EPSPs generated at an EC synapse are expected to be smaller than those at CA3synapses [39,40]. To make matters worse for EC inputs, dendritic filtering causes the
Ahmed and Mehta Page 4
Trends Neurosci. Author manuscript; available in PMC 2011 March 30.
NIH
-PA Author Manuscript
NIH
-PA Author Manuscript
NIH
-PA Author Manuscript
amplitude of distal dendritic EPSPs to be significantly reduced by the time the signalreaches the soma [41]. The increased AMPA receptor numbers in distal S-R is a synapticscaling method that compensates for dendritic filtering [42]. However, as evidenced by thedecrease in AMPA receptors in S-LM, synaptic scaling might not apply to the EC inputs.
Given their fewer number, more distal location and lower AMPA receptor count, thesynaptic inputs from EC would appear to be far less likely to make a CA1 cell fire,compared to the more numerous, and more proximal, CA3 inputs. But the lesion studiesdiscussed above [9,11] suggest otherwise. There may be three complementary solutions tothis apparent impasse: dendritic spikes, gating of EC inputs by CA3 inputs, and the firingproperties of EC in vivo.
Synchronous activation of nearby synapses can lead to a large dendritic depolarization and aresulting dendritic spike [43-45]. This mechanism is thought to be especially efficacious forthe thin, high input resistance distal dendrites in the S-LM [39,40]. However, a dendriticspike does not necessarily translate into a somatic spike [43]. Two groups have recentlyshown that the chances of an EC-induced dendritic spike eliciting a somatic spike areincreased by a modest coactivation of CA3 inputs [40,46]. The depolarization provided bysuch CA3 inputs prevents the EC-generated dendritic spike from falling victim to inhibitoryinputs and dendritic filtering. In this scenario, inputs from CA3 act as a “gate” that permitsthe passage of an EC-induced distal dendritic spike to the soma, where it can then trigger asomatic action potential.
The third piece of the puzzle comes from the in vivo firing properties of EC and CA3 cells.CA3 pyramidal cells, like CA1 cells, can be either place cells or silent cells. In fact, 67% ofCA3 cells are silent cells [47] (Figure 2H). Including the silent cells, the mean firing rate ofall recorded CA3 cells is around 0.4 Hz [47] (Figure 2G). In contrast, MEC has very fewsilent cells and the active cells have a six-fold higher mean firing rate: around 2.5 Hz [32](Figure 2G). The firing of all types of MEC layer III cells (head-direction, grid, andconjunctive [32]) is less sparse than that of CA3 place cells [32,47]. Grid cells fire in aregular, repeating pattern over the entire environment and do so in all environments [28,32].These factors increase the chances of synchronous MEC inputs from overlapping grid andhead direction cells. This synchronous input can result in a dendritic spike in the distal S-LM dendrites. When accompanied by simultaneous inputs from even a very small number ofCA3 place cells, the aforementioned “gate” would open, and the CA1 cell would be able tooutput a spatially-modulated rate code. When CA3 is lesioned, the gate would close and theCA1 cell would be expected to fire less often. Experiments show that this is only partiallytrue: although the peak firing rate of the CA1 cell is lower in CA3 lesioned animals, the cellfires more diffusely and has larger place fields. To explain what could underlie this diffusefiring, we finally turn our focus to CA1 interneurons.
CA1 interneurons are anything but silentInterneurons local to the CA1 region are the main source of inhibitory inputs onto a CA1pyramidal cell [48,49]. Basket, bistratified and axo-axonic interneurons have their cellbodies in S-P and form synapses on the proximal dendrites and cell body of the CA1pyramidal cell, exerting a powerful control over its output. O-LM, LM-R and several othertypes of interneurons inhibit the distal dendrites of the CA1 cell. The cell bodies of theseinterneurons are located in S-O or near the border between S-R and S-LM [48,49]. Over thelast few years, there has been a surge in the number of studies analyzing the spatial firingproperties of CA1 interneurons [50-52].
Fast-spiking S-P interneurons fire at high rates (greater than 20 Hz) and are active on almostall parts of the track [50-52] (Figure 2B,C). Some interneurons have ON place fields, where
Ahmed and Mehta Page 5
Trends Neurosci. Author manuscript; available in PMC 2011 March 30.
NIH
-PA Author Manuscript
NIH
-PA Author Manuscript
NIH
-PA Author Manuscript

they further increase their firing rate, and others have OFF place fields, where they decreasetheir rate [50-52] (Figure 2C). The existence of OFF interneuron place fields suggests thepossibility that some CA1 pyramidal cells may fire on the track due to a release-from-inhibition effect (Figure 3D).
The high firing rates and sustained activation of CA1 interneurons, coupled with the relativesparseness of CA3 and EC inputs suggests that inhibition onto CA1 pyramidal cells faroutweighs excitation. In fact, using the most conservative estimates, the total number ofinhibitory spikes arriving at a CA1 pyramidal neuron may be at least twice the number ofexcitatory inputs during spatial navigation (Figure 2M-O). This has a number of importantconsequences. Consider the case of perfectly balanced excitation and inhibition onto a CA1pyramidal cell. In this scenario, any small, random increases in excitation or decreases ininhibition would make the CA1 cell fire. This would give rise to numerous spikes on a trackat randomly distributed locations, something that is rarely seen in vivo [12] (Figure 3A).Instead, if inhibition was the dominant force, minor fluctuations in excitatory or inhibitoryinputs would rarely make the CA1 pyramidal cell spike. Thus, an inhibition-dominatedregime can help explain the numerous silent cells seen in CA1 and the almost completeabsence of spiking of place cells outside their place fields (Figure 3B). In such a regime, alarge number of synchronous excitatory inputs would be required to make the CA1 cell fire,as discussed in the previous section (Figure 3C).
This dominant inhibition can also explain the more diffuse firing in CA3-lesioned rats. CA3activation directly excites CA1 pyramidal cells. However, it also generates strong,feedforward inhibition by activating CA1 interneurons. Rapid disynaptic inhibition of theproximal dendrites and soma of the CA1 pyramidal cell follows [53]. This gives excitatoryCA3 inputs a very short time window in which to bring the CA1 cell to threshold and makeit spike. It also gives any EC driven dendritic spikes generated in the distal dendrites a veryshort time window to propagate to the soma and cause a somatic spike. This combination ofstrong and rapid feedforward inhibition could be responsible for the sparsity of CA1 placecells: only strongly synchronized EC and CA3 inputs can make the cell fire. When CA3 islesioned, much of the precisely timed feedforward inhibition is also lost. This gives the ECgenerated dendritic spikes a larger time window to travel down to the soma and make theCA1 cell fire over wider regions of space. This would give rise to the more diffuse rate codethat is seen in CA3-lesioned animals, and suggests an easily testable hypothesis: in CA3-lesioned animals, the firing rates of interneurons recorded from S-P should be significantlylower than in controls.
Similar arguments may apply to the effects of EC lesions on CA1 place fields. EC inputs toCA1 terminate on the distal dendrites of CA1 pyramids, but also excite LM-R and otherinterneurons in the S-LM layer [31,48,49], as evidenced by recent in vivo studies showingthat LM-R cells are phase locked to entorhinal inputs during slow-wave sleep [54]. Thedominant effect of this disynaptic inhibition is well documented [55]. Although LM-Rneurons are primarily driven by EC inputs, their axons project to both the proximal anddistal dendrites of CA1 pyramidal cells [48,49], inhibiting the feedforward excitatory inputsfrom both EC and CA3. When EC is lesioned, this source of dominant inhibition is also lostand CA3 inputs alone can cause a CA1 cell to spike more diffusely [10].
Accounting for plasticityWhile a detailed understanding of the excitation-inhibition balance can help explain certainfacets of the hippocampal code, it cannot explain changes in the rate code over differenttime-scales. For example, the place field size decreases across the first 3 days of exposure toa novel environment [10,11] (Table 1). Other prominent changes occur on an even faster
Ahmed and Mehta Page 6
Trends Neurosci. Author manuscript; available in PMC 2011 March 30.
NIH
-PA Author Manuscript
NIH
-PA Author Manuscript
NIH
-PA Author Manuscript
timescale – the firing rate of CA1 place cells almost doubles within the first few traversalsof a familiar environment [56-59]. In lesion [9,10] and slow-acting transgenic inactivationstudies [11], there is a delay of many days between the lesion/inactivation and the CA1recordings. Thus it is possible that several plasticity-dependent or metaplastic [60] changeshave already taken place during this time period (Box 2.3).
ConclusionsThe hippocampal rate code can best be understood in terms of the anatomical inputs to thehippocampus and the excitation-inhibition balance within the hippocampus. There appear tobe a few key factors that play a role in generating the spatially-precise firing of a CA1pyramidal cell. First, strong input from spatially overlapping MEC layer III cells cangenerate a large EPSP or a dendritic spike in the distal dendrites of the CA1 cell[30,39,40,43-45]. Once the dendritic spike is generated, the strong feed-forward inhibitionwould prevent it from propagating to the soma [43,53]. However, additional synchronousinputs from CA3 can help overcome the inhibition and lead to somatic spikes [40,46]. It ispossible that the converse is also true: strong depolarization from overlapping CA3 placefields can lead to an EPSP that would normally be counteracted by the stronger feed-forwardinhibition. However, the synchronous arrival of MEC inputs, together with the CA3 inputscan help overcome the inhibition and lead to a somatic spike.
This makes sense given the anatomical inputs to a CA1 cell and the in vivo firing rates of theinput cells. There are relatively few inputs from MEC, but these input cells fire at highermean rates and their grid and head-direction fields are more likely to overlap [30,32,36].CA3 cells are sparser and fire at much lower rates than MEC cells [47], but CA3 synapticinputs onto a CA1 cell outnumber EC inputs by an order of magnitude – 30,000 versus2,000 [36] – increasing the chances of temporally overlapping inputs from CA3. Thus,synchronous inputs from both EC and CA3 seem to be necessary to give rise to small,sparse, sharply peaked place fields in CA1. When either CA3 or EC inputs are removed, notonly is the synchronous input removed (resulting in lower peak firing rates [9-11]), but thestrong feed-forward inhibition (caused by either CA3 or MEC inputs) is also removed. Thisallows relatively weaker EPSPs and dendritic spikes (that would have otherwise beenshunted by the strong inhibition) to lead to somatic spikes, resulting in larger and morediffuse place fields [9-11]. In fact, since inhibition seems to outweigh excitation onto a CA1pyramidal neuron, precisely timed synchronous excitatory inputs are needed to output thespatially precise CA1 rate code [53].
This approach leads to an intriguing conclusion: the hippocampal rate code is stronglydependent on the temporal pattern of inputs. The goal of future experiments will be toprovide a unified explanation of how the rate and temporally coded outputs of the CA1 cellcan arise from a set of excitatory and inhibitory inputs and to understand how these CA1outputs are interpreted by neurons in downstream brain regions [61-65]. Exactly seventy-five years after being christened by Lorenté de Nó [17], the CA1 pyramidal neuron promisesto be the focus of both basic and clinical research for many decades to come.
Box 1
Sparse Codes: Population Sparseness versus Single-Cell Sparseness
The phrase “sparse code” appears often in sensory-coding literature. However, this termis used to describe two slightly different phenomena: the sparseness of the activity of abrain region (population sparseness) and the sparseness of the activity of a singleneuron (single-cell sparseness). This box attempts to clarify the uses of these two termsin the context of the hippocampus.
Ahmed and Mehta Page 7
Trends Neurosci. Author manuscript; available in PMC 2011 March 30.
NIH
-PA Author Manuscript
NIH
-PA Author Manuscript
NIH
-PA Author Manuscript

In this review, we state that the hippocampal rate code is sparse. More accurately, thehippocampal rate code shows population sparseness [66]. Population sparseness meansthat a very small percentage of the CA1 pyramidal cell population is active at anylocation in a given environment.
Population sparseness in dorsal CA1 can arise because of two independent reasons:
1. A large proportion of CA1 pyramidal cells are silent cells. These silent cells donot fire anywhere in the environment.
2. Dorsal CA1 place cells have very small place fields, ensuring that each cell isactive over a small region of space.
Individual CA1 cells whose firing rate is sharply elevated in a small region of space arealso said to display sparseness. We call this single-cell sparseness, although it has alsobeen called “lifetime sparseness” [66]. Single-cell sparseness can be quantified using thesparsity index [67]:
Where i is a spatial bin and ri is the firing rate of the cell in bin i of an environmentcontaining a total or n spatial bins. A sparsity value of 1 implies no single-cellsparseness. A sparsity value approaching 0 is indicative of maximal single-cellsparseness, and implies a greater amount of spatial information in each spike emitted bythat cell. However, the sparsity index provides no direct information about populationsparseness.
At this point, it is instructive to consider the results of Jung et al. [19]. They comparedthe firing properties of dorsal and ventral CA1 pyramidal cells. Ventral place fields werealmost four times larger than dorsal place fields. The sparsity values were 0.32 (dorsal)and 0.59 (ventral). Thus, as expected, dorsal place cells showed more single-cellsparseness. However, 54% of dorsal cells were silent in this study, whereas 82% ofventral cells were silent cells. Thus it is possible that, in ventral CA1, the opposinginfluences of decreased single-cell sparseness and increased number of silent cells mightcancel out and the population sparseness might be identical in dorsal versus ventral CA1,albeit due to very different reasons.
Here, we suggest that one simple formula for the population-sparsity index may be:
where 〈s〉 is the mean single-cell sparsity index of all active cells, a is the number ofcells active in a given environment, and n is the total number of cells isolated during thesleep and track sessions combined. The closer the population-sparsity index is to 0, thesparser the population activity is.
It should be noted that a sparse code resulting from high population sparseness(population-sparsity index approaching 0) is not necessarily better than a distributed code(but see ref [67,68,69,70]). However, it is commonly thought that a CA1 pyramidal cellshowing a high degree of single-cell sparseness (small, sharply tuned place fields) is ofmore use for spatial navigation and spatial learning than a broadly tuned cell. This is an
Ahmed and Mehta Page 8
Trends Neurosci. Author manuscript; available in PMC 2011 March 30.
NIH
-PA Author Manuscript
NIH
-PA Author Manuscript
NIH
-PA Author Manuscript

implicit assumption of the lesion and inactivation studies discussed in this review. If theremoval of CA3 or entorhinal inputs decreases single-cell sparseness in CA1 (indicatedby increased values of the sparsity index) then those inputs can be considered importantfor sharply tuned CA1 place cells. However, additional behavioral tests are crucial to testif a decrease in single-cell sparseness necessarily translates into behavioral or memorydeficits.
Box 2
Hypotheses and Outstanding Questions
2.1 Does proximal CA1 have place cells that are sparser and more spatiallyinformative than those in distal CA1?
The anatomy and physiology reviewed here (Figures 1,2) predict the predominance ofsparse, spatially informative place cells in proximal CA1, whereas cells showing poorspatial modulation are expected in distal CA1. This dichotomy would be expected tooccur at every transverse section along the dorso-ventral axis of the hippocampus. Thuslesions of proximal CA1 might be expected to impair performance on spatial tasks morethan lesions of distal CA1. Anatomically precise quantification of the sparseness andspatial information ratios across the distal and proximal CA1 regions can test thishypothesis.
2.2 Is inhibition onto a single CA1 pyramidal cell far stronger than excitation?
Our review of the literature provides indirect evidence for this hypothesis (Figure 2M-O).In vivo whole cell recordings, ideally from behaving rats [71], can test this hypothesisdirectly.
2.3 Does plasticity play an important role in generating similar CA1 place cells afterEC or CA3 lesions?
To remove any potential plastic or meta-plastic [60] consequences of lesions or slow-acting transgenic inactivation, optogenetic inactivation of EC or CA3 usinghalorhodopsin [72] can be combined with CA1 tetrode recordings. This will help tofurther understand the relative, instantaneous contributions of EC and CA3 inputs ingiving rise to a CA1 place field.
2.4 Are there any anatomical differences between rat and mouse hippocampus?
CA3 receives the majority of its cortical inputs from EC layer II in rats [25] and from EClayer III in mice [73]. Grid field dynamics are similar in the MEC of both rats and mice[74]. This suggests that CA3 neurons in mice receive inputs from less spatially selectiveMEC layer III head-direction cells, whereas rat CA3 neurons are primarily driven bymore spatially selective grid cells in layer II of MEC. Thus, CA3 neurons might be morespatially informative in rats than in mice. Consistently, the removal of CA3 inputs in ratsimpairs spatial recall on a Morris water maze in rats [9] but not in mice [11], althoughmethodological differences (lesion versus transgenic inactivation) might account for thisdiscrepancy. Additionally, as shown in Table 2, the ratio of excitation-to-inhibition ismuch larger in mice (120:1) than in rats (20:1) [75]. The lower inhibition in mouse CA1can potentially explain why CA1 place fields in mice are larger, more diffuse (Figure 3A)and less spatially informative than in rats (figure 3B,Table 1) [9,11]. It is worth exploringif interneurons in mice fire at higher rates or have more axonal collaterals to balance theexcitation-inhibition ratios across species.
Ahmed and Mehta Page 9
Trends Neurosci. Author manuscript; available in PMC 2011 March 30.
NIH
-PA Author Manuscript
NIH
-PA Author Manuscript
NIH
-PA Author Manuscript

AcknowledgmentsThis work was supported by National Institutes of Mental Grant MH081477 to OJA and by a CRCNS Grant,NARSAD Award and NSF Career Award to MRM. We thank James McFarland, Lyle Muller and Samuel Reiterfor a careful reading of this manuscript.
References1. O'Keefe J, Dostrovsky J. The hippocampus as a spatial map. Preliminary evidence from unit activity
in the freely-moving rat. Brain Res. 1971; 34:171–175. [PubMed: 5124915]2. Wilson MA, McNaughton BL. Dynamics of the hippocampal ensemble code for space. Science.
1993; 261:1055–1058. [PubMed: 8351520]3. O'Keefe J, Recce ML. Phase relationship between hippocampal place units and the EEG theta
rhythm. Hippocampus. 1993; 3:317–330. [PubMed: 8353611]4. Skaggs WE, et al. Theta phase precession in hippocampal neuronal populations and the compression
of temporal sequences. Hippocampus. 1996; 6:149–172. [PubMed: 8797016]5. Mehta MR, et al. Role of experience and oscillations in transforming a rate code into a temporal
code. Nature. 2002; 417:741–746. [PubMed: 12066185]6. Harris KD, et al. Spike train dynamics predicts theta-related phase precession in hippocampal
pyramidal cells. Nature. 2002; 417:738–741. [PubMed: 12066184]7. Huxter J, et al. Independent rate and temporal coding in hippocampal pyramidal cells. Nature. 2003;
425:828–832. [PubMed: 14574410]8. Hafting T, et al. Hippocampus-independent phase precession in entorhinal grid cells. Nature. 2008;
453:1248–1252. [PubMed: 18480753]9. Brun VH, et al. Place cells and place recognition maintained by direct entorhinal-hippocampal
circuitry. Science. 2002; 296:2243–2246. [PubMed: 12077421]10. Brun VH, et al. Impaired spatial representation in CA1 after lesion of direct input from entorhinal
cortex. Neuron. 2008; 57:290–302. [PubMed: 18215625]11. Nakashiba T, et al. Transgenic inhibition of synaptic transmission reveals role of CA3 output in
hippocampal learning. Science. 2008; 319:1260–1264. [PubMed: 18218862]12. Thompson LT, Best PJ. Place cells and silent cells in the hippocampus of freely-behaving rats. J
Neurosci. 1989; 9:2382–2390. [PubMed: 2746333]13. Lewis FT. The significance of the term Hippocampus. J Comp Neurol. 1923; 35:213–230.14. Walther C. Hippocampal terminology: concepts, misconceptions, origins. Endeavour. 2002; 26:41–
44. [PubMed: 12174467]15. Mercer A, et al. Characterization of neurons in the CA2 subfield of the adult rat hippocampus. J
Neurosci. 2007; 27:7329–7338. [PubMed: 17611285]16. Bartesaghi R, et al. Input-output relations in the entorhinal cortex-dentate-hippocampal system:
evidence for a non-linear transfer of signals. Neuroscience. 2006; 142:247–265. [PubMed:16844310]
17. Lorenté de Nó R. Studies on the structure of the cerebral cortex. II. Continuation of the study of theammonic system. J Psychol Neurol. 1934; 46:113–177.
18. Amaral DG, Witter MP. The three-dimensional organization of the hippocampal formation: areview of anatomical data. Neuroscience. 1989; 31:571–591. [PubMed: 2687721]
19. Jung MW, et al. Comparison of spatial firing characteristics of units in dorsal and ventralhippocampus of the rat. J Neurosci. 1994; 14:7347–7356. [PubMed: 7996180]
20. Maurer AP, et al. Self-motion and the origin of differential spatial scaling along the septo-temporalaxis of the hippocampus. Hippocampus. 2005; 15:841–852. [PubMed: 16145692]
21. Kjelstrup KB, et al. Finite scale of spatial representation in the hippocampus. Science. 2008;321:140–143. [PubMed: 18599792]
22. Muller RU, Kubie JL. The effects of changes in the environment on the spatial firing ofhippocampal complex-spike cells. J Neurosci. 1987; 7:1951–1968. [PubMed: 3612226]
Ahmed and Mehta Page 10
Trends Neurosci. Author manuscript; available in PMC 2011 March 30.
NIH
-PA Author Manuscript
NIH
-PA Author Manuscript
NIH
-PA Author Manuscript

23. O'Keefe J, Burgess N. Geometric determinants of the place fields of hippocampal neurons. Nature.1996; 381:425–428. [PubMed: 8632799]
24. Redish AD, et al. Independence of firing correlates of anatomically proximate hippocampalpyramidal cells. J Neurosci. 2001; 21:RC134. [PubMed: 11222672]
25. Witter, MP.; Amaral, DG. Hippocampal Formation. In: Paxinos, G., editor. The Rat NervousSystem. 3rd. Elsevier Academic Press; 2004. p. xviip. 1309
26. Dolorfo CL, Amaral DG. Entorhinal cortex of the rat: topographic organization of the cells oforigin of the perforant path projection to the dentate gyrus. J Comp Neurol. 1998; 398:25–48.[PubMed: 9703026]
27. Fyhn M, et al. Spatial representation in the entorhinal cortex. Science. 2004; 305:1258–1264.[PubMed: 15333832]
28. Hafting T, et al. Microstructure of a spatial map in the entorhinal cortex. Nature. 2005; 436:801–806. [PubMed: 15965463]
29. Brun VH, et al. Progressive increase in grid scale from dorsal to ventral medial entorhinal cortex.Hippocampus. 2008; 18:1200–1212. [PubMed: 19021257]
30. Solstad T, et al. From grid cells to place cells: a mathematical model. Hippocampus. 2006;16:1026–1031. [PubMed: 17094145]
31. Kajiwara R, et al. Convergence of entorhinal and CA3 inputs onto pyramidal neurons andinterneurons in hippocampal area CA1--an anatomical study in the rat. Hippocampus. 2008;18:266–280. [PubMed: 18000818]
32. Sargolini F, et al. Conjunctive representation of position, direction, and velocity in entorhinalcortex. Science. 2006; 312:758–762. [PubMed: 16675704]
33. Hargreaves EL, et al. Major dissociation between medial and lateral entorhinal input to dorsalhippocampus. Science. 2005; 308:1792–1794. [PubMed: 15961670]
34. Kerr KM, et al. Functional neuroanatomy of the parahippocampal region: the lateral and medialentorhinal areas. Hippocampus. 2007; 17:697–708. [PubMed: 17607757]
35. Leutgeb S, Leutgeb JK. Pattern separation, pattern completion, and new neuronal codes within acontinuous CA3 map. Learn Mem. 2007; 14:745–757. [PubMed: 18007018]
36. Megias M, et al. Total number and distribution of inhibitory and excitatory synapses onhippocampal CA1 pyramidal cells. Neuroscience. 2001; 102:527–540. [PubMed: 11226691]
37. Desmond NL, Weinberg RJ. Enhanced expression of AMPA receptor protein at perforatedaxospinous synapses. Neuroreport. 1998; 9:857–860. [PubMed: 9579679]
38. Andrasfalvy BK, Magee JC. Distance-dependent increase in AMPA receptor number in thedendrites of adult hippocampal CA1 pyramidal neurons. J Neurosci. 2001; 21:9151–9159.[PubMed: 11717348]
39. Nicholson DA, et al. Distance-dependent differences in synapse number and AMPA receptorexpression in hippocampal CA1 pyramidal neurons. Neuron. 2006; 50:431–442. [PubMed:16675397]
40. Jarsky T, et al. Conditional dendritic spike propagation following distal synaptic activation ofhippocampal CA1 pyramidal neurons. Nat Neurosci. 2005; 8:1667–1676. [PubMed: 16299501]
41. Rall W. Theory of physiological properties of dendrites. Ann N Y Acad Sci. 1962; 96:1071–1092.[PubMed: 14490041]
42. Magee JC, Cook EP. Somatic EPSP amplitude is independent of synapse location in hippocampalpyramidal neurons. Nat Neurosci. 2000; 3:895–903. [PubMed: 10966620]
43. Golding NL, Spruston N. Dendritic sodium spikes are variable triggers of axonal action potentialsin hippocampal CA1 pyramidal neurons. Neuron. 1998; 21:1189–1200. [PubMed: 9856473]
44. Kamondi A, et al. Dendritic spikes are enhanced by cooperative network activity in the intacthippocampus. J Neurosci. 1998; 18:3919–3928. [PubMed: 9570819]
45. Mehta MR. Cooperative LTP can map memory sequences on dendritic branches. Trends Neurosci.2004; 27:69–72. [PubMed: 15106650]
46. Ang CW, et al. Hippocampal CA1 circuitry dynamically gates direct cortical inputs preferentiallyat theta frequencies. J Neurosci. 2005; 25:9567–9580. [PubMed: 16237162]
Ahmed and Mehta Page 11
Trends Neurosci. Author manuscript; available in PMC 2011 March 30.
NIH
-PA Author Manuscript
NIH
-PA Author Manuscript
NIH
-PA Author Manuscript

47. Leutgeb JK, et al. Pattern separation in the dentate gyrus and CA3 of the hippocampus. Science.2007; 315:961–966. [PubMed: 17303747]
48. Somogyi P, Klausberger T. Defined types of cortical interneurone structure space and spike timingin the hippocampus. J Physiol. 2005; 562:9–26. [PubMed: 15539390]
49. Klausberger T, Somogyi P. Neuronal diversity and temporal dynamics: the unity of hippocampalcircuit operations. Science. 2008; 321:53–57. [PubMed: 18599766]
50. Wilent WB, Nitz DA. Discrete place fields of hippocampal formation interneurons. JNeurophysiol. 2007; 97:4152–4161. [PubMed: 17392415]
51. Ego-Stengel V, Wilson MA. Spatial selectivity and theta phase precession in CA1 interneurons.Hippocampus. 2007; 17:161–174. [PubMed: 17183531]
52. Maurer AP, et al. Phase precession in hippocampal interneurons showing strong functionalcoupling to individual pyramidal cells. J Neurosci. 2006; 26:13485–13492. [PubMed: 17192431]
53. Pouille F, Scanziani M. Enforcement of temporal fidelity in pyramidal cells by somatic feed-forward inhibition. Science. 2001; 293:1159–1163. [PubMed: 11498596]
54. Hahn TT, et al. Phase-locking of hippocampal interneurons' membrane potential to neocortical up-down states. Nat Neurosci. 2006; 9:1359–1361. [PubMed: 17041594]
55. Empson RM, Heinemann U. Perforant path connections to area CA1 are predominantly inhibitoryin the rat hippocampal-entorhinal cortex combined slice preparation. Hippocampus. 1995; 5:104–107. [PubMed: 7633510]
56. Mehta MR, et al. Experience-dependent, asymmetric expansion of hippocampal place fields. ProcNatl Acad Sci U S A. 1997; 94:8918–8921. [PubMed: 9238078]
57. Mehta MR, et al. Experience-dependent asymmetric shape of hippocampal receptive fields.Neuron. 2000; 25:707–715. [PubMed: 10774737]
58. Lee I, et al. A double dissociation between hippocampal subfields: differential time course of CA3and CA1 place cells for processing changed environments. Neuron. 2004; 42:803–815. [PubMed:15182719]
59. Mehta, MR.; McNaughton, BL. Expansion and shift of hippocampal place fields: evidence forsynaptic potentiation during behavior. In: Bower, JM., editor. Computational Neuroscience :Trends in Research. Plenum Press; 1996. p. 741-745.
60. Abraham WC, Bear MF. Metaplasticity: the plasticity of synaptic plasticity. Trends Neurosci.1996; 19:126–130. [PubMed: 8658594]
61. O'Mara S. Controlling hippocampal output: the central role of subiculum in hippocampalinformation processing. Behav Brain Res. 2006; 174:304–312. [PubMed: 17034873]
62. Ahmed OJ, et al. Reactivation in ventral striatum during hippocampal ripples: evidence for thebinding of reward and spatial memories? J Neurosci. 2008; 28:9895–9897. [PubMed: 18829947]
63. Kloosterman F, et al. Electrophysiological characterization of interlaminar entorhinal connections:an essential link for re-entrance in the hippocampal-entorhinal system. Eur J Neurosci. 2003;18:3037–3052. [PubMed: 14656299]
64. Canto CB, et al. What does the anatomical organization of the entorhinal cortex tell us? NeuralPlast. 2008; 2008:381243. [PubMed: 18769556]
65. Moser EI, et al. Place cells, grid cells, and the brain's spatial representation system. Annu RevNeurosci. 2008; 31:69–89. [PubMed: 18284371]
66. Willmore B, Tolhurst DJ. Characterizing the sparseness of neural codes. Network. 2001; 12:255–270. [PubMed: 11563529]
67. Treves A, Rolls ET. What Determines the Capacity of Autoassociative Memories in the Brain.Network-Computation in Neural Systems. 1991; 2:371–397.
68. Jung MW, McNaughton BL. Spatial selectivity of unit activity in the hippocampal granular layer.Hippocampus. 1993; 3:165–182. [PubMed: 8353604]
69. Schultz SR, Rolls ET. Analysis of information transmission in the Schaffer collaterals.Hippocampus. 1999; 9:582–598. [PubMed: 10560929]
70. Olshausen BA, Field DJ. Sparse coding of sensory inputs. Curr Opin Neurobiol. 2004; 14:481–487. [PubMed: 15321069]
Ahmed and Mehta Page 12
Trends Neurosci. Author manuscript; available in PMC 2011 March 30.
NIH
-PA Author Manuscript
NIH
-PA Author Manuscript
NIH
-PA Author Manuscript

71. Lee AK, et al. Whole-cell recordings in freely moving rats. Neuron. 2006; 51:399–407. [PubMed:16908406]
72. Zhang F, et al. Multimodal fast optical interrogation of neural circuitry. Nature. 2007; 446:633–639. [PubMed: 17410168]
73. van Groen T, et al. The entorhinal cortex of the mouse: organization of the projection to thehippocampal formation. Hippocampus. 2003; 13:133–149. [PubMed: 12625464]
74. Fyhn M, et al. Grid cells in mice. Hippocampus. 200875. Jinno S, Kosaka T. Cellular architecture of the mouse hippocampus: a quantitative aspect of
chemically defined GABAergic neurons with stereology. Neurosci Res. 2006; 56:229–245.[PubMed: 16930755]
76. Abusaad I, et al. Stereological estimation of the total number of neurons in the murinehippocampus using the optical disector. J Comp Neurol. 1999; 408:560–566. [PubMed: 10340505]
77. Aika Y, et al. Quantitative analysis of GABA-like-immunoreactive and parvalbumin-containingneurons in the CA1 region of the rat hippocampus using a stereological method, the disector. ExpBrain Res. 1994; 99:267–276. [PubMed: 7925807]
78. Shi L, et al. Stereological quantification of GAD-67-immunoreactive neurons and boutons in thehippocampus of middle-aged and old Fischer 344 × Brown Norway rats. J Comp Neurol. 2004;478:282–291. [PubMed: 15368530]
79. Jinno S, et al. Quantitative analysis of GABAergic neurons in the mouse hippocampus, withoptical disector using confocal laser scanning microscope. Brain Res. 1998; 814:55–70. [PubMed:9838044]
80. McBain CJ. Differential mechanisms of transmission and plasticity at mossy fiber synapses. ProgBrain Res. 2008; 169:225–240. [PubMed: 18394477]
81. Andrasfalvy BK, Mody I. Differences between the scaling of miniature IPSCs and EPSCs recordedin the dendrites of CA1 mouse pyramidal neurons. J Physiol. 2006; 576:191–196. [PubMed:16887875]
Ahmed and Mehta Page 13
Trends Neurosci. Author manuscript; available in PMC 2011 March 30.
NIH
-PA Author Manuscript
NIH
-PA Author Manuscript
NIH
-PA Author Manuscript

Figure 1. Entorhinal projections to the hippocampus in the ratThe entorhinal cortex (EC) has traditionally been divided into 2 major subdivisions: thelateral entorhinal cortex (LEC) and the medial entorhinal cortex (MEC). However, there arealso three bands that run perpendicular to the MEC/LEC divide: the dorsolateral,intermediate and ventromedial bands. The hippocampus has a septo-temporal axis (alsocalled its long axis): it starts off at a septal, medial and dorsal location in each hemisphereand then arches backwards and outwards in a C-shape, ending up at a temporal, lateral andventral location [18,25]. The pathway projecting from the EC to the hippocampus is calledthe perforant path. This projection has a number of key organizing principles. There aretopographic projections from the bands of the EC to the septo-temporal axis of thehippocampus. The dorsolateral band (encompassing parts of both the MEC and LEC)projects to the septal half of the hippocampus. The intermediate band projects to the thirdquarter of the hippocampus (projections not shown for sake of clarity). The ventromedialband goes to the most temporal quarter of the hippocampus [26].A) Layer III pyramidal neurons in the LEC component of each band project to the distalportion of CA1 (cells distant from CA3) [25]. LEC layer III cells show poor spatialmodulation [33].B) Layer III pyramidal neurons in the MEC project to the proximal part of CA1 (cells closerto CA3) [25]. MEC layer III cells are spatially modulated: about half are head-directioncells, a quarter are grid cells and the rest are mixed [32].C) In each of the three bands, layer II stellate cells of both the MEC and LEC project to theDG and CA3* [25]. This means that an individual DG or CA3 cell can be innervated byaxons from both MEC and LEC.D) Granule cells in DG provide intra-hippocampal projections to CA3 [25,80].E) CA3 pyramidal cells provide input to CA1 via the Schaffer Collaterals. There is sometopography in this projection: at each transverse level of the hippocampus, CA3 close to DGprimarily project to distal CA1 cells, whereas CA3 cells closer to CA1 project to proximalCA1 cells [25].* This figure shows projections from the EC to the hippocampus in the rat. In the mouse,however, CA3 does not receive its inputs from layer II of the EC. Instead, most projectionsto the mouse CA3 originate in layer III of both the MEC and LEC [73] (Table 2 and Box2.4).
Ahmed and Mehta Page 14
Trends Neurosci. Author manuscript; available in PMC 2011 March 30.
NIH
-PA Author Manuscript
NIH
-PA Author Manuscript
NIH
-PA Author Manuscript

Figure 2. Synaptic organization of inputs to a single CA1 cell: source, number, strength and rateA) Most inhibitory GABAergic inputs onto a single CA1 cell are from CA1 interneurons[48,49].B) Fast spiking putative interneurons corresponding to basket and axo-axonic cells projectprimarily to the proximal dendrites of the CA1 cell and to the cell body and axon. Thesecells fire at rates of at least 20 Hz in vivo during exploration [50-52]. However, few in vivorecordings have been made from interneurons with broad spikes such as O-LM neurons andother cells that project more heavily to the distal CA1 dendrites. Thus, the in vivo firing rateof these cells is unknown.C) Schematic showing representative spatial firing profiles of interneurons. Most of thesecells fire at high rates and normally show little spatial modulation. However, recent studieshave shown that some interneurons can also increase or decrease their firing rates inrestricted regions of space [50-52].D) The number of GABAergic synapses found across the CA1 cell body and dendrites [36].E) The miniature inhibitory postsynaptic current (mIPSC) is relatively constant across thecell body and proximal dendrites of the CA1 cell [81]. The mIPSC magnitude at distal S-LMand basal S-O dendrites is unknown, as it is difficult to patch onto these very thin dendrites.F) The source of excitatory inputs to different dendritic regions of a CA1 cell [25].G) The mean rate of excitatory inputs to a CA1 cell during exploration [32,47].H) Schematic showing representative spatial firing profiles of entorhinal and CA3 cellduring exploration. Two-thirds of CA3 cells are silent, and the rest have sparse place fields.Entorhinal cells, on the other hand, encode space in a repeating grid pattern or encode headdirection information [32].I) The number of excitatory synaptic inputs onto dendritic spines at all locations along thedendritic tree of a CA1 cell. Note the larger number of putative CA3 inputs [36]. It shouldbe pointed out that a small proportion of the excitatory synaptic inputs to a CA1 cell arefrom regions other than CA3 or EC [25].J) The proportion of large, perforated synapses increases along the apical dendrite, peakingat the most distal synapses [39].K) The number of AMPA receptors per perforated synapse peaks at the distal S-R dendrites,but then falls rapidly at the most distal dendrites in S-LM [38,39].L) As expected from the numbers in (I) and (J), the size of the miniature excitatorypostsynaptic current (mEPSC) increases from proximal to distal S-R [42,81]. However, nodirect evidence exists for the value of this current in the most distal dendrites in S-LM asthese dendrites are far too thin to patch on to. It is estimated that due to the decreasedAMPA receptor count at these most distal synapses, the mEPSC would decrease in thesedistal dendrites [39].M) The total number of inhibitory synapses on a CA1 neuron is far less than the number ofexcitatory synapses [36].N) The mean firing rate of the inhibitory neurons is far greater than that of excitatoryneurons [50-52]. Furthermore, entorhinal firing rates are much greater than CA3 rates[32,47].O) A product of the number of synapses times the firing rates yields an estimate of the netinhibitory and excitatory drive onto a CA1 cell. Conservative estimates suggest that theinhibitory drive may be at least twice as large as the excitatory drive. Note that thiscalculation does not factor in the efficacy, strength or short term dynamics of the synapses.
Ahmed and Mehta Page 15
Trends Neurosci. Author manuscript; available in PMC 2011 March 30.
NIH
-PA Author Manuscript
NIH
-PA Author Manuscript
NIH
-PA Author Manuscript

Figure 3. Excitation-inhibition balance onto a single CA1 pyramidal cellSchematic representation of the relative influence of excitation and inhibition on the spatialselectivity of a place cell. The x-axis in all plots represents distance along a linear track.A) Perfectly balanced excitation and inhibition would lead to spikes at several points on thetrack due to random increases in excitation or decreases in inhibition. However, silent cellsdo not fire many spikes on the track [12].B) Dominant inhibition would prevent random fluctuations in excitatory and inhibitoryinputs from resulting in spikes. This could explain the observed, very rare firing of silentcells [12].C) A synchronous increase in excitation at a particular point on the track can lead toexcitation overcoming inhibition and the CA1 cell firing in a place-dependent manner [30].D) A synchronous decrease in inhibition in a given region of space can also lead to thespatially modulated firing of a CA1 cell [50-52].E) Experience-dependent changes in the excitatory inputs can lead to asymmetric placefields with higher firing rates [56-58].
Ahmed and Mehta Page 16
Trends Neurosci. Author manuscript; available in PMC 2011 March 30.
NIH
-PA Author Manuscript
NIH
-PA Author Manuscript
NIH
-PA Author Manuscript
NIH
-PA Author Manuscript
NIH
-PA Author Manuscript
NIH
-PA Author Manuscript
Ahmed and Mehta Page 17
Tabl
e 1
Plac
e fie
ld st
atis
tics s
ugge
st th
at C
A3
and
EC a
re b
oth
requ
ired
for g
ener
atin
g sh
arp,
spar
se p
lace
fiel
ds.
Man
ipul
atio
n:C
hem
ical
ly L
esio
n C
A3
Che
mic
ally
Les
ion
EC
Lay
er II
IT
rans
geni
cally
Sile
nce
CA
3
Rec
ordi
ng S
ite:
Dor
sal C
A1
Ven
tral
CA
1D
orsa
l CA
1
Spec
ies:
Rat
Rat
Mou
se
Ref
eren
ce:
[9]
[10]
[11]
Met
ric
Con
trol
- CA
3Si
gnif
Con
trol
- EC
III
Sign
ifC
ontr
ol- C
A3
Sign
if
Plac
e Fi
eld
Size
Nov
el (D
ay 1
)En
viro
nmen
tN
/AN
/AN
/A0.
46 m
2
Fig
6Da
0.55
m2
Fig
6Da
+20%
Z=1.
19N
.S52
.2%
of b
ox69
.3%
of b
ox+3
3%p<
0.00
1
Plac
e Fi
eld
Size
Fam
iliar
Envi
ronm
ent
18.9
%of
box
28.2
%of
box
+49%
Z=1.
7N
.S0.
25 m
20.
36 m
2+4
4%Z=
2.22
*p<
0.05
44.3
%of
box
56.3
%of
box
+27%
p<0.
001
Peak
Firi
ng R
ate
Nov
el (D
ay 1
)En
viro
nmen
t (H
z)N
/AN
/AN
/AN
/AN
/AN
/A13
.34
13.2
6-1
%N
.S
Peak
Firi
ng R
ate
Fam
iliar
Envi
ronm
ent (
Hz)
10.3
7.0
-32%
Z=2.
2*p<
0.05
11.3
28.
66-2
3%Z=
1.69
N.S
17.1
411
.32
-34% N/A
Mea
n Fi
ring
Rat
eN
ovel
(Day
1)En
viro
nmen
t (H
z)N
/AN
/AN
/A1.
45Fi
g 6F
a1.
85Fi
g 6F
aN
/A1.
852.
64+4
3%p<
0.00
1
Mea
n Fi
ring
Rat
eFa
mili
arEn
viro
nmen
t (H
z)1.
000.
91-9
%Z=
0.2
N.S
1.34
1.20
-10%
Z=0.
12N
.S2.
271.
77-2
2% N.S
.
Spat
ial I
nfor
mat
ion
Nov
el (D
ay 1
)En
viro
nmen
t (bi
ts)
N/A
N/A
N/A
0.40
Fig
6Ca
0.28
Fig
6Ca
-30%
Z=2.
25*
p<0.
050.
80.
4-5
0%p<
0.00
1
Spat
ial I
nfor
mat
ion
Fam
iliar
Envi
ronm
ent (
bits
)N
/AN
/AN
/A0.
710.
47-3
4%Z=
2.81
*p<
0.00
51.
10.
7-3
6%p<
0.00
1
Spar
sity
Inde
x(s
ee B
ox 1
),Fa
mili
arEn
viro
nmen
t0.
300.
46+5
3%Z=
2.9*
p<0.
005
0.45
0.56
+24%
Z=2.
92*
p<0.
005
N/A
N/A
N/A
Foot
note
s:
a Val
ues r
epre
sent
the
mea
n ac
tivity
dur
ing
min
utes
10-
20 in
a n
ovel
env
ironm
ent
b N.S
: Not
Sig
nific
ant.
Trends Neurosci. Author manuscript; available in PMC 2011 March 30.

NIH
-PA Author Manuscript
NIH
-PA Author Manuscript
NIH
-PA Author Manuscript
Ahmed and Mehta Page 18c N
/A: N
ot A
vaila
ble.
Trends Neurosci. Author manuscript; available in PMC 2011 March 30.

NIH
-PA Author Manuscript
NIH
-PA Author Manuscript
NIH
-PA Author Manuscript
Ahmed and Mehta Page 19
Table 2
Comparative hippocampal anatomy of rats and mice.
Rat Mouse
Main source of corticalinputs to CA3 EC layer II [25] EC layer III [73]
Density of pyramidal(excitatory) neurons in CA1
(1000s of neurons/mm3)270 [75,76] 1600 [75,77].
Density of GABAergic(inhibitory) neurons in CA1
(1000s of neurons/mm3)13.3 [75,78] 13.5 [75,79].
Ratio of CA1excitatory:inhibitory neuron
density20:1 120:1
Footnotes:
EC = Entorhinal Cortex
Trends Neurosci. Author manuscript; available in PMC 2011 March 30.


![Medial septal [beta]-amyloid 1-40 injections alter septo-hippocampal anatomy and function](https://static.fdokumen.com/doc/165x107/6329e172e9556f820801538c/medial-septal-beta-amyloid-1-40-injections-alter-septo-hippocampal-anatomy-and.jpg)