The global impact of the Russian financial crisis: evidence using granger causality and impulse...
35
Ahmed M. Khalid and Gulasekaran Rajaguru Global Impact of Russian Financial Crisis Evidence Using Grange Causality and Impulse Reponses in a VAR Model No. 12, November 2007
-
Upload
independent -
Category
Documents
-
view
0 -
download
0
Transcript of The global impact of the Russian financial crisis: evidence using granger causality and impulse...
GDC Working Papers
Ahmed M. Khalid and Gulasekaran Rajaguru
Global Impact of Russian Financial Crisis Evidence Using Grange Causality and Impulse Reponses in a VAR Model
No. 12, November 2007

2
Global Impact of Russian Financial Crisis Evidence Using Grange Causality and Impulse Reponses in a VAR Model
by
Ahmed M. Khalid and
Gulasekaran Rajaguru
September 2006
Abstract
This study attempts to investigate the financial market contagion in a global perspective. We use a large sample of 26 countries representing different regions in the world and focus on the spillover effects of the 1998 Russian crisis. We use daily observations on three financial market indicators namely, the exchange rates, stock prices and interest rates. We construct a VAR to test the interlinkages among different market and different regions using the Granger causality. Later, we perform impulse response analysis by introducing a shock in each of the Russian market and observe the impact and duration of this shock on other global markets. The evidence suggests that most of the exchange rates and stock prices within and across the regions are strongly linked and may have had provided a channel for contagion during the 1998 Russian crisis. However, the evidence for interest rate linkages is less supportive. JEL Classification: F30, F31, F32, F34, F41,
Key words: Russian Crisis, Global Market Linkages, VAR, Granger Causality, Impulse Responses
Acknowledgements: We acknowledge the useful comments by the participants of the Bond University Staff Seminar. The usual disclaimer applies. Correspondence to: Ahmed M. Khalid, Globalisation and Development Centre, Bond University, Gold Coast, QLD 4229, Australia, Fax: (617) 5595-1160, E-mail: [email protected]

3
Global Impact of Russian Financial Crisis Evidence Using Grange Causality and Impulse Reponses in a VAR Model
1. Introduction
The increased episodes of financial crises during the 1990s in various regions around the globe
prompted academics and policy makers to identify the source(s) and spillover effects of such crises.
The crises in Latin America (1994), Asia (1997) and Russia (1998) are examples of such shocks
spreading from one country to another. It is argued that inappropriate and hasty financial sector
reforms in many parts of the developing world in the 1990s left the markets unstable and vulnerable
to even minor shocks. The increased financial and trade sectors interdependence within a region
further aggravated the problem.1 In the literature, this is labeled as contagion. As a result, there is
a growing concern among researchers and policy makers to investigate the cause and effect of such
crises. Many economists, in the recent past, have studied this phenomenon both theoretically and
empirically. Recently, some studies have focused on the issue of currency contagion using data
from Latin American and Asian countries. However, the existing research has several limitations.
This study attempts to extend the scope of existing research and looks into the issue of contagion in
a global perspective.
Specifically, we investigate the spread of contagion as the main cause of trouble across
different markets, both regional and global. This paper studies the co-movements of three market
indicators namely the exchange rates, stock price indices, and interest rates during the 1998 Russian
crisis. We use a comprehensive sample of 26 representative countries from six regions, namely,
East Asia, South Asia, Latin America, Eastern Europe, Africa and the Middle-East. We look at
several scenarios including cross-country contagion in a single market and within and across
regions in a selected sample of countries from all above stated regions. We use daily observations
and focus on the 1998 Russian financial crisis. We construct a VAR (vector autoregression) model

4
suitable for our analysis and use Granger causality tests to investigate inter-linkages. We also study
impulse responses by introducing shocks to each of three markets in Russia and observe the impact,
timing, and duration of these shocks to the countries in the region as well as across the regions.
This study is organized in the following manner. Section 2 provides a historical perspective
of the crises in Russia (1998). Section 3 reviews the theoretical and empirical literature on
contagion. Data and estimation techniques are discussed in section 4. Section 5 reports the results
of causality tests as well as impulse responses analysis. Finally, the conclusions are drawn in
section 6.
2. Russian Financial Crisis: A Historical Perspective
Basically, the 1998 financial crisis in Russia was originated by Russia’s decision to default on
external debt payment. Before moving towards any empirical analysis to investigate he impact of
the 1998 Russian crisis on markets within the Eastern European region and across regions, it is
imperative to have a close to at the historical facts unleashed before and during the Russian crisis.
We first look at some major economic indicators during the late 1990s in Russia and a sample of
countries in the Eastern Europe region. A quick look at the macroeconomic/financial indicators
provided in Table 1 reveals substantial variations across countries. During the period covered in
this Table 1, some countries experienced negative growth while others had a marginal to reasonable
positive growth rates. Russia, Romania and Yugoslavia experienced large devaluation in 1998 and
1999. All regional countries seem to suffer with fiscal deficits prior to the crisis. It is believed that
Russian government failed to curtail these persistent deficits. The absence of a well-developed and
efficient money, capital and bond markets further aggravated the problem and exerted a huge
burden to the limited resources and eventually led to the financial crisis in 1998.
INSERT TABLE 1 AROUND HERE
1 See Ariff and Khalid (2005) for further details.

5
A chronology of financial crisis in Russia suggests that the crisis was the result of overall
macroeconomic mismanagement, specifically inadequate and inefficient management of the fiscal
sector as well as a deteriorating balance of payments. The main cause of the Russian crisis was the
imbalances in state finances, which resulted into a declining trend in major macroeconomic
indicators as early as 1995.2 Domestic debt, which started to rise in 1995 due to increased
borrowings in the securities market rose to about 26 percent of GDP by mid-1998. The borrowings
in the foreign financial market increased at the same time. However, the domestic borrowing was
more of short-term maturity while foreign borrowings were of long-term nature.
The first attack on the rouble was felt in November 1997, partly a result of problems in tax
collecting mechanism and high domestic debt3 and partly due to a contagion (or spillovers) from
Asia (the 997 Asian crisis).4 It is argued that the damaging effects of the collapse of Hong Kong
equity prices in October 1997 were not restricted to Asia but were also felt in emerging economies
in Eastern Europe and Russia. Arkhipov et.al (1999) also attributes the downfall of Dow Jones
Industrial Index which dropped to a record low of 554 points on October 1997 as the beginning of
Russian economic problems. The Russian stock market followed the trend and dropped by 328.5
points during October-November 1997. This resulted into a lack of confidence and an attack on the
Russian rouble. In an effort to defend the currency, the central bank of Russia (CBR) intervened in
the foreign exchange market loosing US$6 billion (later reached to a level of about US$17 billion)
of foreign reserves between October and November 1997. The second blow to the Russian
economy and financial market came when the crisis in Asia worsened in late 1997 and early 1998.
The Russian market was severely affected by this global trend and the stock market index (RTS-1)
dropped by about 51 percent between October 1997 and January 1998. In the absence of any
2 See Arkhipov et.al. (1999)
3 See Buchs (1999) for details.

6
immediate response by the Russian government and policy makers to deal with the crisis, the
situation continued worsening and by mid-May RTS-1 dropped by another 40 percent while
international reserves went down to US$ 1.4 billion. In May 1998 the collapse of Russian rouble
was very much imminent. The Russian government’s ability to sovereign its debt and maintain
stable currency became questionable.
As compared to the experiences in Latin America and Asia5, the reaction of the government
to overcome the crisis was very slow and created more lack of confidence among investors.
Eventually, in June 1998, the International Monetary Fund, The International Bank for
Reconstruction and Development and the government of Japan agreed to extend an assistance of
US$22.6 billion to Russia with US$5.6 billion to be granted immediately. This, however, did not
help improve the situation due to internal political turmoil and by August 1998, the country faced a
full fledged crisis including the collapse of currency and stock markets and the domestic banking
sector. On August 17, the Russian Central Bank announced that the rouble would be allowed to
float within a wider band, between 6.0 to 9.5 roubles to the US dollar. All trading in T-bills was
suspended and complete capital controls were imposed. The government also declared a 90-day
moratorium on foreign commercial debt.
The spillover effects of Russian crises were much larger than what was believed at the time
of crisis. The impact was felt on currencies in many emerging economies as well as equity prices
in both emerging and developed markets. For example, equity markets in the United States
bottomed out, in late August 1998, by about 20 percent below their high. Between August and
mid-October 1998, stock prices in the European markets fell by about 35 percent. This shows that
the negative impact of Russian crisis was not restricted to Russia but was spread to the global
economy. It is also supported by an IMF study which reveals that the Russian crises, which
4 Khalid and Rajaguru (2006b) found evidence of this spillover from Asian countries to other parts of the world
including Russia.
5 See Khalid and Rajaguru and Kawai (2006a) for a discussion on the 1994 Mexican crisis. For a discussion of the
1997 Asian crisis, see Khalid and Kawai (2003).
7
dropped stock prices in Russia by over 30 percent, left the global markets down by at least 10
percent.6 The above discussion and the summary of events unfolded during the 1998 Russian crisis
lead us to believe certain cross-market and cross-country linkages that may have contributed to the
spread of the crises. This aim of this paper is to empirically test this hypothesis.
3. Financial Market Contagion: Literature Survey
The repeated episodes of financial crisis in various parts of the world during the 1990s could be
attributed to several factors including close financial market integration, regional similarities and
most importantly, the financial market contagion which is the focus of this paper. Financial
contagion may be defined as a systematic effect on the likelihood of speculative activity in one
country’s financial (such as foreign exchange, stock and/or money) markets arising from similar
activity in another country’s financial markets.
Theoretical literature provides a variety of explanations for the channels of contagion. A
financial crisis may spread from one country to another due to some Common shocks, factors that
may affect exchange rates or stock markets of several countries simultaneously. This could be a
reaction of either a sharp decline in world aggregate demand or significant changes in commodity
prices or large changes in exchange rates between major currencies. One of the important causes of
currency crises is argued to be due to strong trade linkages. In such a case, currency (or foreign
exchange market) contagion starts by a real depreciation of country A’s currency due to speculative
attacks. Such depreciation enhances its export competitiveness and produces a trade deficit for its
competitor country B. This results into a depletion of foreign exchange reserves of country B and
increases the probability of speculative attacks on the country B’s currency. A pressure on
domestic currency may expose the strength of the financial market and may increase the volatility
of stock market returns and interest rates.
6 See IMF-World Economic Outlook (1999) for details.

8
Similar to trade linkages, strong financial linkages are also considered as a major cause of
contagion. In this case, if market in country A suffers a negative shock that is expected to increase
risk exposure to financial assets, the investors in Country B may need a portfolio readjustment and
risk management to avoid losses. However, if financial markets in a group of countries are closely
linked, then a crisis in one country will increase the probability of crisis in the region as a whole.
This will force investors to change their portfolio. As a result some countries may experience
capital outflows even if their macroeconomic fundamentals have not changed.
Shifts in investor’s sentiments7.is another channel through witch the crisis spreads from one
country to another. Accordingly, a country with weak financial market fundamentals is more likely
to suffer from shocks elsewhere. Any speculative attack in another country will make this country
more vulnerable to similar attacks. This could also be due to herd mentality where investors
respond to a shock in one country in a similar pattern based on certain expectation on the
movement of the market variables in the whole region.
Empirical literature, in general, has found evidence of a currency contagion. For example, a
group of economists detected contagion in case of Tequila crisis in Latin America initiated by a
crash of Mexican peso in 19948. Eichengreen, Rose and Wyplosz (1996) used thirty years panel
data for 20 industrialized countries and argue that currency contagion spread more easily to
countries which were closely tied by international trade linkages than to countries in similar
macroeconomics conditions. Using data from emerging markets, Glick and Rose (1999) concluded
that trade was the important channel for contagion. Using a time-varying transition probability
Markov-switching model, Cerra and Saxena (2000) found empirical evidence suggesting contagion
(pressures on exchange rate emerging from Thailand) as one source of crisis in Indonesia along
with other factors such as domestic financial conditions and political instability. Ahluwalia (2000)
twisted the argument of common macroeconomic weaknesses to important similarities between
7 Rijckeghem and Weder (1999) also define “pure contagion” as spread of crisis from one country to another (or the region) due to factors not termed as changes in fundamentals or any spillovers. 8 Calvo and Reinhart (1995) and Sachs, Tornell and Velasco (1996) are among few of these studies.
9
countries as a channel for contagion and found support for contagion in a sample of 19 countries
Asia and Latin America.
Rijckeghem and Weder (1999) argue that financial market linkages are an important source
of spillovers from shock-originating country to other countries in the region. Using Mexico,
Thailand and Russia as the crisis originating countries, they found support for financial market
linkages as the source of spillovers. There is also an argument based on common creditor problem,
which may lead to unexpected capital outflows independent of macroeconomic fundamentals.
Later empirical research using data from Asian crisis period found support for the case of regional
currency market contagion.9
It is evident from above discussion that most of the existing research is restricted to
currency market only and investigates spillover effects within a region ignoring the possibility of an
impact across regions and across markets. The issue of contagion, as such, has not been explored
using all three financial market indicators namely, the exchange rate, stock prices and interest rates.
Furthermore, not much attention is paid to the 1998 Russian crisis and its spillover effects within
and across regions. The objective of this paper is to extend the existing research by incorporating
all of these factors with a focus on the 1998 Russian crisis. We use daily observations to study the
financial market contagion. We construct a VAR and apply Granger causality tests to identify the
cross-country-cross market contagion during the above crises period. Later, we extend the analysis
to investigate the impact of a shock introduced in each of the Russian market by using impulse
responses. This study, in this respect, is much more comprehensive than the earlier research on the
issue and could offer some important policy implications.
9 Barrell, Ray, et.al. (1998), Biag and Goldfajn (1998), Fratzscher (1998), Perry and Lederman (1998), Masih and Masih (1999), Chan and Felmingham (2003), Min, McDonald and Choung (2003), and Sander and Kleimeier (2003) are among few of these studies.
10
4. Data and Estimation Techniques
This paper attempts to study the interlinkage between three important financial market indicators,
namely, exchange rates, stock price indices and the interest rates with a focus on the 1998 Russian
crisis. We investigate both cross-country and cross-market contagion within and across regions
using a representative sample of countries from East-Asia, South Asia, Latin America, Eastern
Europe, East Africa and the Middle-East. Daily observations on exchange rates, stock prices and
interest rates for each country are used for empirical estimation.
Spot exchange rates are probably not the best reflector of exchange rate movements if the
country has fixed or managed exchange rate regimes. Forward market rates should help to isolate
the central bank intervention in the foreign exchange market and reflects the true movements of the
exchange rate. However, forward rates are not available for most of the sample countries. We,
therefore, use data for each country’s domestic currency against the US$ (WMR; Reuters). Some
of the countries report exchange rate against the UK pound sterling only. In such a case, these rates
are then converted to domestic currency against the US dollar using UK pound/US dollar cross rate.
Morgan Stanley Capital International (MSCI) is the main source used for stock price
indices. IFC index is used as a proxy in cases where MSCI index is not available. Noruma index is
the third source and finally we use any domestic country average index (in cases where no other
index is available). Interest rates are the most difficult to obtain especially if it is on a daily basis.
Firstly, such data are not reported for most of the developing countries. Secondly, even if some
data are reported they are not the common interest rates across countries. As a result, we have no
choice but to use close proxy of a short term money market rate such as a three-month interbank
rate. Depending of data availability, we use a variety of interest rates such as three-month deposit
rate, three-month T-bill rate, 90-day CD, 3-month interbank rate, 7-15 days repo, etc. All these
data details are provided in Appendix Table A1. All data on exchange rates, stock prices and
interest rates are obtained from DataStream.10
10 Details of the data and data sources are provided in Appendix Table A1.
11
For empirical estimation, we cover the 1998 Russian crisis period ranging from 1 August
1998 to 31 March 1999.
Estimation Techniques
Mean reversal property for variables used in this study is important prior to any empirical
estimation. Standard ADF and Phillip-Perron unit root tests are used to identify the order of
integration for each sample period corresponding to a particular crisis. The results of this exercise
will help us to construct the specification of the vector autoregression (VAR) model.
The vector autoregression (VAR) is commonly used for analyzing the dynamic impact of
random disturbances on the system of variables. The VAR approach models every endogenous
variable in the system as a function of the lagged values of all of the endogenous variables in the
system and can be specified as:
yt = A1yt-1 + ….. + Apyt-p + εt (1)
Where yt is a k vector of endogenous variables, A1, …, Ap are matrices of coefficients to be
estimated, and εt is a vector of innovations that may be contemporaneously correlated with each
other but are uncorrelated with their own lagged values and uncorrelated with all of the right-hand
side variables. It is very essential to determine the optimal lag length before estimating a VAR. It
is common practice to choose a lag length arbitrarily allowing just enough lags to ensure that the
residuals are white noise but maintaining the precision of estimates. There are also some
procedures used to determine an appropriate lag length such as Akaike information criteria (AIC),
Schwartz information criteria (SIC) and likelihood ratio (LR) test. We used all three methods to
determine a lag length. Surprisingly, both the AIC and SIC suggest lag length of one while LR is
inclusive. We, therefore, choose one lag for all VARs in this study. Since we have same lag
length, each equation in the system could be estimated using OLS.
The main objective of estimating a VAR in this study is to identify any causal relationship
among different markets across countries. For example, we are interested to see what causes the

12
disturbance in Thai foreign exchange market? This is accomplished by testing Granger causality
by running a VAR on the system of equations and testing for zero restrictions on the VAR
coefficients.
Next, we analyze the impulse responses. An impulse response function traces the effect of
a one standard deviation shock to one of the innovations on current and future values of the
endogenous variables. A shock to i-th variable directly affects the i-th variable, and is also
transmitted to all of the endogenous variables through the dynamic structure of the VAR. Since
innovations are usually contemporaneously correlated, they have common factors, which cannot be
associated or isolated with a specific variable. As such, the ordering of variables becomes very
important in this analysis.
The dynamic analysis of the VARs is usually carried out using the orthogonalized impulse
responses’ as suggested by Sims (1980). Accordingly, Cholesky decomposition is normally used in
the literature where errors are orthogonalized in such a way that the covariance matrix of the
resulting innovations is diagonal. However, as stated above, this method is rather arbitrary and the
impulse responses are very sensitive to ordering of variables in the VAR. Pesaran and Shin (1997)
proposed an alternative procedure called, the generalized impulse response (GIR) analysis, which is
invariant to the ordering of variables in the VARs. Since ordering of variables in a rather large
VAR as used in this paper may be difficult and complicated to identify an appropriate order of the
variables. We, therefore, use the generalized impulse response analysis in this study. We
concentrate on three regions and three markets. First, we introduce independent shocks to Russian
exchange rates and analyze the impact within and across the regions. We repeat the same in other
two markets namely, stock market and interest rates. We, finally, repeat the analysis using the full
sample.

13
5. Empirical Results
As discussed earlier, we first perform the diagnostic tests on all the variables using DF/ADF and PP
procedures. The results in differenced series are reported in Tables 211. The results suggest that all
the variables used in this study are integrated of order one I(1). These results help us construct a
VAR as specified in equation (1) using variables in first difference and then perform the causality
tests and impulse response analysis. We discuss these results in the following sub-sections.
Granger Causality Tests
This section examines the cross-country-cross-market linkages in the above sample countries. The
analysis is, therefore, comprehensive, using a large sample of 3 markets of 26 countries. As a
result, the coefficient matrix in the VAR is a 78x78 matrix. This means that any causality result,
say between exchange rate of Argentina and stock prices for Russia does account for the whole
VAR (78x78). For analytical purposes, the coefficient matrix is divided into 9 sub-matrices. Due
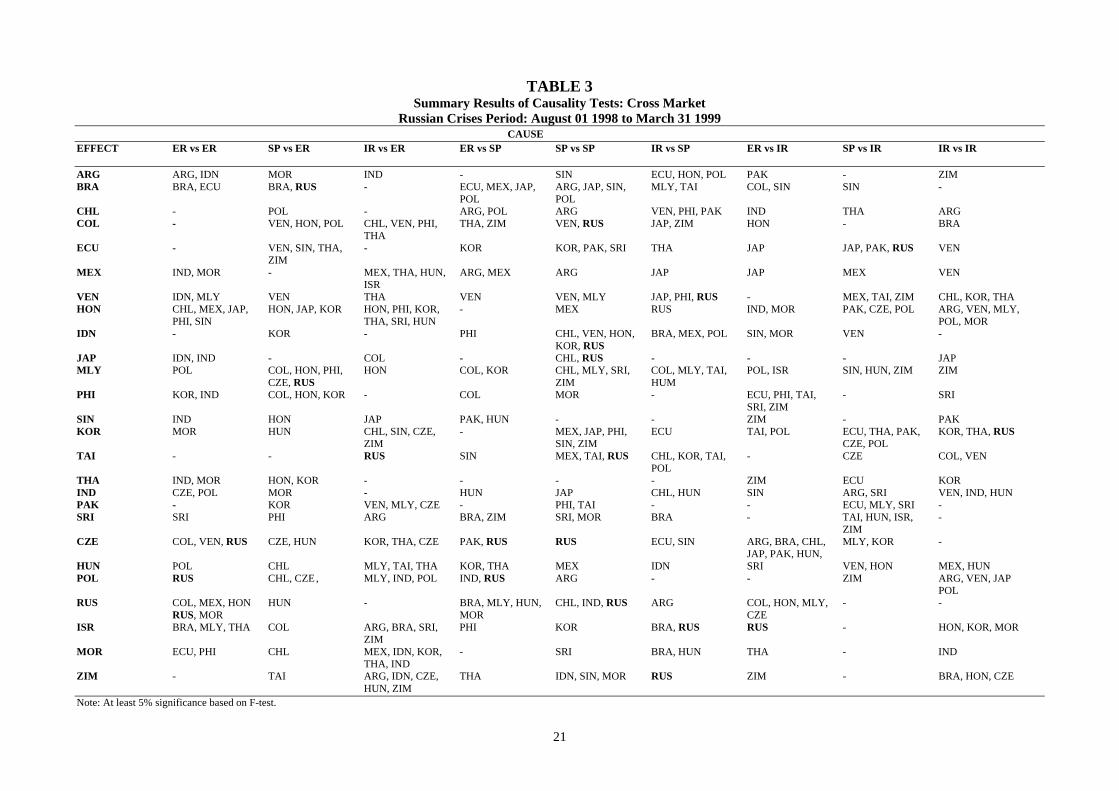
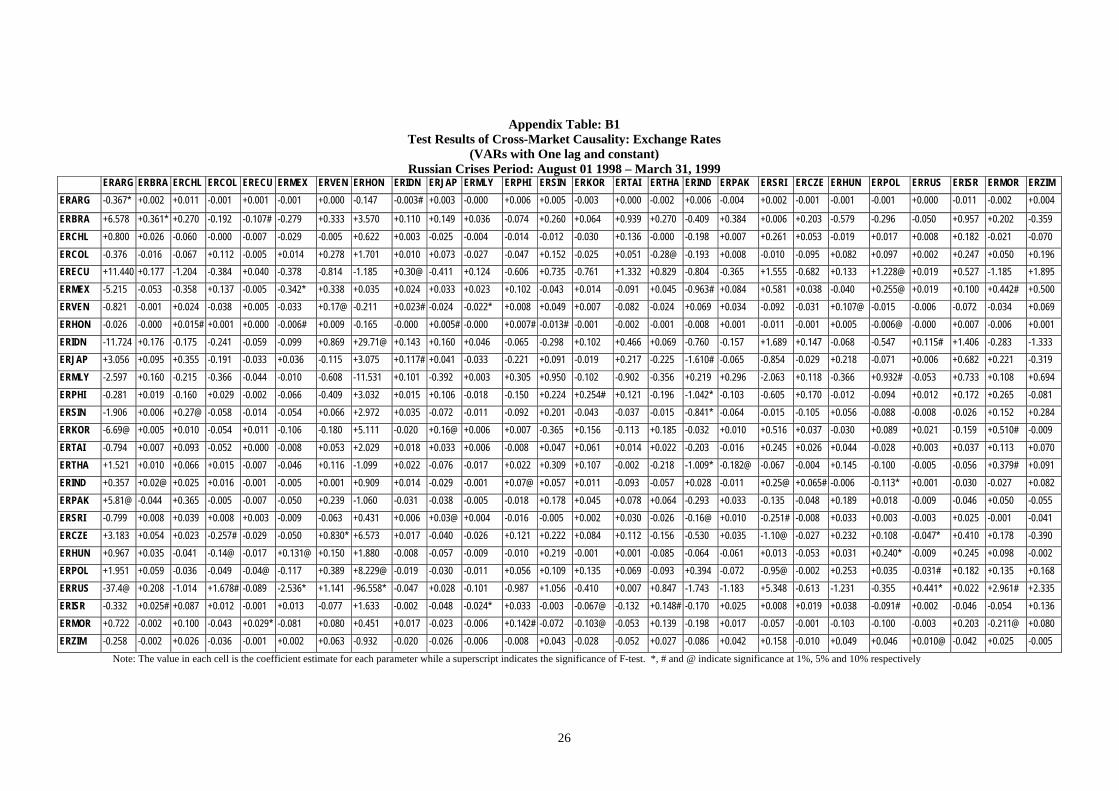
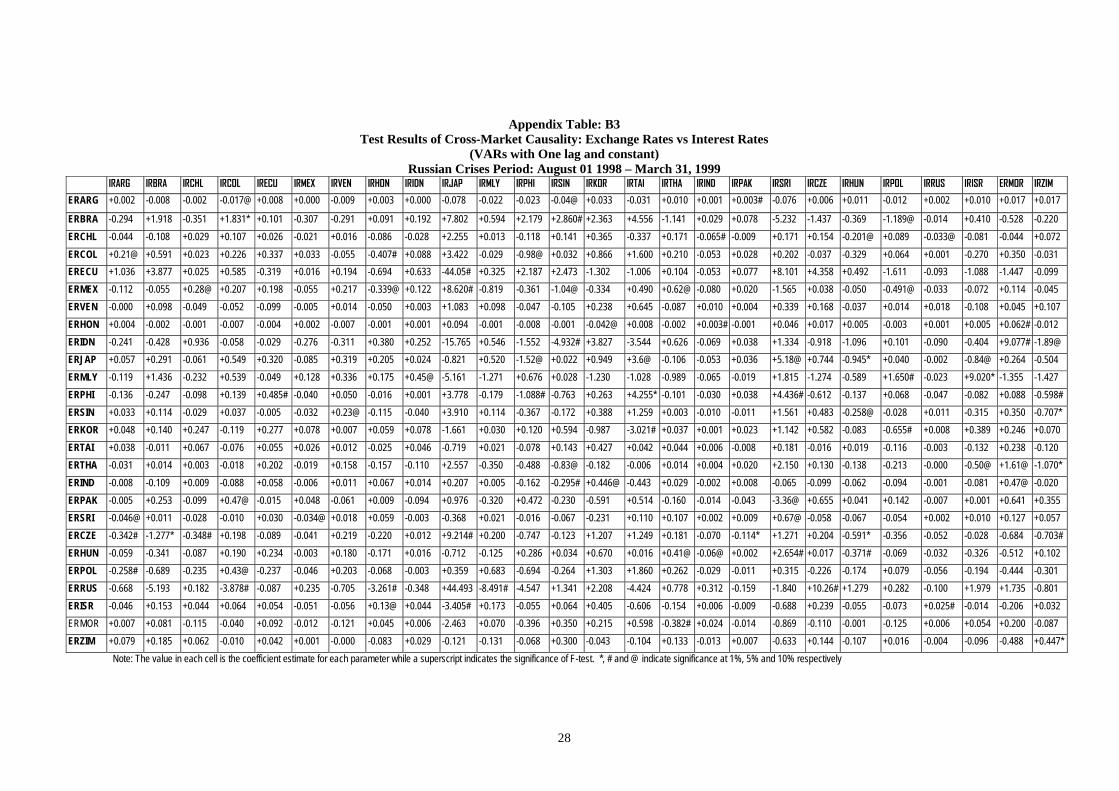
to space constraint, we have only reported the summarized results in this paper in Table 3. The
detailed results are included as Appendix Table B1-B9.
The results show that within exchange rate markets, changes in Russian rouble has major
impact in a couple of Eastern-European markets only. Specifically, Russian currency cause
changes in currencies in Czech Republic and Poland. However, the empirical tests suggest that
changes in Russian rouble did cause changes in stock markets in Brazil and Malaysia and money
market in Thailand. The results on stock market linkages are rather much stronger. The results in
column 6 of Table 3 the changes in Russian stock market create movement in stock markets in
Columbia, Indonesia, Japan, Thailand and Czech republic. We also find evidence of a causal
relationship between Russian stock market and currency market in Czech Republic and Poland as
well as Russian stock market and money market in Valenzuela, Israel and Zimbabwe. The
empirical estimates of this paper do not support strong links between money market in Russia and
14
the three markets in the sample countries. The only evidence of a money market linkage is between
interest rates in Russian and South Korea. Interest rate changes in Russian also influence stocks in
Ecuador and exchange rates in Israel.
Another interesting finding revealed through these results is the feedback effect. For
example, the results in column 1 of Table 3 show that Russian rouble cause changes in currencies
in Czech Republic and Poland. It is interesting to note that Polish currency influences changes in
Malaysian ringgit and Indian rupee while Czech currency causes changes in Indian rupee.
Similarly we find that changes in stock market in Russia cause changes in stock market in
Columbia (column 6) which then influences changes in currency markets in Malaysia and the
Philippines (column 5). It is also evident from row 23 (RUS) of Table 3 that all three Russian
markets are influenced by changes in market in Latin American countries (Argentina, Brazil, Chile,
Columbia, and Mexico), Asian countries (Hong Kong, Malaysia, and India), and other regions
(Morocco, Hungry, and Czech Republic). There are very clear evidences of the fact that contagion
should be looked in a global perspective and any spill over effects should be studied across markets
and across countries. These are important findings of this paper.
Impulse Responses
The above causality tests results, in general, do support that the spillover effects of turmoil in
Russian financial market during August 1990 were felt in markets in Asia and Europe. In this
section, we again test the global impact of Russian crisis using impulse response. To achieve this,
we introduce a shock in each of the Russian financial market (currency, stock or money market)
and see its impact within Eastern Europe region and across regions. Since, large part of our sample
covers East Asian countries, for analytical purposes, we spilt the sample into two regions; East Asia
(EA) and non-East Asia (NEA), which includes countries in Latin American region and all
11 ADF and PP tests on level series suggest the presence of unit roots in all series. For brevity, these results are not
reported in this paper. It is available from authors upon request.
15
remaining countries from South Asia, Middle-East, Africa and Eastern Europe. First, we introduce
a 1 percent shock to Russian rouble and observe its impact on currency, stock and money markets
in EA and NEA regions.12 The results are reported in Figures 1-3.13 First we introduce a shock to
Russian rouble and examine the impact on all three markets in NEA and EA countries. This is
provided in Figure 1 (a-f). Here we have two interesting observations. First, a disturbance in
Russian rouble did not have any significant impact on currency market in NEA regions (Figure 1a).
This is consistent with the results of Granger causality tests discussed earlier in this section.
Second, though, the shock to Russian rouble does create some jitters in currency markets in EA
region and takes about 10 days to disappear (see Figure 1(b)), the magnitude of these impacts is
extremely small.14 Figures 1(c) and 1(d) show the impact of a shock to Mexican peso in stock
market. Here we observe that stock markets in NEA region show substantial movements but are
short lived and the markets settle within 5 days. Stock markets in Brazil and Mexico show major
losses within a day of rouble’s collapse. EA stock markets are also disturbed with a shock to
Russian rouble and takes longer time to settle (about 10 days). Stock market in Malaysia seems to
feel the major impact of this. Finally, we look into money market and Figures 1(e) and 1(f) show
that both NEA and EA markets were disturbed with a shock to Russian rouble. However, these
disturbances disappear within 5 days in NEA region while money market in EA region takes about
10 days to settle, Singapore, Indonesia, Hong Kong and the Philippines being the major target of
these disturbances.
12 We basically introduce a one unit shock to Russian rouble. Since the data is used in the first-difference log of exchange rate for each country, this one unit shock can be interpreted as a depreciation of Russian currency by 1%. 13 It is important to note that Granger causality test examines overall significance of causal relation among the variables for given optimal lag structure. However, it does not explain the duration (time-length) and degree of impact a shock in one variable on other variables. The impulse responses overcome these problems. Interestingly, even if the Granger causality results do not support a significant causal relationship among the regional markets, impulse responses can still identify the impact of a shock to Russian markets on other markets (even though the magnitude could be very small). Moreover, by splitting the impulse responses for EA and NEA countries, we could identify how severely EA counties were hit by a shock in the Russian markets.

16
INSERT FIGURE 1 AROUND HERE
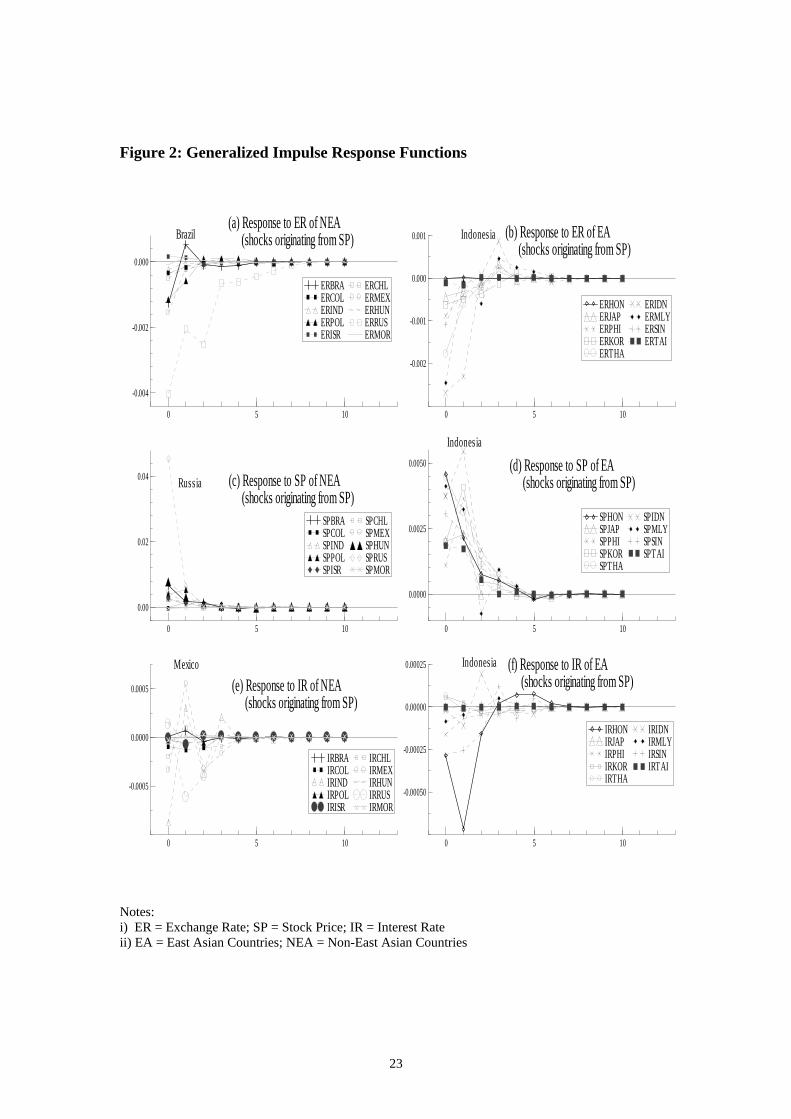
Figure 2 (a-f) demonstrates the impact of introducing a shock to stock market in Russia.
Figure 2(a-b) shows the impact of a shock to Russian stock market in currency market in EA and
NEA regions. We found a very strong link between the currency and stock market in Russia.
Poland and Brazil are the only NEA countries where currency markets show some disturbance as a
result of a shock to the Russian stock market with markets settling in within 5 days. On the
contrary, most of the markets in EA region get a major upset. These include Indonesia, Malaysia
and Thailand. These markets also take a longer time (about 8 days) to settle. The impact of stock
market shock within NEA and EA stock market is observed is Figures 2(c-d). We do not find any
evidence of a disturbance within stock markets of NEA region. However, all of the stock markets
in EA region get a major beating as a result of a disturbance in the Russian stock market. Finally,
Figure 2(e-f) shows that shocks in Russian stock markets do increase movements in money markets
in both the NEA and the EA regions and takes about 8 days to settle.
INSERT FIGURE 2 AROUND HERE
Figure 3 depicts the impact of a shock to interest rates in Russia in NEA and EA regions.
The evidence does suggest that the currency markets in both EA and NEA regions are affected by
this shock and takes about 10 days to disappear. Similarly, a shock to money market in Russia
leaves a major upset in the stock markets in NEA and EA regions with Brazil, Poland, Hungary and
South Korea being the major target. The same shock, however, does not have any influence on the
money market with NEA region. The money markets in Indonesia and Hong Kong are disturbed
but settle within 4 days.
INSERT FIGURE 3 AROUND HERE
14 Since exchange rate for each country is measured against US$, an upward movement implies a depreciation of the
currency. Similarly, currency depreciation has a negative impact on stock market and can be seen as a downward

17
In general, the results if the impulse response analysis are consistent with the causality test results
and do confirm that the spillover effects of the collapse of Russian rouble were not only restricted
within the region and within currency market but were felt in other market and other regional
countries especially, most of the East Asian countries.15
6. Conclusions:
This study investigates the spread of contagion in global financial markets during the 1998 Russian
crisis. We made an attempt to identify the patterns of linkages among regional and global foreign
exchange markets, stock markets and money markets using national currencies, stock prices and
interest rates and an indicator of each of these markets. We used high frequency data (daily
observations) and a variety of econometric test procedures including Granger causality and impulse
responses.
The analysis tends to indicate that the currency and stock markets are strongly linked within
and across regions. The evidence for interest rates are, however, not very strong. This may due to
data limitation on interest rates and the fact interest rates are still regulated in most of the
developing countries. The evidence from impulse response analysis suggests that impact of shocks
in Russian markets will take about 4-9 days to die down in the regional as well as global markets.
These results, therefore, highlight an interesting feature in this area of research where previous
efforts were restricted only to investigate regional linkages or contagion. The study provides an
insight into the linkages that may be observed and are supported empirically across regions. These
finding will help- policy makers to design appropriate policies in case an adverse shock is observed
in a linked market.
movement in stock market. Finally, currency depreciation is expected to put upward pressure on the interest rates.
15 These findings are consistent with IMF (1999).
18
References
Ahluwalia, Pavan (2000), Discriminating contagion: an alternative explanation of contagious currency crises in emerging markets, IMF Working Paper no. WP/00/14, International Monetary Fund, Washington, DC, February.
Ariff, Mohamed and Ahmed M. Khalid (2005), Liberalization and growth in Asia: 21st century chanllenges, Edward Elgar Publishing Company, U.K., June 2005, 399 p. Arkhipov, S., S. Drobyshevskii, S. Batkibekov and I. Trunin (1999), The crisis of the financial system
in Russia: principal factors and economic policy, translated from Russian to English by M.E.Sharpe, Problems of Economic Transition, vol 41, no. 10, February, 7-44.
Baig, Taimur and Ilan Goldfijn(1998), Financial market contagion in the Asian crisis, IMF Working
Paper no. WP/98/155, International Monetary Fund, Washington, DC, November. Barrell, Ray, et.al. (1998), Financial market contagion and the crises in East Asia, Russia and Latin
America, National Institute Economic Review, U.K., # 166, 57-69. Buchs, Thierry D. (1999), Financial crisis in the Russian Federation: Are the Russians learning to
tango?, Economics of Transition, volume 7 (3), 687-715. Calvo, Sara and Carmen Reinhart (1995), Capital inflows to Latin America: Is there evidence of
contagion effects, unpublished manuscript, World Bank and International Monetary Fund. Cerra, Valerie and Sweta Chaman Saxena (2000), Contagion, moonsoons, and domestic turmoil in
Indonesia: A case study in the Asian currency crisis, IMF Working Paper no. WP/00/60, International Monetary Fund, Washington, DC.
Datastream, Database. Eichengreen, Barry, Andrew Rose and Charles Wyplosz (1996), Contagious currency crisis, Scandinavian Economic review, 98, 4, 463-84. Fratzcher, Marcel (1998), Why are currency crises contagious? A comparison of the Latin American
crisis of 1994-95 and the Asian crisis of 1997-98, Welwirtschaftliches Archiv/Review of World Economics, v134, n4, 664-91.
Glick, Reuven and Andrew Rose (1999), Contagion and trade: why are currency crisis regional,
Journal of International Money and Finance, V. 18, 603-17. International Monetary Fund, International Financial Statistics, CD-ROM. International Monetary Fund (1999), World Economic Outlook 1999, IMF, Washington D.C.,
October, 66-87. Khalid, Ahmed M and Gulasekaran Rajaguru (2006a), Financial Market Linkages and Spillover Effects
Evidence from Asia Using Multivariate GARCH, Paper presented at the 2006 Asian Finance Association conference held in Auckland, New Zealand, 10-12 July.
Khalid, Ahmed M. and Gulasekaran Rajaguru (2006b), Financial market linkages or Contagion: Investigating the global impact of the Asian crisis, Paper presented at staff seminar, LaTrobe University, Australia. Khalid, Ahmed M. and Masahiro Kawai (2003), Was financial market contagion the source of
economic crisis in Asia? Evidence using a multivariate VAR model, Journal of Asian Economics, 14(1), February, 133-159.
Chan, Leong Su and Bruce Felmingham (2003), The interdependence of share markets in the developed economies of East Asia, Pacific-Basin Finance Journal, 11, 219-37.

19
Masih, Abdul M.M. and Rumi Masih (1999), Are Asian stock fluctuations due mainly to intra-regional contagion effect? Evidence based on Asian emerging stock markets, Pacific-Basin Finance Journal, 7, 251-82.
Min, Hong-Ghi, Judith A. McDonald and Jaeyong Choung (2003), Dynamic capital mobility, capital- market risk, and contagion: evidence from seven Asian countries, Japan and the wolrd Economy, 15, 161-83. Obstfeld, Maurice (1986), Rational and self-fulfilling balance of payment crises, American Economic
Review, 76, 72-81. Perry, Guillermo E. and Daniel Lederman (1998), Financial vulnerability, spillover effects, and the
contagion: lessons from the Asian Crises for Latin America, Viewpoint, World Bank Latin American and Caribbean Studies, The World Bank, Washington, DC.
Pesaran, Hashem M and Yongcheol Shin (1997), Generalized Impulse Response Analysis in Linear
Multivariate Models, Department of Applied Economics, University of Cambridge. Rijckeghem, Caroline Van and Beatrice Weder (1999), Sources of contagion: Finance or Trade, IMF
Working Paper no. WP/99/146, International Monetary Fund, Washington, DC, October. Sachs, Jeffrey, Aaron Tornell, and Andres Velasco (1996), Financial crises in emerging markets: The
lessons from 1995, NBER Discussion paper 5576. Sander, Harold, and Stefanie Kleimeier (2003), Contagion and causality: an empirical investigation of four Asian crisis episodes, Journal International Financial Markets, Institutions and Money, 13, 171-86. Sims, Christopher A. (1980), Macroeconomics and reality, Econometrica, 48, 1, 1-48.

19
TABLE 1: Selected Economic and Financial Indicators: Eastern Europe
Countries/Period GDP Growth (%)
CA/GDP (%)
Fiscal Balance/GDP
(%)
Exchange Rate (Local $/US$)
FX/Imports (%)
FX/Short-term Debt (%)
Total Debt/Exports
(%)
Short-term debt/Total Debt
(%)
Change in stock price index
(%) Bulgaria
1997 -6.9 4.20 -3.1 1.68 41.98 284.09 185.20 7.83 ??? 1998 3.5 -2.06 1.4 1.76 55.30 1999 1.84
Czech Republic 1997 0.3 -6.17 -0.9 31.70 34.11 137.72 94.33 32.94 -13.08 1998 -2.3 -1.97 -1.6 32.28 41.45 -7.99 1999 34.57 -16.28
Hungary 1997 4.6 -11.50 -4.0 186.79 40.31 248.20 130.84 13.77 110.10 1998 5 -5.4 214.40 36.09 84.03 1999 237.15 38.34 -12.60
Romania 1997 -6.9 -6.11 -3.6 7,167.90 32.80 389.83 123.85 9.09 ??? 1998 -5.4 -6.95 -1.2 8,875.60 24.25 1999 15,333.00 25.83
Russia 1997 0.8 753.05 -7.0 5.78 17.34 130.32 161.85 6.86 202.56 1998 -4.6 -5.0 9.71 13.20 1.59 1999 24.62 20.68 -57.11
Yugoslavia 1997 7.4 -1.46 ??? 15.20 ??? ??? 637.96 27.2 ??? 1998 2.6 69.71 1999
Source: IMF-International Financial Statistics, CD-ROM.

20
TABLE 2 UNIT ROOT TESTS
Russian Crisis (August 01, 1998 – March 31, 1999) Exchange Rates Stock Prices Interest Rates First Differences First Differences First Differences Countries
ADF PP ADF PP ADF PP Argentina -20.22* -37.91* -12.12* -12.08* -13.81* -13.86*
Brazil -10.31* -10.64* -12.36* -12.35* -15.51* -16.19* Chile -12.65* -12.65* -10.08* -10.22* -13.00* -13.15* Colombia -11.41* -11.39* -9.67* -9.96* -13.42* -13.44* Ecuador -13.00* -13.01* -13.20* -13.20* -13.35* -13.35* Mexico -13.33* -13.34* -11.73* -11.71* -13.12* -13.12* Venezuela -9.27* -9.26* -10.54* -10.30* -15.51* -15.63* Hong Kong -17.75* -19.63* -12.03* -12.00* -12.65* -12.64* Indonesia -12.19* -12.19* -11.10* -11.16* -13.18* -13.18* Japan -11.36* -11.35* -13.50* -13.50* -10.77* -10.97* Malaysia -12.15* -12.15* -15.61* -15.63* -13.22* -13.22* Philippines -12.60* -12.59* -10.92* -10.83* -13.24 -13.25* Singapore -14.40* -14.52* -11.65* -11.61* -12.91* -12.91* South Korea -10.58* -10.57* -12.55* -12.57* -7.36* -7.34* Taiwan -10.62* -10.81* -12.97* -12.97* -13.67* -13.71* Thailand -12.71* -12.73* -11.93* -11.97* -14.75* -14.71* India -12.71* -12.70* -13.26* -13.26* -21.31* -27.38* Pakistan -14.28* -14.55* -12.15* -12.19* -13.69* -13.71* Sri Lanka -14.00* -13.98* -9.46* -9.46* -13.12* -13.13* Czech Rep. -11.52* -11.60* -12.34* -12.51* -13.06* -13.09* Hungary -13.09* -13.09* -12.33* -12.32* -15.25* -15.55* Morocco -14.30* -14.29* -11.06* -11.07* -13.23* -13.23* Poland -11.91* -11.84* -10.98* -10.96* -17.63* -18.51* Russia -8.65* -8.50* -11.30* -11.34* -11.77 -11.79* Israel -12.64* -12.64* -11.54* -11.59* -13.10* -13.10* Zimbabwe -12.63* -12.72* -10.21 -10.26* -13.27* -13.27* Note: *, **, *** indicate that the null of a unit root is rejected at 1%, 5% and 10% levels respectively.
21
TABLE 3 Summary Results of Causality Tests: Cross Market
Russian Crises Period: August 01 1998 to March 31 1999 CAUSE
EFFECT ER vs ER SP vs ER IR vs ER ER vs SP SP vs SP IR vs SP ER vs IR SP vs IR IR vs IR ARG ARG, IDN MOR IND - SIN ECU, HON, POL PAK - ZIM BRA BRA, ECU BRA, RUS - ECU, MEX, JAP, ARG, JAP, SIN, MLY, TAI COL, SIN SIN - POL POL CHL - POL - ARG, POL ARG VEN, PHI, PAK IND THA ARG COL - VEN, HON, POL CHL, VEN, PHI, THA, ZIM VEN, RUS JAP, ZIM HON - BRA THA ECU - VEN, SIN, THA, - KOR KOR, PAK, SRI THA JAP JAP, PAK, RUS VEN ZIM MEX IND, MOR - MEX, THA, HUN, ARG, MEX ARG JAP JAP MEX VEN ISR VEN IDN, MLY VEN THA VEN VEN, MLY JAP, PHI, RUS - MEX, TAI, ZIM CHL, KOR, THA HON CHL, MEX, JAP, HON, JAP, KOR HON, PHI, KOR, - MEX RUS IND, MOR PAK, CZE, POL ARG, VEN, MLY, PHI, SIN THA, SRI, HUN POL, MOR IDN - KOR - PHI CHL, VEN, HON, BRA, MEX, POL SIN, MOR VEN - KOR, RUS JAP IDN, IND - COL - CHL, RUS - - - JAP MLY POL COL, HON, PHI, HON COL, KOR CHL, MLY, SRI, COL, MLY, TAI, POL, ISR SIN, HUN, ZIM ZIM CZE, RUS ZIM HUM PHI KOR, IND COL, HON, KOR - COL MOR - ECU, PHI, TAI, - SRI SRI, ZIM SIN IND HON JAP PAK, HUN - - ZIM - PAK KOR MOR HUN CHL, SIN, CZE, - MEX, JAP, PHI, ECU TAI, POL ECU, THA, PAK, KOR, THA, RUS ZIM SIN, ZIM CZE, POL TAI - - RUS SIN MEX, TAI, RUS CHL, KOR, TAI, - CZE COL, VEN POL THA IND, MOR HON, KOR - - - - ZIM ECU KOR IND CZE, POL MOR - HUN JAP CHL, HUN SIN ARG, SRI VEN, IND, HUN PAK - KOR VEN, MLY, CZE - PHI, TAI - - ECU, MLY, SRI - SRI SRI PHI ARG BRA, ZIM SRI, MOR BRA - TAI, HUN, ISR, - ZIM CZE COL, VEN, RUS CZE, HUN KOR, THA, CZE PAK, RUS RUS ECU, SIN ARG, BRA, CHL, MLY, KOR - JAP, PAK, HUN, HUN POL CHL MLY, TAI, THA KOR, THA MEX IDN SRI VEN, HON MEX, HUN POL RUS CHL, CZE , MLY, IND, POL IND, RUS ARG - - ZIM ARG, VEN, JAP POL RUS COL, MEX, HON HUN - BRA, MLY, HUN, CHL, IND, RUS ARG COL, HON, MLY, - - RUS, MOR MOR CZE ISR BRA, MLY, THA COL ARG, BRA, SRI, PHI KOR BRA, RUS RUS - HON, KOR, MOR ZIM MOR ECU, PHI CHL MEX, IDN, KOR, - SRI BRA, HUN THA - IND THA, IND ZIM - TAI ARG, IDN, CZE, THA IDN, SIN, MOR RUS ZIM - BRA, HON, CZE HUN, ZIM Note: At least 5% significance based on F-test.

22
Figure 1: Generalized Impulse Response Functions
0 5 10
0.00
0.01
0.02
0.03
(a) Response to ER of NEA (shocks originating from ER)
Russia
ERBRA ERCOL ERIND ERPOL ERISR
ERCHL ERMEX ERHUN ERRUS ERMOR
0 5 10
0.000
0.001
0.002
(b) Response to ER of EA (shocks originating from ER)
Indonesia
ERHON ERJAP ERPHI ERKOR ERTHA
ERIDN ERMLY ERSIN ERTAI
0 5 10
-0.0050
-0.0025
0.0000
(c) Response to SP of NEA (shocks originating from ER)
Russia
Russia
SPBRA SPCOL SPIND SPPOL SPISR
SPCHL SPMEX SPHUN SPRUS SPMOR
0 5 10
-0.0025
0.0000
0.0025 (d) Response to SP of EA (shocks originating from ER)
Malaysia
SPHON SPJAP SPPHI SPKOR SPTHA
SPIDN SPMLY SPSIN SPTAI
0 5 10
-0.0010
-0.0005
0.0000
0.0005 (e) Response to IR of NEA (shocks originating from ER)
IRBRA IRCOL IRIND IRPOL IRISR
IRCHL IRMEX IRHUN IRRUS IRMOR
0 5 10
-0.00025
0.00000
0.00025 (f) Response to IR of EA (shocks originating from ER)
Singapore
IRHON IRJAP IRPHI IRKOR IRTHA
IRIDN IRMLY IRSIN IRTAI
Notes: i) ER = Exchange Rate; SP = Stock Price; IR = Interest Rate ii) EA = East Asian Countries; NEA = Non-East Asian Countries
23
Figure 2: Generalized Impulse Response Functions
0 5 10
-0.004
-0.002
0.000
(a) Response to ER of NEA (shocks originating from SP)Brazil
ERBRA ERCOL ERIND ERPOL ERISR
ERCHL ERMEX ERHUN ERRUS ERMOR
0 5 10
-0.002
-0.001
0.000
0.001 (b) Response to ER of EA (shocks originating from SP)
Indonesia
ERHON ERJAP ERPHI ERKOR ERTHA
ERIDN ERMLY ERSIN ERTAI
0 5 10
0.00
0.02
0.04 (c) Response to SP of NEA (shocks originating from SP)
Russia
SPBRA SPCOL SPIND SPPOL SPISR
SPCHL SPMEX SPHUN SPRUS SPMOR
0 5 10
0.0000
0.0025
0.0050 (d) Response to SP of EA (shocks originating from SP)
Indonesia
SPHON SPJAP SPPHI SPKOR SPTHA
SPIDN SPMLY SPSIN SPTAI
0 5 10
-0.0005
0.0000
0.0005 (e) Response to IR of NEA (shocks originating from SP)
Mexico
IRBRA IRCOL IRIND IRPOL IRISR
IRCHL IRMEX IRHUN IRRUS IRMOR
0 5 10
-0.00050
-0.00025
0.00000
0.00025 (f) Response to IR of EA (shocks originating from SP)
Indonesia
IRHON IRJAP IRPHI IRKOR IRTHA
IRIDN IRMLY IRSIN IRTAI
Notes: i) ER = Exchange Rate; SP = Stock Price; IR = Interest Rate ii) EA = East Asian Countries; NEA = Non-East Asian Countries

24
Figure 3: Generalized Impulse Response Functions
0 5 10
-0.0010
-0.0005
0.0000
0.0005 (a) Response of ER to NEA (shocks originating from IR)
PolandBrazil
ERBRA ERCOL ERIND ERPOL ERISR
ERCHL ERMEX ERHUN ERRUS ERMOR
0 5 10
-0.0005
0.0000
0.0005
0.0010 (b) Response of ER to EA (shocks originating from IR)
Thailand
Indonesia
ERHON ERJAP ERPHI ERKOR ERTHA
ERIDN ERMLY ERSIN ERTAI
0 5 10
-0.002
-0.001
0.000
0.001
0.002
(c) Response of SP to NEA (shocks originating from IR)
Brazil
SPBRA SPCOL SPIND SPPOL SPISR
SPCHL SPMEX SPHUN SPRUS SPMOR
0 5 10
-0.001
0.000
0.001
0.002
(d) Response of SP to EA (shocks originating from IR)
Korea
SPHON SPJAP SPPHI SPKOR SPTHA
SPIDN SPMLY SPSIN SPTAI
0 5 10
0.00
0.01
0.02 (e) Response of IR to NEA (shocks originating from IR)
Russia
IRBRA IRCOL IRIND IRPOL IRISR
IRCHL IRMEX IRHUN IRRUS IRMOR
0 5 10
-0.0005
0.0000
(f) Response of IR to EA (shocks originating from IR)
Indonesia
IRHON IRJAP IRPHI IRKOR IRTHA
IRIDN IRMLY IRSIN IRTAI
Notes: i) ER = Exchange Rate; SP = Stock Price; IR = Interest Rate ii) EA = East Asian Countries; NEA = Non-East Asian Countries

25
Appendix Table A1: Data Descriptions
INTEREST RATES
Interbank/Other ASIA
China na Hong Kong 3m Interbank: 1/1/92-
12/31/99 Indonesia 90 Day Deposit: 1/1/92-
12/31/99 Japan 3m Interbank: 1/1/92-
12/31/99 Malaysia 3m Interbank: 8/10/93-
12/31/99 Philippines 3m Tbill: 1/92-12/31/99 Singapore 3m Interbank: 1/1/92-
12/31/99 South Korea 90day CD: 1/3/92-12/31/99 Taiwan 90 Day Deposit: 1/6/92-
12/31/99 Thailand 3m Interbank: 1/7/92-
12/31/99 SOUTH ASIA India 90 Day Deposit: 1/1/92-
12/31/99 Pakistan Repo 7day: 2/18/92-12/31/99 Sri Lanka 3m Tbill: 10/7/94-12/31/99 LATIN AMERICA Argentina 90day deposit: 1/1/92-
12/31/99 Brazil Savings a/c: 10/10/94-
12/31/99 Chile 90day CD: 1/3/94-12/31/99 Colombia Fixed Term Dep: 1/1/92-
12/31/99 Ecuador Av. Bank Lending: 1/25/93-
12/31/99 Mexico 90day CP: 1/20/93-12/31/99 Peru na Venezuela Repo: 6/19/92-12/31/99 EASTERN EUROPE & NIS
Czech Republic 3m Interbank: 4/22/92-12/31/99
Hungary 3m Interbank: 9/7/95-12/31/99
Poland 3m Interbank: 6/4/93-12/31/99
Russia 3m Interbank: 9/1/94-12/31/99
Yugoslavia na
E. AFRICA & MIDDLE EAST Egypt na Israel 3m Tbill: 5/30/95-12/31/99 Kenya 3m Tbill: 1/31/95-12/31/-99 EASTERN EUROPE & NIS
Czech Republic 3m Interbank: 4/22/92-12/31/99
Hungary 3m Interbank: 9/7/95-12/31/99
Poland 3m Interbank: 6/4/93-12/31/99
Russia 3m Interbank: 9/1/94-12/31/99
Yugoslavia na E. AFRICA & MIDDLE EAST Egypt na Israel 3m Tbill: 5/30/95-12/31/99 Kenya 3m Tbill: 1/31/95-12/31/-99
26
Appendix Table: B1 Test Results of Cross-Market Causality: Exchange Rates
(VARs with One lag and constant) Russian Crises Period: August 01 1998 – March 31, 1999
ERARG ERBRA ERCHL ERCOL ERECU ERMEX ERVEN ERHON ERIDN ERJAP ERMLY ERPHI ERSIN ERKOR ERTAI ERTHA ERIND ERPAK ERSRI ERCZE ERHUN ERPOL ERRUS ERISR ERMOR ERZIM ERARG -0.367* +0.002 +0.011 -0.001 +0.001 -0.001 +0.000 -0.147 -0.003# +0.003 -0.000 +0.006 +0.005 -0.003 +0.000 -0.002 +0.006 -0.004 +0.002 -0.001 -0.001 -0.001 +0.000 -0.011 -0.002 +0.004
ERBRA +6.578 +0.361* +0.270 -0.192 -0.107# -0.279 +0.333 +3.570 +0.110 +0.149 +0.036 -0.074 +0.260 +0.064 +0.939 +0.270 -0.409 +0.384 +0.006 +0.203 -0.579 -0.296 -0.050 +0.957 +0.202 -0.359 ERCHL +0.800 +0.026 -0.060 -0.000 -0.007 -0.029 -0.005 +0.622 +0.003 -0.025 -0.004 -0.014 -0.012 -0.030 +0.136 -0.000 -0.198 +0.007 +0.261 +0.053 -0.019 +0.017 +0.008 +0.182 -0.021 -0.070 ERCOL -0.376 -0.016 -0.067 +0.112 -0.005 +0.014 +0.278 +1.701 +0.010 +0.073 -0.027 -0.047 +0.152 -0.025 +0.051 -0.28@ -0.193 +0.008 -0.010 -0.095 +0.082 +0.097 +0.002 +0.247 +0.050 +0.196 ERECU +11.440 +0.177 -1.204 -0.384 +0.040 -0.378 -0.814 -1.185 +0.30@ -0.411 +0.124 -0.606 +0.735 -0.761 +1.332 +0.829 -0.804 -0.365 +1.555 -0.682 +0.133 +1.228@ +0.019 +0.527 -1.185 +1.895 ERMEX -5.215 -0.053 -0.358 +0.137 -0.005 -0.342* +0.338 +0.035 +0.024 +0.033 +0.023 +0.102 -0.043 +0.014 -0.091 +0.045 -0.963# +0.084 +0.581 +0.038 -0.040 +0.255@ +0.019 +0.100 +0.442# +0.500 ERVEN -0.821 -0.001 +0.024 -0.038 +0.005 -0.033 +0.17@ -0.211 +0.023# -0.024 -0.022* +0.008 +0.049 +0.007 -0.082 -0.024 +0.069 +0.034 -0.092 -0.031 +0.107@ -0.015 -0.006 -0.072 -0.034 +0.069 ERHON -0.026 -0.000 +0.015# +0.001 +0.000 -0.006# +0.009 -0.165 -0.000 +0.005# -0.000 +0.007# -0.013# -0.001 -0.002 -0.001 -0.008 +0.001 -0.011 -0.001 +0.005 -0.006@ -0.000 +0.007 -0.006 +0.001 ERIDN -11.724 +0.176 -0.175 -0.241 -0.059 -0.099 +0.869 +29.71@ +0.143 +0.160 +0.046 -0.065 -0.298 +0.102 +0.466 +0.069 -0.760 -0.157 +1.689 +0.147 -0.068 -0.547 +0.115# +1.406 -0.283 -1.333 ERJAP +3.056 +0.095 +0.355 -0.191 -0.033 +0.036 -0.115 +3.075 +0.117# +0.041 -0.033 -0.221 +0.091 -0.019 +0.217 -0.225 -1.610# -0.065 -0.854 -0.029 +0.218 -0.071 +0.006 +0.682 +0.221 -0.319 ERMLY -2.597 +0.160 -0.215 -0.366 -0.044 -0.010 -0.608 -11.531 +0.101 -0.392 +0.003 +0.305 +0.950 -0.102 -0.902 -0.356 +0.219 +0.296 -2.063 +0.118 -0.366 +0.932# -0.053 +0.733 +0.108 +0.694 ERPHI -0.281 +0.019 -0.160 +0.029 -0.002 -0.066 -0.409 +3.032 +0.015 +0.106 -0.018 -0.150 +0.224 +0.254# +0.121 -0.196 -1.042* -0.103 -0.605 +0.170 -0.012 -0.094 +0.012 +0.172 +0.265 -0.081 ERSIN -1.906 +0.006 +0.27@ -0.058 -0.014 -0.054 +0.066 +2.972 +0.035 -0.072 -0.011 -0.092 +0.201 -0.043 -0.037 -0.015 -0.841* -0.064 -0.015 -0.105 +0.056 -0.088 -0.008 -0.026 +0.152 +0.284 ERKOR -6.69@ +0.005 +0.010 -0.054 +0.011 -0.106 -0.180 +5.111 -0.020 +0.16@ +0.006 +0.007 -0.365 +0.156 -0.113 +0.185 -0.032 +0.010 +0.516 +0.037 -0.030 +0.089 +0.021 -0.159 +0.510# -0.009 ERTAI -0.794 +0.007 +0.093 -0.052 +0.000 -0.008 +0.053 +2.029 +0.018 +0.033 +0.006 -0.008 +0.047 +0.061 +0.014 +0.022 -0.203 -0.016 +0.245 +0.026 +0.044 -0.028 +0.003 +0.037 +0.113 +0.070 ERTHA +1.521 +0.010 +0.066 +0.015 -0.007 -0.046 +0.116 -1.099 +0.022 -0.076 -0.017 +0.022 +0.309 +0.107 -0.002 -0.218 -1.009* -0.182@ -0.067 -0.004 +0.145 -0.100 -0.005 -0.056 +0.379# +0.091 ERIND +0.357 +0.02@ +0.025 +0.016 -0.001 -0.005 +0.001 +0.909 +0.014 -0.029 -0.001 +0.07@ +0.057 +0.011 -0.093 -0.057 +0.028 -0.011 +0.25@ +0.065# -0.006 -0.113* +0.001 -0.030 -0.027 +0.082 ERPAK +5.81@ -0.044 +0.365 -0.005 -0.007 -0.050 +0.239 -1.060 -0.031 -0.038 -0.005 -0.018 +0.178 +0.045 +0.078 +0.064 -0.293 +0.033 -0.135 -0.048 +0.189 +0.018 -0.009 -0.046 +0.050 -0.055 ERSRI -0.799 +0.008 +0.039 +0.008 +0.003 -0.009 -0.063 +0.431 +0.006 +0.03@ +0.004 -0.016 -0.005 +0.002 +0.030 -0.026 -0.16@ +0.010 -0.251# -0.008 +0.033 +0.003 -0.003 +0.025 -0.001 -0.041 ERCZE +3.183 +0.054 +0.023 -0.257# -0.029 -0.050 +0.830* +6.573 +0.017 -0.040 -0.026 +0.121 +0.222 +0.084 +0.112 -0.156 -0.530 +0.035 -1.10@ -0.027 +0.232 +0.108 -0.047* +0.410 +0.178 -0.390 ERHUN +0.967 +0.035 -0.041 -0.14@ -0.017 +0.131@ +0.150 +1.880 -0.008 -0.057 -0.009 -0.010 +0.219 -0.001 +0.001 -0.085 -0.064 -0.061 +0.013 -0.053 +0.031 +0.240* -0.009 +0.245 +0.098 -0.002 ERPOL +1.951 +0.059 -0.036 -0.049 -0.04@ -0.117 +0.389 +8.229@ -0.019 -0.030 -0.011 +0.056 +0.109 +0.135 +0.069 -0.093 +0.394 -0.072 -0.95@ -0.002 +0.253 +0.035 -0.031# +0.182 +0.135 +0.168 ERRUS -37.4@ +0.208 -1.014 +1.678# -0.089 -2.536* +1.141 -96.558* -0.047 +0.028 -0.101 -0.987 +1.056 -0.410 +0.007 +0.847 -1.743 -1.183 +5.348 -0.613 -1.231 -0.355 +0.441* +0.022 +2.961# +2.335 ERISR -0.332 +0.025# +0.087 +0.012 -0.001 +0.013 -0.077 +1.633 -0.002 -0.048 -0.024* +0.033 -0.003 -0.067@ -0.132 +0.148# -0.170 +0.025 +0.008 +0.019 +0.038 -0.091# +0.002 -0.046 -0.054 +0.136 ERMOR +0.722 -0.002 +0.100 -0.043 +0.029* -0.081 +0.080 +0.451 +0.017 -0.023 -0.006 +0.142# -0.072 -0.103@ -0.053 +0.139 -0.198 +0.017 -0.057 -0.001 -0.103 -0.100 -0.003 +0.203 -0.211@ +0.080 ERZIM -0.258 -0.002 +0.026 -0.036 -0.001 +0.002 +0.063 -0.932 -0.020 -0.026 -0.006 -0.008 +0.043 -0.028 -0.052 +0.027 -0.086 +0.042 +0.158 -0.010 +0.049 +0.046 +0.010@ -0.042 +0.025 -0.005
Note: The value in each cell is the coefficient estimate for each parameter while a superscript indicates the significance of F-test. *, # and @ indicate significance at 1%, 5% and 10% respectively

27
Appendix Table: B2 Test Results of Cross-Market Causality: Exchange Rates vs Stock Prices
(VARs with One lag and constant) Russian Crises Period: August 01 1998 – March 31, 1999
SPARG SPBRA SPCHL SPCOL SPECU SPMEX SPVEN SPHON SPIDN SPJAP SPMLY SPPHI SPSIN SPKOR SPTAI SPTHA SPIND SPPAK SPSRI SPCZE SPHUN SPPOL SPRUS SPISR ERMOR SPZIM
ERARG +0.001 -0.001 +0.001 -0.000 -0.003@ -0.001 +0.001 -0.000 -0.001@ +0.000 -0.001 -0.002 +0.002 -0.000 +0.000 +0.000 -0.000 -0.001 +0.001 +0.000 -0.001 +0.001 -0.000 +0.002 -0.001 -0.000
ERBRA +0.086 -0.102 -0.246 -0.170@ +0.287# +0.250# -0.014 +0.054 +0.012 +0.379* -0.037 +0.101 -0.105 +0.020 +0.059 +0.101 +0.067 -0.001 -0.096 +0.047 +0.139@ -0.356* -0.016 -0.248 -0.216 -0.186 ERCHL -0.058# +0.025 +0.026 -0.004 +0.013 -0.018 +0.006 +0.010 +0.010 -0.007 -0.011 -0.020 +0.006 +0.007 +0.017 +0.02@ +0.006 +0.010 -0.016 -0.000 +0.011 -0.033# -0.003 +0.015 -0.018 -0.026 ERCOL +0.08@ -0.011 -0.071 -0.051 -0.005 -0.025 -0.021 -0.042 -0.006 +0.028 -0.029 -0.004 +0.033 -0.040 -0.056 +0.057# +0.004 +0.042@ -0.010 +0.020 +0.024 -0.029 -0.006 -0.058 -0.161 -0.123# ERECU +0.389 -0.020 -0.269 +0.121 +0.109 -0.284 -0.022 -0.101 +0.050 -0.081 +0.011 +0.344 -0.154 -0.304# +0.178 -0.031 +0.341 -0.125 -0.024 +0.262 -0.133 +0.027 +0.053 +0.249 +1.090 -0.288 ERMEX -0.146* +0.017 -0.084 -0.008 -0.014 -0.103# +0.04@ +0.014 -0.009 +0.046 -0.020 +0.045 +0.025 -0.007 -0.036 +0.041 +0.024 +0.035 -0.016 -0.002 +0.018 -0.042 +0.001 +0.069 +0.119 -0.038 ERVEN +0.001 +0.003 -0.015 -0.008 -0.012 -0.001 -0.039* +0.007 +0.003 +0.006 +0.008 -0.013 +0.003 -0.018@ +0.012 -0.002 +0.007 +0.002 +0.015 +0.001 +0.004 +0.006 -0.002 +0.023 -0.013 -0.007 ERHON +0.002 -0.001@ -0.001 -0.002@ +0.001 -0.002@ +0.001 -0.001 -0.000 -0.000 +0.001 -0.000 +0.001 -0.001 +0.001 -0.000 +0.002 +0.000 +0.000 +0.002 +0.000 +0.000 -0.000 +0.001 +0.005 +0.002 ERIDN +0.35@ -0.120 -0.223 -0.127 +0.047 -0.044 +0.072 +0.000 +0.016 +0.149 +0.030 +0.355# -0.072 -0.002 -0.032 -0.095 +0.135 +0.125 -0.089 -0.012 -0.047 -0.119 -0.015 -0.280 -0.196 -0.248 ERJAP +0.13@ -0.055 +0.141 +0.028 +0.16@ +0.017 -0.060@ +0.033 +0.016 -0.001 -0.046 +0.069 -0.093 +0.000 +0.047 +0.015 +0.017 +0.054 +0.001 +0.073 -0.083 +0.019 -0.035@ +0.146 +0.112 -0.105 ERMLY +0.016 -0.067 +0.109 +0.266# +0.27@ -0.100 -0.001 +0.083 -0.014 -0.030 +0.043 +0.133 +0.083 -0.166# -0.088 -0.111 -0.065 -0.043 -0.183 -0.011 +0.061 +0.002 -0.008 +0.287 +0.111 -0.246 ERPHI +0.060 -0.033 -0.047 -0.077# -0.002 +0.004 -0.041@ -0.034 +0.011 +0.012 -0.019 -0.043 +0.005 +0.013 -0.021 +0.031 -0.010 +0.028 +0.040 +0.017 -0.023 -0.017 -0.002 -0.044 +0.101 -0.022 ERSIN +0.019 -0.006 +0.021 +0.001 +0.031 -0.021 -0.021 -0.011 -0.008 -0.005 -0.022 +0.017 +0.000 -0.022 +0.030 +0.000 -0.010 +0.042# -0.028 +0.047 -0.045# +0.021 -0.007 +0.08@ +0.16@ -0.030 ERKOR -0.058 -0.022 -0.020 -0.001 +0.064 +0.032 +0.005 +0.07@ -0.003 +0.005 -0.015 +0.073 -0.007 -0.004 -0.035 -0.048 +0.022 +0.028 +0.021 -0.055 -0.024 +0.030 +0.019 -0.030 +0.121 -0.020 ERTAI +0.023 -0.016 -0.010 +0.008 +0.025 +0.010 +0.002 -0.018 +0.007 +0.000 -0.004 +0.020 +0.041# +0.014 -0.03@ -0.010 -0.003 +0.000 -0.016 -0.006 -0.024@ +0.012 +0.009@ -0.018 +0.070 +0.009 ERTHA -0.012 -0.006 +0.023 -0.020 +0.034 -0.047 -0.012 -0.005 -0.002 -0.031 -0.023 +0.038 +0.023 -0.009 -0.031 -0.013 +0.001 +0.035 -0.004 +0.024 -0.051@ +0.018 +0.003 +0.043 +0.111 -0.010 ERIND +0.016 -0.013 -0.004 +0.001 +0.005 +0.001 +0.001 +0.008 +0.006 +0.005 -0.006 -0.009 +0.009 -0.012 -0.012 -0.003 -0.005 -0.004 +0.000 -0.010 -0.024* +0.010 -0.001 +0.03@ -0.043 -0.017 ERPAK -0.080@ +0.047 +0.11@ -0.034 -0.004 -0.054 +0.009 +0.06@ -0.035 -0.016 -0.007 -0.016 -0.006 -0.003 +0.008 +0.014 -0.017 +0.000 +0.010 +0.023 +0.004 -0.007 +0.011 -0.034 -0.095 +0.027 ERSRI +0.014 -0.015# +0.003 +0.002 +0.002 +0.012 +0.003 -0.008 +0.001 -0.014 +0.003 +0.006 +0.001 -0.002 +0.009 -0.006 -0.001 -0.003 +0.010 +0.012 +0.002 +0.003 +0.002 +0.003 +0.030 -0.028# ERCZE +0.062 -0.020 +0.019 -0.029 +0.079 -0.076 -0.004 -0.023 +0.035 +0.043 +0.013 +0.021 -0.036 -0.006 +0.022 +0.024 +0.041 +0.062# -0.060 -0.035 +0.026 +0.021 -0.031# +0.050 +0.003 -0.025 ERHUN +0.040 -0.032 +0.026 -0.001 +0.06@ -0.014 -0.004 +0.040 +0.018 -0.032 -0.023 -0.013 -0.018 -0.039# +0.005 +0.038# +0.004 +0.022 -0.015 -0.001 +0.011 -0.002 -0.004 +0.08@ +0.006 +0.036 ERPOL -0.004 -0.030 +0.014 -0.030 +0.014 -0.046 -0.015 +0.032 +0.015 +0.041 +0.015 +0.002 -0.033 -0.005 -0.016 +0.033 +0.088# +0.044@ -0.068 +0.012 +0.025 +0.036 -0.034# +0.011 +0.018 -0.09@ ERRUS +0.131 -0.562# +0.358 -0.354 +0.005 +0.088 +0.064 +0.235 -0.085 -0.265 -0.520* +0.025 +0.399 +0.065 +0.062 +0.043 -0.151 -0.142 +0.260 +0.231 -0.593* -0.056 -0.010 +0.175 +1.923# -0.085 ERISR +0.024 -0.014 +0.003 +0.002 -0.004 -0.007 +0.005 +0.000 -0.007 +0.028 +0.005 +0.043* -0.027 +0.001 +0.005 -0.007 -0.03@ +0.000 +0.001 +0.003 +0.014 -0.014 -0.003 +0.035 -0.008 -0.014 ERMOR +0.018 +0.004 -0.038 -0.020 -0.007 -0.014 -0.004 +0.000 +0.004 +0.014 +0.007 -0.011 -0.031 -0.003 -0.015 +0.006 -0.000 +0.003 +0.004 -0.000 +0.013 +0.000 -0.009 +0.038 -0.015 -0.027 ERZIM -0.020 +0.012 +0.035 +0.001 -0.009 -0.023 +0.001 +0.005 -0.007 -0.002 -0.016@ +0.007 -0.004 -0.004 +0.003 +0.021# -0.002 -0.012 +0.030 -0.013 +0.015 -0.020 +0.006 +0.010 -0.025 +0.000
Note: The value in each cell is the coefficient estimate for each parameter while a superscript indicates the significance of F-test. *, # and @ indicate significance at 1%, 5% and 10% respectively
28
Appendix Table: B3 Test Results of Cross-Market Causality: Exchange Rates vs Interest Rates
(VARs with One lag and constant) Russian Crises Period: August 01 1998 – March 31, 1999
IRARG IRBRA IRCHL IRCOL IRECU IRMEX IRVEN IRHON IRIDN IRJAP IRMLY IRPHI IRSIN IRKOR IRTAI IRTHA IRIND IRPAK IRSRI IRCZE IRHUN IRPOL IRRUS IRISR ERMOR IRZIM
ERARG +0.002 -0.008 -0.002 -0.017@ +0.008 +0.000 -0.009 +0.003 +0.000 -0.078 -0.022 -0.023 -0.04@ +0.033 -0.031 +0.010 +0.001 +0.003# -0.076 +0.006 +0.011 -0.012 +0.002 +0.010 +0.017 +0.017
ERBRA -0.294 +1.918 -0.351 +1.831* +0.101 -0.307 -0.291 +0.091 +0.192 +7.802 +0.594 +2.179 +2.860# +2.363 +4.556 -1.141 +0.029 +0.078 -5.232 -1.437 -0.369 -1.189@ -0.014 +0.410 -0.528 -0.220 ERCHL -0.044 -0.108 +0.029 +0.107 +0.026 -0.021 +0.016 -0.086 -0.028 +2.255 +0.013 -0.118 +0.141 +0.365 -0.337 +0.171 -0.065# -0.009 +0.171 +0.154 -0.201@ +0.089 -0.033@ -0.081 -0.044 +0.072 ERCOL +0.21@ +0.591 +0.023 +0.226 +0.337 +0.033 -0.055 -0.407# +0.088 +3.422 -0.029 -0.98@ +0.032 +0.866 +1.600 +0.210 -0.053 +0.028 +0.202 -0.037 -0.329 +0.064 +0.001 -0.270 +0.350 -0.031 ERECU +1.036 +3.877 +0.025 +0.585 -0.319 +0.016 +0.194 -0.694 +0.633 -44.05# +0.325 +2.187 +2.473 -1.302 -1.006 +0.104 -0.053 +0.077 +8.101 +4.358 +0.492 -1.611 -0.093 -1.088 -1.447 -0.099 ERMEX -0.112 -0.055 +0.28@ +0.207 +0.198 -0.055 +0.217 -0.339@ +0.122 +8.620# -0.819 -0.361 -1.04@ -0.334 +0.490 +0.62@ -0.080 +0.020 -1.565 +0.038 -0.050 -0.491@ -0.033 -0.072 +0.114 -0.045 ERVEN -0.000 +0.098 -0.049 -0.052 -0.099 -0.005 +0.014 -0.050 +0.003 +1.083 +0.098 -0.047 -0.105 +0.238 +0.645 -0.087 +0.010 +0.004 +0.339 +0.168 -0.037 +0.014 +0.018 -0.108 +0.045 +0.107 ERHON +0.004 -0.002 -0.001 -0.007 -0.004 +0.002 -0.007 -0.001 +0.001 +0.094 -0.001 -0.008 -0.001 -0.042@ +0.008 -0.002 +0.003# -0.001 +0.046 +0.017 +0.005 -0.003 +0.001 +0.005 +0.062# -0.012 ERIDN -0.241 -0.428 +0.936 -0.058 -0.029 -0.276 -0.311 +0.380 +0.252 -15.765 +0.546 -1.552 -4.932# +3.827 -3.544 +0.626 -0.069 +0.038 +1.334 -0.918 -1.096 +0.101 -0.090 -0.404 +9.077# -1.89@ ERJAP +0.057 +0.291 -0.061 +0.549 +0.320 -0.085 +0.319 +0.205 +0.024 -0.821 +0.520 -1.52@ +0.022 +0.949 +3.6@ -0.106 -0.053 +0.036 +5.18@ +0.744 -0.945* +0.040 -0.002 -0.84@ +0.264 -0.504 ERMLY -0.119 +1.436 -0.232 +0.539 -0.049 +0.128 +0.336 +0.175 +0.45@ -5.161 -1.271 +0.676 +0.028 -1.230 -1.028 -0.989 -0.065 -0.019 +1.815 -1.274 -0.589 +1.650# -0.023 +9.020* -1.355 -1.427 ERPHI -0.136 -0.247 -0.098 +0.139 +0.485# -0.040 +0.050 -0.016 +0.001 +3.778 -0.179 -1.088# -0.763 +0.263 +4.255* -0.101 -0.030 +0.038 +4.436# -0.612 -0.137 +0.068 -0.047 -0.082 +0.088 -0.598# ERSIN +0.033 +0.114 -0.029 +0.037 -0.005 -0.032 +0.23@ -0.115 -0.040 +3.910 +0.114 -0.367 -0.172 +0.388 +1.259 +0.003 -0.010 -0.011 +1.561 +0.483 -0.258@ -0.028 +0.011 -0.315 +0.350 -0.707* ERKOR +0.048 +0.140 +0.247 -0.119 +0.277 +0.078 +0.007 +0.059 +0.078 -1.661 +0.030 +0.120 +0.594 -0.987 -3.021# +0.037 +0.001 +0.023 +1.142 +0.582 -0.083 -0.655# +0.008 +0.389 +0.246 +0.070 ERTAI +0.038 -0.011 +0.067 -0.076 +0.055 +0.026 +0.012 -0.025 +0.046 -0.719 +0.021 -0.078 +0.143 +0.427 +0.042 +0.044 +0.006 -0.008 +0.181 -0.016 +0.019 -0.116 -0.003 -0.132 +0.238 -0.120 ERTHA -0.031 +0.014 +0.003 -0.018 +0.202 -0.019 +0.158 -0.157 -0.110 +2.557 -0.350 -0.488 -0.83@ -0.182 -0.006 +0.014 +0.004 +0.020 +2.150 +0.130 -0.138 -0.213 -0.000 -0.50@ +1.61@ -1.070* ERIND -0.008 -0.109 +0.009 -0.088 +0.058 -0.006 +0.011 +0.067 +0.014 +0.207 +0.005 -0.162 -0.295# +0.446@ -0.443 +0.029 -0.002 +0.008 -0.065 -0.099 -0.062 -0.094 -0.001 -0.081 +0.47@ -0.020 ERPAK -0.005 +0.253 -0.099 +0.47@ -0.015 +0.048 -0.061 +0.009 -0.094 +0.976 -0.320 +0.472 -0.230 -0.591 +0.514 -0.160 -0.014 -0.043 -3.36@ +0.655 +0.041 +0.142 -0.007 +0.001 +0.641 +0.355 ERSRI -0.046@ +0.011 -0.028 -0.010 +0.030 -0.034@ +0.018 +0.059 -0.003 -0.368 +0.021 -0.016 -0.067 -0.231 +0.110 +0.107 +0.002 +0.009 +0.67@ -0.058 -0.067 -0.054 +0.002 +0.010 +0.127 +0.057 ERCZE -0.342# -1.277* -0.348# +0.198 -0.089 -0.041 +0.219 -0.220 +0.012 +9.214# +0.200 -0.747 -0.123 +1.207 +1.249 +0.181 -0.070 -0.114* +1.271 +0.204 -0.591* -0.356 -0.052 -0.028 -0.684 -0.703# ERHUN -0.059 -0.341 -0.087 +0.190 +0.234 -0.003 +0.180 -0.171 +0.016 -0.712 -0.125 +0.286 +0.034 +0.670 +0.016 +0.41@ -0.06@ +0.002 +2.654# +0.017 -0.371# -0.069 -0.032 -0.326 -0.512 +0.102 ERPOL -0.258# -0.689 -0.235 +0.43@ -0.237 -0.046 +0.203 -0.068 -0.003 +0.359 +0.683 -0.694 -0.264 +1.303 +1.860 +0.262 -0.029 -0.011 +0.315 -0.226 -0.174 +0.079 -0.056 -0.194 -0.444 -0.301 ERRUS -0.668 -5.193 +0.182 -3.878# -0.087 +0.235 -0.705 -3.261# -0.348 +44.493 -8.491# -4.547 +1.341 +2.208 -4.424 +0.778 +0.312 -0.159 -1.840 +10.26# +1.279 +0.282 -0.100 +1.979 +1.735 -0.801 ERISR -0.046 +0.153 +0.044 +0.064 +0.054 -0.051 -0.056 +0.13@ +0.044 -3.405# +0.173 -0.055 +0.064 +0.405 -0.606 -0.154 +0.006 -0.009 -0.688 +0.239 -0.055 -0.073 +0.025# -0.014 -0.206 +0.032 ERMOR +0.007 +0.081 -0.115 -0.040 +0.092 -0.012 -0.121 +0.045 +0.006 -2.463 +0.070 -0.396 +0.350 +0.215 +0.598 -0.382# +0.024 -0.014 -0.869 -0.110 -0.001 -0.125 +0.006 +0.054 +0.200 -0.087 ERZIM +0.079 +0.185 +0.062 -0.010 +0.042 +0.001 -0.000 -0.083 +0.029 -0.121 -0.131 -0.068 +0.300 -0.043 -0.104 +0.133 -0.013 +0.007 -0.633 +0.144 -0.107 +0.016 -0.004 -0.096 -0.488 +0.447*
Note: The value in each cell is the coefficient estimate for each parameter while a superscript indicates the significance of F-test. *, # and @ indicate significance at 1%, 5% and 10% respectively

29
Appendix Table: B4 Test Results of Cross-Market Causality: Stock Prices vs Exchange Rates
(VARs with One lag and constant) Russian Crises Period: August 01 1998 – March 31, 1999
ERARG ERBRA ERCHL ERCOL ERECU ERMEX ERVEN ERHON ERIDN ERJAP ERMLY ERPHI ERSIN ERKOR ERTAI ERTHA ERIND ERPAK ERSRI ERCZE ERHUN ERPOL ERRUS ERISR ERMOR ERZIM
SPARG +18.197 +0.133 +0.917 -0.480 +0.049 -0.026 -0.741 -16.133 -0.061 -0.269 +0.008 -0.542 -0.604 -0.028 +0.333 +0.362 +0.092 +0.454 -2.318 +0.707 -0.225 -0.919 -0.082 +1.284 -1.827# -0.495
SPBRA +29.6@ +0.382# +2.29@ -0.525 +0.031 -0.110 +1.215 +6.336 -0.218 -0.085 -0.110 -0.744 -0.644 +0.162 -0.165 +0.268 -2.354 +0.472 -4.021 +0.965 -1.539 -1.226@ -0.177# +1.856 -1.512 -2.487 SPCHL +13.7@ +0.137 +0.628 -0.193 +0.013 -0.228 -0.285 -12.381 -0.030 +0.095 +0.004 -0.018 -0.410 -0.142 -0.484 +0.128 -1.108 +0.195 +0.670 +0.397 -0.322 -0.661# +0.015 +0.016 -0.85@ -0.920 SPCOL -9.108 +0.098 +0.943 -0.289 +0.001 -0.024 -1.503# +25.67# +0.050 +0.169 +0.065 -0.052 -0.546 +0.334 +0.033 -0.198 +1.091 -0.165 -1.728 +0.102 +0.712 -0.649# +0.003 -0.639 -0.87@ +0.354 SPECU -6.843 +0.016 +0.027 +0.141 -0.022 -0.141 +1.373# -4.189 +0.14@ -0.261 -0.021 +0.043 +1.353* +0.117 -0.500 -0.896# +0.606 -0.121 +1.599 -0.059 -0.276 +0.309 +0.033 -0.661 -0.439 +1.326# SPMEX +6.905 +0.003 +0.916 +0.357 +0.012 -0.211 -1.179 -21.082 -0.015 +0.061 +0.002 -0.685 -0.277 +0.089 +0.759 -0.219 -1.233 +0.159 -1.360 +0.080 +0.247 -0.661 -0.062 +1.405 -0.936 -1.194 SPVEN +5.051 -0.028 -1.034 -0.280 -0.089 +0.340 +3.429# -16.548 -0.046 +0.736 +0.004 -0.330 -1.559 -0.145 -0.183 -0.022 -0.493 -0.187 +2.503 -0.206 -1.218 -0.254 +0.018 -0.409 +0.830 -1.389 SPHON +5.876 -0.095 +0.174 +0.135 -0.003 +0.454 +0.629 -41.823* -0.122 -0.527# +0.020 -0.277 -0.131 -0.988* -0.494 +0.612 -0.259 -0.057 +0.672 -0.035 +0.625 +0.225 -0.022 +0.666 -0.310 -1.263 SPIDN -13.331 +0.039 -0.098 -0.052 -0.095 +0.449 +2.28@ -30.193 +0.059 -0.694@ +0.024 +0.216 -0.741 -1.453* -1.955 +1.39@ +0.740 +0.126 +1.283 +0.138 -0.011 -0.743 +0.048 -0.413 +0.613 +0.097 SPJAP +8.206 -0.000 +0.454 +0.194 -0.007 -0.043 +0.932 -10.914 -0.036 +0.016 +0.017 +0.065 -0.284 -0.016 -0.645 +0.401 -0.316 -0.188 +1.824 -0.083 +0.669@ -0.171 +0.041 +0.281 +0.027 +0.071 SPMLY -6.877 -0.246@ -0.089 +1.434* +0.046 -0.082 -0.353 -136.67* +0.109 -0.464 -0.114 -1.367* +1.022 -0.330 -1.107 +0.705 +0.707 -0.758 +3.379 -1.148# +0.109 +0.134 +0.129# +0.811 +0.449 -0.154 SPPHI -2.211 -0.037 -0.320 +0.806* +0.015 -0.128 -0.300 -27.39# -0.153@ -0.182 +0.10@ -0.018 +0.075 -0.876* +0.322 +0.098 -1.066 +0.059 +0.862 -0.017 -0.139 -0.300 -0.031 +0.183 +0.406 -0.792 SPSIN -7.122 +0.017 -0.611 +0.043 -0.007 +0.130 +0.156 -28.78# -0.123 -0.205 +0.052 -0.237 -0.280 -0.412 -0.510 +0.650 -0.086 +0.074 -0.542 -0.041 +0.704 +0.055 -0.058 +0.568 +0.805 -0.806 SPKOR +5.520 +0.019 +1.216 -0.720@ -0.082 +0.114 +0.134 +11.475 +0.064 -0.364 +0.013 +0.502 +0.008 -0.069 -0.742 -0.708 -0.238 +0.120 -2.691 -0.608 +1.544# +0.067 +0.071 +1.038 -0.916 -1.296 SPTAI -7.071 +0.101 -0.548 -0.331 -0.004 +0.085 +0.406 -14.453 +0.030 -0.275 -0.014 +0.148 -0.890 +0.475 -0.988 +0.297 +1.625 -0.364 -1.973 +0.170 +0.431 +0.086 +0.031 +0.096 +0.147 -0.354 SPTHA +2.133 +0.097 -0.904 +0.088 -0.004 +0.397 +1.509 -70.550* -0.179 -0.616@ +0.17@ -0.382 -0.576 -0.940# -0.276 +1.30@ -1.552 +0.745 +1.396 +0.135 -0.591 -0.004 +0.102@ +0.458 -1.362 -0.380 SPIND -3.692 -0.130 +0.421 +0.009 +0.067 +0.032 -0.634 -0.004 -0.042 +0.027 -0.021 -0.065 +0.546 +0.119 +0.562 -0.332 +0.690 +0.119 +0.311 +0.005 -0.422 +0.207 +0.027 -0.144 +1.040# -0.408 SPPAK -9.042 -0.152 +0.708 -0.077 +0.084 +0.476 -1.851@ -27.001 -0.122 +0.293 +0.103 -0.414 +0.679 +0.879# +1.79@ -0.152 -0.991 -0.785@ +0.545 +0.171 -0.750 -0.391 +0.016 -1.090 +0.758 +0.372 SPSRI -9.186 -0.066 +0.040 +0.342 -0.084@ -0.122 -1.033@ -12.129 +0.082 -0.226 +0.026 -0.682# +0.533 +0.114 -1.02@ +0.328 +0.403 -0.108 +0.828 +0.076 -0.253 +0.184 -0.007 +0.355 -0.209 -0.365 SPCZE +4.345 +0.086 +0.439 -0.324 -0.058 +0.422 +0.414 -12.182 -0.051 -0.299 +0.070 -0.109 -0.019 -0.206 -1.079 +0.711 -0.886 -0.286 +1.600 -0.871* +1.287* -0.068 +0.001 +0.490 -0.436 -1.004 SPHUN -9.652 +0.148 +2.452# -0.365 +0.013 -0.350 +0.089 -11.632 +0.049 +0.134 -0.002 +0.099 -1.024 -0.287 -1.620 +0.373 +0.432 +0.317 -0.312 -0.95@ +0.843 +0.014 -0.030 -0.544 -0.498 -1.915 SPPOL -1.002 +0.087 +1.852# +0.095 +0.025 -0.174 +0.763 -17.510 -0.003 -0.540@ -0.002 -0.008 +1.039 -0.408 -0.334 -0.108 -2.33@ -0.360 +2.125 -0.974# +1.082@ -0.399 +0.059 -0.280 +0.324 -1.98@ SPRUS -7.865 +0.174 +1.023 -1.575@ -0.109 +1.343 +0.525 -45.523 -0.307 -0.828 -0.002 -0.047 +0.270 -0.315 -2.493 +0.684 -3.330 +0.040 +3.898 -1.032 +4.146# -1.591 +0.087 +0.740 +0.089 -1.868 SPISR -10.117 +0.114 +0.627 -0.511# +0.006 -0.226 +0.079 +4.817 -0.083 +0.014 +0.016 -0.144 -0.160 +0.103 +0.362 +0.136 -0.235 -0.127 +0.484 -0.173 +0.539 -0.236 +0.009 -0.064 +0.288 -0.888 SPMOR +1.388 +0.004 +0.426# +0.086 -0.008 -0.073 -0.003 +4.968 +0.006 -0.011 +0.007 +0.041 -0.111 +0.003 +0.297 -0.030 +0.303 +0.151@ -0.494 +0.082 -0.107 +0.048 -0.016 -0.025 +0.191 +0.123 SPZIM -3.414 +0.044 -0.405 -0.291 -0.009 -0.124 +0.184 -12.442 +0.051 -0.094 +0.037 -0.326 +0.213 +0.206 -1.075# +0.355 -0.713 -0.060 +0.266 -0.078 +0.013 +0.177 -0.022 +0.584 -0.406 -0.284
Note: The value in each cell is the coefficient estimate for each parameter while a superscript indicates the significance of F-test. *, # and @ indicate significance at 1%, 5% and 10% respectively

30
Appendix Table: B5 Test Results of Cross-Market Causality: Stock Prices
(VARs with One lag and constant) Russian Crises Period: August 01 1998 – March 31, 1999
SPARG SPBRA SPCHL SPCOL SPECU SPMEX SPVEN SPHON SPIDN SPJAP SPMLY SPPHI SPSIN SPKOR SPTAI SPTHA SPIND SPPAK SPSRI SPCZE SPHUN SPPOL SPRUS SPISR ERMOR SPZIM
SPARG +0.296 -0.196 +0.188 -0.188 +0.218 +0.312 -0.160 +0.124 +0.109 -0.025 +0.046 -0.038 -0.454# -0.027 +0.218 +0.045 +0.151 -0.049 +0.111 +0.164 -0.100 -0.064 +0.009 +0.006 -0.788 +0.096
SPBRA +0.509# -0.248 -0.067 -0.180 +0.408 +0.295 -0.190 -0.098 +0.152 +0.659# +0.015 -0.124 -0.517# -0.010 +0.37@ +0.126 +0.118 -0.025 +0.078 +0.41@ +0.061 -0.398# -0.050 +0.176 -0.756 +0.290 SPCHL +0.248# -0.143@ +0.209 -0.020 +0.093 +0.095 -0.064 -0.010 +0.09@ +0.123 -0.047 +0.071 -0.24@ -0.063 +0.113 -0.038 +0.024 -0.035 +0.099 +0.103 -0.108 +0.024 +0.008 -0.068 -0.332 +0.163 SPCOL +0.22@ -0.135 +0.210 +0.066 -0.044 +0.012 -0.113# +0.013 +0.11@ -0.148 +0.054 +0.104 +0.088 -0.074 +0.076 -0.13@ +0.048 +0.102 +0.145 +0.033 -0.055 +0.064 +0.070# -0.26@ -0.312 -0.151 SPECU -0.039 +0.001 +0.077 +0.054 -0.096 +0.090 -0.011 -0.045 -0.025 +0.020 +0.013 -0.062 +0.059 -0.129# +0.035 +0.084 +0.17@ -0.115# +0.225# +0.100 -0.055 +0.038 +0.007 +0.003 -0.098 -0.036 SPMEX +0.328# -0.106 -0.000 -0.179 +0.33@ +0.062 -0.143@ -0.021 +0.025 +0.215 +0.003 +0.094 -0.259 -0.051 +0.21@ +0.037 +0.088 +0.009 -0.041 +0.138 -0.088 -0.046 -0.023 -0.087 -0.423 +0.220 SPVEN +0.48@ -0.131 -0.043 -0.053 +0.51@ -0.107 +0.286# +0.113 +0.098 +0.133 -0.267# -0.022 -0.247 +0.023 +0.146 +0.102 +0.001 -0.123 -0.114 -0.318 -0.091 +0.110 -0.026 -0.177 -0.556 +0.134 SPHON +0.085 +0.004 +0.046 -0.025 +0.086 +0.312# -0.031 -0.095 +0.005 -0.157 -0.027 -0.051 -0.013 +0.019 +0.059 +0.066 -0.062 +0.107 -0.096 +0.024 +0.001 -0.009 -0.009 +0.097 -0.456 -0.046 SPIDN -0.035 -0.072 +0.904* -0.091 -0.091 +0.071 +0.229# -0.503* +0.110 +0.116 -0.078 -0.167 +0.193 +0.330# -0.119 +0.151 +0.140 +0.134 +0.098 -0.058 -0.286@ -0.130 +0.176* +0.223 +0.615 -0.080 SPJAP -0.008 -0.011 +0.287# -0.054 +0.128 +0.105 +0.046 +0.043 -0.020 -0.018 +0.029 -0.025 -0.010 +0.105@ -0.018 +0.038 -0.050 +0.042 -0.076 -0.091 -0.056 -0.097 +0.060# +0.020 -0.353 +0.050 SPMLY -0.350@ +0.110 +0.644* -0.166 +0.342 +0.287 -0.045 -0.049 +0.053 -0.161 -0.277* +0.073 -0.106 -0.029 +0.010 +0.025 -0.250 -0.045 +0.525* +0.146 -0.227@ +0.023 +0.082 -0.045 -0.073 -0.460# SPPHI +0.21@ -0.100 +0.135 -0.086 -0.070 -0.082 +0.050 -0.058 -0.017 -0.022 -0.079 +0.047 +0.168 +0.049 +0.148 +0.070 -0.19@ +0.099 +0.117 +0.147 +0.001 -0.016 +0.034 +0.010 +0.780# +0.179 SPSIN +0.107 -0.124 +0.194 -0.040 +0.28@ +0.123 +0.10@ +0.005 +0.022 -0.017 -0.074 +0.080 -0.109 +0.125 +0.017 -0.052 +0.013 +0.088 +0.25@ -0.095 +0.006 +0.031 +0.041 +0.116 -0.323 -0.068 SPKOR +0.219 -0.073 +0.072 -0.068 +0.058 +0.410# +0.047 +0.142 +0.012 -0.498# +0.118 -0.378# +0.375# -0.009 -0.065 +0.044 +0.145 -0.058 -0.251 +0.027 +0.147 -0.083 +0.004 -0.106 -0.723 -0.423# SPTAI -0.034 -0.138 +0.091 +0.067 +0.069 +0.325# -0.081 -0.021 +0.020 +0.037 +0.044 -0.104 +0.082 +0.096 -0.217# +0.12@ +0.125 -0.083 +0.121 -0.191 -0.052 -0.044 +0.072# +0.184 -0.112 -0.081 SPTHA -0.061 +0.024 +0.43@ +0.138 +0.095 +0.35@ +0.106 -0.231 +0.093 +0.099 -0.149 -0.059 +0.071 +0.161 -0.046 -0.076 -0.114 -0.088 +0.209 -0.096 -0.069 +0.087 +0.027 +0.020 -0.605 -0.021 SPIND -0.067 +0.053 +0.102 -0.079 -0.129 -0.040 +0.008 +0.029 +0.041 -0.421* +0.029 -0.032 +0.051 +0.039 +0.119 +0.034 -0.062 -0.030 +0.143 +0.044 +0.018 +0.102 +0.038 -0.218 -0.191 +0.073 SPPAK -0.088 +0.009 +0.37@ -0.002 -0.202 +0.043 -0.074 -0.126 -0.069 +0.121 -0.064 -0.352# -0.010 +0.056 +0.279# +0.075 +0.053 +0.045 +0.133 +0.247 -0.115 +0.178 -0.080@ -0.39@ -0.237 -0.154 SPSRI -0.082 +0.112 +0.164 +0.070 +0.22@ -0.075 +0.005 -0.046 +0.051 -0.012 +0.050 +0.064 -0.105 -0.030 +0.105 -0.010 +0.041 +0.038 +0.267* -0.048 +0.075 -0.059 +0.019 +0.25@ -0.568# -0.166 SPCZE +0.23@ -0.108 +0.234 +0.002 +0.147 +0.199 +0.10@ +0.094 +0.010 -0.238 -0.064 -0.014 -0.207 +0.116 -0.119 +0.004 -0.005 -0.044 +0.039 -0.119 -0.041 +0.018 +0.071# +0.001 +0.511 +0.059 SPHUN +0.292 -0.179 +0.342 +0.056 +0.273 +0.462# +0.017 +0.129 +0.042 -0.152 -0.107 +0.158 -0.122 +0.176 +0.044 -0.179 -0.012 -0.119 -0.108 -0.121 -0.094 +0.032 +0.009 +0.082 -0.94@ -0.252 SPPOL +0.335# -0.050 +0.304 -0.090 +0.182 +0.109 +0.011 -0.220@ -0.138@ -0.071 -0.056 -0.072 -0.087 +0.110 +0.182 -0.022 -0.004 -0.112 +0.098 +0.194 +0.165 +0.002 +0.022 +0.225 +0.060 -0.139 SPRUS -0.478 -0.104 +1.690* +0.231 +0.673 +0.590 -0.028 -0.227 +0.145 -0.071 -0.024 -0.012 -0.640 +0.306 -0.018 +0.256 -0.742# -0.217 +0.623 -0.422 -0.212 -0.051 +0.284# -0.089 -1.269 -0.066 SPISR +0.17@ -0.139@ -0.008 -0.044 +0.19@ +0.052 +0.006 +0.016 -0.023 +0.011 +0.007 +0.022 -0.105 +0.120# +0.076 -0.081 +0.006 +0.016 +0.028 +0.043 -0.080 +0.067 +0.005 +0.052 -0.209 +0.015 SPMOR -0.061 +0.018 +0.039 +0.015 +0.042 +0.044 -0.031@ -0.006 -0.006 +0.033 +0.025 +0.021 +0.037 -0.030 -0.005 +0.011 +0.043 -0.029 -0.080# -0.049 +0.005 +0.014 -0.003 -0.019 +0.090 +0.007 SPZIM +0.011 -0.024 +0.009 -0.072 +0.072 +0.064 -0.015 +0.029 +0.092# +0.153 -0.038 +0.031 -0.202# +0.005 +0.029 +0.021 +0.001 +0.054 +0.049 -0.003 -0.040 -0.026 -0.015 +0.051 -0.506# +0.119
Note: The value in each cell is the coefficient estimate for each parameter while a superscript indicates the significance of F-test. *, # and @ indicate significance at 1%, 5% and 10% respectively
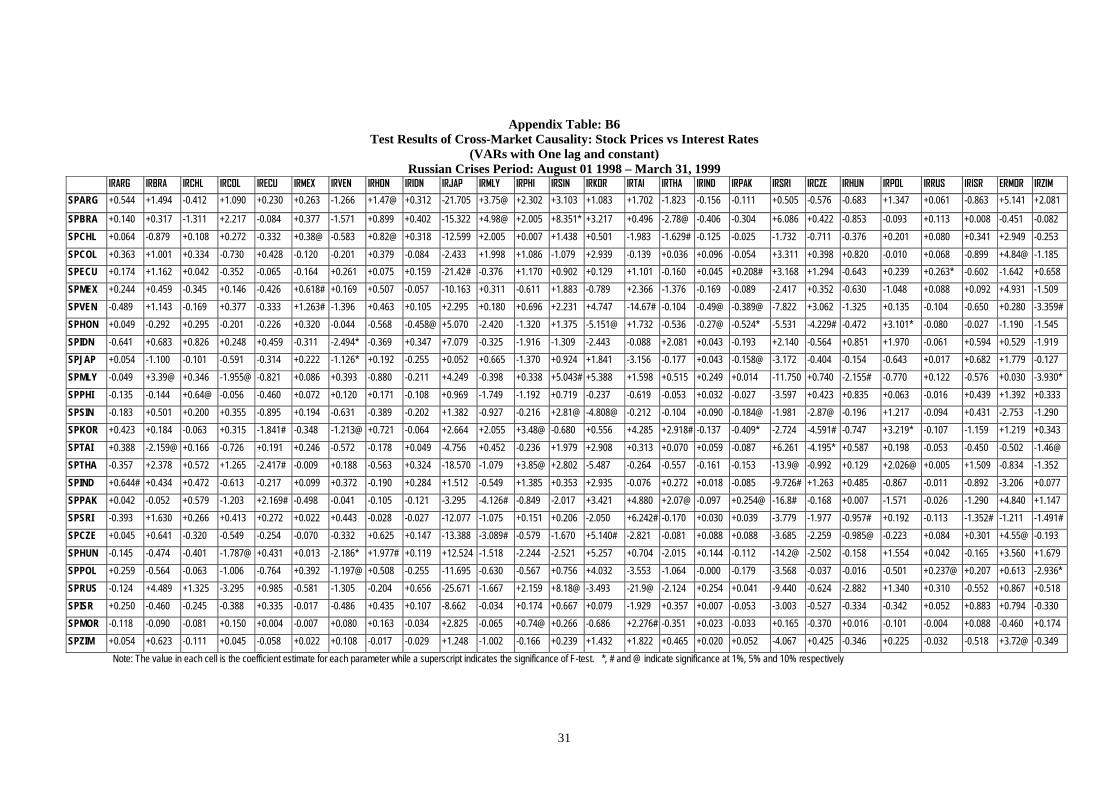
31
Appendix Table: B6 Test Results of Cross-Market Causality: Stock Prices vs Interest Rates
(VARs with One lag and constant) Russian Crises Period: August 01 1998 – March 31, 1999
IRARG IRBRA IRCHL IRCOL IRECU IRMEX IRVEN IRHON IRIDN IRJAP IRMLY IRPHI IRSIN IRKOR IRTAI IRTHA IRIND IRPAK IRSRI IRCZE IRHUN IRPOL IRRUS IRISR ERMOR IRZIM
SPARG +0.544 +1.494 -0.412 +1.090 +0.230 +0.263 -1.266 +1.47@ +0.312 -21.705 +3.75@ +2.302 +3.103 +1.083 +1.702 -1.823 -0.156 -0.111 +0.505 -0.576 -0.683 +1.347 +0.061 -0.863 +5.141 +2.081
SPBRA +0.140 +0.317 -1.311 +2.217 -0.084 +0.377 -1.571 +0.899 +0.402 -15.322 +4.98@ +2.005 +8.351* +3.217 +0.496 -2.78@ -0.406 -0.304 +6.086 +0.422 -0.853 -0.093 +0.113 +0.008 -0.451 -0.082 SPCHL +0.064 -0.879 +0.108 +0.272 -0.332 +0.38@ -0.583 +0.82@ +0.318 -12.599 +2.005 +0.007 +1.438 +0.501 -1.983 -1.629# -0.125 -0.025 -1.732 -0.711 -0.376 +0.201 +0.080 +0.341 +2.949 -0.253 SPCOL +0.363 +1.001 +0.334 -0.730 +0.428 -0.120 -0.201 +0.379 -0.084 -2.433 +1.998 +1.086 -1.079 +2.939 -0.139 +0.036 +0.096 -0.054 +3.311 +0.398 +0.820 -0.010 +0.068 -0.899 +4.84@ -1.185 SPECU +0.174 +1.162 +0.042 -0.352 -0.065 -0.164 +0.261 +0.075 +0.159 -21.42# -0.376 +1.170 +0.902 +0.129 +1.101 -0.160 +0.045 +0.208# +3.168 +1.294 -0.643 +0.239 +0.263* -0.602 -1.642 +0.658 SPMEX +0.244 +0.459 -0.345 +0.146 -0.426 +0.618# +0.169 +0.507 -0.057 -10.163 +0.311 -0.611 +1.883 -0.789 +2.366 -1.376 -0.169 -0.089 -2.417 +0.352 -0.630 -1.048 +0.088 +0.092 +4.931 -1.509 SPVEN -0.489 +1.143 -0.169 +0.377 -0.333 +1.263# -1.396 +0.463 +0.105 +2.295 +0.180 +0.696 +2.231 +4.747 -14.67# -0.104 -0.49@ -0.389@ -7.822 +3.062 -1.325 +0.135 -0.104 -0.650 +0.280 -3.359# SPHON +0.049 -0.292 +0.295 -0.201 -0.226 +0.320 -0.044 -0.568 -0.458@ +5.070 -2.420 -1.320 +1.375 -5.151@ +1.732 -0.536 -0.27@ -0.524* -5.531 -4.229# -0.472 +3.101* -0.080 -0.027 -1.190 -1.545 SPIDN -0.641 +0.683 +0.826 +0.248 +0.459 -0.311 -2.494* -0.369 +0.347 +7.079 -0.325 -1.916 -1.309 -2.443 -0.088 +2.081 +0.043 -0.193 +2.140 -0.564 +0.851 +1.970 -0.061 +0.594 +0.529 -1.919 SPJAP +0.054 -1.100 -0.101 -0.591 -0.314 +0.222 -1.126* +0.192 -0.255 +0.052 +0.665 -1.370 +0.924 +1.841 -3.156 -0.177 +0.043 -0.158@ -3.172 -0.404 -0.154 -0.643 +0.017 +0.682 +1.779 -0.127 SPMLY -0.049 +3.39@ +0.346 -1.955@ -0.821 +0.086 +0.393 -0.880 -0.211 +4.249 -0.398 +0.338 +5.043# +5.388 +1.598 +0.515 +0.249 +0.014 -11.750 +0.740 -2.155# -0.770 +0.122 -0.576 +0.030 -3.930* SPPHI -0.135 -0.144 +0.64@ -0.056 -0.460 +0.072 +0.120 +0.171 -0.108 +0.969 -1.749 -1.192 +0.719 -0.237 -0.619 -0.053 +0.032 -0.027 -3.597 +0.423 +0.835 +0.063 -0.016 +0.439 +1.392 +0.333 SPSIN -0.183 +0.501 +0.200 +0.355 -0.895 +0.194 -0.631 -0.389 -0.202 +1.382 -0.927 -0.216 +2.81@ -4.808@ -0.212 -0.104 +0.090 -0.184@ -1.981 -2.87@ -0.196 +1.217 -0.094 +0.431 -2.753 -1.290 SPKOR +0.423 +0.184 -0.063 +0.315 -1.841# -0.348 -1.213@ +0.721 -0.064 +2.664 +2.055 +3.48@ -0.680 +0.556 +4.285 +2.918# -0.137 -0.409* -2.724 -4.591# -0.747 +3.219* -0.107 -1.159 +1.219 +0.343 SPTAI +0.388 -2.159@ +0.166 -0.726 +0.191 +0.246 -0.572 -0.178 +0.049 -4.756 +0.452 -0.236 +1.979 +2.908 +0.313 +0.070 +0.059 -0.087 +6.261 -4.195* +0.587 +0.198 -0.053 -0.450 -0.502 -1.46@ SPTHA -0.357 +2.378 +0.572 +1.265 -2.417# -0.009 +0.188 -0.563 +0.324 -18.570 -1.079 +3.85@ +2.802 -5.487 -0.264 -0.557 -0.161 -0.153 -13.9@ -0.992 +0.129 +2.026@ +0.005 +1.509 -0.834 -1.352 SPIND +0.644# +0.434 +0.472 -0.613 -0.217 +0.099 +0.372 -0.190 +0.284 +1.512 -0.549 +1.385 +0.353 +2.935 -0.076 +0.272 +0.018 -0.085 -9.726# +1.263 +0.485 -0.867 -0.011 -0.892 -3.206 +0.077 SPPAK +0.042 -0.052 +0.579 -1.203 +2.169# -0.498 -0.041 -0.105 -0.121 -3.295 -4.126# -0.849 -2.017 +3.421 +4.880 +2.07@ -0.097 +0.254@ -16.8# -0.168 +0.007 -1.571 -0.026 -1.290 +4.840 +1.147 SPSRI -0.393 +1.630 +0.266 +0.413 +0.272 +0.022 +0.443 -0.028 -0.027 -12.077 -1.075 +0.151 +0.206 -2.050 +6.242# -0.170 +0.030 +0.039 -3.779 -1.977 -0.957# +0.192 -0.113 -1.352# -1.211 -1.491# SPCZE +0.045 +0.641 -0.320 -0.549 -0.254 -0.070 -0.332 +0.625 +0.147 -13.388 -3.089# -0.579 -1.670 +5.140# -2.821 -0.081 +0.088 +0.088 -3.685 -2.259 -0.985@ -0.223 +0.084 +0.301 +4.55@ -0.193 SPHUN -0.145 -0.474 -0.401 -1.787@ +0.431 +0.013 -2.186* +1.977# +0.119 +12.524 -1.518 -2.244 -2.521 +5.257 +0.704 -2.015 +0.144 -0.112 -14.2@ -2.502 -0.158 +1.554 +0.042 -0.165 +3.560 +1.679 SPPOL +0.259 -0.564 -0.063 -1.006 -0.764 +0.392 -1.197@ +0.508 -0.255 -11.695 -0.630 -0.567 +0.756 +4.032 -3.553 -1.064 -0.000 -0.179 -3.568 -0.037 -0.016 -0.501 +0.237@ +0.207 +0.613 -2.936* SPRUS -0.124 +4.489 +1.325 -3.295 +0.985 -0.581 -1.305 -0.204 +0.656 -25.671 -1.667 +2.159 +8.18@ -3.493 -21.9@ -2.124 +0.254 +0.041 -9.440 -0.624 -2.882 +1.340 +0.310 -0.552 +0.867 +0.518 SPISR +0.250 -0.460 -0.245 -0.388 +0.335 -0.017 -0.486 +0.435 +0.107 -8.662 -0.034 +0.174 +0.667 +0.079 -1.929 +0.357 +0.007 -0.053 -3.003 -0.527 -0.334 -0.342 +0.052 +0.883 +0.794 -0.330 SPMOR -0.118 -0.090 -0.081 +0.150 +0.004 -0.007 +0.080 +0.163 -0.034 +2.825 -0.065 +0.74@ +0.266 -0.686 +2.276# -0.351 +0.023 -0.033 +0.165 -0.370 +0.016 -0.101 -0.004 +0.088 -0.460 +0.174 SPZIM +0.054 +0.623 -0.111 +0.045 -0.058 +0.022 +0.108 -0.017 -0.029 +1.248 -1.002 -0.166 +0.239 +1.432 +1.822 +0.465 +0.020 +0.052 -4.067 +0.425 -0.346 +0.225 -0.032 -0.518 +3.72@ -0.349
Note: The value in each cell is the coefficient estimate for each parameter while a superscript indicates the significance of F-test. *, # and @ indicate significance at 1%, 5% and 10% respectively

32
Appendix Table: B7 Test Results of Cross-Market Causality: Interest Rates vs Exchange Rates
(VARs with One lag and constant) Russian Crises Period: August 01 1998 – March 31, 1999
ERARG ERBRA ERCHL ERCOL ERECU ERMEX ERVEN ERHON ERIDN ERJAP ERMLY ERPHI ERSIN ERKOR ERTAI ERTHA ERIND ERPAK ERSRI ERCZE ERHUN ERPOL ERRUS ERISR ERMOR ERZIM
IRARG +3.86@ -0.025 +0.091 +0.043 -0.012 +0.085 +0.186 -0.923 -0.014 +0.057 +0.001 -0.046 -0.079 +0.087 -0.419# +0.129 -0.613# -0.021 -0.036 +0.085 +0.090 -0.068 -0.014 +0.074 +0.090 -0.305
IRBRA +0.352 +0.001 +0.076 +0.001 +0.001 -0.031 -0.004 -0.022 -0.002 +0.017 +0.004 +0.011 +0.024 +0.025 -0.029 -0.007 +0.068 +0.013 -0.019 -0.022 -0.020 +0.008 +0.001 +0.039 -0.033 +0.091 IRCHL -0.980 -0.015 +0.297 -0.103 +0.010 +0.065 -0.270 -2.144 -0.036 +0.063 -0.003 -0.070 +0.059 +0.036 +0.039 +0.177 +0.107 -0.132 -0.464 -0.132 +0.030 +0.068 -0.002 -0.156 -0.27@ -0.071 IRCOL +0.740 +0.018 -0.331* +0.054 -0.000 -0.033 -0.390* -3.017 +0.001 -0.032 +0.005 -0.121# -0.032 -0.078 +0.010 +0.170# -0.002 -0.008 -0.44@ +0.035 +0.045 +0.032 +0.009 +0.071 -0.101 +0.006 IRECU -1.668 +0.022 -0.049 -0.001 -0.008 -0.026 +0.134 -1.201 -0.009 +0.047 -0.005 -0.066 -0.006 -0.047 +0.012 +0.017 -0.174 -0.037 +0.197 -0.080 +0.071 +0.031 +0.003 +0.156 -0.010 -0.112 IRMEX -1.831 -0.041 -0.077 +0.121 -0.016 -0.302# -0.066 -4.123 +0.035 +0.072 +0.030 +0.000 +0.021 -0.140 -0.090 +0.487# -0.432 +0.018 +0.069 -0.174 -0.493# +0.169 +0.008 +0.703# -0.048 +0.158 IRVEN +1.394 -0.011 -0.003 +0.070 -0.002 -0.005 +0.012 +1.709 -0.005 +0.045 -0.010 -0.006 +0.049 +0.052 +0.107 -0.236* -0.252 +0.001 +0.49@ +0.10@ +0.029 -0.076 +0.013@ +0.127 +0.049 -0.124 IRHON -2.007 -0.010 +0.063 -0.098@ +0.003 +0.070 -0.103 +9.145* -0.003 -0.023 +0.02@ -0.133# +0.173 +0.132# -0.183 +0.274* +0.036 -0.011 +0.547# +0.015 -0.204# +0.058 -0.013@ +0.023 -0.086 +0.057 IRIDN -6.665@ +0.036 -0.474 -0.043 -0.002 +0.117 +0.119 -6.321 -0.065 +0.076 -0.018 +0.024 -0.070 -0.070 +0.047 -0.202 +0.009 -0.061 +0.677 +0.014 +0.085 +0.050 -0.012 -0.016 +0.269 +0.303 IRJAP +0.15@ +0.001 -0.000 +0.009* -0.001@ -0.001 -0.004 -0.178 -0.001 -0.004 +0.000 -0.005 +0.005 -0.001 +0.006 +0.001 -0.008 -0.002 -0.009 +0.002 +0.002 -0.002 -0.001@ -0.004 -0.001 -0.007 IRMLY -0.246 +0.003 -0.018 -0.013 +0.000 +0.020 -0.007 +5.135* -0.010 -0.019 +0.003 -0.008 +0.045 -0.023 +0.087 +0.003 -0.018 -0.019 -0.007 -0.038 +0.016 +0.021 -0.002 +0.047 -0.046 -0.046 IRPHI +0.894 +0.004 -0.033 -0.002 -0.000 +0.005 -0.044 +0.092 +0.003 +0.014 -0.001 +0.022 -0.053 -0.032 +0.006 -0.011 +0.034 +0.027 -0.058 -0.005 -0.000 +0.010 +0.002 -0.047 -0.047 -0.027 IRSIN -0.237 +0.004 -0.016 -0.011 +0.004 +0.007 +0.016 +0.924 +0.007 +0.044* -0.004 +0.007 -0.024 +0.011 -0.055 +0.024 +0.097 +0.009 +0.018 -0.018 -0.021 +0.035 -0.001 +0.017 -0.012 +0.019 IRKOR -0.168 +0.002 +0.059# +0.002 -0.000 -0.005 -0.003 -0.090 -0.002 +0.001 +0.001 -0.010 +0.046# +0.018@ -0.014 -0.007 -0.046 -0.018 -0.043 -0.029# +0.034@ -0.017 -0.001 -0.017 -0.008 -0.065# IRTAI -0.070 +0.000 +0.003 -0.003 +0.001 +0.005 +0.032 -0.073 +0.001 +0.008 +0.001 +0.005 +0.001 -0.005 +0.033 -0.007 -0.038 -0.005 -0.042 -0.010 -0.011 -0.004 -0.002# -0.004 +0.03@ +0.034 IRTHA +0.426 +0.004 -0.037 +0.014 +0.007 -0.000 +0.016 +1.362 +0.001 -0.013 -0.000 +0.010 +0.045 -0.030 +0.052 +0.044 +0.036 +0.010 +0.291 +0.007 +0.022 +0.015 -0.002 -0.050 -0.020 +0.087 IRIND -4.641 -0.054 -0.117 -0.089 +0.046 -0.186 -0.146 -3.099 -0.050 +0.034 +0.021 -0.367 -0.676 +0.084 +0.331 +0.475 +0.395 -0.148 -0.313 +0.001 +0.024 +0.240 +0.014 -0.016 +0.001 -0.677 IRPAK +17.14# -0.149@ +0.176 -0.033 -0.013 +0.061 -1.380# -2.771 -0.046 -0.137 -0.320* +0.58@ +0.404 +0.180 -0.831 -0.287 +0.629 +0.074 -0.306 +0.554# -0.005 -0.286 -0.039 -0.400 -0.003 -0.189 IRSRI +0.379# -0.001 -0.010 -0.004 +0.000 +0.003 +0.012 -0.235 -0.002 +0.003 -0.001 +0.003 +0.005 -0.001 -0.010 -0.006 -0.022 -0.007 -0.021 +0.007 -0.000 -0.008 +0.000 +0.004 +0.003 -0.014 IRCZE +0.822 -0.003 +0.057 +0.012 +0.004 -0.017 +0.048 +1.143 -0.000 -0.006 -0.006 +0.04@ -0.020 +0.044# +0.065 -0.066# -0.019 +0.008 -0.027 +0.047# +0.018 -0.024 -0.003 -0.007 +0.042 -0.017 IRHUN -0.394 +0.010 -0.109 +0.014 -0.014 +0.017 +0.042 +1.332 +0.014 +0.032 -0.028* +0.024 +0.18@ +0.071 -0.255# -0.277* +0.107 +0.020 -0.128 +0.002 +0.005 +0.012 -0.003 -0.090 -0.16@ +0.020 IRPOL -1.049 +0.005 -0.128@ -0.064@ +0.002 -0.021 -0.009 -0.188 -0.002 -0.013 -0.018# -0.012 +0.087 +0.018 -0.062 -0.081 -0.317# -0.066@ +0.31@ -0.057 +0.065 +0.083# +0.006 +0.093 +0.019 +0.087 IRRUS +4.523 +0.100 +1.057 +0.063 -0.031 -0.201 +0.811 -6.414 +0.068 +0.055 -0.031 +0.195 +0.238 -0.085 -0.282 -0.577 -2.57@ -0.178 -3.58@ +0.598 -0.345 -0.826@ +0.007 -0.305 +0.876 -0.462 IRISR -2.279# +0.022# -0.106 +0.001 -0.002 +0.005 +0.088 +1.318 -0.011 -0.014 +0.002 -0.057 -0.047 -0.014 -0.046 +0.070 +0.010 +0.020 +0.492* -0.014 +0.019 -0.054 +0.001 +0.034 -0.087 +0.266* IRMOR +0.278 +0.004 -0.007 -0.009 +0.001 -0.047* +0.015 +0.095 +0.008# +0.006 -0.001 +0.02@ -0.010 +0.023# -0.030 -0.051* +0.118* +0.008 -0.032 -0.002 +0.004 +0.014 -0.001 +0.010 -0.006 +0.017 IRZIM -3.327* +0.007 -0.054 +0.014 -0.002 -0.006 +0.19@ +1.979 +0.026# +0.010 +0.009 +0.023 +0.068 -0.044 +0.007 -0.031 +0.137 -0.033 +0.205 -0.096# -0.157# +0.051 +0.008 -0.071 -0.067 +0.258#
Note: The value in each cell is the coefficient estimate for each parameter while a superscript indicates the significance of F-test. *, # and @ indicate significance at 1%, 5% and 10% respectively

33
Appendix Table: B8 Test Results of Cross-Market Causality: Interest Rates vs Stock Prices
(VARs with One lag and constant) Russian Crises Period: August 01 1998 – March 31, 1999
SPARG SPBRA SPCHL SPCOL SPECU SPMEX SPVEN SPHON SPIDN SPJAP SPMLY SPPHI SPSIN SPKOR SPTAI SPTHA SPIND SPPAK SPSRI SPCZE SPHUN SPPOL SPRUS SPISR ERMOR SPZIM
IRARG +0.002 +0.021 +0.005 -0.029 -0.118* -0.025 +0.002 +0.056# +0.018 +0.059 +0.002 -0.028 -0.06@ +0.008 +0.002 +0.006 +0.025 +0.018 -0.021 +0.022 -0.011 -0.069* -0.012 +0.08@ -0.111 -0.039
IRBRA -0.009 -0.009 +0.010 -0.013 -0.001 -0.003 -0.000 -0.009 -0.002 -0.003 -0.013* +0.000 +0.009 +0.005 +0.021* +0.000 +0.012 +0.003 +0.012 -0.003 -0.001 +0.001 +0.002 +0.009 -0.009 -0.016 IRCHL +0.058 -0.014 -0.012 -0.011 -0.004 +0.019 -0.034# +0.05@ -0.002 -0.009 -0.010 -0.080# -0.034 +0.004 -0.015 -0.009 +0.038 -0.039# +0.009 -0.038 -0.021 +0.046@ +0.003 +0.019 -0.153 -0.008 IRCOL -0.000 +0.015 +0.005 -0.005 +0.001 -0.014 -0.010 +0.002 +0.010 -0.080* +0.002 -0.018 -0.014 -0.017 +0.006 -0.012 -0.008 -0.011 +0.04@ -0.009 +0.014 +0.010 +0.005 +0.041 +0.094 -0.048# IRECU -0.008 +0.005 -0.001 -0.000 -0.012 -0.000 +0.007 -0.007 +0.002 -0.031 -0.008 -0.013 -0.009 -0.010 +0.006 +0.029# +0.008 -0.003 +0.017 -0.014 +0.007 -0.009 +0.001 +0.014 +0.015 +0.006 IRMEX +0.032 +0.012 -0.036 -0.050 +0.076 -0.031 +0.000 +0.005 +0.043 -0.162# +0.006 -0.036 +0.008 -0.038 +0.042 -0.004 -0.007 -0.042 -0.042 +0.006 -0.018 -0.055 +0.015 +0.056 +0.239 -0.047 IRVEN +0.009 -0.007 +0.019 -0.029 -0.024 +0.007 +0.009 +0.027 +0.008 -0.065# +0.000 -0.050# -0.008 -0.012 +0.021 +0.021 -0.001 +0.000 +0.005 +0.014 -0.017 -0.003 -0.014# -0.038 -0.061 -0.026 IRHON -0.015 +0.022 -0.019 +0.003 +0.05@ -0.016 -0.007 +0.018 +0.016 +0.006 -0.007 -0.032 -0.010 +0.000 +0.011 -0.008 +0.012 -0.010 +0.038 +0.008 -0.026 -0.002 -0.014# +0.041 +0.020 -0.026 IRIDN -0.012 -0.088# -0.071 +0.032 -0.047 +0.192* +0.016 +0.023 +0.015 -0.042 -0.057@ -0.11@ +0.032 -0.006 -0.049 +0.004 -0.008 -0.050 +0.045 +0.028 -0.055 +0.082# -0.005 +0.034 -0.070 -0.046 IRJAP +0.001 -0.001 +0.001 -0.000 -0.000 -0.000 +0.000 +0.000 +0.000 +0.001 -0.001 +0.001 -0.001 -0.000 -0.000 -0.001 -0.001 -0.001 +0.002 +0.001 -0.001 -0.000 +0.000 +0.001 +0.002 -0.001 IRMLY -0.003 +0.005 -0.003 +0.020# -0.014 +0.003 +0.004 -0.008 -0.000 +0.016 -0.013# +0.014 +0.007 -0.002 -0.019# -0.002 -0.011 +0.004 -0.016 -0.013 +0.016# +0.003 -0.002 -0.008 +0.008 +0.009 IRPHI +0.009 -0.006 -0.007 +0.006 -0.006 +0.013 -0.002 -0.009 +0.007 +0.005 +0.004 +0.003 -0.015 +0.002 +0.003 -0.005 -0.005 -0.005 +0.009 -0.004 +0.001 +0.001 -0.002 +0.008 -0.032 -0.011 IRSIN +0.002 -0.003 -0.015 -0.001 +0.010 +0.002 +0.000 -0.001 +0.003 +0.007 +0.001 -0.007 +0.009 -0.004 +0.005 +0.003 +0.005 +0.002 -0.007 -0.000 -0.004 -0.007 -0.002 +0.003 +0.033 +0.02@ IRKOR -0.002 -0.002 +0.005 +0.001 +0.012# +0.003 -0.001 -0.002 +0.000 +0.001 -0.003 -0.000 -0.000 +0.003 +0.005 -0.000 -0.01@ +0.002 -0.001 -0.01@ +0.001 +0.003 -0.000 -0.001 +0.007 +0.01@ IRTAI +0.005 -0.003 -0.009# +0.003 +0.004 -0.000 +0.002 -0.001 +0.001 -0.003 +0.000 -0.003 +0.01@ -0.005# -0.007# +0.004@ +0.001 -0.001 -0.003 +0.006 -0.004 +0.005# -0.001 -0.01@ +0.013 +0.006 IRTHA +0.003 -0.002 -0.010 -0.003 -0.014 +0.009 -0.001 +0.005 +0.000 +0.016 -0.010 +0.003 -0.005 -0.000 -0.001 +0.008 +0.012 -0.003 +0.008 -0.015 -0.008 -0.006 +0.001 +0.014 -0.032 +0.021 IRIND -0.048 +0.12@ -0.238# +0.012 -0.120 -0.062 -0.030 +0.029 +0.004 +0.019 +0.067 -0.062 -0.130 -0.092 +0.027 +0.036 -0.008 -0.021 -0.093 +0.109 +0.145# -0.049 -0.033 +0.009 +0.309 +0.085 IRPAK -0.148 +0.089 +0.132 -0.058 -0.017 -0.028 -0.042 +0.134 -0.036 -0.000 +0.059 -0.131 +0.015 -0.052 -0.027 +0.001 -0.072 +0.044 +0.001 +0.065 -0.127@ +0.009 +0.040 -0.006 +0.080 +0.091 IRSRI -0.002 +0.004# -0.002 +0.002 -0.000 -0.001 -0.001 +0.000 -0.001 -0.001 -0.000 -0.002 -0.002 +0.000 -0.002 +0.002 +0.000 +0.001 -0.001 +0.004@ -0.003@ -0.003 -0.000 +0.001 -0.007 -0.002 IRCZE -0.004 -0.011@ +0.005 -0.008 -0.019# +0.013 -0.000 +0.009 +0.002 +0.003 +0.005 -0.01@ +0.023# +0.004 -0.004 +0.002 +0.000 +0.003 -0.007 -0.003 -0.008 +0.003 -0.006* -0.02@ -0.017 -0.010 IRHUN +0.001 -0.028@ +0.028 +0.002 +0.027 +0.025 -0.010 -0.007 -0.021# +0.025 +0.009 +0.012 -0.021 -0.008 +0.03@ +0.008 -0.023 -0.007 +0.031 +0.004 -0.002 -0.001 +0.001 -0.010 -0.062 -0.009 IRPOL -0.022 -0.004 -0.006 +0.019 -0.025 +0.03@ +0.003 +0.016 +0.008 -0.002 -0.002 -0.017 -0.018 -0.013 +0.005 +0.011 +0.017 +0.001 -0.009 +0.008 -0.003 -0.005 -0.002 +0.004 -0.016 +0.000 IRRUS +0.347# -0.162 -0.212 +0.038 -0.039 -0.060 +0.013 -0.236@ +0.026 -0.103 +0.041 +0.124 -0.018 +0.035 -0.096 -0.027 -0.046 -0.013 +0.185 +0.29@ -0.202@ +0.096 -0.016 +0.044 -0.081 -0.231 IRISR +0.017 -0.021# -0.015 -0.012 -0.022 +0.013 +0.005 -0.000 +0.007 -0.008 +0.000 +0.010 -0.013 -0.005 +0.005 -0.001 +0.011 +0.009 +0.010 -0.000 +0.009 +0.005 -0.011* +0.018 -0.022 +0.001 IRMOR +0.007 -0.008# -0.007 +0.002 -0.001 +0.001 +0.003 +0.001 +0.004@ +0.002 +0.004@ +0.005 -0.003 -0.001 -0.001 -0.001 +0.005 +0.001 +0.002 +0.001 -0.008* +0.005 +0.001 -0.008 -0.007 -0.005 IRZIM +0.009 -0.007 -0.013 +0.007 -0.007 +0.017 +0.011 +0.010 -0.003 -0.016 +0.002 +0.008 -0.000 -0.004 +0.003 +0.000 +0.005 -0.013 -0.002 -0.012 -0.005 -0.003 +0.011# +0.012 +0.040 +0.007
Note: The value in each cell is the coefficient estimate for each parameter while a superscript indicates the significance of F-test. *, # and @ indicate significance at 1%, 5% and 10% respectively

34
Appendix Table: B9
Test Results of Cross-Market Causality: Interest Rates (VARs with One lag and constant)
Russian Crises Period: August 01 1998 – March 31, 1999 IRARG IRBRA IRCHL IRCOL IRECU IRMEX IRVEN IRHON IRIDN IRJAP IRMLY IRPHI IRSIN IRKOR IRTAI IRTHA IRIND IRPAK IRSRI IRCZE IRHUN IRPOL IRRUS IRISR ERMOR IRZIM
IRARG -0.056 -0.231 -0.101 +0.118 +0.039 -0.014 -0.080 +0.092 -0.022 +4.051 +0.163 +0.154 -0.052 +0.804 -0.124 +0.281 -0.014 -0.038 -1.881 -0.169 -0.153 -0.376@ -0.015 +0.045 +1.211@ +0.888*
IRBRA -0.045@ -0.186@ -0.033 +0.008 +0.004 +0.029 -0.008 -0.002 +0.001 +0.181 -0.154 -0.009 -0.027 +0.197 +0.279 +0.12@ +0.009 +0.009 -0.444 +0.026 +0.084@ -0.102@ +0.006 +0.060 -0.143 -0.005 IRCHL +0.244# +0.369 -0.120 -0.160 -0.050 +0.067 +0.199 +0.032 +0.007 -0.917 +0.046 -0.062 +0.048 +1.177@ +0.289 -0.218 +0.055 +0.012 -1.588 -0.297 +0.178 -0.237 +0.017 +0.053 +0.591 +0.228 IRCOL +0.092 +0.488# -0.004 +0.102 -0.068 -0.009 +0.112 -0.145@ -0.015 -2.088 -0.247 -0.307 +0.196 -0.429 +0.223 +0.040 +0.027 -0.007 +0.723 +0.215 +0.040 -0.148 -0.011 +0.031 -0.534 +0.091 IRECU -0.013 -0.134 -0.021 -0.002 -0.030 +0.017 +0.174# -0.065 -0.012 -0.007 -0.090 -0.153 -0.022 -0.126 +0.093 +0.005 -0.001 -0.008 +0.570 +0.101 +0.011 +0.054 -0.009 -0.057 -0.156 -0.005 IRMEX +0.048 +0.498 -0.150 +0.102 -0.130 +0.061 +0.681* +0.192 +0.046 -1.324 -1.194@ -0.721 -1.15@ +1.207 +1.905 +0.644 +0.034 -0.042 -1.346 +0.818 +0.063 +0.041 -0.033 +0.118 +0.880 +0.041 IRVEN -0.039 +0.014 -0.209* -0.004 +0.098 +0.008 -0.167@ +0.066 -0.013 -1.212 -0.106 -0.171 -0.326 +1.289* -0.675 +0.407# -0.019 +0.036@ +0.504 +0.367 -0.019 -0.091 -0.001 -0.039 +0.430 +0.144 IRHON -0.137# +0.301 -0.008 -0.065 +0.20@ -0.083@ +0.210# -0.161@ +0.033 +0.554 +0.572# -0.119 -0.167 +0.440 -1.18@ -0.047 -0.002 +0.032 +0.449 +0.018 +0.012 -0.304# +0.019 -0.244 -1.140# -0.002 IRIDN +0.200 -0.044 -0.183 -0.309 +0.469 -0.002 +0.272 -0.079 +0.035 -0.662 -1.166@ +0.108 +0.146 -0.051 -0.000 +0.536 +0.011 +0.062 -0.229 +0.089 -0.189 +0.187 -0.021 +0.120 -0.068 +0.554 IRJAP -0.003 -0.018 -0.002 -0.002 +0.003 -0.000 +0.004 +0.004 -0.000 +0.244# -0.022 +0.004 -0.005 -0.000 -0.027 -0.012 +0.001 +0.001 -0.012 +0.005 +0.001 -0.010 +0.001 +0.010 +0.013 -0.002 IRMLY +0.022 +0.158 -0.009 +0.051 +0.028 -0.003 +0.054 +0.041 +0.005 -1.289 +0.101 +0.042 -0.006 -0.184 -0.324 -0.050 -0.003 +0.010 -0.307 -0.105 -0.010 +0.047 +0.005 -0.022 -0.136 -0.190* IRPHI +0.018 +0.081 +0.012 +0.028 -0.010 -0.007 -0.051 +0.056 +0.011 -0.736 +0.060 +0.046 -0.143 +0.109 +0.140 -0.033 -0.002 +0.004 +0.728# +0.091 +0.025 +0.024 -0.001 +0.021 -0.103 -0.004 IRSIN +0.009 -0.083 -0.015 -0.027 +0.068 -0.007 +0.007 -0.045 +0.003 +0.805 +0.145 -0.057 -0.059 +0.111 +0.004 +0.074 +0.000 +0.015# -0.335 -0.083 -0.020 -0.001 -0.008 -0.020 -0.060 +0.086 IRKOR +0.010 -0.048 +0.019 -0.030 -0.001 +0.013 -0.012 -0.014 -0.015@ -0.460 -0.041 -0.088 +0.038 +0.521* -0.166 +0.066# -0.002 +0.005 -0.224 -0.014 +0.031 -0.051@ +0.009# +0.040 +0.058 -0.028 IRTAI -0.003 -0.045 -0.015 -0.045# -0.003 +0.003 +0.033# +0.004 +0.004 +0.391 -0.060 -0.033 +0.047 -0.004 -0.080 -0.008 +0.005 -0.000 +0.005 +0.002 +0.001 -0.013 -0.002 +0.005 +0.14@ -0.008 IRTHA +0.046 -0.100 -0.068 -0.127 +0.026 +0.003 -0.033 -0.025 +0.006 -0.437 +0.116 -0.185 -0.254 +0.667# -0.240 -0.18@ -0.019 +0.023@ -1.10@ +0.034 -0.031 -0.070 +0.004 -0.082 -0.051 +0.149 IRIND +0.220 +0.389 -0.411 -0.401 -0.291 -0.120 +1.264* -0.384 -0.039 -2.995 -0.286 +0.588 -0.257 -1.909 +0.057 +0.807 -0.350* -0.038 -0.808 -0.189 +0.917# -0.593 -0.030 -0.149 -1.812 -0.441 IRPAK +0.427 -1.143 -0.202 -0.044 +0.073 -0.224 +0.193 -0.078 -0.134 +13.431 +1.121 -0.613 -1.359 -2.699 +1.107 -0.371 +0.21@ -0.010 -6.369 -2.52@ -0.351 +0.501 -0.003 +0.111 +3.113 +1.163 IRSRI -0.009 -0.032 -0.004 +0.005 -0.004 +0.000 -0.009 -0.008 -0.002 +0.33@ -0.030 -0.038 -0.030 -0.059 -0.101 +0.001 -0.003 -0.004@ +0.059 +0.046 -0.004 +0.011 -0.001 +0.007 +0.053 +0.000 IRCZE -0.015 -0.057 -0.000 +0.021 +0.062 -0.003 +0.012 +0.019 -0.012 +1.038 +0.15@ -0.064 -0.043 -0.015 -0.003 +0.094 -0.002 +0.003 +0.094 -0.107 +0.025 -0.081 +0.002 +0.042 +0.200 +0.043 IRHUN -0.028 +0.013 -0.043 +0.068 -0.015 -0.092# -0.106 +0.001 -0.043 -3.196@ +0.189 +0.303 +0.261 +0.383 +0.863 -0.27@ -0.04@ +0.023 -0.129 +0.002 -0.300* +0.016 +0.031@ +0.022 +0.085 +0.142 IRPOL +0.134* -0.269@ +0.063 -0.111 +0.007 -0.007 +0.128# +0.014 -0.012 +2.753# +0.070 +0.064 -0.132 +0.068 -0.004 +0.041 -0.012 -0.014 +0.048 +0.022 +0.077 -0.211# -0.010 -0.097 +0.047 +0.034 IRRUS +0.037 -0.784 -0.022 -0.390 -0.168 +0.092 -0.395 +0.011 +0.263 +12.326 -1.067 -1.049 -0.732 +0.506 +2.237 -0.068 -0.073 -0.218 +4.272 +2.997 +0.259 +0.196 +0.054 +0.178 +1.411 -1.077 IRISR +0.001 -0.205 +0.016 -0.057 +0.14@ -0.048@ +0.051 +0.129# +0.020 -0.843 +0.134 +0.026 -0.29@ +0.671# -1.156* +0.052 +0.008 +0.015 -0.165 +0.218 +0.054 -0.032 +0.019@ -0.039 +1.159* +0.094 IRMOR -0.010 +0.049 -0.026@ -0.021 -0.008 +0.006 -0.028 +0.017 +0.011 +0.070 +0.035 +0.037 +0.020 -0.029 +0.088 -0.037 +0.016* +0.003 -0.028 +0.026 +0.005 -0.032 +0.000 +0.021 +0.057 -0.014 IRZIM -0.019 +0.344# +0.050 -0.027 +0.026 -0.033 -0.045 +0.188* +0.026 -1.298 -0.062 +0.154 +0.079 +0.018 -0.431 +0.064 +0.016 +0.005 +0.528 +1.033* -0.042 +0.033 +0.012 +0.041 +0.258 +0.152
Note: The value in each cell is the coefficient estimate for each parameter while a superscript indicates the significance of F-test. *, # and @ indicate significance at 1%, 5% and 10% respectively.