
Evaluation of the effective connectivity of supplementary motor areas during motor imagery using...
10
Evaluation of the effective connectivity of supplementary motor areas during motor imagery using Granger causality mapping Huafu Chen a, ⁎, Qin Yang a , Wei Liao a , Qiyong Gong b,c , Shan Shen a,d a Key Laboratory for NeuroInformation of Ministry of Education, School of Life Science and Technology, University of Electronic Science and Technology of China, Chengdu, 610054, PR China b Huaxi MR Research Center (HMRRC), Department of Radiology, West China Hospital of Sichuan University, 610041, PR China c The Division of Medical Imaging, Faculty of Medicine, University of Liverpool, UK d Clinical Neuroscience Research Team, Department of Psychology, University of Surrey Guildford GU2 7XH, UK abstract article info Article history: Received 18 January 2009 Revised 22 April 2009 Accepted 11 June 2009 Available online 18 June 2009 Keywords: Effective connectivity Feedback Granger causality Motor imagery Supplementary motor areas Brain activation during motor imagery has been studied extensively for years, but only a few of these studies focused on investigating the effective connectivity in the brain. The existence of interactions or closed loop circuits between the SMA and other brain regions during motor imagery still remains unclear. In the present study, selecting the SMA as the region of interest, we used the Granger causality mapping (GCM) method to explore the effective connectivity in the brain during motor imagery. Our results demonstrated that more brain regions showed effective connections to the SMA during the right-hand motor imagery than during the left-hand motor imagery, but the strength of the casual influence during the left-hand motor imagery was stronger than that of the right-hand motor imagery. We further found forward and backward effective connectivity between the SMA and three regions, including the bilateral dorsal premotor area (PMd), the contralateral primary and secondary somatosensory cortex (S1), and the primary motor cortex (M1). these results might indicate how the brain regions were inter-activated during motor imagery. © 2009 Elsevier Inc. All rights reserved. Introduction Motor imagery, defined as the mental rehearsal of motor move- ment without any overt body movement (Jeannerod 1995; Porro et al., 1996), has been demonstrated to play a very important role in training for athletes and musicians (Lotze and Halsband, 2006), and also in the recovery of motor abilities in patients with movement disorders (Malouin et al., 2004; Kimberley et al., 2006). In particular, motor imagery was often performed using two different strategies, visual imagery (Solodkin et al., 2004), i.e. people produce a visual representation of their movements, and kinetic imagery, i.e. people simulate the movement with a kinesthetic feeling. Benefited from brain imaging techniques, such as functional magnetic resonance imaging (fMRI) and positron emission tomogra- phy (PET), motor imagery has been studied intensively for years. Among the activated brain areas during motor imagery, the supple- mentary motor area (SMA) was reported to be the most active area and plays an important role in motor imagery tasks as well as in the high-level motor control (Gerardin et al., 2000; Nair et al., 2003; Lacourse et al., 2005; Michelon et al., 2006; Szameitat et al., 2007). It was also found to be involved in the programming of movements (Cunnington et al., 1996). Recently, the interactions between the SMA and some specific regions during motor imagery were investigated, in which effective connectivity (Friston et al., 1993) among brain regions was calculated. Solodkin et al. (2004) used structural equation modeling to estimate the networks underlying motor execution and motor imagery with specified regions of interest. A more recent study (Kasess et al., 2008) analyzed the interaction between the SMA and the primary motor cortex (M1) by dynamic causal modeling (DCM) (Friston et al., 2003) and showed that the SMA exerted a suppressive influence on the M1 during motor imagery. Besides the SMA, there are several other brain regions, such as the dorsal premotor area (PMd) and inferior parietal lobule (IPL), also participating in motor imagery as addressed by many studies (Lortze et al., 1999; Simon et al., 2002; Hanakawa et al.,, 2003; Nair et al., 2003; Solodkin et al., 2004; Lacourse et al., 2005; Lotze and Halsband, 2006; Szameitat et al., 2007). Aiming to obtain a clear picture on the interaction networks between the SMA and all these important regions involved in motor imagery, we employed the Granger causality mapping (GCM) method (Goebel et al., 2003; Roebroeck et al., 2005; Deshpande et al., 2008; Gao et al., 2008) to investigate this inter-regional interaction. GCM is an important approach to explore Granger causal relationships between two time series. It can detect the effective connectivity in the brain by its predictive power based on the assumption that the hemodynamic response function (HRF) is capable of measuring inter-regional latencies (chronometry) (For- misano and Goebel, 2003; Hulsmann et al., 2003; Menon et al., 1998; Mohamed et al., 2003). NeuroImage 47 (2009) 1844–1853 ⁎ Corresponding author. Fax: +86 28 83208238. E-mail address: [email protected] (H. Chen). 1053-8119/$ – see front matter © 2009 Elsevier Inc. All rights reserved. doi:10.1016/j.neuroimage.2009.06.026 Contents lists available at ScienceDirect NeuroImage journal homepage: www.elsevier.com/locate/ynimg
-
Upload
independent -
Category
Documents
-
view
4 -
download
0
Transcript of Evaluation of the effective connectivity of supplementary motor areas during motor imagery using...
NeuroImage 47 (2009) 1844–1853
Contents lists available at ScienceDirect
NeuroImage
j ourna l homepage: www.e lsev ie r.com/ locate /yn img
Evaluation of the effective connectivity of supplementary motor areas during motorimagery using Granger causality mapping
Huafu Chen a,⁎, Qin Yang a, Wei Liao a, Qiyong Gong b,c, Shan Shen a,d
a Key Laboratory for NeuroInformation of Ministry of Education, School of Life Science and Technology, University of Electronic Science and Technology of China, Chengdu, 610054, PR Chinab Huaxi MR Research Center (HMRRC), Department of Radiology, West China Hospital of Sichuan University, 610041, PR Chinac The Division of Medical Imaging, Faculty of Medicine, University of Liverpool, UKd Clinical Neuroscience Research Team, Department of Psychology, University of Surrey Guildford GU2 7XH, UK
⁎ Corresponding author. Fax: +86 28 83208238.E-mail address: [email protected] (H. Chen).
1053-8119/$ – see front matter © 2009 Elsevier Inc. Aldoi:10.1016/j.neuroimage.2009.06.026
a b s t r a c t
a r t i c l e i n f oArticle history:Received 18 January 2009Revised 22 April 2009Accepted 11 June 2009Available online 18 June 2009
Keywords:Effective connectivityFeedbackGranger causalityMotor imagerySupplementary motor areas
Brain activation during motor imagery has been studied extensively for years, but only a few of these studiesfocused on investigating the effective connectivity in the brain. The existence of interactions or closed loopcircuits between the SMA and other brain regions during motor imagery still remains unclear. In the presentstudy, selecting the SMA as the region of interest, we used the Granger causality mapping (GCM) method toexplore the effective connectivity in the brain during motor imagery. Our results demonstrated that morebrain regions showed effective connections to the SMA during the right-hand motor imagery than during theleft-hand motor imagery, but the strength of the casual influence during the left-hand motor imagery wasstronger than that of the right-hand motor imagery. We further found forward and backward effectiveconnectivity between the SMA and three regions, including the bilateral dorsal premotor area (PMd), thecontralateral primary and secondary somatosensory cortex (S1), and the primary motor cortex (M1). theseresults might indicate how the brain regions were inter-activated during motor imagery.
© 2009 Elsevier Inc. All rights reserved.
Introduction
Motor imagery, defined as the mental rehearsal of motor move-ment without any overt bodymovement (Jeannerod 1995; Porro et al.,1996), has been demonstrated to play a very important role in trainingfor athletes andmusicians (Lotze and Halsband, 2006), and also in therecovery of motor abilities in patients with movement disorders(Malouin et al., 2004; Kimberley et al., 2006). In particular, motorimagery was often performed using two different strategies, visualimagery (Solodkin et al., 2004), i.e. people produce a visualrepresentation of their movements, and kinetic imagery, i.e. peoplesimulate the movement with a kinesthetic feeling.
Benefited from brain imaging techniques, such as functionalmagnetic resonance imaging (fMRI) and positron emission tomogra-phy (PET), motor imagery has been studied intensively for years.Among the activated brain areas during motor imagery, the supple-mentary motor area (SMA) was reported to be the most active areaand plays an important role in motor imagery tasks as well as in thehigh-level motor control (Gerardin et al., 2000; Nair et al., 2003;Lacourse et al., 2005; Michelon et al., 2006; Szameitat et al., 2007). Itwas also found to be involved in the programming of movements(Cunnington et al., 1996). Recently, the interactions between the SMA
l rights reserved.
and some specific regions during motor imagery were investigated, inwhich effective connectivity (Friston et al., 1993) among brain regionswas calculated. Solodkin et al. (2004) used structural equationmodeling to estimate the networks underlying motor execution andmotor imagery with specified regions of interest. A more recent study(Kasess et al., 2008) analyzed the interaction between the SMA andthe primary motor cortex (M1) by dynamic causal modeling (DCM)(Friston et al., 2003) and showed that the SMA exerted a suppressiveinfluence on the M1 during motor imagery.
Besides the SMA, there are several other brain regions, such as thedorsal premotor area (PMd) and inferior parietal lobule (IPL), alsoparticipating in motor imagery as addressed by many studies (Lortzeet al., 1999; Simon et al., 2002; Hanakawa et al.,, 2003; Nair et al.,2003; Solodkin et al., 2004; Lacourse et al., 2005; Lotze and Halsband,2006; Szameitat et al., 2007). Aiming to obtain a clear picture on theinteraction networks between the SMA and all these importantregions involved in motor imagery, we employed the Grangercausality mapping (GCM) method (Goebel et al., 2003; Roebroeck etal., 2005; Deshpande et al., 2008; Gao et al., 2008) to investigate thisinter-regional interaction. GCM is an important approach to exploreGranger causal relationships between two time series. It can detectthe effective connectivity in the brain by its predictive power based onthe assumption that the hemodynamic response function (HRF) iscapable of measuring inter-regional latencies (chronometry) (For-misano and Goebel, 2003; Hulsmann et al., 2003; Menon et al., 1998;Mohamed et al., 2003).
1845H. Chen et al. / NeuroImage 47 (2009) 1844–1853
Because of the importance of the SMA in motor imagery statedabove, we chose the SMA as our region of interest in the current study.GCM was used to analyze the effective connectivity between the SMAand the whole brain during motor imagery. This approach wastargeted to identify brain regions that are sources or targets of thedirected influence over or by the SMA (Goebel et al., 2003; Roebroecket al., 2005; Gao et al., 2008), and further detect the interactionsbetween those regions and the SMA.
Materials and methods
Subjects
Ten right-handed subjects (four females, age range 19–25 years)with no history of neuropsychiatric disorders participated in the studyafter giving informed consents. The average handedness score was90.72, with a standard deviation of 6.43, according to the Edinburghinventory. The study protocol was approved by the local InstitutionalReview Board.
Experimental paradigm
The experiment was performed on a 3.0-T GE-Signa MRI scanner(Huaxi MR Research Center, Chengdu, China). The gradient-recalledecho planar imaging (EPI) sequence was employed for fMRI scanningand the parameters were as follows: 30 transverse slices,TR=2000 ms, TE=30 ms, FOV=24 cm, matrix=64×64, voxelsize=3.75×3.75×5 mm3 (without gap), flip angle=90°. The fMRIexperiment had two runs: onewas for left-hand performance, and theother one was for right-hand performance. Each run included 10 trialsand each trial lasted 30 s (4 s for sequence informing, 10 s for imagery,6 s for motor execution, and 10 s for resting, in order). All visualstimuli were presented by a projector. During each trial, subjects firstlearned from four sequentially presented pictures, indicating arandom order of finger tapping (for example, ring-index-little-middle,or, index-middle-ring-little), then started to imagine tapping theirfingers in the order that initially informed by the visual stimulus.Importantly, the screen turned blackwhen the imagination began. Theimagery was repeated continuously in the 10 s duration. Next, anothercue for the next 6 s was presented on the screen informing theparticipants to perform the finger tapping exactly as they hadimagined. This was the motor execution (ME) condition. The reasonthat the motor imagery task was followed by a ME task was to ensurethat the participants concentrated on motor imagery and imaginedthe finger tapping correctly. Before the fMRI experiment, subjectswere trained for about 1 h.
High-resolution T1-weighted anatomical images were alsoacquired in axial orientation using a 3D spoiled gradient-recalled(SPGR) sequence in the interval during the first and second run offMRI (TR=8.5 ms, TE=3.4 ms, flip angle=12°, matrix size=512×512×156 and voxel size=0.47×0.47×1 mm3).
Data analyses
The experimental data were pre-processed using statisticalparametric mapping software (SPM2, http://www.fil.ion.ucl.ac.uk/spm). To allow for magnetization equilibrium, the first five imageswere discarded for each run. The remaining 150 images were firstcorrected for the acquisition time delay among different slices, andthen the images were realigned to the first volume for head-motion correction. Six regressive motion correction parameterswere included in the design matrix for each run as covariates withno interest. Then, a high-pass filter with a cut-off of 1/128 Hz wasused to remove the low-frequency noise. After being spatiallynormalized into a standard stereotaxic space at 2×2×2 mm3,using the Montreal Neurological Institute (MNI) EPI template, the
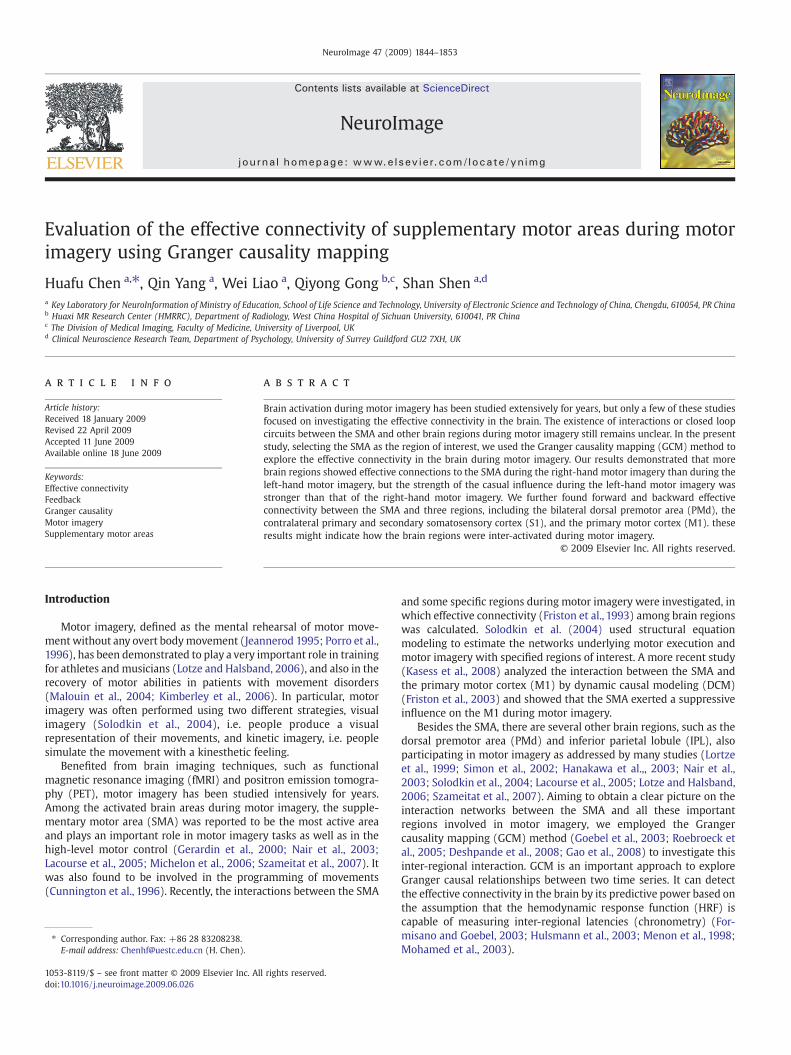
voxel coordinates were transformed from the MNI coordinates tothe Talairach coordinates (Talairach and Tournoux, 1988). TheTalairach coordinates were reported in Tables 1–3. A spatialsmoothing filter was employed for each volume by convolvingwith an isotropic Gaussian kernel (FWHM=8 mm). Statisticalparametric maps (t-statistics) of contrasting between the motorimagery condition and the rest condition were generated with athreshold of pb0.001 (uncorrected), to detect significantly acti-vated brain regions during the imagery condition. Subsequently, inorder to extend inferences based on the individual statisticalanalyses to the general population from which the subjects weredrawn, a random-effect analysis (Penny et al., 2003) wasperformed. This estimates the error variance for each conditionof interest across subjects, rather than across scans. In the random-effect analysis, a one-sample t-test (degree of freedom d.f.=9) wasperformed across subjects on their contrast images between themotor imagery condition and the rest condition. Voxels in the graymatter, which was obtained from the probabilistic maps of graymatter in SPM2, with tN3.5 for left-hand imagery and tN3.7 forright-hand imagery (q=0.05 false discovery rate (FDR) corrected(Genovese et al., 2002)) were considered as significantly activated.
Identification of region of interest (ROI)
Taking into account the anatomical variation across subjects, thesubject-specific peak voxel and the subject-specific ROI were definedon individual SPM {t} maps. The ROI for each subject was described asa sphere with a radius of 6 mmwithin the activated area located in theSMA and was restricted to within the activated voxels detected by thegroup analysis in the previous step. The center of the spherewas at thevoxel with the highest positive t-value. The mean time course of theROI for each subject was calculated by averaging the time series of allvoxels in the ROI.
Effective connectivity analysis
In this study, we only paid attention to the effective connectivity ofthe motor imagery condition; therefore, the other three phases(sequence informing, motor execution, and resting) in the time seriesof fMRI signals for each subject were excluded by regression. Severalother preprocessing steps for fMRI time series were implemented toreduce spurious variances. The detailed steps were as follows: first,regression of six head-motion parameters was performed. Morespecifically, each regional mean time series was corrected for theeffect of head movement by regression on the translations androtations estimated in the image realignment procedure. The residualsof these regressions constituted the set of the regional mean timeseries used for further analyses. Second, regression of the whole-brainsignal, obtained by averaging the time series of all voxels within thebrain to enhance the sensitivity and accuracy of the subsequent step,was performed. Third, the averaged time series of the sagittal sinusand the cerebrospinal fluid (CSF) were also regressed. The sagittalsinus were obtained for each subject by manually delineated thisregion and the CSF were obtained for each subject from theprobabilistic maps of CSF in SPM2. Furthermore, linear trends wereremoved from the data to eliminate the effect of gross signal drifts,which could be caused by scanner instabilities and/or grossphysiological changes in the subject.
Granger causality, proposed and formalized by Granger (1969,1980), is defined as follows: one series is said to have an influence on ifthe prediction of made by a linear model is improved wheninformation on is added. Geweke (1982) has proposed a measure oflinear dependence between and which implements of Grangercausality in terms of vector autoregressive models (see Appendix fordetails) (Goebel et al., 2003; Roebroeck et al., 2005). Exploringwhether and how two time series exert Granger causal influences on
1846 H. Chen et al. / NeuroImage 47 (2009) 1844–1853
each other is a topic which is becoming increasingly important (Gao etal., 2008; Goebel et al., 2003; Londei et al., 2007; Roebroeck et al.,2005; Seth, 2005; Sridharan et al., 2008; Uddin et al., 2009; Upadhyayet al., 2008; Wilke et al., 2009; Zhou et al., 2009). In the current study,Granger causality mapping for effective connectivity analysis wasperformed using an in-house program coded in MATLAB (TheMathworks, Natick, MA) in light of previous studies (Sridharan etal., 2008; Goebel et al., 2003; Roebroeck et al., 2005; Gao et al., 2008).More specifically, we used Granger causality to describe the effectiveconnectivity between the ROI (SMA) and all brain regions duringmotor imagery. The pre-processed mean time course for the ROI wasdefined as the seed time series x, and the time series y denotes thetime series of all voxels in the graymatter whichwas obtained for eachsubject from the probabilistic maps of in SPM2. Three components:
Fig.1. a. The activated areas during left-handmotor imagery obtained by group analysis usingduring right-hand motor imagery obtained by group analysis using SPM2. The FDR-based t
the linear direct influence of x on y (Fx→ y), the linear direct influenceof y on x (Fy→ x), and the instantaneous indirect influence between xand y (Fx·y) were calculated voxel by voxel for each subject (Sridharanet al., 2008; Goebel et al., 2003; Roebroeck et al., 2005; Gao et al.,2008). Thus, three Granger causality maps were generated based onthe influence measures.
Subsequently, a group analysis was employed by averaging theten maps of Fx→ y across ten subjects to obtain the averaged F−x→ y
map for Fx→ y, as well as for Fy→ x and Fx·y, in line with our previousstudy (Gao et al., 2008). Since the null distribution of the Fx→ y wasunknown, to assess the significance of Granger causality at thegroup-level, we used the framework of a nonparametric estimationbased on the bootstrap methodology (Efron and Tibshirani, 1993).This approach was widely employed in many fMRI studies
SPM2. The FDR-based thresholdwas set to q=0.05 (t-valueN3.5). b. The activated areashreshold was set to q=0.05 (t-value N3.7).
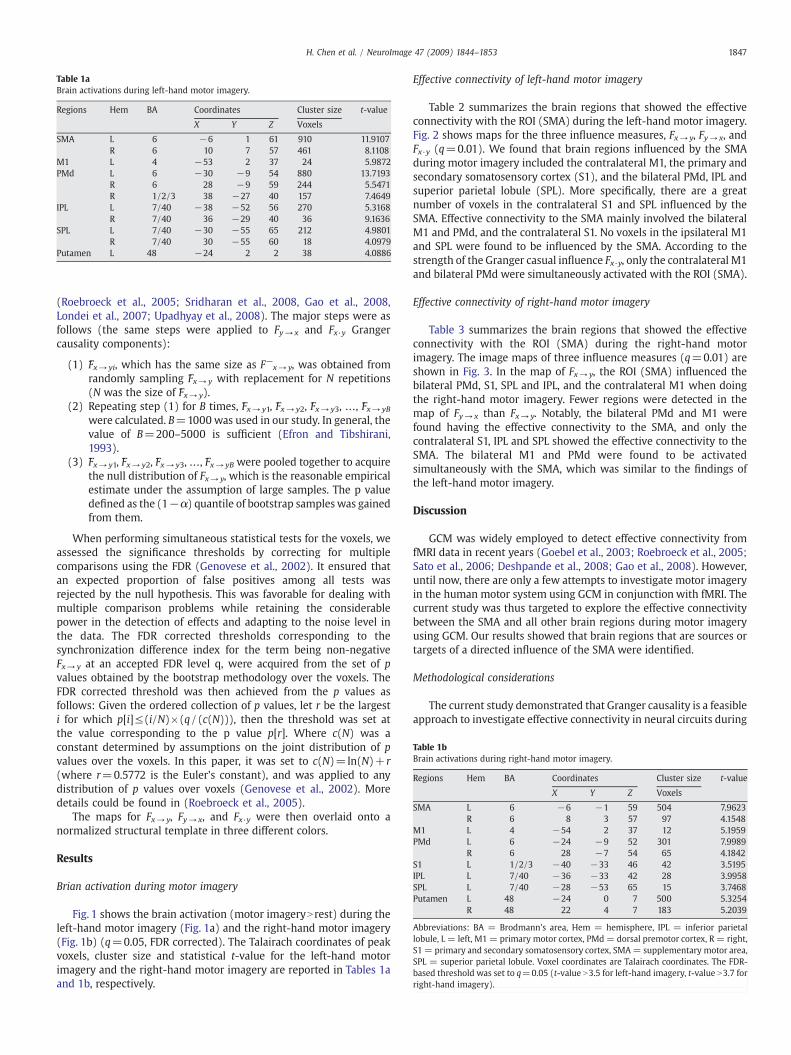
Table 1aBrain activations during left-hand motor imagery.
Regions Hem BA Coordinates Cluster size t-value
X Y Z Voxels
SMA L 6 −6 1 61 910 11.9107R 6 10 7 57 461 8.1108
M1 L 4 −53 2 37 24 5.9872PMd L 6 −30 −9 54 880 13.7193
R 6 28 −9 59 244 5.5471R 1/2/3 38 −27 40 157 7.4649
IPL L 7/40 −38 −52 56 270 5.3168R 7/40 36 −29 40 36 9.1636
SPL L 7/40 −30 −55 65 212 4.9801R 7/40 30 −55 60 18 4.0979
Putamen L 48 −24 2 2 38 4.0886
Table 1bBrain activations during right-hand motor imagery.
Regions Hem BA Coordinates Cluster size t-value
X Y Z Voxels
SMA L 6 −6 −1 59 504 7.9623R 6 8 3 57 97 4.1548
M1 L 4 −54 2 37 12 5.1959PMd L 6 −24 −9 52 301 7.9989
R 6 28 −7 54 65 4.1842S1 L 1/2/3 −40 −33 46 42 3.5195IPL L 7/40 −36 −33 42 28 3.9958SPL L 7/40 −28 −53 65 15 3.7468Putamen L 48 −24 0 7 500 5.3254
R 48 22 4 7 183 5.2039
Abbreviations: BA = Brodmann's area, Hem = hemisphere, IPL = inferior parietallobule, L = left, M1 = primary motor cortex, PMd= dorsal premotor cortex, R = right,S1= primary and secondary somatosensory cortex, SMA= supplementary motor area,SPL = superior parietal lobule. Voxel coordinates are Talairach coordinates. The FDR-based threshold was set to q=0.05 (t-value N3.5 for left-hand imagery, t-value N3.7 forright-hand imagery).
1847H. Chen et al. / NeuroImage 47 (2009) 1844–1853
(Roebroeck et al., 2005; Sridharan et al., 2008, Gao et al., 2008,Londei et al., 2007; Upadhyay et al., 2008). The major steps were asfollows (the same steps were applied to Fy→ x and Fx·y Grangercausality components):
(1) F̄x→ yi, which has the same size as F−x→ y, was obtained fromrandomly sampling F̄x→ y with replacement for N repetitions(N was the size of F̄x→ y).
(2) Repeating step (1) for B times, F̄x→ y1, F̄x→ y2, F̄x→ y3, …, F̄x→ yB
were calculated. B=1000 was used in our study. In general, thevalue of B=200–5000 is sufficient (Efron and Tibshirani,1993).
(3) F̄x→ y1, F̄x→ y2, F̄x→y3, …, F̄x→ yB were pooled together to acquirethe null distribution of Fx→ y, which is the reasonable empiricalestimate under the assumption of large samples. The p valuedefined as the (1−α) quantile of bootstrap sampleswas gainedfrom them.
When performing simultaneous statistical tests for the voxels, weassessed the significance thresholds by correcting for multiplecomparisons using the FDR (Genovese et al., 2002). It ensured thatan expected proportion of false positives among all tests wasrejected by the null hypothesis. This was favorable for dealing withmultiple comparison problems while retaining the considerablepower in the detection of effects and adapting to the noise level inthe data. The FDR corrected thresholds corresponding to thesynchronization difference index for the term being non-negativeFx→y at an accepted FDR level q, were acquired from the set of pvalues obtained by the bootstrap methodology over the voxels. TheFDR corrected threshold was then achieved from the p values asfollows: Given the ordered collection of p values, let r be the largesti for which p[i]≤(i/N)×(q/(c(N))), then the threshold was set atthe value corresponding to the p value p[r]. Where c(N) was aconstant determined by assumptions on the joint distribution of pvalues over the voxels. In this paper, it was set to c(N)=ln(N)+ r(where r=0.5772 is the Euler's constant), and was applied to anydistribution of p values over voxels (Genovese et al., 2002). Moredetails could be found in (Roebroeck et al., 2005).
The maps for Fx→ y, Fy→ x, and Fx·y were then overlaid onto anormalized structural template in three different colors.
Results
Brian activation during motor imagery
Fig. 1 shows the brain activation (motor imageryNrest) during theleft-hand motor imagery (Fig. 1a) and the right-hand motor imagery(Fig. 1b) (q=0.05, FDR corrected). The Talairach coordinates of peakvoxels, cluster size and statistical t-value for the left-hand motorimagery and the right-hand motor imagery are reported in Tables 1aand 1b, respectively.
Effective connectivity of left-hand motor imagery
Table 2 summarizes the brain regions that showed the effectiveconnectivity with the ROI (SMA) during the left-hand motor imagery.Fig. 2 shows maps for the three influence measures, Fx→ y, Fy→ x, andFx·y (q=0.01). We found that brain regions influenced by the SMAduring motor imagery included the contralateral M1, the primary andsecondary somatosensory cortex (S1), and the bilateral PMd, IPL andsuperior parietal lobule (SPL). More specifically, there are a greatnumber of voxels in the contralateral S1 and SPL influenced by theSMA. Effective connectivity to the SMA mainly involved the bilateralM1 and PMd, and the contralateral S1. No voxels in the ipsilateral M1and SPL were found to be influenced by the SMA. According to thestrength of the Granger casual influence Fx·y, only the contralateral M1and bilateral PMd were simultaneously activated with the ROI (SMA).
Effective connectivity of right-hand motor imagery
Table 3 summarizes the brain regions that showed the effectiveconnectivity with the ROI (SMA) during the right-hand motorimagery. The image maps of three influence measures (q=0.01) areshown in Fig. 3. In the map of Fx→ y, the ROI (SMA) influenced thebilateral PMd, S1, SPL and IPL, and the contralateral M1 when doingthe right-hand motor imagery. Fewer regions were detected in themap of Fy→ x than Fx→ y. Notably, the bilateral PMd and M1 werefound having the effective connectivity to the SMA, and only thecontralateral S1, IPL and SPL showed the effective connectivity to theSMA. The bilateral M1 and PMd were found to be activatedsimultaneously with the SMA, which was similar to the findings ofthe left-hand motor imagery.
Discussion
GCM was widely employed to detect effective connectivity fromfMRI data in recent years (Goebel et al., 2003; Roebroeck et al., 2005;Sato et al., 2006; Deshpande et al., 2008; Gao et al., 2008). However,until now, there are only a few attempts to investigate motor imageryin the human motor system using GCM in conjunction with fMRI. Thecurrent study was thus targeted to explore the effective connectivitybetween the SMA and all other brain regions during motor imageryusing GCM. Our results showed that brain regions that are sources ortargets of a directed influence of the SMA were identified.
Methodological considerations
The current study demonstrated that Granger causality is a feasibleapproach to investigate effective connectivity in neural circuits during
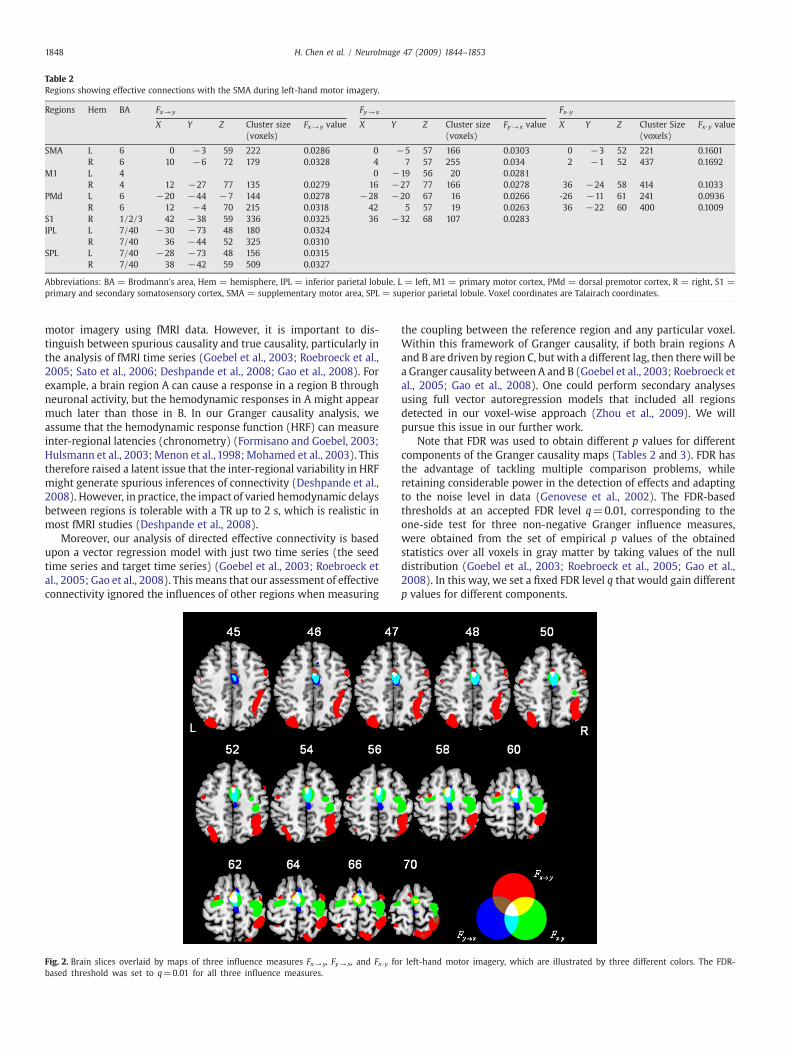
Table 2Regions showing effective connections with the SMA during left-hand motor imagery.
Regions Hem BA Fx→ y Fy→ x Fx·y
X Y Z Cluster size(voxels)
Fx→ y value X Y Z Cluster size(voxels)
Fy→ x value X Y Z Cluster Size(voxels)
Fx·y value
SMA L 6 0 −3 59 222 0.0286 0 −5 57 166 0.0303 0 −3 52 221 0.1601R 6 10 −6 72 179 0.0328 4 7 57 255 0.034 2 −1 52 437 0.1692
M1 L 4 0 −19 56 20 0.0281R 4 12 −27 77 135 0.0279 16 −27 77 166 0.0278 36 −24 58 414 0.1033
PMd L 6 −20 −44 −7 144 0.0278 −28 −20 67 16 0.0266 -26 −11 61 241 0.0936R 6 12 −4 70 215 0.0318 42 5 57 19 0.0263 36 −22 60 400 0.1009
S1 R 1/2/3 42 −38 59 336 0.0325 36 −32 68 107 0.0283IPL L 7/40 −30 −73 48 180 0.0324
R 7/40 36 −44 52 325 0.0310SPL L 7/40 −28 −73 48 156 0.0315
R 7/40 38 −42 59 509 0.0327
Abbreviations: BA = Brodmann's area, Hem = hemisphere, IPL = inferior parietal lobule, L = left, M1 = primary motor cortex, PMd = dorsal premotor cortex, R = right, S1 =primary and secondary somatosensory cortex, SMA = supplementary motor area, SPL = superior parietal lobule. Voxel coordinates are Talairach coordinates.
1848 H. Chen et al. / NeuroImage 47 (2009) 1844–1853
motor imagery using fMRI data. However, it is important to dis-tinguish between spurious causality and true causality, particularly inthe analysis of fMRI time series (Goebel et al., 2003; Roebroeck et al.,2005; Sato et al., 2006; Deshpande et al., 2008; Gao et al., 2008). Forexample, a brain region A can cause a response in a region B throughneuronal activity, but the hemodynamic responses in A might appearmuch later than those in B. In our Granger causality analysis, weassume that the hemodynamic response function (HRF) can measureinter-regional latencies (chronometry) (Formisano and Goebel, 2003;Hulsmann et al., 2003; Menon et al., 1998; Mohamed et al., 2003). Thistherefore raised a latent issue that the inter-regional variability in HRFmight generate spurious inferences of connectivity (Deshpande et al.,2008). However, in practice, the impact of varied hemodynamic delaysbetween regions is tolerable with a TR up to 2 s, which is realistic inmost fMRI studies (Deshpande et al., 2008).
Moreover, our analysis of directed effective connectivity is basedupon a vector regression model with just two time series (the seedtime series and target time series) (Goebel et al., 2003; Roebroeck etal., 2005; Gao et al., 2008). This means that our assessment of effectiveconnectivity ignored the influences of other regions when measuring
Fig. 2. Brain slices overlaid by maps of three influence measures Fx→y, Fy→ x, and Fx·y fobased threshold was set to q=0.01 for all three influence measures.
the coupling between the reference region and any particular voxel.Within this framework of Granger causality, if both brain regions Aand B are driven by region C, but with a different lag, then therewill bea Granger causality between A and B (Goebel et al., 2003; Roebroeck etal., 2005; Gao et al., 2008). One could perform secondary analysesusing full vector autoregression models that included all regionsdetected in our voxel-wise approach (Zhou et al., 2009). We willpursue this issue in our further work.
Note that FDR was used to obtain different p values for differentcomponents of the Granger causality maps (Tables 2 and 3). FDR hasthe advantage of tackling multiple comparison problems, whileretaining considerable power in the detection of effects and adaptingto the noise level in data (Genovese et al., 2002). The FDR-basedthresholds at an accepted FDR level q=0.01, corresponding to theone-side test for three non-negative Granger influence measures,were obtained from the set of empirical p values of the obtainedstatistics over all voxels in gray matter by taking values of the nulldistribution (Goebel et al., 2003; Roebroeck et al., 2005; Gao et al.,2008). In this way, we set a fixed FDR level q that would gain differentp values for different components.
r left-hand motor imagery, which are illustrated by three different colors. The FDR-
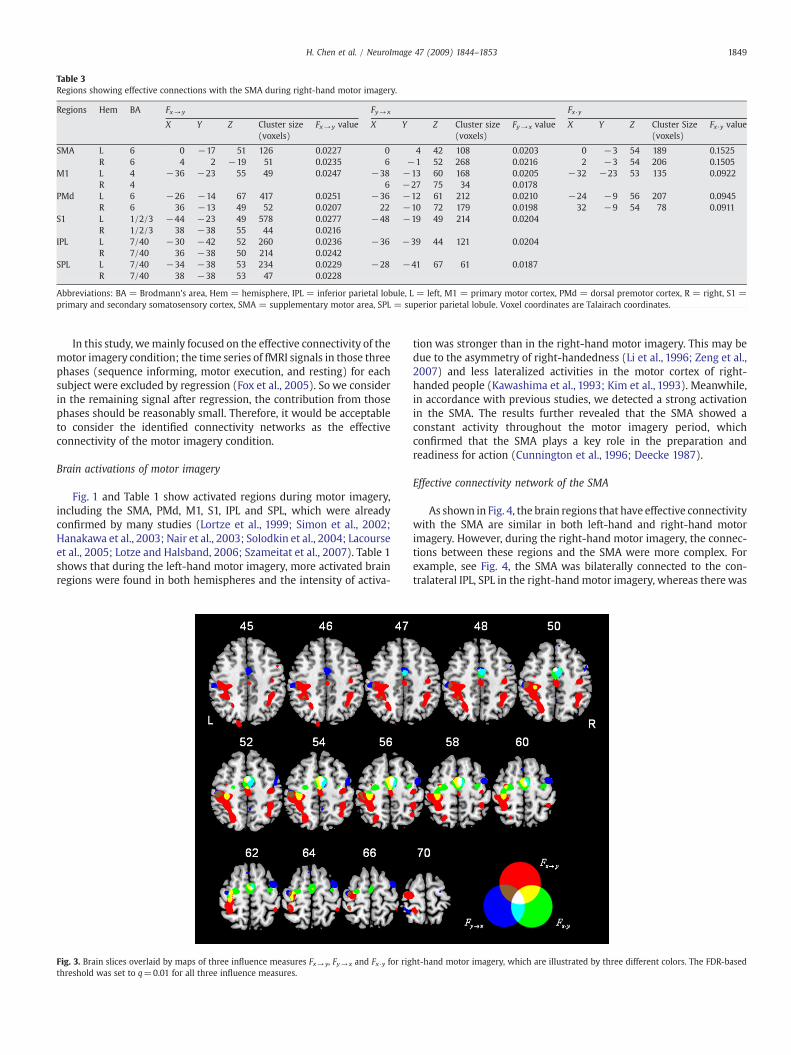
Table 3Regions showing effective connections with the SMA during right-hand motor imagery.
Regions Hem BA Fx→y Fy→ x Fx·y
X Y Z Cluster size(voxels)
Fx→y value X Y Z Cluster size(voxels)
Fy→ x value X Y Z Cluster Size(voxels)
Fx·y value
SMA L 6 0 −17 51 126 0.0227 0 4 42 108 0.0203 0 −3 54 189 0.1525R 6 4 2 −19 51 0.0235 6 −1 52 268 0.0216 2 −3 54 206 0.1505
M1 L 4 −36 −23 55 49 0.0247 −38 −13 60 168 0.0205 −32 −23 53 135 0.0922R 4 6 −27 75 34 0.0178
PMd L 6 −26 −14 67 417 0.0251 −36 −12 61 212 0.0210 −24 −9 56 207 0.0945R 6 36 −13 49 52 0.0207 22 −10 72 179 0.0198 32 −9 54 78 0.0911
S1 L 1/2/3 −44 −23 49 578 0.0277 −48 −19 49 214 0.0204R 1/2/3 38 −38 55 44 0.0216
IPL L 7/40 −30 −42 52 260 0.0236 −36 −39 44 121 0.0204R 7/40 36 −38 50 214 0.0242
SPL L 7/40 −34 −38 53 234 0.0229 −28 −41 67 61 0.0187R 7/40 38 −38 53 47 0.0228
Abbreviations: BA = Brodmann's area, Hem = hemisphere, IPL = inferior parietal lobule, L = left, M1 = primary motor cortex, PMd = dorsal premotor cortex, R = right, S1 =primary and secondary somatosensory cortex, SMA = supplementary motor area, SPL = superior parietal lobule. Voxel coordinates are Talairach coordinates.
1849H. Chen et al. / NeuroImage 47 (2009) 1844–1853
In this study, wemainly focused on the effective connectivity of themotor imagery condition; the time series of fMRI signals in those threephases (sequence informing, motor execution, and resting) for eachsubject were excluded by regression (Fox et al., 2005). So we considerin the remaining signal after regression, the contribution from thosephases should be reasonably small. Therefore, it would be acceptableto consider the identified connectivity networks as the effectiveconnectivity of the motor imagery condition.
Brain activations of motor imagery
Fig. 1 and Table 1 show activated regions during motor imagery,including the SMA, PMd, M1, S1, IPL and SPL, which were alreadyconfirmed by many studies (Lortze et al., 1999; Simon et al., 2002;Hanakawa et al., 2003; Nair et al., 2003; Solodkin et al., 2004; Lacourseet al., 2005; Lotze and Halsband, 2006; Szameitat et al., 2007). Table 1shows that during the left-hand motor imagery, more activated brainregions were found in both hemispheres and the intensity of activa-
Fig. 3. Brain slices overlaid by maps of three influence measures Fx→y, Fy→ x and Fx·y for rigthreshold was set to q=0.01 for all three influence measures.
tion was stronger than in the right-hand motor imagery. This may bedue to the asymmetry of right-handedness (Li et al., 1996; Zeng et al.,2007) and less lateralized activities in the motor cortex of right-handed people (Kawashima et al., 1993; Kim et al., 1993). Meanwhile,in accordance with previous studies, we detected a strong activationin the SMA. The results further revealed that the SMA showed aconstant activity throughout the motor imagery period, whichconfirmed that the SMA plays a key role in the preparation andreadiness for action (Cunnington et al., 1996; Deecke 1987).
Effective connectivity network of the SMA
As shown in Fig. 4, the brain regions that have effective connectivitywith the SMA are similar in both left-hand and right-hand motorimagery. However, during the right-hand motor imagery, the connec-tions between these regions and the SMA were more complex. Forexample, see Fig. 4, the SMA was bilaterally connected to the con-tralateral IPL, SPL in the right-hand motor imagery, whereas there was
ht-hand motor imagery, which are illustrated by three different colors. The FDR-based
Fig. 4. Networks underlying left-hand motor imagery and right-hand motor imagery. These colored and directed arrows depict the strength and direction of effective connectionsduring the two experimental conditions. The numbers next to the arrows refer to the strength of the connectivity. Note the three loops of effective connectivity among the SMA andbilateral PMd, contralateral S1 and contralateral M1. Abbreviations: SMA = supplementary motor area, PMd = dorsal premotor cortex, M1 = primary motor cortex, S1 = primaryand secondary somatosensory cortex, SPL = superior parietal lobule, IPL = inferior parietal lobule.
1850 H. Chen et al. / NeuroImage 47 (2009) 1844–1853
only effective connectivity from the SMA to those two regions in theleft-handmotor imagerywhichmaysuggest that performing the right-handmotor imagery recruitedmore connectivity in brain regions thanthe left-hand motor imagery. Furthermore, the strength of causalconnection to the SMA in some brain regions during the left-handmotor imagery was much stronger than in the right-hand motorimagery. This asymmetry of effective connectivity networkmayalso beexplained by the asymmetry of right-handedness, but further work isrequired to address this issue comprehensively.
The bilateral connections between the SMA and regions includingthe PMd, M1, S1, IPL and SPL further suggested that there may be anintrinsic causal connection network for the SMA, which is similar tothe phenomenon that an intrinsic spontaneous reflects a low-frequency synchronous neuronal oscillations inmotor network duringthe resting-state (Biswal et al., 1995).
More importantly, three types of forward and backward effectiveconnectivity were found between the SMA and the bilateral PMd, thecontralateral M1 and S1 during both the left- and right-hand motorimagery (Fig. 4). This might indicate that there were loops ofinformation flow for motor imagery between the brain regions statedabove.
Effective connection between the SMA and bilateral PMd
Our results showed a great consistency for the network betweenthe SMA and the bilateral PMd during both left- and right-handmotor imagery. For motor imagery with either hand, there wereforward and backward effective connections between the SMA andthe bilateral PMd (Fig. 4). It may suggest that during motor imagery,the PMd first had influence on the SMA, then the information wastransferred back to the PMd (Matsumoto et al., 2007). Using cortico-cortical-evoked potentials, Matsumoto et al. (2007) found that therewere reciprocal connections between the upper extremity of theSMA and that of the precentral motor area. Similarly, in anatomicalstudies of nonhuman primates, there were some evidence suggestinga connection between the bilateral PMd and the SMA and thepossible existence of commissural fibers between them (Marconi etal., 2003). More particularly, only the PMd received strong inputs
from the visual areas of the parietal–occipital region (Marconi et al.,2001; Simon et al., 2002). Although the PMd in the left hemisphere isdominant in preparation and selection of actions (Rushworth et al.,2003; Koch et al., 2006), which was also confirmed in study usingtranscranial magnetic stimulation (Johansen-Berg et al., 2002), theloop of effective connectivity was found between the left and rightPMd and SMA. According to our previous study (Gao et al., 2008)that reported a causal connection between the left and righthemisphere, the loop of effective connectivity may be interpretedas an intrinsic causal connection network between the SMA andbilateral PMd. This was suggested by the similar phenomenon that anintrinsic spontaneous reflecting low-frequency synchronous neuro-nal oscillations exists in motor network during the resting-state(Biswal et al., 1995).
Some studies in non-primate have proposed that the caudal partof the PMd (F2) sends substantial projections to the M1 (F1) anddirectly to the spinal cord. Another study of networks involved inmuscle imagery (Solodkin et al., 2004) further revealed a weakeffective connectivity from the PMd to the M1. However, other non-primate studies suggested that the rostral part of the PMd (F7) wasclosely interconnected with the prefrontal cortex rather than theM1 (F1) (Luppino et al., 1990; He et al., 1993; Matsumoto et al.,2007). Since the PMd was not chosen as a ROI in our study, theeffective connectivity between the PMd and other regions duringmotor imagery remains unclear. Further study is needed to clarifythis issue.
Effective connection between the SMA and contralateral M1
The involvement of M1 in motor imagery was reported con-troversially. In some studies, the activation of M1 was either notdetected, or there was only transient activation found during motorimagery (Hanakawa et al., 2003; Dechent et al., 2004), However,other fMRI studies suggested that M1 was significantly excited(Lortze et al., 1999; Gerardin et al., 2000; Nair et al., 2003; Solodkinet al., 2004; Lotze and Halsband, 2006; Szameitat et al., 2007; Kasesset al., 2008). Moreover, in the study of Solodkin et al. (2004), anetwork between the SMA and M1 was found during kinesthetic
1851H. Chen et al. / NeuroImage 47 (2009) 1844–1853
motor imagery. This result was confirmed by Kasess et al. (2008)using DCM, showing that besides a suppressive influence that SMAhas on M1 during motor imagery, there is a feedback circuit from M1to the SMA. Our results further confirmed the existence of theforward and backward circuit between the SMA and M1, anddemonstrated that the circuit was mainly present between theSMA and the contralateral M1 during both the left- and right-handmotor imagery (Fig. 4). There were anatomic studies reporting thatthe SMAs were reciprocally connected and each projected to bothcontralateral and ipsilateral primary motor areas (Muakkassa andStrick, 1979; Pandya and Vignolo, 1971).
Effective connection between the SMA and contralateral S1
Another loop of effective connection was found within the SMAand contralateral S1 either during the left- or right-hand motorimagery (Fig. 4). This finding was supported by the study ofMatsumoto et al. (2007), which detected a bi-directional connectivitybetween the SMA and S1. Solodkin et al. (2004) also found that S1 wasinfluenced by the SMA. However, a few studies of motor imagery haveconsidered that S1 only participates in motor execution (Lortze et al.,1999; Galdo-Álvarez and Carrillo-de-la-Peña, 2004). Some otherstudies on motor execution stated that the SMA activity occurs beforethe S1 activity (Deecke 1987; Rogers et al., 2004). The contradictoryresults between our experiment and others may be explained by thefact that the information transformation pattern between the SMAand S1 duringmotor imagery differs from that duringmotor execution(Gao et al., 2008).
Effective connection between the SMA and IPL, SPL
Another effective connectivity exists between the SMA and IPL(Fig. 4). This conjunction is consistent with the findings of previousneurophysiological studies, which showed matching patterns ofneuronal activity within the frontal and parietal cortices (Gerardinet al., 2000). As shown in the studies of monkeys (Chafee andGoldman-Rakic, 1998, 2000), the human frontal and parietal areasare organized as a tightly coupled functional system with highlyspecific connections between their respective anatomical subdivi-sions (Gerardin et al., 2000). Moreover, the parietal cortex has beenfound to play a role in generating mental movement representationconfirmed by neuropsychological examination (Sirigu et al., 1996;Hanakawa et al., 2003), and in sensorimotor mapping of temporaland spatial relations (Ramnani and Passingham, 2001; Lacourse et al.,2005). The connectivity between the SMA and SPL revealed by ourexperiment was further supported by the study of Rizzolatti et al.(1998). It demonstrated that the area F3 of the monkey brain that ishomologous to the SMA in humans, was strongly connected with theSPL. Some other studies also suggested that the IPL and SPL wereactive during a finger sequence learning task (Toni and Passingham,1999; Doyon et al., 2002; Lacourse et al., 2005), and the SPL wasreported to be more activated when the task became harder. Sincethe motor imagery of finger tapping was a complex task to someextent, we therefore consider it was capable to detecting theactivation in the SPL and IPL and their effective connectivity withthe SMA.
Conclusion
In the current study, we applied the Granger causality analysis towhole-brain fMRI data to investigate the effective connectivitybetween the SMA and other brain regions during motor imagery.Several regions were detected to have effective connectivity with theSMA. More specifically, we have found that during both the right- andleft-hand motor imagery, there were forward and backward connec-tions between the SMA and the bilateral PMd, the contralateral M1
and S1. We further discovered forward connections from the SMA tothe bilateral SPL and IPL, and backward connections from theipsilateral M1 to the SMA. Importantly, more brain regions showingeffective connections to the SMA were involved in the right-handmotor imagery than in the left-hand motor imagery, but most casualconnections during the left-hand motor imagery were stronger thanthe right-hand imagery. These results provided an integrated andinteractive view of the brain network during motor imagery.
Acknowledgments
We thank Matthew Brett for his Matlab routines (mni2tal.m). Thiswork was supported by NSFC# 90820006 and 30770590; Key researchproject of Science and Technology of MOE (107097); 863 Program No:2008AA02Z408.
Appendix. Calculation of Granger causality
Geweke (1982) has proposed a measure of linear dependencebetween and which implements Granger causality in terms ofvector autoregressive models. Consider the case of K-dimensionalXt and L-dimensional Yt as:
Xt =Xpj=1
a1jXt− j + e1t ; var e1tð Þ = Σ1 ð1Þ
Yt =Xpj=1
d1jXt− j + η1t ; var η1t� �
= C1: ð2Þ
Jointly, they are represented as:
Xt =Xpj=1
a1jXt− j +Xpj=1
b2jYt− j + e2t ; ð3Þ
Yt =Xpj=1
c2jXt− j +Xpj=1
d2jYt− j + η2t ; ð4Þ
where the residual noise terms are uncorrelated over time and theircontemporaneous covariance matrix is:
X= Σ2 C
C C2
� �: ð5Þ
The entries are defined as Σ2=var(ɛ2t), Γ2=var(η2t) and C=cov(ɛ2t, η2t). Where Σ1 and Σ2 have a dimension of K by K, Γ1 and Γ2 are Lby L, and Σ is M by M (with M=K+L). Although both Xt and Yt canbe vector time series, they are both scalar time series in theseinvestigations, that is, K=L=1. The residual noise terms Σ1, Σ2, and Σ,quantify how well we are able to predict current values of x and yfrom their past values. The measures of total linear influencedependence between x and y, linear influence from x to y, linearinfluence from y to x, and instantaneous influence between x and yare defined as follows (Geweke, 1982):
Fx;y = lnjΣ1 j � jC1 j
jΣ j� �
ð6Þ
FxYy = lnjC1 jjC2 j
� �ð7Þ
FyYx = lnjΣ1 jjΣ2 j
� �ð8Þ
Fx�y = lnjΣ2 j � jC2 j
jΣ j� �
ð9Þ
1852 H. Chen et al. / NeuroImage 47 (2009) 1844–1853
where | · | denotes the determinant of the enclosed matrix. Accordingto the definitions, it holds that:
Fx;y = FxYy + FyYx + Fx�y: ð10Þ
It is clear that Fy→ x=0when there is no causal influence from y tox and Fy→ xN0 when there is. In other words, the value of Σ1 measuresthe accuracy of the autoregressive prediction of x based on itsprevious values, whereas the value of Σ2 represents the accuracy ofpredicting the present value of x based on the previous values of bothx and y. If Σ2 is less than Σ1 in some suitable statistical sense, then y issaid to have a causal influence on x. A similar interpretation holds forFy→ x. Thus, the two directed components, Fx→ y and Fy→ x, use thearrow of time to decide on the direction of influence. However, thetotal linear dependence (Fx, y) between x and y cannot be fullyexplained by these directed components. Much of the total lineardependence (Fx, y) can be contained in the instantaneous influenceFx·y between them, which is captured by Σ and the covariance matrixbetween ɛ2t and η2t. When C is zero, Fx·y is also zero. When C is notzero, Fx·yN0.
References
Biswal, B., Yetkin, F.Z., Haughton, V.M., Hyde, J.S.,1995. Functional connectivity in themotorcortex of resting human brain using echo-planarMRI.Magn. Reson.Med. 34, 357–541.
Chafee, M.V., Goldman-Rakic, P.S., 1998. Matching patterns of activity in primateprefrontal area 8a and parietal area 7ip neurons during a spatial working memorytask. J. Neurophysiol. 79, 2919–2940.
Chafee, M.V., Goldman-Rakic, P.S., 2000. Inactivation of parietal and prefrontal cortexreveals interdependence of neural activity during memory-guided saccades.J. Neurophysiol. 83, 1550–1566.
Cunnington, R., Bradshaw, J.L., Lansek, R., 1996. The role of the supplementary motorarea in the control of voluntary movement. Hum. Mov. Sci. 15, 627–647.
Dechent, P., Mérboldt, K., Frahm, J., 2004. Is the human primarymotor cortex involved inmotor imagery? Brain Res. Cogn. Brain Res. 19, 138–144.
Deecke, L., 1987. Bereitschafts potential as an indicator of movement preparation insupplementary motor area and motor cortex. Ciba Lound. Symp. 132, 231–250.
Deshpande, G., Hu, X., Stilla, R., Sathian, K., 2008. Effective connectivity during hapticperception. A study using Granger causality analysis of functional magneticresonance imaging data. NeuroImage 40, 1014–1807.
Doyon, J., Song, A.W., Karni, A., Lalonde, F., Adams, M.M., Ungerleider, L.G., 2002.Experience-dependent changes in cerebellar contributions to motor sequencelearning. Proc. Natl. Acad. Sci. U. S. A. 99, 1017–1022.
Efron, B., Tibshirani, R.J., 1993. An Introduction to the Bootstrap. Chapman and Hall, NewYork.
Formisano, E., Goebel, R., 2003. Tracking cognitive processes with functional MRImental chronometry. Curr. Opin. Neurobiol. 13, 174–181.
Fox, M.D., Snyder, A.Z., Vincent, J.L., Corbertta, M., Van Essen, D.C., Raichle, M.E., 2005.The human brain is intrinsically organized into dynamic, anticorrelated functionalnetworks. Proc. Natl. Acad. Sci. U. S. A. 2005, 9673–9678.
Friston, K.J., Frith, C.D., Frackowiak, R.S.J., 1993. Time-dependent changes in effectiveconnectivity measured with PET. Hum. Brain Mapp. 13, 69–79.
Friston, K.J., Harrison, L., Penny, W., 2003. Dynamic causal modelling. NeuroImage 6,218–229.
Galdo-Álvarez, S., Carrillo-de-la-Peña, M.T., 2004. ERP evidence of MI activationwithoutmotor response execution. NeuroReport 15, 2067–2070.
Gao, Q., Chen, H., Gong, Q., 2008. Evaluation of the effective connectivity of thedominant primary motor cortex during bimanual movement using Grangercausality. Neurosci. Lett. 443, 1–6.
Genovese, C.R., Lazar, N.A., Nichols, T., 2002. Thresholding of statistical mapsin functional neuroimaging using the false discovery rate. NeuroImage 15, 870–878.
Gerardin, E., Sirigu, A., Lehericy, S., Poline, J., Gaymard, B., Marsault, C., Agid, Y., Bihan,D.L., 2000. Partially overlapping neural networks for real and imagined handmovements. Cereb. Cortex 10, 1093–1104.
Geweke, J.F., 1982. Measurement of linear dependence and feedback between multipletime series. J. Am. Stat. Assoc. 77, 304–324.
Goebel, R., Roebroeck, A., Kim, D., Formisano, E., 2003. Investigating directed corticalinteractions in time-resolved fMRI data using vector autoregressive modeling andGranger causality mapping. Magn. Reson. Imaging 21, 1251–1261.
Granger, C.W.J., 1969. Investigating causal relations by econometric models and cross-spectral methods. Econometrica 37, 424–438.
Granger, C.W.J., 1980. Testing for causality: a personal viewpoint. J. Econ. Dyn. Control. 2,329–352.
Hanakawa, T., Immisch, I., Toma, K., Dimyan, M.A., Van Gelderen, P., Hallett, M., 2003.Functional properties of brain areas associated with motor execution and imagery.J. Neurophysiol. 83, 989–1002.
He, S.Q., Dum, R.P., Strick, P.L., 1993. Topographic organization of corticospinalprojections from the frontal lobe: motor areas on the lateral surface of thehemisphere. J. Neurosci. 13, 952–980.
Hulsmann, E., Erb, M., Grodd, W., 2003. From will to action: sequential cerebellarcontributions to voluntary movement. NeuroImage 20, 1485–1492.
Jeannerod, M., 1995. Mental imagery in the motor context. Neuropsychologia 33,1419–1432.
Johansen-Berg, H., Rushworth, M.F., Bogdanovic, M.D., Kischka, U., Wimalaratna, S.,Matthews, P.M., 2002. The role of ipsilateral premotor cortex in hand movementafter stroke. Proc. Natl. Acad. Sci. U. S. A. 99, 14518–14523.
Kasess, C.H., Windischberger, C., Cunnington, R., Lanzenberger, R., Pezawas, L., Moser, E.,2008. The suppressive influence of SMA on M1 in motor imagery revealed by fMRIand dynamic causal modeling. NeuroImage 40, 828–837.
Kawashima, R., Yamada, K., Kinomura, S., Yamaguchi, T., Matsui, H., Yoshioka, S., Fukuda,H., 1993. Regional cerebral blood flow changes of cortical motor areas andprefrontal areas in humans related to ipsilateral and contralateral hand movement.Brain Res. 623, 33–40.
Kim, S.G, Ashe, J., Hendrich, K., Ellermann, J.M., Merkle, H., Ugurbil, K., Georgopoulos,A.P., 1993. Functional magnetic resonance imaging of motor cortex: hemisphericasymmetry and handedness. Science 261, 615–617.
Kimberley, T.J, Khandekar, G, Skraba, L.L., Spencer, J.A., Van Gorp, E.A., Walker, S.R., 2006.Neural substrates for motor imagery in severe hemiparesis. NeurorehabilitationNeural Repair 20, 268–277.
Koch, G., Franca, M., Olmo, M.F.D., Cheeran, B., Milton, R., Sauco, M.A, Rothwell, J.C.,2006. Time course of functional connectivity between dorsal premotor andcontralateral motor cortex during movement selection. J. Neurosci. 26,7452–7459.
Lacourse, M.G., Orr, E.L., Cramer, S.C., Cohen, M.J., 2005. Brain activation duringexecution and motor imagery of novel and skilled sequential hand movements.NeuroImage 27, 505–519.
Li, A., Yetkin, F.Z., Cox, R., Haughton, V.M., 1996. Ipsilateral hemisphere activation duringmotor and sensory tasks. AJNR Am. J. Neuroradiol. 17, 651–655.
Londei, A., D'Ausilio, A., Basso, D., Sestieri, C., Del Gratta, C., Romani, G.L., OlivettiBelardinelli, M., 2007. Brain network for passive word listening as evaluated withICA and Granger causality. Brain Res. Bull. 72, 284–292.
Lotze, M., Halsband, U., 2006. Motor imagery. J. Phys. Paris 99, 386–395.Lortze, M., Montoya, P., Erb, M., Hülsmann, E., Flor, H., Klose, U., Birbaumer, N.,
Grodd, W., 1999. Activation of cortical and cerebellar motor areas duringexecuted and imagined hand movements: an fMRI study. J. Cogn. Neurosci. 11,491–501.
Luppino, G., Matelli, M., Rizzolatti, G., 1990. Cortico-cortical connections of twoelectrophysiologically identified arm representations in the mesial agranularfrontal cortex. Exp. Brain Res. 82, 214–218.
Malouin, F., Richards, C.L., Doyon, J., Desrosiers, J., Belleville, S., 2004. Training mobilitytasks after stroke with combined mental and physical practice: a feasibility study.Neurorehabilitation Neural Repair 18, 66–75.
Marconi, B., Genovesio, A., Battaglla-Mayer, A., Ferraina, S., Squatrito, S., Molinari, M.,Lacquaniti, F., Camimiti, R., 2001. Eye-hand coordination during reaching. I.Anatomical relationships between parietal and frontal cortex. Cereb. Cortex 11,513–527.
Marconi, B., Genovesio, A., Giannetti, S., Molinari, M., Caminiti, R., 2003. Callosalconnections of dorso-lateral premotor cortex. Eur. J. Neurosci. 18, 775–788.
Matsumoto, R., Nair, D.R., LaPresto, E., Bingaman, W., Shibasaki, H., Lüders, H.O., 2007.Functional connectivity in human cortical motor system: a cortico-cortical evokedpotential study. Brain 130, 181–197.
Menon, R.S., Luknowsky, D.C., Gati, J.S., 1998. Mental chronometry using latency-resolved functional MRI. Proc. Natl. Acad. Sci. U. S. A. 95, 10902–10907.
Michelon, P., Vettel, M.J., Zacks, J.M., 2006. Lateral somatotopic organization duringimagined and prepared movements. J. Neurophysiol. 95, 811–822.
Mohamed, M.A., Yousem, D.M., Tekes, A., Browner, N.M., Calhoun, V.D., 2003. Timing ofcortical activation: a latency-resolved event-related functional MR imaging study.AJNR Am. J. Neuroradiol. 24, 1967–1974.
Muakkassa, K.F., Strick, P.L., 1979. Frontal lobe inputs to primate motor cortex: evidencefor four somatotopically organized ‘premotor’ area. Brain Res. 177, 176–182.
Nair, D.G., Purkott, K.L., Fuchs, A., Steinberg, F., Kelso, J.A.S., 2003. Cortical and cerebellaractivity of the human brain during imagined and executed unimanual andbimanual movement sequences. A functional MRI study. Cogn. Brain Res. 15,250–260.
Pandya, D.N., Vignolo, L.A., 1971. Intra- and interhemispheric projections of theprecentral, premotor and arcuate areas in the rhesus monkey. Brain Res. 26,217–233.
Penny, W.D., Holmes, A.P., Friston, K.J., 2003. Random effects analysis, In: Frackowiak,RSJ, Friston, K.J., Frith, C., Dolan, R., Friston, K.J., Price, C.J., Zeki, S., Ashburner, J.,Penny, W.D. (Eds.), Human Brain Function, 2nd ed. Academic Press.
Porro, C.A., Francescato, M.P., Cettolo, V., Diamond, M.E., Baraldi, P., Zuiani, C.H.,Bazzocchi, M., di Prampero, P.E., 1996. Primary motor and sensory cortex activationduring motor performance and motor imagery: a functional magnetic resonanceimaging study. J. Neurosci. 16, 7688–7698.
Ramnani, N., Passingham, R.E., 2001. Changes in the human brain during rhythmlearning. J. Cogn. Neurosci. 13, 952–966.
Rizzolatti, G., Luppino, G., Matteli, M., 1998. The organization of the cortical motorsystem: new concepts. Electroencephalogr. Clin. Neurophysiol. 106, 283–296.
Roebroeck, A., Formisano, E., Goebel, R., 2005. Mapping directed influence over thebrain using Granger causality and fMRI. NeuroImage 25, 230–242.
Rogers, B.P, Carew, J.D, Meyerand, M.E., 2004. Hemispheric asymmetry in supplemen-tary motor area connectivity during unilateral finger movements. NeuroImage 22,855–859.
Rushworth, M.F, Johansen-Berg, H., Gobel, S.M., Devlin, J.T., 2003. The left parietal andpremotor cortices: motor attention and selection. NeuroImage 20, S89–S100.

1853H. Chen et al. / NeuroImage 47 (2009) 1844–1853
Sato, R.J., Junior, E.A., Takahashi, D.Y, Felix, M.M, Brammer, M.J., Morettin, P.A., 2006. Amethod to produce evolving functional connectivity maps during the course of anfMRI experiment using wavelet-based time-varying Granger causality. NeuroImage31, 187–196.
Seth, A.K., 2005. Causal connectivity of evolved neural networks during behavior.Network 16, 35–54.
Simon, S.R., Meunier, M., Piettre, L., Berardi, A.M., Segebarth, C.M., Boussaoud, D., 2002.Spatial attention and memory versus motor preparation: premotor cortexinvolvement as revealed by fMRI. J. Neurophysiol. 88, 2047–2057.
Sirigu, A., Duhamel, J.R., Cohen, L., Pillon, B., Dubois, B., Agid, Y., 1996. The mentalrepresentation of hand movements after parietal cortex damage. Science 273,1564–1568.
Solodkin, A., Hlustik, P., Chen, E.E., Small, S.L., 2004. Fine modulation in networkactivation duringmotor execution andmotor imagery. Cereb. Cortex 14,1246–1255.
Sridharan, D., Levitin, D.J., Menon, V., 2008. A critical role for the right fronto-insularcortex in switching between central-executive and default-mode networks. Proc.Natl. Acad. Sci. U. S. A. 105, 12569–12574.
Szameitat, A.J., Shen, S., Sterr, A., 2007. Motor imagery of complex everydaymovements.An fMRI study. NeuroImage 34, 702–713.
Talairach, J., Tournoux, P., 1988. Co-planar Stereotaxic Atlas of the Brain. Thieme,New York.
Toni, I., Passingham, R.E., 1999. Prefrontal-basal ganglia pathways are involved in thelearning of arbitrary visuomotor associations: a PET study. Exp. Brain Res. 127,19–32.
Uddin, L.Q., Clare Kelly, A.M., Biswal, B.B., Xavier Castellanos, F., Milham, M.P., 2009.Functional connectivity of default mode network components: correlation, antic-orrelation, and causality. Hum. Brain Mapp. 30, 625–637.
Upadhyay, J., Silver, A., Knaus, T.A., Lindgren, K.A., Ducros, M., Kim, D.S., Tager-Flusberg, H., 2008. Effective and structural connectivity in the human auditorycortex. J. Neurosci. 28, 3341–3349.
Wilke, M., Lidzba, K., Krageloh-Mann, I., 2009. Combined functional and causalconnectivity analyses of language networks in children: a feasibility study. BrainLang. 108, 22–29.
Zeng, L., Chen, H., Ouyang, L., Yao, D., Gao, J-H., 2007. Quantitative analysis of asymmetrycortical activity in motor area during sequential finger movement. Magn. Reson.Imaging 25, 1370–1375.
Zhou, Z., Chen, Y., Ding, M., Wright, P., Lu, Z., Liu, Y., 2009. Analyzing brain networks withPCA and conditional Granger causality. Hum. Brain Mapp. 30, 2197–2206.