The Bolivian Hydrocarbon Revenue Sharing System and its Impact on Territorial Inequalities
Upload
independentCategory
view
0download
0
The Genetic History of Indigenous Populations of thePeruvian and Bolivian Altiplano: The Legacy of the UrosJose Raul Sandoval1,2, Daniela R. Lacerda1, Marilza S. A. Jota1, Alberto Salazar-Granara2,
Pedro Paulo R. Vieira1, Oscar Acosta2, Cinthia Cuellar3, Susana Revollo3, Ricardo Fujita2,
Fabrıcio R. Santos1*, and The Genographic Project Consortium"
1 Universidade Federal de Minas Gerais (UFMG), Belo Horizonte, MG, Brazil, 2 Universidad San Martin de Porres (USMP), Lima, Peru, 3 Universidad Mayor de San Andres
(UMSA), La Paz, Bolivia
Abstract
The Altiplano region of the South American Andes is marked by an inhospitable climate to which the autochthonoushuman populations adapted and then developed great ancient civilizations, such as the Tiwanaku culture and the IncaEmpire. Since pre-Columbian times, different rulers established themselves around the Titicaca and Poopo Lakes. By thetime of the arrival of Spaniards, Aymara and Quechua languages were predominant on the Altiplano under the rule of theIncas, although the occurrence of other spoken languages, such as Puquina and Uruquilla, suggests the existence ofdifferent ethnic groups in this region. In this study, we focused on the pre-Columbian history of the autochthonousAltiplano populations, particularly the Uros ethnic group, which claims to directly descend from the first settlers of theAndes, and some linguists suggest they might otherwise be related to Arawak speaking groups from the Amazon. Usingphylogeographic, population structure and spatial genetic analyses of Y-chromosome and mtDNA data, we inferred thegenetic relationships among Uros populations (Los Uros from Peru, Uru-Chipaya and Uru-Poopo from Bolivia), andcompared their haplotype profiles with eight Aymara, nine Quechua and two Arawak (Machiguenga and Yanesha) speakingpopulations from Peru and Bolivia. Our results indicated that Uros populations stand out among the Altiplano populations,while appearing more closely related to the Aymara and Quechua from Lake Titicaca and surrounding regions than to theAmazon Arawaks. Moreover, the Uros populations from Peru and Bolivia are genetically differentiated from each other,indicating a high heterogeneity in this ethnic group. Finally, our results support the distinctive ancestry for the Urospopulations of Peru and Bolivia, which are likely derived from ancient Andean lineages that were partially replaced duringmore recent farming expansion events and the establishment of complex civilizations in the Andes.
Citation: Sandoval JR, Lacerda DR, Jota MSA, Salazar-Granara A, Vieira PPR, et al. (2013) The Genetic History of Indigenous Populations of the Peruvian andBolivian Altiplano: The Legacy of the Uros. PLoS ONE 8(9): e73006. doi:10.1371/journal.pone.0073006
Editor: David Caramelli, University of Florence, Italy
Received February 27, 2013; Accepted July 22, 2013; Published September 11, 2013
Copyright: � 2013 Sandoval et al. This is an open-access article distributed under the terms of the Creative Commons Attribution License, which permitsunrestricted use, distribution, and reproduction in any medium, provided the original author and source are credited.
Funding: This work was supported by grants from the National Geographic Society, IBM, and the Waitt Family Foundation (USA) and FAPEMIG (Fundacao deAmparo a Pesquisa do estado de Minas Gerais), and (Conselho Nacional de Desenvolvimento Cientıfico e Tecnologico) CNPq (Brazil). This work is part of theGenographic Project, where the project Consortium participate in the sampling, data gathering design, results, discussion and in the preparation of themanuscript.
Competing Interests: The authors, including all authors from universities, institutes, and private companies declare that they followed all ethical guidelines andthere is no financial conflict of interest that might be construed to influence the results or interpretation of this manuscript. The participation of authors of privatecompanies like IBM does not alter the authors’ adherence to all the PLOS ONE policies on sharing data and materials.
* E-mail: [email protected]
" Membership of The Genographic Project Consortium is provided in the Acknowledgments.
Introduction
Since pre-Columbian times, the inhabitants of the Altiplano
region in the South American Andes (between southern Peru,
western Bolivia, and northern Chile and Argentina) have been
engaged in agriculture, raising livestock and fishing. The Altiplano
region or Collao Plateau lies in the central Andes, and presents an
average height of about 3,750 meters above sea level, mean annual
temperatures below 10uC, and total annual rainfall less than
1000 mm. Despite its harsh conditions, radiocarbon dating of
artifacts suggested that the Altiplano was initially occupied by
humans at approximately 3,700 years before the present [1].
At the time of arrival of the Spaniards in the 16th century, most
of this region was inhabited by Kollas, Lupakas, Pakaxes, and
Carangas (mostly Aymara speaking clans or ‘‘senorios’’) who were
subjugated by the Inca Empire [2,3,4,5]. However, other ethnic
groups speaking unrelated languages such as Puquina and
Uruquilla were also living around the Titicaca, Coipasa, and
Poopo lake basins [6,7,8,9,10]. These languages gradually
vanished during Spanish colonization, when Quechua and
Aymara were imposed to facilitate administrative and evangelizing
activities [3,5]. Currently, most residents of the Altiplano speak
Aymara (Jaqi-aru) and Quechua (Runa simi), ‘‘sister’’ languages of
the Andean family that share about 20% of their vocabulary [5].
Until the 16th century, the Uruquilla speakers who were named
Uros (or Urus, as they are called in Bolivia) were distributed along
the aquatic axis comprising Lake Titicaca (Peru/Bolivia), the
Azangaro and Desaguadero Rivers, Lake Poopo, the Lacajahuira
and Lauca Rivers, and Lake Coipasa in Bolivia [2,8]. The Uros
population has diminished since this time, and is currently
distributed in four different settlements dispersed along the aquatic
areas of the Altiplano (Figure 1). In Bolivia, the Uru-Chipaya live
PLOS ONE | www.plosone.org 1 September 2013 | Volume 8 | Issue 9 | e73006

near Lake Coipasa at the village of Santa Ana de Chipaya, the
Uru-Poopo live in several villages close to Lake Poopo, and the
Uru-Irohito (today with very few remnants) live on the banks of
Desaguadero river, south of Lake Titicaca [7,8]. In Peru, most of
the Uros live in the Los Uros community, which is composed by
the floating islands from Puno Bay of Lake Titicaca [8,9].
The reduction of the Uros population has been suggested by
linguists to have resulted from a gradual ‘‘transculturation’’ during
pre-Inca, Inca and Spanish dominance, when many Uros were
‘‘puquinized’’, ‘‘aymarized’’, ‘‘quechuized’’, and ‘‘castellanized’’
[6,8,9,10]. Although the Uros’ original language (Uru or
Uruquilla) was reportedly spoken in Puno Bay until 1929 [9],
the current Peruvian population of approximately 219 families
(,2000 inhabitants) living in Lake Titicaca (Peruvian census at
http://www.inei.gob.pe) speaks only Aymara and Spanish.
Bolivian Uros (Uru-Chipaya, Uru-Poopo, and Uru-Irohito) are
composed by about 2600 individuals (Bolivian census at http://
www.ine.gob.bo), with the majority speaking only Aymara or
Spanish [9]. However, about 1050 individuals from Santa Ana de
Chipaya in Bolivia [12,13] still speak their original language, Uru-
Chipaya (likely derived from Uruquilla), although with a
significant influence in the vocabulary from Aymara, Quechua,
and more recently, Spanish language [8,9].
According to some researchers, the Uros were the first settlers of
the Andean Altiplano, yet their origin has been subjected to
considerable academic debate [6,8,9,13,14]. Although in Aymara
the term Uri means brave, wild, indomitable, and Uru means day,
they are usually known by their neighbors as uma jaqe (men of the
water) [8]. Actually, the Uros called themselves Qhas Qut suni,
which also means ‘‘men of the water’’ in the Uru (or Uruquilla)
language [9]. However, some Native American groups that were
not conquered by the Incas and Spaniards were also called Uros,
like the Changos or ‘‘Uros de la costa’’ [6,11]. Furthermore, the
word Uro has been frequently used by the Incas and Conquis-
tadores in distinct ways, referring to it as a language, ethnicity, a
tax category or social status [8,10].
Because of the complexity of their reported history and
subjugation to other dominant societies since pre-Columbian
Figure 1. Map of the western South America showing the Andes and locations of the 22 Peruvian and Bolivian populations understudy. Population codes are found in Materials and Methods (Sampling section). Yellow circles represent Quechua populations, blue circles representAymara, green circles represent Arawak, and red circles represent Uros’ populations. A detailed map of the Andean Altiplano region can be seen inFigure S2.doi:10.1371/journal.pone.0073006.g001
Genetic History of the Uros
PLOS ONE | www.plosone.org 2 September 2013 | Volume 8 | Issue 9 | e73006
times, the Uros have been the target of many research studies,
particularly in the fields of anthropology and linguistics
[7,8,9,10,13,14,15]. However, few genetic studies have been
conducted with Uros communities. A previous study of HLA
profiles [16] suggested an ancient connection between the Uros
from Puno and Amazonian ethnic groups, following an old
hypothesis of connection between Uruquilla (original language of
the Uros) and the Arawak linguistic branch [7,8]. Other genetic
studies using mtDNA [17,18] suggested that the Uros from Lake
Titicaca still conserve part of their own ancient genetic
background, while also forming a heterogeneous group. In any
case, a larger survey of genetic data in many samples including
other Uros’ subpopulations, Andean communities from the
Altiplano, and Arawaks is still lacking. Such data would allow us
investigating alternative hypotheses for the peopling of this region
and to characterize genetic affinities of the current Uros’
communities inhabiting Peru and Bolivia.
Here, we generated and analyzed Y-chromosome and mtDNA
diversity in 388 indigenous participants from Peru and Bolivia,
focusing mainly on the pre-Columbian settlement of the Altiplano
region and the ancestry of the Uros. Our results clarify the genetic
relationships and population structure of the Peruvian and
Bolivian Altiplano communities, as well as unveil the degree of
kinship and shared ancestry between currently known Uros from
Peru (Los Uros) and Bolivia (Uru-Chipaya and Uru-Poopo), and
the major ethnic groups from the Andes, the Aymaras and
Quechuas, and Arawaks from the Peruvian Amazon. With these
data, we investigated three major questions: (i) Do the Uros from
Bolivia and Peru share a recent common ancestry, or do they
descend from distinct ancestors? (ii) How do the Uros relate to the
neighboring Aymara and Quechua, and other populations from
the Altiplano? and (iii) Do the Uros present any evidence of having
close genetic kinship to Amazonian native communities of the
Arawak family?
Materials and Methods
Ethics StatementEthical approval for the present study (The South American
Genographic Project) was provided by the Brazilian National
Ethics Commission (CONEP, Resolution number 763/2009), and
by local ethical committees from Peru and Bolivia (USMP and
UMSA, respectively). The project was explained to the volunteers
after previous contact with indigenous confederations, authorities
and/or community leaders, and in some cases in their indigenous
languages. Signed informed consents for all subjects were obtained
before collection of mouth swab samples. In most cases, collection
expeditions occurred in the relatively isolated villages of the native
participants, who were interviewed in order to assess the birthplace
and ethnicity of their parents and grandparents, and to certify that
at least three preceding generations of their ancestors had been
living in the same locality. Relatives to the 3rd degree were
avoided, and men representing unique families were preferentially
sampled to allow analyses with both Y-chromosome and mtDNA
markers using a lower number of individuals, as women would
only contribute to mtDNA analysis.
SamplingFor the present study, we analyzed DNAs from 388 individuals
residing in 22 sampling localities or communities (Figure 1, Table
S1) that were divided into four major ethnic (or linguistic) groups.
These included eight Aymara (n = 115; Chi = Chimu, SRY = -
Santa Rosa de Yanaque, ViM = Villa Molino, StA = Santa Ana,
Paj = Pajchiri, Des = Desaguadero, And = Andamarca, Pam = -
Pampa Aullagas,), two Arawak (n = 29; Mac = Machiguenga,
Yan = Yanesha), nine Quechua (n = 206; Caj = Cajamarca,
Qui = Quinuabamba, HVC = Huancavelica, Apu = Apurimac,
Cus = Cusco, Taq = Taquile, Amt = Amantani, Cap = Capachica,
Pot = Potosi), and three Uros (n = 38; Pun = Los Uros-Puno,
Chp = Uru-Chipaya, Ppo = Uru-Poopo) communities. An addi-
tional female sample from the Uru-Poopo community was
included, and, therefore, the sample size was reduced to 387 for
Y-chromosome analyses.
Y-chromosome and mtDNA AnalysesDNA samples were extracted from buccal swabs using standard
procedures. Samples were initially genotyped for the four more
prevalent Y-SNPs autochthonous from South America, M130,
M242, M346, and M3 [19,20] using TaqMan assays (ABI) and a
7900HT Fast Real-Time PCR System (ABI). All samples
belonging to the Native American Q haplogroup (lineages
Q1a3* or Q-M346*, and Q1a3a or Q-M3, according to Karafet
et al. [19]) and other haplogroups were further genotyped with 17
Y-chromosomal short tandem repeats (Y-STRs) using Y-filerTM
Kit (ABI) and a 3130XL Genetic Analyzer (ABI) [20]. Fragment
profiles of the Y-STRs were determined using the GeneMapper
Software (v3.2, ABI). DNA controls supplied within the Y-filer Kit,
as well as 20 Coriell DNA samples previously genotyped in
University of Arizona, USA, were used to assess the quality and
accuracy of the STR allele determinations.
Although the assignment of the two-repeat blocks of DYS385
could not be accurately made without further genotyping, it was
suggested the shorter repeat allele was associated with DYS385a
[21]. Anyway, we performed phylogenetic analyses with and
without DYS385a and DYS385b data. In addition, DYS389b was
calculated by subtracting DYS389I from DYS389II [22].
For all samples, the complete mtDNA control region (1122 bp,
16024-576 according to the revised Cambridge Reference
Sequence (rCRS) [23]) was amplified with 15876-Forward and
639-Reverse primers, and sequenced using four oligonucleotides
(15946-Forward, 132-Reverse, 16436-Forward, and 637-Reverse)
[24], and the standard protocols for the 3130XL Genetic Analyzer
(ABI) using Big Dye Terminator v. 3.1.
The sequence alignments were performed in relation to rCRS
through SeqScape 2.6 (Applied Biosystems). Variable positions
were determined and major haplogroup assignment was obtained
by MitoTool [25] using as reference the rCRS and haplogroup
prediction tool from Genographic Project (nnhgtool.nationalgeo-
graphic.com). Due to the phylogenetic uncertainty and alignment
controversy, substitutions at nucleotide positions (np) 16182 and
16183, and indels at np 60, 72, 309, 315, 455, 519, 573, 16182,
16183 and 16193 were not used for phylogenetic and statistical
analyses.
Statistical AnalysesTo reveal the genetic relationships among individuals we used
the Median Joining algorithm through the program Network
(www.fluxus-engineering.com), with and without weighting the Y-
STRs or mtDNA haplotypes [26]. For Y-STR networks we used a
weighting inversely proportional to twice the square root of the
STR variance, yielding networks with low reticulation. For
mtDNA networks, we used individual weights for variable sites
based on the mutation number for each position, according to the
Network manual (www.fluxus-engineering.com).
Analysis of Molecular Variance (AMOVA) was performed with
Arlequin 3.5 [28], where FST indices (RST for STRs, and WST for
mtDNA) were obtained to evaluate the genetic differentiation of
the 22 communities. For estimation of a substitution model on
Genetic History of the Uros
PLOS ONE | www.plosone.org 3 September 2013 | Volume 8 | Issue 9 | e73006

mtDNA analyses, we used jModelTest 0.1.1 [27]. We used genetic
distances linearized with population divergence times, converting
RST and WST distances into Reynolds’ coancestry coefficients in
Arlequin, which were used in metric MDS analyses with GenAlEx
[29], and non-metric MDS (nmMDS) calculated with PAST
software (http://folk.uio.no/ohammer/past) to visualize popula-
tion relationships in a bidimensional space. The goodness of fit
stress values were estimated for nmMDS. The linearized
Reynolds’ distances were also used in the Mantel test, comparing
matrices of genetic and geographic distances (calculated with
Geographic Distance Matrix Generator v1.2.3 - http://
biodiversityinformatics.amnh.or/open_source/gdmg), and also in
the spatial analysis using the Monmonier’s algorithm and
Delaunay triangulation performed with the program Barrier
[30]. In addition, the haplotype diversity indices and neutrality
tests for distribution of mtDNA A2, B2, C1 and D1 haplotypes
among the 22 populations were calculated with the Arlequin
package under 10,000 permutations.
Results
Y-chromosome ResultsAfter SNP genotyping samples from all 22 populations, we
obtained Y chromosomal haplotypes from only two related Q
lineages, Q-M346* (n = 24) and Q-M3 (n = 363). Because our
main focus was investigating the origin of the Uros and all
displayed only Q-M3 haplogroup, we selected 363 Q-M3 samples
for individual level genetic analyses in phylogenetic networks,
using 15 or 17 Y-STRs, with and without weighting. A complete
list of Y-STR haplotypes is available in Table S2. Other
population level analyses were performed with all native
haplogroups.
Following the stepwise mutation model and parsimony criteria,
we obtained a median-joining (MJ) phylogeographic network
(Figure 2) of Y-chromosome STR haplotypes belonging to
haplogroup Q-M3, by using 15 Y-STRs (excluding DYS385a
and b, Table S2c) and weighting proportional to twice the inverse
of square root variance. In Figure 2, we observed an isolated
cluster of STR haplotypes very common among Peruvian Uros
(red color) composed by H1 (n = 13) and H2 (n = 1). Other
haplotypes appearing in this cluster were H3 and H4, which are
closely related to the Uros haplotypes (H1, H2), and occurred in
individuals from Santa Ana (StA), an Aymara community at the
shores of Titicaca Lake, near the floating islands of Los Uros.
However, other Peruvian Uros’ haplotypes appeared in
different clusters, all of which being more closely related to those
found in communities around Lake Titicaca (Figure 1). For
example, two individuals from Los Uros shared haplotype H5 with
one Quechua from Amantani, which differed by one repeat unit
from haplotype H6, which was also from Amantani. In the central
agglomeration of the network, H7 from Los Uros (Pun) was very
close to H8 from Santa Ana (Aymara), as well as to H9 from
Amantani (Quechua), H10 from Pajchiri (Aymara) and H11 from
Chimu (Aymara). Another Uros’ haplotypes found in low
frequency (H26, H25, H28, and H30) appeared scattered in the
network.
Among Bolivian Uros, the Uru-Chipaya (Chp) haplotypes also
formed a cluster bearing haplotypes H12 and H13, which was
closely related to individuals bearing haplotype H15 from Pampa
Aullagas (Pam) and H14 from Chimu (Chi), both neighboring
Aymara communities. However, another haplotype H16 (Uru-
Chipaya) did not belong to this cluster, but appeared genetically
related to an Uru-Poopo (Ppo) haplotype H17. Both haplotypes
(H16 and H17) were related to H18, which appeared in one
Aymara from Pajchiri (Paj) on the border of Lake Titicaca.
Moreover, haplotype H24 was shared between individuals from
Uru-Chipaya and Santa Rosa de Yanaque (SRY), also at the
shores of Lake Titicaca. In another cluster, H19 from one
individual Uru-Poopo was closely related to H20 (one repeat unit
difference) from Quechua of Potosi, very close to the Uro-Poopo
locality. For two Uru-Poopo individuals, there was one difference
between haplotypes H21 and H22, and those haplotypes were
close to haplotype H23 (a Quechua from HVC). The major results
of clustering and sharing of Peruvian and Bolivian Uros
haplotypes can be also observed using all 17 Y-STRs and without
weighting (Figure S1). Anyway, because of limited sample sizes of
Bolivian Uros (Chipaya = 8, Poopo = 5 for mtDNA, and 4 for Y),
some results should be taken with care.
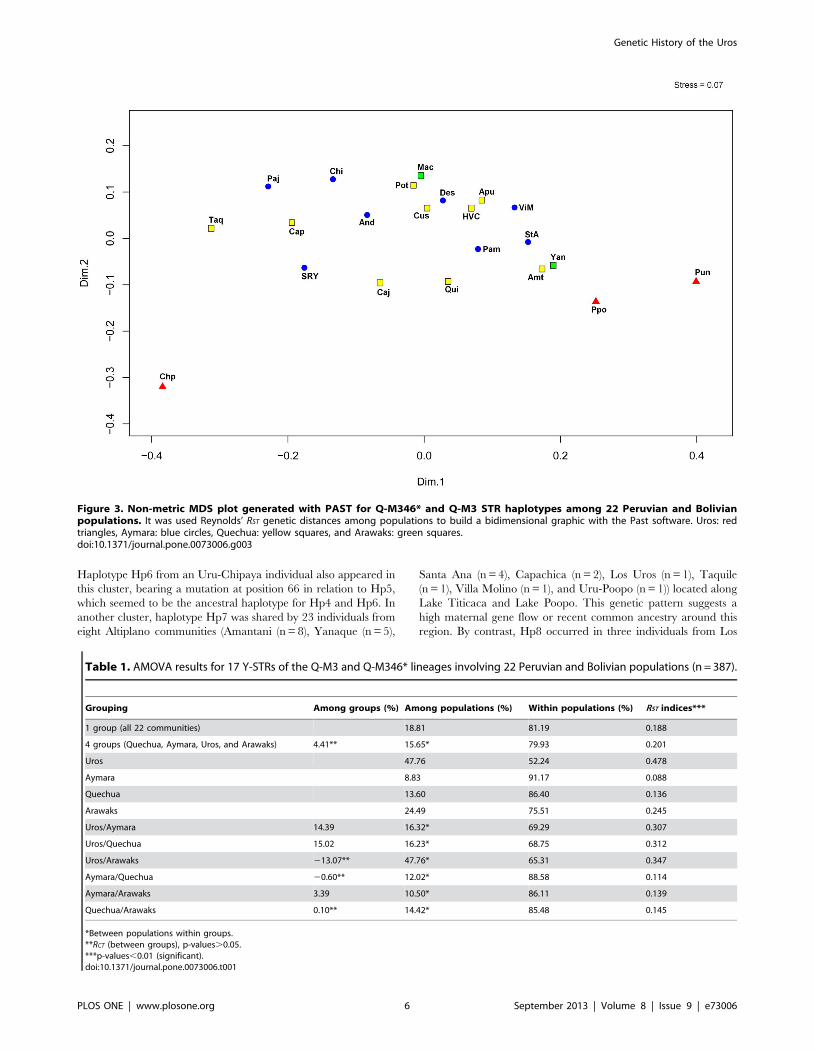
In the nmMDS plot (Figure 3) of 17 Y-STR haplotypes for Q-
M346* and Q-M3 lineages, we observed a compact cluster formed
by all Aymara and Quechua and the two Arawak communities,
while the three Uros communities appeared outside of this cluster.
The Uru-Chipaya was the most isolated population, followed by
Peruvian Uros and Uru-Poopo (Figure 3). We did not observe any
clear geographic or ethnic/linguistic correlation, and the Arawaks
appeared separated on different sides of the central cluster.
Interestingly, the Quechua community of Taquile Island appears
more isolated from the central cluster, which agrees with recently
published data showing this community presents a relative
isolation from other communities in Titicaca Lake [31]. Our
nmMDS analyses show stress value = 0.07, below a 1% left-hand-
tail cutoff value (stress = 0.293) for 22 objects in two dimensions
considering tables from Sturrock and Rocha [32]. Although the
configuration of the metric MDS calculated with GenAlex was
different (figure not shown), the Bolivian and Peruvian Uros
appear outside the major central cluster formed by Quechua and
Aymara communities.
In the AMOVA results of different comparisons of Peruvian and
Bolivian subpopulations (Table 1), we observed a complementary
picture to the results observed at the individual level. When all
major population groups were analyzed separately (Quechua,
Aymara, Uros, and Arawaks), there was low differentiation among
Aymara populations (RST = 0.088), a moderate differentiation
among Quechua groups (RST = 0.136), and high differentiation
among Arawaks (RST = 0.245) and Uros (RST = 0.478). The RST
comparisons in the three levels AMOVA also showed higher
values when Uros were analyzed together Aymaras, Quechuas or
Arawaks than analyses without them. However, there was little
intergroup differentiation when subpopulations were clustered in
four linguistic groups (4.41%). Besides a negative (FCT = 20.13)
and non-significant differentiation (p = 0.9) was observed in the
tree levels AMOVA between Uros and Arawaks (Table 1), which
could be due to a very large differentiation among populations
within Uros and Arawaks (FST = 0.35, p,0.01). We also performed
two levels AMOVAs to compare linguistic groupings with
artificially merged subpopulations (Table S3a). Although these
analyses indicated relatively small differentiation between Uros
and Arawaks (RST = 0.111), the latter appeared much closer to
Aymara and Quechua (Rst = 0.066 and 0.045, respectively). The
population pairwise RSTs between Peruvian and Bolivian Uros and
other communities were all significant (p,0.05), except for Uro-
Poopo that presented non-significant differentiation to Qui, Apu,
Amt, ViM, Chi, Pam, and Pun likely due to its very small sample
size (n = 4). Furthermore, the AMOVA between different popu-
lation pairs (Table S3a) indicated that individual Uros populations
were still more differentiated from Arawaks than the Aymara and
Quechua, suggesting that within group heterogeneity was influ-
encing these results.
Genetic History of the Uros
PLOS ONE | www.plosone.org 4 September 2013 | Volume 8 | Issue 9 | e73006

Non-significant correlation was observed between genetic
distances (Reynolds’ RST) and geographic distances (Km) in the
Mantel test among the 22 communities (R2 = 0.013; p = 0.228),
suggesting gene flow discontinuities. Moreover, the test consider-
ing geographic location and genetic distances through Barrier
software showed that the Peruvian Uros, Taquile, Uru-Chipaya,
Uru-Poopo, and Machiguenga communities were relatively
isolated by gene flow barriers (Figure S2), in close agreement
with the results of the MDS plot and AMOVAs.
mtDNA ResultsIn a total of 388 individuals from autochthonous Peruvian and
Bolivian populations, we identified 203 control region haplotypes
belonging to four Native American haplogroups. No discrepancy
in the haplogroup prediction was found between MitoTool and
Genographic Project tool. Of these, 25 haplotypes corresponded
to haplogroup A2 (n = 40), 133 haplotypes to haplogroup B2
(n = 285), 20 haplotypes to haplogroup C1 (n = 23), and 25
haplotypes to haplogroup D1 (n = 40). The haplotypes found in
the Uros populations are listed in Table S4, and the complete set
of variable sites of mtDNA sequences or haplotypes relative to the
rCRS is shown in Table S5.
The distribution of mtDNA haplogroup frequencies in the 22
communities is shown in the Table S6. To characterize the genetic
relationships among mtDNA haplotypes from Uros and other
ethnic groups (at the individual level), we generated a MJ network
from all control region haplotypes (Figure 4), and compared them
through their site variants or SNPs (Table S4). In the MJ network,
among B2 haplotypes, the most common haplogroup in the
Altiplano (Figure 4), most of the Los Uros (Pun) individuals shared
the haplotype Hp1 with one Aymara individual from Chimu (Chi),
which was closely related to Hp3 from Taquile (Taq, Quechua),
differing only at the np 146 (Tables S4 and S5). Also, the
haplotype Hp1 was genetically related (two SNP changes at np
316 and 16170) to haplotype Hp2, and appeared in a cluster of
individuals formed by Quechuas (Cus, Amt), Aymaras (Des, SRY,
StA, And, Pam), and one Uru-Chipaya (Chp). The SNPs at np 316
and 16170 are recurrent, appearing also in single haplotypes of the
C1 and A2 haplogroups, respectively (Table S5).
In other B2 clusters within the MJ network (Figure 4), we
observed that haplotype Hp4 occurred in two Peruvian Uros, an
individual from Capachica (Quechua) and another from Chimu
(Aymara). Haplotype Hp4 was genetically close and probably
derived from Hp5, which was shared among five Uru-Chipaya,
three Aymara (Paj and Chi), and one Quechua from Potosi (Pot).
Figure 2. Median Joining network for Q-M3 STR haplotypes among 22 Peruvian and Bolivian populations. Different population groupsare defined by distinct colors, where Aymara and Quechua communities from the border of the lakes (Titicaca and Poopo) are discriminated. Thehaplotypes (H#) composed of 15 Y-STRs are represented by circles with sizes proportional to numbers of individuals (H3 = 1, H1 = 13 males), andbranch lengths are proportional to STR mutation steps (one repeat unit between H3 and H4). Haplotype names are according to the 15 Y-STRs (TableS2c).doi:10.1371/journal.pone.0073006.g002
Genetic History of the Uros
PLOS ONE | www.plosone.org 5 September 2013 | Volume 8 | Issue 9 | e73006
Haplotype Hp6 from an Uru-Chipaya individual also appeared in
this cluster, bearing a mutation at position 66 in relation to Hp5,
which seemed to be the ancestral haplotype for Hp4 and Hp6. In
another cluster, haplotype Hp7 was shared by 23 individuals from
eight Altiplano communities (Amantani (n = 8), Yanaque (n = 5),
Santa Ana (n = 4), Capachica (n = 2), Los Uros (n = 1), Taquile
(n = 1), Villa Molino (n = 1), and Uru-Poopo (n = 1)) located along
Lake Titicaca and Lake Poopo. This genetic pattern suggests a
high maternal gene flow or recent common ancestry around this
region. By contrast, Hp8 occurred in three individuals from Los
Figure 3. Non-metric MDS plot generated with PAST for Q-M346* and Q-M3 STR haplotypes among 22 Peruvian and Bolivianpopulations. It was used Reynolds’ RST genetic distances among populations to build a bidimensional graphic with the Past software. Uros: redtriangles, Aymara: blue circles, Quechua: yellow squares, and Arawaks: green squares.doi:10.1371/journal.pone.0073006.g003
Table 1. AMOVA results for 17 Y-STRs of the Q-M3 and Q-M346* lineages involving 22 Peruvian and Bolivian populations (n = 387).
Grouping Among groups (%) Among populations (%) Within populations (%) RST indices***
1 group (all 22 communities) 18.81 81.19 0.188
4 groups (Quechua, Aymara, Uros, and Arawaks) 4.41** 15.65* 79.93 0.201
Uros 47.76 52.24 0.478
Aymara 8.83 91.17 0.088
Quechua 13.60 86.40 0.136
Arawaks 24.49 75.51 0.245
Uros/Aymara 14.39 16.32* 69.29 0.307
Uros/Quechua 15.02 16.23* 68.75 0.312
Uros/Arawaks 213.07** 47.76* 65.31 0.347
Aymara/Quechua 20.60** 12.02* 88.58 0.114
Aymara/Arawaks 3.39 10.50* 86.11 0.139
Quechua/Arawaks 0.10** 14.42* 85.48 0.145
*Between populations within groups.**RCT (between groups), p-values.0.05.***p-values,0.01 (significant).doi:10.1371/journal.pone.0073006.t001
Genetic History of the Uros
PLOS ONE | www.plosone.org 6 September 2013 | Volume 8 | Issue 9 | e73006

Uros and was differentiated from all other Uros haplotypes,
suggesting a relative degree of isolation of some maternal lineages
among Peruvian Uros.
Among Bolivian Uros, three Uru-Poopo individuals appeared in
an exclusive and highly differentiated B2 cluster (Figure 4) of
related haplotypes Hp9 and Hp10. In other relationships, Hp11
from Uru-Poopo (Ppo) was close to Hp12 from Potosi (Pot),
presenting a single base change at np 16172. Among the Uru-
Chipaya, haplotype Hp13 (Chp) was very close to Hp14 from an
Aymara individual from the border of Lake Titicaca (Des), but
showed a single base difference at np 143 (Table S4). Interestingly,
Hp13 was differentiated from Hp15 by two changes at np 16242
and 16324, which were carried by two individuals from
Quinuabamba (Qui), a village located in the northern Andes
(Ancash Department from Peru) and far away from Chipaya and
Lake Titicaca.
Among sequences of haplogroup D1 (Figure 4), we observed
that haplotype Hp16 was shared by Peruvian Uros (Pun), Aymaras
from Chimu (Chi) and Andamarca (And), and a Quechua from
Apurimac (Apu). Among haplogroup A2, we observed a cluster
consisting of haplotypes Hp17 (Los Uros, n = 3), Hp18 (Machi-
guenga Arawaks, n = 1), and Hp19 (Quechua from Capachica,
n = 1).
A maximum likelihood phylogenetic reconstruction (Figure S3)
built with PhyML 3.0 (http://www.atgc-montpellier.fr/phyml)
supports the close relationship of Uros haplotypes discussed above,
although the tree presents a branching topology that cannot be
directly observed in the networks.
The nmMDS plot generated from Reynolds’ linearized
distances (Figure 5) showed that Arawaks (Machiguenga and
Yanesha), Taquile and Bolivian and Peruvian Uros were separated
from a compact cluster formed by other Quechua and Aymara
populations. We also noted that Uru-Chipaya and Uru-Poopo
appeared in opposite sides of the MDS plot. The Peruvian Uros
appeared closer to communities of the shores of Titicaca Lake
(Chi, SRY, ViM, Des, Amt), in the central cluster. In accordance
with our previous Y-STR haplotype results (Figure 2), the Bolivian
and Peruvian Uros, and Arawak populations appeared relatively
differentiated among them (Figure 5), even though they belonged
to the same major ethnic groups. Our nmMDS analyses show
stress value = 0.066, below a 1% left-hand-tail cutoff value for 22
objects in two dimensions (stress = 0.293) considering tables from
Sturrock and Rocha [32]. A similar configuration was obtained
with metric MDS calculated with GenAlex (figure not shown),
showing Bolivian and Peruvian Uros outside the major central
cluster formed by Quechua and Aymara communities.
Figure 4. Median Joining network of mtDNA control region haplotypes found in 22 Peruvian and Bolivian populations. Differentpopulation groups are defined by distinct colors, where Aymaran and Quechuan communities from the border of the lakes (Titicaca and Poopo) arediscriminated. The mtDNA haplotypes (Hp#) are represented by circles with sizes proportional to numbers of individuals (Hp10 = 1 individual), andbranch lengths are proportional to nucleotide changes (1 mutation step between Hp1 and Hp3). Clusters of haplotypes into four mtDNAhaplogroups (A2, B2, C1, D1) are indicated.doi:10.1371/journal.pone.0073006.g004
Genetic History of the Uros
PLOS ONE | www.plosone.org 7 September 2013 | Volume 8 | Issue 9 | e73006

To characterize population structure and genetic diversity
within and between the 22 Peruvian and Bolivian autochthonous
communities under study, we carried out AMOVA tests following
different population comparisons (Table 2). We performed the
AMOVA runs using the TN93 substitution model with a gamma
parameter (closest model available in Arlequin to TPM2uf +I+G
obtained by the jModelTest algorithm) or using simple pairwise
haplotype differences. Both generated similar results.
When ethnic groups were analyzed separately by AMOVA
(Table 2), the highest interpopulation differentiation was observed
among Uros (WST = 0.310), followed by the Arawaks (WST = 0.252),
Quechua (WST = 0.137), and Aymara (WST = 0.024). Thus, there
was high heterogeneity among populations of Uros and Arawaks
in comparison to Aymara and Quechua, a pattern similar to that
produced by the AMOVA using Y-STR haplotypes. In the three
level AMOVA results, we observed a lower interpopulation
differentiation between Uros and Aymara (WST = 0.090) when
compared to Uros and Quechua (WST = 0.169), but a particularly
high difference between Uros and Arawaks (WST = 0.352). On the
other hand, Aymara and Quechua populations were more closely
related through their maternal lineages (WST = 0.090) than either
was to Arawaks (WST.0.23). The population pairwise WST’s
between Peruvian and Bolivian Uros, and other communities
were all significant (p,0.05), except between Uru-Chipaya and
Pajchiri (p = 0.06), We also conducted several two level AMOVAs
between specific population pairs, or joining populations in
linguistic groups (Table S3b). Compared to Y-STR analyses
(Table S3a), mtDNA differentiation results were consistent with
those of three level AMOVAs (Table 2), supporting a large
differentiation between Uros and Arawak communities.
Haplotype diversity indices for B2 sequences in the 22
populations showed low values among Machiguenga (h = 0.417),
Uros-Puno (h = 0.521), and Uru-Chipaya (h = 0.643), and this
finding partially explains the relationships observed in the MDS
plot (Figure 5). Tajima’s D and Fu’s Fs statistics showed significant
negative values (p,0.05) among Potosi and Villa Molino
populations, suggesting they have gone through demographic
expansions in the past (Table S7).
We observed no correlation between Reynolds’ linearized
distances of mtDNA data and geographic distances among the
22 populations using the Mantel test (R2 = 0.010; p = 0.248).
However, the spatial analysis using genetic distances and
geographic coordinates through Monmonier’s algorithm and
Delaunay triangulation showed that the Machiguenga, Peruvian
Uros, Uru-Poopo, Uru-Chipaya, and Taquile communities were
isolated by geographic barriers (Figure S2) in close agreement with
the MDS analyses, and previous results with Y-STR haplotypes.
Discussion
This study focused on the genetic kinship and structure of
Altiplano populations, and particularly that of the Uros, a self-
identified ethnic affiliation used by different communities from
Peru and Bolivia. Anthropologists and linguists [8,9,10,13,33]
have always considered them to be an ethnic group separate from
the Aymara and Quechua because of their different traditions,
lifestyle and original language (Uru or Uruquilla).
Figure 5. Non-metric MDS plot generated with PAST for mtDNA control region sequences for all haplogroups among 22 Bolivianand Peruvian populations. It was used Reynolds’ WST genetic distances among populations. Uros: red triangles, Aymaras: blue circles, Quechuas:yellow squares, and Arawaks: green squares.doi:10.1371/journal.pone.0073006.g005
Genetic History of the Uros
PLOS ONE | www.plosone.org 8 September 2013 | Volume 8 | Issue 9 | e73006

Previous studies of Andean and Amazonian populations using
dermatoglyphic patterns suggested that the Uru-Chipaya could be
more related to Arawakan speakers of the Amazon forest than to
Andean Quechua and Aymara [34]. An earlier study of mtDNA
diversity [17] indicated that Uros from Puno were similar to
Aymara from Anapia (an island from Lake Titicaca located in the
frontier between Peru and Bolivia), although the presence of A2
among the Uros also suggested a differentiated genetic back-
ground, which in our results was related to an A2 haplotype from a
Machiguenga Arawak (Figure 4). Our results suggest a remarkable
heterogeneity within Uros populations, but also indicate that they
possess a distinct genetic profile of maternal and paternal lineages
in relation to other Andean populations.
Our analysis of Y-STR haplotypes from haplogroup Q-M3
suggests a distinctive ancestry of the Uros populations in the
Altiplano of Peru and Bolivia. This distinctiveness may be related
to their unique origin, peculiar demographic history and/or
relatively lower admixture with their neighbors. At present, the
Uru-Chipayas are living in an isolated location along the shores of
Lake Coipasa, the Uru-Poopo live near Lake Poopo, and the
Peruvian Uros live in the floating islands of the Lake Titicaca. As a
result, all Uros communities are relatively distant from each other,
as well. The Y-STR network (Figure 2) and population clusters
observed in MDS (Figure 3) suggest higher gene flow between the
Uros and surrounding populations at lake shores, but the Uros also
possessed exclusive lineages that could be traced back to their
unique ancestry.
In general, the MJ network of Y-STR haplotypes showed a
remarkable divergence among current Peruvian and Bolivian Uros
communities (Peruvian Uros, Uru-Chipaya, Uru-Poopo). It
revealed some exclusive clusters of Uros, particularly among
Peruvian Uros from Puno Bay. The few related haplotypes in this
exclusive cluster (H1, H2, H3) are found in two Aymara
individuals from Santa Ana, at the shore of Lake Titicaca, and
this finding can be explained by unidirectional gene flow from
Uros to Aymara or ‘‘Aymarization’’ of Uros, as suggested by
linguists [6]. This trend may also be exemplified by other minor
paternal haplotypes observed in Peruvian Uros, Uru-Chipaya and
Uru-Poopo that were not seen in the isolated clusters, but were
closely related to Aymara and Quechua lineages found in
communities at shores of Lake Titicaca, such as Amantani, Santa
Rosa de Yanaque, Santa Ana, Pajchiri, and Villa Molino. As
shown in the MJ network (Figure 2), the Quechua and Aymara are
not clearly differentiated, nor do they show any specific geographic
clustering. Moreover, we observed remarkable differences between
two Amazonian ethnic groups speaking different languages of the
Arawak family, Machiguenga from Nuevo Mundo (Cusco
department) and Yanesha from Oxapampa (Cerro de Pasco
department), although their genetic profiles appear more closely
related to those of Quechua and Aymara than to any Uros
population.
The AMOVAs of both Y-chromosome and mtDNA haplotypes
(Tables 1 and 2) indicated that Uros populations are differentiated
from each other and also to other linguistic groups from the
Altiplano, being more heterogeneous than the Aymara and
Quechua, and particularly, the Arawaks. This pattern indicates
that the Uros communities are similarly to autochthonous groups
from the Amazon compared to less heterogeneous Andean
populations, as suggested by a previous demographic model of
evolution of South American native groups [35,36]. These results
further indicate that the ethnic and demographic histories of each
particular population group are essential for explaining their
current genetic profiles. Furthermore, drift and gene flow
associated with relative isolation and geographic proximity,
respectively, are important factors influencing the configuration
of relationships between populations, as we have identified shared
lineages and population similarities between Uros and neighboring
populations of Quechua and Aymara.
The mtDNA results indicate that the Machiguenga (Mac) and
Uru-Chipaya (Chp) are the most differentiated populations,
followed by Peruvian Uros (Pun) and Uru-Poopo (Ppo). Among
the Uros from Puno, the sharing of a mtDNA haplotype with an
individual from Chimu community suggests that these individuals
could be descendents of Aymarized ‘‘Uros’’, as suggested by
linguists [6], and other recent mtDNA analyses performed with
the Chimu population [18]. The MJ network of B2 haplotypes
shows that Andean Peruvian and Bolivian populations share
several divergent lineages (Figure 4), while the Amazonian
Table 2. AMOVA results for mtDNA control region sequences on the A2, B2, C1 and D1 haplogroups found among 22 Peruvianand Bolivian populations (n = 388).
Grouping Among groups (%) Among populations (%) Within populations (%) W ST indices***
1 group (all 22 communities) 14.56 85.44 0.146
4 groups (Quechua, Aymara, Uros, Arawaks) 4.08 11.69* 84.23 0.158
Uros 30.98 69.02 0.310
Aymara 2.35 97.65 0.024
Quechua 13.69 86.31 0.137
Arawaks 25.22 74.78 0.252
Uros/Aymara 1.82** 7.21* 90.97 0.09
Uros/Quechua 1.80** 15.08* 83.12 0.169
Uros/Arawaks 10.89** 24.34* 64.77 0.352
Aymara/Quechua 20.06** 10.01* 90.05 0.10
Aymara/Arawaks 18.57 5.26* 76.17 0.238
Quechua/Arawak 11.15** 13.05* 75.81 0.242
*Between populations within groups.**FCT (between groups), p-value.0.05.***p-values,0.01 (significant).doi:10.1371/journal.pone.0073006.t002
Genetic History of the Uros
PLOS ONE | www.plosone.org 9 September 2013 | Volume 8 | Issue 9 | e73006

Machiguenga and Yanesha B2 lineages are not genetically similar
(Figures 4 and 5). These results indicate that there has been
historically high levels of gene flow and effective population size
among Aymara and Quechua populations, a pattern previously
observed with mtDNA control region and Y-STRs polymorphisms
from Peru and Bolivia [18,35,36,37].
Likewise, the cluster depicting the distribution of A2 haplotypes
(Figure 4) suggests a common ancestral branch connecting Uros
and Arawak mtDNAs, although they are also closely related to
many haplotypes found in different Quechua communities from
outside the region between Lake Titicaca and Lake Poopo. In
addition, the wide distribution of D1 haplotypes going from
Central Andes (Apu) towards south to the northern region of Lake
Poopo (And) suggests either an ancient common ancestry before
population splits or a large-scale and recent gene flow amongst
groups in the region. In any case, because of the low prevalence of
mtDNA lineages aside from B2, comparisons are limited due to
small sample sizes.
In conclusion, the genetic evidence obtained through analyses of
autochthonous paternal and maternal lineages from the Andean
Altiplano showed that Uros from Puno Bay in Peru and Bolivian
Uros communities of Uru-Chipaya and Uru-Poopo are heteroge-
neous groups, bearing genetic lineages derived from divergent
ancestors when compared to most of the current Andean
populations. Our results also indicate more gene flow with
neighboring Andeans (Aymara and Quechua) than with more
distant Andean communities or Arawakan speaking populations.
Moreover, the results suggest the Uros could be derived from
ancestral Andean stocks that were intermingled and partially
replaced by lineages arriving with populations expanding due to a
more recent farming expansion and posterior establishment of
complex civilizations on the Andes.
Supporting Information
Figure S1 Median Joining network for 17-YSTR Q-M3haplotypes among 22 Peruvian and Bolivian populationswithout weighting. Different population groups are defined by
distinct colors, where Aymara and Quechua communities from the
border of the lakes (Titicaca and Poopo) are discriminated. The Y-
STR haplotypes (H#) named according to Table S2a, are
represented by circles with sizes proportional to numbers of
individuals.
(TIF)
Figure S2 Detailed map of the Altiplano region withfour gene flow barriers detected among 22 Bolivian andPeruvian populations using the Barrier software. The
ranking order of barriers isolating populations is as follows:
Peruvian Uros (Pun), Taquile (Taq), Uru-Chipaya (Chp), Uru-
Poopo (Ppo), and Machiguenga (Mac, not shown) for Y-STR data
analysis; and Machiguenga (not shown), Peruvian Uros, Uru-
Poopo, Uru-Chipaya, and Taquile for mtDNA data analysis.
(TIF)
Figure S3 A Maximum likelihood phylogenetic tree ofall mtDNA control region haplotypes among Peruvianand Bolivian individuals (only topology is shown). The
haplogroups are indicated at the end of haplotype names. Red
sequence names appear on the Uros communities (Table S4) and
are discussed on the text.
(TIF)
Table S1 Description of the 22 Peruvian and Bolivianpopulations analyzed.
(XLSX)
Table S2 Y-STR haplotypes found among the 22 Per-uvian and Bolivian populations. a) individual 17 Y-STR
haplotype data for Q-M3 and Q-M346* lineages; b) population
data for Q-M3 Y-STR haplotypes; c) 15 Y-STR haplotypes.
(XLSX)
Table S3 Two levels AMOVA results using 17 Y-STRs ofQ-M3 and Q-M346 lineages (a) and four mtDNAhaplogroups (b) involving comparisons of four linguisticgroups without subpopulation division, and specificpopulation pairs.
(DOCX)
Table S4 Control region mtDNA haplotypes and SNPvariant positions found among Uros and related indi-viduals from Peruvian and Bolivian populations.
(DOCX)
Table S5 Polymorphic sites in mtDNA CR sequencesamong Peruvian and Bolivian autochthonous individu-als, determined by MitoTool program.
(XLSX)
Table S6 Distribution of mtDNA haplogroup frequen-cies (absolute values) among the 22 Peruvian andBolivian populations.
(DOCX)
Table S7 Diversity indices and neutrality tests perpopulation on 388 mtDNA CR sequences of A2, B2, C1and D1 haplogroups.
(DOCX)
Acknowledgments
We especially thank the Uros and other autochthonous communities from
Peru and Bolivia, as well as all participants of the South American
Genographic Project, which allowed this historical study to be carried out.
We thank also to Julio Vilca (Major of Los Uros, Puno), Gonzalo Yucra
(Major of Taquile), Adrian Yanarico (Major of Amantani) for initial
enthusiasm and help in this project, and to Henry Flores, Daniela Arteaga,
Donaldo Pinedo, Michael Kent and many other field guides and eventual
collaborators for allowing the recruitment of participants in Peru and
Bolivia; to PELT (Proyecto Especial Binacional del Lago Titicaca), and
ALT (Autoridad Binacional Autonoma del Sistema Hidrico Lago Titicaca),
particularly the former executive president of ALT, Julian Barra Catacora,
for his important local support and allowing the use of logistics and
infrastructure. We also thank T.G. Schurr (USA) for a detailed review of
English.
The members of The Genographic Consortium are: Kavitha
Valampuri John, Arun Varatharajan Santhakumari, Syama Adhikarla,
ArunKumar GaneshPrasad, Ramasamy Pitchappan (Madurai Kamaraj
University, Madurai, Tamil Nadu, India); Christina J Adler, Alan Cooper,
Wolfgang Haak, Clio SI Der Sarkissian (University of Adelaide, South
Australia, Australia); Pierre A Zalloua, Danielle A Badro, Marc Haber
(Lebanese American University, Chouran, Beirut, Lebanon); Elena
Balanovska, Oleg Balanovsky (Research Centre for Medical Genetics,
Russian Academy of Medical Sciences, Moscow, Russia); Doron M Behar
(Rambam Medical Center, Haifa, Israel); Jaume Bertranpetit, David
Comas, Marta Mele, Begona Martınez-Cruz (Universitat Pompeu Fabra,
Barcelona, Spain); Andrew C Clarke, Elizabeth A Matisoo-Smith
(University of Otago, Dunedin, New Zealand); Theodore G Schurr,
Miguel G Vilar, Matthew C Dulik, Amanda C Owings, Jill B Gaieski
(University of Pennsylvania, Philadelphia, PA, USA); Christoff J Erasmus,
Angela Hobbs, Himla Soodyall (National Health Laboratory Service,
Johannesburg, South Africa); Asif Javed, Ajay K Royyuru, Laxmi Parida,
Daniel E Platt (IBM, Yorktown Heights, NY, USA); Li Jin, Shilin Li
(Fudan University, Shanghai, China); Matthew E Kaplan, Nirav C
Merchant (University of Arizona, Tucson, AZ, USA); R John Mitchell (La
Trobe University, Melbourne, Victoria, Australia); Lluis Quintana-Murci
(Institut Pasteur, Paris, France); Colin Renfrew (University of Cambridge,
Genetic History of the Uros
PLOS ONE | www.plosone.org 10 September 2013 | Volume 8 | Issue 9 | e73006

Cambridge, UK); R Spencer Wells, David F Soria Hernanz (National
Geographic Society, Washington, District of Columbia, USA); Pandikumar
Swamikrishnan (IBM, Somers, NY, USA); Chris Tyler-Smith (The
Wellcome Trust Sanger Institute, Hinxton, United Kingdom).
Author Contributions
Conceived and designed the experiments: JRS RF FRS. Performed the
experiments: JRS DRL MSJ. Analyzed the data: JRS DRL RF FRS.
Wrote the paper: JRS FRS. Collected the samples: JRS ASG OA RF PPV
SR CC FRS. Reviewed and approved the final version of this manuscript:
JRS RF FRS DRL MSJ ASG OA PPV CC SR.
References
1. Aldenderfer M, Craig NM, Speakman RJ, Popelka-Filcoff R (2008) Four-
thousand-year-old gold artifacts from the Lake Titicaca basin, southern Peru.
Proc Natl Acad Sci USA 105: 5002–5005.
2. Gavira Marquez MC (2010) La poblacion del Corregimiento de Carangas
(Virreynato de La Plata) a fines del siglo XVIII. Alhe 33: 67–89.
3. Canahuire Ccama JA (1999) Evolucion historica y social de las naciones Collas.
Editor LACG, p.84, Puno, Peru.
4. Tamayo Herrera J (1987) Nuevo Compendio de Historia del Peru. Editorial
Osiris, Lima, Peru. 3rd edition. 372.
5. Cerron Palomino R (1998) Examen de la teorıa aimarista de Uhle. Indiana 15:
79–106. Available: http://www.iai.spk-berlin.de. Accessed 2013 Feb 10.
6. Bouysse Cassagne T (1991) Poblaciones humanas antiguas y actuales.
ORSTOM, HISBL, Bolivia. 481–498.
7. Torero A (1992) Acerca de la familia linguıstica Uruquilla (Uru-Chipaya).
Revista Andina, N1, Cusco, 171–189.
8. Wachtel N (1986) Men of the water: The Uru problem (XVI and XVII
centuries). Cambridge University Press & Editions de la Maison des Sciences de
L’ Homme.
9. Cerron Palomino R (2007) Reconstruccion del proto-Uro:fonologıa. Lexis, v.
XXXI/1–2, Lima, 47–104.
10. Browman DL (1994) Titicaca Basin Archaeolinguistics: Uru, Pukina and
Aymara AD 750–1450. World Archaeol 26(2): 235–251.
11. Rothhammer F, Moraga M, Santoro CM, Arriaza BT (2010) Origen de los
Changos. Analisis de ADNmt antiguo sugiere descendencia de pescadores de la
cultura Chinchorro (7.900–4.000 A.P.). Rev Med Chile 138: 251–256.
12. Moseley C (2010) Atlas of the World’s Languages in Danger, 3rd edition. Paris,
UNESCO Publishing. Available: http://www.unesco.org/culture/languages-
atlas/. Accessed 2013 Aug 4.
13. Muysken P (2002) Uchumataqu: Research in Progress on the Bolivian Altiplano.
Inter J Multicult Soc 4(2): 235–247.
14. Manelis de Klein HE (1973) Los Urus: El extrano pueblo del altiplano. Estudios
Andinos 3(1): 129–150.
15. Kent M (2013) The importance of being Uros: Indigenous identity politics in the
genomic age. Social Studies of Science. doi: 10.1177/0306312712468520.
16. Arnaiz Villena A, Gonzales-Alcos V, Serrano-Vela JI, Reguera R, Barbolla L, et
al. (2009) HLA genes in Uros from Titikaka Lake, Peru: origin and relationship
with other Amerindians and worldwide populations. Inter J Immunogenet 36:
159–167.
17. Sandoval J, Delgado B, Rivas L, Bonilla B, Nugent D, et al. (2004) Variantes del
ADNmt en islenos del lago Titicaca: maxima frecuencia del haplotipo B1 y
evidencia de efecto fundador. Rev Peru Biol 11: 161–168.
18. Barbieri C, Heggarty P, Castri L, Luiselli D, Pettener D (2011) Mitochondrial
DNA Variability in the Titicaca Basin: Matches and Missmatches with
Linguistics and Ethnohistory. Am J Hum Biol 23: 89–99.
19. Karafet TM, Mendez FL, Meilerman MB, Underhill PA, Zegura SL, et al.
(2008) New binary polymorphisms reshape and increase resolution of the human
Y chromosomal haplogroup tree. Genome Res 18: 830–838.
20. Jota MS, Lacerda DR, Sandoval JR, Vieira PPR, Santos-Lopes SS, et al. (2011)A new subhaplogroup of native American Y-Chromosomes from the Andes.
Am J Phys Anthropol 146: 553–559.
21. Schurr TG, Dulik MC, Owings AC, Zhadanov SI, Gaieski JB, et al. (2012) Clan,language, and migration history has shaped genetic diversity in Haida and
Tlingit populations from southeast Alaska. Am J Phys Anthropol 148: 422–435.22. Zerjal T, Dashnyam B, Pandya A, Kayser M, Rower L, et al. (1997) Genetic
relationships of Asians and northern Europeans revealed by Y-chromosomalDNA analysis. Am J Hum Genet 60: 1174–1183.
23. Andrews RM, Kubacka I, Chinnery PF, Lightowlers RN, Turnbull DM, et al.
(1999) Reanalysis and revision of the Cambridge reference sequence for humanmitochondrial DNA. Nature Genetics 23: 147.
24. Behar DM, Rosset S, Blue-Smith J, Balanovsky O, Tzur S, et al. (2007) TheGenographic Project public participation mitochondrial DNA database. PLoS
Genet 3(6): e104.
25. Fan L, Yao Y-G (2011) MitoTool: a web server for the analysis and retrieval ofhuman mitochondrial DNA sequence variations. Mitochondrion 11: 351–356.
26. Bandelt H-J, Forster P, Sykes BC, Richards MB (1995) Mitochondrial portraitsof human populations using median networks. Genetics 141: 743–753.
27. Posada D (2008) jModelTest: phylogenetic model averaging. Mol Biol Evol25(7): 1253–1256.
28. Excoffier L, Lischer HEL (2010) Arlequin suite ver 3.5: a new series of programs
to perform population genetics analyses under Linux and Windows. Mol EcolResour 10: 564–567.
29. Peakall R, Smouse PE (2006) GENALEX 6: genetic analysis in Excel.Population genetic software for teaching and research. Mol Ecol 6: 288–295.
30. Manni F, Guerard E, Heyer E (2004) Geographic patterns of (genetic,
morphological, linguistic) variation: How barriers can be detected by usingMonmonier’s algorithm. Hum Biol 76(2): 173–190.
31. Sandoval JR, Salazar-Granara A, Acosta O, Castillo-Herrera W, Fujita R, et al.(2013) Tracing the Genomic Ancestry of Peruvians Reveals a Major Legacy of
Pre-Columbian Ancestors. J Hum Genet doi: 10.1038/jhg.2013.73.
32. Sturrock K, Rocha J (2000) A Multidimensional Scaling Stress EvaluationTable. Field Methods 2000 12: 49–60.
33. Vellard J (1959) Poblaciones indıgenas del lago Titicaca. Boletın SociedadGeografica Lima, 76 (3–4 trimestre): 17–40.
34. Murillo F, Rothhammer F, Llop E (1977) The Chipaya of Bolivia:Dermatoglyphics and ethnic relationships. Am J Phys Anthropol 46(1): 45–50.
35. Fuselli S, Tarazona-Santos E, Dubanloup I, Soto A, Luiselli D, et al. (2003)
Mitochondrial DNA Diversity in South America and the Genetic History ofAndean Highlanders. Mol Biol Evol 20(10): 1682–1691.
36. Tarazona-Santos E, Carvalho-Silva DR, Pettener D, Luiselli D, De Stefano GF,et al. (2001) Genetic differentiation in South Amerindians is related to
environmental and cultural diversity: Evidence from the Y Chromosome.
Am J Hum Genet 68: 1485–1496.37. Gaya-Vidal M, Moral P, Saenz-Ruales N, Gerbault P, Tonasso L, et al. (2011)
mtDNA and Y-chromosome diversity in Aymaras and Quechuas from Bolivia:different stories and special genetic traits of the Andean Altiplano populations.
Am J Phys Anthropol 145: 215–230.
" Membership of The Genographic Project Consortium is provided in the
Genetic History of the Uros
PLOS ONE | www.plosone.org 11 September 2013 | Volume 8 | Issue 9 | e73006
Copyright © 2022 FDOKUMEN