Recuperación Patrimonial Viviendas Altiplano Chile_01_Memoria

www.elsevier.com/locate/jgeoexp
Journal of Geochemical Explo
The effect of filtration on analyses of surface water samples.
A study from the Salars of Coipasa and Uyuni, Bolivian Altiplano
David Banks a,*, Howard Markland b, Paul V. Smith c, Carlos Mendez b,
Javier Rodriguez b, Alonso Huerta b, Ola M. Sæther d
aHolymoor Consultancy, 8 Heaton Street, Brampton, Chesterfield, Derbyshire, S40 3AQ, UKbURS Dames and Moore, Edificio Creyland, Avenida Santa Cruz #1344, Piso 1, Cochabamba, Bolivia
cURS Dames and Moore, 5 Industrial Way, Salem, NH, 03079, USAdNorges Geologiske Undersøkelse, N-7491 Trondheim, Norway
Received 23 July 2004; accepted 4 April 2005
Available online 28 June 2005
Abstract
Analyses by inductively coupled plasma atomic emission spectrometry (ICP-AES), inductively coupled plasma mass
spectrometry (ICP-MS) and cold vapour atomic absorption (for Hg, CVAA) of a wide range of elements in some 300 surface
water samples from the Salar de Uyuni and Salar de Coipasa catchments of the Bolivian Altiplano have been undertaken.
Comparison of analyses of acidified aliquots of unfiltered sample water with water filtered at 0.45 Am reveals that the following
elements are not affected significantly by filtration in this high-pH environment: B, Ca, Li, Mg, K, Si, Na, Sr, S. The following
elements appear to experience significantly elevated concentrations in unfiltered samples, relative to filtered: Al, (As to a minor
extent), Ba, Be, Cd, Cr, Co, Cu, Fe, Pb, Mn, Hg, Ni, P, Ag, Tl, Ti, V. The effect appears to be related to the presence, and
subsequent dissolution in acid preservative, of Fe-, Al-or Mn-oxyhydroxide flocs (or coatings on silicate particles) in unfiltered
samples, and their retention or precipitation on filters.
D 2005 Elsevier B.V. All rights reserved.
Keywords: Analysis; Arsenic; Filtration; Particulate matter; Surface waters; Bolivia
1. Introduction and objective
Many water sampling protocols recommend the
filtration of water samples prior to analysis, often at
0375-6742/$ - see front matter D 2005 Elsevier B.V. All rights reserved.
doi:10.1016/j.gexplo.2005.04.003
* Corresponding author. Tel./fax: +44 1246 230068.
E-mail address: [email protected] (D. Banks).
a filter of nominal pore size 0.45 Am (USGS, 1984,
2004; Hauge and Breedveld, 1991; UNESCO et al.,
1992; Appelo and Postma, 1996; Mather, 1997; Yes-
kis and Zavala, 2002). The purpose of this is to
remove any particulate fraction from the water, such
that only the bdissolvedQ fraction of an element is
analysed. In practice, this recommendation is not
always adhered to in environmental surveys, either
ration 86 (2005) 104–118

Fig. 1. Outline map of Bolivia, showing location of study area
(in grey) and salars (black).
D. Banks et al. / Journal of Geochemical Exploration 86 (2005) 104–118 105
due to ignorance of the sampling protocols, or because
the investigators regard the particulate content of ele-
ments (e.g. being transported by a river) as being of
interest to the study.
It is important that the decision as to whether or not
to filter water samples is made in an informed way. In
particular, one should realise that:
(a) The presence of particles in a water sample can
seriously disturb an analytical result, especially
in cases where nitric acid is subsequently added
to preserve the water sample for metals analyses
(a common practice). The acid may partially or
totally dissolve particulate matter, releasing
solutes in quantities that are significant com-
pared with the original dissolved phase.
(b) Differing analytical methods may behave dif-
ferently in the presence of particulate matter.
For example, it might be suspected that bhotQanalytical methods (e.g. inductively coupled
plasma) might volatilise particulate or colloidal
matter and incorporate it into the analysed
plasma, whereas bcoolQ methods (colorimetry,
ion detectors) may be less sensitive to its
presence.
(c) Filtration is an arbitrary fractionation process.
Filtration at 0.45 Am will generally not remove
particles less than that nominal pore size (al-
though some smaller particles may be retained
as pore throats become clogged as filtration
progresses), nor will it remove most of any
colloidal fraction.
(d) The effect of filtration will affect different
elements differently. One would expect highly
soluble species (e.g. chloride) to occur mainly
in the dissolved phase and to be relatively
unaffected by filtration, whereas other elements
(e.g. rare earths, thorium) may be more
blithophileQ and have a tendency to be associ-
ated with the particulate phase. Still other ele-
ments may have a tendency to form colloidal
flocs (e.g. iron, manganese at high pH—see
Banks et al., 1997).
(e) Filtration, in itself, may have a potential adverse
effect on sample quality, as the filter material
may contain impurities which can be leached
(e.g. ammonium in some filter papers or tin
from some sealed filter units, BSI, 1998; Reim-
ann et al., 1999; see also Horowitz et al., 1996).
The filter membrane may also act as a nucle-
ation/precipitation surface for some dissolved
elements.
In order to make an informed assessment
concerning the effects of filtration, it is necessary to
have access to documented case studies. Although the
impact of filtration on analyses is well-recognised,
relatively few studies have identified which specific
elements are especially affected. Banks et al. (1999)
and Reimann et al. (1999) studied the impact of
filtration at 0.45 Am (and 0.10 Am, in the latter
study) on groundwater samples from wells in Norwe-
gian crystalline bedrock and found that filtration had
rather little effect. They warn, however, in their con-
clusions, that it is difficult to generalise this result, as
such groundwaters by their very nature have rather
low particulate contents.
This paper seeks to provide documentation of the
impact of filtration on water samples from a very
different medium: surface water (river/stream) sam-
ples from the Bolivian Altiplano (Fig. 1), which are
generally of high pH, often have a high particulate
content and which can be rather saline (Fig. 2). In
particular, the paper seeks to identify those elements

Fig. 2. Boxplots (see text for explanation) showing distributions of field-determined pH and electrical conductivity, and laboratory-determined
chloride and Total Suspended Solids. For each parameter, the bTotalQ data set for all surface water samples is shown, together with four subsets
containing analyses from the (i) bUyuniQ and (ii) bCoipasaQ catchment areas only and analyses for bRainyQ and bDryQ season sampling rounds
only. Sample numbers in each data set are shown above the boxplots.
D. Banks et al. / Journal of Geochemical Exploration 86 (2005) 104–118106
which are most and least impacted by filtration in this
particular hydrochemical environment.
2. The study area
The data are derived from a regional geochemical
study of the catchments of the Salars (salt flats) of
Uyuni and Coipasa on the Bolivian Altiplano (Fig. 1).
The study was performed by the environmental engi-
neering consultancy URS Dames and Moore Norge, in
cooperation with the National Geological and Mining
Service (Servicio Nacional de Geologıa y Minerıa
[SERGEOMIN]), for the Vice Ministry for Mining
and Metallurgy (VMMM) of Bolivia. The project ob-
jective was to assess the impact of mining activities on
the catchments and to provide a baseline against which
to monitor future activities. The study (including sam-
pling and analytical protocols, analytical results, etc.)
is fully reported by URS Dames and Moore Norge
(2000) and summarized by Banks et al. (2004).
The Altiplano is a high-altitude intermontane pla-
teau located between the dominantly metasedimentary
Cordillera Oriental and the volcanic Cordillera Occi-
dental of the Andes (USGS and GEOBOL, 1992). The
study area extends roughly from latitude 188 to 22830VSouth, and from longitude 66815V to 69815V West,
encompassing the hydrographic drainage basins
(catchment areas) of the Salar de Uyuni (salar area
10,085 km2) and the Salar de Coipasa (2239 km2).
The study area occupies a total area of approximately
71,183 km2.
Elevation in the study area ranges from approxi-
mately 3650 m above mean sea level (asl) in the salars
to over 5000 m asl in the surrounding mountains,
reaching 6542 m asl at Mount Sajama volcano. The

D. Banks et al. / Journal of Geochemical Exploration 86 (2005) 104–118 107
region is characterised by an arid to semi-arid climate,
sparse vegetation and sparse population. The majority
of the precipitation in the region is received within a
relatively short rainy season, extending roughly from
December to March. The region generally receives
very little rainfall during the rest of the year, with
total annual average rainfall ranging from b100 to 500
mm (increasing northwards). Water loss from the
basins occurs largely through evaporation, with
Class A open water tank evaporation data indicating
a mean annual evaporation rate of about 1200–2200
mm (Banks et al., 2004). The two salars (salt flats)
represent the evaporative sinks of the internal drainage
basins considered in this study and have accumulated
vast quantities of evaporite salts.
The catchments (which are often hilly or moun-
tainous) draining towards the salars contain a wide
variety of historically and currently worked metalifer-
ous and sulphur mineral deposits (USGS and GEO-
BOL, 1992).
Two rounds of river/stream water sampling were
carried out at a network of sampling stations within
the catchments draining towards the salars, during the
rainy (January/February 2000) and the dry (March/
April 2000) seasons, resulting in some 300 samples.
Particulate contents in the waters can be seen to be
considerably higher during the rainy season (Fig. 2)
due to increased surface water flows and sediment
transport capacity. For each sampling visit, both un-
filtered and filtered (0.45 Am) aliquots of the water
samples were collected.
For the purposes of this paper, a detailed consid-
eration of the area’s hydrochemistry is unnecessary,
although a summary has been published by Quinta-
nilla et al. (1995). The study (Banks et al., 2004) did,
however, result in the following salient findings:
(i) With the exception of a very small number of
mines, mining had little impact on the regional
hydrochemistry of this rather well-buffered
(high pH) system. The hydrochemical data pre-
sented in this paper are thus largely regarded as
representing natural water quality.
(ii) Although the surface water samples were taken
from the rivers draining towards the salars, rath-
er than in the salars themselves, some of the
waters were very saline. There is some tendency
for surface water salinity to increase down-
stream (towards the salars) due to evaporative
concentration.
(iii) Individual catchments had very different charac-
teristic water chemistries depending on the to-
pography, geology and prevalent mineralization
of the catchment. In particular, extremely high
(presumed natural) arsenic concentrations were
found in catchments draining from areas of na-
tive fumarolic sulphur mineralization and ther-
mal/saline springs in the Cordillera Occidental.
3. Sampling and analytical protocols
Field measurements were made of the following
parameters (meters calibrated on a daily basis):
– pH and water temperature using a Fisher Scientific
Accumet AP61 or AP63 combined pH/temperature
meter;
– electrical conductivity (EC) using a Hanna HI 9033
conductivimeter;
– dissolved oxygen (DO) using a YSI 55 immersion
probe.
Surface water samples were generally collected as
grab samples from the watercourse using a deconta-
minated container, and decanted into individual sam-
ple containers. Where there were multiple channels,
such as in braided river systems, composite samples
were collected, comprised of quanta from each chan-
nel in proportion to the relative magnitude of flow.
Sample flasks were provided by the analytical
laboratory and, where necessary, were pre-filled with
the appropriate preservative agent (ultrapure concen-
trated nitric acid in the case of unfiltered and filtered
samples destined for ICP-AES/ICP-MS analyses). In
the case of samples destined for ICP-MS/ICP-AES/
CVAA analyses, both unfiltered and filtered aliquots
were taken.
The filtration procedure utilised Nalgene integrated
filtration flasks. The initial sample was collected from
the stream in a 2-l sample container (liquinox-washed
and double rinsed in sample stream). That portion to
be filtered was transferred to the upper compartment
of the filtration unit. Pressure from a hand pump was
applied to the filtration flask, driving water through
the 50-mm diameter, 0.45 Am pore-size cellulose filter
D. Banks et al. / Journal of Geochemical Exploration 86 (2005) 104–118108
membrane into the final (lower) compartment of the
flask, which was pre-filled with nitric acid preserva-
tive. The nominal filtration capacity for each sample
was 500 ml.
Water samples were stored in the field in cool-
boxes, and were subsequently shipped in the cool-
boxes to Philip Analytical Services Corp, Vancouver,
British Columbia, Canada, for analysis. The analytical
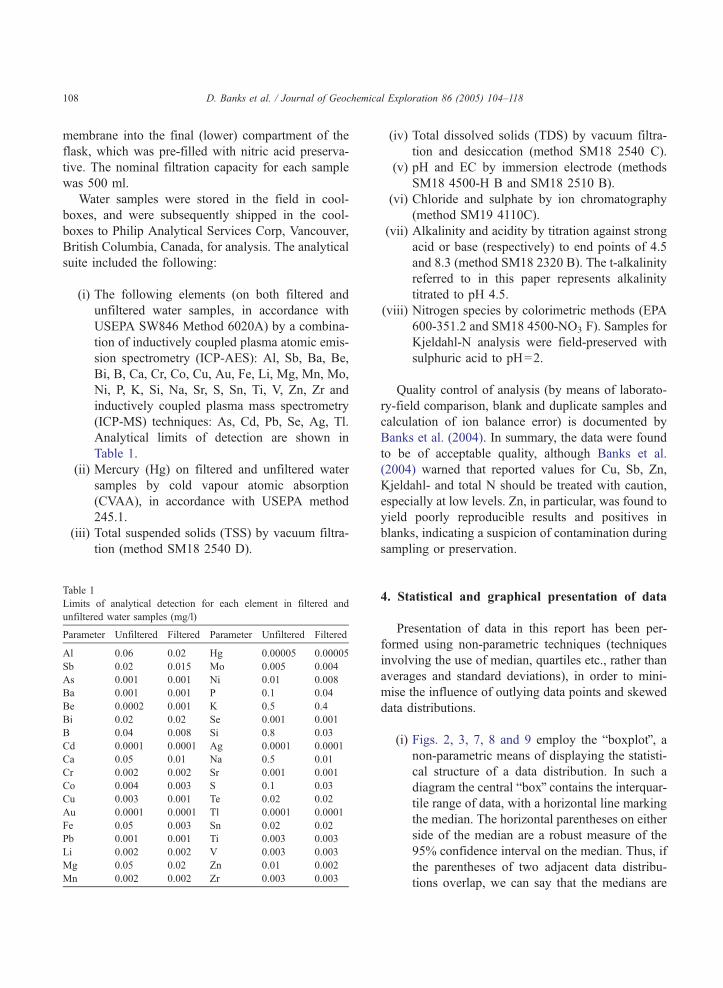
suite included the following:
(i) The following elements (on both filtered and
unfiltered water samples, in accordance with
USEPA SW846 Method 6020A) by a combina-
tion of inductively coupled plasma atomic emis-
sion spectrometry (ICP-AES): Al, Sb, Ba, Be,
Bi, B, Ca, Cr, Co, Cu, Au, Fe, Li, Mg, Mn, Mo,
Ni, P, K, Si, Na, Sr, S, Sn, Ti, V, Zn, Zr and
inductively coupled plasma mass spectrometry
(ICP-MS) techniques: As, Cd, Pb, Se, Ag, Tl.
Analytical limits of detection are shown in
Table 1.
(ii) Mercury (Hg) on filtered and unfiltered water
samples by cold vapour atomic absorption
(CVAA), in accordance with USEPA method
245.1.
(iii) Total suspended solids (TSS) by vacuum filtra-
tion (method SM18 2540 D).
Table 1
Limits of analytical detection for each element in filtered and
unfiltered water samples (mg/l)
Parameter Unfiltered Filtered Parameter Unfiltered Filtered
Al 0.06 0.02 Hg 0.00005 0.00005
Sb 0.02 0.015 Mo 0.005 0.004
As 0.001 0.001 Ni 0.01 0.008
Ba 0.001 0.001 P 0.1 0.04
Be 0.0002 0.001 K 0.5 0.4
Bi 0.02 0.02 Se 0.001 0.001
B 0.04 0.008 Si 0.8 0.03
Cd 0.0001 0.0001 Ag 0.0001 0.0001
Ca 0.05 0.01 Na 0.5 0.01
Cr 0.002 0.002 Sr 0.001 0.001
Co 0.004 0.003 S 0.1 0.03
Cu 0.003 0.001 Te 0.02 0.02
Au 0.0001 0.0001 Tl 0.0001 0.0001
Fe 0.05 0.003 Sn 0.02 0.02
Pb 0.001 0.001 Ti 0.003 0.003
Li 0.002 0.002 V 0.003 0.003
Mg 0.05 0.02 Zn 0.01 0.002
Mn 0.002 0.002 Zr 0.003 0.003
(iv) Total dissolved solids (TDS) by vacuum filtra-
tion and desiccation (method SM18 2540 C).
(v) pH and EC by immersion electrode (methods
SM18 4500-H B and SM18 2510 B).
(vi) Chloride and sulphate by ion chromatography
(method SM19 4110C).
(vii) Alkalinity and acidity by titration against strong
acid or base (respectively) to end points of 4.5
and 8.3 (method SM18 2320 B). The t-alkalinity
referred to in this paper represents alkalinity
titrated to pH 4.5.
(viii) Nitrogen species by colorimetric methods (EPA
600-351.2 and SM18 4500-NO3�F). Samples for
Kjeldahl-N analysis were field-preserved with
sulphuric acid to pH=2.
Quality control of analysis (by means of laborato-
ry-field comparison, blank and duplicate samples and
calculation of ion balance error) is documented by
Banks et al. (2004). In summary, the data were found
to be of acceptable quality, although Banks et al.
(2004) warned that reported values for Cu, Sb, Zn,
Kjeldahl- and total N should be treated with caution,
especially at low levels. Zn, in particular, was found to
yield poorly reproducible results and positives in
blanks, indicating a suspicion of contamination during
sampling or preservation.
4. Statistical and graphical presentation of data
Presentation of data in this report has been per-
formed using non-parametric techniques (techniques
involving the use of median, quartiles etc., rather than
averages and standard deviations), in order to mini-
mise the influence of outlying data points and skewed
data distributions.
(i) Figs. 2, 3, 7, 8 and 9 employ the bboxplotQ, anon-parametric means of displaying the statisti-
cal structure of a data distribution. In such a
diagram the central bboxQ contains the interquar-tile range of data, with a horizontal line marking
the median. The horizontal parentheses on either
side of the median are a robust measure of the
95% confidence interval on the median. Thus, if
the parentheses of two adjacent data distribu-
tions overlap, we can say that the medians are

Fig. 3. Boxplots (see text for explanation), showing distributions of Al, Fe, Mn and Na in unfiltered water samples. See caption to Fig. 2 for
explanation of subsets. Note elevated concentrations of Al, Fe and Mn in rainy season samples relative to dry season.
D. Banks et al. / Journal of Geochemical Exploration 86 (2005) 104–118 109
not significantly different at the 95% confidence
level. The bwhiskersQ show the extraquartile
data, while squares and crosses show near and
far (respectively) boutlyingQ data (defined by a
statistical algorithm).
(ii) Figs. 4–6 and 9 employ x–y plots.
In both forms of graphical presentation, data below
the analytical limit of quantification have been set
equal to that limit. Elements where the large majority
of data fall below the detection limit have been omit-
ted from the graphical presentation.
5. Comparison of wet season and dry season results
Figs. 2 and 3 presents the distributions of a small
selection of parameters within the total surface water
dataset (typically n =297). Furthermore, for each pa-
rameter, distributions are presented for subsets
corresponding to the two catchments of the Salar de
Uyuni (n=166) and the generally slightly less saline
Salar de Coipasa (n =131), to permit a visual assess-
ment of any systematic differences in hydrochemical
distributions between the two catchments (see Banks
et al., 2004, for more information). Data are also
subdivided into subsets corresponding to samples col-
lected during the wet (n =153) and dry (n =144)
seasons.
The most marked difference between rainy and
dry seasons is the significantly higher concentration
of total suspended solids during the rainy season, as
one would expect given the higher flows and higher
sediment transport capacities in the rivers. It was
also found that for the following parameters, signif-
icantly greater (at a 95% significance level) median
concentrations are found during the wet than the dry
season:
Al_U, Ba_U, Cu_U, Fe_U, Pb_U, Mn_U, P_U,
K_U, Tl_U, Ti_U, V_U, nitrogen species, Cr_F, Cu_F

Fig. 4. x–y plots showing concentrations of each element in unfiltered versus filtered (0.45 Am) aliquots of each sample. Rainy and dry season
samples are shown by different symbols. Note that all analyses below the analytical limit of quantification (Table 1) are set equal to that limit.
D. Banks et al. / Journal of Geochemical Exploration 86 (2005) 104–118110

Fig. 5. x–y plots showing concentrations of each element in unfiltered versus filtered (0.45 Am) aliquots of each sample. Rainy and dry season
samples are shown by different symbols. Note that all analyses below the analytical limit of quantification (Table 1) are set equal to that limit.
D. Banks et al. / Journal of Geochemical Exploration 86 (2005) 104–118 111

Fig. 6. x–y plots showing concentrations of each element in unfiltered versus filtered (0.45 Am) aliquots of each sample. Rainy and dry season
samples are shown by different symbols. Note that all analyses below the analytical limit of quantification (Table 1) are set equal to that limit.
D. Banks et al. / Journal of Geochemical Exploration 86 (2005) 104–118112
(where _F indicates filtered samples, and _U indicates
unfiltered samples).
Very few parameters exhibit significantly lower
median values in the rainy than the dry season: dis-
solved oxygen, pH_laboratory (but not field), As_F,
Sb_U.
For all other parameters (including the majority of
parameters in filtered samples) differences cannot be
said to be significant at a 95% level. The most inter-
esting observations to be noted from the above are:
(i) The decline in concentrations of many of the
bunfilteredQ parameters in the dry season. This
suggests that particulate and colloidal matter
have a significant impact on analyses of unfil-
tered samples.
(ii) The fact that metals such as Al, Fe, Mn (which
may form colloidal flocs in waters of high pH)
appear to be associated with suspended solids,
whereas elements such as Si, Ca, Na, Mg are
not. This suggests that the analytical discrepan-
cies between filtered and unfiltered samples in
rainy and dry seasons may be related to the
presence (and subsequent dissolution in acid
preservative) of Fe-, Al-, Mn-oxyhydroxide
flocs, rather than to silicate particles themselves.
Several of the potentially toxic trace elements
(Pb, Cu, Tl) may be associated (adsorbed or
coQprecipitated) with these oxyhydroxides. Al-
ternatively, it is possible that the postulated
oxyhydroxide phases are present as readily
acid-soluble coatings on detrital particles.
(iii) The elevated concentrations of nitrogen species
during the rainy season are probably due to
leaching of soluble nitrogen compounds from
the soil profile during rainy flushes.
(iv) It is intriguing that one of very few parameters
exhibiting an increase in the dry season is arse-
nic (filtered). This ties in with the regional
findings of Banks et al. (2004) that arsenic (i)
is at least in large part associated with the dis-
solved phase, (ii) is subject to evaporative con-

D. Banks et al. / Journal of Geochemical Exploration 86 (2005) 104–118 113
centration and (iii) occurs as a mobile oxy-anion
under alkaline conditions and exhibits a degree
of correlation with pH.
6. Impact of filtration
Figs. 4–6 illustrate the correlation between filtered
and unfiltered samples for the parameters determined
by ICP and AA techniques where a significant pro-
portion of data fall above the detection limit.
In clean groundwater samples, it has been demon-
strated that filtration only has a minor impact on the
concentrations of most elements (see Reimann et al.,
1999). However, it will immediately be seen from the
figures that filtration has a major effect on concentra-
tions of many of the elements in the surface waters of
the salar catchments. This is probably due to two main
reasons:
(i) in unfiltered samples, particulate matter is pres-
ent in the sample, is dissolved in the preserva-
tive acid and releases significant quantities of
solutes. This results in an berroneouslyQ elevatedconcentration.
(ii) in filtered samples, elements may be retained
on the filter material by sorption or retention
of colloidal flocs, resulting in a depressed
concentration.
Figs. 4–6 may be examined by comparing the
distribution of data points relative to a conceptual
1:1 line across the plot. Points falling below the 1:1
line have elevated concentrations in the unfiltered
samples. The figures indicate that the following ele-
ments are relatively little affected by the filtration
process:
B, Ca, Li, Mg, K, Si, Na, Sr, S
Even with these elements (and especially Ca, Mg,
K and Si), however, there are individual samples,
especially in the rainy season, that are impacted by
filtration and fall below the 1:1 line. The elements
listed above are generally soluble elements, not read-
ily retained in solid phases, with the exception of Ca
and Si. The fact that Ca and Si are not highly impact-
ed by filtration suggests that the filtration effect ob-
served in other elements is typically not related to
retention or passage of lithic silicate or limestone
sediment particles (except for a few rainy season
samples).
The following elements show elevated concentra-
tions in unfiltered aliquots of a substantial number of
samples, especially in the rainy season:
Al, As, Ba, Be (not shown), Cd, Cr, Co, Cu, Fe,
Pb, Mn, Hg, Ni, P, Ag, Tl, Ti, V, (Zn)
Note for Zn, the extremely poor, unsystematic
correlation between filtered and unfiltered data. This
suggests poor reproducibility of the Zn analytical data
(and this was, in fact, confirmed in blank and field
duplicate tests). For the other elements noted above,
the elevated concentrations in unfiltered samples are
probably related to the presence and acid dissolution
of non-silicate phases such as hydroxide flocs, form-
ing under high pH conditions (e.g. for Al, Fe and Mn,
especially), or oxyhydroxide coatings on other parti-
cles. If such colloidal or floc particles form, many
other elements sorb effectively onto their large surface
area and are retained by filtration. Note that, for
arsenic, the majority of samples fall close to the 1:1
line, indicating lack of any effect of filtration and the
association of As with the dissolved phase (see
bComparison of Wet and Dry Season ResultsQ,above). However, some samples plot below the 1:1
line, indicating association of arsenic with a colloidal
or particulate form. Banks et al. (2004) do, in fact,
present evidence from the regional geochemical sur-
vey of the probable partial sorption of arsenic onto
iron oxyhydroxide flocs and precipitates.
For the other elements, there are typically too few
samples above the limit of quantification to make an
assessment of the effects of filtration.
Figs. 7 and 8 show the distribution of concentra-
tions for all the elements in filtered and unfiltered
samples in the form of boxplots. These permit one
to readily observe how median and quartile concen-
trations are affected by filtration. For the following
elements, the median concentration of the element is
not significantly affected (at a 95% confidence level)
by filtration:
As, B, Ca, Li, Mg, K, Si, Na, Sr, S
The boxplots in Figs. 7 and 8 do not, of course,
reveal some of the detail in data sets for individual
elements. For example, they appear to demonstrate
that the median concentrations of Mg and K in filtered
and unfiltered samples are not significantly different.
However, Fig. 5 clearly shows that there are some

Fig. 7. Boxplots showing distributions of elements (Al to Mn) in unfiltered (_U) and filtered (_F) aliquots of samples. Note that all analyses
below the analytical limit of quantification (Table 1) are set equal to that limit; hence for some elements, most data plot on a single horizontal
line at the limit of quantification. #=number of samples in each subset.
Fig. 8. Boxplots showing distributions of elements (Hg to Zr) in unfiltered (_U) and filtered (_F) aliquots of samples. Note that all analyses
below the analytical limit of quantification (Table 1) are set equal to that limit; hence for some elements, most data plot on a single horizontal
line at the limit of quantification. #=number of samples in each subset.
D. Banks et al. / Journal of Geochemical Exploration 86 (2005) 104–118114

Fig. 9. The relationship of the Filtration Ratios for As, Ba, Fe, Mg, Mn and Si to Total Suspended Solids (TSS) and field pH. The Filtration
Ratio is the ratio of concentration in an unfiltered sample to that in the corresponding filtered sample. To demonstrate the Ratio–pH relationship,
the total data set has been ranked according to field pH and subdivided into five 20-percentile subsets. For each subset a boxplot is presented.
#=number of samples in each subset.
D. Banks et al. / Journal of Geochemical Exploration 86 (2005) 104–118 115

D. Banks et al. / Journal of Geochemical Exploration 86 (2005) 104–118116
samples for these elements from the rainy season
which are impacted by filtration. In the case of K,
these samples are sufficient to render the rainy season
median concentrations higher than dry season median
concentrations in unfiltered samples. They are not
sufficient however, to substantially elevate the median
concentrations for unfiltered samples in Fig. 8, rela-
tive to filtered samples.
The possible factors controlling the impact of fil-
tration on selected element concentrations has further
been investigated by calculating the Filtration Ratio of
the element concentration in the unfiltered sample to
the concentration in the corresponding filtered sample.
This ratio has then been plotted against factors such as
Total Suspended Solids (TSS), pH and electrical con-
ductivity. The Filtration Ratios did not show any sig-
nificant correlation with electrical conductivity (i.e.
salinity) of the water sample. Fig. 9 demonstrates the
relationship of the Filtration Ratio with field pH and
TSS for six elements with rather different geochemical
properties, and where most samples are above the
analytical detection limit (hence giving reliable values
of Ratios). It will be seen that, for Fe and Mn, there is a
clear relationship between the Filtration Ratio and
TSS, even down to relatively small concentrations of
TSS. For Mg, Ba, Ca (not shown) and Si, there is also a
demonstrable relationship with TSS, but only when
TSS exceeds a specific threshold. For As, the relation-
ship with TSS is not clearly demonstrated, although
there is some tendency to an elevated Ratio at high
TSS. Note that, for all elements, the highest ratios are
observed in the rainy season.
Direct examination of the relationship between the
Filtration Ratio and field pH is problematic due to the
clustering of pH values. To overcome this, the data set
has been ranked according to field pH and five subsets
defined on the basis of 20 percentile groupings
according to pH. Boxplots have been constructed in
Fig. 9 for each subset. This technique fails to demon-
strate any relationship between the Filtration Ratio
and pH for most elements (e.g. As, Ba, Mg and Si).
However, for Fe and Mn, there is a clear increase in
ratio from low to slightly alkaline pH. It is suggested
that that this is related to the progressive formation of
manganese and ferric oxyhydroxide flocs with in-
creasing pH:
4Fe2+ + 10H2O + O2 = 4Fe(OH)3 + 8H+(aq)
Fig. 9 would appear to suggest that, at low
concentrations of TSS, the dominant particulate
forms are flocs of iron, manganese and possibly
aluminium oxyhydroxides, whose concentrations in-
crease both with increasing TSS and increasing pH.
Silicate and carbonate particulate phases appear to
be less important and only become significant at
higher concentrations of TSS. The highest ratios of
unfiltered/filtered concentrations occur in the rainy
season samples. This would appear to confirm that
hypothesis that the differences in element concentra-
tions between filtered and unfiltered aliquots of
individual samples are related to that sample’s par-
ticulate content. The particulate content tends to be
elevated during the rainy season, due to higher
stream-flows having the capacity to mobilise and
retain in suspension higher concentrations of partic-
ulate matter.
7. Conclusions
Samples of surface water from the catchment areas
of the Salars de Uyuni and Coipasa, which are typi-
cally of high pH and can be rather saline, indicate that
analysed concentrations of the following elements in
most samples are not significantly affected by filtra-
tion at 0.45 Am:
B, Ca, Li, Mg, K, Si, Na, Sr, S
x–y plots demonstrate elevated concentrations of
As in unfiltered aliquots of some samples, compared
with filtered samples. The most likely explanation for
this is some degree of sorption of As onto iron oxy-
hydroxide flocs or particle coatings (Sracek et al.,
2004). However, the difference in median concentra-
tions of As in filtered and unfiltered samples is not
statistically significant at the 95% level, confirming
the findings of Banks et al. (2004) that As is typically
a highly soluble and mobile element in high-pH
environments.
The following elements appear to be impacted by
the filtration process, resulting in elevated concentra-
tions in unfiltered samples, relative to filtered:
Al, Ba, Be, Cd, Cr, Co, Cu, Fe, Pb, Mn, Hg, Ni, P,
Ag, Tl, Ti, V
The impact of filtration appears mainly related to
the passage into unfiltered samples (and subsequent
dissolution in preservative acid) of oxyhydroxide

D. Banks et al. / Journal of Geochemical Exploration 86 (2005) 104–118 117
(e.g. Fe, Mn, Al and co-sorbed/precipitated trace
elements) flocs/particle coatings and possibly non-
calcium carbonate particles. These would be retained
or precipitated on the filter and hence not contribute
to the analysis of filtered samples. The effect of
filtration increases with increasing Total Suspended
Solids (TSS) and increasing pH, suggesting that
such oxyhydroxide flocs preferentially form under
neutral or slightly alkaline pH conditions. The effect
of filtration is due only in minor part to the reten-
tion of silicate or limestone particles on filters (fil-
tration has little effect on Si or Ca concentrations).
At high concentrations of TSS, the significance of
carbonate and silicate particles appears to increase,
however.
Samples taken in the rainy season had higher loads
of suspended particles than those in the dry season.
Consequently, median concentrations of the following
elements in unfiltered samples were higher in the
rainy season than the dry:
Al, Ba, Cu, Fe, Pb, Mn, P, K, Tl, Ti, V
In most cases, this can be explained by the associ-
ation of such elements with particulate phases.
Acknowledgements
The study of the baseline environmental chemistry
of the Salar catchments was performed by URS
Dames and Moore Norge in fulfilment of a contract
issued by the Vice Ministry of Mining and Metallurgy
(Viceministerio de Minerıa y Metalurgia [VMMM])
of the Government of Bolivia to perform the scope of
work delineated under Part D of the Project for the
Environment, Industry and Mining (Proyecto de
Medio Ambiente, Industria y Minerıa [PMAIM]),
Subproject No. 2-D3, bGeneration of Environmental
Baseline InformationQ. Support for the project was
provided by the Nordic Development Fund and the
World Bank.
References
Appelo, C.A.J., Postma, D., 1996. Geochemistry, Groundwater and
Pollution (3rd reprint). Balkema, Rotterdam. 536 pp.
Banks, D., Burke, S.P., Gray, C.G., 1997. Hydrogeochemistry of
coal mine drainage and other ferruginous waters in north Der-
byshire and South Yorkshire, UK. Quarterly Journal of Engi-
neering Geology 30, 257–280.
Banks, D., Hall, G.E.M., Reimann, C., Siewers, U., 1999. Distri-
bution of rare earth elements in crystalline bedrock ground-
waters: Oslo and Bergen regions, Norway. Applied
Geochemistry 14, 27–39.
Banks, D., Markland, H., Smith, P.V., Mendez, C., Rodriguez, J.,
Huerta, A., Sæther, O.M., 2004. Distribution, salinity and pH-
dependence of elements in surface waters of the catchment areas
of the salars of Coipasa and Uyuni, Bolivian Altiplano. Journal
of Geochemical Exploration 84, 141–166.
BSI, 1998. Code of practice for investigation of potentially con-
taminated sites (Draft for public comment), Document 98/
568053 DC, 85 pp. British Standards Institution, London.
Hauge, A., Breedveld, G., 1991. Veiledning i miljøtekniske grun-
nundersøkelser (Guidance in environmental ground investiga-
tions-in Norwegian). Statens forurensningstilsyn guidance
document no. 91.01 (TA-720/1991), Statens forurensningstil-
syn, Oslo, 110 pp.
Horowitz, A.J., Lum, K.R., Garbarino, J.R., Hall, G.E.M., Lemieux,
C., Demas, C.R., 1996. Problems associated with using filtration
to define dissolved element concentrations in natural water
samples. Environmental Science and Technology 30, 954–963.
Mather, J., 1997. Collection and analysis of groundwater samples.
In: Sæther, O.M., de Caritat, P. (Eds.), Geochemical Processes,
Weathering and Groundwater Recharge in Catchments. Balk-
ema, Rotterdam, pp. 167–184.
Quintanilla, J., Coudrain-Ribstein, A., Martinez, J., Camacho, V.,
1995. Hidroquımica de las aguas del Altiplano de Bolivia
(Hydrochemistry of the waters of the Bolivian Altiplano-in
Spanish). In: Ribstein, P., Francou, B., Coudrain-Ribstein, A.,
Mourguiart, P. (Eds.), Eaux, Glaciers et Changements Clima-
tiques dans les Andes Tropicales, Bulletin de l’Institut Francais
d’ Etudes Andines, vol. 24(3), pp. 461–471.
Reimann, C., Siewers, U., Skarphagen, S., Banks, D., 1999. Influ-
ence of filtration on concentrations of 62 elements analysed on
crystalline bedrock groundwater samples by ICPMS. Science of
the Total Environment 234, 155–173.
Sracek, O., Bhattacharya, P., Jacks, G., Gustafsson, J-P., von Broms-
sen, M., 2004. Behavior of arsenic and geochemical modeling
of arsenic enrichment in aqueous environments. Applied Geo-
chemistry 19, 169–180.
UNESCO, WHO, UNEP, 1992. Water Quality Assessments—a
Guide to use of Biota, Sediments and Water in Environmental
Monitoring, 2nd edition. UNESCO/WHO/UNEP.
URS Dames, Moore Norge, 2000. Generation of environmental
baseline information—Salar De Uyuni and Salar De Coipasa.
Final report, PMAIM Sub-project No. 2-D3, prepared for Vice-
ministerio de Minerıa y Metalurgia, Bolivia. URS Dames and
Moore Norge, November 30, 2000.
USGS, 1984. National handbook of recommended methods for
water-data acquisition. Chemical and Physical Quality of
Water and Sediment. United States Department of the Interior,
Geological Survey. Chapter 5.
USGS, 2004. National field manual for the collection of water-
quality data. United States Geological Survey, Office of
Water Quality. Handbooks for Water-Resources Investigations

D. Banks et al. / Journal of Geochemical Exploration 86 (2005) 104–118118
Book 9. Last modified 15/4/2004, http://water.usgs.gov/owq/
FieldManual/index.html.
USGS, GEOBOL, 1992. Geology and mineral resources of the
Altiplano and Cordillera Occidental, Bolivia. United States
Geological Survey Bulletin 1975, 365 pp., plus maps.
Yeskis, D., Zavala, B. 2002. Ground-water sampling guidelines for
superfund and RCRA project managers. US Environmental Pro-
tection Agency, Office of Solid Waste and Emergency Response,
GroundWater Forum Issue Paper EPA 542-S-02-001, May 2002.
http://www.epa.gov/tio/tsp/download/gw_sampling_guide.pdf.
Copyright © 2022 FDOKUMEN