The flux profile of a blowing sand cloud: a wind tunnel investigation
12
The flux profile of a blowing sand cloud: a wind tunnel investigation Zhibao Dong * , Xiaoping Liu, Hongtao Wang, Aiguo Zhao, Xunming Wang Laboratory of Blown Sand Physics and Desert Environments, Cold and Arid Regions Environmental and Engineering Research Institute, Chinese Academy of Sciences, No. 260, West Donggang Road, Lanzhou, Gansu Province 730000, PR China Received 25 January 2002; received in revised form 19 March 2002; accepted 27 April 2002 Abstract The flux profile of a blowing sand cloud, or the variation of blown sand flux with height, is the reflection of blown sand particles that move in different trajectories, and also the basis for checking drifting sand. Here we report the wind tunnel results of systematic tests of the flux profiles of different sized sands at different free-stream wind velocities. The results reveal that within the 60-cm near-surface layer, the decay of blown sand flux with height can be expressed by an exponential function: q h = aexp( h/b), where, q h is the blown sand transport rate at height h, a and b are parameters that vary with wind velocity and sand size. The significance of coefficient a and b in the function is defined: a represents the transport rate in true creep and b implies the relative decay rate with height of the blown sand transport rate. The true creep fraction, the ratio of the sand transported on the surface (h = 0) to the total transport varies widely, decreasing with both sand size and wind speed. The flux profiles are converted to straight lines by plotting sand transport rate, q h , on a log-scale. The slope of the straight lines that represents the relative decay rate with height of sand transport rate decreases with an increase in free-stream wind velocity and sand grain size, implying that relatively more of the blown sand is transported to greater heights as grain size and wind speed increase. The average saltating height represented by the height where 50% of the cumulative flux percentage occurs increases with both wind speed and grain size, implying that saltation becomes more intense as grain size and/or wind velocity increase. D 2002 Elsevier Science B.V. All rights reserved. Keywords: Aeolian transport; Flux profile; Relative decay rate; Average saltation height; Creep fraction 1. Introduction Study of the transport of blown sand has been of continuing significance for decades. Humans have lived with the hazards of blown sand for centuries. Hurricanes or tornadoes demonstrate the potential power of the wind, but the destruction of natural resources by sand-laden wind is more devastating when the wind erodes loose ground. The eroded material generates tremendous clouds that may reduce the atmospheric visibility, impede traffic, damage crops and electric lines, interfere with communication, abrade constructions and machines, and degrade val- uable nonrenewable soil resources. The problem of blown sand transport becomes more serious as the climate gets dry and more bare ground is exposed to the wind by adverse human activities such as land 0169-555X/02/$ - see front matter D 2002 Elsevier Science B.V. All rights reserved. PII:S0169-555X(02)00170-8 * Corresponding author. Tel.: +86-931-827-1167; fax: +86-931- 827-3894. E-mail address: [email protected] (Z. Dong). www.elsevier.com/locate/geomorph Geomorphology 49 (2002) 219 – 230
Transcript of The flux profile of a blowing sand cloud: a wind tunnel investigation

The flux profile of a blowing sand cloud:
a wind tunnel investigation
Zhibao Dong *, Xiaoping Liu, Hongtao Wang, Aiguo Zhao, Xunming Wang
Laboratory of Blown Sand Physics and Desert Environments, Cold and Arid Regions Environmental and Engineering Research Institute,
Chinese Academy of Sciences, No. 260, West Donggang Road, Lanzhou, Gansu Province 730000, PR China
Received 25 January 2002; received in revised form 19 March 2002; accepted 27 April 2002
Abstract
The flux profile of a blowing sand cloud, or the variation of blown sand flux with height, is the reflection of blown sand
particles that move in different trajectories, and also the basis for checking drifting sand. Here we report the wind tunnel results
of systematic tests of the flux profiles of different sized sands at different free-stream wind velocities. The results reveal that
within the 60-cm near-surface layer, the decay of blown sand flux with height can be expressed by an exponential function:
qh = aexp(� h/b), where, qh is the blown sand transport rate at height h, a and b are parameters that vary with wind velocity and
sand size. The significance of coefficient a and b in the function is defined: a represents the transport rate in true creep and b
implies the relative decay rate with height of the blown sand transport rate. The true creep fraction, the ratio of the sand
transported on the surface (h = 0) to the total transport varies widely, decreasing with both sand size and wind speed. The flux
profiles are converted to straight lines by plotting sand transport rate, qh, on a log-scale. The slope of the straight lines that
represents the relative decay rate with height of sand transport rate decreases with an increase in free-stream wind velocity and
sand grain size, implying that relatively more of the blown sand is transported to greater heights as grain size and wind speed
increase. The average saltating height represented by the height where 50% of the cumulative flux percentage occurs increases
with both wind speed and grain size, implying that saltation becomes more intense as grain size and/or wind velocity increase.
D 2002 Elsevier Science B.V. All rights reserved.
Keywords: Aeolian transport; Flux profile; Relative decay rate; Average saltation height; Creep fraction
1. Introduction
Study of the transport of blown sand has been of
continuing significance for decades. Humans have
lived with the hazards of blown sand for centuries.
Hurricanes or tornadoes demonstrate the potential
power of the wind, but the destruction of natural
resources by sand-laden wind is more devastating
when the wind erodes loose ground. The eroded
material generates tremendous clouds that may reduce
the atmospheric visibility, impede traffic, damage
crops and electric lines, interfere with communication,
abrade constructions and machines, and degrade val-
uable nonrenewable soil resources. The problem of
blown sand transport becomes more serious as the
climate gets dry and more bare ground is exposed to
the wind by adverse human activities such as land
0169-555X/02/$ - see front matter D 2002 Elsevier Science B.V. All rights reserved.
PII: S0169 -555X(02 )00170 -8
* Corresponding author. Tel.: +86-931-827-1167; fax: +86-931-
827-3894.
E-mail address: [email protected] (Z. Dong).
www.elsevier.com/locate/geomorph
Geomorphology 49 (2002) 219–230
reclamation and over-grazing, as is evidenced by the
more frequent dust storms in the desertified arid and
semiarid zones.
The problems caused by blown sand are related not
only to the amount transported, but also to the vertical
distribution of the transported material. The flux
profile of a blowing sand cloud, or the variation with
height of blown sand flux, also termed the structure of
a blowing sand cloud, is a reflection of blown sand
particles that move in different trajectories, and also
the basis for checking drifting sand (Wu, 1987).
Though considerable efforts have been devoted to
quantifying the amount of wind-transported material
(Bagnold, 1941; Greeley and Iversen, 1985; Fryrear et
al., 1991) and many theoretical and empirical equa-
tions have been developed (Greeley and Iversen,
1985; Pye and Tsoar, 1990), the flux profile of blow-
ing sand cloud has not been well defined yet. The
variation of blown sand flux with height, in most
cases, used to be described qualitatively (Bagnold,
1936; Chepil, 1945; Sharp, 1964; Wu, 1987).
Some researchers have attempted to describe the
flux profile of a blowing sand cloud quantitatively
through theoretical analysis and available field obser-
vation or wind tunnel data (Rouse, 1937, quoted by
Anderson and Hallet, 1986; Karamura, 1951; Zingg,
1953; Chepil and Woodruff, 1957; Znamenskii, 1960;
Williams, 1964; Gillette et al., 1974; Gillette and
Walker, 1977; Nickling, 1978; Takeuchi, 1980; Gree-
ley et al., 1983; Gerety and Slingerland, 1983;
Fryrear, 1987; Vories and Fryrear, 1991; Fryrear
and Saleh, 1993; Chen et al., 1996). In general, two
kinds of functions: power function and exponential
function, have been suggested to describe the flux
profile of a blowing sediment cloud. Blown particles
usually move in three modes: creep, saltation and
suspension (Bagnold, 1941). Factors, such as particle
size, wind, surface properties that influence sediment
particle movement will influence the flux profile. For
example, different functions have been proposed to
describe the flux profiles of different transport modes
in the recent decades (Takeuchi, 1980; Greeley et al.,
1983; Gerety and Slingerland, 1983; Fryrear, 1987;
Vories and Fryrear, 1991; Fryrear and Saleh, 1993;
Chen et al., 1996). Takeuchi (1980) thought that
snow saltation fell off exponentially with height,
whereas suspension profiles fell off by a power
function with height. Greeley et al. (1983) and Gerety
and Slingerland (1983) concluded that the mass flux
in saltation decreased exponentially with height
Fig. 1. The aerodynamic outline of the wind tunnel.
Z. Dong et al. / Geomorphology 49 (2002) 219–230220

above the bed for all their tests. After reanalyzing the
published data, Anderson and Hallet (1986) suggested
an exponential for the saltation flux profile and a
power function for the suspension profile. Though
the conditions are different between a wind tunnel
and the field, the suggested exponential function for
saltation flux and power function for suspension flux
were found to agree well with both the subsequent
field observation and wind tunnel test results (Fryrear,
1987; Vories and Fryrear, 1991; Fryrear and Saleh,
1993). However, Chen et al.’s (1996) results of the
vertical distribution of wind-blown sand flux in the
Taklimakan Desert, China revealed that the saltation
flux profile can be described by neither exponential
function nor power function.
Our knowledge about the quantitative expression
of blown sand flux profile is in need of improvement,
especially the physical significance of the parameters
in the expressions. Systematic tests and field obser-
vation are needed. The existing results suffer the
following limitations: (1) The collected blown sand
samples were not classified with respect to height
enough to get the accurate results. Zingg (1953)
caught mass flux samples at only four heights.
Williams (1964), Gerety and Slingerland (1983),
and Fryrear and Saleh (1993) obtained their results
based only on five sampling heights. The maximum
number of sampling heights of Chen et al. (1996) was
no more than 20 within the 40-cm near-surface layer.
(2) The division of the blown sand transport modes in
practice was arbitrary and it is difficult to describe the
flux profiles of different transport mode respectively.
In many wind tunnel tests and field observations,
suspension and saltation are mixed together though
their relative proportions are different. Recent studies
show that there is no clear distinction between
saltation and creep, creep can be considered as a kind
of saltation with low angle and short trajectory
Fig. 2. The sand sampler used in the test.
Fig. 3. Layout of the test.
Z. Dong et al. / Geomorphology 49 (2002) 219–230 221

Fig. 4. Wind tunnel results of the flux profiles of blowing sand cloud [(1) d= 0.80–1.00 mm, (2) d= 0.63–0.80 mm, (3) d= 0.56–0.63 mm, (4) d= 0.50–0.56 mm, (5) d= 0.40–0.50
mm, (6) d= 0.25–0.40 mm, (7) d= 0.20–0.25 mm, (8) d= 0.15–0.20 mm, (9) d= 0.10–0.15 mm].
Z.Donget
al./Geomorphology49(2002)219–230
222
(Lancaster, 1995; Livingstone and Warren, 1996). (3)
Although many quantitative functions have been
suggested for the flux profile of a blowing sand
cloud, the significance of the key parameters in the
function has not been defined. This limits the further
extension of these functions. (4) The flux profile of a
blowing sand cloud is greatly influenced by surface
conditions, the existing results are obtained from
different surface conditions so that they are difficult
to be compared.
A loose sandy surface is the most common surface
in desert regions where blown sand is very active. We
have measured the blown sand flux at different
heights in a wind tunnel. Here we report a part of
the study: (1) to investigate the flux profile of a
blowing sand cloud on loose sandy bed; (2) to define
the physical significance of the parameters in flux
profiles and their relationship to grain size and wind
velocity; (3) to discuss the average saltation height of
blown sand and the influencing factors.
2. Experimental methods
The experiment was carried out in the wind tunnel
at the Shapotou Desert Experimental Research Sta-
tion, Institute of Desert Research, Chinese Academy
of Sciences. The blow-type non-circulating wind
tunnel (Fig. 1) has a total length of 37 m and is
composed of a power section (2.60 m long), expan-
sion section (6.40 m long), stabilization section (1.50
m long, where drag screens and honeycombs are set to
reduce large-scale eddying), compression section
(2.50 m long), work section (21 m long) and diffusion
section (3 m long) (Fig. 1). The maximum cross-
sectional area at the expansion section is 2.4 m� 1.2
m. The 21-m-long working section has a cross-sec-
tional area of 1.2 m� 1.2 m. Wind speed can be
changed continuously from 2 to 30 m s � 1. The
stability coefficient of air flow, g < 3.0%, uniformity
coefficient of wind speed du < 2.0%, average turbu-
lence e = 0.6%, the axial static pressure gradient AdCp/
dxA = 0.01 m � 1. The depth of boundary layer can
reach 40–50 cm in the work section.
The main purpose of this experiment is to measure
the flux profile of a blowing sand cloud with different
sizes at different wind velocities. Natural sand from
the field was sifted into nine size groups for tests:
0.10–0.15, 0.15–0.20, 0.20–0.25, 0.25–0.40, 0.40–
0.50, 0.50–0.56, 0.56–0.63, 0.63–0.80 and 0.80–
1.00 mm.
Blown sand flux was measured by a segmented
sand sampler (Fig. 2). The sampler is 60 cm tall and
sectionalized into sixty 1� 0.5-cm openings to collect
the blown sand at 60 heights at 1 cm intervals. Each
opening is connected to a sand chamber that is
removed after the test to weigh the collected sand
inside using a 1/1000 g electronic balance. The spacer
between the openings is made very thin to reduce the
measurement error. To minimize the interference of the
sand sampler to the airflow, the leading part of the
sampler is made wedge-shaped so that the width of the
sand chamber is 1.5 cm while the width of openings is
only 0.5 cm. A screened vertical vent is connected to
each sand chamber to minimize the air pressure in the
sand chamber and maximize the collection efficiency.
The sampler that was evaluated in a wind tunnel before
use proved to be good for collecting aeolian sands,
especially particles over 0.1 mm in diameter whose
inter-particle cohesion is not significant, the overall
efficiency is over 90%.
In the experiment, the sampler was set 16 m down-
wind from the entrance of the work section of the wind
tunnel, 5 cm apart from the sand tray upwind. The
bottom of the lowest opening of the sampler was set
flush with the tunnel floor. The sand tray upwind of the
sand sampler is 4 m long, 0.8 m wide and 2.5 cm deep.
The chosen length of the sand tray ensured the full
development of the saltation cloud. The prepared sand
samples were put in the sand tray, and the surface was
leveled to the tunnel floor, then blown by the required
free-stream (centerline, 60 cm above the tunnel floor)
Table 1
The measured threshold shear velocity of the tested sandsa
d (mm) 0.80–1.00 0.63–0.80 0.56–0.63 0.50–0.56 0.40–0.50 0.25–0.40 0.20–0.25 0.15–0.20 0.10–0.15
V * t (cm s� 1) 50.99 50.01 48.58 47.31 44.45 40.33 39.14 36.89 35.29
Vt (m s� 1) 12.15 11.35 9.90 9.06 8.21 7.59 7.11 5.56 4.73
a d is the sand grain diameter, V * t is the threshold shear velocity, Vt is the threshold velocity measured at centerline height.
Z. Dong et al. / Geomorphology 49 (2002) 219–230 223
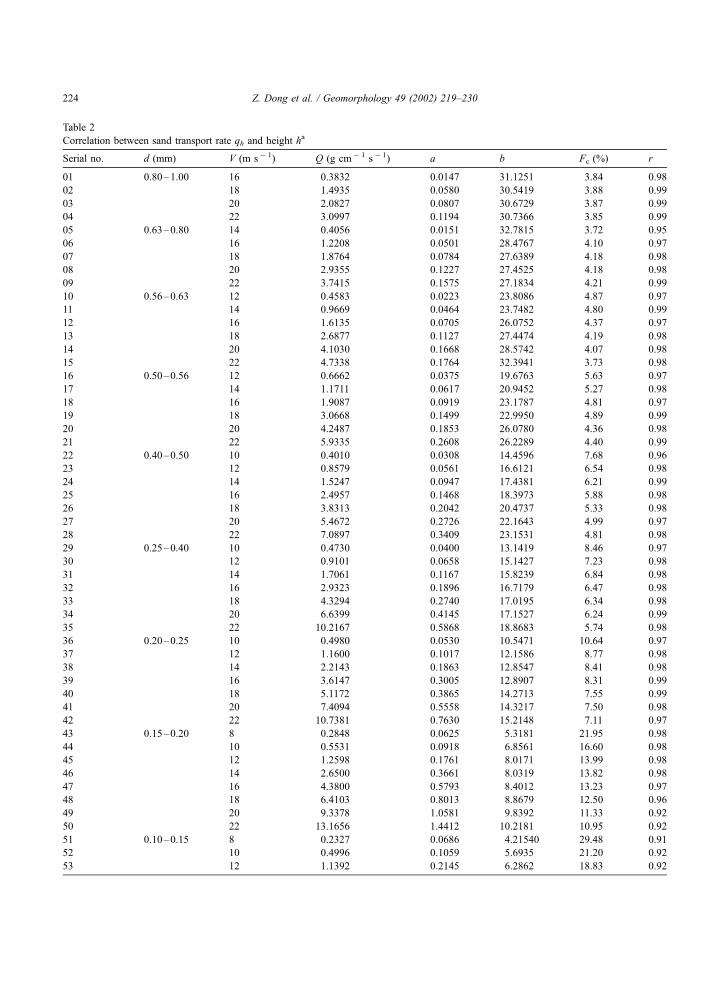
Table 2
Correlation between sand transport rate qh and height ha
Serial no. d (mm) V (m s� 1) Q (g cm� 1 s� 1) a b Fc (%) r
01 0.80–1.00 16 0.3832 0.0147 31.1251 3.84 0.98
02 18 1.4935 0.0580 30.5419 3.88 0.99
03 20 2.0827 0.0807 30.6729 3.87 0.99
04 22 3.0997 0.1194 30.7366 3.85 0.99
05 0.63–0.80 14 0.4056 0.0151 32.7815 3.72 0.95
06 16 1.2208 0.0501 28.4767 4.10 0.97
07 18 1.8764 0.0784 27.6389 4.18 0.98
08 20 2.9355 0.1227 27.4525 4.18 0.98
09 22 3.7415 0.1575 27.1834 4.21 0.99
10 0.56–0.63 12 0.4583 0.0223 23.8086 4.87 0.97
11 14 0.9669 0.0464 23.7482 4.80 0.99
12 16 1.6135 0.0705 26.0752 4.37 0.97
13 18 2.6877 0.1127 27.4474 4.19 0.98
14 20 4.1030 0.1668 28.5742 4.07 0.98
15 22 4.7338 0.1764 32.3941 3.73 0.98
16 0.50–0.56 12 0.6662 0.0375 19.6763 5.63 0.97
17 14 1.1711 0.0617 20.9452 5.27 0.98
18 16 1.9087 0.0919 23.1787 4.81 0.97
19 18 3.0668 0.1499 22.9950 4.89 0.99
20 20 4.2487 0.1853 26.0780 4.36 0.98
21 22 5.9335 0.2608 26.2289 4.40 0.99
22 0.40–0.50 10 0.4010 0.0308 14.4596 7.68 0.96
23 12 0.8579 0.0561 16.6121 6.54 0.98
24 14 1.5247 0.0947 17.4381 6.21 0.99
25 16 2.4957 0.1468 18.3973 5.88 0.98
26 18 3.8313 0.2042 20.4737 5.33 0.98
27 20 5.4672 0.2726 22.1643 4.99 0.97
28 22 7.0897 0.3409 23.1531 4.81 0.98
29 0.25–0.40 10 0.4730 0.0400 13.1419 8.46 0.97
30 12 0.9101 0.0658 15.1427 7.23 0.98
31 14 1.7061 0.1167 15.8239 6.84 0.98
32 16 2.9323 0.1896 16.7179 6.47 0.98
33 18 4.3294 0.2740 17.0195 6.34 0.98
34 20 6.6399 0.4145 17.1527 6.24 0.99
35 22 10.2167 0.5868 18.8683 5.74 0.98
36 0.20–0.25 10 0.4980 0.0530 10.5471 10.64 0.97
37 12 1.1600 0.1017 12.1586 8.77 0.98
38 14 2.2143 0.1863 12.8547 8.41 0.98
39 16 3.6147 0.3005 12.8907 8.31 0.99
40 18 5.1172 0.3865 14.2713 7.55 0.99
41 20 7.4094 0.5558 14.3217 7.50 0.98
42 22 10.7381 0.7630 15.2148 7.11 0.97
43 0.15–0.20 8 0.2848 0.0625 5.3181 21.95 0.98
44 10 0.5531 0.0918 6.8561 16.60 0.98
45 12 1.2598 0.1761 8.0171 13.99 0.98
46 14 2.6500 0.3661 8.0319 13.82 0.98
47 16 4.3800 0.5793 8.4012 13.23 0.97
48 18 6.4103 0.8013 8.8679 12.50 0.96
49 20 9.3378 1.0581 9.8392 11.33 0.92
50 22 13.1656 1.4412 10.2181 10.95 0.92
51 0.10–0.15 8 0.2327 0.0686 4.21540 29.48 0.91
52 10 0.4996 0.1059 5.6935 21.20 0.92
53 12 1.1392 0.2145 6.2862 18.83 0.92
Z. Dong et al. / Geomorphology 49 (2002) 219–230224

wind velocity above the initiation threshold. Because it
took some time for the wind tunnel to reach a pre-set
free-stream wind speed, an automatic sliding lid cov-
ered the sand tray until the required wind speed was
reached so that the sand was not blown away. The
wind tunnel was powered off when about 2 cm of the
top sand in the tray was blown away. For each sample
at each free-stream wind velocity, three repetitions
were made to get the mean values. Fig. 3 illustrates
the layout of the sand tray and sampler.
3. Analysis of the results
The maximum free-stream wind speed tested was
22 m s� 1. We obtained 58 groups of mass flux data
(each group is the mean of three repetitions) for
analysis (Fig. 4). The coarser the sand, the fewer the
wind speeds tested because the initiation threshold
velocity changes with grain size (Table 1). The decay
curves of blown sand flux with height are similar for
all the grain sizes and wind speeds tested. The total
transport rate increases with wind speed but decreases
with grain size. Fig. 4 indicates that the increase in the
total transport rate results in an increase in the trans-
port rate at every layer.
Regression analyses show that for all grain sizes
and wind speeds, the transport rate decreases expo-
nentially with height
qh ¼ aexpð�h=bÞ ð1Þ
where, qh is the blown sand transport rate at height h,
in grams per centimeter per second, h is height, in
centimeters, a and b are regressive coefficients. Table
Serial no. d (mm) V (m s� 1) Q (g cm� 1 s� 1) a b Fc (%) r
54 14 2.4702 0.5009 5.7398 20.28 0.95
55 16 4.4214 0.8653 5.8603 19.57 0.95
56 18 7.0073 1.2067 6.6695 17.22 0.89
57 20 10.7681 1.8452 6.52048 17.14 0.96
58 22 15.6736 2.4033 7.2367 15.33 0.95
a Fittet function: qh= aexp(� h/b), qh is in grams per centimeter per second, h is in centimeters, d is the sand grain diameter, V is free-stream
wind velocity, Q is the total sand transport rate, Fc is the creep fraction, r is the squared correlation coefficient.
Fig. 5. The transport fraction in true creep at different wind speeds for different sand sizes.
Table 2 (continued )
Z. Dong et al. / Geomorphology 49 (2002) 219–230 225
2 indicates that the correlation between transport rate
and height is reasonably good. In over 90% of the
cases, the correlation coefficient R2 is over 0.95.
Here, the sand transported on the surface (h in Eq.
(1) is zero) is defined as the creep, the ratio of true
creep flux to total sand flux is defined as creep frac-
tion or creep proportion. So, coefficient a in Eq. (1)
represents the transport rate in creep. Table 2 reveals
that the creep transport rate increases with wind
speed, but decreases with grain size while the creep
fraction within the 60-cm layer varies widely, ranging
from about 4% to 29%. Because the maximum
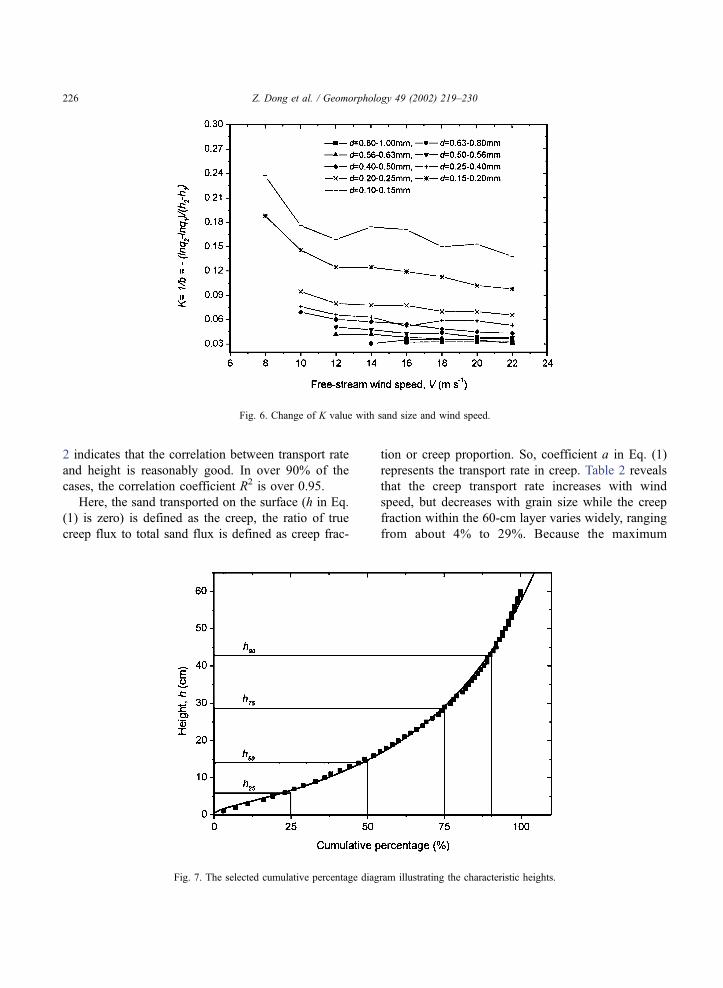
Fig. 6. Change of K value with sand size and wind speed.
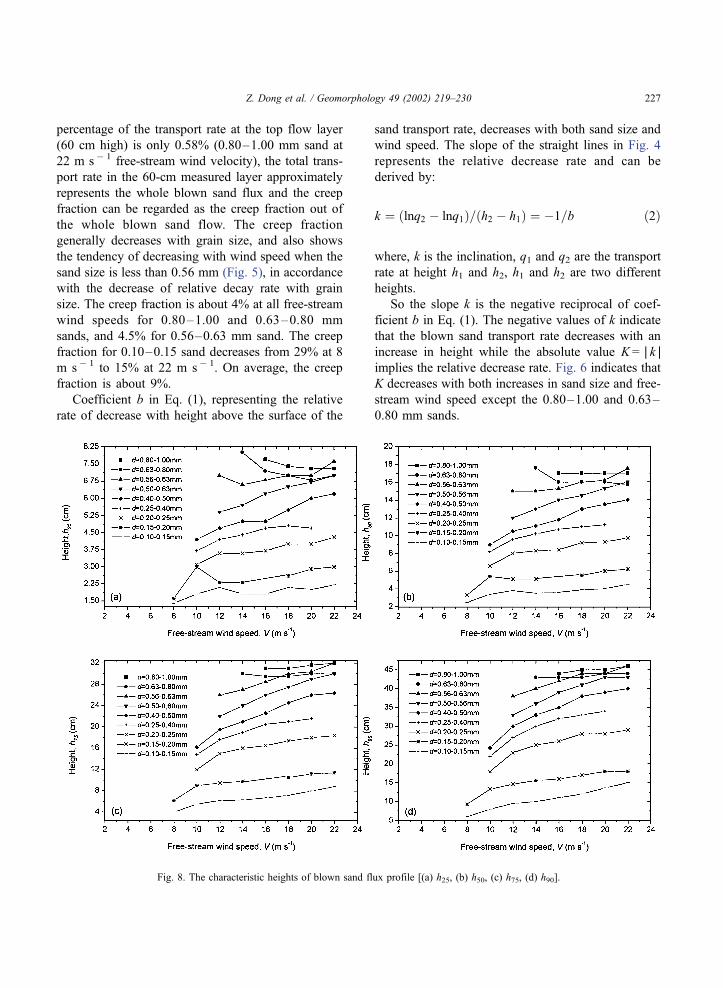
Fig. 7. The selected cumulative percentage diagram illustrating the characteristic heights.
Z. Dong et al. / Geomorphology 49 (2002) 219–230226
percentage of the transport rate at the top flow layer
(60 cm high) is only 0.58% (0.80–1.00 mm sand at
22 m s� 1 free-stream wind velocity), the total trans-
port rate in the 60-cm measured layer approximately
represents the whole blown sand flux and the creep
fraction can be regarded as the creep fraction out of
the whole blown sand flow. The creep fraction
generally decreases with grain size, and also shows
the tendency of decreasing with wind speed when the
sand size is less than 0.56 mm (Fig. 5), in accordance
with the decrease of relative decay rate with grain
size. The creep fraction is about 4% at all free-stream
wind speeds for 0.80–1.00 and 0.63–0.80 mm
sands, and 4.5% for 0.56–0.63 mm sand. The creep
fraction for 0.10–0.15 sand decreases from 29% at 8
m s� 1 to 15% at 22 m s� 1. On average, the creep
fraction is about 9%.
Coefficient b in Eq. (1), representing the relative
rate of decrease with height above the surface of the
sand transport rate, decreases with both sand size and
wind speed. The slope of the straight lines in Fig. 4
represents the relative decrease rate and can be
derived by:
k ¼ ðlnq2 � lnq1Þ=ðh2 � h1Þ ¼ �1=b ð2Þ
where, k is the inclination, q1 and q2 are the transport
rate at height h1 and h2, h1 and h2 are two different
heights.
So the slope k is the negative reciprocal of coef-
ficient b in Eq. (1). The negative values of k indicate
that the blown sand transport rate decreases with an
increase in height while the absolute value K =AkAimplies the relative decrease rate. Fig. 6 indicates that
K decreases with both increases in sand size and free-
stream wind speed except the 0.80–1.00 and 0.63–
0.80 mm sands.
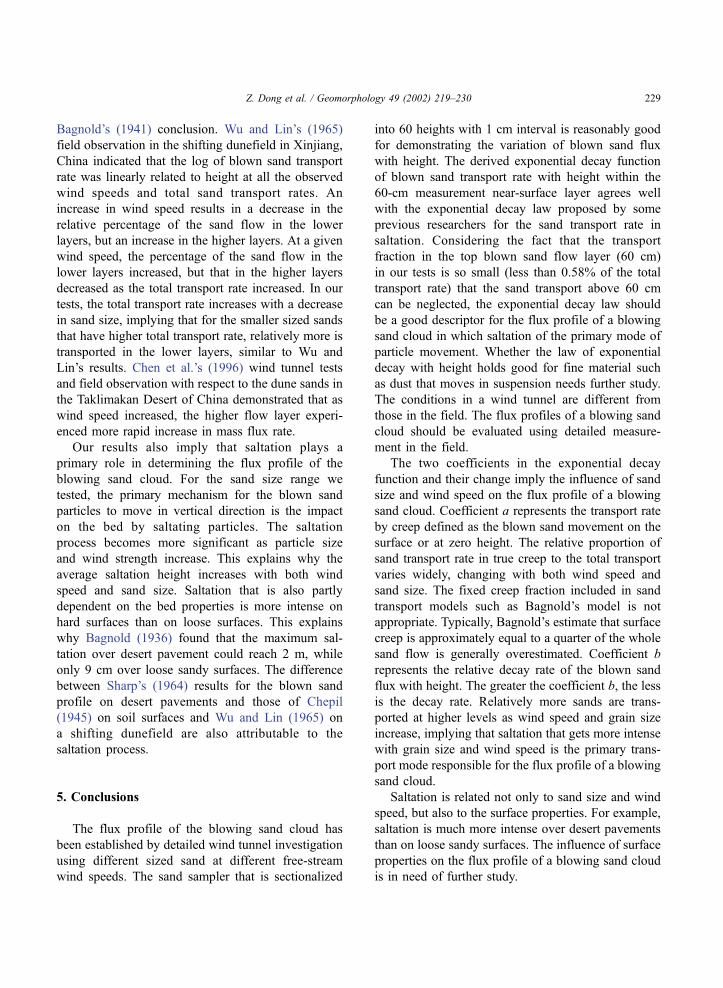
Fig. 8. The characteristic heights of blown sand flux profile [(a) h25, (b) h50, (c) h75, (d) h90].
Z. Dong et al. / Geomorphology 49 (2002) 219–230 227

Four characteristic heights h25, h50, h75 and h90corresponding to the 25%, 50%, 75% and 90% of the
cumulative percentage out of the total transport rate
are derived from the ‘percentage-smaller’ diagram
(Fig. 7). Except for the 0.80–1.00 and 0.63–0.80
mm sands, all the four characteristic heights show the
tendency of increasing with both grain size and wind
speed (Fig. 8). Usually the characteristic height h50,
the height representing the 50% cumulative percent-
age, is defined as the average saltation height ha(Zingg, 1953; Wu, 1987). Zingg (1953) proposed
the empirical relationship between the average salta-
tion height and grain size:
ha ¼ 7:7d3=2s1=4 ð3Þ
where, ha is the average saltation height, in inches, d is
sand grain size, in millimeters, s is the shear stress on
the ground surface, in pound per square inch.
To develop the relationship between average sal-
tation height and sand grain size, we obtained for each
grain size the mean value of the average saltation
height for all wind speeds together in Fig. 8. The
mean average saltation height increases linearly with
the log of sand size.
ham ¼ 184:03þ 71:18lnd R2 ¼ 0:98 ð4Þ
where, ham is the mean average saltation height, in
millimeters, d is the mean grain size, in millimeters.
4. Discussion
The function we got for the blown sand flux profile
(Eq. (1)) is in the same form as the exponential decay
function proposed by Williams (1964) for the 16-cm
near-surface layer based on wind tunnel tests. Most
published results suggest that the blown sand transport
rate in saltation decays with height by a natural
exponential law (Williams, 1964; Takeuchi, 1980;
Greeley et al., 1983; Gerety and Slingerland, 1983;
Anderson and Hallet, 1986; Wu, 1987; Fryrear et al.,
1991; Fryrear and Saleh, 1993). According to Bag-
nold (1941), particles less than 0.08 mm in diameter
are defined as dust and usually move in suspension.
Our results are for sands greater than 0.1 mm in
diameter so that the transport in true suspension is
negligible. So the natural exponential function proves
to be a good descriptor for saltation flux. In the finest
wind-blown sands, the predominant diameter is never
less than 0.08 mm (Bagnold, 1941). Usual values of
blown sand, depending on the locality, lie between
0.15 and 0.3 mm (Bagnold, 1941). In fact, in many
sand transport models, the fraction in true suspension
was neglected (Bagnold, 1941; Greeley and Iversen,
1985). Neglecting the suspension fraction which,
except perhaps in the case of very dusty sand, appears
to be very small indeed, we can therefore think that
the flux profile of a blowing sand cloud obeys the law
of natural exponential decay with height.
The blown sand transport in creep is usually
difficult to measure in both the field and wind tunnel.
The sand movement in true creep at zero height is
sensitive to the surface disturbance such as lowering
the surface level once the erosion occurs. Crude
estimate of the surface creep used to be included in
the blown sand transport model (Bagnold, 1941). Any
ground trap for surface creep such as that used by
Bagnold (1941) is not able to distinguish the blown
sands in true creep and saltation, and the creep
fraction is inevitably overestimated. Bagnold’s
(1941) measurements both in the wind tunnel and in
the open indicated that the surface creep was approx-
imately equal to a quarter of the whole sand flow,
greater than that we suggested above. Our results
suggest that the creep fraction is a function of wind
speed and sand size, which are two important factors
influencing particle movement. Estimating the creep
fraction must specify sand size and wind speed.
The relative decay rate and creep fraction are
closely related. Particles that move between different
layers change the relative decay rate on one hand and
creep fraction on the other hand. Both the variations
of the relative decay rate and creep fraction with wind
speed and grain size imply that relatively more sands
are transported to higher levels as sand grain size and
wind speed increase. This is qualitatively in agree-
ment with some previously reported results (Znamen-
skii, 1960; Wu and Lin, 1965; Chen et al., 1996).
Znamenskii’s (1960) wind tunnel results showed that
within the 10-cm near-surface blown sand flow layer,
the percentage in 0–1 cm layer decreased with wind
speed, that in 1–4 cm layer independent of wind
speed, while those in the layers above 4 cm increased
with wind speed. These imply that blown sand is
transported higher as wind speed increases, similar to
Z. Dong et al. / Geomorphology 49 (2002) 219–230228
Bagnold’s (1941) conclusion. Wu and Lin’s (1965)
field observation in the shifting dunefield in Xinjiang,
China indicated that the log of blown sand transport
rate was linearly related to height at all the observed
wind speeds and total sand transport rates. An
increase in wind speed results in a decrease in the
relative percentage of the sand flow in the lower
layers, but an increase in the higher layers. At a given
wind speed, the percentage of the sand flow in the
lower layers increased, but that in the higher layers
decreased as the total transport rate increased. In our
tests, the total transport rate increases with a decrease
in sand size, implying that for the smaller sized sands
that have higher total transport rate, relatively more is
transported in the lower layers, similar to Wu and
Lin’s results. Chen et al.’s (1996) wind tunnel tests
and field observation with respect to the dune sands in
the Taklimakan Desert of China demonstrated that as
wind speed increased, the higher flow layer experi-
enced more rapid increase in mass flux rate.
Our results also imply that saltation plays a
primary role in determining the flux profile of the
blowing sand cloud. For the sand size range we
tested, the primary mechanism for the blown sand
particles to move in vertical direction is the impact
on the bed by saltating particles. The saltation
process becomes more significant as particle size
and wind strength increase. This explains why the
average saltation height increases with both wind
speed and sand size. Saltation that is also partly
dependent on the bed properties is more intense on
hard surfaces than on loose surfaces. This explains
why Bagnold (1936) found that the maximum sal-
tation over desert pavement could reach 2 m, while
only 9 cm over loose sandy surfaces. The difference
between Sharp’s (1964) results for the blown sand
profile on desert pavements and those of Chepil
(1945) on soil surfaces and Wu and Lin (1965) on
a shifting dunefield are also attributable to the
saltation process.
5. Conclusions
The flux profile of the blowing sand cloud has
been established by detailed wind tunnel investigation
using different sized sand at different free-stream
wind speeds. The sand sampler that is sectionalized
into 60 heights with 1 cm interval is reasonably good
for demonstrating the variation of blown sand flux
with height. The derived exponential decay function
of blown sand transport rate with height within the
60-cm measurement near-surface layer agrees well
with the exponential decay law proposed by some
previous researchers for the sand transport rate in
saltation. Considering the fact that the transport
fraction in the top blown sand flow layer (60 cm)
in our tests is so small (less than 0.58% of the total
transport rate) that the sand transport above 60 cm
can be neglected, the exponential decay law should
be a good descriptor for the flux profile of a blowing
sand cloud in which saltation of the primary mode of
particle movement. Whether the law of exponential
decay with height holds good for fine material such
as dust that moves in suspension needs further study.
The conditions in a wind tunnel are different from
those in the field. The flux profiles of a blowing sand
cloud should be evaluated using detailed measure-
ment in the field.
The two coefficients in the exponential decay
function and their change imply the influence of sand
size and wind speed on the flux profile of a blowing
sand cloud. Coefficient a represents the transport rate
by creep defined as the blown sand movement on the
surface or at zero height. The relative proportion of
sand transport rate in true creep to the total transport
varies widely, changing with both wind speed and
sand size. The fixed creep fraction included in sand
transport models such as Bagnold’s model is not
appropriate. Typically, Bagnold’s estimate that surface
creep is approximately equal to a quarter of the whole
sand flow is generally overestimated. Coefficient b
represents the relative decay rate of the blown sand
flux with height. The greater the coefficient b, the less
is the decay rate. Relatively more sands are trans-
ported at higher levels as wind speed and grain size
increase, implying that saltation that gets more intense
with grain size and wind speed is the primary trans-
port mode responsible for the flux profile of a blowing
sand cloud.
Saltation is related not only to sand size and wind
speed, but also to the surface properties. For example,
saltation is much more intense over desert pavements
than on loose sandy surfaces. The influence of surface
properties on the flux profile of a blowing sand cloud
is in need of further study.
Z. Dong et al. / Geomorphology 49 (2002) 219–230 229

Acknowledgements
We gratefully acknowledge the funding from the
National Key Project for Basic Research
(2000048702), Hundred Talents Project and the
Knowledge Innovation Project of the Chinese Acad-
emy of Sciences (KZCX2-304), and the Natural
Science Foundation of China (NSFC40001005). We
wish to thank Mr. G. Wang for his help in wind tunnel
experiment, and Dr. G. Wu and Mr. B. He for
preparing the illustrations. Profs. N. Lancaster and D.
Goossens’s valuable comments improving the manu-
script are especially acknowledged.
References
Anderson, R.S., Hallet, B., 1986. Sediment transport by wind: to-
ward a general model. Geological Society of America Bulletin
97, 523–535.
Bagnold, R.A., 1936. The movement of desert sand. Proceedings of
Royal Society of London, Series A 157, 594–620.
Bagnold, R.A., 1941. The Physics of Blown Sand and Desert
Dunes. Methuen & Co., London, 265 pp.
Chen, W., Yang, Z., Zhang, J., Han, Z., 1996. Vertical distribution
of wind-blown sand flux in the surface layer, Taklimakan Des-
ert, Central Asia. Physical Geography 17, 193–218.
Chepil, W.S., 1945. Dynamics of wind erosion: nature of movement
of soil by wind. Soil Science 60, 305–320.
Chepil, W.S., Woodruff, N.P., 1957. Sedimentary characteristics of
dust storms: II. Visibility and dust concentration. American
Journal of Science 255, 104–114.
Fryrear, D.W., 1987. Aerosol measurements from 31 dust storms.
In: Ariman, T., Veziroglu, T.N. (Eds.), Particulate and Multi-
phase Flows: Contamination Analysis and Control. Hemisphere
Publishing, New York, pp. 407–415.
Fryrear, D.W., Saleh, A., 1993. Field wind erosion: vertical distri-
bution. Soil Science 155, 294–300.
Fryrear, D.W., Stout, J.E., Hagen, L.J., Vories, E.D., 1991. Wind
erosion: field measurement and analysis. Transactions of the
ASAE 34, 155–160.
Gerety, K.M., Slingerland, R., 1983. Nature of saltation population
in wind tunnel experiments with heterogeneous size-density
sands. In: Brookfield, M.E., Ahlbrand, T.S. (Eds.), Eolian Sedi-
ments and Processes: Developments in Sedimentology. Elsevier,
Amsterdam, pp. 115–131.
Gillette, D.A., Walker, T.R., 1977. Characteristics of airborne par-
ticles produced by wind erosion of sandy soil, high plains of
west Texas. Soil Science 123, 97–110.
Gillette, D.A., Blifford, I.H., Fryrear, D.W., 1974. The influence of
wind velocity on the size distribution of aerosols generated by
wind erosion of soils. Journal of Geophysical Research 79,
4068–4075.
Greeley, R., Iversen, J.I., 1985. Wind As A Geological Process on
Earth, Mars, Venus and Titan. Cambridge Univ. Press, Cam-
bridge, 33 pp.
Greeley, R., Williams, S.H., Marshall, J.R., 1983. Velocities of
wind-blown particles in saltation: preliminary laboratory and
field measurements. In: Brookfield, M.E., Ahlbrandt, T.S.
(Eds.), Eolian Sediments and Processes: Developments in Sed-
imentology. Elsevier, Amsterdam, pp. 133–148.
Karamura, R., 1951. Study on Sand Movement by Wind, Report 5.
Institute of Science and Technology, Tokyo, pp. 95–112.
Lancaster, N., 1995. Geomorphology of Desert Dunes Routledge,
London, 290 pp.
Livingstone, I., Warren, A., 1996. Aeolian Geomorphology: an In-
troduction Addison Wesley Longman, England, 211 pp.
Nickling, W.G., 1978. Eolian sediment transport during dust storms:
Slims River Valley, Yukon Territory. Canadian Journal of Earth
Science 15, 1069–1084.
Pye, K., Tsoar, H., 1990. Aeolian Sand and Sand Dunes. Unwin
Hyman, London, 396 pp.
Sharp, R.P., 1964. Wind-driven sand in Coachella Valley, Califor-
nia. Geological Society of America Bulletin 75, 785–830.
Takeuchi, M., 1980. Vertical profile and horizontal increase of drift-
snow transport. Journal of Glaciology 26, 4492–4498.
Vories, E.D., Fryrear, D.W., 1991. Vertical distribution of wind-
eroded soil over a smooth, bare field. Transactions of the ASAE
34, 1763–1768.
Williams, G., 1964. Some aspects of aeolian transport load. Sedi-
mentology 3, 257–287.
Wu, Z., 1987. Aeolian Geomorphology (in Chinese). Science Press,
Beijing, 316 pp.
Wu, Z., Lin, Y., 1965. A preliminary study on blown sand move-
ment and its control. Blown Sand Control Research (in Chinese)
7, 7–14.
Zingg, A.W., 1953. Some characteristics of aeolian sand movement
by saltation process. Edition du Centre National de la Recherche
Scientifique 7, 197–208.
Znamenskii, A.I., 1960. Experimental Investigation of Wind Ero-
sion of Sandland and the Control of Drifting Sand (Chinese
version translated by Yang, Y.). Science Press, Beijing, 120 pp.
Z. Dong et al. / Geomorphology 49 (2002) 219–230230