Influence of sand density and retaining wall stiffness on the three-dimensional responses of a...
54
Influence of sand density and retaining wall stiffness on the three- 1 dimensional responses of a tunnel to basement excavation 2 3 C.W.W. Ng 1 , Jiangwei Shi 2 , David Mašín 3 , Huasheng Sun 4 , and G.H. Lei 5 4 5 An article submitted to CGJ for consideration of possible publication 6 7 Corresponding author: Mr Jiangwei Shi 8 Research student, Department of Civil and Environmental Engineering, Hong Kong 9 University of Science and Technology, Clear Water Bay, Kowloon, Hong Kong. 10 E-mail: [email protected] 11 Tel: 852-6762-9710 12 13 Co-author: Dr C. W. W. Ng 14 Chair Professor, Department of Civil and Environmental Engineering, Hong Kong University 15 of Science and Technology, Clear Water Bay, Kowloon, Hong Kong. 16 E-mail: [email protected] 17 Tel: 852-2358-8760 18 Fax: 852-2358-1534 19 20 Co-author: Dr David Mašín 21 Associate Professor, Department of Engineering Geology, Institute of Hydrogeology, 22 Engineering Geology and Applied Geophysics, Faculty of Science, Charles University in 23 Prague, Prague, Czech Republic. 24 E-mail: [email protected] 25 26 Co-author: Mr Huasheng Sun 27 Research Student, Key Laboratory of Geomechanics and Embankment Engineering of the 28 Ministry of Education, Geotechnical Research Institute, Hohai University, 1 Xikang Road, 29 Nanjing, China. 30 E-mail: [email protected] 31 32
Transcript of Influence of sand density and retaining wall stiffness on the three-dimensional responses of a...

Influence of sand density and retaining wall stiffness on the three-1
dimensional responses of a tunnel to basement excavation 2
3
C.W.W. Ng1, Jiangwei Shi2, David Mašín3, Huasheng Sun4, and G.H. Lei5 4
5
An article submitted to CGJ for consideration of possible publication 6
7
Corresponding author: Mr Jiangwei Shi 8
Research student, Department of Civil and Environmental Engineering, Hong Kong 9
University of Science and Technology, Clear Water Bay, Kowloon, Hong Kong. 10
E-mail: [email protected] 11
Tel: 852-6762-9710 12
13
Co-author: Dr C. W. W. Ng 14
Chair Professor, Department of Civil and Environmental Engineering, Hong Kong University 15
of Science and Technology, Clear Water Bay, Kowloon, Hong Kong. 16
E-mail: [email protected] 17
Tel: 852-2358-8760 18
Fax: 852-2358-1534 19
20
Co-author: Dr David Mašín 21
Associate Professor, Department of Engineering Geology, Institute of Hydrogeology, 22
Engineering Geology and Applied Geophysics, Faculty of Science, Charles University in 23
Prague, Prague, Czech Republic. 24
E-mail: [email protected] 25
26
Co-author: Mr Huasheng Sun 27
Research Student, Key Laboratory of Geomechanics and Embankment Engineering of the 28
Ministry of Education, Geotechnical Research Institute, Hohai University, 1 Xikang Road, 29
Nanjing, China. 30
E-mail: [email protected] 31
32

Co-author: Dr G.H. Lei 33
Professor, Key Laboratory of Geomechanics and Embankment Engineering of the Ministry of 34
Education, Geotechnical Research Institute, Hohai University, 1 Xikang Road, Nanjing, 35
China. 36
E-mail: [email protected] 37

1
ABSTRACT: Basement excavation inevitably causes stress changes in the ground leading to 38
soil movements which may affect the serviceability and safety of adjacent tunnels. Despite 39
paying much attention to the basement-tunnel interaction, previous research has mainly 40
focused on the influence of tunnel location in relation to the basement, tunnel stiffness and 41
excavation geometry. The effects of sand density and basement wall stiffness on nearby 42
tunnels due to excavation, however, have so far been neglected. A series of three-dimensional 43
centrifuge tests were thus carried out in this study to investigate these effects on the complex 44
basement-tunnel interaction. Moreover, three-dimensional numerical analyses and a 45
parametric study by adopting hypoplastic sand model were conducted to improve the 46
fundamental understanding of this complex problem and calculation charts were developed as 47
a design tool. When the basement was constructed directly above the existing tunnel, 48
excavation-induced heave and strain were more sensitive to a change in soil density in the 49
transverse direction than that in the longitudinal direction of the tunnel. Because a looser sand 50
possesses smaller soil stiffness around the tunnel, the maximum tunnel elongation and 51
transverse tensile strain increased by more than 20% as the relative sand density decreased by 52
25%. Moreover, the tensile strain induced along the longitudinal direction was insensitive to 53
the stiffness of the retaining wall, but that induced along the transverse direction was 54
significantly reduced by a stiff wall. When the basement was constructed at the side of the 55
existing tunnel, the use of a diaphragm wall reduced the maximum settlements and tensile 56
strains induced in the tunnel by up to 22% and 58%, respectively, compared with the use of a 57
sheet pile wall. Under the same soil density and wall stiffness, excavation induced maximum 58
movement and tensile strains in the tunnel located at a side of basement were about 30% of 59
the measured values in the tunnel located directly beneath basement centre. 60
KEYWORDS: three-dimensional responses, basement excavation, tunnel, sand density, 61
retaining wall stiffness, calculation chart 62

2
INTRODUCTION 63
With an increasing demand for new infrastructures in congested urban cities, 64
underground constructions such as deep excavations have become commonplace. For public 65
convenience, basement excavations for shopping malls and/or car parks are done very close 66
to existing tunnels (within a distance of 0.5 times the tunnel diameter as reported by Burford 67
(1988) and Liu et al. (2011)). But any basement excavations cause stress changes in the 68
ground leading to soil movements which may in turn induce unacceptable deformations and 69
stress changes in adjacent tunnels. 70
To evaluate the basement-tunnel interaction, several researchers simplified it as a plane 71
strain problem (Doležalová, 2001; Sharma et al., 2001; Hu et al., 2003; Karki, 2006; Zheng 72
and Wei, 2008). Sharma et al. (2001) conducted a two-dimensional numerical analysis to 73
investigate tunnel deformation due to adjacent basement excavation. They found that tunnel 74
deformation decreased with an increase in lining stiffness. Zheng and Wei (2008) carried out 75
a plane strain numerical parametric study to investigate tunnel deformation and stress 76
redistribution around the tunnel lining due to basement excavation. They found that the 77
tunnel deformation mode was closely related to the distance between the tunnel and the 78
retaining wall. Other researchers have shown that movement and bending moment are 79
induced in a tunnel not only along its transverse direction but also along its longitudinal 80
direction as a result of basement excavation (Lo and Ramsay, 1991; Chang et al., 2001; 81
Meguid et al., 2002; Huang et al., 2012, 2013; Ng et al., 2013b; Shi et al., 2015). Due to 82
corner effects in a short and narrow excavation, it is expected that excavation induced tunnel 83
responses at basement centre would be different from those under the plane strain condition. 84
By conducting a numerical parametric study, Shi et al (2015) investigated three-dimensional 85
tunnel heave and tensile strain to overlying basement excavation. Influence of excavation 86

3
geometry, sand density, tunnel stiffness and joint stiffness on the basement-tunnel interaction 87
was explored. 88
Huang et al. (2012) carried out a series of three-dimensional centrifuge tests in Shanghai 89
soft clay to investigate the effect of the cover-to-diameter ratio (C/D) on a tunnel’s responses 90
to overlying basement excavation. The measured maximum tunnel heave was found to 91
decrease exponentially with an increase in the C/D ratio. However, they did not measure the 92
bending moments in the tunnel along its longitudinal direction. Huang et al. (2013) conducted 93
a three-dimensional numerical parametric study to investigate the basement-tunnel interaction 94
using the Hardening Soil model to simulate soil responses. It is well-known that soil stiffness 95
is not only strain dependent but also stress path dependent (e.g., Atkinson et al., 1990; Powrie 96
et al., 1998), but the HS model is unable to capture their effects on soil stiffness. 97
Ng et al. (2013b) conducted two three-dimensional centrifuge tests in sand to investigate 98
the influence of basement excavation on an existing tunnel located in either of two horizontal 99
offsets in relation to the basement. Basement excavations were carried out in medium-dense 100
sand with relative densities of 68% and 69%. A maximum heave of 0.07% He (final 101
excavation depth) and settlement of 0.014% He were induced in the tunnel when the 102
basement was excavated directly above the tunnel and when it was constructed at the side of 103
the tunnel, respectively. Vertical elongation was induced in the tunnel in the former case, 104
while distortion was observed in the tunnel in the latter case. An inspection of the measured 105
strains in the tunnel along its longitudinal direction revealed that the inflection point, i.e. the 106
point where the shear force was at a maximum, was located 0.8 L (basement length) away 107
from the basement centre. 108
Despite paying much attention to the basement-tunnel interaction, previous studies have 109
mainly focused on the influence of tunnel location in relation to the basement, and the effects 110
of excavation geometry and tunnel stiffness. The effects of strain and stress path 111

4
dependencies on soil stiffness, however, were often not considered. As the sand density is 112
reduced, vertical stress relief at the formation level of the basement and soil stiffness around 113
the tunnel decrease simultaneously. But tunnel responses dominated by reduced stress relief 114
or soil stiffness were not clear. By collecting 300 case histories, Wang et al. (2010) found that 115
the mean values of the maximum lateral movement of a sheet pile wall and a diaphragm wall 116
as a result of basement excavation were 1.5% H and 0.27 % H, respectively, where H was 117
excavation depth. Thus, the responses of a tunnel located behind a retaining wall may be 118
significantly affected by wall flexural stiffness. 119
This paper is a continuation of a previous paper (Ng et al., 2013b) and considers the 120
influence of sand density and retaining wall stiffness on three-dimensional responses of a 121
tunnel to basement excavation. Four three-dimensional centrifuge tests were thus designed 122
and conducted to investigate these effects on the basement-tunnel interaction. In addition, 123
three-dimensional numerical back-analyses were carried out to enhance the fundamental 124
understanding of stress transfer mechanisms and soil stiffness around the tunnel. Moreover, a 125
three-dimensional numerical parametric study was conducted to determine the effects of wall 126
stiffness on the complex interaction. To capture the effects of strain and stress path 127
dependencies on soil stiffness, an advanced constitutive model, namely the hypoplastic sand 128
model, was adopted in the numerical analyses. 129
130
THREE-DIMENSIONAL CENTRIFUGE MODELLING 131
Experimental program and set-up 132
Four three-dimensional centrifuge tests were designed and conducted at the 133
Geotechnical Centrifuge Facility of the Hong Kong University of Science and Technology. 134
The 400 g-ton centrifuge has an arm radius of 4.2 m (Ng et al., 2001, 2002). In order to have 135
enough space for installing instruments (i.e., potentiometer and strain gauge) inside the tunnel 136

5
lining, the diameter of the model tunnel cannot be too small. By considering boundary 137
conditions of entire model package, the model tunnel with a diameter of 100 mm was adopted 138
in this study. In order to simulate tunnels commonly constructed in many urban cities such as 139
Taipei, London and Shanghai (e.g., Chang et al., 2001; Mohamad et al., 2010; Sun et al., 140
2012; Wang et al., 2014), 60 g (i.e., gravitational acceleration) was chosen to give a 141
corresponding 6 m diameter (in prototype) tunnels. The dimensions of soil were 1245 mm 142
(length) × 990 mm (width) × 750 mm (depth). According to the relevant scaling laws 143
summarised in Table 1 (Taylor, 1995), the dimensions of the soil stratum were equivalent to 144
74.7 m (length), 59.4 m (width) and 45.0 m (depth) in prototype. 145
Due to time and budget constraints, it is not realistic to conduct centrifuge tests for every 146
case. For a tunnel located directly underneath basement centre, centrifuge tests were designed 147
and carried out to investigate the influence of sand density on the basement-tunnel interaction. 148
On the other hand, numerical parametric study was conducted to explore the influence of wall 149
stiffness on tunnel responses by overlying excavation, instead of carrying out centrifuge 150
model tests. 151
For a tunnel located at a side of basement, excavation induced tunnel responses were 152
negligible when a diaphragm wall was used as the retaining system (Ng et al., 2013b). In 153
order to explore tunnel responses when a less stiff retaining system was adopted, one test was 154
designed to use a sheet pile wall. Similarly, numerical parametric study was decided and 155
carried out to investigate the effects of sand density to save time and budget. Detailed 156
measurements in the tests are presented in following sections. 157
Figure 1 shows a plan view of the centrifuge model. The model wall and tunnel were 158
assumed to be wished-in-place in each test. A square excavation (on plan) with a side length 159
of 300 mm (18 m in prototype) was carried out. In the four tests, the distance between the 160
model wall and the boundary of the container was no less than 2.2 times the final excavation 161

6
depth (2.2 He), which was larger than the influence zone (i.e., 2 He) of ground settlement 162
behind the retaining wall identified by Peck (1969) for basement excavation in sand. Tests 163
CD51 and CD68 (with relative sand densities of 51% and 68%, respectively) were designed 164
to investigate the effects of soil density on the basement-tunnel interaction when the 165
basement was excavated directly above the tunnel. The diaphragm wall (DW) and the sheet 166
pile wall (SW) are both typical retaining systems for basement excavation. The sheet pile 167
wall is used to support basements worldwide provided the final excavation depth is less than 168
12 m (e.g., Hsieh and Ou, 1998; Long, 2001; Wang et al., 2010). In Tests CD51, CD68 and 169
SD69, the diaphragm wall was used as the retaining system, while the sheet pile wall was 170
installed to support the basement in Test SS70. By comparing soil and tunnel responses in 171
Tests SD69 and SS70, the effects of retaining wall stiffness on the basement-tunnel 172
interaction were explored. In these two tests, the model tunnel was located at the side of the 173
basement with a clear distance between its springline and the basement of 25 mm (1.5 m in 174
prototype). Note that the measured results of Tests CD68 and SD69 have been reported by 175
Ng et al. (2013b). A summary of the four centrifuge tests is given in Table 2. 176
Figures 2a & b show elevation views of the centrifuge model. The final excavation 177
depth (He) was 150 mm, corresponding to 9 m in prototype. The wall penetration depth in 178
model scale was 75 mm which was half the final excavation depth and exceeded the clear 179
distance between the tunnel crown and the formation level of the basement (50 mm). Thus, 180
two arches were made in the walls to accommodate the tunnel in Tests CD51 and CD68 (see 181
Fig. 2b). The clear distance between the tunnel crown and the arches was 20 mm which was 182
equivalent to 1.2 m in prototype. Such set-ups have been reported by several researchers (e.g., 183
Liu et al., 2011; Huang et al., 2012, 2013; Ng et al., 2013b). In this study, basement 184
excavation was simulated by draining away heavy fluid (ZnCl2). Because of its simplicity, 185
heavy fluid is commonly used to simulate the effects of excavation by draining the fluid away 186

7
in-flight (e.g., Bolton and Powrie, 1988; Leung et al., 2001, 2003; Zheng et al., 2012). By 187
doing so, in-situ horizontal stress may not be simulated correctly if the coefficient of earth 188
pressure at rest (K0) is not equal to 1. For the tests reported in this paper, K0 of sand was 189
estimated as 0.5 by using the equation proposed by Jáky (1944). Thus, the horizontal stress 190
acting on retaining wall was over released in this study. However, this over relaxation should 191
not affect major conclusions drawn from this study. This is because the effects of excavation 192
on an existing tunnel located below it should be governed mainly by the vertical stress rather 193
than the horizontal stress relief. The excavation proceeded in three stages where a depth of 50 194
mm (3 m in prototype) was excavated in each stage. The diameter and initial cover depth of 195
the model tunnel were 100 and 200 mm (6 and 12 m respectively in prototype), giving a 196
tunnel cover-to-diameter ratio (C/D) of 2. The distance from the tunnel invert to the bottom 197
of the model box was 0.45 m (4.5 D) which was equivalent to 27 m in prototype. 198
199
Model wall and tunnel 200
In all tests, the model wall and tunnel were made from single sheets and a tube of 201
aluminium alloy, respectively. The influence of joints in the wall and the tunnel was beyond 202
the scope of this study. In Tests CD51, CD68 and SD69, the aluminium sheets were 12.7 mm 203
thick and were equivalent to 0.96 m thick concrete walls in prototype, assuming Young’s 204
modulus (Econcrete) of concrete of 35 GPa. On the other hand, 4 mm thick aluminium sheets 205
were used to simulate a typical U-type sheet pile wall (i.e., type NSP III with moment of 206
inertia of 3.24 × 10⁻⁴ m4/m in prototype) in Test SS70. The flexural stiffness (EwIw) of the 207
diaphragm wall was 32 times that of the sheet pile wall. 208
The model tunnel was 1200 mm long, 100 mm wide and 3 mm thick, corresponding to 209
72, 6 and 0.18 m in prototype, respectively. At 60 g, it had longitudinal stiffness and 210
8
transverse stiffness equivalent to those of 420 and 230 mm thick concrete slabs (Econcrete = 35 211
GPa), respectively. 212
213
Model preparation 214
Considering the complexity of the basement-tunnel interaction, dry Toyoura sand was 215
adopted in the tests for simplicity. Dry Toyoura sand is a uniform fine sand with a mean grain 216
size (D50) of 0.17 mm and a specific gravity (Gs) of 2.65 (Ishihara, 1993). 217
Figure 3a shows the centrifuge model with strain gauge and potentiometer instruments 218
installed. The pluvial deposition method was used to prepare soil samples. By keeping the 219
hopper at constant distances of 200 and 500 mm above the sand surface, repeatable relative 220
sand densities of about 50% and 70% were achieved in the calibration, respectively. The 221
model tunnel with extension rods was installed once the sand had reached the invert level. An 222
enlarged base was fixed at the bottom of each extension rod via a screw to increase the 223
contact area between the rod and the outer surface of the tunnel lining. Each extension rod 224
was protected by a hollow tube from the surrounding sand to minimise friction and was 225
connected to a linear variable differential transformer (LVDT) core. A structural frame was 226
used to temporarily support the retaining wall until pluvial deposition was completed. A 227
flexible rubber bag was placed inside the basement to contain the heavy fluid (ZnCl2) used to 228
simulate the effects of basement excavation. After pluvial deposition, the average sand 229
densities in Tests CD51, CD68, SD69 and SS70 were 1486, 1542, 1546 and 1548 kg/m3, 230
corresponding to relative densities (Dr) of 51%, 68%, 69% and 70%, respectively. In Test 231
CD51, the density of heavy fluid (ZnCl2) placed inside basement was 1486 kg/m3, while it 232
was 1544 kg/m3 in Tests CD68, SD69 and SS70. 233
234
Instrumentation 235

9
The vertical displacements of the tunnel along its longitudinal direction were monitored 236
by the LVDTs together with extension rods installed at the crown (see Fig. 3a). For Tests 237
CD51 and CD68 (in which the basement was excavated directly above the tunnel), three 238
holes were made in the bottom of the rubber bags into which extension rods were inserted. 239
Any gaps were sealed to prevent leakage of the heavy fluid. 240
Full-bridge strain gauges for temperature compensation were installed to measure 241
bending moments induced in the tunnel not only along its transverse direction but also along 242
its longitudinal direction. Semiconductor strain gauges (SSGs) were mounted on the outer 243
surfaces of the tunnel to measure bending moments along the longitudinal tunnel direction. 244
Along the tunnel crown and invert, 23 sets of SSGs were mounted at a spacing of 50 mm. 245
Moreover, seven sets of SSGs were mounted along the springline at a spacing ranging from 246
60 to 80 mm. Conventional foil gauges (CFGs) were mounted on the outer and inner surfaces 247
of the tunnel lining to measure bending moments along the transverse direction (i.e., S1 and 248
S2). Sections S1 and S2 were located directly beneath and 100 mm (i.e., 0.33 L) away from 249
the basement centre, respectively. In each monitoring section, eight sets of CFGs were 250
mounted evenly at an interval of 45˚ around the circumference of the tunnel lining. Based on 251
the measured bending moments and flexural stiffness of the model tunnel, induced strains in 252
the tunnel along its longitudinal and transverse directions could be readily deduced by beam 253
theory. 254
By installing four potentiometers inside tunnel lining, any increases or decreases in 255
tunnel diameters could be measured in section S1 (i.e., directly beneath the basement centre). 256
As shown in Figs. 3b and 3c, four linear potentiometers were fixed onto an aluminium plate 257
connected to a supporting frame. This lightweight frame was mounted to the lining of 258
existing tunnel using screws. The linear potentiometer is a variable resistor connected to three 259
leads. Two leads are connected to both ends of the resistor, thus the resistance between them 260

10
is fixed. Another lead is connected to a slider which can travel along the resistor. Accordingly, 261
the resistance between the slider and the other two connections is varied. Any change in 262
tunnel diameter is captured by the travel of the slider, which in turn alters the resistance of a 263
potentiometer (Todd, 1975). By measuring the voltage between the slider and end of resistor, 264
the travel distance of the slider (i.e., a change in tunnel diameter) can be calibrated and 265
determined. Based on the analysis of measured data before the commencement of basement 266
excavation, the accuracy of each potentiometer was estimated to be ±1 mm in prototype scale 267
(Ng et al., 2013a). Two Druck PDCR-81 miniature pore pressure transducers were 268
submerged in heavy fluid (ZnCl2) to monitor the excavation depth. Moreover, one video 269
camera was installed to record the entire test process. 270
271
Centrifuge testing procedure 272
Once the centrifuge model had been set up and following a final check, the model 273
container was transferred to one of the centrifuge arms. Then the centrifuge was gradually 274
spun up to 60 g. As soon as readings from the transducers had stabilised, the effects of 275
basement excavation were simulated by draining away the heavy fluid (ZnCl2) from the 276
flexible rubber bag. Based on measurements from the pore pressure transducers submerged in 277
the heavy fluid, three excavation stages were simulated in a sequential manner. The 278
centrifuge was then spun down to 1 g until readings from all transducers again became stable. 279
280
THREE-DIMENSIONAL NUMERICAL ANALYSIS 281
To enhance the fundamental understanding of stress transfer and soil stiffness around the 282
existing tunnel, three-dimensional numerical back-analyses of the four centrifuge tests were 283
carried out using the software package ABAQUS (Hibbitt et al., 2008). A numerical 284
parametric study was conducted to determine the effects of wall stiffness on the basement-285

11
tunnel interaction when the basement was constructed directly above the tunnel. For the case 286
when the relative density of sand was 68%, five retaining systems (i.e., a sheet pile wall, 0.6, 287
0.96 and 1.5 m thick diaphragm walls and a rigid wall) were adopted to evaluate the effects 288
of wall stiffness on the basement-tunnel interaction. Moreover, two final excavation depths of 289
9 and 15 m were considered. Correspondingly, the initial cover depths (C) of the tunnel were 290
2 D (12 m) and 3 D (18 m) respectively in the two scenarios. In all analyses, the clear 291
distance between the tunnel crown and the formation level of the basement was kept at 0.5 D 292
(3 m). The ratio between the wall penetration depth and the final excavation depth was taken 293
as 0.5. A summary of all the numerical simulation parameters is given in Table 3. 294
295
Finite element mesh and boundary conditions 296
Figure 4 shows the three-dimensional finite element mesh used to back-analyse the 297
centrifuge Test CD68. All dimensions in model scale were identical to those adopted in the 298
centrifuge test. By conducting a numerical parametric study, the maximum difference of 299
tunnel responses by adopting linear 8-node cubic (i.e., C3D8) and quadratic 20-node cubic 300
elements (i.e., C3D20) to simulate soil stratum was within 6%. If C3D20 elements were used 301
to replace C3D8 elements, the computational time was increased from 2 to 36 hours for each 302
numerical run. In order to reduce computational time significantly, C3D8 elements were used 303
to simulate the soil stratum in this study. According a numerical parametric study, the 304
difference of tunnel responses by using 4-node shell elements (i.e., S4) and linear 8-node 305
cubic elements (i.e., C3D8) to simulate sheet pile wall was less than 10%. Thus, the solid 306
elements were selected to model both sheet pile wall and diaphragm wall in this study. Linear 307
8-node cubic elements (i.e., C3D8) were used to model the sand stratum and the retaining 308
wall, while the tunnel lining was simulated with 4-node shell elements (i.e., S4). In total, the 309
entire mesh consisted of 28064 solid elements (i.e., C3D8), 608 shell elements (i.e., S4) and 310

12
32896 nodes. By using a laptop computer with a CPU of 3.4 GHz and a ram memory of 8 GB, 311
it took about two hours to finish a numerical run. 312
Soil movements were restrained in the x direction in the ABCD and EFGH planes, and 313
in the y direction in the ABFE and CDHG planes. Moreover, soil movements in the x, y and z 314
directions were restrained in the ADHE plane. In the numerical parametric study, the cover-315
to-tunnel diameter ratio (C/D) was varied from 2.0 to 3.0, corresponding to the final 316
excavation depth of 9 and 15 m, respectively. For the cases with the final excavation depth of 317
15 m, the distance between the model wall and the outer boundary of the mesh was kept at 318
least twice the final excavation depth to minimise boundary effects. By assuming a perfect 319
contact of soil-structure interface, the computed maximum tunnel heave, longitudinal and 320
transverse tensile strains were 11%, 12% and 6% smaller than those when interface friction 321
angle was 20º (i.e., 2/3 φ′c, frictional angle at the critical state). Thus, a perfect contact of 322
soil-structure interface was assumed for simplicity. 323
324
Constitutive models and model parameters 325
Sand behaviours were described by a user-defined hypoplastic soil model which was 326
incorporated in the software package ABAQUS using open-source implementation available 327
for free download on the web (Gudehus et al., 2008). Hypoplastic constitutive models were 328
capable of describing nonlinear response of soils. Various hypoplastic models have been 329
developed in a number of studies (Kolymbas, 1991; Gudehus, 1996; Von Wolffersdorff, 1996; 330
Wu et al., 1996; Mašín, 2012; Mašín, 2013; Mašín, 2014). The model proposed by Von 331
Wolffersdorff (1996) was adopted in the present simulation to describe the behaviours of 332
Toyoura sand. Hypoplasticity is a particular class of soil constitutive models characterised by 333
the following rate formulation [1]: 334
335

13
[1]
T fs(L: D + fdN||D||) 336
337
where L is a fourth-order tensor, N is a second-order tensor, D is rate of deformation fs is a 338
barotropy factor incorporating the dependency of the responses on mean stress level and fd is 339
a pyknotropy factor including the influence of relative density. In the hypoplastic formulation, 340
the strain is not divided into elastic and plastic components. 341
The basic hypoplastic model requires eight material parameters (i.e., φ′c, hs, n, ed0, ec0, 342
ei0, and ). Parameter φ′c is angle of internal shearing resistance at critical state, which can 343
be calibrated using the angle of repose test. Parameters hs and n describe the slope and shape 344
of limiting void ratio lines, i.e., isotropic normal compression line, critical state line and 345
minimum void ratio line. Parameters ed0, ec0 and ei0 are reference void ratios specifying 346
positions of those three curves. eco and edo are related to emax (maximum void ratio) and emin 347
(minimum void ratio) at zero stress level. By using results of oedometric test on loose sand, 348
parameters hs, n and ec0 can be calibrated. Parameters ed0 and ei0 can typically be estimated 349
using empirical correlations. Parameters and control the dependency of peak friction 350
angle and shear stiffness on relative density, respectively. Both of them can be estimated 351
using triaxial shear test results. More information on model calibration can be found in Herle 352
and Gudehus (1999). 353
By considering the intergranular strain concept, Niemunis and Herle (1997) enhanced 354
the model for predictions of small strain stiffness and recent stress history. The modification 355
requires five additional parameters, namely mR, mT, R, r and . Parameters mR and mT 356
control very small strain shear modulus upon 180° and 90° change of strain path direction, 357
respectively. The size of elastic range in the strain space is specified by parameter R. 358
Parameters r and χ control the rate of stiffness degradation with strain. For details of 359
calibration procedure for the intergranular strain concept, see Niemunis and Herle (1997). 360
14
Six parameters of Toyoura sand (φ′c, hs, n, ed0, ec0 and ei0) were obtained from Herle and 361
Gudehus (1999), while triaxial test results reported by Maeda and Miura (1999) were used to 362
calibrate parameters of and . According to the measured stiffness degradation curve in the 363
small strain range of Toyoura sand reported by Yamashita et al. (2000), five parameters 364
related to the intergranular strain were calibrated. Summary of all the parameters adopted in 365
the present simulations was in Table 4. The same parameter set has already been successfully 366
adopted in simulation of centrifuge tests by Ng et al. (2013a; 2013b). By using the equation 367
proposed by Jáky (1944), the coefficient of at-rest earth pressure of soil (i.e., K0 = 1-sin φ′c) 368
was estimated to be 0.5. The void ratio of soil was considered as a state variable in the 369
hypoplastic model. For sand with different relative densities, the hypoplastic model can be 370
used to evaluate the basement-tunnel interaction with a single set of material parameters. At 1 371
g conditions, void ratios of 0.78 and 0.72 (corresponding to relative sand density of 51% and 372
68%) were inputted as initial values in the back analyses of Tests CD51 and CD68, 373
respectively. 374
A linearly elastic model was used to simulate the behaviours of the retaining wall and 375
tunnel lining with Young’s modulus (Ealuminium) of 70 GPa and a Poisson ratio (ν) of 0.2. The 376
aluminium alloy used for the retaining wall and tunnel lining had a unit weight of 27 kN/m3. 377
378
Numerical modelling procedure 379
The procedures adopted for numerical modelling were identical to those adopted for the 380
centrifuge test. The exact simulation procedures are as follows: 381
1. Establish the initial boundary and stress conditions of soil at 1 g (i.e., gravitational 382
acceleration) by assuming that the coefficient of at-rest earth pressure of soil (K0) is 0.5. 383
Then apply equivalent pressures on the wall and the formation level of the basement to 384
simulate the existence of heavy fluid (ZnCl2) inside the basement. 385
15
2. Increase the gravitational acceleration from 1 g to 60 g for the entire mesh (including soil, 386
tunnel and retaining wall) in four steps. At each step, increase also the corresponding 387
lateral and vertical fluid pressures applied on the wall and the formation level of the 388
basement. 389
3. Decrease the lateral and vertical fluid pressures applied on the wall and the formation level 390
of basement simultaneously (i.e., 3 steps in each run) to simulate the effects of basement 391
excavation. 392
393
INTERPRETATION OF MEASURED AND COMPUTED RESULTS 394
All results are expressed in prototype scale unless stated otherwise. 395
396
Vertical displacement at the crown of the tunnel along its longitudinal direction 397
Figure 5 compares measured and computed vertical displacements at the crown of the 398
tunnel along its longitudinal direction at the end of basement excavation. Positive and 399
negative values denote tunnel heave and settlement, respectively. As the LVDT installed at 400
the basement centre malfunctioned in Test CD68, tunnel heave was not obtained for that 401
location. 402
In Tests CD51 and CD68 (in which the basement was excavated directly above the 403
tunnel), heave was induced in the tunnel along its longitudinal direction due to vertical stress 404
relief. Upon completion of basement excavation, the measured maximum tunnel heave at the 405
basement centre was 0.09% He (final excavation depth) when the relative sand density was 406
51% (CD51). Moreover, the measured maximum tunnel heave in Test CD 68 (with a relative 407
density of 68%) was 0.07% He at a distance of 0.2 L (basement length) from the basement 408
centre. At this location, the tunnel heave in Test CD51 was only 5% larger than that in Test 409
CD68. LTA (2000) recommended that the maximum tunnel movement be within 15 mm (i.e., 410

16
0.17% He). The maximum tunnel heave induced by basement excavation in this study is 411
within the proposed allowable limit. The measured tunnel heaves gradually decreased with an 412
increase in normalised distance from the basement centre. For the given model set-up, 413
basement excavation exerted an influence on tunnel heave within 1.2 L (basement length) 414
from the basement centre along the longitudinal direction of the tunnel. It was found that the 415
measured and computed tunnel heaves in the longitudinal direction increased as the relative 416
sand density decreased from 68% to 51%. Explanations are given in the next section. 417
During basement excavation, heave was induced in the soil beneath the basement, while 418
settlement occurred behind the retaining wall. As shown in Figure 5, settlement was induced 419
in the existing tunnel located at the side of the basement. For basements supported by sheet 420
pile (SS70) and diaphragm walls (SD69), the maximum induced tunnel settlements were 421
0.018% He and 0.014% He, respectively. Note that the maximum tunnel settlement induced in 422
Test SD 60 was less than 20% of the tunnel heave in Test CD68. Clearly the use of a 0.96 m 423
thick diaphragm wall led to a 22% smaller maximum tunnel settlement than the use of a sheet 424
pile wall. This is because a stiffer diaphragm wall can reduce the ground movements behind 425
it and hence minimise tunnel settlement. The computed tunnel settlement also shows that 426
tunnel settlement increased with decreasing wall stiffness. However, the profiles of the 427
computed tunnel settlement were shallower and wider than the measured ones, probably 428
because the stiffness anisotropy of soil was not properly captured by the constitutive model. 429
430
Vertical stress and mobilised shear stiffness of soil along the tunnel crown and invert 431
To fully understand the increase in tunnel heave with decreasing sand density (Tests 432
CD51 and CD68), stress and stiffness of soil at the tunnel crown and invert along the 433
longitudinal direction are compared. Figure 6a shows the computed changes in vertical stress 434

17
at the tunnel crown and invert along the longitudinal direction. Positive and negative values 435
denote increases and decreases in stress acting on the tunnel lining, respectively. 436
Along the tunnel crown, the vertical stress of soil beneath the basement was significantly 437
reduced due to the removal of soil simulated by decreasing the lateral and vertical pressures 438
applied on the wall and the formation level of the basement. On the contrary, an increase in 439
vertical stress of up to 68 kPa was observed in the soil underneath the bottom of retaining 440
wall. As basement excavation proceeded, the entire tunnel moved upward as shown in Fig. 5. 441
Moreover, ground settlement was induced behind the retaining wall generating downward 442
friction. Due to a combination of upward tunnel movement and downward wall-soil friction, 443
stress in the soil between the retaining wall and the model tunnel increased accordingly. At a 444
distance of 0.2 L (basement length) to 0.7 L behind the retaining wall, a slight increase in soil 445
stress (less than 5 kPa) was observed at the crown. On the other hand, the vertical stress of 446
soil beneath the tunnel invert decreased along the longitudinal direction of the tunnel, even at 447
a distance of 1.0 L behind the retaining wall. This is because the existing tunnel moved 448
upward during basement excavation resulting in stress reduction at the invert. 449
At the end of basement excavation, the maximum changes in vertical stress at the tunnel 450
crown and invert exceeded the allowable limit (i.e., ±20 kPa) set by BD (2009). Thus, the 451
structural integrity of the existing tunnel should be reviewed based on changes in the loading 452
condition acting on the lining. Cracks or even collapse may be induced in the tunnel, 453
depending on the magnitude of stress changes surrounding the lining. Along the tunnel crown, 454
stress changes in the soil behind the retaining wall stayed within the allowable limit. 455
However, stress changes in the soil at the tunnel invert exceeded the allowable limit at a 456
distance of less than 0.4 L behind the retaining wall. Note that the maximum vertical stress 457
relief at the tunnel crown was about five times that at the invert. The large reduction in stress 458
makes it imperative to review the structural integrity of the existing tunnel, especially at the 459
18
crown. Although the relative sand density in Test CD51 was 25% smaller than that in Test 460
CD68, vertical stress relief at the tunnel crown and invert in looser soil was about 1% smaller 461
than that in denser soil as expected. 462
Figure 6b shows the relationships between the mobilised secant shear stiffness of soil at 463
the tunnel crown and the normalised distance from the basement centreline. For clarity, the 464
mobilised shear stiffness of soil at the tunnel invert is not shown in this figure. By taking the 465
deviatoric stress (q) and shear strain (s) from numerical analyses, the mobilised secant shear 466
stiffness (q/3s) of soil at a given stage can be obtained. After increasing g-level to 60 g, the 467
mobilised secant shear stiffness of soil located directly underneath the diaphragm wall was 468
much larger than that in other regions. This is because compression of the soil between the 469
tunnel and the retaining wall resulted in higher soil stress in this region. Upon completion of 470
basement excavation, the mobilised secant shear stiffness of soil beneath the basement was 471
significantly reduced due to the removal of vertical stress at the tunnel crown (see Fig. 6a) 472
and accumulative shear strain in soil. Although stress of soil located underneath the bottom of 473
retaining wall increased as excavation proceeded, the stiffness of soil at this location was 474
reduced. This is because basement excavation induced further compression of soil underneath 475
the wall causing significant stiffness degradation. Due to stress relief along the tunnel invert 476
(see Fig. 6a), the mobilised shear stiffness of soil along the invert decreased during basement 477
excavation. 478
Along the tunnel crown, the mobilised secant shear stiffness of soil beneath the 479
basement in looser sand (CD51) was 35-42% smaller than that in denser sand (CD68) upon 480
completion of increasing g-level and basement excavation. Moreover, the mobilised shear 481
stiffness of soil at the tunnel invert in Test CD51 was 33% smaller than that in Test CD68. 482
However, the differences in stress changes at the tunnel crown and invert were negligible 483
when relative sand density varied from 68% to 51% (see Fig. 6a). Thus, an increase in tunnel 484

19
heave with decreasing sand density was observed. As the sand density decreased from 68% to 485
51%, the maximum heave in tunnel increased by about 5%. This indicates that excavation-486
induced maximum tunnel heave was not sensitive to a change in sand density from 68% to 487
51% even though the mobilised shear stiffness of soil was significantly reduced by more than 488
30% at the crown and invert. 489
490
Displacement vectors of soil around the existing tunnel located at the side of the 491
basement 492
To improve the understanding of the variation in tunnel settlement with wall stiffness, 493
displacement vectors of soil around the tunnel located at the side of the basement were 494
computed. Figure 7 shows the computed displacement vectors of soil around the existing 495
tunnel and the basement upon completion of excavation. As expected, heave was induced in 496
the soil beneath the basement due to vertical stress relief. Because the forces on the excavated 497
side and the retained side were unbalanced, the soil behind the retaining wall moved 498
downward toward the basement. As shown in the figure, soil settlement was induced around 499
the existing tunnel except at the right springline and the right knee resulting in tunnel 500
settlement accordingly. In addition, the soil surrounding the existing tunnel also moved 501
toward the basement, implying that the tunnel also bent toward the basement during 502
excavation. 503
The computed ground movement behind the retaining wall was much more significant 504
when a sheet pile wall was adopted instead of a 0.96 m thick diaphragm wall. Moreover, 505
induced heave in the soil beneath the basement increased as the flexural stiffness of the 506
retaining wall reduced. This is because much more soil was squeezed into the basement and 507
larger inward wall movement was induced when a sheet pile was used. As the lateral wall 508
movement of the sheet pile wall was much larger than that of the diaphragm wall, a much 509

20
larger lateral soil movement was observed near the excavated side of retaining wall with a 510
smaller flexural stiffness. It was also found that soil settlement around the existing tunnel 511
increased with a reduction in the flexural stiffness of the retaining wall. Correspondingly, a 512
trend of increasing tunnel settlement with a decrease in wall stiffness could be observed (see 513
Fig. 5). 514
The lateral and vertical movements of soil above the formation level and behind 515
retaining wall decreased significantly when the retaining wall increased in stiffness. For a 516
tunnel located at any of those locations, adopting a stiff retaining wall should be an effective 517
way to alleviate the adverse effects of basement excavation. 518
519
Changes in tunnel diameter 520
Figure 8 compares measured and computed changes in tunnel diameter with the 521
unloading ratio. All the results were taken at section S1which was located directly underneath 522
basement (see Fig. 2a). The unloading ratio is defined as the excavation depth (H) to the 523
initial tunnel cover depth (C). Positive and negative values denote elongation and 524
compression of the tunnel, respectively. 525
Due to a reduction in vertical stress accompanied by a smaller horizontal stress relief 526
around the tunnel lining, vertical elongation and horizontal compression were induced in the 527
tunnel located beneath the basement centre (i.e., section S1 as shown in Fig. 2a). The vertical 528
elongation and horizontal compression of the tunnel increased with the unloading ratio. Once 529
basement excavation had ended, the maximum vertical elongation (ΔDV) and horizontal 530
compression (ΔDH) of the tunnel in Test CD51 were measured to be 0.16% D (tunnel 531
diameter) and 0.20% D, respectively. Moreover, a maximum vertical elongation of 0.13% D 532
and horizontal compression of 0.16% D were measured in the tunnel in Test CD68. BTS 533
(2000) recommended that the maximum distortion of a tunnel ((ΔDV+ΔDH)/D) was within 534
21
2%. The maximum distortion induced in the existing tunnel (i.e., 0.36% D) in this study is 535
within the recommended limit. 536
At basement centre (i.e., section S1), the measured maximum vertical elongation and 537
horizontal compression of the tunnel increased by 23% and 25%, respectively, as the relative 538
sand density decreased from 68% to 51%. Computed results also show that the magnitude of 539
tunnel deformation increased with a reduction in the sand density. However, the computed 540
changes in tunnel diameters were 32% to 48% smaller than the measured ones. 541
To explain the variations in tunnel diameters with sand density, the mobilised secant 542
shear stiffness (G = q/3s) of soil along the transverse direction of the tunnel was computed at 543
section S1 (i.e., underneath basement centre). Figure 9 shows the normalised secant shear 544
modulus of soil along the transverse direction of the tunnel. In total, the secant shear modulus 545
of soil at sixteen points was obtained. At each location, the secant modulus of soil with a 546
relative density of 51% (i.e., GCD51) was normalised by that in a sand with a relative density 547
of 68% (i.e., GCD68). Due to a smaller void ratio in a denser sand, the normalised secant shear 548
modulus of soil (GCD51/GCD68) along the transverse tunnel direction was about 0.65 after the 549
g-level was increased to 60 g. Upon completion of simulating basement excavation, the 550
normalised shear modulus of soil above the tunnel springline was decreased to 0.58, but that 551
of soil below the tunnel springline was increased to 0.73. After increasing g-level and 552
basement excavation, the computed soil stiffness around the transverse tunnel direction in a 553
looser sand (i.e., CD51) was found to be much smaller than that in a denser sand (i.e., CD68). 554
This implies that a tunnel buried in a looser sand is less resistant to vertical elongation when 555
it was subjected to stress relief. Moreover, a larger inward wall movement is induced in a 556
looser sand (i.e., CD51) due to a smaller stiffness of soil around the tunnel. Thus, basement 557
excavation in a looser sand caused a larger horizontal compression in a tunnel. Because of 558
these two factors, larger vertical elongations are induced in the tunnel accordingly. 559

22
Correspondingly, a larger horizontal compression is induced in a tunnel buried in a looser 560
sand. 561
562
Induced strain in the tunnel along its transverse direction 563
Figure 10 shows the measured and computed strains at the outer surface of the tunnel 564
lining along the transverse direction of the tunnel. All the strains presented in this figure are 565
incremental, i.e., due to basement excavation only. Positive and negative values denote 566
tensile and compressive strains, respectively. By taking bending moment of the aluminium 567
alloy tube from centrifuge tests and numerical analyses, strain of an unreinforced concrete 568
tunnel with equivalent flexural stiffness (i.e., with Young’s modulus of 35 GPa and thickness 569
of 230 mm) was calculated by using beam theory. All the results were taken at two sections 570
of existing tunnel, i.e., directly beneath (section S1) and 0.33 L (section S2) away from the 571
basement centre, respectively. 572
Due to symmetrical stress relief around the tunnel lining, the profiles of measured and 573
computed strains were symmetrical for the tunnel located directly beneath and 0.33 L away 574
from basement centre (i.e., sections S1 and S2) as expected. Tensile strains were induced at 575
the outer surface of the tunnel crown, shoulder, knee and invert, corresponding to elongation 576
of the tunnel at those locations. On the other hand, compressive strain was measured and 577
computed at the outer surface of the tunnel springline, corresponding to compression of the 578
tunnel at that particular location. Variations in strains in the tunnel along its transverse 579
direction were consistent with changes in tunnel diameters measured by the potentiometers 580
(see Fig. 8). Upon completion of basement excavation, the maximum tensile strain of 132 581
μin the tunnel along its transverse direction was measured beneath the basement centre (i.e., 582
section S1). According to ACI224R (2001), the ultimate tensile strain of unreinforced 583
concrete is 150 μ. So if the tensile strain in the existing tunnel is above 18 μeven before 584
23
basement excavation, the tunnel could crack. Compared with the strain at section S1 (i.e., 585
beneath the basement centre), the strain at section S2 (i.e., 0.33 L away from the basement 586
centre) was reduced by 20-30%. 587
Both measured and computed maximum tensile strain at the tunnel crown was much 588
larger than that at the invert. This is because the tunnel crown experienced a much larger 589
stress relief than the invert (see Fig. 6a). At a given tensile strain in the tunnel along its 590
transverse direction, the crown was more vulnerable to cracking than the invert. For tunnel 591
located directly underneath basement centre (i.e., section S1), the measured maximum tensile 592
strains in the tunnel along its transverse direction were 132 and 110 μ, respectively, in Tests 593
CD51 and CD68. This indicates that the measured maximum tensile strain in the tunnel 594
increased by 20% when the relative sand density decreased from 68% (CD68) to 51% 595
(CD51). The computed maximum tensile strain also increased with a reduction in sand 596
density. It is consistent with variations in tunnel diameters with the relative sand density as 597
shown in Fig. 8. This is because a looser soil is less stiff around a tunnel and hence the 598
inward wall movement would be larger. 599
In the cases of SD69 and SS70 (in which the basement was excavated at the side of the 600
tunnel), both measured and computed strains showed that the shape of the tunnel was clearly 601
distorted due to unsymmetrical stress relief and shearing around it. At both sections S1 and 602
S2, the maximum tensile strain was measured and computed in the right shoulder (close to 603
the basement) of the tunnel. Upon completion of basement excavation, the maximum tensile 604
strains in the tunnel located at basement centre (i.e., section S1) were measured to be 34and 605
69 μ respectively in Tests SD69 and SS70. Under the same sand density and wall stiffness, 606
the maximum transverse tensile strain of tunnel in Test SD60 was only about 31% of that in 607
Test CD68. At section S1, the measured maximum tensile strain in the tunnel located at the 608
side of the basement (i.e., 69 μ in Test SS70) was only 52% of that in the tunnel located 609

24
directly beneath the basement (i.e., 132 μ in Test CD51). It is obvious that the maximum 610
tensile strain in the tunnel along its transverse direction was reduced by more than 50% when 611
a diaphragm wall was adopted to replace a sheet pile wall. As expected, the sheet pile wall 612
moved inward to a larger extent causing a greater stress reduction around the tunnel lining. A 613
discussion on the reduced normal stress acting on the tunnel lining is given in the next section. 614
According to the numerical parametric study by Shi et al. (2015), the basement-tunnel 615
interaction at basement centre could be simplified as a plane strain condition when the 616
excavation length (i.e., L) along the longitudinal tunnel direction reached 9 He (excavation 617
depth). For the short excavation (i.e., L/He = 2.0) reported in this study, induced tunnel heave 618
and transverse tensile strain at basement centre were less than 30% of that in a long and 619
narrow excavation (i.e., L/He = 9.0). It implies that corner stiffening in a short excavation 620
significantly reduced tunnel heave and tensile strain by basement excavation. 621
622
Reduced normal stress acting on the tunnel lining along its transverse direction 623
Figure 11 shows the reduction in normal stress acting on the tunnel lining along its 624
transverse direction as a result of basement excavation. Excavation induced reduction in 625
normal stress around tunnel lining is computed in section S1 which is located beneath 626
basement centre For a tunnel located beneath the basement centre (CD51 and CD68), the 627
profiles of reduced normal stress acting on the tunnel lining were symmetrical as expected. 628
Stress relief along the vertical direction was larger than that along the horizontal direction. 629
Thus, the existing tunnel was vertically elongated and horizontally compressed (see Figs. 8 & 630
10). Accordingly, tensile strain was induced at the outer surface of the tunnel crown and 631
invert, while compressive strain was observed at the outer surface of the tunnel springline. 632
Note that the reduction in normal stress at the tunnel crown was about five times larger than 633
that at the invert. Correspondingly, a much larger tensile strain was induced at the crown than 634

25
at the invert (see Fig. 10). As expected, the extent of normal stress reduction around the 635
tunnel lining changed little (less than 1%) as the relative sand density decreased from 68% 636
(CD68) to 51% (CD51). However, the maximum transverse tensile strain at the tunnel crown 637
in Test CD51 was 20% larger than that in Test CD68. This is because a looser soil is less stiff 638
around the tunnel (see Fig. 9) and hence the wall moved inward to a greater extent. Thus, a 639
stiffer retaining wall can be used to reduce excavation-induced tensile strain in the tunnel 640
along its transverse direction. 641
For a tunnel located at the side of the basement, the reduction in normal stress acting on 642
the tunnel lining was clearly asymmetrical. The stress relief at the tunnel right shoulder and 643
springline, which are closer to the basement, was much larger than that at other locations. 644
Correspondingly, the tunnel lining was elongated toward the basement as shown in Fig. 10. 645
Note that a much larger stress reduction occurred around the tunnel lining when the sheet pile 646
wall (SS70), as opposed to the diaphragm wall (SD69), was adopted. Due to an increase in 647
stress relief around the tunnel lining with decreasing wall stiffness, a much larger transverse 648
tensile strain was observed in Test SS70 than in Test SD69 (see Fig. 10). 649
For a tunnel located beneath the basement centre (CD51 and CD68), the reduction in 650
normal stress around the tunnel lining exceeded the allowable limit (of 20 kPa according to 651
BD (2009)). Because of large stress changes around existing tunnel, attention should be paid 652
to the integrity of existing tunnel lining. For a tunnel located at the side of the basement 653
(SD69 and SS70), however, only the section of the tunnel lining closest to the basement 654
experienced stress changes larger than the allowable limit. Note that the maximum reduction 655
in normal stress in the latter tunnel was 43% of that in the former tunnel. This is consistent 656
with the measured tensile strain in tunnel (i.e., located outside the basement) along its 657
transverse direction as shown in Fig. 10. 658
659

26
Induced strain in the tunnel along its longitudinal direction 660
Figure 12 shows the measured and computed strains in the tunnel along its longitudinal 661
direction. Positive and negative values denote tensile and compressive strains at the tunnel 662
crown, corresponding to hogging and sagging moments, respectively. 663
For a tunnel located directly beneath the basement centre (CD51 and CD68), the profiles 664
of measured strains at the tunnel crown along the longitudinal direction were symmetrical 665
with respect to the basement centre as expected. This implies that uniformity was achieved in 666
the preparation of sand samples. Due to differential tunnel heave as shown in Fig. 5, hogging 667
and sagging moments were induced at the basement centre and other locations. By inspecting 668
the strains measured at the tunnel crown along the longitudinal direction of the tunnel, the 669
inflection point where strain is equal to zero can be identified. In these two tests, the 670
inflection point, where the shear force was at a maximum, was about 0.8 L (i.e., basement 671
length) away from the basement centre. 672
A reasonably good agreement between measured and computed results was obtained 673
except for induced strain at the basement centre. Both measured and computed strains in the 674
tunnel along its longitudinal direction increased due to a reduction in sand density. Upon 675
completion of basement excavation, the measured maximum strains in the hogging and 676
sagging regions increased by 15% and 13%, respectively, as the relative sand density 677
decreased from 68% (CD68) to 51% (CD51). This is consistent with the finding shown in Fig. 678
5 that longitudinal tunnel heave increased as soil density was reduced. This is because the 679
mobilised shear stiffness of soil at the tunnel crown and invert was significantly reduced as 680
sand density decreased from 68% to 51%, while differences in soil stress relief at those 681
locations were negligible (see Fig. 6). 682
For clarity, induced strain in the tunnel located at the side of the basement is not shown 683
in Figure 12. Due to excavation-induced differential settlement of that tunnel (see Fig. 5), 684

27
sagging and hogging moments were induced at the basement centre and other locations, 685
respectively. Once basement excavation had ended, the maximum tensile strains at tunnel 686
crown were measured to be 12 and 18 μ, respectively, when the tunnel was retained by the 687
diaphragm wall (SD69) and when it was retained by the sheet pile wall (SS70). In addition, 688
the measured maximum tensile strains at the tunnel springline in Tests SD69 and SS70 were 689
5 and 12 μ respectively. Therefore, using a diaphragm wall (SD69) instead of a sheet pile 690
wall (SS70) reduced the measured maximum tensile strains in the tunnel along its 691
longitudinal direction by up to 58%. This is because a stiffer wall can reduce the ground 692
movements behind it and hence minimise tensile strain in a tunnel. Moreover, the maximum 693
longitudinal tensile strain of tunnel in Test SD60 was only about 18% of that in Test CD68. 694
For a tunnel located at the side of the basement, the maximum strains in the longitudinal 695
and transverse directions were only 23% and 53% of the corresponding values for a tunnel 696
located directly beneath the basement. Moreover, the maximum movement of the former 697
tunnel was measured to be just 21% of that of the latter tunnel. By using a sheet pile wall to 698
replace a diaphragm wall, excavation induced responses of tunnel at a side of basement (i.e., 699
SS70) were still small. Thus, it is decided that the influence of sand density on tunnel 700
responses was not considered for this case. In this paper, the numerical parametric study only 701
focused on the influence of wall stiffness on the responses of tunnel when it was located 702
directly underneath basement centre. 703
704
Effects of wall stiffness on three-dimensional tensile strains induced in the tunnel 705
Figure 13 shows the relationships between wall stiffness and excavation-induced three-706
dimensional tensile strains in the tunnel located directly beneath the basement centre. All the 707
strains plotted in this figure are due to overlying basement excavation only. A retaining wall 708
with a flexural stiffness (EwIw) of 2.58×10⁵ MN·m in prototype is equivalent to a 4.5 m thick 709

28
diaphragm wall assuming Young’s modulus of concrete of 35 GPa. Since the induced 710
maximum lateral movement of the wall was less than 0.1 mm in prototype, the retaining wall 711
can be considered as a rigid wall. In this case, the induced heave and tensile strain in the 712
tunnel were attributed to vertical stress relief and soil movement behind the retaining wall 713
rather than inward wall movement. 714
As shown in Figure 13a, the maximum tensile strain in the tunnel along its longitudinal 715
direction increased slightly when wall stiffness increased from 80 (sheet pile wall) to 716
9.84×10³ MN·m (1.5 m diaphragm wall) in prototype. However, tensile strain in the tunnel 717
did not change much when wall stiffness was further increased to 2.58×10⁵ MN·m (rigid 718
wall). The maximum tensile strain in the tunnel along its longitudinal direction was computed 719
to have varied by up to 15% when a rigid wall was adopted instead of a sheet pile wall. This 720
implies that the maximum tensile strain induced in the tunnel along its longitudinal direction 721
is insensitive to the flexural stiffness of retaining wall, given the model geometry used. 722
In contrast, induced maximum tensile strain at the crown of the tunnel along its 723
transverse direction was significantly affected by the flexural stiffness of the retaining wall as 724
shown in Figure 13b. The maximum tensile strain was reduced by more than 40% when a 1.5 725
m thick diaphragm wall was adopted instead of a sheet pile wall. Another 10% reduction in 726
the maximum tensile strain was made by further increasing the wall stiffness to 2.58×10⁵ 727
MN·m (i.e., rigid wall). This is because inward wall movement was significantly reduced for 728
the stiff diaphragm wall and so the tensile strain in the tunnel was minimised. Adopting a stiff 729
retaining wall is therefore an effective way to reduce the maximum tensile strain induced in 730
the tunnel along its transverse direction by basement excavation. 731
The maximum tensile strain in the tunnel along its longitudinal direction differed by 732
less than 15% when a rigid wall was adopted as opposed to a sheet pile wall. However, the 733
maximum tensile strain at the tunnel crown along its transverse direction was reduced by 734
29
more than 50%. This is because a tunnel has a much smaller flexural stiffness in the 735
transverse direction than in the longitudinal direction. 736
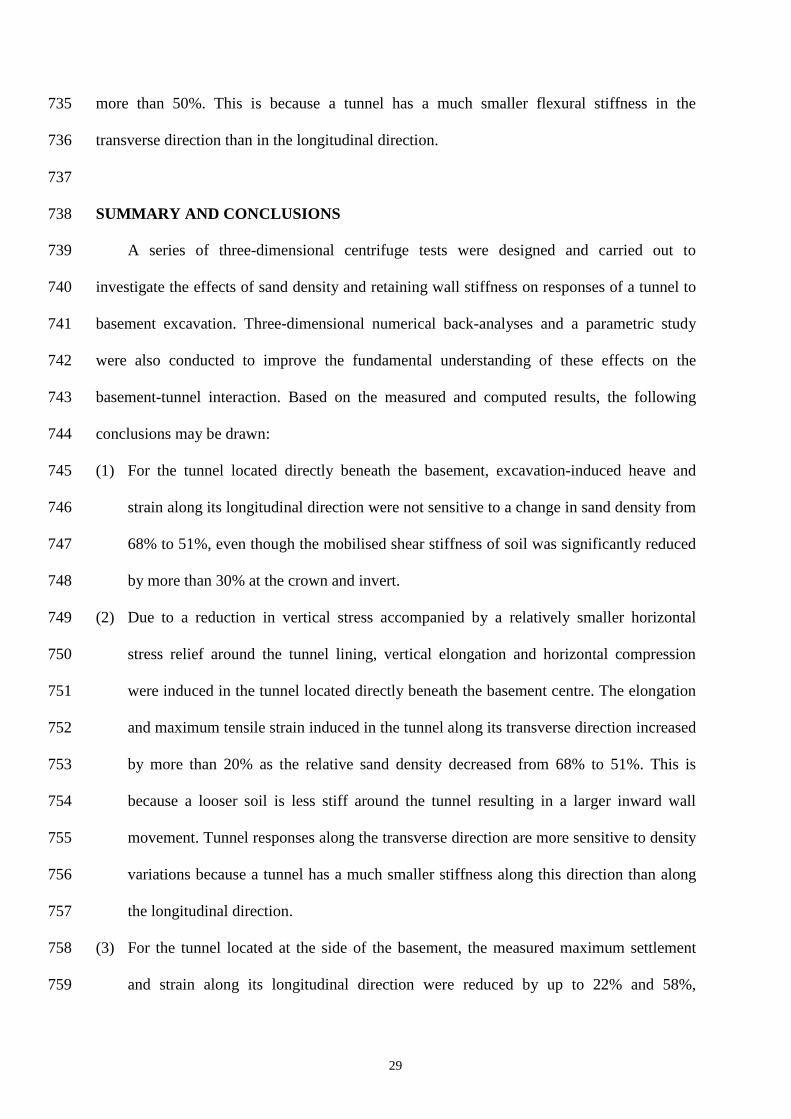
737
SUMMARY AND CONCLUSIONS 738
A series of three-dimensional centrifuge tests were designed and carried out to 739
investigate the effects of sand density and retaining wall stiffness on responses of a tunnel to 740
basement excavation. Three-dimensional numerical back-analyses and a parametric study 741
were also conducted to improve the fundamental understanding of these effects on the 742
basement-tunnel interaction. Based on the measured and computed results, the following 743
conclusions may be drawn: 744
(1) For the tunnel located directly beneath the basement, excavation-induced heave and 745
strain along its longitudinal direction were not sensitive to a change in sand density from 746
68% to 51%, even though the mobilised shear stiffness of soil was significantly reduced 747
by more than 30% at the crown and invert. 748
(2) Due to a reduction in vertical stress accompanied by a relatively smaller horizontal 749
stress relief around the tunnel lining, vertical elongation and horizontal compression 750
were induced in the tunnel located directly beneath the basement centre. The elongation 751
and maximum tensile strain induced in the tunnel along its transverse direction increased 752
by more than 20% as the relative sand density decreased from 68% to 51%. This is 753
because a looser soil is less stiff around the tunnel resulting in a larger inward wall 754
movement. Tunnel responses along the transverse direction are more sensitive to density 755
variations because a tunnel has a much smaller stiffness along this direction than along 756
the longitudinal direction. 757
(3) For the tunnel located at the side of the basement, the measured maximum settlement 758
and strain along its longitudinal direction were reduced by up to 22% and 58%, 759

30
respectively, when a diaphragm wall was adopted instead of a sheet pile wall. This is 760
because a stiffer diaphragm wall can significantly reduce the ground movements behind 761
it and hence minimise the longitudinal settlement of the tunnel. Thus, a stiff wall can be 762
used to alleviate basement excavation induced adverse effects on existing tunnel. 763
(4) Because of unsymmetrical stress relief and shearing, distortion was induced in the 764
transverse direction of the existing tunnel located at the side of the basement. When the 765
tunnel was placed behind a sheet pile wall, the maximum tensile strain in the tunnel 766
along its transverse direction was twice as large as that when the tunnel was placed 767
behind a diaphragm wall. This is because the normal stress relief around the tunnel was 768
much larger in the former case. Thus, a stiffer retaining wall can be used to alleviate 769
excavation-induced tensile strain in the tunnel along its transverse direction. 770
(5) Under the same soil density and wall stiffness, basement excavation induced maximum 771
movement and tensile strains in the tunnel located at a side of basement were about 30% 772
of the corresponding values measured in the tunnel located directly beneath basement 773
centre. For given the model geometry in this study, it is thus suggested to construct a 774
basement at a side of tunnel rather than above it. 775
(6) For the tunnel located directly beneath basement centre, dimensionless calculation charts 776
were developed to estimate the influence of wall stiffness on the maximum tensile strain 777
of tunnel along its longitudinal and transverse directions. Three-dimensional tensile 778
strains induced in the tunnel by basement excavation were observed in the calculation 779
charts. The maximum tensile strain induced in the tunnel along its longitudinal direction 780
was insensitive to wall stiffness while a stiffer retaining wall significantly reduced the 781
maximum tensile strain induced in the transverse direction. This is because a tunnel has 782
a much smaller flexural stiffness along its transverse direction than along its longitudinal 783
direction. 784

31
785
ACKNOWLEDGEMENTS 786
The authors would like to acknowledge the financial supports provided by the Research 787
Grants Council of the HKSAR (General Research Fund project No. 617511), the Program for 788
Changjiang Scholars and Innovative Research Team in University (Grant No. IRT1125) and 789
the 111 Project (Grant No. B13024). 790
791

32
REFERENCES 792
American Concrete Institute. 2001. Control of cracking in concrete structures (ACI 224R-01). 793
American Concrete Institute, Mich., USA. 794
Atkinson, J. H., Richardson, D., and Stallebrass, S. E. 1990. Effect of recent stress history on 795
the stiffness of overconsolidated soil. Géotechnique, 40 (4): 531-540. 796
Buildings Department. 2009. Practice note for authorized persons APP-24. Technical notes 797
for guidance in assessing the effects of civil engineering construction/building 798
development on railway structures and operations. Building department of the 799
government of HKSAR (BD). 800
Bolton, M. D., and Powrie, W. 1988. Behavior of diaphragm walls: retaining walls prior to 801
collapse. Géotechnique, 37 (3): 335-353. 802
BTS. 2000. Specification for tunnelling. British Tunnelling Society (BTS). Thomas Telford, 803
London. 804
Burford, D. 1988. Heave of tunnels beneath the Shell Centre, London, 1959-1986. 805
Géotechnique, 38 (1): 135-137. 806
Chang, C.-T., Sun, C.-W., Duann, S.W., and Hwang, R.N. 2001. Response of a Taipei Rapid 807
Transit System (TRTS) tunnel to adjacent excavation. Tunnelling and Underground 808
Space Technology, 16 (3): 151-158. 809
Doležalová, M. 2001. Tunnel complex unloaded by a deep excavation. Computer and 810
Geotechnics, 28 (6): 469-493. 811
Gudehus, G. 1996. A comprehensive constitutive equation for granular materials. Soils and 812
Foundations, 36(1): 1-12. 813
Gudehus, G., Amorosi, A., Gens, A., Herle, I., Kolymbas, D., Mašín, D., Muir Wood, D., 814
Niemunis, A., Nova, R., Pastor, M., Tamagnini, C., Viggiani, G. 2008. The 815

33
soilmodels.info project. International Journal for Numerical and Analytical Methods in 816
Geomechanics, 32(12): 1571-1572. 817
Herle, I., and Gudehus, G. 1999. Determination of parameters of a hypoplastic constitutive 818
model from properties of grain assemblies. Mechanics of Cohesive-frictional Materials, 819
4 (5): 461-486. 820
Hibbitt, Karlsson and Sorensen Inc. 2008. ABAQUS User’s Manual, version 6.8.2. 821
Hsieh, P.-G., and Ou, C.-Y. 1998. Shape of ground surface settlement profiles caused by 822
excavation. Canadian Geotechnical Journal, 35 (6): 1004-1017. 823
Hu, Z. F., Yue, Z. Q., Zhou, J., and Tham, L. G. 2003. Design and construction of a deep 824
excavation in soft clay adjacent to the shanghai metro tunnels. Canadian Geotechnical 825
Journal, 40(5): 933-948. 826
Huang, X., Huang H.W., and Zhang, D.M. 2012. Centrifuge modeling of deep excavation 827
over existing tunnels. Proceedings of the ICE-Geotechnical Engineering (in press). 828
Huang, X., Schweiger, H.F., and Huang. H.W. 2013. Influence of deep excavations on nearby 829
existing tunnels. International Journal of Geomechanics, ASCE, 13 (2): 170-180. 830
Ishihara, K. 1993. Liquefaction and flow failure during earthquakes. Géotechnique, 43(3): 831
351-415. 832
Jáky, J. 1944. The coefficient of earth pressure at rest. Journal for the Society of Hungarian 833
Architects and Engineers, 7: 355-358. 834
Karki, R. 2006. Effects of deep excavations on circular tunnels in fine-grained soils. M.Ph. 835
thesis, University of Saskatchewan, Saskatoon, SK, Canada. 836
Kolymbas, D. 1991. An outline of hypoplasticity. Archive of Applied Mechanics, 61: 143-837
151. 838
Leung, C. F., Chow, Y. K., and Shen, R. F. 2001. Behavior of pile subject to excavation-839
induced soil movement. Journal of Geotechnical and Geoenvironmental, ASCE, 126 840

34
(11): 947-954. 841
Leung, C. F., Lim, J. K., Shen, R. F., and Chow, Y. K. 2003. Behavior of pile groups subject 842
to excavation-induced soil movement. Journal of Geotechnical and Geoenvironmental, 843
ASCE, 129 (1): 58-65. 844
Liu, H. L., Li, P., and Liu, J. Y. 2011. Numerical investigation of underlying tunnel heave 845
during a new tunnel construction. Tunnelling and Underground Space Technology, 846
26(2): 276-283. 847
Lo, K.Y., and Ramsay, J.A. 1991. The effect of construction on existing subway tunnels-a 848
case study from Toronto. Tunnels and Deep Space, 6(3): 287-297. 849
Long, M. 2001. Database for retaining wall and ground movements due to deep excavation. 850
Journal of Geotechnical and Geoenvironmental Engineering, ASCE, 127(3): 203-224. 851
LTA. 2000. Code of practice for railway protection. Development & Building Control 852
Department, Land Transport Authority (LTA), Singapore. 853
Maeda, K., and Miura, K. 1999. Relative density of dependency of mechanical properties of 854
sands. Soils and Foundations, 39 (1): 69-79. 855
Mašín, D. 2012. Hypoplastic Cam-clay model. Géotechnique, 62 (6): 549-553. 856
Mašín, D. 2013. Clay hypoplasticity with explicitly defined asymptotic states. Acta 857
Geotechnica, 8 (5): 481-496. 858
Mašín, D. 2014. Clay hypoplasticity model including stiffness anisotropy. Géotechnique, 64 859
(3): 232-238. 860
Meguid, M.A., Rowe, R.K., and Lo, K.Y. 2002. 3D effects of surface construction over 861
existing subway tunnels. International Journal of Geomechanics, ASCE, 2 (4): 447-469. 862
Mohamad, H., Bennett, P. J., Soga K., Mair R. J., and Bowers, K. 2010. Behaviour of an old 863
masonry tunnel due to tunnelling-induced ground settlement. Géotechnique, 60 (12): 864
927–938. 865

35
Ng, C.W.W., Boonyarak, T., and Mašín, D. 2013a. Three-dimensional centrifuge and 866
numerical modeling of the interaction between perpendicularly crossing tunnels. 867
Canadian Geotechnical Journal, 50 (9): 935-946. 868
Ng, C.W.W, Shi, J., and Hong, Y. 2013b. Three-dimensional centrifuge modelling of 869
basement excavation effects on an existing tunnel in dry sand. Canadian Geotechnical 870
Journal, 50 (8): 874-888. 871
Ng, C.W.W., Van Laak, P., Tang, W.H., Li, X.S., and Zhang, L.M. 2001. The Hong Kong 872
geotechnical centrifuge. Proc. 3rd Int. Conf. Soft Soil Engineering, 225-230. 873
Ng, C.W.W., Van Laak, P.A., Zhang, L.M., Tang, W.H., Zong, G.H., Wang, Z.L., Xu, G.M., 874
and Liu, S.H. 2002. Development of a four-axis robotic manipulator for centrifuge 875
modeling at HKUST. Proc. Int. Conf. Physical Modelling in Geotechnics, St. John's 876
Newfoundland, Canada, 71-76. 877
Niemunis, A. and Herle, I. 1997. Hypoplastic model for cohensionless soils with elastic strain 878
range. Mechanics of Cohesive-frictional Material, 2: 279-299. 879
Peck, R.B. 1969. Deep excavations and tunneling in soft ground. Proceedings of the 7th 880
International Conference on Soil Mechanics and Foundation Engineering, Sociedad 881
Mexicana de Mecanica de Suelos, A.C., Mexico City, pp.225-290. 882
Powrie, W., Pantelidou, H., and Stallebrass, S. E. 1998. Soil stiffness in stress paths relevant 883
to diaphragm walls in clay. Géotechnique, 48 (4): 483-494. 884
Sharma, J.S., Hefny, A.M., Zhao, J., and Chan, C.W. 2001. Effect of large excavation on 885
displacement of adjacent MRT tunnels. Tunnelling and Underground Space Technology, 886
16 (2): 93-98. 887
Shi, J., Ng, C. W. W., and Chen, Y. H. 2015. Three-dimensional numerical parametric study 888
of the influence of basement excavation on existing tunnel. Computers and Geotechnics 889
63: 146-158. 890

36
Sun, Y., Xu, Y.-S., Shen, S.-L., and Sun, W.-J. 2012. Field performance of underground 891
structures during shield tunnel construction. Tunnelling and Underground Space 892
Technology, 28 (1): 272-277. 893
Taylor, R.N. 1995. Geotechnical centrifuge technology. Blackie Academic and Professional, 894
London. 895
Todd, C. D. 1975. The potentiometer handbook. McGraw-Hill, New York. 896
Von Wolffersdorff, P. A. 1996. A hypoplastic relationship for granular material with a 897
predefined limit state surface. Mechanics of Cohesive-frictional Material, 1: 251-271. 898
Wang, J. H., Xu, Z. H., and Wang, W. D. 2010. Wall and ground movements due to deep 899
excavations in Shanghai soft soil. Journal of Geotechnical and Geoenvironmental 900
Engineering, ASCE, 136 (7): 985-994. 901
Wang, Z., Wang, L., Li, L., and Wang, J. 2014. Failure mechanism of tunnel lining joints and 902
bolts with uneven longitudinal ground settlement. Tunnelling and Underground Space 903
Technology, 40: 300-308. 904
Wu, W., Bauer, E., and Kolymbas, D. 1996. Hypoplastic constitutive model with critical state 905
for granular materials. Mechanics of Materials, 23 (1): 45-69. 906
Yamashita, S., Jamiolkowski, M., and Lo Presti, D.C.F. 2000. Stiffness nonlinearity of three 907
sands. Journal of Geotechnical and Geoenvironmental Engineering, ASCE, 126 (10): 908
929-938. 909
Zheng, G., Peng, S. Y., Ng, C. W. W., and Diao, Y. 2012. Excavation effects on pile 910
behaviour and capacity. Canadian Geotechnical Journal, 49 (12): 1347-1356. 911
Zheng, G., and Wei, S.W. 2008. Numerical analysis of influence of overlying pit excavation 912
on existing tunnels. Journal of Central South University of Technology, 15(s2): 69-75.913

37
List of captions 914
Tables 915
Table 1. Relevant scaling laws (Taylor, 1995; Ng et al., 2013b) 916
Table 2. Centrifuge test program 917
Table 3. Numerical analysis program 918
Table 4. Summary of material parameters adopted for finite element analysis (Ng et al., 919
2013a; 2013b) 920
921
Figures 922
Fig. 1. Plan view of the centrifuge model 923
Fig. 2. Elevation views of the centrifuge model: (a) section A-A and (b) section B-B 924
Fig. 3. (a) Types and locations of instruments installed on the existing tunnel; (b) Transverse 925
section view; (c) Longitudinal section view (Unit: mm. All dimensions in model scale) 926
Fig. 4. (a) The three-dimensional finite element mesh adopted in this study; (b) Intersection 927
of the tunnel and the retaining wall in detail (Unit: mm. All dimensions in model scale) 928
Fig. 5. Normalised vertical displacement of the tunnel along its longitudinal direction 929
Fig. 6. Computed soil responses around the tunnel: (a) changes in vertical stress at the crown 930
and invert; (b) mobilised secant shear stiffness of soil at the crown 931
Fig. 7. Computed soil displacement vectors around the basement and the tunnel 932
Fig. 8. Elongation and compression of the tunnel located beneath the basement centre 933
Fig. 9. Mobilised secant shear stiffness of soil along the transverse direction of the tunnel in 934
section S1 935
Fig. 10. Induced strain at the outer surface of the tunnel along its transverse direction 936
Fig. 11. Reduced normal stress acting on the tunnel lining in section S1 (Unit: kPa) 937
Fig. 12. Effects of sand density on induced strain in the tunnel along its longitudinal direction 938
Fig. 13. Effects of wall stiffness on three-dimensional tensile strains induced in the tunnel by 939
basement excavation 940
941

38
Tables 942
943
Table 1. Relevant scaling laws (Taylor, 1995; Ng et al., 2013b) 944
Parameter Scaling law
(model/prototype)
Gravity (m/s2) N
Length (m) 1/N
Strain 1
Stress (kPa) 1
Density (kg/m3) 1
Unit weight (N/m3) N
Bending moment (N·m) 1/N 3
Bending moment per meter run (N·m/m) 1/N 2
Flexural stiffness (N·m2) 1/N 4
Flexural stiffness per meter run (N·m2/m) 1/N 3
945
946
Table 2. Centrifuge test program 947
ID Relative sand
density (Dr)
Retaining
wall type Remark
CD51 51% DW Basement constructed directly above the existing
tunnel CD68 68% DW
SD69 69% DW Basement constructed at the side of the existing
tunnel SS70 70% SW
DW: diaphragm wall; SW: sheet pile wall 948
949
950
Table 3. Numerical analysis program 951
Tunnel location Relative sand
density (Dr) Retaining wall type
Cover-to-
diameter ratio
(C/D)
Final
excavation
depth, He (m)
Beneath the
basement centre 68%
SW, DW (0.6, 0.96
and 1.5 m), RW
2 9
3 15
At the side of the
basement
69% DW (0.96 m) 2 9
70% SW
DW: diaphragm wall; SW: sheet pile wall; RW: rigid wall 952

39
Table 4. Summary of material parameters adopted for finite element analysis (Ng et al., 953
2013a; 2013b) 954
Angle of internal shearing resistance at critical state, '
c () a 30
Hardness of granulates, hs (GPa) a 2.6
Exponent, n a 0.27
Minimum void ratio at zero pressure, edoa 0.61
Critical void ratio at zero pressure, ecoa 0.98
Maximum void ratio at zero pressure, eioa 1.10
Exponent, b 0.14
Exponent, b 3
Parameter controlling initial shear modulus upon
180 strain path reversal, mR b
8
Parameter controlling initial shear modulus upon
90 strain path reversal, mT b
4
Size of elastic range, R b 2×10⁻⁵
Parameter controlling degradation rate of
stiffness with strainr b
0.1
Parameter controlling degradation rate of
stiffness with strain b 1.0
Coefficient of at-rest earth pressure, Ko 0.5
a: Obtained from Herle and Gudehus (1999) 955 b: Calibrated from triaxial test results for Toyoura sand (Maeda and Miura, 1999; Yamashita 956
et al., 2000) 957
φ′c: Determined from angle of repose test 958

40
Figures
1245
B
AA
All dimensions in model scaleUnit: mm
990
CD51 & CD68
25
207
SD69 & SS70
Existing tunnels
Retaining wall
g-level: 60g
Toyoura sand
100
345
300
345
Heavy fluid
reservoir
LVDT
Plastic tube
X
Y
B (Spacing: 60)
300
Fig. 1. Plan view of the centrifuge model

41
150
300750
225
1200
450
100
200
1245
Existing tunnel
S1 S2
LVDT
Unit: mmAll dimensions in model scale
(Spacing: 60)
Strain gauges
Ground surface
(a)
20
SD69 & SS70 CD51 & CD68
100
Unit: mmAll dimensions in model scale Plastic tube
Existing tunnels
25
Heavy fluid(ZnCl2)
Heavy fluidreservoir
990
200
75
150
30
207
750
450
Ground surface
(b)
Fig. 2. Elevation views of the centrifuge model: (a) section A-A and (b) section B-B

42
(a)
100
(b)
300200
100
(c)
Fig. 3. (a) Types and locations of instruments installed on the existing tunnel; (b)
Transverse section view; (c) Longitudinal section view (Unit: mm. All dimensions in
model scale)
Structural frame to
support retaining wall Structural frame to support
LVDT extension rods
Existing tunnel
Extension rod for
LVDT
Potentiometer
SSGs:
longitudinal
bending
moment
Sheet pile wall
CFGs:
transverse
bending
moment
Strain gauges in the
transverse direction of
existing tunnel
Four potentiometers
Plate for
potentiometer
Potentiometer
Plate for potentiometer
Supporting frame for potentiometer
Strain gauges in the longitudinal direction
of existing tunnel (spacing 50)

43
1
2
3
4
5
6
7
8
9
10
11
12
13
14
15
16
17
18
19
20
21
22
23
24
25
26
27
(a) 28
29
30
31
32
33
34
35
36
37
38
39
40
41
42
43
(b) 44
Existing tunnel
Retaining wall
1200
100
300 300
225
20
A
B
D
C
E
F
G
H
1245
750
990
X
Y
Z
Retaining wall
Fig. 4. (a) The three-dimensional finite element mesh adopted in this study; (b)
Intersection of the tunnel and the retaining wall in detail (Unit: mm. All dimensions in
model scale)

44
-0.02
0.00
0.02
0.04
0.06
0.08
0.10
0.0 0.5 1.0 1.5 2.0 2.5Normalised distance from basement centre, X / (L/2)
N
orm
alise
d v
erti
cal d
isp
lace
men
t of
the
tun
nel
l
alo
ng its
lon
git
ud
inal d
irec
tion
, d
/ H
e (
%)
Measured (CD51)
Measured (CD68)Measured (SD69)
Measured (SS70)Computed (CD51)
Computed (CD68)Computed (SD69)
Computed (SS70)
Location of
retaining wall
Fig. 5. Normalised vertical displacement of the tunnel along its longitudinal direction
Sign convention:
+: heave
-: settlement

45
-150
-100
-50
0
50
100
0.0 0.5 1.0 1.5 2.0 2.5 3.0 3.5
Normalised distance from basement centreline, X/(L/2)
Ch
an
ges
in
ver
tica
l st
ress
at
crow
n a
nd
in
ver
t of
f
tun
nel
alo
ng its
lon
git
ud
inal d
irec
tion
, Δ
sv (
kP
a) CD51-Crown
CD51-Invert
CD68-Crown
CD68-Invert
Location of
retaining wall
Δs= ±20 kPa (BD, 2009)
(a)
0
5
10
15
0.0 0.5 1.0 1.5 2.0 2.5 3.0 3.5Normalised distance from basement centreline, X/(L/2)
Mob
ilis
ed s
ecan
t sh
ear
stif
fnes
s of
soil a
t tu
nn
el
crow
n a
lon
g its
lon
git
ud
inal d
irec
tion
, G
(MP
a) CD51 (End of increasing g-level)
CD51 (End of excavation)
CD68 (End of increasing g-level)
CD68 (End of excavation)
Location of
retaining wall
(b)
Fig. 6. Computed soil responses around the tunnel: (a) changes in vertical stress at the
crown and invert; (b) mobilised secant shear stiffness of soil at the crown
Sign convention:
+: stress increase
-: stress decrease

46
-4 -3 -2 -1 0 1 2 3 4
0
1
2
3
4
5
Normalised distance from basement centre, Y/He
No
rm
ali
sed
dep
th b
elo
w g
ro
un
d s
urfa
ce,
Z/H
e
(a) Basement supported by a diaphragm wall
-4 -3 -2 -1 0 1 2 3 4
0
1
2
3
4
5
Normalised distance from basement centre, Y/He
No
rm
ali
sed
dep
th b
elo
w g
ro
un
d s
urfa
ce,
Z/H
e
(b) Basement supported by a sheet pile wall
Fig. 7. Computed soil displacement vectors around the basement and the tunnel
Tunnel
Basement
Tunnel
Basement
10 mm in prototype

47
-0.3
-0.2
-0.1
0.0
0.1
0.2
0.00 0.25 0.50 0.75 1.00Unloading ratio, H/C
Norm
alise
d c
han
ges
in
tu
nn
el d
iam
eter
, ∆
D/D
(%
) )
Measured (CD51_V)
Measured (CD51_H)
Measured (CD68_V)
Measured (CD68_H)
Computed (CD51_V)
Computed (CD51_H)
Computed (CD68_V)
Computed (CD68_H)
Sign convention:
+: elongation
-: compression
Fig. 8. Elongation and compression of the tunnel located beneath the basement centre
H C
Existing tunnel
Diaphragm
wall
D+D
D
D - D
V
H
Vertical
elongation
Horizontal
compression

48
0.5
0.6
0.7
0.8
(End of increasing g-level)
(End of excavation)
GCD51/GCD68
GCD51/GCD68
Cr
R-sh
R-sp
In
R-kn L-kn
L-sp
L-sh
Fig. 9. Mobilised secant shear stiffness of soil along the transverse direction of the
tunnel in section S1
CD51 & CD68
Retaining wall
Tunnel
S1
Basement
centreline
Retaining wall
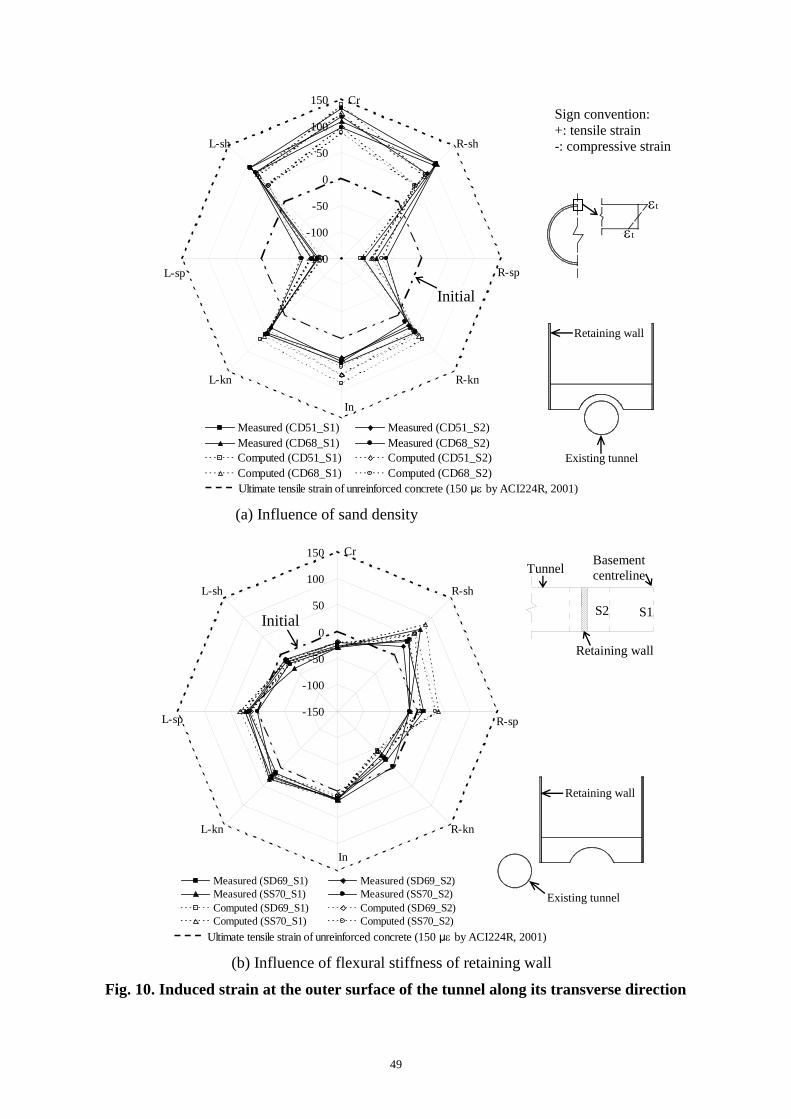
49
-150
-100
-50
0
50
100
150
Measured (CD51_S1) Measured (CD51_S2)
Measured (CD68_S1) Measured (CD68_S2)
Computed (CD51_S1) Computed (CD51_S2)
Computed (CD68_S1) Computed (CD68_S2)
Cr
R-sh
R-sp
In
R-knL-kn
L-sp
L-sh
Ultimate tensile strain of unreinforced concrete (150 μby ACI224R, 2001)
(a) Influence of sand density
-150
-100
-50
0
50
100
150
Measured (SD69_S1) Measured (SD69_S2)
Measured (SS70_S1) Measured (SS70_S2)
Computed (SD69_S1) Computed (SD69_S2)
Computed (SS70_S1) Computed (SS70_S2)
Cr
R-sh
R-sp
R-kn
In
L-kn
L-sp
L-sh
Ultimate tensile strain of unreinforced concrete (150 μby ACI224R, 2001)
(b) Influence of flexural stiffness of retaining wall
Fig. 10. Induced strain at the outer surface of the tunnel along its transverse direction
Sign convention:
+: tensile strain
-: compressive strain
Tunnel
S2 S1
Basement
centreline
Retaining wall
t
t
Existing tunnel
Retaining wall
Existing tunnel
Retaining wall
Initial
Initial

50
-30
0
30
60
90
120
150
Computed (CD51)
Computed (CD68)
Cr
R-sh
R-sp
R-kn
In
L-kn
L-sp
L-sh
1
(a) Influence of sand density 2
3
-30
0
30
60
90
120
150
Computed (SD69)
Computed (SS70)
Cr
R-sh
R-sp
R-kn
In
L-kn
L-sp
L-sh
4
(b) Influence of flexural stiffness of retaining wall 5
Fig. 11. Reduced normal stress acting on the tunnel lining in section S1 (Unit: kPa) 6
Tunnel
S1
Basement
centreline
Retaining wall
Existing tunnel
Retaining wall
Existing tunnel
Retaining wall
± 20 kPa
(BD, 2009)
± 20 kPa
(BD, 2009)
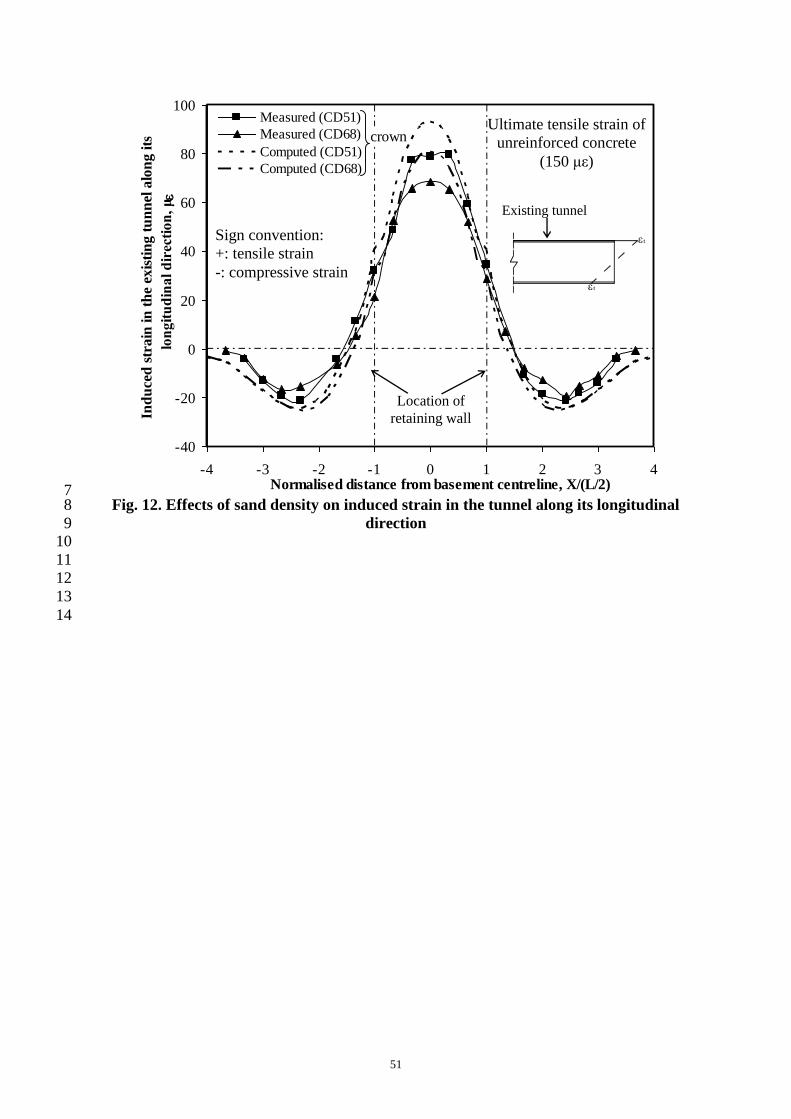
51
-40
-20
0
20
40
60
80
100
-4 -3 -2 -1 0 1 2 3 4Normalised distance from basement centreline, X/(L/2)
Ind
uce
d s
tra
in in
th
e ex
isti
ng
tu
nn
el a
lon
g its
s
lon
git
ud
ina
l d
irec
tio
n,
μ
Measured (CD51)
Measured (CD68)
Computed (CD51)
Computed (CD68)
crown
7 Fig. 12. Effects of sand density on induced strain in the tunnel along its longitudinal 8
direction 9 10
11
12
13
14
Sign convention:
+: tensile strain
-: compressive strain
Location of
retaining wall
t
t
Existing tunnel
Ultimate tensile strain of
unreinforced concrete
(150 με)

52
0
50
100
150
200
250
300
1.0E+01 1.0E+02 1.0E+03 1.0E+04 1.0E+05 1.0E+06
Flexural stiffness of retaining wall, E w I w (MN·m)
Maxim
um
tem
sile
str
ain
in
tu
nn
el a
lon
g its
s
lon
git
ud
inal d
irec
tion
,
t (μ
)
Measured (C/D=2, H = 9 m)
Computed (C/D=2, H = 9 m)
Computed (C/D=3, H = 15 m)
15 (a) Maximum tensile strain in tunnel along its longitudinal direction 16
0
50
100
150
200
250
300
1.0E+01 1.0E+02 1.0E+03 1.0E+04 1.0E+05 1.0E+06Flexural stiffness of retaining wall, E w I w (MN·m)
Maxim
um
ten
sile
str
ain
at
crow
n o
f tu
nn
el a
lon
g g
its
tran
sver
se d
irec
tion
,
t (μ
)
Measured (C/D=2, H = 9 m)
Computed (C/D=2, H = 9 m)
Computed (C/D=3, H = 15 m)
17 (b) Maximum tensile strain at crown of tunnel along its transverse direction 18
Fig. 13. Effects of wall stiffness on three-dimensional tensile strains induced in the 19
tunnel by basement excavation 20
21
Ultimate tensile strain of unreinforced
concrete (150 μby ACI224R, 2001)
Ultimate tensile strain of unreinforced
concrete (150 μby ACI224R, 2001)
e
e
e
e
e
e
Existin
g
tunnel
Retaining
wall
Dr = 68%
Dr = 68%