
Retaining the Information Structure in
86
HIROSHIMA UNIVERSITY Retaining the Information Structure in the Open Information Structure Approach During Redesign of Learning Applications: Two Study Cases (オープ ン情報構造アプローチを用いた学習アプリケ ーションの再設計における情報構造の保持: 2 つの事例) by Pedro Gabriel Fonteles Furtado A thesis submitted in partial fulfillment for the Doctor of Engineering degree in the Graduate School of Engineering Department of Information Engineering 2020 September
-
Upload
khangminh22 -
Category
Documents
-
view
0 -
download
0
Transcript of Retaining the Information Structure in

HIROSHIMA UNIVERSITY
Retaining the Information Structure inthe Open Information Structure
Approach During Redesign of LearningApplications: Two Study Cases (オープン情報構造アプローチを用いた学習アプリケーションの再設計における情報構造の保持:
2 つの事例)
byPedro Gabriel Fonteles Furtado
A thesis submitted in partial fulfillment for theDoctor of Engineering degree
in theGraduate School of Engineering
Department of Information Engineering
2020 September

Declaration of Authorship
I, Pedro Gabriel Fonteles Furtado, declare that this thesis titled, ’Retaining the In-formation Structure in the Open Information Structure Approach During Redesign ofLearning Applications: Two Study Cases’ and the work presented in it are my own. Iconfirm that:
■ This work was done wholly or mainly while in candidature for a research degreeat this University.
■ Where any part of this thesis has previously been submitted for a degree or anyother qualification at this University or any other institution, this has been clearlystated.
■ Where I have consulted the published work of others, this is always clearly at-tributed.
■ Where I have quoted from the work of others, the source is always given. Withthe exception of such quotations, this thesis is entirely my own work.
■ I have acknowledged all main sources of help.
■ Where the thesis is based on work done by myself jointly with others, I have madeclear exactly what was done by others and what I have contributed myself.
Signed:
Date:
i

“Yori ii mono ni suru tame, jinsei mo manga mo onaji. Jibun nara yarerutte unuboreya un mo hitsuyou dakedo, ichiban taisetsu na no ha, doryoku.”
Tsugumi Ohba

HIROSHIMA UNIVERSITY
AbstractGraduate School of Engineering
Department of Information Engineering
Doctor of Engineering
by Pedro Gabriel Fonteles Furtado
The open information structure is a promising approach to design learning applications.One challenge with learning applications is redesigning the activity for new learningcontexts. The open information structure, however, is based on interactable informationstructures. There is a possibility that the activity can be redesigned for the new contextswithout changing the underlying information structure. This should make for a moreeffective redesign process. This study explores redesigning learning applications that usethe open information structure approach. It explores two case studies of two systemsthat were redesigned and analyses data from multiple experiments. The redesign processwas successful and the applications appropriate for their new context. This study alsoprovides insight on how it has affected learning gains and on how the redesigned portionsaffect how the application should be used.

Acknowledgements
Gratitude to my family, for their love and support. Without them, I would not havecame so far.
Gratitude to my two brilliant professors, Professor Hirashima and Professor Hayashi,for their guidance.
Professor Hirashima was the one who made me want to come to Hiroshima University.He was also the one who made me want to continue working in research. A genius ofdiscussions, who can consider the opinions of others better than I ever could, alwaystrying to find an agreement and deepen everyone’s knowledge. He may not believe me,but I’m definitely a fan. He often helped me think about things deeper and from differentangles. I’m truly thankful.
Professor Hayashi offered me needed insight and advice into my research, helping mefind and deal with various problems. He also helped me adapt to the various culturaldifferences between Japan and my home country, an adaptation which is still a work inprogress. Our various conversations have helped me mature better as a person and forthat I’m grateful.
Deep thanks to the Japan’s Ministry of Education, Culture, Sports, Science and Tech-nology(MEXT), for having chosen me to receive a scholarship. If not for their continuedsupport, I would not have had the chance to come to Japan. I hope I can contributefurther to my laboratory and to Japan, as to honor their choice.
Of course, all my lab-mates. Always warm, friendly, accepting and glad to help. Inparticular Yamamoto, Hirota, Yoshimura, Nachan, Iwai, Motokawa, Lia and Kitamura,who helped me multiple times and were very useful in giving me feedback on my research.
To the various people I met in Japan. Everyone who makes my life here better, friends,university staff, everyone who has helped me. I would like to mention Abu, Jonathan,Kai, Li, Chizuka, Tomato, Karina and Misako in particular, for having played a big rolein my life in Japan.
To Samuel, Rodrigo, Mari and Bea for entertaining me in Tokyo. To my friends inBrazil. There are too many to cite but I would just like to say that the ”prostitutos”group is ”doidera”.
And thank you, reader. If you’re going to read everything, I definitely hope you enjoy.
iv

Contents
Declaration of Authorship i
Abstract iii
Acknowledgements iv
List of Figures viii
List of Tables x
Abbreviations xi
1 Introduction 1
2 Related Works 62.1 Kindergarten Interventions on Math Skills . . . . . . . . . . . . . . . . . . 62.2 Cognitive Load, Learning, Interfaces and the Flow State . . . . . . . . . . 82.3 Computer-based Concept Map Tools . . . . . . . . . . . . . . . . . . . . . 92.4 Learning Analytics . . . . . . . . . . . . . . . . . . . . . . . . . . . . . . . 112.5 Computer-based Concept Map Tools and Closed Concept Maps . . . . . . 122.6 Learning Analytics Applied to Concept Maps . . . . . . . . . . . . . . . . 12
3 Research Questions 14
4 Case Study 1: Kindergarten Monsakun 154.1 The System . . . . . . . . . . . . . . . . . . . . . . . . . . . . . . . . . . . 15
4.1.1 The Development Process . . . . . . . . . . . . . . . . . . . . . . . 154.1.2 Triplet Structure Model . . . . . . . . . . . . . . . . . . . . . . . . 16
4.1.2.1 Image and sound design in connection with the TripletStructure Model . . . . . . . . . . . . . . . . . . . . . . . 18
4.1.2.2 Level 1 . . . . . . . . . . . . . . . . . . . . . . . . . . . . 194.1.2.3 Level 2 . . . . . . . . . . . . . . . . . . . . . . . . . . . . 21
Level 2-2 . . . . . . . . . . . . . . . . . . . . . . . . . . . . . 214.1.2.4 Level 3 . . . . . . . . . . . . . . . . . . . . . . . . . . . . 21
Level 3-1 . . . . . . . . . . . . . . . . . . . . . . . . . . . . . 21
v

Contents vi
Level 3-2 . . . . . . . . . . . . . . . . . . . . . . . . . . . . . 214.1.2.5 Level 4 . . . . . . . . . . . . . . . . . . . . . . . . . . . . 224.1.2.6 Level 5 . . . . . . . . . . . . . . . . . . . . . . . . . . . . 234.1.2.7 Level 6 . . . . . . . . . . . . . . . . . . . . . . . . . . . . 23
4.2 The Experiment . . . . . . . . . . . . . . . . . . . . . . . . . . . . . . . . 244.2.1 Methods . . . . . . . . . . . . . . . . . . . . . . . . . . . . . . . . . 244.2.2 Results and Discussion . . . . . . . . . . . . . . . . . . . . . . . . . 26
4.2.2.1 Overall Analysis . . . . . . . . . . . . . . . . . . . . . . . 264.2.2.2 Case studies . . . . . . . . . . . . . . . . . . . . . . . . . 30
4.2.3 Limitations . . . . . . . . . . . . . . . . . . . . . . . . . . . . . . . 32
5 Case Study 2: Kit-build 335.1 Airmap & The Relation to Kit-build . . . . . . . . . . . . . . . . . . . . . 33
5.1.1 System Design . . . . . . . . . . . . . . . . . . . . . . . . . . . . . 335.1.1.1 Kit-build . . . . . . . . . . . . . . . . . . . . . . . . . . . 345.1.1.2 Airmap . . . . . . . . . . . . . . . . . . . . . . . . . . . . 345.1.1.3 Cognitive load considerations between the interfaces . . . 35
5.1.2 Support for Recreating the Expert Map . . . . . . . . . . . . . . . 375.2 Kit-build Experiment 1 . . . . . . . . . . . . . . . . . . . . . . . . . . . . 38
5.2.1 Participants . . . . . . . . . . . . . . . . . . . . . . . . . . . . . . . 395.2.2 Materials . . . . . . . . . . . . . . . . . . . . . . . . . . . . . . . . 395.2.3 Procedure . . . . . . . . . . . . . . . . . . . . . . . . . . . . . . . . 395.2.4 Results . . . . . . . . . . . . . . . . . . . . . . . . . . . . . . . . . 40
5.3 Kit-build Experiment 2 . . . . . . . . . . . . . . . . . . . . . . . . . . . . 425.3.1 Design . . . . . . . . . . . . . . . . . . . . . . . . . . . . . . . . . . 425.3.2 Participants . . . . . . . . . . . . . . . . . . . . . . . . . . . . . . . 435.3.3 Materials . . . . . . . . . . . . . . . . . . . . . . . . . . . . . . . . 435.3.4 Procedure . . . . . . . . . . . . . . . . . . . . . . . . . . . . . . . . 445.3.5 Results . . . . . . . . . . . . . . . . . . . . . . . . . . . . . . . . . 445.3.6 General Discussion . . . . . . . . . . . . . . . . . . . . . . . . . . . 47
5.4 Kit-build Experiment 2 New and Previous Knowledge Analysis . . . . . . 495.4.1 Method . . . . . . . . . . . . . . . . . . . . . . . . . . . . . . . . . 49
5.4.1.1 Data Analysis Methods . . . . . . . . . . . . . . . . . . . 495.4.1.2 Results . . . . . . . . . . . . . . . . . . . . . . . . . . . . 49
5.4.2 Discussion . . . . . . . . . . . . . . . . . . . . . . . . . . . . . . . . 525.5 Kit-build Experiment 2 Node Oriented Analysis . . . . . . . . . . . . . . . 54
5.5.1 Coupling Nodes and Questions . . . . . . . . . . . . . . . . . . . . 545.5.2 Method . . . . . . . . . . . . . . . . . . . . . . . . . . . . . . . . . 545.5.3 Results . . . . . . . . . . . . . . . . . . . . . . . . . . . . . . . . . 54
6 Conclusion 626.1 Monsakun . . . . . . . . . . . . . . . . . . . . . . . . . . . . . . . . . . . . 626.2 Kit-build . . . . . . . . . . . . . . . . . . . . . . . . . . . . . . . . . . . . 636.3 Overall Conclusion . . . . . . . . . . . . . . . . . . . . . . . . . . . . . . . 64

Contents vii
Bibliography 66

List of Figures
1.1 Open Information Structure approach related to the grounding theories . 31.2 MVC model redesign showing off possible improvements regarding im-
proved use and higher accessibility . . . . . . . . . . . . . . . . . . . . . . 41.3 Expanded Open Information Structure Application for Redesigned appli-
cations . . . . . . . . . . . . . . . . . . . . . . . . . . . . . . . . . . . . . . 4
4.1 The Triplet Structure Model. A diagram showing the composition of thetriplet structure model . . . . . . . . . . . . . . . . . . . . . . . . . . . . . 16
4.2 Increase overall story and story pieces. The two representations of anincrease story . . . . . . . . . . . . . . . . . . . . . . . . . . . . . . . . . . 18
4.3 Example of a problem in Level 1. Screenshot of a level 1 problem . . . . . 204.4 Screenshot of a level 3-2 problem . . . . . . . . . . . . . . . . . . . . . . . 224.5 Screenshot of a level 6 problem . . . . . . . . . . . . . . . . . . . . . . . . 234.6 Average number of tries on Level 3-2 problems . . . . . . . . . . . . . . . 284.7 Ratio of problems solved in 1 try to total number of times attempted on
Level 3-2 . . . . . . . . . . . . . . . . . . . . . . . . . . . . . . . . . . . . . 294.8 Comparison between performance on the first problem and on remaining
problems for Level 3-2 and Difficulty 2 and 3 . . . . . . . . . . . . . . . . 30
5.1 The Kit-build interface . . . . . . . . . . . . . . . . . . . . . . . . . . . . . 345.2 The Airmap interface . . . . . . . . . . . . . . . . . . . . . . . . . . . . . . 345.3 Flow diagram for building the map and changing it into the expert map . 375.4 Timeline for Experiment 1 . . . . . . . . . . . . . . . . . . . . . . . . . . . 385.5 Pre-test, post-test and delayed-test score averages for participants who
completed the delayed test . . . . . . . . . . . . . . . . . . . . . . . . . . . 445.6 A scatter plot of pre-test and post-test scores . . . . . . . . . . . . . . . . 465.7 A scatter plot of pre-test and delayed test scores . . . . . . . . . . . . . . 465.8 A scatter plot of post-test and delayed test scores . . . . . . . . . . . . . . 475.9 Boxplots of the normalized values for Air and Kit conditions. Retained
Review, which is related to retained reviewed knowledge, represents thebiggest difference between the two conditions. . . . . . . . . . . . . . . . 50
5.10 A scatter plot of Review and Retained Review. Both metrics are relatedto reviewed knowledge. The farther away from the diagonal line, the morethe user forgets. The Kit condition, represented by triangles, is able toretain more after the two-week period when compared to the Air condition 50
5.11 Examples of the three possible proposition states for node ”Between Mayand August” . . . . . . . . . . . . . . . . . . . . . . . . . . . . . . . . . . . 57
5.12 Timeline for the Experiment. . . . . . . . . . . . . . . . . . . . . . . . . . 57
viii

List of Figures ix
5.13 Bar graph showing the relationship between proposition correctness andthe answer to the related questions on the delayed post test. Propositioncorrectness is associated with correct answers on the delayed test. . . . . . 58
5.14 Bar graph showing the relationship between proposition existence andthe answer to the related questions on the delayed post test. Propositionexistence is associated with correct answers on the delayed test. . . . . . . 61
List of Tables
4.1 Example of intermediary CSV generated from raw data . . . . . . . . . . 254.2 Number of participants who cleared each level of the application . . . . . 264.3 One sample t-test results comparing measured number of attempts per
problem to the equivalent ”gaming the system” calculated value. sdstands for standard deviation. . . . . . . . . . . . . . . . . . . . . . . . . . 26
4.4 One sample t-test results comparing measured ratio of problems solved in1 try to the equivalent ”gaming the system” calculated value. Data wasconstant for level 6 so the test was not performed . . . . . . . . . . . . . . 27
5.1 Cognitive load differences between the interfaces . . . . . . . . . . . . . . 355.2 Cognitive Load metrics . . . . . . . . . . . . . . . . . . . . . . . . . . . . . 425.3 Comprehension and flow measurements . . . . . . . . . . . . . . . . . . . 425.4 Collected metrics for all participants in Experiment 2 . . . . . . . . . . . 425.5 Metrics for participants who completed the delayed test . . . . . . . . . . 425.6 Question classification table . . . . . . . . . . . . . . . . . . . . . . . . . . 515.7 Calculated user metrics and their formula. Pre refers to pre-test scores.
Review, New, ReviewOnDelay, and NewOnDelay refer to the number ofquestions belonging to each classification for that particular user. . . . . 51
5.8 The format of the log data for test answers in the experiment . . . . . . . 515.9 Average and standard deviation for the four relevant normalized metrics.
Review and Retained Review are related to reviewed knowledge. Newand Retained New are related to new knowledge. Kit is the conditionwhich takes influence from the positioning task. . . . . . . . . . . . . . . . 51
5.10 Examples of questions in the tests and the nodes they are related to inthe concept map. . . . . . . . . . . . . . . . . . . . . . . . . . . . . . . . . 56
5.11 E . . . . . . . . . . . . . . . . . . . . . . . . . . . . . . . . . . . . . . . . . 585.12 Amount of data entries for each node classification based on the proposi-
tions that use the node. Entries are further divided based on the interfaceused and based on whether or not they answered the corresponding ques-tion correctly on the delayed post test. . . . . . . . . . . . . . . . . . . . . 58
5.13 P values and odds ratio for the logistic regression related to propositioncorrectness using the nodes. HV signifies high values that were omitted,for one user that had perfect scores. . . . . . . . . . . . . . . . . . . . . . 59
5.14 P values and odds ratio for the logistic regression related to propositionexistence using the nodes. HV signifies high values that were omitted, forone user that had perfect scores. . . . . . . . . . . . . . . . . . . . . . . . 60
x

Abbreviations
LAH List Abbreviations Here
xi

Dedicated to Ana Fonteles, my mother
xii

Chapter 1
Introduction
No application can be used in every context. Learning applications are designed andoptimized for specific situations and learners. Whether or not they will keep the samelearning gains in different contexts is something that has to be verified. Not just learninggains but the application might not even be usable in a different context. For instance,an application in Japanese cannot be used in English without translating the text in theapplication. However, this problem can be more complicated depending on the context.What if the students cannot read ANY text? What if the students instead have littletime and the activity needs to be shortened? What about a context where studentsexperience high cognitive load and that might be diminishing their learning gains? Howto redesign activities for these tasks? Before we address this issue on how to redesignactivities, let us first focus in one way to create them in the first place.
One approach for designing learning applications is the Open Information StructureApproach[1, 2]. It is grounded on multiple theories:
1) Some researchers in cognitive science have pointed out mental representation struc-tures as being relevant to learning Pitt states that thought can be modeled throughmental structures [3].
2) Vosniadou proposed conceptual models for learning physics[4].
3) Furthermore, researchers have theorized that people learn through interactions witha context, through activities[5].
Combining contextualized interactions, mental representation structures and informa-tion science, The open information structure method was proposed[1, 2]. Various soft-ware have been developed under the open information structure method and have beenshown to improve learning [6, 7, 8, 9]. In the open information structure approach, the
1

Introduction 2
learning subject is modeled as an information structure. Then, this information struc-ture is broken down into pieces and manipulated by the users. Users can then use thesepieces to construct complex structures. We mentioned before that there are multipletheories that ground the Open Information Structure Approach. Figure 1.1 illustrateshow the theories relate to the information structures. Vosniadou and Pitt theorizedrepresenting the thoughts and understanding of students as mental structures. Thisprovides theoretical grounding on the link between the information structure and thelearning subject as seen in the Figure. By mapping the learning subject and making itinteractable, the approach taps into the situated learning theory of Clancey, allowingusers to learn by manipulating those structures. This is illustrated by the ”interaction”link in the figure. Since the structures being manipulated are meant to mirror the struc-tures that are forming in the minds of the users, the activities aim to externalize thethought process. The representation of the learning subject in the mind of the user isrepresented by the ”subconscious” link. The similarity between the information struc-tures can be seen in the ”similar” link. The struggles users face while trying to assembletogether the pieces aims to mirror the struggle to understand the learning subject. Thismirroring is illustrated by the ”equivalent” link in the figure. This helps bring thosestruggles to the surface, making them accessible to educators and for use in feedbackfunctions.
This is similar to the Model-View-View (MVC) model of software engineering[10]. How-ever, instead of it being at the software level, it is an MVC at the activity level. Oneadvantage of MVC is that you can change the controller and the view without havingto change the model. One could argue, though, that any learning application can bedesigned using MVC, so it is not an advantage of the Open Information Structure ap-proach. However, we are talking about redesigning learning activities, not just software.Open Information Structure approach can used MVC at a conceptual level but not useit at a software level. Often if you change the controller and view of the software, youmight greatly affect how the users learn using the application. What we are propos-ing here is not changing the controller and view of the software, but of the activity,regardless of the actual data structures in the implementation.
These information structures should be transferable between different contexts. As such.it should be possible for only the way the interaction happens to be redesigned. This way,the information structure itself would remain unchanged. This can be visualized in figure1.3. This research aims to redesign open information structure based applications andverify the effectiveness of the process. While the redesign is at the activity level, thereare other benefits related to maintaining the information structure, specially related tolog data analysis, which is often dependant on the information structure of the subject.This way we can apply similar analysis across the redesigned applications.

Introduction 3
Figure 1.1: Open Information Structure approach related to the grounding theories
On Figure 1.2, the possible benefits of the redesign are visible. Those include theexpansion of the userbase by allowing more people to ue the application and also howuse of the application can be improved for the previous userbase. By improved use wemean reduction of cognitive load or of time-on-task. Furthermore, the possibility toapply similar log data analysis techniques is also illustrated in the figure.
In this study two systems were redesigned for new contexts as use cases. In one casea arithmetic study system was redesigned for Kindergarten, where not all students canread. In the second case a concept map building application was redesigned for contextswhere long activity times and high cognitive load are undesirable. Multiple experiments

Introduction 4
Figure 1.2: MVC model redesign showing off possible improvements regarding im-proved use and higher accessibility
Figure 1.3: Expanded Open Information Structure Application for Redesigned appli-cations

Introduction 5
are done using the systems to answer the research questions. The research questions arelisted in their own chapter.

Chapter 2
Related Works
2.1 Kindergarten Interventions on Math Skills
Past research has shown that proficiency in mathematics in the early years, such asnumber sense, can predict mathematical performance in later school life [11]. This hasbeen verified all the way to the third year of elementary school. It suggests that buildingmathematical skills before entering elementary school can greatly impact how the studentdeals with mathematics in the coming years. Hence, interventions at an early age couldbe successful in improving students’understanding of contextual problems.
Interventions to strengthen mathematical skills for both kindergarten and pre-kindergartenstudents have been implemented previously. The work of [12] focuses on cognitive devel-opmental theory to define number sense and teach it through a series of activities andgames. It has found success in increasing students’understanding of number sense. Theintervention of [13] also saw success, with activities based on various mathematics cur-ricula designed for kindergarten students. The work by [14] focused on pre-kindergartenchildren of around four years of age. Their study focused on more than just numbersense, also considering subjects such as geometric reasoning, and their results were pos-itive.
Computer-based interventions have also been researched. The work by [15] used adaptivesoftware that models the progress of the children and regulates problem difficulty foreach child, resulting in software that can be used without supervision. The softwareis focused more on specific skills and on fast and accurate access, so the authors statethat what is developed in the software is number sense access instead of number senseitself, describing the software as a complementary activity for children who are laggingbehind in class. [16] used a software called“building blocks”. Building blocks focuses
6

Related Works 7
on many aspects of Math teaching, including number sense, and targets children frompre-kindergarten to grade 2. This method has found good success.
These interventions, in general, focus on whole number understanding. However, theydo not focus on the conceptual understanding of contextual problems, which is a bigpart of how students interact with mathematics after kindergarten.
Computer-assisted interventions focused on contextual problems
With regard to contextual problems, interventions using computers have been researchedbefore. The work of [17] provides a review of the literature on the use of computer-assisted interventions (CAI) focused on contextual problems for children with mathdifficulty. The review suggests that CAI are useful for supporting students with mathdifficulty. It also suggests that CAI can be more effective than paper-based approaches.However, the review suggests that there is not enough research to answer if computer-mediated learning is more effective than teacher-mediated learning.
The study conducted by [18] approached the problem by using algebraic thinking in theearly grades. The study argued that analyzing the problems through this type of thinkingrequired a structural understanding of the problems. The analysis of how students usethe software shows that students were gradually shifting to an algebraic way of thinkingwhile solving and understanding the problems. However, the tool deployed elementsthat would be hard to adapt for Kindergarten students, such as text and diagrams.
The work of [19] focuses on a tool based on graphs to help students solve algebra con-textual problems. The tool is mainly used to plot graphics, to give more visual contextto the equations and to approximate values. The author states that it would be usefulfor the tools to become a bridge between the contextual problems and the algebraicsymbols. While targeting contextual understanding, an approach using graphics wouldbe too complex for young children. In the study by [20], which also considered al-gebraic problems, a cognitive tutor attempted to model students and provide specifictasks for each of them. The study analyzed the problem-solving strategy variants of acomputerized tutor and explored the differences between the strategies. The cognitivetutor focused more on guiding students in the various steps of problem-solving insteadof focusing on understanding the problem itself. The work of [21] had elemental schoolstudents with disabilities interact with math content through PowerPoint. Users wouldrevise the content and solve problems while receiving feedback through the system. Thescore of system users was significantly higher than the control group. The test usedfor evaluation included addition, subtraction, multiplication, and division. While thecontent of the system has not been detailed, it is implied that students mostly solved

Related Works 8
word problems and received feedback on the correctness of their answer. The systemused relies on reading and might not have a step focused on contextual understanding.
The work of [22] describes a problem-solving software based on dividing the problem intophases and assisting the students in solving each phase. One of the phases is dedicated toconceptually understanding the problem and another to planning and carrying out thecalculations. Experimental tests were also performed. The experimental group showedbetter scores than the control group and participants showed a positive affective responsetowards the system. While the system deployed does have a step focused on conceptualunderstanding of the problems, Kindergarten students who are unable to read wouldnot be able to use it.
The above research examples show various degrees of success in using computers to helpstudents with contextual problems. Some of the work even have a focus on structuralunderstanding. However, all of them rely on text and on procedures that would be toocomplicated for kindergarten students.
The main contribution of our study is that the system we propose focuses on the concep-tual understanding of contextual problems while being usable by Kindergarten students.Furthermore, we have analyzed collected data from the software to investigate whetherstudents are engaged in thinking about the structure of contextual problems. Whetheror not there were improvements in the conceptual understanding of the students is alsoinvestigated. Such a study, as far as we know, has not been done before.
2.2 Cognitive Load, Learning, Interfaces and the Flow State
Cognitive load refers to the total amount of effort used in the working memory. Cogni-tive load theory suggests that instructional activities which are not focused on schemaacquisition and automation frequently require more processing capacity than what isavailable to learners[23]. Cognitive load theory defines three types of load[24]. The first,intrinsic load, is a load which cannot be changed, relative to understanding the target.The second, extrinsic load, is a load caused by cognitive processes that are not relatedto understanding the target. The third is the germane load, which refers to the useof resources in memory to deal with the intrinsic load. As such, instructional methodsshould focus on reducing extraneous load while maximizing germane load.
When designing interfaces with consideration to cognitive load, one aspect is eliminat-ing multitasking. Multitasking can cause attention splitting, which increases cognitiveload[25]. One example is when two sources of information refer to each other and must

Related Works 9
be understood together, but are presented separately. In this case, there is an addi-tional task of keeping items in working memory because of their separation. Integratingthe two pieces of information together would eliminate this additional task and free re-sources used to actually understand the relationship between the pieces[23]. One studyfound that different interface component grouping schemes affected the amount of effortusers needed to use the interface[26]. When users have to spend time finding whereinterface components are, they are multitasking. That is, they are trying to accomplishsomething by using the interface and at the same time they are trying to find out wherethe interface components are. And while they are searching around for the interfacecomponents, they need to keep in mind what they are trying to accomplish. This iswhat affects cognitive load. By simplifying interface component search, users can focuson their goals. In terms of learning, that means users free up resources to deeply processwhat they are trying to study.
As discussed in the introduction, motivation and the flow state affect Cognitive Load.Cognitive load theories are not usually concerned with motivation, despite the problemthat a learner who experiences the flow state may report low cognitive load, while intruth he experienced high cognitive load. This is a limitation of using self-reportedsubjective ratings to measure cognitive load[27]. In this study, flow state metrics aremeasured and cognitive load is measured by both objective metrics and self-reportedsubjective metrics. This makes it possible to see how our changes affect cognitive loadand how cognitive load interacts with the flow state.
2.3 Computer-based Concept Map Tools
Computer-based concept mapping tools have been used successfully to improve learningin general[28, 29, 30] and reading comprehension[31, 32, 33]. Past studies have pointedadvantages of computer-based concept mapping, such as ease of correction and con-struction[34], the capability to add behavior-guiding constraints[35], creation processpersonalization, and frustration reduction [36]. Another possibility of computer-basedtools is the automation of diagnosis. One way to perform this diagnosis is by usingsemantic web technologies[37]. Another study used word proximity data to score theconcept maps[38]. Another option is by comparing the student constructed map withan expert constructed map. Concept map tools that provide automatic diagnosis byexpert map comparison are Cmapanalysis[39], Kit-build[40, 41], CRESST[42], KAS[43],and ICMLS [44]. The expert map comparison is made possible because the maps areclosed concept maps. This means that the number of map possibilities is limited. Thetool provides the links and concepts, so the student only has to assemble the map. Since

Related Works 10
they are built from the same pieces, it is possible to display exactly in which ways thestudent map differs from the expert map. This type of automatic diagnosis was foundto correlate with standard science tests[45] and was found to be reliable when com-pared to traditional map scoring approaches[46, 47]. It has also been used to measurechanges in interdisciplinary learning during high school[48]. With the diagnosis infor-mation, teachers can revise their lessons and give more precise feedback. This approachhas shown good results in retention when compared to traditional teaching, especiallywhen the teacher uses the map to give the feedback[49]. This type of automatic diagno-sis also allows for automated feedback, which has been effective for improving readingcomprehension[44].
Closed Concept map assembling (CMA), from pre-existing labeled concepts and linksin tools such as Kit-build, is a different process than traditional concept map cre-ation(TMC). By TMC, we mean creating a map from scratch by creating, labelingand connecting every concept and link. By CMA, we mean connecting pre-existing,pre-labeled concepts and links to form a map. Since CMA only requires connecting thepieces, it may seem like a simpler task than TMC. However, in TMC, to build a propo-sition, the user has to remember relevant information, translate a portion of it into aproposition and then translate that proposition into two concepts and a link. In CMA,to build a proposition, the user has to find two related nodes, access his memory to finda relationship between them and find, among the provided links, the one which best de-scribes that relationship. TMC involves free recalling of information and describing thatinformation in terms of freely created concepts and links. CMA involves cued recalls, aconstant search of pieces, and trying to fit one’s knowledge into the concepts and linksthat another person made.
Results from a study that compared TMC to CMA showed no significant differences inimmediate comprehension but CMA had significantly higher scores than TMC after atwo-week retention period[33]. In this study, users built the map while looking at thetext, so the differences in recall mechanisms were not present. The explanation given forthis difference in retention was that CMA challenges students to understand the entiretext in order to be able to use every concept and link provided, which doesn’t helpin TMC since the student creates the concepts and links himself. Furthermore, it wassaid that CMA requires high memory access and deeper processing of the meaning inthe text. This could be interpreted as CMA having a higher cognitive load than TMC.However, some questions remain unanswered. What about the load incurred by havingto manage the layout for all those concepts and links that the student did not createhimself? And the visual load incurred by having so much information on the screen assoon as the building process starts? And the constant search for relevant pieces? Is thatcontributing to this deeper access to memory?
Related Works 11
The changes to cognitive load proposed in this study could amplify the gains in CMA byreducing the extraneous load in the activity. On the other hand, it could diminish thegains by reducing the germane load. Since TMC and CMA have so many differences,it is hard to know what parts of CMA consist of germane load and what parts consistof extraneous load by comparing it to TMC. Since this study compares different CMAinterfaces with different cognitive loads, it should shed light on this issue.
2.4 Learning Analytics
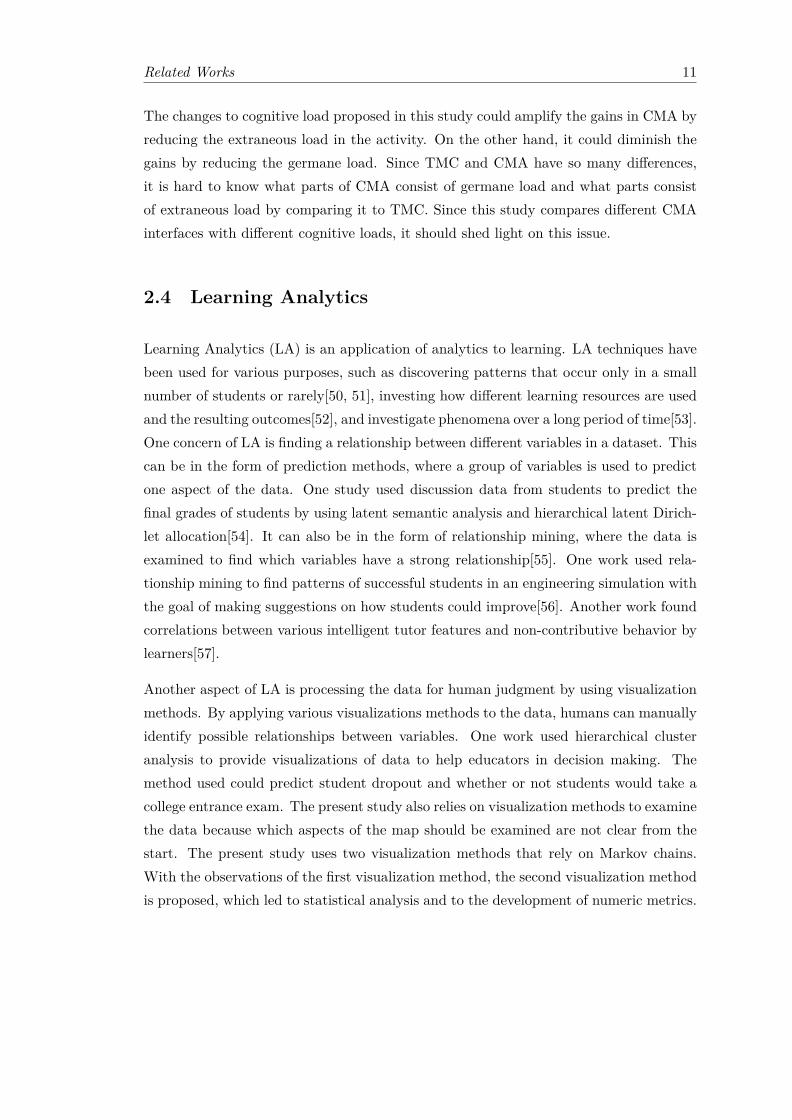
Learning Analytics (LA) is an application of analytics to learning. LA techniques havebeen used for various purposes, such as discovering patterns that occur only in a smallnumber of students or rarely[50, 51], investing how different learning resources are usedand the resulting outcomes[52], and investigate phenomena over a long period of time[53].One concern of LA is finding a relationship between different variables in a dataset. Thiscan be in the form of prediction methods, where a group of variables is used to predictone aspect of the data. One study used discussion data from students to predict thefinal grades of students by using latent semantic analysis and hierarchical latent Dirich-let allocation[54]. It can also be in the form of relationship mining, where the data isexamined to find which variables have a strong relationship[55]. One work used rela-tionship mining to find patterns of successful students in an engineering simulation withthe goal of making suggestions on how students could improve[56]. Another work foundcorrelations between various intelligent tutor features and non-contributive behavior bylearners[57].
Another aspect of LA is processing the data for human judgment by using visualizationmethods. By applying various visualizations methods to the data, humans can manuallyidentify possible relationships between variables. One work used hierarchical clusteranalysis to provide visualizations of data to help educators in decision making. Themethod used could predict student dropout and whether or not students would take acollege entrance exam. The present study also relies on visualization methods to examinethe data because which aspects of the map should be examined are not clear from thestart. The present study uses two visualization methods that rely on Markov chains.With the observations of the first visualization method, the second visualization methodis proposed, which led to statistical analysis and to the development of numeric metrics.

Related Works 12
2.5 Computer-based Concept Map Tools and Closed Con-cept Maps
Computer-based concept map tools have been used to improve both general learn ingeneral[28, 29, 30] and reading comprehension[31, 32, 33]. The advantages of closedconcept maps have been cited as ease of correction and construction[34], the capabilityto add behavior-guiding constraints[35], creation process personalization, and frustrationreduction [36]. Computer-based concept map tools also make automated feedback pos-sible. This automated feedback has been done by using semantic web technologies[37].Another study used word proximity data to score the concept maps[38]. If the mapsused are closed concept maps, then it is trivial to compare the student-built maps to theexpert map. Multiple concept map tools used this approach, such as Cmapanalysis[39],Kit-build[40, 41], CRESST[42], KAS[43], and ICMLS [44]. Since they are built from thesame pieces, it is possible to display exactly in which ways the student map differs fromthe expert map. This type of automatic diagnosis was found to correlate with standardscience tests[45] and was found to be reliable when compared to traditional map scoringapproaches[46, 47]. It has also been used to measure changes in interdisciplinary learn-ing during high school[48]. With the diagnosis information, teachers can revise theirlessons and give more precise feedback. This approach has shown good results in reten-tion when compared to traditional teaching, especially when the teacher uses the mapto give the feedback[49]. This type of automatic diagnosis also allows for automatedfeedback, which has been effective for improving reading comprehension[44].
2.6 Learning Analytics Applied to Concept Maps
Learning analytics has been applied to educational software which uses concept mapsin the past. One work compared learners’ concept maps to expert maps and to listsof misconceptions, to diagnose students’ learning and to find their misconceptions[58].It uses tabletops coupled with CMapTools. The teacher in the study could visualizestudents information by using a tablet, at realtime. The analytics used in this studypresent the current status of the map to find misconceptions and show them to theteacher. It does not attempt to relate that data to external information or to correlatethem to other learning metrics.
Another study used concept maps to evaluate how well students learned and coupledthat with analytic methods to redesign a learning environment. In this case, the conceptmap is an evaluation method that was manually scored[59].

Related Works 13
Data from two intelligent tutoring systems that feature concept maps were examined inpast research to design and evaluate knowledge tracking variables[60]. The number ofconcepts was a significant predictor of knowledge in one of the two systems. For closedconcept maps, however, a complete map always has the same number of concepts, sincethe pieces are fixed. As such, this result is hard to apply to closed concept maps.
Another study uses concept maps as a visualization method for students performanceby generating a concept map based on the tests performed by the learners[61]. In thiscase, the concept maps are artifacts generated by the analytical methods, instead of theconcept maps being the input.
Betty’s Brain is a learning by teaching environment where students construct the knowl-edge of an agent by using concept maps[62]. Automated analysis of learners’ actions hasbeen coupled with discourse analysis in a past study on Betty’s Brain[63]. Different col-laborative behaviors were associated with different learning performances. Some of themodeled concept map constructing actions include adding nodes, adding links, removingnodes, removing links, and highlighting parts of the map. However, the map actionsare coupled with discourse to check how students were collaborating. The actual mapbuilding process in isolation and how it relates to learning gains was not observed. Onework used hidden Markov models to analyze log data in Betty’s Brain[64], to check theeffects of metacognitive prompts. Another analysis also used hidden Markov models butcoupled with reinforcement learning to generate more data, which is then fed to a newmodel, alongside the old data[65]. However, those two studies that used Markov modelsonly used data related to the various high-level functions in the system, without delvinginto the data related to the map building process.
One work evaluated concept maps using the number and depth of the concepts to eval-uate students’ understanding[66]. It uses manual verification by teachers to check whichpropositions are correct. It was said that teachers believed the evaluation method usemirrored homework scores, but no correlation was provided. This makes it hard to knowhow effective the method is. An extension to the method using Markov chains has beenproposed, but the Markov chain also relies on depth information and amount of elementsin the concept map, not including evaluation of the correctness of the propositions[67].
While learning analytics have been applied in great extent to concept maps, few workstarget the map building process and closed concept maps. The works that do includeclosed concept maps focus on higher level functions instead of the actual map buildingprocess. Relating content in a concept map to individual questions in externals tests ina depth higher than the correlation of average scores has not been done before, as faras we have researched.

Chapter 3
Research Questions
In this chapter the research questions of the study are introduced.
Can applications built using the open information structure approach be redesignedwhile keeping the information structure impact?
Do the redesigned applications fit their new context appropriately?
How does the redesign process affect learning gains in the new context?
In the following chapters we introduce use cases to solve these questions. The first usecase can only address the first two research questions but the second one addresses allof them.
14

Chapter 4
Case Study 1: KindergartenMonsakun
4.1 The System
4.1.1 The Development Process
The development team consisted of four people. All members influenced the design ofthe application. One member of the team was in charge of programming, designing thescreens and creating the graphics. One of the team members had years of experienceas a primary school teacher. Given his understanding of how to handle children and ofteaching mathematics, he was able to point out various shortcomings in the application.He also had experience working with Monsakun inside the classroom. The other twomembers contributed by helping design the activities and by suggesting possible solutionsto the problems that were pointed out by the team.
Developing the software involved creating features, having the team members test andanalyze the current state of the software and then deciding on improvements, additions,and cuts. As such, the development process was iterative in nature[68]. The team wouldhave a meeting and decide on the tasks that had to be completed until the next meeting.The time interval between the meetings was defined based on estimations made by thedeveloper. This process continued until all four team members were satisfied with theapplication.
Ideally, the constructed activities should have been tested with children during develop-ment. However, the tight schedule of Kindergarten in Japan has made this unfeasible.The presence of a person who has experience as a primary school teacher is thought
15

Case Study 1: Kindergarten Monsakun 16
to mitigate this issue, but not to eliminate it. The use of pictures similar to Japanesetextbooks in the application and software demonstrations with Kindergarten teachersalso helped mitigate this issue.
Figure 4.1: The Triplet Structure Model. A diagram showing the composition of thetriplet structure model
4.1.2 Triplet Structure Model
The Triplet Structure Model binds the three quantities of one arithmetical operation(operand, operant, and result quantities) to contextual story roles by using three quan-tity sentences. This is illustrated on Figure 4.1. It is usually used to describe arithmeticcontextual problems where one of the quantities is unknown.
These quantity sentences can be classified into two types: independent quantity andrelative quantity sentences. Independent quantity sentences state the existence of acertain number of objects. For example, ’there are two apples’. Relative quantity sen-tences depend on the previous existence of a certain number of objects. ’Two appleswere eaten’ is an example of relative quantity. Relative quantities operate on one ormore independent quantities.
The example in Figure 4.1 contains a case of subtraction story. The Triplet StructureModel refers to this type of story as a decrease story. An example of an increase storyis given below:
1. There are five apples (independent quantity);
2. Two apples were brought (relative quantity);
3. There are seven apples (independent quantity).

Case Study 1: Kindergarten Monsakun 17
And for combination stories:
1. There are three apples (independent quantity);
2. There are two oranges (independent quantity);
3. Put together, there are five apples and oranges (relative quantity).
Both increase and decrease stories are composed of one independent quantity in thebeginning, one relative quantity in the middle, and another independent quantity inthe end. The relative quantity shows how much the amount of the object changed(increased or decreased, depending on the story), while the independent quantities showthe number of objects before and after the change. All three quantities in increase anddecrease stories must refer to the same object, or else the story is invalid (“there aretwo apples, one apple is eaten, there is one banana”is not valid, for example).
Composition stories have a slightly different structure. In composition stories, the rel-ative quantity comes at the end, with two independent quantities coming before it.The two independent quantities must then refer to different types of objects, while therelative quantity describes the total number of the two objects together.
In decrease and increase stories, the relative quantity created a change in the amountof a certain object. In the composition case, the relative quantity provides a numericobservation of the previously defined quantities without changing their value. Differentobjects here could be “John’s apples”and “Mary’s apples”, while the relativequantity would be “John and Mary’s apples put together”.
There is one more story type that is outside of the scope of this paper, namely, thecomparison story. Due do to the nature of this story, we found it difficult to showthis by using pictures and decided to not include it in our design. However, it may beincluded in future research after a satisfactory representation is found. More informationon this and on the Triplet Structure Model can be found in the work of [6].
Application Design
The application design must allow for interactivity with the Triplet Structure Modelwithout relying on text. Our solution has been to use pictures and spoken sound. Thereare two types of pictures. The first type is rectangular in shape and is called an overallstory picture. This type shows the entire problem at once. The second type is thestory piece picture. These are small, square and represent each sentence in the TripletStructure Model. Understanding the relationship between the overall story pictures and

Case Study 1: Kindergarten Monsakun 18
the story piece pictures is like understanding how a problem is structured in the TripletStructure Model. The design of the pictures will be further introduced below. In theapplication, we also ask for users to connect the pictures to numbers. This connectionbrings them a step further to connect the in-context parts of a problem to the out-of-context parts of an arithmetic expression. This type of connection is in-line with theconceptual understanding of contextual problems described in previous sections.
We have divided the application activities into levels. Each level is described in moredetail below. Level 3 is critical to the application. It focuses on connecting story piecepictures to big pictures. Performing this requires students to be able to divide the bigpicture into three small parts, each related to a meaningful quantity.
Level 6, which connects the pictures to numbers, is also worth noting. First, we askstudents to connect story piece pictures to numbers. Since each small picture refersto one quantity, connecting one meaningful quantity to one number is not a difficulttask. However, later, the application requests users to connect one big picture to threenumbers. Since no other help is given to the user, they have no choice but to visualize thethree numbers related to the big picture. This is like writing the arithmetic expressionof a given problem while being given only the picture of the problem. Students that canperform this task well should be able to meaningfully connect contextual problems totheir arithmetic expressions. These levels will be explained further below.
4.1.2.1 Image and sound design in connection with the Triplet StructureModel
Figure 4.2: Increase overall story and story pieces. The two representations of anincrease story
The two picture representations of a Triplet Structure Model story can be seen in Figure4.2. Each picture also has an accompanying sound. On the left, the overall story is

Case Study 1: Kindergarten Monsakun 19
shown, where one picture contains all the information to describe a story. On the right,story pieces are shown, in which three pictures are put together to describe a story.
While in the model we would have, “There are three apples”, in the picture’s ac-companying sound we would have “there are three apples on the shelf”. We describethe place that the objects are in to strengthen the connection between what the soundis saying and what the picture is showing. Story piece pictures come in two types, inde-pendent and relative pictures. They correspond to independent and relative quantitiesin the Triplet Structure Model. Independent pictures are usually composed of stationaryobjects. Relative pictures will usually describe an action, like a boy inserting objectssomewhere or an animal entering a place. By describing an action or movement, wecan convey the same idea as the relative quantities of the Triplet Structure Model. Wecan be confident in the children’s interpretations of the pictures because very similardesigns are used in the textbooks used in Japanese schools.
Overall story pictures represent the entire problem in a single picture. In the overallstory picture in Figure 4.2, the three numbers of the problem can be seen, as:
1. The number of watering cans on the shelf;
2. The number of cans the boy puts on the shelf;
3. The total number of cans after the boy places them on the shelf.
The three numbers are mapped to the three-story piece pictures, creating the relationshipbetween the overall picture and the story pictures. The sound related to the overallpicture is a simple combination of the sounds of the three-story pieces put together.While connecting the overall story to the three pictures may seem like a trivial task, itis not so simple. While the first two numbers are quite clear in the overall story picture,the third number, which represents how many cans there will be on the shelf, requiresmore thinking. Students have to understand the described story and then recognize thatthere will be two watering cans on the shelf after the boy has finished. This numbercould be calculated by counting or by mental addition, either is valid. What matters is ifthe student can interpret the story or not. Since not all quantities are explicitly shown,connecting the overall story picture to the three-story piece pictures requires more thansimply looking at the photo and trying to match the objects or scenery.
4.1.2.2 Level 1
At Level 1, participants listen to audio describing a picture and then choose, from threepictures, which picture corresponds to the audio. At this level, the pictures are story

Case Study 1: Kindergarten Monsakun 20
pieces and not the overall story pictures. This is an introductory stage to introduce thepictures that can make up a story and their corresponding description.
Figure 4.3: Example of a problem in Level 1. Screenshot of a level 1 problem
Figure 4.3 shows an example. In this case, the student would hear one of these threephrases spoken out loud:
1. There are two watering cans on the shelf;
2. There is one watering can on the shelf;
3. John puts a watering can on the shelf.
Then the student would have to touch the picture that corresponds to the phrase thatthey heard. The student can also repeat the sound by pressing the sound button.

Case Study 1: Kindergarten Monsakun 21
4.1.2.3 Level 2
Level 2 focuses on connecting the overall story pictures to their spoken narration, toease students into understanding the content of the pictures. Unlike story piece pic-tures, the pictures in this level have a description comprised of three phrases, each onecorresponding to one of the quantities described in the story.
Level 2 is made up of two parts, Level 2-1 and Level 2-2.
Level 2-1 This level is based on true or false problems. Participants hear the spokennarration and are shown one overall story picture. They must decide if the picturedescribed in the narration is the picture being shown or not by pressing true or false.
Level 2-2 Part two is like Level 1, where participants are shown three pictures andaudio, having to decide which picture corresponds to the audio.
4.1.2.4 Level 3
Level 3 focuses on connecting overall stories to their story piece pictures and it is madeup of two parts.
Level 3-1 In this part, we have true or false problems, with participants being shownone overall story big picture and three-story piece pictures. They then must decide if thethree-story piece pictures correspond to the same story being shown in the big pictureor not by choosing from true or false buttons.
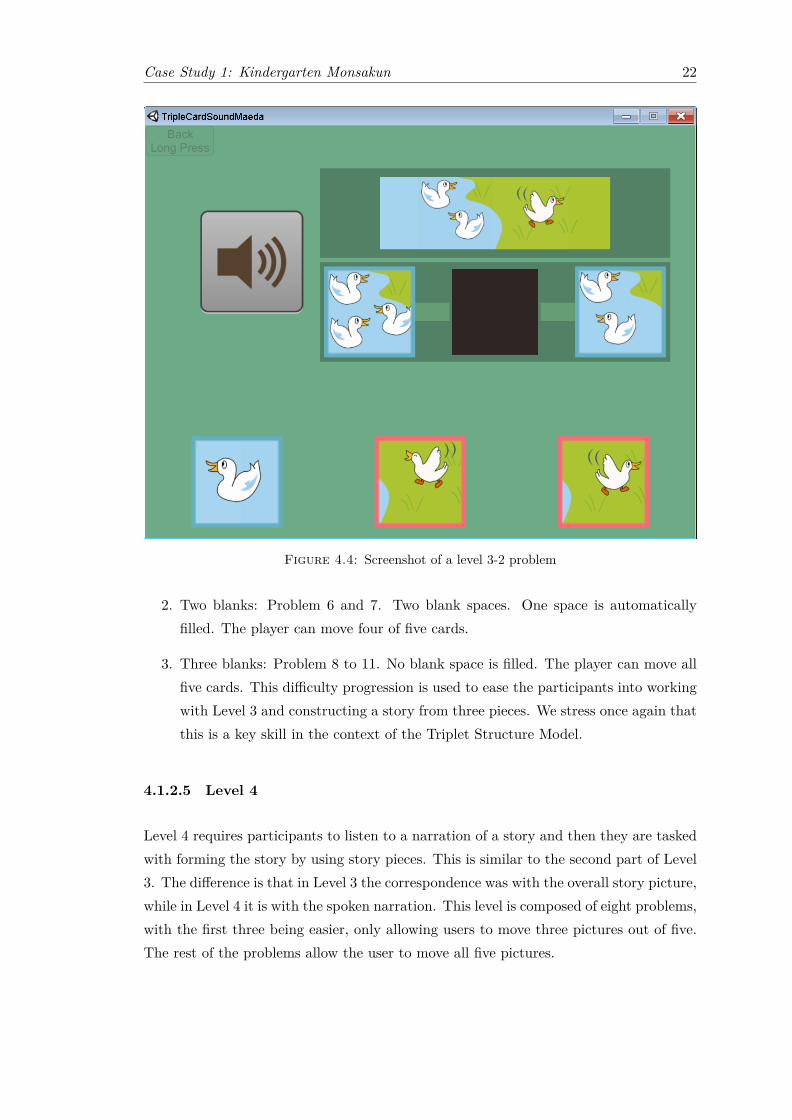
Level 3-2 Participants are shown an overall story picture and given multiple storypiece pictures in this part. They are asked to use three of the story piece pictures tomake up a single story. The made-up story must correspond to the same story beingshown in the overall story picture. Figure 4.4 illustrates this setup. Participants aregiven five pictures. Since only three pictures make up a story, the remaining two picturesare dummy pictures. Dummy pictures are added to give students more to think about.Problems in Level 3-2 do not all have the same difficulty, the number of blank spacesvaries as described below:
1. One blank: Problem 1 to 5. There is only one blank space. The other two spacesare automatically filled. The player can move three of five cards.
Case Study 1: Kindergarten Monsakun 22
Figure 4.4: Screenshot of a level 3-2 problem
2. Two blanks: Problem 6 and 7. Two blank spaces. One space is automaticallyfilled. The player can move four of five cards.
3. Three blanks: Problem 8 to 11. No blank space is filled. The player can move allfive cards. This difficulty progression is used to ease the participants into workingwith Level 3 and constructing a story from three pieces. We stress once again thatthis is a key skill in the context of the Triplet Structure Model.
4.1.2.5 Level 4
Level 4 requires participants to listen to a narration of a story and then they are taskedwith forming the story by using story pieces. This is similar to the second part of Level3. The difference is that in Level 3 the correspondence was with the overall story picture,while in Level 4 it is with the spoken narration. This level is composed of eight problems,with the first three being easier, only allowing users to move three pictures out of five.The rest of the problems allow the user to move all five pictures.

Case Study 1: Kindergarten Monsakun 23
4.1.2.6 Level 5
Level 5 shows participants an overall story picture and asks if that story belongs to acertain story type (the types being “increase”, “decrease”and “combine”), withthe participant having to choose“true”or“false”. This level relates to how well theparticipant understands the concepts of increasing, decreasing and combining. It alsorelates to how the participants comprehend the story of each picture.
4.1.2.7 Level 6
Figure 4.5: Screenshot of a level 6 problem
In this level, participants connect numbers to pictures. It is divided into two parts. Inpart one, students are tasked with connecting numbers to story piece pictures. In parttwo, students are asked to connect three numbers to a single overall story picture.
The setup that can be seen in Figure 4.5. As stated before, this is a problem thatrequires a deep understanding of the three quantities that can be interpreted from asingle picture. Users that can do this should be able to construct mental models thatallow them to be successful problem solvers.

Case Study 1: Kindergarten Monsakun 24
This section introduced the application’s design, sound design, picture design andexplained each level of the application. Which levels are critical to the conceptualunderstanding of contextual problems and why they are critical has also been discussed.
4.2 The Experiment
4.2.1 Methods
100 Japanese kindergarten students participated in the experiment. They were aroundfive years old and they were divided into three classes. All students belonged to the samekindergarten. The application was introduced in around 10 minutes. During this time,four to five problems of the first two levels were shown by using a projector connected toa tablet. The participants were encouraged to give their opinion on the answer while theteacher advanced through the problems. Afterward, students had around 20 minutes tointeract with the application by themselves, by using an android tablet that containedthe application and headphones. There was one tablet available per student, so nosharing was necessary. The use of the application by the students and the explanationswere recorded on video.
Afterward, user log data was extracted from the tablets for analysis. Because of privacyissues, it was not possible to associate student information recorded on video to theirrespective log data. The data includes various events that can happen during applicationuse. Examples of these events are a list of problems being started or a button beingpressed. A snippet of data can be seen below.
config choice, LevelConfig, 2016−12−31−12:26:26, 11.6,level choice, 0, 2016−12−31−12:26:30, 15.16,problem list start, ProblemList − Level 1, 2016−12−31−12:26:30, 15.16,problem in list start, 0, unitCardVsSound, 2016−12−31−12:26:30, 15.18,problem in list start, 1, unitCardVsSound, 2016−12−31−12:26:32, 16.84,problem solved, 2016−12−31−12:26:32, 16.84,problem mistake, jouro1boyadd, 2016−12−31−12:26:32, 17.66,
This raw data was then processed into an intermediary comma separated value (CSV)format for easier analysis. The main interest of this intermediary data was the numberof mistakes that each user made while trying to solve the problems. An example of thisdata can be seen in Table 4.1.
The measured performance of participants was compared to a calculated “gaming thesystem”performance metric. Gaming the system (GTS, will also be used as ”to game

Case Study 1: Kindergarten Monsakun 25
Table 4.1: Example of intermediary CSV generated from raw data
session list problem mistakes operation difficulty probability5 ProblemList Level 1 0 2 exist 1 0.33333335 ProblemList Level 1 1 0 add 1 0.33333335 ProblemList Level 1 2 1 exist 1 0.33333335 ProblemList Level 1 3 1 exist 1 0.3333333
the system”), refers to the behavior displayed when students attempt to systematicallytake advantage of the way the system is made. One way users can GTS is by randomlypicking options. This definition and further discussion can be found in the work of [69].We used the probability that students will solve a level on their first try as a performancemetric. This probability depends on both the level and the difficulty of the problem.
For example, on Level 4, the probability, by random chance, of solving the first threeeasy problems in one try is 1/3 (only one option with three choices). The probabilityof solving the last five problems is 1/60 (five choices on the first card, four choices onthe second card, and three choices on the third card). The calculation (3 * 1/3 + 5 *1/60) / 8 gives us the probability of solving a problem in Level 4 in one try, by randomchance. We can use a similar logic to calculate the average number of attempts.
However, the calculated values are based on which problems the students have attemptedon each level. While uncommon, students could have stopped midway through a level,restarted and completed the level. This means that the calculated values are based onwhich problems the participants have completed for this study.
To analyze the data collected from the students we used two metrics. The first was theaverage number of attempts per problem. That is, the average number of times they tryto get to the correct answer. The second metric was the ratio of problems solved in onetry to the total number of problems attempted (RPOT). The metrics are calculated forevery student/level pair. The first metric showed how much difficulty a participant hadwith the problem. The second one revealed signs of problem mastery, since solving theproblem in one try implies that the student obtained the required knowledge related tothe problem. We also analyzed peaks of difficulties. That is, we analyzed when studentsare first introduced to harder problems and how they coped with the problem when theysaw it again, by comparing their performances.
For example, looking at the data in Table 4.1, the student related to session five tookthree attempts to solve problem one, one attempt to solve problem two, and two attemptsto solve problem three and four. If these four problems were the only problems in Level1, the average for this student for Level 1 would be two tries per problem. Since he onlysolved one problem in one try, his RPOT would be 0.25.

Case Study 1: Kindergarten Monsakun 26
Table 4.2: Number of participants who cleared each level of the application
Level N1 1002-1 902-2 893-1 203-2 144 135 96 2
Table 4.3: One sample t-test results comparing measured number of attempts perproblem to the equivalent ”gaming the system” calculated value. sd stands for standard
deviation.
Level Avg. N. Attempts Avg. N. Attempts (GTS) t df p1 1.16 (0.24) 2.00 -34.79 99.00 <0.0012-1 1.17 (0.23) 1.50 -13.61 89.00 <0.0012-2 1.24 (0.25) 2.00 -29.31 88.00 <0.0013-1 1.30 (0.32) 1.50 -2.77 19.00 0.013-2 4.77 (3.80) 13.18 -8.28 13.00 <0.0014 1.44 (0.66) 18.44 -93.11 12.00 <0.0015 1.19 (0.18) 1.50 -5.38 8.00 <0.0016 1.31 (0.27) 8.25 -37.00 1.00 0.02
Statistical analyses were run in the group of students as a whole using the metricsdefined above. Furthermore, the interactions of students that performed similarly to thecalculated GTS metrics were individually analyzed as use cases.
A pre-test and a post-test were not included in our pilot study due to constraints ontime in the schedule of the school. Log data was only collected when the user completeda level. This means that our analysis did not include some data from levels that werestopped midway through.
4.2.2 Results and Discussion
4665 lines of raw data were collected. To prepare for the analysis, the data was convertedinto 2578 lines of intermediary CSV. No data was eliminated.
4.2.2.1 Overall Analysis
Students were quick to progress through Levels 1 and 2 and found difficulty with Level3. During application use, students were deeply focused on the application. Other thanusing the software they commented on the progress of each other and asked for help
Case Study 1: Kindergarten Monsakun 27
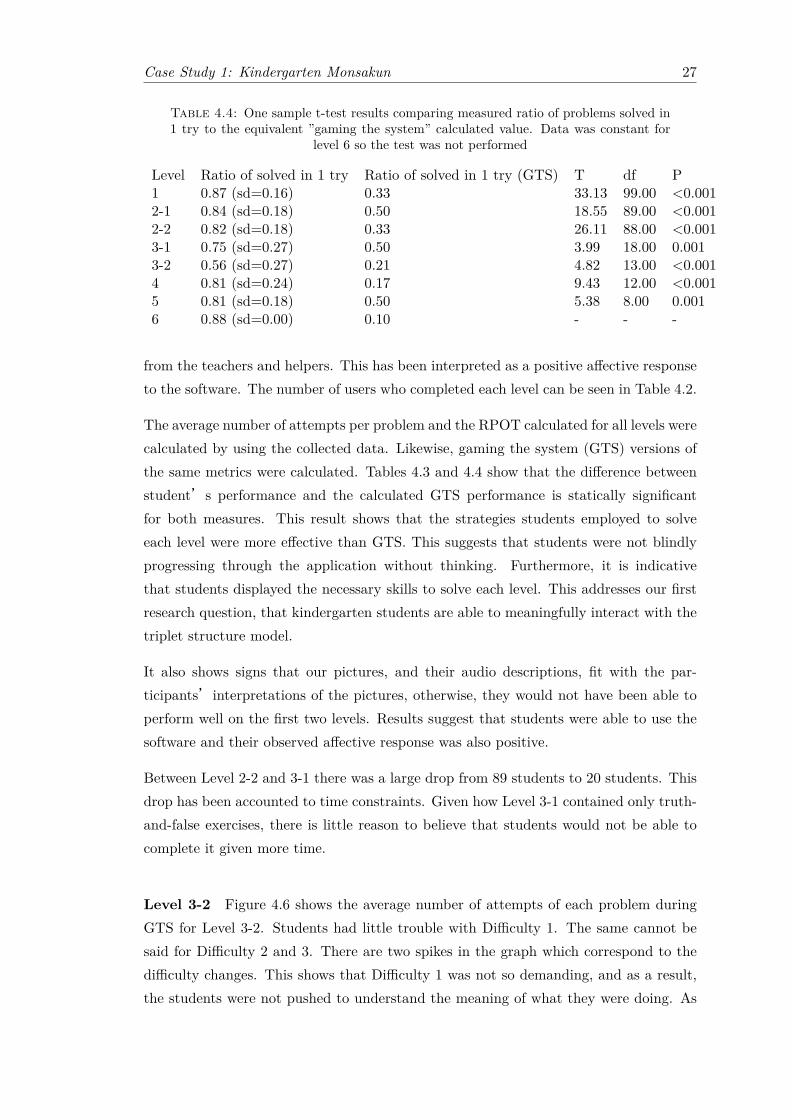
Table 4.4: One sample t-test results comparing measured ratio of problems solved in1 try to the equivalent ”gaming the system” calculated value. Data was constant for
level 6 so the test was not performed
Level Ratio of solved in 1 try Ratio of solved in 1 try (GTS) T df P1 0.87 (sd=0.16) 0.33 33.13 99.00 <0.0012-1 0.84 (sd=0.18) 0.50 18.55 89.00 <0.0012-2 0.82 (sd=0.18) 0.33 26.11 88.00 <0.0013-1 0.75 (sd=0.27) 0.50 3.99 18.00 0.0013-2 0.56 (sd=0.27) 0.21 4.82 13.00 <0.0014 0.81 (sd=0.24) 0.17 9.43 12.00 <0.0015 0.81 (sd=0.18) 0.50 5.38 8.00 0.0016 0.88 (sd=0.00) 0.10 - - -
from the teachers and helpers. This has been interpreted as a positive affective responseto the software. The number of users who completed each level can be seen in Table 4.2.
The average number of attempts per problem and the RPOT calculated for all levels werecalculated by using the collected data. Likewise, gaming the system (GTS) versions ofthe same metrics were calculated. Tables 4.3 and 4.4 show that the difference betweenstudent’s performance and the calculated GTS performance is statically significantfor both measures. This result shows that the strategies students employed to solveeach level were more effective than GTS. This suggests that students were not blindlyprogressing through the application without thinking. Furthermore, it is indicativethat students displayed the necessary skills to solve each level. This addresses our firstresearch question, that kindergarten students are able to meaningfully interact with thetriplet structure model.
It also shows signs that our pictures, and their audio descriptions, fit with the par-ticipants’interpretations of the pictures, otherwise, they would not have been able toperform well on the first two levels. Results suggest that students were able to use thesoftware and their observed affective response was also positive.
Between Level 2-2 and 3-1 there was a large drop from 89 students to 20 students. Thisdrop has been accounted to time constraints. Given how Level 3-1 contained only truth-and-false exercises, there is little reason to believe that students would not be able tocomplete it given more time.
Level 3-2 Figure 4.6 shows the average number of attempts of each problem duringGTS for Level 3-2. Students had little trouble with Difficulty 1. The same cannot besaid for Difficulty 2 and 3. There are two spikes in the graph which correspond to thedifficulty changes. This shows that Difficulty 1 was not so demanding, and as a result,the students were not pushed to understand the meaning of what they were doing. As

Case Study 1: Kindergarten Monsakun 28
Problem
Att
em
pts
05
10
15
20
25
30
1 2 3 4 5 6 7 8 9 10 11
Difficulty1
Difficulty2
Difficulty3
Figure 4.6: Average number of tries on Level 3-2 problems
soon as the difficulty went up, students struggled to solve the problem. However, afterthis first peak, their performance quickly increased. This means that students werequick to understand what was being asked of them after solving it for the first time.
Figure 4.7 shows a similar trend. The figure shows the value of RPOT for level 3-2.
Students had little trouble with difficulty 1 and they had difficulties with the sameproblems shown in the previous analysis. However, it is worth noting that around 20%of the participants managed to solve Problem 8 in one try. Level 8 is the point atwhich Difficulty 3 is first introduced. This means that a good portion of the studentshad a good understanding before the difficulty increased. The effects of the peaks aresummarized in Figure 4.8. The only peak that shows a statistical significance (t (13.83)= 2.21, p <.05) is the difference between the average number of attempts between thefirst problem (M = 18.07, SD = 22.35) and the other problems (M = 4.67, SD = 6.89).

Case Study 1: Kindergarten Monsakun 29
Problem
Solv
ed
in 1
try
(ra
tio
)
0.0
0.2
0.4
0.6
0.8
1.0
1.2
1.4
1 2 3 4 5 6 7 8 9 10 11
Difficulty1
Difficulty2
Difficulty3
Figure 4.7: Ratio of problems solved in 1 try to total number of times attempted onLevel 3-2
Although the other peaks that were analyzed di not show statistical significance, theyall show the same trend.
These results show that students had trouble when the difficulty goes up in Level 3-2but, after initially struggling, they could understand what was being asked of them, andshowed patterns of growth.
While this trend has been verified for the group in general, it remained unknown if thestudents who had most trouble also showed similar patterns. Some of these studentshave shown performance similar to the predicted GTS metrics. To investigate whetherthese students also took advantage of using the system, we perform case studies for everystudent whose average number of tries went above 50% of the predicted values.

Case Study 1: Kindergarten Monsakun 30
First problem Others First problem Others
Att
em
pts
05
10
15
20
25
Difficulty2
Difficulty3
Figure 4.8: Comparison between performance on the first problem and on remainingproblems for Level 3-2 and Difficulty 2 and 3
4.2.2.2 Case studies
The performance of four participants on Level 3-2 is analyzed in this section. This meansthat their performance was close to trying to game the system. This could be a signthat they may not have engaged well with the system.
1. User 1: Performance of 1.0 * GTS value. This participant had a lot of trouble inboth peaks of difficulty (problems 6 and 8) and in problem 11. The participantquickly solved the other problems in Difficulty 2 and 3;
2. User 2: Performance of 0.52 * GTS value. This participant had trouble fromproblems 6 to 9. They quickly managed to solve problems 10 and 11;
Case Study 1: Kindergarten Monsakun 31
3. User 3: Performance of 0.54 * GTS value. This participant had similar results toUser 1;
4. User 4: Performance of 0.84 * GTS value. This participant had similar results toUser 1.
All four students had good performance in previous levels. None of the students com-pleted Level 4. Since these students took time to get through Level 3, the reason theydid not complete Level 4 is likely because of lack of time.
Three of the four users had trouble with problems 6, 8 and 11. They had more troublethan the other participants in the pilot study and this pushed their average performancecloser to GTS. That does not mean that they were not trying to actively solve andunderstand the problems since after going through this initial trouble, they managed tosolve the other problems fast.
User 2 had a different scenario. The student had moderate trouble with problems 6 to9, four problems in a row, and then the student’s performance went up in problems 10and 11. The student did not have as much trouble with problems 6 and 8 as the otherparticipants, having more trouble with problems 7 and 9. Either the student finallyunderstood the activity while trying to solve problem 9 or they received help fromanother student. We cannot be certain because although it was observed that some ofthe students were asking for help, it is not possible to know if the student correspondingto the examined log data asked for help or not.
Users had trouble with problem 11. Of the four problems of difficulty 3 in Level 3-2,two of them are“decrease story”type, one is a“combination story”type and the lastone is an“increase story”type problem. Problems 8 and 11 are“decrease story”typeproblems and participants had trouble with both. It could be the case that “decreasestory”type problems are more difficult for students.
These results suggest that, even when students struggled at first, they could meaningfullytake advantage of the application.
Results suggest that the interaction of students with the system was meaningful andthat they showed growth patterns. This remains true even when we isolate the studentsthat struggled at first. The overall analysis combined with the case studies answer oursecond research question, that the interactions with the triplet structure model improveas the students use the application.

Case Study 1: Kindergarten Monsakun 32
4.2.3 Limitations
The pilot study lacked a control group, a pre-test, and a post-test. This makes it hardto evaluate the learning effects of the application. Time constraints also limited theamount of data collected on the harder levels of the application.
Lastly, the interactions between students, and between teachers and students, may haveinfluenced application use. In the future, one solution to this problem would be toisolate the children, so that data would be unaffected. Another approach would be tocollect data on these interactions so that it could be compared to the collected softwaredata. This would allow for a more complete view of application use and of the socialimplications of the application.

Chapter 5
Case Study 2: Kit-build
5.1 Airmap & The Relation to Kit-build
5.1.1 System Design
This study uses two interfaces for the construction of concept maps. The first one is theinterface of the previously mentioned Kit-build. The second one, the Airmap interfacethat was developed in the course of this study, will be detailed in this section. Bothinterfaces approach map building by providing pieces to the user. This means that inboth interfaces users are not required to write the nodes and links of the concept map.There are three major differences in the two interfaces:
1. Kit-build users have to manage the position of the pieces. In Airmap, the piecesautomatically position themselves.
2. In Kit-build, the user is shown all links and nodes in the same area from the verybeginning. In Airmap, the user is shown only the concepts in the beginning. Linksare added to the same area as the concepts according to the actions of the user.
3. To connect nodes, Kit-build users use connector gizmos. Airmap users use a linkselection menu.
These three differences will be further explained below. The study used two variantsof the Airmap interface. The difference is that one of the variants only shows the linkselection menu when the user connects two nodes. The other variant always keeps thelink selection menu visible. Differences in cognitive load between all three interfaces arefurther explored below.
33

Case Study 2: Kit-build 34
Figure 5.1: The Kit-build interface
Figure 5.2: The Airmap interface
5.1.1.1 Kit-build
A screenshot of the interface of Kit-build can be seen in Fig. 5.1. In this figure, Concept1, 2 and 3 are the nodes of the map. Link 1-2, Link 1-3 and Link 2-3 are the links. Whenthe activity starts, all nodes and links are displayed in a column. Links and nodes arein separate columns.
In order to connect nodes, users have to drag-and-drop the connector gizmos of eachlink. The connector gizmos are two circles connect to each link by a line. When the circlecomes into contact with a node by drag-and-drop, the circle disappears and the nodeand link are connected. In Kit-build, a link can be connected to a single node during thebuilding process. By connecting a link to two different nodes we have a node:link:nodeconnection. This is called a proposition.
In order to disconnect nodes from links, the users have to click on a link. By clickingon a link, the circles that disappeared during the connection process reappear. Bydrag-and-dropping the circles away from the connected node, the link and node becomedisconnected. The link can then be connected to other nodes.
In order to manage the layout, users are required to drag-and-drop the nodes and links.In no moment do the links or nodes move by themselves.
5.1.1.2 Airmap
The interface of Airmap can be seen in Fig. 5.2. On the right, Concept 1, 2 and 3 arethe nodes. Users can click on a node to select it. In the figure, Concept 1 and Concept

Case Study 2: Kit-build 35
3 are selected. When two nodes are selected, a thick line connects them. Link 1-2 is thelink. Link 1-2 is connecting Concept 2 and Concept 1. Thin lines connect the link tothe two concepts. On the left, there are two buttons on a menu. They show the linksavailable alongside their available quantities.
Two variations of the interface have been built. In the first variation, the button menuon the left only becomes visible when two nodes are selected. In the second variation,the button menu is always visible.
In order to connect nodes, users have to select two nodes. Afterward, they have to clickon one of the link buttons in the left menu. Then, the link will appear, connecting thetwo nodes. Unlike Kit-build, a link always connects two nodes. It is not possible toassociate a link with a single node in this interface.
In order to disconnect nodes, users have to click on the links. Clicking on a link destroysit, breaking the connection. That link then becomes available on the left menu.
Users don’t have to manage the layout. Both links and nodes move automatically. Theuser is unable to directly control the positions of the nodes and links. The algorithmused to handle the layout is a type of force-directed graph drawing algorithm[70]. Theimplementation used can be found in [71].
5.1.1.3 Cognitive load considerations between the interfaces
In this subsection, we analyze possible differences in cognitive load between the Kit-buildinterface (Kit), Airmap with hideable links (AirA) and Airmap without hideable links(AirB). All interfaces provide users with pre-labeled concepts and links, thus both areCMA activities. They all involve cued recalls, that is, the labeled pieces provided helpusers recall information. A summary of the analysis can be seen in Table 5.1.
Table 5.1: Cognitive load differences between the interfaces
Use case Kit AirA AirBConcept search >Kit, >AirB >KitLink search >Kit >KitCCL >Kit >Kit, >AirB >KitCLC ?AirA, ?AirB ?Kit >AirA, ?KitLCC ?AirA, ?AirB ?Kit >AirA
To reason about cognitive load, we define possible interface use cases and try to modelwhat kind of information the user has to keep in working memory during the use cases.We will first define the use cases and explain how they work generally. Afterward, we

Case Study 2: Kit-build 36
will explain how the use cases differ between each interface. All use cases define theconstruction of a proposition formed by concept A, concept B, and link L.
The first use case we consider is the situation where the user picks concept A, searchesfor a concept B that might be connected to concept A, then searches for the link L whichbest describes a possible relationship between concept A and B. We will call this usecase CCL (concept-concept-link). During the search for concept B, information aboutconcept A is being constantly accessed because the user must find a concept which islikely to be connected to A. When searching for link L, it is assumed that informationabout both concept A and concept B are kept in working memory. Information aboutboth A and B is constantly accessed to make a decision if the current link being visualizedcan connect A and B.
The second use case we consider is the situation where the user picks a concept A,searches for a link L believed to involve concept A, then searches for a concept B whichis related to concept A through L. We will call this use case CLC (concept-link-concept).Similar to CCL, the user has to record the initial information in his working mem-ory(concept A), then he has to perform two searches, with the second search (conceptB) requiring the result from the first search (link L).
The third use case is LCC(link-concept-concept). The only difference to CLC is thatthe user will first pick a link and then search for the concepts.
The three use cases we have defined all involve searching for the same three piecesof information and only differ in the order of search. However, when analyzing thedifferences between the interfaces, this order of search becomes important. First, wecompare AirA and AirB, the two interfaces which are most similar. In both AirA andAirB concepts get selected after clicking. However, a user cannot select a link. Byselecting a concept, the user might decrease the cognitive load associated with keepingthe information of a concept in his working memory since it is marked in the interface.Thus, this should facilitate both searches in CCL, the first search of CLC and the secondsearch of LCC. Now, remember that only in AirB the user has constant access to all linklabels. In AirA, the user can only see the links after selecting two concepts. Because ofthis, LCC and CLC are unlikely to happen in AirA. If the user does engage in LCC orCLC while using AirA, he will have further difficulty because if he forgets informationregarding the link, he will have to select two nodes in order to recheck link information.However, since link information is hidden, users are less distracted when searching forconcepts. Thus, the first search of CCL should be easier in AirA compared to AirB.To summarize, both AirA and AirB have mechanisms to facilitate CCL, with AirAfacilitating CCL further. However, AirA has mechanisms that make CLC and LCCharder.

Case Study 2: Kit-build 37
Figure 5.3: Flow diagram for building the map and changing it into the expert map
Finally, we compare Kit to both AirA and AirB. In Kit, links and concepts share thesame space. In AirA and AirB, they exist in clearly separated spaces. Furthermore,the user may have to engage in organizing the layout during a search, putting morestrain in the working memory. Thus, it is assumed that searching, in general, is moredifficult in Kit, for both concepts and links. Also, Kit does not allow for the graphicalselection of concepts. To compensate for this, users might develop spatial strategies,such as moving a concept or a link to a specific position in order to simulate selection.Such spatial strategies are not possible in AirA and AirB because these interfaces do notallow users to move the pieces. However, these strategies are user-enforced and there isno guarantee that users will use them. One advantage that Kit has over the other twointerfaces is that users can connect a concept directly to a link, without specifying thesecond concept. This connection is visible. As such, during CLC and LCC, the usercan connect the first concept to the link, thus reducing the load on the working memorywhile searching for the final concept to complete the proposition. Since during CCLthe link is only identified last, this mechanism is of no help. Thus we can say that Kithas mechanisms that facilitate CLC and LCC. However, it cannot be said that Kit isbetter than AirA and AirB for CLC and LCC since there are other factors involved, suchas differences in visual spaces and layout organization. Finally, AirA and AirB grouplinks with the same name as one element. This is not possible for Kit. This is anotherelement that speeds up the search for links when compared to Kit, in the case of mapswith multiple links that have the same label.
5.1.2 Support for Recreating the Expert Map
The general workflow for how the student builds their map and changes it into the expertmap can be seen in Fig. 5.3. At first, students build their map using Kit-build. When
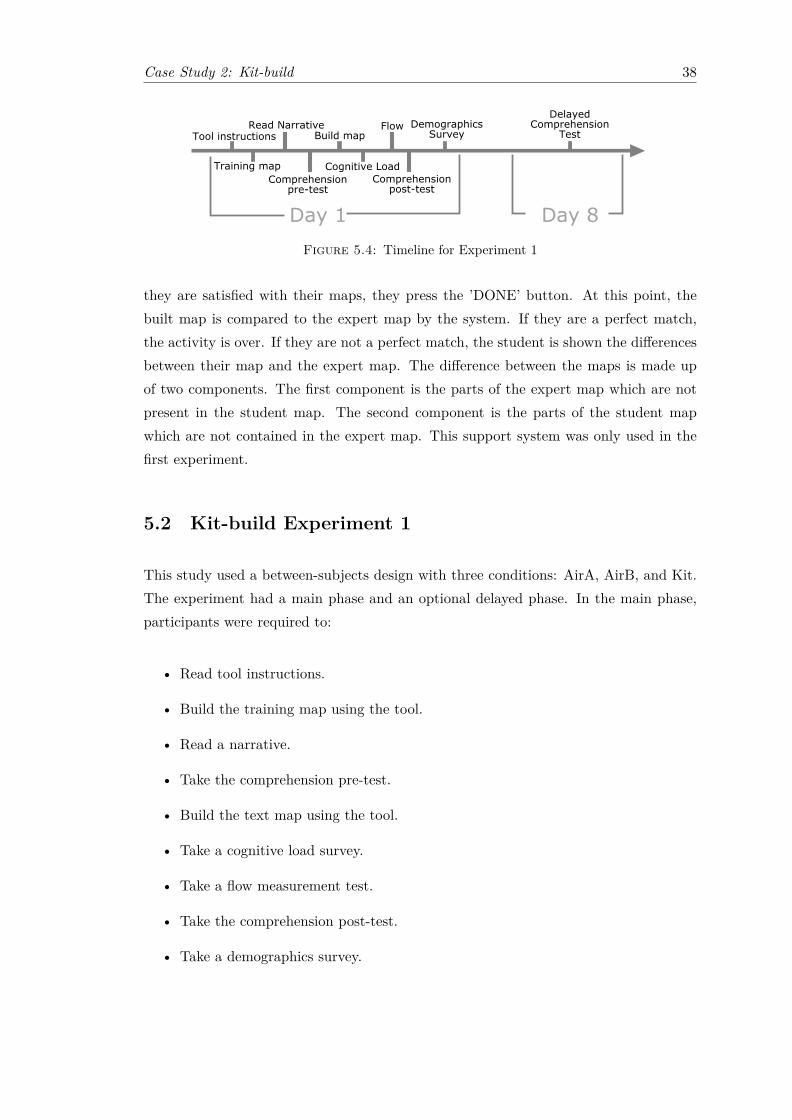
Case Study 2: Kit-build 38
Figure 5.4: Timeline for Experiment 1
they are satisfied with their maps, they press the ’DONE’ button. At this point, thebuilt map is compared to the expert map by the system. If they are a perfect match,the activity is over. If they are not a perfect match, the student is shown the differencesbetween their map and the expert map. The difference between the maps is made upof two components. The first component is the parts of the expert map which are notpresent in the student map. The second component is the parts of the student mapwhich are not contained in the expert map. This support system was only used in thefirst experiment.
5.2 Kit-build Experiment 1
This study used a between-subjects design with three conditions: AirA, AirB, and Kit.The experiment had a main phase and an optional delayed phase. In the main phase,participants were required to:
• Read tool instructions.
• Build the training map using the tool.
• Read a narrative.
• Take the comprehension pre-test.
• Build the text map using the tool.
• Take a cognitive load survey.
• Take a flow measurement test.
• Take the comprehension post-test.
• Take a demographics survey.

Case Study 2: Kit-build 39
The only difference between the conditions was the interface used. AirA used Airmapwith hideable links. AirB used Airmap without hideable links, and Kit used Kit-build.The interfaces did not have automatic feedback enabled and users could submit incorrectmaps. Participants who completed the main phase were invited to participate in thedelayed phase. The delayed phase consisted of the same comprehension post-test usedin the main phase, but with a delay of one week. A timeline for this experiment can beseen in Fig. 5.12.
5.2.1 Participants
Participants were recruited through Amazon Mechanical Turk (AMT) between Decem-ber of 2017 and January of 2018. Participants were required to be residents of the U.S.and were also required to have completed more than 5000 tasks on AMT with an ap-proval rate above 97%. This was done to ensure quality and avoid automated programsfrom participating in the experiment. Participants were also required to use a computerwhile participating since the experiment was not optimized for mobile devices. Partic-ipants were paid $2 upon completion of the activities. Participants who agreed to takethe delayed post-test received an additional $0.15.
5.2.2 Materials
A narrative text involving sled dog racing was used[72]. The comprehension pre-testand post-test both used the same questions. The questions used were the reading com-prehension exercises found in [72], but only the multiple choice questions were included.A 7-point Likert scale was used for measuring perceived difficulty and perceived effort.Previous research shows that subjective rating scales like these can be valid measure-ments of cognitive load[73]. We also collect time-stamped log data of software use. Thisdata is used to calculate time-on-task and the number of actions participants take tobuild the map. Both are indirect objective measurements of cognitive load[74] and havebeen used before[75, 76]. The flow-short-scale[77] was used for measuring flow. An ad-ditional question was included in the flow short scale to measure the perceived fun ofthe activity. The map participants were requested to build was based on the text andon the reading comprehension exercises.
5.2.3 Procedure
The experiment was delivered through a website. Participants completed informed con-sent and then proceeded to read instructions on the map building tool they would use.

Case Study 2: Kit-build 40
Afterward, they would build the training map to get used to the tool. The training mapconsisted of three concepts and three links. The content of this training map had norelation to the rest of the experiment. The tool instructions and the tool used to buildthe map was specific to each condition. After building the training map, participantsread the narrative and answered the pre-test. After the pre-test, participants had tobuild the map using the tool respective to their condition. Then, all participants had toanswer the cognitive load questions related to the map buildinfg task. This was followedby the flow measurement questions also related to the map building task. Participantsthen answered the post-test and completed the demographics survey, ending the mainphase of the experiment.
All activities in the main phase had a 5-minute limit, with the exception of building themap, which had a 10-minute limit.
One week later, participants were contacted by email to take part in the optional delayedphase. The delayed phase consisted of the same comprehension test taken in the pre-testand post-test. Participants did nothing else other than answer the comprehension test.
5.2.4 Results
66 participants attempted the experiment. 6 users were excluded because of a datacollection bug (N = 60). None of the demographics collected (gender, age and edu-cational attainment) were related to the assigned condition under a chi-square test ofindependence. 28 users participated in the optional delayed phase.
To analyze the cognitive load metrics, we used a non-parametric MANOVA with Wilks’slambda because not all metrics passed a test of normality. The procedure used is de-scribed in [78]. A multiple testing procedure using Wilk’s lambda was performed for thepost hoc comparisons. The procedure controls for type I error and it is also describedin [78]. Statistical tests were performed at α = 0.05 to address our research questions.
To address our first research question, whether changes in layout management burdenand visual load affect the cognitive load during concept map construction, we performeda non-parametric MANOVA on the four dependent variables related to cognitive load,including the number of actions, time-on-task, perceived difficulty and perceived effortwhen building the map. The predictor used was condition. Table 5.2 shows the samplesize, the mean and standard deviation for all four dependent variables tested among the3 conditions.
The non-parametric MANOVA revealed a significant main effect of condition on cog-nitive load, F(8, 108) = 2.942, p = 0.005. Post hoc comparisons between subsets of

Case Study 2: Kit-build 41
condition using a closed multiple testing procedure revealed that the cognitive load forthe Kit condition was significantly higher than the cognitive load for the AirB condition(p = 0.003). No other subsets of condition showed significant differences. Post hoccomparisons on subsets of the dependent variables revealed a significant difference forthe number of actions (p = 0.014) between conditions and for every subset that con-tained the number of actions. No other subsets of dependent variables were significantlydifferent.
To address our second research question, whether changes in layout management burdenand visual load affect flow during concept map construction, we performed a Kruskal-Wallis H test on flow scores as the dependent variable. The predictor used was condition.Mean and standard deviation for the flow scores can be seen in Table 5.3. The test didnot reveal a significant effect for condition on flow scores. All interfaces scored belowflow measures during learning in an obligatory statistics course (M = 4.60, SD = 1.16)and during playing a computer game on moderate difficulty(M = 4.68, SD = 1.18)[77].Although not statistically significant, both Airmap interfaces had similar flow scores andthey both outperformed flow scores reported during Kit-build use.
We could not address questions 3 and 4 because significant gains in reading comprehen-sion could not be seen in the data for all conditions. There were six questions and pre-testscores had an average higher than five questions answered correctly. It is believed thiswas caused by the low difficulty of the reading comprehension test.
Our main finding for experiment 1 is that changes in layout management burden andvisual load reduced the cognitive load during the map building activity. Although onlythe Airmap interface without hideable links showed statistically lower cognitive loadwhen compared to the Kit-build interface, the Airmap interface with hideable linksoutperformed the Kit-build interface in all four cognitive load metrics. Also, there wereno significant differences between the two Airmap interfaces. This means that whetherthe links are hideable or not should not have a large impact on cognitive load.
Given the low flow scores, we can assume that there is no reduction of the perceivedcognitive load because of the flow state. As such, objective metrics of cognitive andself-reported subjective metrics should follow the same trends, which does happen forperceived difficulty. Flow scores follow an opposite trend to perceived difficulty scores,which could be interpreted as the Kit-build task being perceived as too difficult by users,thus resulting in a lower flow score by deviating from the ideal flow conditions.

Case Study 2: Kit-build 42
Table 5.2: Cognitive Load metrics
Group N N. of actions Time-on-task Perceived difficulty Perceived effortM (SD) M (SD) M (SD) M (SD)
AirA 18 57.78 (20.50) 276.17 (132.14) 3.28 (1.13) 4.22 (1.22)AirB 23 54.91 (16.39) 328.22 (144.12) 3.13 (1.32) 4.78 (1.28)Kit 19 91.53 (44.98) 361.00 (163.26) 3.79 (1.51) 4.74 (1.05)
Table 5.3: Comprehension and flow measurements
Group Flow Pre-test Post-test Map scoreM (SD) M (SD) M (SD) M (SD)
AirA 4.19 (0.79) 0.92 (0.16) 0.91 (0.13) 9.44 (4.97)AirB 4.25 (0.80) 0.85 (0.19) 0.89 (0.16) 8.96 (3.46)Kit 3.62 (1.14) 0.89 (0.10) 0.89 (0.17) 6.42 (5.06)
5.3 Kit-build Experiment 2
This experiment is similar to the previous experiment, but with a higher focus on readingcomprehension gains. The main difference from the previous experiment is that usersreceived automated feedback while using the tool and are required to construct thecorrect map to proceed. Furthermore, there was an increase in difficulty in the text readand in the content of the pre-test and post-test. These changes made it easier to answerresearch questions three and four, which are the main concerns of this experiment.
Table 5.4: Collected metrics for all participants in Experiment 2
Group N Pre-test Post-test Normalized N. of actions Time-Change on-task
Air 26 0.60 (0.19) 0.78 (0.21) 0.47 (0.40) 146.52 (69.38) 771.00 (270.41)Kit 24 0.58 (0.22) 0.82 (0.11) 0.53 (0.30) 280.58 (268.52) 944.50 (259.82)
Table 5.5: Metrics for participants who completed the delayed test
Group N Pre-test Post-test Delayed test Delayed Normalized changeAir 20 0.59 (0.19) 0.78 (0.21) 0.59 (0.15) 0.03 (0.26)Kit 16 0.59 (0.22) 0.82 (0.10) 0.70 (0.17) 0.25 (0.37)
5.3.1 Design
This study used a between-subjects design with two conditions: Air and Kit. The exper-iment had a main phase and an optional delayed phase. In the main phase, participantswere required to:

Case Study 2: Kit-build 43
• Read tool instructions.
• Build the correct training map using the tool.
• Read a text.
• Take the comprehension pre-test.
• Build the correct text map using the tool.
• Take the comprehension post-test.
The only difference between the conditions was the interface used. Air used the Airmapinterface without hideable links and Kit used the Kit-build interface. The interfaceshad feedback enabled and required participants to redo their maps until they built thecorrect map. Participants who completed the main phase were invited to participate inthe delayed phase. The delayed phase consisted of the same comprehension post-testused in the main phase, but with a delay of two weeks.
5.3.2 Participants
Participants were recruited in the same way as described in subsection 5.2.1 of experi-ment 1, differing only in monetary compensation and recruitment period. Participantsof experiment 1 were not allowed to participate in experiment 2. The monetary differ-ences were due to longer experiment times and to increase the number of participantsof the delayed phase. Participants of this experiment were recruited during February of2018. They were paid $3.10 upon completion of the activities. Participants who agreedto take the delayed post-test received an additional $0.80.
5.3.3 Materials
The text used described various characteristics of the Komodo dragon. It is a modified,shorter version of a text found in Wikipedia1. The comprehension pre-test and post-testscontained the same questions. The questions consisted of ten multiple choice questionscreated to test the content of the text. The map participants were requested to buildwas based on the text and on the reading comprehension exercises.
1https://en.wikipedia.org/wiki/Komodo_dragon

Case Study 2: Kit-build 44
Ma
p b
uild
ing
Ma
p b
uild
ing
Ma
p b
uild
ing
Ma
p b
uild
ing
Ma
p b
uild
ing
Ma
p b
uild
ing
Tw
o W
ee
k D
ela
yTw
o W
ee
k D
ela
yTw
o W
ee
k D
ela
yTw
o W
ee
k D
ela
yTw
o W
ee
k D
ela
yTw
o W
ee
k D
ela
y
0.4
0.5
0.6
0.7
0.8
0.9
pre post delay
Test
Ave
rag
e S
co
res
condition
aaaa
Air
Kit
Figure 5.5: Pre-test, post-test and delayed-test score averages for participants whocompleted the delayed test
5.3.4 Procedure
The procedure was similar to the procedure of experiment 1, described in subsection5.2.3. This section will list the differences between the procedure of the two experiments.Neither flow tests nor cognitive load tests, present in experiment 1, were present inexperiment 2. Regarding the construction of the concept map, there was a change oftime limit from ten minutes in experiment 1 to twenty minutes in experiment 2. Also,unlike experiment 1, users were given automated feedback by the system and could onlyproceed to the next task after submitting the correct map. The delay between phaseswas increased from one week in experiment 1 to two weeks in experiment 2.
5.3.5 Results
50 participants attempted the experiment. Of these, 36 users participated in the optionaldelayed phase.
To compare gains in reading comprehension, we calculated the normalized change asdescribed in [79]. Pre-test, post-test and normalized change scores for all participantscan be seen in Table 5.4. To compare retention, we also calculated a normalized changemetric. However, we used the delayed test scores as the post-test instead. We callthis metric the delayed normalized change. Pre-test, post-test, delayed test and delayednormalized change scores can be seen in Table 5.5. The data in Table 5.5 is only relatedto the students who participated in the delayed test. Statistical tests were conducted atα = 0.05 to address research questions three and four.
To address our third research question, whether changes in layout management burdenand visual load during the concept map building activity affect immediate reading com-prehension gains, we analyze the data seen in Table 5.4. There is very little differencein pre-test scores, post-test scores, and normalized change. The same trends can be

Case Study 2: Kit-build 45
seen in pre-test scores and post-test scores seen in Table 5.5. We can conclude thatchanges in layout management burden and visual load do not have a large effect onreading comprehension gains. That being said, participants in the Air condition displaya higher variation in scores. Although this difference is small, it could be interpreted asthe Airmap interface having a larger sensitivity to differences between the users. In theKit condition, which requires users to manage their own layout, users are more likely toengage in the same way with the map, thus being less sensitive to user individualities.
To address our fourth research question, whether changes in layout management burdenand visual load during the concept map building activity affect the retention of read-ing comprehension gains, we performed a Mann-Whitney test with delayed normalizedchange as the dependent variable and condition as the predictor. The test revealed thatnormalized change for the Kit condition (Mdn = 0.27) was significantly higher thannormalized change for the Air condition (Mdn = 0), U = 94, p = 0.03. Looking at thescores on Table 5.5, both conditions answered six questions correctly on average duringthe pre-test. This goes up to around eight questions on average during the post-test, forboth conditions. Then, after two weeks, users in the Air condition went back to answer-ing six questions on average, while users in the Kit condition answer seven questions onaverage. This can be visualized in Fig. 5.5. Thus, even after two weeks, users from theKit condition have a greater performance than before building the map. It is importantto stress that although users from the Air condition have delayed post-test scores similarto the pre-test scores, the pre-test has been performed after reading a text. Since aftertwo weeks it is expected that they would forget about the content, delayed test scoreswould be lower than pre-test scores. As such, both conditions are believed to have hadgains in retention.
Moving beyond normalized change, Fig. 5.6 gives us better insight on how test scoresimproved after building the map for each condition. We have examples of users goingfrom answering only one question before building the map to answering seven questionsafterward. The score of only one user went down after building the map. Most of theusers answered between eight and ten questions in the post-test. Fig. 5.7 gives us insighton how users fared two weeks later when compared to their performance before buildingthe map. A lot of the users did not change in this comparison. Some users in the Kitcondition have improved their scores by four questions, while only one user of the Aircondition got an improvement of three questions. In the Air condition, we have a dropin performance of as much as four questions. For the Kit condition, performance onlydrops as much as two questions. Finally, Fig. 5.8 gives us insight on how users fared twoweeks later when compared to their scores after building the map. We have abnormalimprovements in both conditions. That is, after the two-week retention period, we haveusers who perform better in the test scores. It cannot be said if this is due to luck

Case Study 2: Kit-build 46
4
5
6
7
8
9
10
1 2 3 4 5 6 7 8 9 10
Pre
Po
st
1
2
3
4
density
group
Air
Kit
Figure 5.6: A scatter plot of pre-test and post-test scores
4
5
6
7
8
9
10
1 2 3 4 5 6 7 8 9 10
Pre
De
lay
1
2
3
density
group
Air
Kit
Figure 5.7: A scatter plot of pre-test and delayed test scores

Case Study 2: Kit-build 47
4
5
6
7
8
9
10
4 5 6 7 8 9 10
Post
De
lay
group
Air
Kit
2
3
4
5density
Figure 5.8: A scatter plot of post-test and delayed test scores
or if some participants ended up studying the subject by themselves between phases.Once again, users from the Air condition have bigger losses, going up to as much as afive-question difference. Users from the Kit condition, however, have at most a drop ofthree questions.
Although not a main concern of this experiment, time-on-task, and the number of actionsdifferences between Air and Kit conditions show the same trends as in experiment 1.This indicates that cognitive load is also being reduced in this experiment.
Our main findings for experiment 2 is that a reduction in layout management burdenand visual load did not affect immediate reading comprehension but did negatively affectretention of those gains. It is assumed that this occurs because users commit informationdeeper in memory while trying to organize the layout of the map. We can assume thatthe cognitive load associated with layout management and the display of informationhas a germane load component.
5.3.6 General Discussion
Experiment 1 showed that overall cognitive load related to building the map is reducedby using the Airmap interface. This can be associated with a reduction of cognitive load.This indicates that the proposed approach can reduce cognitive load. This suggests thatadding layout automation and spatial separation to educational software can provide

Case Study 2: Kit-build 48
benefits linked to reduced cognitive load, such as reducing stress and dissatisfaction[80,81].
Experiment 2 showed that there was little difference in reading comprehension gains.As such, we can assume that the portion of load reduced is not associated with compre-hending the information. Thus, as far as comprehension goes, Airmap shows superiorperformance when compared to Kit-build, since there is a reduction of cognitive loadwithout reducing comprehension.
This, however, did not hold true for retention. The Kit-build interface outperforms theAir interface after a two week period. As such, we have a trade-off between cognitiveload and retention. Thus, the cognitive load differences between the two applicationsare related to information retention. Past research has shown other cases of associationbetween cognitive load and retention[82]. Literature has also shown other cases wherecognitive load reduction diminishes learning effects in general[83]. While it is believedthis is mostly caused by the layout management burden factor, there is also the visualload reduction factor. Isolating the factors to see how they affect retention is a matterfor future research.
Results further inform teachers who use Kit-build in class, allowing them to choosebetween the Air interface and the traditional Kit-build interface, depending on thenecessity of content retention. The possibility to reduce time-on-task also makes iteasier to incorporate computer-based concept mapping on busy classes. Furthermore,developers of other closed concept map building tools can now make a more informeddecision about the worth of adding automated layouts and spatial separation to theirtools.
The results also suggest that learning applications, in general, could be made easier to usewithout sacrificing immediate comprehension by using the described approaches whenthey are applicable and when retention is not of concern. This reduces the mental effortused by learners, allowing them to focus their energies on other activities. It also suggeststhat a reversed approach can increase retention gains of learning activities. Mixing areasof the interface to eliminate spatial separation and forcing the user to manage the layoutwould be examples of reversed approaches. Activities in which retention play a strongrole, such as vocabulary learning[84] and science classes[85], could benefit from thesereversed approaches.
Results also have implications in the comparison between CMA and TMC. The trendsshown by the results are similar to those seen in comparisons between CMA and TMC.Kit-build, without automated feedback, performs similarly to traditional creation inreading comprehension but outperforms it in retention[33]. The experiments performed

Case Study 2: Kit-build 49
shed some light on why this happens. Differences in retention are not only because ofhaving to search for the appropriate links and nodes but also because users have tomanage the layout of those provided pieces. Having to keep information in the workingmemory while organizing the layout does little for improving comprehension but doeshelp in committing the comprehended information into long-term memory. That beingsaid, verifying how Airmap fares against traditional map building would give furtherinformation into the factors that affect retention in concept map building.
5.4 Kit-build Experiment 2 New and Previous KnowledgeAnalysis
5.4.1 Method
5.4.1.1 Data Analysis Methods
Each research question needs a quantifiable metric. The metrics can be modeled afteranswer transitions between a test done before the concept map is built (pre-test), afterthe concept map is built (post-test), and after a delayed period (delayed post-test).Table 5.6 shows how each question can be classified. Each classification is related to oneof the research questions.
”Review” is related to reviewed knowledge. ”New” is related to new knowledge. ”On-Delay” metrics are related to the two week retention period after building the map.Metrics which don’t have the word ”OnDelay” on them are related to the immediatemeasurements. Those immediate measurements are the pre-test and post-test performedminutes before and after building the map.
The questions are classified and then counted for each metric. This gives raw metricsfor each user. Based on the raw metrics, normalized metrics are then calculated. Thenormalized metrics take into account individual ceilings into the calculation of eachmetric and are more representative of each research question. The normalized metricsand their formulas can be seen in Table 5.7.
5.4.1.2 Results
Normalized values for Review, New, Retained Review, and Retained New were calculatedfor each participant using their answers for the pre-test, post-test and delayed post-test from the data set. Table 5.9 shows the number of participants of each condition,

Case Study 2: Kit-build 50
0.00
0.25
0.50
0.75
1.00
Review New Retained Review Retained New
Metrics
Norm
aliz
ed V
alu
es
group
Air
Kit
Figure 5.9: Boxplots of the normalized values for Air and Kit conditions. RetainedReview, which is related to retained reviewed knowledge, represents the biggest differ-
ence between the two conditions.
0
1
2
3
4
5
6
7
8
9
1 2 3 4 5 6 7 8 9 10
Review
Reta
ined R
evie
w
1.0
1.5
2.0
density
group
Air
Kit
Figure 5.10: A scatter plot of Review and Retained Review. Both metrics are relatedto reviewed knowledge. The farther away from the diagonal line, the more the userforgets. The Kit condition, represented by triangles, is able to retain more after the
two-week period when compared to the Air condition

Case Study 2: Kit-build 51
Table 5.6: Question classification table
Answer Correctness
Classification Pre-test Post-test Delayed Post-test
Review Correct Correct NANew Incorrect Correct NAReviewOnDelay Correct Correct CorrectNewOnDelay Incorrect Correct Correct
Table 5.7: Calculated user metrics and their formula. Pre refers to pre-test scores.Review, New, ReviewOnDelay, and NewOnDelay refer to the number of questions be-
longing to each classification for that particular user.
Metric Formula
Normalized Review ReviewPre
Normalized New New1−Pre
Normalized Review Retention ReviewOnDelayReview
Normalized New Retention NewOnDelayNew
Table 5.8: The format of the log data for test answers in the experiment
User ID Test Question Number Answer Correctness12345 Pre-test 2 4 True12345 Post-test 3 2 False
Table 5.9: Average and standard deviation for the four relevant normalized metrics.Review and Retained Review are related to reviewed knowledge. New and RetainedNew are related to new knowledge. Kit is the condition which takes influence from the
positioning task.
Group N Review New Retained Review Retained NewAir 19 0.92 (0.13) 0.66 (0.29) 0.60 (0.27) 0.57 (0.38)Kit 16 0.89 (0.12) 0.72 (0.21) 0.87 (0.17) 0.60 (0.34)
alongside the average and standard deviation of the relevant normalized metrics. Figure5.9 shows box plot comparisons of the two conditions.
To address how the positioning task affects immediate retained knowledge, we comparethe values of Normalized Review shown in the boxplots of Figure 5.9 and the averagevalues seen in Table 5.9. There is very little difference in Normalized Review betweenthe two interfaces, with users remembering around 90% of their pre-test answers in thepost-test.
To address how the positioning task affects immediate new knowledge, we comparethe values of Normalized New shown in the boxplots of Figure 5.9 and the average

Case Study 2: Kit-build 52
values seen in Table 5.9. There is very little difference in Normalized New between thetwo interfaces, with users from both interfaces correctly answering around 70% of thequestions in the post-test that they could not answer correctly in the pre-test.
To address how the positioning task affects delayed reviewed knowledge, we performeda Mann-Whitney test with Retained Review as the dependent variable and condition asthe predictor. The test revealed that Retained Review for the Kit condition (Mdn = 1)was significantly higher than Retained Review for the Air condition (Mdn = 0.62), U= 58, p = 0.002. Looking at Table 5.9, Airmap users remember around 60% of revisedinformation. In contrast, Kit-build users remember 87% of the revised information. Notonly that, but the standard deviation is lower for Kit-build, suggesting results are morestable. Both Air and Kit maintain similar transitions during Map building, but Airdrops steeply after the two-week delay, as far as reviewing is concerned. In contrast, Kitshows little loss in reviewed knowledge after the two-week delay.
Looking at the scatter plot in Figure 5.10, multiple Kit-build users forgot none of thetest answers related to reviewed information after two weeks. In the worst case scenario,Kit-build users would forget two answers, while Airmap users could forget up to fouranswers.
To address how the positioning task affects delayed new knowledge, we compare thevalues of Retained New in the boxplots of Figure 5.9 and the average values seen inTable 5.9. There is very little difference in Normalized Retained New between the twointerfaces. This suggests that the two interfaces do not differ in retention as an acqui-sition tool. Users of both interfaces remember around 60% of the acquired information.This value is similar to the Normalized Retained Review users have during Airmap use.This suggests that users process reviewed information and new information at aroundthe same level while using Airmap.
5.4.2 Discussion
Results show that there was little difference in immediate new knowledge, in the retentionof new knowledge, and in immediate reviewed knowledge. As such, we can assume thatthe differences between the interfaces are not associated with processing new knowledge.Thus, Airmap outperforms Kit-build when new knowledge is of concern since users canmake maps using less effort without decreasing immediate and delayed understanding ofnew knowledge. The reduction in effort, believed to also cause a reduction in cognitiveload, is desirable because it has been associated with various benefits, such as reducedstress and higher satisfaction[80, 81]. Results are in line with past research that stated

Case Study 2: Kit-build 53
the positioning task does not affect immediate learning gains[86], but it goes further toalso state that it does not affect the retention of new information.
This, however, did not hold true for delayed reviewed knowledge. Kit-build outperformsAirmap in retention of reviewed content after a two week period. As such, we have atrade-off between effort and reviewing retention. Cognitive load reduction leading to areduction in general retention has been shown in other research as well[82, 83], which is inline with the theory that Airmap has lower cognitive load than Kit-build[86]. Unlike pastresults, results suggest that this influence on retention is limited to reviewing activities.The reduction is believed to be mostly caused by the layout management burden, butthere is also the visual load reduction factor. Isolating these two factors to see how theyaffect reviewing retention is a matter for future studies.
Results also inform further educators who use closed concept map building tools. Pre-viously it was stated that Kit-build should be used whenever retention is of concern[86].However, current results suggest that Kit-build should be used as a tool for reviewing. Ifthe user does not have a good grasp of the content, Airmap is better suited since a goodportion of information will be new. Furthermore, developers of other closed conceptmap building tools now have more information when deciding whether or not to addautomatic layout management and spatial separation to their tools.
Past research has also pointed out that learning applications, in general, could be madeeasier to use by applying automatic layout management and spatial separation whenretention is not of concern[86]. The same work also pointed out that using a reversedapproach could benefit retention gains in learning activities. Adding the positioningtask to the activity would be the reversed approach. Current results go further, statingthat retention is only prejudiced during reviewing activities, so the amount of activ-ities that could benefit from removing the positioning task is higher than previouslythought. However, the reversed approach that was thought to benefit overall reten-tion, is suggested to only influence retention during reviewing. As such, only learningactivities which focus on reviewing knowledge should consider this reversed approach.Fields in which retention play a strong role, such as vocabulary learning[84] and scienceclasses[85], could benefit from review activities focused on these reversed approaches.

Case Study 2: Kit-build 54
5.5 Kit-build Experiment 2 Node Oriented Analysis
5.5.1 Coupling Nodes and Questions
In order to carry out the analyses in this study, it is necessary to couple portions ofthe map with external questions. While it would be simpler to couple concept mappropositions with propositions, since propositions represent meaningful information inthe concept maps, nodes were chosen instead. This is because, when discussing propo-sitions, it is only possible to discuss if the proposition is present or not. When usingnodes, it is possible to take into account if the nodes are used in correct propositions,incorrect propositions or in no propositions. This allows us to argue by using propositioninformation while also being able to take into account whether the nodes are not usedat all. Fig. 5.11 shows examples of the three possible proposition states.
One thing to note is that central nodes which are used in a wide variety of propositionsare not included in this analysis. This is because that would add a lot of noise into theanalysis. In the material used in this study, a concept map between Komodo dragonsis used. In this case, the node ”Komodo dragon” is related to every question, so it isomitted.
Table 5.10 has some examples of questions used in this study alongside the nodes theyare coupled with.
5.5.2 Method
Table 5.10 shows two examples of questions included in the test used. Table 5.11 showssome proposition examples from the map. Each proposition is composed of two conceptsconnected by a link.
5.5.3 Results
The dataset contains entries from 51 users, but only the data related to the 34 userswho completed the delayed post-test was used. Out of the 34 users, 18 are Airmap usersand 16 are Kit-build users.
612 entries generated by the pairing of nodes and questions were identified in the col-lected data. The amount of entries divided by proposition classification, interface anddelayed test answer can be seen in Table 5.12. The entries distribution can be moreeasily visualized in Fig. 5.13. Proposition non-existence shows the worse performance

Case Study 2: Kit-build 55
in delayed post-test answers. Surprisingly, proposition correctness and proposition ex-istence does not show much difference in delayed post-test performance. These matterswill be further investigated below as the research questions are addressed.
To address our first research question, whether learning performance related to the con-tent represented by closed concept map nodes can be predicted by whether the propo-sitions using the nodes are correct, we performed a Mann-Whitney test with questioncorrectness as the dependent variable and node proposition correctness as the predic-tor. The test revealed that question correctness for nodes that have correct propositions(Mdn = 1) was significantly higher than question correctness for nodes that did not havecorrect propositions (Mdn = 1), U = 17.81, p <0.001.
The delayed post-test correctness rate is 0.72 for nodes with correct propositions. Incontrast, the delayed post-test correctness rate for nodes with incorrect propositions is0.56. These ratios have been calculated by adding and dividing the appropriate valuesin Table 5.12. Given that the users are receiving automated feedback and that the dataused is from before the feedback, it makes sense for the difference to not be so high.
To address our second research question, whether learning performance related to thecontent represented by closed concept map nodes can be predicted by whether proposi-tions using the node exist, we performed a Mann-Whitney test with question correctnessas the dependent variable and node proposition existence as the predictor. The test re-vealed that question correctness for when propositions exist (Mdn = 1) was significantlyhigher than question correctness for when propositions do not exist (Mdn = 0), U =15.28, p <0.001.
Delayed post test correctness is 0.67 for nodes that are involved in any proposition. 0.47is the post test correctness for nodes that were not used in any proposition. Interestto note is comparing proposition existence with proposition correctness, there is notmuch gap between propositions existing (0.67 correctness) and propositions being correct(0.72 correctness). However, the gap is bigger between propositions not existing (0.47)and not having correct propositions (0.56). This means that not using the node onany propositions has a bigger impact than not making correct propositions. Whileproposition existence is a stronger predictor, it is rare for users to leave nodes unusedin Airmap. So correctness and existence can be used together.
While both research questions have been answered, the interface used and differencesbetween users was not taken into account in the analyses. For that reason, additionalexploratory analyses using the interface and the user as covariates were performed. Sincethe Mann-whitney test cannot take into account covariates, two logistic regressions wereperformed. The first one took into account proposition correctness using the node, the

Case Study 2: Kit-build 56
Table 5.10: Examples of questions in the tests and the nodes they are related to inthe concept map.
Question Choices Related Nodes3) Komodo’s large size has Island gigantism and Large Sizebeen attributed to: being an excelent predator
Being an excelent predator and Island Gigantismbeing a representative of (...)varanid lizardsextinct large varanid lizardsIsland gigantism andof extinct large varanid lizards
being a representativeBeing an excelent predator andtheir venomous biteIsland gigantism and being andtheir venomous bite
7) About their They mate in September Between May(Komodo Dragons) They mate in October and Augustreproduction They mate between September
and DecemberThey mate between Mayand AugustThey mate in December
interface used and the users. The second one took into account proposition existenceusing the node, the interface used and the users.
Information on the first regression can be seen in Table 5.13. Correct propositions usingthe node is a significant predictor. Interface is not a significant predictor. Some of theusers, mainly those who performed well, have been identified as significant predictors.This means that some users perform well regardless of proposition correctness.
Information on the second regression can be seen in Table 5.14. Proposition existenceusing the node is a significant predictor. Like the previous analysis, interface is not asignificant predictor but some of the users are identified as significant predictors.
The two analyses suggest that the effect of proposition correctness and propositionexistence remains even after controlling for the interface and the users.
Results show that analytics using closed concept maps can be used to understand howmuch students learn specific parts of the content. This goes beyond previous resultswhich focused only on the correlation between test scores and map scores[45].
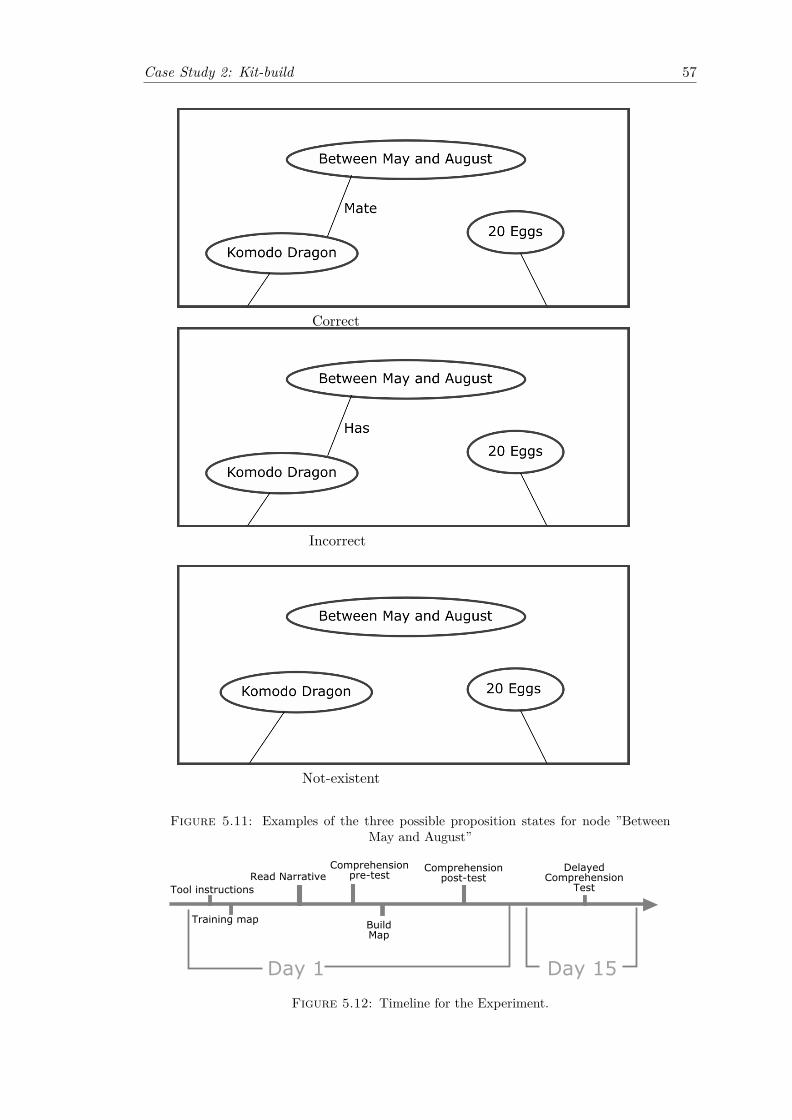
Case Study 2: Kit-build 57
Correct
Incorrect
Not-existent
Figure 5.11: Examples of the three possible proposition states for node ”BetweenMay and August”
Figure 5.12: Timeline for the Experiment.

Case Study 2: Kit-build 58
Table 5.11: E
Concept 1 Link Concept 2komodo dragon has large sizelarge size attributed to Island gigantismlarge size attributed to representative of extinct large varanid lizardskomodo dragon mates between May and August
Table 5.12: Amount of data entries for each node classification based on the propo-sitions that use the node. Entries are further divided based on the interface used andbased on whether or not they answered the corresponding question correctly on the
delayed post test.
Node Interface Test AmountIncorrect Airmap Incorrect 58
Correct 63Kit-build Incorrect 61
Correct 85Correct Airmap Incorrect 64
Correct 139Kit-build Incorrect 33
Correct 109Not exist Airmap Incorrect 17
Correct 11Kit-build Incorrect 32
Correct 32Exist Airmap Incorrect 105
Correct 191Kit-build Incorrect 62
Correct 162
0.00
0.25
0.50
0.75
1.00
Proposition Correct Proposition Incorrect
Proposition Correctness
Am
ount Delayed Answer
correct
incorrect
Figure 5.13: Bar graph showing the relationship between proposition correctness andthe answer to the related questions on the delayed post test. Proposition correctness is
associated with correct answers on the delayed test.

Case Study 2: Kit-build 59
Table 5.13: P values and odds ratio for the logistic regression related to propositioncorrectness using the nodes. HV signifies high values that were omitted, for one user
that had perfect scores.
OR 2.5 % 97.5 % pCorrectness 1.86 1.25 2.78 <0.001
Interface 1.62 0.42 6.38 0.49user2 0.70 0.18 2.65 0.60user3 1.02 0.26 3.87 0.98user4 1.15 0.29 4.70 0.84user5 1.15 0.29 4.70 0.84user7 0.88 0.23 3.34 0.86user9 3.60 0.82 19.77 0.11
user11 0.78 0.20 2.96 0.72user18 0.90 0.23 3.44 0.88user19 0.95 0.25 3.59 0.94user20 5.74 1.12 44.09 0.05user22 4.54 0.88 34.86 0.09user23 2.52 0.55 14.02 0.25user24 7.33 1.46 56.12 0.03user25 3.60 0.82 19.77 0.11user26 0.36 0.09 1.36 0.14user27 1.67 0.41 7.22 0.48user29 0.93 0.24 3.67 0.92user30 HV HV HV 0.98user31 0.85 0.22 3.26 0.81user32 0.54 0.13 2.08 0.38user34 2.03 0.50 8.78 0.33user37 1.45 0.38 5.70 0.58user39 0.64 0.16 2.43 0.52user40 0.76 0.20 2.94 0.69user41 1.40 0.34 6.06 0.64user42 2.07 0.53 8.47 0.30user43 4.39 0.99 24.25 0.06user44 0.72 0.18 2.75 0.64user45 5.25 1.17 29.21 0.04user47 3.53 0.84 16.74 0.96user48 1.04 0.27 3.94 0.49user49 1.61 0.42 6.50 0.56
Constant term 0.75 0.28 2.07 0.56

Case Study 2: Kit-build 60
Table 5.14: P values and odds ratio for the logistic regression related to propositionexistence using the nodes. HV signifies high values that were omitted, for one user that
had perfect scores.
OR 2.5 % 97.5 % pExistence 2.11 1.11 4.09 0.02Interface 1.26 0.33 4.85 0.74
user2 0.64 0.17 2.37 0.51user3 0.80 0.21 2.98 0.74user4 1.27 0.32 5.12 0.73user5 1.27 0.32 5.12 0.73user7 0.80 0.21 2.98 0.74user9 4.00 0.91 21.86 0.08user11 0.78 0.20 2.96 0.72user18 0.78 0.20 2.96 0.72user19 0.83 0.22 3.11 0.78user20 6.56 1.26 51.05 0.04user22 5.37 1.06 41.03 0.06user23 3.18 0.71 17.47 0.15user24 6.40 1.29 48.50 0.04user25 4.00 0.91 21.86 0.08user26 0.44 0.11 1.64 0.23user27 1.65 0.41 7.05 0.48user29 1.00 0.26 3.88 1.00user30 HV HV HV 0.98user31 1.32 0.32 5.48 0.70user32 0.54 0.13 2.13 0.39user34 2.59 0.60 11.83 0.21user37 1.26 0.33 4.85 0.74user39 0.99 0.23 4.20 0.99user40 0.98 0.25 3.81 0.98user41 1.65 0.41 7.05 0.48user42 1.60 0.42 6.41 0.50user43 4.00 0.91 21.86 0.08user44 1.10 0.26 4.52 0.90user45 4.65 1.05 25.78 0.05user47 2.80 0.68 13.03 0.80user48 1.18 0.31 4.54 0.42user49 1.75 0.45 7.07 0.36
Constant Term 0.59 0.19 1.87 0.36

Case Study 2: Kit-build 61
0.00
0.25
0.50
0.75
1.00
exist not exist
Proposition Existence
Am
ount Delayed Answer
correct
incorrect
Figure 5.14: Bar graph showing the relationship between proposition existence andthe answer to the related questions on the delayed post test. Proposition existence is
associated with correct answers on the delayed test.

Chapter 6
Conclusion
6.1 Monsakun
In this study, the design of an application for teaching the conceptual understandingof contextual problems for Kindergarten students was presented. Furthermore, the vi-ability of the application was verified through use in a Kindergarten classroom. Theinteraction of users with the application was successful in many respects. Studentsshowed good affective responses and satisfactory performance, outperforming the GTScalculated measures. The results suggest the following:
1. The application is successful in allowing for meaningful interaction with the TripletStructure Model without the use of text and arithmetic expressions;
2. Students interactions with the Triplet Structure Model improve while using theapplication, quickly clearing problems which had given them trouble in the past.
Their growth patterns and the distance to gaming the system patterns suggest that theinteractions of the students with the software are meaningful. This indicates that theTriplet Structure Model is effective for younger children too. The results strengthenthe software position as a tool to help kindergarten students to understand contextualproblems conceptually.
The design and viability verification of the application, alongside the data analysis sug-gesting meaningful use and growth inside the application are the main contributions ofthis study.
The interactions of the students get better as they clear problems. As such, improvementinside the application has been verified. The lack of evaluations from outside the system,
62

Conclusion 63
such as using a control group, pre-test, and post-test makes it hard to verify how wellthis transfer to other contexts. This is one issue to be tackled in future studies.
The case-by-case results suggest that students who struggled during some critical levelsare also engaging and improving their understanding, they just took longer than otherstudents to overcome hard challenges for the first time.
Looking at the average values, students perform well in the early levels. However, someof the students may be leaving Level 1 and Level 2 without a clear interpretation of thepictures. Adding user modeling and procedural question generation to the applicationis one approach to make sure that students are leaving the earlier levels with the desiredinterpretation of the pictures. Furthermore, increasing the number of easier problemsin Level 3 problems might make it easier for students to clear the harder levels.
The next step in this research is to allow students to create the story pieces themselves.The objective would be to make children think deeply about each quantity separately.
6.2 Kit-build
Software-based concept map assembling from provided pieces is an effective learningmethod. Yet, no cognitive load studies of this approach have been found in the literature,despite the benefits of cognitive load optimization. This study attempted to lower thecognitive load associated with the activity by developing an interface with automaticlayout management and spatial separation of elements. Results show that the developedinterface was successful in reducing cognitive load. Furthermore, no significant reductionof gains in immediate comprehension was found. However, there was a significant dropin performance after a two week retention period. Thus, having to search around for thepieces in a complex space and having to manage the layout during concept map creationhelp students commit the information deeper into memory.
One limitation of the present study is that there was no measure of gains in comprehen-sion and retention without the automatic feedback feature. Another limitation is thatthe two factors related to cognitive load, layout management and spatial separation,were not isolated.
In future work, new interfaces that isolate layout management and spatial separationwill be developed. The challenge of developing these interfaces lies in introducing theseelements without changing other aspects of the interface. Another matter for futurestudy is analyzing differences in learning gains without the use of feedback mechanisms.

Conclusion 64
Finally, whether or not the time saved by reducing the cognitive load could be bet-ter spent in other activities, such as having students make associations between thetext and the map, will also be investigated. This could provide further gains in bothcomprehension and retention.
6.3 Overall Conclusion
The open information structure approach has shown promising results in the design oflearning applications. However, the use of these applications in different contexts is aproblem that is not only limited to the open information structure. However, there isthe potential for applications built with the open information structure to be adapted tonew contexts without changing the information structure. This simplifies the redesigningprocess since the information structure can be reused. To the best of our knowledge, thishas not been studied before. This study examines two use cases where applications builtwith the open information structure approach have been redesigned while maintainingthe information structure. It uses these two use cases and multiple experiments toaddress the three research questions.
The first research question, ”Can applications built using the open information structureapproach be redesigned while keeping the information structure imtact?”, is answeredin both use cases. Both applications were redesigned and are usable while keeping theinformation structure intact.
The second research question, ”Do the redesigned applications fit their new contextappropriately?”, has also been answered in both case studies. In case of the first usecase, the redesigned Monsakun was successfully used by the Kindergarten students,which showed growing patterns and were not gaming the system. In the second usecase, Kit-build, the redesigned version of Airmap managed to reduce the overall effortrelated to building the map.
The third research question, ”How does the redesign process affect learning gains inthe new context?”, could not be answered in the first study case but was answered inthe second one. The reason why it could not be answered is because the Kindergartenstudents cannot use the original Monsakun, so it is not possible to compare the learninggains. In the case of Kit-build, the redesigned version was compared to the originalversion and immediate learning comprehension was not affected. However, since longterm results were affected, this shows that both versions of Kit-build are useful in theclassroom and should be used based on the context.

Conclusion 65
This study shows new advantages of the open information structure approach. It informsdesigners that they can keep the underlying information approach when redesigning theapplications. It gave an example of adapting an application from text to images. It alsogives information on which closed concept map tools are better used for each context.

Bibliography
[1] T. Hirashima and Y. Hayashi, “Design of meta-problem with open informationstructure approach,” 12 2018.
[2] T. Hirashima and Y. Hayashi, “Educational externalization of thinking task bykit-build method,” in International Conference on Human Interface and the Man-agement of Information, pp. 126–137, Springer, 2016.
[3] D. Pitt, “Mental representation,” 2000.
[4] S. Vosniadou, “Capturing and modeling the process of conceptual change,” Learningand instruction, vol. 4, no. 1, pp. 45–69, 1994.
[5] W. J. Clancey, Situated cognition: On human knowledge and computer representa-tions. Cambridge university press, 1997.
[6] T. Hirashima, S. Yamamoto, and Y. Hayashi, “Triplet structure model of arithmeti-cal word problems for learning by problem-posing,” in International Conference onHuman Interface and the Management of Information, pp. 42–50, Springer, 2014.
[7] A. A. Supianto, Y. Hayashi, and T. Hirashima, “An investigation of learner’s actionsin problem-posing activity of arithmetic word problems,” in Intelligent TutoringSystems: 13th International Conference, ITS 2016, Zagreb, Croatia, June 7-10,2016. Proceedings, vol. 9684, p. 478, Springer, 2016.
[8] S. Yamamoto, T. Kanbe, Y. Yoshida, K. Maeda, and T. Hirashima, “A case studyof learning by problem-posing in introductory phase of arithmetic word problems,”in Proceedings of the 20th International Conference on Computers in Education,pp. 25–32, 2012.
[9] S. Yamamoto, Y. Akao, M. Murotsu, T. Kanbe, Y. Yoshida, K. Maeda, Y. Hayashi,and T. Hirashima, “Interactive environment for learning by problem-posing of arith-metic word problems solved by one-step multiplication and division,” ICCE2014,pp. 89–94, 2014.
66

Bibliography 67
[10] A. Leff and J. T. Rayfield, “Web-application development using the model/view/-controller design pattern,” in Proceedings fifth ieee international enterprise dis-tributed object computing conference, pp. 118–127, IEEE, 2001.
[11] N. C. Jordan, “Early predictors of mathematics achievement and mathematicslearning difficulties,” Encyclopedia on Early Childhood Development, pp. 1–6, 2010.
[12] S. Griffin, “Building number sense with number worlds: A mathematics programfor young children,” Early childhood research quarterly, vol. 19, no. 1, pp. 173–180,2004.
[13] N. I. Dyson, N. C. Jordan, and J. Glutting, “A number sense intervention for low-income kindergartners at risk for mathematics difficulties,” Journal of LearningDisabilities, vol. 46, no. 2, pp. 166–181, 2013.
[14] P. Starkey, A. Klein, and A. Wakeley, “Enhancing young children’s mathematicalknowledge through a pre-kindergarten mathematics intervention,” Early ChildhoodResearch Quarterly, vol. 19, no. 1, pp. 99–120, 2004.
[15] A. J. Wilson, S. Dehaene, O. Dubois, and M. Fayol, “Effects of an adaptive gameintervention on accessing number sense in low-socioeconomic-status kindergartenchildren,” Mind, Brain, and Education, vol. 3, no. 4, pp. 224–234, 2009.
[16] D. H. Clements and J. Sarama, “Effects of a preschool mathematics curriculum:Summative research on the building blocks project,” Journal for Research in Math-ematics Education, pp. 136–163, 2007.
[17] S. Kim, “Computer-assisted mathematical interventions on word problems for ele-mentary students with underachievement in mathematics,” 2017.
[18] V. Freiman, E. Polotskaia, and A. Savard, “Using a computer-based learning taskto promote work on mathematical relationships in the context of word problems inearly grades,” ZDM, vol. 49, no. 6, pp. 835–849, 2017.
[19] M. Yerushalmy, “Slower algebra students meet faster tools: Solving algebra wordproblems with graphing software,” Journal for Research in Mathematics Education,pp. 356–387, 2006.
[20] K. R. Koedinger and J. R. Anderson, “Illustrating principled design: The earlyevolution of a cognitive tutor for algebra symbolization,” Interactive Learning En-vironments, vol. 5, no. 1, pp. 161–179, 1998.
[21] B. M. Hamadneh, H. A. Hamad, and M. M. Al-azzam, “The impact of applyingcomputer-based training strategy upon developing the skill of solving mathematical

Bibliography 68
word problem among students with learning disabilities,” International Research inEducation, vol. 4, no. 1, pp. 149–158, 2016.
[22] T.-H. Huang, Y.-C. Liu, and H.-C. Chang, “Learning achievement in solving word-based mathematical questions through a computer-assisted learning system.,” Ed-ucational Technology & Society, vol. 15, no. 1, pp. 248–259, 2012.
[23] J. Sweller, “Cognitive load theory, learning difficulty, and instructional design,”Learning and instruction, vol. 4, no. 4, pp. 295–312, 1994.
[24] J. Leppink, F. Paas, T. Van Gog, C. P. van Der Vleuten, and J. J. Van Merrienboer,“Effects of pairs of problems and examples on task performance and different typesof cognitive load,” Learning and Instruction, vol. 30, pp. 32–42, 2014.
[25] T. Grunwald and C. Corsbie-Massay, “Guidelines for cognitively efficient multi-media learning tools: educational strategies, cognitive load, and interface design,”Academic medicine, vol. 81, no. 3, pp. 213–223, 2006.
[26] X. P. Kotval and J. H. Goldberg, “Eye movements and interface component group-ing: An evaluation method,” in Proceedings of the Human Factors and ErgonomicsSociety Annual Meeting, vol. 42, pp. 486–490, SAGE Publications Sage CA: LosAngeles, CA, 1998.
[27] W. Schnotz, S. Fries, and H. Horz, “Motivational aspects of cognitive load theory,”Contemporary motivation research: From global to local perspectives, pp. 69–96,2009.
[28] G.-J. Hwang, L.-H. Yang, and S.-Y. Wang, “A concept map-embedded educationalcomputer game for improving students’ learning performance in natural sciencecourses,” Computers & Education, vol. 69, pp. 121–130, 2013.
[29] P. Kim and C. Olaciregui, “The effects of a concept map-based information displayin an electronic portfolio system on information processing and retention in a fifth-grade science class covering the earth’s atmosphere,” British Journal of EducationalTechnology, vol. 39, no. 4, pp. 700–714, 2008.
[30] M. Willerman and R. A. Mac Harg, “The concept map as an advance organizer,”Journal of research in science teaching, vol. 28, no. 8, pp. 705–711, 1991.
[31] E. Morfidi, A. Mikropoulos, and A. Rogdaki, “Using concept mapping to improvepoor readers’understanding of expository text,” Education and Information Tech-nologies, vol. 23, no. 1, pp. 271–286, 2018.

Bibliography 69
[32] M. Omar, “Improving reading comprehension by using computer-based conceptmaps: A case study of esp students at umm-alqura university,” British Journal ofEducation, vol. 3, no. 4, pp. 1–20, 2015.
[33] M. Alkhateeb, Y. Hayashi, T. Rajab, and T. Hirashima, “Comparison betweenkit-build and scratch-build concept mapping methods in supporting efl readingcomprehension,” The Journal of Information and Systems in Education, vol. 14,no. 1, pp. 13–27, 2015.
[34] P.-L. Liu, C.-J. Chen, and Y.-J. Chang, “Effects of a computer-assisted conceptmapping learning strategy on efl college students’english reading comprehension,”Computers & Education, vol. 54, no. 2, pp. 436–445, 2010.
[35] W. Reader and N. Hammond, “Computer-based tools to support learning fromhypertext: concept mapping tools and beyond,” in Computer Assisted Learning:Selected Contributions from the CAL’93 Symposium, pp. 99–106, Elsevier, 1994.
[36] L. Anderson-Inman and L. Zeitz, “Computer-based concept mapping: Active study-ing for active learners,” The computing teacher, vol. 21, no. 1, 1993.
[37] U. Park and R. A. Calvo, “Automatic concept map scoring framework using thesemantic web technologies,” in Advanced Learning Technologies, 2008. ICALT’08.Eighth IEEE International Conference on, pp. 238–240, IEEE, 2008.
[38] E. M. Taricani and R. B. Clariana, “A technique for automatically scoring open-ended concept maps,” Educational Technology Research and Development, vol. 54,no. 1, pp. 65–82, 2006.
[39] A. J. Cañas, L. Bunch, J. D. Novak, and P. Reiska, “Cmapanalysis: An extensibleconcept map analysis tool,” Journal for Educators, Teachers and Trainers, 2013.
[40] T. Hirashima, K. Yamasaki, H. Fukuda, and H. Funaoi, “Kit-build concept mapfor automatic diagnosis,” in International conference on artificial intelligence ineducation, pp. 466–468, Springer, 2011.
[41] T. Hirashima, K. Yamasaki, H. Fukuda, and H. Funaoi, “Framework of kit-buildconcept map for automatic diagnosis and its preliminary use,” Research and Practicein Technology Enhanced Learning, vol. 10, no. 1, p. 17, 2015.
[42] H. Herl, H. O’Neil Jr, G. Chung, and J. Schacter, “Reliability and validity of acomputer-based knowledge mapping system to measure content understanding,”Computers in Human Behavior, vol. 15, no. 3-4, pp. 315–333, 1999.
[43] C. Tao, Development of a Knowledge Assessment System Based on Concept Mapsand Differential Weighting Approaches. PhD thesis, Virginia Tech, 2015.

Bibliography 70
[44] P.-H. Wu, G.-J. Hwang, M. Milrad, H.-R. Ke, and Y.-M. Huang, “An innovativeconcept map approach for improving students’ learning performance with an instantfeedback mechanism,” British Journal of Educational Technology, vol. 43, no. 2,pp. 217–232, 2012.
[45] K. Yoshida, K. Sugihara, Y. Nino, M. Shida, and T. Hirashima, “Practical use ofkit-build concept map system for formative assessment of learners’comprehensionin a lecture,” Proc. of ICCE2013, pp. 892–901, 2013.
[46] W. Wunnasri, J. Pailai, Y. Hayashi, and T. Hirashima, “Validity of kit-build methodfor assessment of learner-build map by comparing with manual methods,” IEICETransactions on Information and Systems, vol. 101, no. 4, pp. 1141–1150, 2018.
[47] W. Wunnasri, J. Pailai, Y. Hayashi, and T. Hirashima, “Reliability investigation ofautomatic assessment of learner-build concept map with kit-build method by com-paring with manual methods,” in International Conference on Artificial Intelligencein Education, pp. 418–429, Springer, 2017.
[48] P. Reiska, K. Soika, and A. J. Cañas, “Using concept mapping to measure changesin interdisciplinary learning during high school,” Knowledge Management & E-Learning: An International Journal (KM&EL), vol. 10, no. 1, pp. 1–24, 2018.
[49] K. Sugihara, T. Osada, S. Nakata, H. Funaoi, and T. Hirashima, “Experimentalevaluation of kit-build concept map for science classes in an elementary school,”Proc. ICCE2012, pp. 17–24, 2012.
[50] J. Sabourin, J. P. Rowe, B. W. Mott, and J. C. Lester, “When off-task is on-task:The affective role of off-task behavior in narrative-centered learning environments,”in International Conference on Artificial Intelligence in Education, pp. 534–536,Springer, 2011.
[51] R. S. Baker, A. T. Corbett, and K. R. Koedinger, “Detecting student misuse ofintelligent tutoring systems,” in International conference on intelligent tutoringsystems, pp. 531–540, Springer, 2004.
[52] J. E. Beck, K.-m. Chang, J. Mostow, and A. Corbett, “Does help help? introducingthe bayesian evaluation and assessment methodology,” in International Conferenceon Intelligent Tutoring Systems, pp. 383–394, Springer, 2008.
[53] A. J. Bowers, “Analyzing the longitudinal k-12 grading histories of entire cohortsof students: Grades, data driven decision making, dropping out and hierarchicalcluster analysis,” Practical Assessment Research and Evaluation, vol. 15, no. 7,pp. 1–18, 2010.

Bibliography 71
[54] N. Ming and V. Ming, “Predicting student outcomes from unstructured data.,” inUMAP Workshops, 2012.
[55] R. S. Baker and P. S. Inventado, “Educational data mining and learning analytics,”in Learning analytics, pp. 61–75, Springer, 2014.
[56] D. Ben-Naim, M. Bain, and N. Marcus, “A user-driven and data-driven approachfor supporting teachers in reflection and adaptation of adaptive tutorials.,” Inter-national Working Group on Educational Data Mining, 2009.
[57] R. S. Baker, A. de Carvalho, J. Raspat, V. Aleven, A. T. Corbett, and K. R.Koedinger, “Educational software features that encourage and discourage“gamingthe system”,” in Proceedings of the 14th international conference on artificialintelligence in education, pp. 475–482, 2009.
[58] R. Martinez-Maldonado, A. Clayphan, K. Yacef, and J. Kay, “Mtfeedback: pro-viding notifications to enhance teacher awareness of small group work in the class-room,” IEEE Transactions on Learning Technologies, vol. 8, no. 2, pp. 187–200,2015.
[59] M. Schmidt and A. A. Tawfik, “Using analytics to transform a problem-based caselibrary: An educational design research approach,” Interdisciplinary Journal ofProblem-Based Learning, vol. 12, no. 1, p. 5, 2017.
[60] A. Grubišić, S. Stankov, B. Žitko, I. Šarić, S. Tomaš, E. Brajković, T. Volarić,D. Vasić, and A. Dodaj, “Knowledge tracking variables in intelligent tutoring sys-tems,” in Proceedings of the 9th International Conference on Computer SupportedEducation, CSEDU, vol. 1, pp. 513–518, 2017.
[61] Y.-S. Lin, Y.-C. Chang, K.-H. Liew, and C.-P. Chu, “Effects of concept map extrac-tion and a test-based diagnostic environment on learning achievement and learners’perceptions,” British Journal of Educational Technology, vol. 47, no. 4, pp. 649–664,2016.
[62] K. Leelawong and G. Biswas, “Designing learning by teaching agents: The betty’sbrain system,” International Journal of Artificial Intelligence in Education, vol. 18,no. 3, pp. 181–208, 2008.
[63] M. Emara, M. Tscholl, Y. Dong, and G. Biswas, “Analyzing students’collaborativeregulation behaviors in a classroom-integrated open ended learning environment,”in Making a Difference: Prioritizing Equity and Access in CSCL, 12th InternationalConference on Computer Supported Collaborative Learning (CSCL), Philadelphia,PA: International Society of the Learning Sciences., 2017.

Bibliography 72
[64] H. Jeong, A. Gupta, R. Roscoe, J. Wagster, G. Biswas, and D. Schwartz, “Usinghidden markov models to characterize student behaviors in learning-by-teachingenvironments,” in International conference on intelligent tutoring systems, pp. 614–625, Springer, 2008.
[65] Y. Dong and G. Biswas, “An extended learner modeling method to assess students’learning behaviors.,” in EDM, 2017.
[66] G. P. Jain, V. P. Gurupur, J. L. Schroeder, and E. D. Faulkenberry, “Artificialintelligence-based student learning evaluation: a concept map-based approach foranalyzing a student’s understanding of a topic,” IEEE Transactions on LearningTechnologies, vol. 7, no. 3, pp. 267–279, 2014.
[67] V. P. Gurupur, G. P. Jain, and R. Rudraraju, “Evaluating student learning usingconcept maps and markov chains,” Expert Systems with Applications, vol. 42, no. 7,pp. 3306–3314, 2015.
[68] C. Larman and V. R. Basili, “Iterative and incremental developments. a brief his-tory,” Computer, vol. 36, no. 6, pp. 47–56, 2003.
[69] R. Baker, J. Walonoski, N. Heffernan, I. Roll, A. Corbett, and K. Koedinger, “Whystudents engage in” gaming the system” behavior in interactive learning environ-ments,” Journal of Interactive Learning Research, vol. 19, no. 2, p. 185, 2008.
[70] T. M. Fruchterman and E. M. Reingold, “Graph drawing by force-directed place-ment,” Software: Practice and experience, vol. 21, no. 11, pp. 1129–1164, 1991.
[71] W. G. La, “juhgiyo/epforcedirectedgraph.cs,” Mar 2017.
[72] W. Hann, “Julie’s race,” Jan 2001.
[73] F. G. Paas and J. J. Van Merriënboer, “Instructional control of cognitive load in thetraining of complex cognitive tasks,” Educational psychology review, vol. 6, no. 4,pp. 351–371, 1994.
[74] R. Brunken, J. L. Plass, and D. Leutner, “Direct measurement of cognitive load inmultimedia learning,” Educational psychologist, vol. 38, no. 1, pp. 53–61, 2003.
[75] R. Brünken and D. Leutner, “Aufmerksamkeitsverteilung oder aufmerksamkeits-fokussierung? empirische ergebnisse zur „split-attention-hypothese “beim lernenmit multimedia,” Unterrichtswissenschaft, vol. 29, no. 4, pp. 357–366, 2001.
[76] H. Astleitner and D. Leutner, “Applying standard network analysis to hypermediasystems: Implications for learning,” Journal of Educational Computing Research,vol. 14, no. 3, pp. 285–303, 1996.

Bibliography 73
[77] S. Engeser and F. Rheinberg, “Flow, performance and moderators of challenge-skillbalance,” Motivation and Emotion, vol. 32, no. 3, pp. 158–172, 2008.
[78] A. R. Ellis, W. W. Burchett, S. W. Harrar, and A. C. Bathke, “Nonparametricinference for multivariate data: the r package npmv,” J. Stat. Softw, vol. 76, no. 4,pp. 1–18, 2017.
[79] J. D. Marx and K. Cummings, “Normalized change,” American Journal of Physics,vol. 75, no. 1, pp. 87–91, 2007.
[80] S. Zhang, L. Zhao, Y. Lu, and J. Yang, “Get tired of socializing as social animal? anempirical explanation on discontinuous usage behavior in social network services.,”in PACIS, p. 125, 2015.
[81] A. Ward and T. Mann, “Don’t mind if i do: Disinhibited eating under cognitiveload.,” Journal of personality and social psychology, vol. 78, no. 4, p. 753, 2000.
[82] F. Kirschner, F. Paas, and P. A. Kirschner, “Individual and group-based learningfrom complex cognitive tasks: Effects on retention and transfer efficiency,” Com-puters in Human Behavior, vol. 25, no. 2, pp. 306–314, 2009.
[83] W. Schnotz and T. Rasch, “Enabling, facilitating, and inhibiting effects of anima-tions in multimedia learning: Why reduction of cognitive load can have negativeresults on learning,” Educational Technology Research and Development, vol. 53,no. 3, p. 47, 2005.
[84] K. S. Folse, “The effect of type of written exercise on l2 vocabulary retention,”TESOL quarterly, vol. 40, no. 2, pp. 273–293, 2006.
[85] D. H. O’day, “The value of animations in biology teaching: a study of long-termmemory retention,” CBE-Life Sciences Education, vol. 6, no. 3, pp. 217–223, 2007.
[86] P. G. F. Furtado, T. Hirashima, and Y. Hayashi, “Reducing cognitive load duringclosed concept map construction and consequences on reading comprehension andretention,” IEEE Transactions on Learning Technologies, 2018.