The First Pilot Project of the Consortium for Top Down Proteomics: A Status Report
11
1130 Proteomics 2014, 14, 1130–1140 DOI 10.1002/pmic.201300438 REPORT The first pilot project of the consortium for top-down proteomics: A status report Xibei Dang 1,2 , Jenna Scotcher 1∗ , Si Wu 3 , Rosalie K. Chu 3 , Nikola Toli´ c 3 , Ioanna Ntai 4 , Paul M. Thomas 4 , Ryan T. Fellers 4 , Bryan P. Early 4 , Yupeng Zheng 4 , Kenneth R. Durbin 4 , Richard D. LeDuc 5 , Jeremy J. Wolff 6 , Christopher J. Thompson 6 , Jingxi Pan 7 , Jun Han 7 , Jared B. Shaw 8 , Joseph P. Salisbury 9 , Michael Easterling 6 , Christoph H. Borchers 7 , Jennifer S. Brodbelt 8 , Jeffery N. Agar 9 , Ljiljana Pa ˇ sa-Toli´ c 3 , Neil L. Kelleher 4 and Nicolas L. Young 1 1 Ion Cyclotron Resonance Program, National High Magnetic Field Laboratory, Florida State University, Tallahassee, FL, USA 2 Department of Chemistry and Biochemistry, Florida State University, Tallahassee, FL, USA 3 Environmental Molecular Sciences Laboratory, Pacific Northwest National Laboratory, Richland, WA, USA 4 Departments of Chemistry and Molecular Biosciences and the Proteomics Center of Excellence, Northwestern University, Evanston, IL, USA 5 NIH/NCRR Mass Spectrometry Resource, Washington University in St. Louis, St. Louis, MO, USA 6 Bruker Daltonics, Billerica, MA, USA 7 UVic-Genome BC Proteomics Centre, Department of Biochemistry and Microbiology, University of Victoria, Victoria, BC, Canada 8 Department of Chemistry, University of Texas, Austin, TX, USA 9 Departments of Chemistry and Pharm. Sci., Barnett Institute, Northeastern University, Boston, MA, USA Received: October 1, 2013 Revised: February 25, 2014 Accepted: March 13, 2014 Pilot Project #1—the identification and characterization of human histone H4 proteoforms by top-down MS—is the first project launched by the Consortium for Top-Down Proteomics (CTDP) to refine and validate top-down MS. Within the initial results from seven participating laboratories, all reported the probability-based identification of human histone H4 (UniProt accession P62805) with expectation values ranging from 10 −13 to 10 −105 . Regarding character- ization, a total of 74 proteoforms were reported, with 21 done so unambiguously; one new PTM, K79ac, was identified. Inter-laboratory comparison reveals aspects of the results that are consistent, such as the localization of individual PTMs and binary combinations, while other aspects are more variable, such as the accurate characterization of low-abundance proteoforms harboring >2 PTMs. An open-access tool and discussion of proteoform scoring are included, along with a description of general challenges that lie ahead including improved proteoform separations prior to mass spectrometric analysis, better instrumentation performance, and software development. Keywords: Human histone H4 / PTM analysis / Technology / Top-down proteomics Additional supporting information may be found in the online version of this article at the publisher’s web-site Correspondence: Dr. Nicolas Young, Ion Cyclotron Resonance Program, National High Magnetic Field Laboratory, Florida State University, 1800 E. Paul Dirac Drive, Tallahassee, FL 32310, USA E-mail: [email protected] Fax: 850-644-1366 Abbreviations: CTDP, Consortium for Top-Down Proteomics; ECD, electron capture dissociation; ETD, electron transfer dissoci- ation; FT-ICR, Fourier transform-ion cyclotron resonance; FTMS, Fourier transform MS; PUF, ProSight Upload Format; QCAD, quadrupole selected collisional activation; UVPD, ultraviolet pho- todissociation ∗ Current Address: Cardiovascular Division, King’s College Lon- don, The Rayne Institute, St. Thomas’ Hospital, London, SE1 7EH, UK C 2014 WILEY-VCH Verlag GmbH & Co. KGaA, Weinheim www.proteomics-journal.com
-
Upload
northwestern -
Category
Documents
-
view
1 -
download
0
Transcript of The First Pilot Project of the Consortium for Top Down Proteomics: A Status Report

1130 Proteomics 2014, 14, 1130–1140DOI 10.1002/pmic.201300438
REPORT
The first pilot project of the consortium for top-down
proteomics: A status report
Xibei Dang1,2, Jenna Scotcher1∗, Si Wu3, Rosalie K. Chu3, Nikola Tolic3, Ioanna Ntai4,Paul M. Thomas4, Ryan T. Fellers4, Bryan P. Early4, Yupeng Zheng4, Kenneth R. Durbin4,Richard D. LeDuc5, Jeremy J. Wolff6, Christopher J. Thompson6, Jingxi Pan7, Jun Han7,Jared B. Shaw8, Joseph P. Salisbury9, Michael Easterling6, Christoph H. Borchers7,Jennifer S. Brodbelt8, Jeffery N. Agar9, Ljiljana Pasa-Tolic3, Neil L. Kelleher4
and Nicolas L. Young1
1 Ion Cyclotron Resonance Program, National High Magnetic Field Laboratory, Florida State University,Tallahassee, FL, USA
2 Department of Chemistry and Biochemistry, Florida State University, Tallahassee, FL, USA3 Environmental Molecular Sciences Laboratory, Pacific Northwest National Laboratory, Richland, WA, USA4 Departments of Chemistry and Molecular Biosciences and the Proteomics Center of Excellence, Northwestern
University, Evanston, IL, USA5 NIH/NCRR Mass Spectrometry Resource, Washington University in St. Louis, St. Louis, MO, USA6 Bruker Daltonics, Billerica, MA, USA7 UVic-Genome BC Proteomics Centre, Department of Biochemistry and Microbiology, University of Victoria,
Victoria, BC, Canada8 Department of Chemistry, University of Texas, Austin, TX, USA9 Departments of Chemistry and Pharm. Sci., Barnett Institute, Northeastern University, Boston, MA, USA
Received: October 1, 2013Revised: February 25, 2014
Accepted: March 13, 2014
Pilot Project #1—the identification and characterization of human histone H4 proteoformsby top-down MS—is the first project launched by the Consortium for Top-Down Proteomics(CTDP) to refine and validate top-down MS. Within the initial results from seven participatinglaboratories, all reported the probability-based identification of human histone H4 (UniProtaccession P62805) with expectation values ranging from 10−13 to 10−105. Regarding character-ization, a total of 74 proteoforms were reported, with 21 done so unambiguously; one newPTM, K79ac, was identified. Inter-laboratory comparison reveals aspects of the results that areconsistent, such as the localization of individual PTMs and binary combinations, while otheraspects are more variable, such as the accurate characterization of low-abundance proteoformsharboring >2 PTMs. An open-access tool and discussion of proteoform scoring are included,along with a description of general challenges that lie ahead including improved proteoformseparations prior to mass spectrometric analysis, better instrumentation performance, andsoftware development.
Keywords:
Human histone H4 / PTM analysis / Technology / Top-down proteomics
� Additional supporting information may be found in the online version of this article atthe publisher’s web-site
Correspondence: Dr. Nicolas Young, Ion Cyclotron ResonanceProgram, National High Magnetic Field Laboratory, Florida StateUniversity, 1800 E. Paul Dirac Drive, Tallahassee, FL 32310, USAE-mail: [email protected]: 850-644-1366
Abbreviations: CTDP, Consortium for Top-Down Proteomics;ECD, electron capture dissociation; ETD, electron transfer dissoci-
ation; FT-ICR, Fourier transform-ion cyclotron resonance; FTMS,Fourier transform MS; PUF, ProSight Upload Format; QCAD,quadrupole selected collisional activation; UVPD, ultraviolet pho-todissociation∗Current Address: Cardiovascular Division, King’s College Lon-don, The Rayne Institute, St. Thomas’ Hospital, London, SE1 7EH,UK
C© 2014 WILEY-VCH Verlag GmbH & Co. KGaA, Weinheim www.proteomics-journal.com
Proteomics 2014, 14, 1130–1140 1131
1 Introduction
Here, we report preliminary results of the first pilot projectof the Consortium for Top-down Proteomics. The Consor-tium for Top Down Proteomics (CTDP) was founded in 2012with the aim of promoting innovative research, collaboration,education, and accelerating the comprehensive analysis ofintact proteins (http://www.topdownproteomics.org). To val-idate top-down MS as a viable and effective tool for definingthe proteome and increasing awareness of top-down tech-niques in the wider proteomics community, CTDP launchedPilot Project #1. This first pilot project focuses on the identifi-cation and characterization of human histone H4 by top-downMS [1–3].
The aim of Pilot Project #1 is to establish the level to whichmultiple laboratories can identify and localize PTMs and ul-timately define the same proteoforms in a complex mixture.This is regardless of the top-down techniques employed. Aproteoform is a recently introduced term to fully describe allsources of heterogeneity possible originating from a singlegene [4]. Importantly for this work, this includes the combi-nations of PTMs that may arise from multiple sites of variablePTM. Each specific combination of PTMs is a separate pro-teoform. For example, five variable sites of phosphorylationmay generate as many as 25 or 32 proteoforms. Human hi-stone H4, which contains 102 amino acids, was chosen asthe target because of its high abundance; easy access; highprofile involvement, and significance in epigenetic regulationand maintenance; and more importantly, its heavily modifiednature. Histone H4 usually contains 1–6 modifications on asingle molecule. Therefore, it is challenging to identify andlocalize its PTMs and even more challenging to simultane-ously determine all PTM localizations to fully characterize aproteoform [5–8].
Human histone H4 samples from HeLa S3 cells were pu-rified, pooled into a single homogeneous sample, aliquoted,and then distributed equally to multiple laboratories. Eachlaboratory performed top-down MS and data analysis inde-pendently to identify histone H4 and characterize all prote-oforms present. Each laboratory, with its unique combina-tion of ion source, fragmentation method, mass analyzer,and data analysis system, reported their identified proteo-forms, with or without ambiguity in PTM localization tothe CTDP. PTM localization and proteoform characterizationinformation was reported by a total of seven laboratories andanalyzed for interlaboratory comparison.
2 Materials and methods
2.1 Histone H4 preparation
HeLa S3 suspension cells were maintained in Joklik’s mod-ified MEM media and harvested after reaching 107 cells/mLdensity. Cell nuclei were isolated by standard nuclei isolation
with nuclei isolation buffer (15 mM Tris HCl, 60 mM KCl,15 mM NaCl, 5 mm MgCl2, 1 mM CaCl2, 250 mM su-crose with 0.3% NP-40. There are also 1 mM dithiothreitol,10 nM microcystin, 0.5 mM 4-(2-aminoethyl) benzenesul-fonyl fluoride, and 10 mM sodium butyrate added as in-hibitors.) Histones were extracted from the isolated nucleithrough standard acid extraction by 0.2 M H2SO4 on a ro-tator at 4�C for 2 h. Insoluble material was removed aftercentrifugation at 3400 × g and histone was precipitated fromthe supernatant with 20% trichloroacetic acid (final, w/v) onice for 45 min. Histone extracts was air-dried after acetonewash [9].
Histone extracts were further purified and separated byRP-HPLC using Thermo Ultimate 3000 system (ThermoFisher Scientific, San Jose, CA, USA) on a Vydac C18 col-umn (218TP54, 250 × 4.6mm, Grace, Deerfield, IL, USA).The gradient was a linear 30% B to 60% B gradient with0.3% B/min increase at 0.8 mL/min flow rate (Buffer A =5% ACN:water with 0.2% TFA; Buffer B = 95% ACN:waterwith 0.188% TFA). Histone H4 eluted at �44% B, collected byan autocollector and dried under vacuum. The H4 fractionswere then suspended in water, combined and aliquoted intoequal portions. Each aliquot contained �25 �g of histone H4extracted from �5 × 10⁷ cells.
2.2 Online LC separation
Two laboratories performed online LC as described below.
(1) Agilent 1200 nanoflow pumps (Agilent Technologies), 2-position Valco valves (Valco Instruments Co., Houston,TX, USA), and a PAL autosampler (Leap Technologies,Carrboro, NC, USA) were assembled into custom HPLCsystem allowing for fully automated histone analysis us-ing in-house packed WAX-HILIC column (PolyCAT A,75 �m id X 100 cm, 5 um particles, 1000 A pore size,PolyLC, Columbia, MD, USA). Mobile phases consistedof 70% ACN aqueous solution with 1.0% formic acid (A)and 70% ACN with 12% formic acid (B). The aliquotedhuman histone H4 sample was resuspended in waterto a final concentration of 0.2 �g/�L. Te microliters ofthe diluted sample was first loaded onto an SPE column(150 �m id × 5 cm, 5 um particles, 1000 A pore size)for 10 min using buffer A, and the following LC gradientwith a flow rate of 300 nL/min was applied for proteo-form separation: 0–1 min, 0–10% B; 1–10 min, 10–35%B; 10–200 min, 35–90% B; 200–207 min, 90–100% B;207–240 min, 100% B; 242 min, 100% A. The elutedproteins were detected on-line using high-resolutionFT-MS (Fourier transform MS) as described later.
(2) Reversed-phase LC was performed using an Eksigenttwo-dimensional LCHPLC, a self-packed 12 cm, 150 �mid column with 5 �m C18 beads (unpacked from a largerTarga column). Buffer A consisted of 0.1% formic acidv/v in HPLC grade water and buffer B consisted of 0.1%
C© 2014 WILEY-VCH Verlag GmbH & Co. KGaA, Weinheim www.proteomics-journal.com
1132 X. Dang et al. Proteomics 2014, 14, 1130–1140
formic acid v/v in 100% HPLC grade ACN v/v/. Sampleswere manually injected and eluted at 2.5 �L/min usinga 32 min gradient: 5% B for 6 min, 5–40% B for 8 min,40–100% B for 2 min, 100% B for 5 min, 100–2% B for1 min, and 2% B for 10 min.
2.3 MS
No guidance or specifications were given to the individuallaboratories as to how to perform MS other than that top-down proteoform characterization is the goal. Below are thetop-down MS methods performed by seven laboratories inrandom order:
(1) Data acquisition was performed using the LTQ OrbitrapVelos (Thermo Fisher Scientific) with nominal resolvingpower of 60,000 (m/z = 400). Precursor ion mass spectrawere collected for 500 to 2000 m/z (with automatic gaincontrol (AGC) set to 1E6), followed by data-dependentETD (electron transfer dissociation) MS/MS (isolationwindow 3 Th, reagent ion AGC 2E5, 15 ms reaction time,MSn AGC 5E5) of the top five most abundant ions. Thenumber of micro scans for both MS and MSn was two.Dynamic exclusion was implemented with the exclusionduration of 200 s and an exclusion list size of 500. MS/MSwas only performed on species with charge states greaterthan four.
(2) Dried histone fraction was acquired from CDTP and usedwithout cleanup or separation. The histone fraction wasdissolved in H2O to create a stock with a concentra-tion of approximately 8 pmol/�L. Prior to infusion byESI, the histone sample was diluted to approximately200 fmol/�L in 50:50:0.1 H2O:ACN:formic acid (Sigma,St. Louis, MO, USA) and infused with ESI at 2 �L/min.All MS experiments were performed on a Bruker 12 TsolariX XR FTMS. The histone sample was first analyzedin MS mode to determine potential targets for MS/MS.For ECD, ETD, and quadrupole selected collisional activa-tion (QCAD) experiments, precursor ions were isolatedin the external quadrupole and stored in the adjacentcollision cell. For QCAD, ions were dissociated insidethe external collision cell adjacent to the quadrupole. ForECD, q-isolated precursor ions were transferred to theICR cell and irradiated with 0.8 eV electrons for <50 ms.For ETD, q-isolated precursor ions were reacted with theETD reagent for 60 ms in the collision cell. For ETD andECD, 300 scans were averaged for each mass spectrum.ESI experiments were externally calibrated with NaTFAclusters.
(3) The histone sample was resuspended in MeOH:water:formic acid (50:49:1) at concentration of 0.1 ug/uLand analyzed by direct infusion without any prior separa-tion or manipulation. Data were obtained on an OrbitrapElite (Thermo Fisher Scientific) by static electrospray. The
optimal spray was obtained with 2 kV applied to a NewObjective glass tip with 3AP coating. For the precursormeasurement, a SIM scan (range of 653.5–678.5 m/z)was used with 10 microscans and an AGC target of 1 ×10⁵. Fragmentation was performed in a data-dependentfashion (top 3) with ETD and an AGC target of 1 × 10⁶.The isolation width was 4 m/z and the ETD activationtime was 15 ms. Dynamic exclusion was enabled witha repeat count of 2, exclusion duration of 600 s. EachMS2 spectrum was obtained with 50 microscans. Precur-sor scans were analyzed with a resolution of 240 000 (atm/z 400) and MS/MS scans were performed with 120 000resolution.
(4) All top-down ECD data were recorded on a 12 T Apex-Qe hybrid Fourier transform-ion cyclotron resonance(FT-ICR) mass spectrometer (Bruker Daltonics, Billerica,MA, USA) equipped with a nano-ESI source, a quadru-ple mass filter, and a hexapole collision cell. The ESIsource was operated in positive ion mode at a capil-lary voltage of 3500 V with a spray shield voltage of3200 V. ECD was employed as the gas-phase fragmen-tation method. The ECD parameters are set as follows:electron pulse length 18 ms, electron beam bias 1.1 V,grid potential 12 V, heater current 1.2 A. All ECD datawere acquired from front end quadrupole-isolated [M +14H]14+ ions. The FWHM of the transmitted isotope dis-tribution window corresponded to 1–2 m/z units. Masscalibration was performed with ECD fragments of bovineubiquitin.
(5) Samples were introduced via a nanospray ion source(CaptiveSpray) with a dual ion funnel (solariX) 12.0 teslahybrid quadrupole FT-ICR, FT-MS mass spectrometer(Bruker Daltonics). Important instrument operation pa-rameters include dry gas flow rate 4.0 L/min., neb gasflow rate 1.0 bar, capillary voltage 1555.0 V, source declus-tering potential = 34 V, source accumulation time =0.001 s, ion accumulation time = 0.1 s, TOF = 0.001 ms,and sidekick extraction voltages = −1.5 V.
(6) Twenty-five micrograms histone H4 sample was resus-pended in 100 �L water and further dilute ten times in50% water: ACN with 1% formic acid. All spectra were col-lected in custom-built 9.4T FT-ICR mass spectrometer.Histone was introduced into mass spectrometer througha positive nano-electrospray source at 0.4 �L/min under2100 V voltage. Intact proteins were first filtered througha quadrupole with 5 m/z window and furthered isolated to1 m/z window by stored waveform inverse Fourier trans-form. Electron capture dissociation was performed for50 mS with 12 V electron grid potential. Each spectrumwas an average of 500–1500 scans.
(7) Protein solutions were prepared at 10 �M in 49.5:49.5:1v/v/v water: ACN: formic acid, and were analyzed bydirect infusion at a flow rate of 3 �L/min into aThermo Scientific Orbitrap Elite mass spectrometer (Bre-men, Germany). The Orbitrap mass spectrometer was
C© 2014 WILEY-VCH Verlag GmbH & Co. KGaA, Weinheim www.proteomics-journal.com
Proteomics 2014, 14, 1130–1140 1133
modified for photodissociation by addition of a CoherentExcistar ArF excimer laser, and all ultraviolet photodis-sociation (UVPD) experiments were undertaken in theHCD cell (3). Spectra were acquired using a mass rangeof 200–2000 m/z and resolving power of 240 000 at m/z400. The AGC target for MS2 was set to one million, andan isolation width of 25 m/z was used. For UVPD ex-periments, precursor ions were transferred to HCD cellwith a normalized collision energy of 1% (no collisionalinduced dissociation occurs at this setting), and spectrawere acquired using one laser pulse at 2 mJ/pulse at 193nm. The HCD collision gas pressure was reduced to apressure measured as a delta of 0.1E-10 Torr in the UHVportion of the vacuum chamber containing the Orbitrapanalyzer (5 mTorr collision gas pressure). Two hundredscans were averaged per spectrum.
2.4 Data analysis
No guidance or specifications were given to the individuallaboratories as to how to analyze MS/MS data. Below are thedata analysis methods of the seven laboratories in randomorder.
(1) Tandem mass spectra were searched against a custom-built H4_HUMAN database using ProSightPC V2.0software (Thermo Fisher Scientific). This databaseconsisted of about 2.5 million of H4 proteoforms calcu-lated based on the information from Uniprot. All spectrawere first deconvoluted using Xtract mode embedded inProSightPC then searched in absolute mode (precursormass tolerance was set at 3 Da, fragment mass tolerancewas set at 20 ppm, and delta mass option was enabled).Initial H4 proteoform identifications were filtered by aminimal of ten matched fragment ions. Filtered spectrawere then evaluated using in-house developed functionsin a semimanual process [10].To obtain list of other proteins present in sample, we usedMSAlign+ (http://bix.ucsd.edu/projects/msalign/) soft-ware on human database derived from UniProt FASTAdownload.
(2) For each dissociation method, monoisotopic m/z andcharge state were determined using the SNAP II peakpicking algorithm in Bruker Daltonics DataAnalysis.Singly charged peaks were exported to Bruker Dalton-ics BioTools. Using BioTools, the singly charged productions were matched against known histone H4 sequencethat contained no modifications. First, using the massdifference between the product ions, BioTools calculateslong strings of amino acids called sequence tags. Second,these sequence tags are compared against the known His-tone H4 sequence to determine possible matches. Third,the mass difference of the matched sequence tag ver-sus the known Histone H4 sequence was calculated andused to determine possible modifications. Finally, the
Histone H4 sequence was modified with the possiblemodification(s) and matched to the experimental data.“Correct” Histone modifications were manually deter-mined by a combination of mass accuracy and sequencecoverage. Matched product ion mass accuracies were <2ppm for ETD and QCAD experiments and <3 ppm forECD experiments.
(3) .RAW files were processed with the cRAWler algorithminside ProSightPC 3.0. Averaged scans were assignedprecursor and fragment masses by cRAWler via the Xtractalgorithm. cRAWLer grouped one precursor mass to theobserved fragment masses from each summed unit tocreate individual ProSightPC experiments, which wereconcatenated into an XML file in ProSight Upload Format(PUF). PUF files were then searched by ProSightPC 3.0against a database created for human H4 with all possiblecombinatorial modifications. The results were manuallyexamined to determine the ambiguous assignments fromunambiguous ones for the localization of modificationsbased on the coverage of fragment ions and nature ofmodifications (e.g. acetylation only occurs at lysine).
(4) Bruker Compass Dataanalysis (version 4.0) was used togenerate peak lists and identify fragment ions. Protein-Prospector was used for database searching using thesequence of human histone H4. Intact ion tolerance is10 ppm, and fragment ion tolerance is 5 ppm. Manualvalidation was conducted for all of the identified isoforms.
(5) Intact protein masses were reconstructed using Maxi-mum Entropy Deconvolution from DataAnalysis (BrukerDaltonics, version 3.4) and spectra were assignedmanually.
(6) Data analysis was performed using a custom ProSightPC workflow. First, the ProSight absolute mass searchalgorithm was modified to match the nine canonical iontypes for UVPD [3, 11]. A shotgun annotated database ofHistone H4 and H2A was then created to search against.Neutral masses were inferred from the averaged MS2
spectrum acquired above using the Xtract algorithm fromThermo Fisher Scientific with a S/N cut-off of 3. Theseneutral masses were used to create a PUF input file thatwas sent to the modified algorithm for processing. Searchresults were manually validated.
(7) Data analysis was performed using custom in-house soft-ware (currently in development) in conjunction withmanual interpretation and validation. Briefly, a basis setof every potential H4 proteoform and the resulting iso-topic distributions of all ions were enumerated in silico.For each MS2 spectrum all basis sets (proteoforms) weretested by querying with 3 ppm accuracy for all of thetheoretically most intense peaks of every isotopic cluster,filtering for those with appropriate isotopic distributions.The sum of the intensities was maximized to identifythe most likely candidate, explaining the largest portionof the data. Further manual validation was performed toconfirm correct peak assignments and reasonable overallinterpretation of the data.
C© 2014 WILEY-VCH Verlag GmbH & Co. KGaA, Weinheim www.proteomics-journal.com
1134 X. Dang et al. Proteomics 2014, 14, 1130–1140
3 Results and discussion
3.1 Analysis of the preliminary results: Protein
identification
All seven laboratories participating reported probability-basedidentification of human histone H4 (UniProt accessionP62805) with a median E-value of 10−37. Individual scoresranged from 10−13 to 10−105 and some of the laboratories alsoidentified minor contaminants of histone H2A.Z, H2A2C,H2A3, H2A2A etc. with a E-value range from 10−12 to 10−45.Laboratories were not instructed whether to report on pro-teins other than histone H4 in this pilot project.
3.2 PTMs and proteoforms
There were 13 PTMs observed across all laboratories at 11sites. On a purely mathematical basis these PTMs generateas many as 4096 proteoforms; however, it is reasonably estab-lished that not all of these are likely present due to biologicalspecificity and certainly not in equal abundance. In this work,there were a total of 74 proteoforms identified by the sevenlaboratories, 21 of which are without ambiguity. This num-ber of proteoforms is remarkably similar to previous middledown analyses of H4 [6, 7]. Among all unambiguously as-signed proteoforms, three of them—H4N�-acK16acK20ac,H4N�-acK20me2K31ac, H4N�-acK20me2K79ac—are novel(with assigned spectra in Supporting Information). One newPTM (K79ac) is identified. This PTM is located after aminoacid 23 and therefore would not have been identified by themiddle-down approaches previously used to extensively char-acterize histone H4 proteoforms [6, 7]. The middle down ef-forts used AspN protease and purified the 1–23 AA peptidebefore analysis and thus such deep PTMs were not observedeither isolated or within a proteoform.
The CTDP encouraged investigators to report proteoformswith ambiguity rather than force the localization with insuf-ficient evidence. With high resolving power MS, ambiguityarises from PTM localization rather than degree of modifica-tion. In Pilot Project #1, 53 ambiguous proteoforms were re-ported. Ambiguity mostly results from insufficient sequencecoverage and low S/N in the MS2 spectra but most ambiguousproteoforms still contain unambiguous PTM localization in-formation for some PTMs. For example, one H4 proteoformwas identified with four acetylations and two methylations byintact mass. The MS2 spectrum localized two acetylations onthe N-terminus and at K5 (lysine 5), two methylations on K20,and two acetylations between 31 and 59 AA. There are threelocations possible for the two unassigned acetylations, K31,K44, and K59. With insufficient sequence coverage, properlocalization of these two acetylations was not possible andresulted in one ambiguous proteoform. However, there arethree unambiguously localized PTMs in this ambiguous pro-teoform: N�-ac, K5ac, and K20me2. Only such unambigu-ously localized PTMs from ambiguous proteoforms, as well
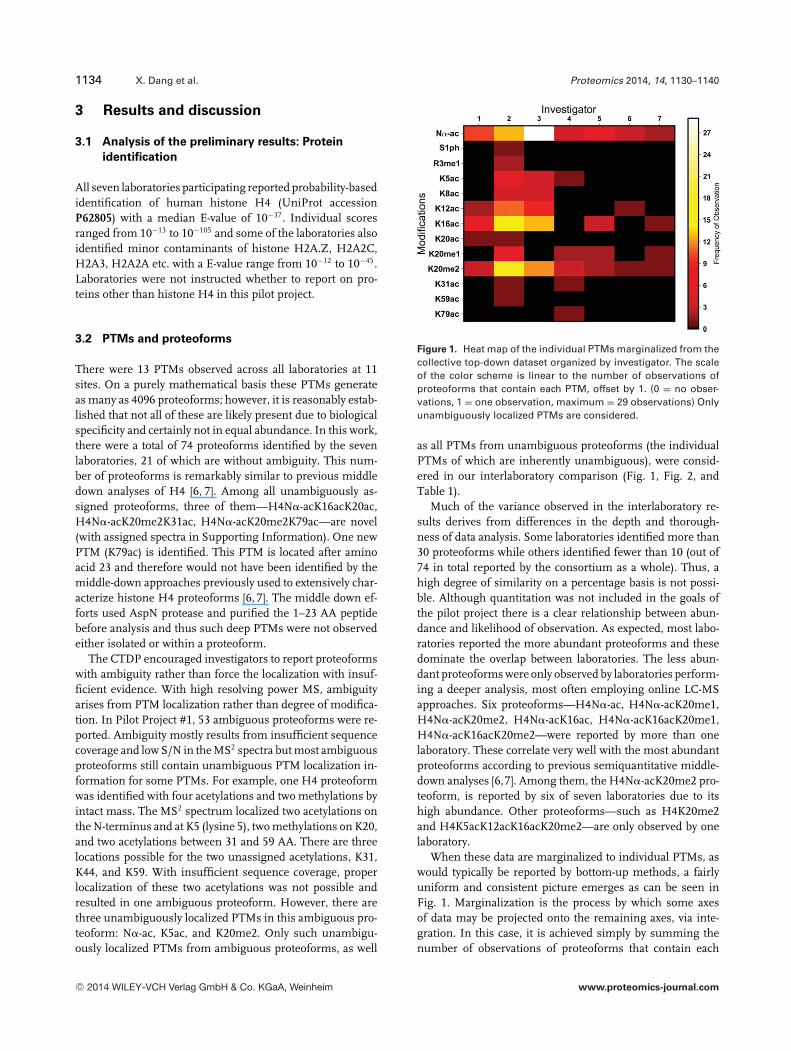
Figure 1. Heat map of the individual PTMs marginalized from thecollective top-down dataset organized by investigator. The scaleof the color scheme is linear to the number of observations ofproteoforms that contain each PTM, offset by 1. (0 = no obser-vations, 1 = one observation, maximum = 29 observations) Onlyunambiguously localized PTMs are considered.
as all PTMs from unambiguous proteoforms (the individualPTMs of which are inherently unambiguous), were consid-ered in our interlaboratory comparison (Fig. 1, Fig. 2, andTable 1).
Much of the variance observed in the interlaboratory re-sults derives from differences in the depth and thorough-ness of data analysis. Some laboratories identified more than30 proteoforms while others identified fewer than 10 (out of74 in total reported by the consortium as a whole). Thus, ahigh degree of similarity on a percentage basis is not possi-ble. Although quantitation was not included in the goals ofthe pilot project there is a clear relationship between abun-dance and likelihood of observation. As expected, most labo-ratories reported the more abundant proteoforms and thesedominate the overlap between laboratories. The less abun-dant proteoforms were only observed by laboratories perform-ing a deeper analysis, most often employing online LC-MSapproaches. Six proteoforms—H4N�-ac, H4N�-acK20me1,H4N�-acK20me2, H4N�-acK16ac, H4N�-acK16acK20me1,H4N�-acK16acK20me2—were reported by more than onelaboratory. These correlate very well with the most abundantproteoforms according to previous semiquantitative middle-down analyses [6,7]. Among them, the H4N�-acK20me2 pro-teoform, is reported by six of seven laboratories due to itshigh abundance. Other proteoforms—such as H4K20me2and H4K5acK12acK16acK20me2—are only observed by onelaboratory.
When these data are marginalized to individual PTMs, aswould typically be reported by bottom-up methods, a fairlyuniform and consistent picture emerges as can be seen inFig. 1. Marginalization is the process by which some axesof data may be projected onto the remaining axes, via inte-gration. In this case, it is achieved simply by summing thenumber of observations of proteoforms that contain each
C© 2014 WILEY-VCH Verlag GmbH & Co. KGaA, Weinheim www.proteomics-journal.com
Proteomics 2014, 14, 1130–1140 1135
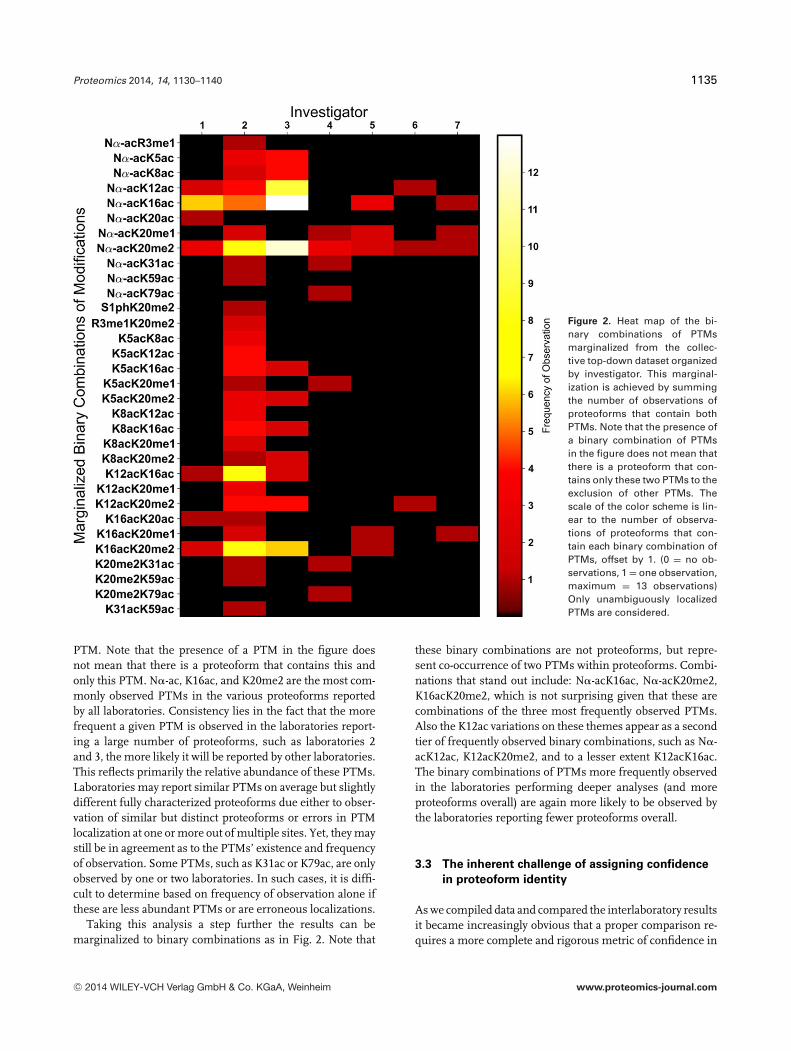
Figure 2. Heat map of the bi-nary combinations of PTMsmarginalized from the collec-tive top-down dataset organizedby investigator. This marginal-ization is achieved by summingthe number of observations ofproteoforms that contain bothPTMs. Note that the presence ofa binary combination of PTMsin the figure does not mean thatthere is a proteoform that con-tains only these two PTMs to theexclusion of other PTMs. Thescale of the color scheme is lin-ear to the number of observa-tions of proteoforms that con-tain each binary combination ofPTMs, offset by 1. (0 = no ob-servations, 1 = one observation,maximum = 13 observations)Only unambiguously localizedPTMs are considered.
PTM. Note that the presence of a PTM in the figure doesnot mean that there is a proteoform that contains this andonly this PTM. N�-ac, K16ac, and K20me2 are the most com-monly observed PTMs in the various proteoforms reportedby all laboratories. Consistency lies in the fact that the morefrequent a given PTM is observed in the laboratories report-ing a large number of proteoforms, such as laboratories 2and 3, the more likely it will be reported by other laboratories.This reflects primarily the relative abundance of these PTMs.Laboratories may report similar PTMs on average but slightlydifferent fully characterized proteoforms due either to obser-vation of similar but distinct proteoforms or errors in PTMlocalization at one or more out of multiple sites. Yet, they maystill be in agreement as to the PTMs’ existence and frequencyof observation. Some PTMs, such as K31ac or K79ac, are onlyobserved by one or two laboratories. In such cases, it is diffi-cult to determine based on frequency of observation alone ifthese are less abundant PTMs or are erroneous localizations.
Taking this analysis a step further the results can bemarginalized to binary combinations as in Fig. 2. Note that
these binary combinations are not proteoforms, but repre-sent co-occurrence of two PTMs within proteoforms. Combi-nations that stand out include: N�-acK16ac, N�-acK20me2,K16acK20me2, which is not surprising given that these arecombinations of the three most frequently observed PTMs.Also the K12ac variations on these themes appear as a secondtier of frequently observed binary combinations, such as N�-acK12ac, K12acK20me2, and to a lesser extent K12acK16ac.The binary combinations of PTMs more frequently observedin the laboratories performing deeper analyses (and moreproteoforms overall) are again more likely to be observed bythe laboratories reporting fewer proteoforms overall.
3.3 The inherent challenge of assigning confidence
in proteoform identity
As we compiled data and compared the interlaboratory resultsit became increasingly obvious that a proper comparison re-quires a more complete and rigorous metric of confidence in
C© 2014 WILEY-VCH Verlag GmbH & Co. KGaA, Weinheim www.proteomics-journal.com

1136 X. Dang et al. Proteomics 2014, 14, 1130–1140
Table 1. Complete table of proteoforms reported, including ambiguous proteoforms and PTM localizations
# m.e. a.me a.ac a.ph Unambiguous PTMs N[�] S1 R3 K5 K8 K12 K16 K20 K31 K59 K79
1 2 0 0 0 K20me24 3 0 0 0 N�-ac1 4 0 0 0 K5acK20me13 4 0 0 0 N�-acK20me11 4 1 0 0 N�-ac1 4 1 0 0 N�-ac1 4 0 1 0 K20me11 4 0 1 0 K20me16 5 0 0 0 N�-acK20me21 5 0 0 0 K5acK20me21 6 0 0 0 N�-acR3meK20me21 6 0 0 0 N�-acK12ac2 6 0 0 0 N�-acK16ac1 6 0 1 0 N�-ac1 6 0 1 0 N�-ac1 6 0 1 0 R3meR20me21 6 0 2 0 (none)2 7 0 0 0 N�-acK16acK20me11 7 1 0 0 N�-acK12ac1 7 1 0 0 N�-acK16ac1 7 1 0 0 N�-acK16ac1 7 0 1 0 K12acK20me11 8 0 0 0 N�-acK12acK20me24 8 0 0 0 N�-acK16acK20me21 8 0 0 0 N�-acK20me2K31ac1 8 0 0 0 N�-acK20me2K79ac1 8 0 1 0 N�-acK20me21 8 0 1 0 K12acK20me21 8 0 1 0 K16acK20me21 8 0 1 0 K16acK20me21 9 0 0 0 N�-acK5acK12ac1 9 0 0 0 N�-acK12acK16ac1 9 0 0 0 N�-acK16acK20ac1 9 1 0 0 N�-acK16acK20me21 9 0 1 0 N�-acK12ac1 9 0 1 0 N�-acK16ac1 9 0 1 0 N�-acK16ac1 9 0 2 0 N�-ac1 9 0 2 0 K16ac1 9 0 3 0 (none)1 10 1 0 0 N�-acK5acK16ac1 10 1 0 0 N�-acK8acK16ac1 10 1 0 0 N�-acK12acK16ac1 10.7 0 1 0 S1phK20me21 10.7 2 0 1 N�-ac1 11 0 0 0 K5acK8acK16acK20me21 11 0 0 0 K5acK12acK16acK20me21 11 0 1 0 N�-acK8acK20me21 11 0 1 0 N�-acK12acK20me21 11 0 1 0 N�-acK12acK20me21 11 0 1 0 N�-acK16acK20me21 11 0 1 0 N�-acK16acK20me21 11 2 1 0 K12acK16ac1 11 0 2 0 N�-acK20me21 11.7 0 0 1 N�-acK5ac1 11.7 0 0 1 N�-acK8ac1 11.7 0 0 1 N�-acK12ac1 12 1 0 0 N�-acK20me2K31acK59ac1 12 0 2 0 N�-acK16ac1 12 0 2 0 N�-acK12ac1 12 0 2 0 K12acK16ac1 13 0 1 0 K5acK8acK16acK20me11 14 0 1 0 N�-acK5acK16acK20me21 14 0 1 0 N�-acK8acK16acK20me21 14 0 1 0 N�-acK12acK16acK20me21 14 0 1 0 N�-acK12acK16acK20me21 14 0 2 0 N�-acK5acK20me21 14 0 2 0 N�-acK12acK20me21 14 0 2 0 N�-acK16acK20me21 14 0 2 0 K12acK16acK20me21 15 0 0 0 N�-acK5acK8acK12acK16ac1 15 0 3 0 K16acK20ac1 16 0 0 0 N�-acK5acK8acK12acK16acK20me11 17 2 5 0 (none)
Light gray: acetylation, dark gray: 1–3 methylation, stripes: phosphorylation. Abbreviations: # = number of labortories that identified thesame proteoform; m.e. = methyl equivalence, the total number of methylations required to achieve the modified mass, regardless of theactual PTMs present (e.g. 1 ac = 3 me); a.me = ambiguously assigned methylation; a.ac = ambiguously assigned acetylation; a.ph =ambiguously assigned phosphorylation; N�-ac = N-terminal acetylation.
C© 2014 WILEY-VCH Verlag GmbH & Co. KGaA, Weinheim www.proteomics-journal.com

Proteomics 2014, 14, 1130–1140 1137
identity of the proteoforms. Such statistical models are nonex-istent to underdeveloped and definitely not well establishedor widely accepted. Recent efforts in the analysis of top-downand related middle-down data while successful in identify-ing proteoforms within a spectrum or LC-MS run [12–14]have only made at most initial attempts at addressing the is-sue of robust confidence scoring across different analyses orlaboratories.
The statistics of confidence in top-down data are affectedby issues beyond S/N and sequence coverage. A typical Top-Down MS experiment is demonstrated in Fig. 3A. The de-gree of modification can be readily identified by intact mass,often expressed in the form of methyl equivalents (m.e.).Proteoforms with the same m.e. are often co-isolated dur-ing MS/MS. The fragment ions assigned in MS2 providesinformation on PTM localization and proteoform characteri-zation. In some cases where a single species is present withinan MS1 peak isolated for fragmentation, the sources of errorare more analogous to the peptide identification problem thatmost MS2 algorithms and confidence scores were originallydesigned for. That is increased S/N results in increased se-quence coverage and decreased unassigned peaks. The majordifference is simply the substantially increased complexity,peak density, and an increased probability of interferences.This simple case (Case i, Fig. 3B), where proteoform charac-terization is the singular goal is widely familiar to the broadproteomics community. The reality of many Top-Down anal-yses is that there are frequently many complicating and con-
founding factors at play that need to be treated properly inorder to understand the confidence that might be placed ona given proteoform. This has become clear to the top-downcommunity; however, these same issues are more frequentin bottom-up analyses than has been traditionally recognized.Thus, there is wider potential impact in the proper scoringof proteoforms that takes into account the other sources oferror more apparent in top-down data.
One of the cases we frequently observe in the consortiumdataset is that some, but not all of the PTMs present arelocalized. This is demonstrated in Case ii, Fig. 3B. Thereis insufficient sequence coverage between G7 and K12. Thesecond acetylation therefore cannot be localized. It may be onK12, K16, or a mixture of K12 and K16. This results in what werefer to as an ambiguous proteoform. The confidence in theprotein identification is not necessarily strongly affected bythis partial characterization and is at least semi-independentof PTM localization per se. Some PTMs, the K5 acetylation inthis case, are clearly confidently assigned in these ambiguousproteoforms. Yet, we do not have an established statisticalmetric or nomenclature to define a well localized PTM on anincompletely characterized peptide/protein.
The most demonstrative case of the challenge of defin-ing a proper statistical framework for scoring proteoformcharacterization is the case where multiple proteoforms arepresent. In Case iii in Fig. 3B, we present a mixed spectrum of2 proteoforms, H4K5acK8ac and H4K8acK16ac. Such mixedspectra are quite common in top down proteomics and more
Figure 3. (A) Scheme of top-down MS experiment. (i) The broadband mass spectrum of the intact protein. (ii) Segment of the 13+ chargestate of the intact protein with methyl equivalents (m.e.) labeled. The proteoform with six m.e. is selected as the precursor for the MS2
experiment. (iii) Tandem mass spectrum for precursor chosen in (ii) to localize PTMs and identify proteoforms. (B) Ambiguity of Top-DownMS. (i) With only a single proteoform existing and enough (100%) sequence coverage, there is no ambiguity for the proteoform H4K5acK8ac.(ii) With a single proteoform existing but not enough sequence coverage, there is ambiguity on the localization of the second acetylation(K8 or K12), resulting in two ambiguous proteoforms, H4K5acK8ac or H4K5acK12ac. (iii) With mixed spectra for multiple proteoformsand enough (100%) sequence coverage, there remains uncertainty on the existence of an acetylation on K12, therefore two ambiguousproteoforms (H4K5acK12ac and H4K8acK12ac) arise.
C© 2014 WILEY-VCH Verlag GmbH & Co. KGaA, Weinheim www.proteomics-journal.com

1138 X. Dang et al. Proteomics 2014, 14, 1130–1140
common than is often recognized in bottom-up analyses,especially when PTM localization is involved. Two proteo-forms/peptides that have the same amino acid sequence andsame degree of modification are structural isomers. Theytend to coelute, have the same exact mass and are thus frag-mented together. In bottom-up MS this is common for phos-phopeptides; however, the most abundant species is typicallyexclusively identified. This results in some penalty to the con-fidence due to other unexplained peaks. In our analysis hereit is clear to us that sometimes the presence of another pro-teoform does not substantially affect our judgment of con-fidence, yet in other cases it can completely eliminate allconfidence in the existence of that proteoform. In the exam-ple of case iii in Fig. 3B, even with 100% sequence coveragethe presence of H4K8acK16ac and H4K5acK8ac will generatea false-positive assignment of H4K8acK12ac. A fully anno-tated spectrum, as required by many proteomics journals,can be generated from correctly assigned ions and supportsthis false assignment to current standards. The confidencein individual PTM localizations is lowered and acetylation onK12 is incorrectly assigned. This also serves as an exampleas to why the PTM localization score is not necessarily inde-pendent of proteoform scoring. Our experience here showsthat ambiguity arises from a combination of insufficient se-quence coverage (case ii, Fig. 3B) and mixed spectra (caseiii, Fig 3B). Therefore, a multitiered scoring approach thatprovides semi-independent metrics of Protein ID, PTM lo-calization, and proteoform characterization is needed. TheConsortium for Top-Down Proteomics and its various meet-ings has served as a platform for discussion of these issuesand we have begun work on establishing the ontology andstatistical framework for such a tool.
3.4 Good scoring for good automation:
A three-tiered challenge
As depicted in Fig. 4, several types of scores need to be devel-oped and validated by the Top-Down community. PTM map-ping by bottom-up is confronting similar challenges presently(e.g. in localizing phosphorylation sites for generating re-liable and community-wide metrics for FDR rates). Here,Top-Down Proteomics requires an additional type of score asdepicted in Fig. 4. The first tier of our scheme is a protein iden-tification score. This metric is fairly well established; however,it should be recognized that the other tiers of proteoformcharacterization in our scheme may inform or detrimentallyaffect the confidence in the protein ID in ways not currentlyapplied in most scoring algorithms. PTM localization is thesecond tier and scoring the statistical significance thereof rep-resents a challenge even in simple cases and warrants furtherdevelopment. A rule of thumb for PTM localization in somelaboratories has been that at least two fragment ions (on eachside of the PTM and containing the PTM) are needed to re-port a specific PTM; however this is not formalized into astatistical model, nor standardized across laboratories. Thethird tier is the complete proteoform, the level at which this
Figure 4. Depiction of three general types of scores requiredto capture and convey the full complexity of data generated byMS/MS of whole, multiply-modified proteins. The dashed arrowsrepresent that these tiers of scoring are only semi-independentand each level of characterization does indeed affect and informthe other. In some cases, failure to consider all levels of infor-mation properly can result in incorrect confidence scores andmisidentification.
pilot project has focused. Such proteoform level scoring ofstatistical significance is essentially nonexistent at this point.Clearly, agreed-to scores that convey the quality of MS/MSdata and confidence in the characterization of PTMs and pro-teoforms in Top-Down MS experiments are needed.
The issue of proteoform and PTM scoring arose duringworkshops and consortium meetings and was identified as akey ambiguity in the field that needs to be addressed. For theScore Type 3 depicted in Fig. 4, an initial tool was developedfor scoring proteoforms of multiply-modified proteins. Theinput is: (i) an intact mass, (ii) a fragment ion dataset, (iii) aprotein sequence, and (iv) the specific kinds of PTMs to beconsidered. The output is given as a Frap score, where thehigher scores are better. Initial use of the tool (available on thewebsite of the Consortium for Top Down Proteomics) is inprogress (Fig. 5). This software is ongoing in its developmentand represents our initial attempt to address the pressingissue of formalizing confidence in proteoform characteriza-tion. Clearly, more work on automated scoring is requiredby the field and we look forward to establishing communitynorms.
4 Concluding remarks
All participating laboratories successfully identified histoneH4 as the main component of the sample provided. In total,74 H4 proteoforms were identified by the seven laboratories,21 of which are without ambiguity. Although proteoform-by-proteoform results reported by different laboratories indeedvary, there is great consistency buried within this variance.More abundant proteoforms were identified by the major-ity of the laboratories while less abundant ones were only
C© 2014 WILEY-VCH Verlag GmbH & Co. KGaA, Weinheim www.proteomics-journal.com

Proteomics 2014, 14, 1130–1140 1139
Figure 5. Screen grab from aweb-based tool for generatinga Proteoform CharacterizationScore (PCS).
identified by one or two laboratories. From the heat map ofsingle PTMs (Fig. 1) and binary PTM combinations (Fig. 2)it is clear that the more frequently a certain PTM or binaryPTM combination is reported by one laboratory, for example,K20me2 or N�-acK20me2, the more likely it is to be reportedby multiple laboratories. Therefore, the variance between lab-oratories has more to do with the sensitivity of methods anddepth of data analysis rather than true disagreement betweenvarious top-down MS approaches.
One of the major challenges of the H4 proteoform anal-ysis is that the various possible proteoforms are frequentlystructural isomers of each other. This makes it essentiallyimpossible to separate them in the mass spectrometer. Thelaboratories using chromatographic methods achieved sub-stantially more extensive lists of proteoforms, likely due toovercoming both ionization suppression and the difficultiesof analyzing mixed tandem mass spectra. However, MS/MSbecomes more challenging when performed at the LC time-scale due to the lack of manual optimization for each MSscan and achieving a limited number of scans for each pro-teoform as they elute. Similarly, the relatively low resolutionof the parent ion isolation often used in automated LC-MSanalyses to achieve good precursor ion signal results in mul-tiplexed MS/MS spectra due to incomplete isolation in themass dimension.
Another limitation identified in these experiments and re-sulting discussions is a need for continued improvement inhigh-resolution isolation and high-efficiency fragmentationcapabilities. Among the three common fragmentation tech-niques (CID/HCD, ECD, ETD), CID/HCD is less than idealfor top-down MS because of the known risk of PTM loss(mostly for phosphorylations). ECD suffers from a lower effi-ciency but benefits greatly from the ability to perform storedwaveform inverse Fourier transform isolation in an ICR cellto completely isolate a single methyl equivalent precursor.
ETD, on the other hand, is typically more efficient than ECDbut high resolution isolations are not available on most ETDenabled instruments (linear ion trap hybrids). UVPD is notas common as the other three and it is still under develop-ment. However, UVPD typically produces a larger numberof fragment ions of different types (a ions, x ions, b ions, yions, c ions, and z ions) and should thus increase the confi-dence in proteoform assignment. Overall, increased attentionto robust high-resolution isolation capabilities of future massspectrometers in addition to efficient (on a LC time scale) andinformation rich fragmentation capabilities would benefit thetop-down community greatly.
Another key issue for the future of top-down MS is contin-ued improvements in data analysis with a particular need todevelop universally accepted metrics of confidence. Data anal-ysis is the most time consuming part of top down proteomics.Good software should first consider all possible proteoformsthat are supported by a spectrum regardless of incompletesequence coverage or the complexity of mixed proteoforms.Unambiguous assignment should be made only if evidenceexists to confidently distinguish a proteoform (or a definedmixture of proteoforms) from all other possible explanationsof the data, including potential false-positive scenarios. Cur-rent software often only picks up the most abundant proteo-form, greatly limiting the depth of analysis. It is essential thata proteoform specific confidence metric be developed to eval-uate the quality of each individual assignment, as discussedabove in “Good Scoring for Good Automation: A Three-tieredChallenge”. Unfortunately most current software can onlyscore the proper assignment of the protein sequence but notproteoform.
Overall, it appears that analysis depth is the major sourceof variance between laboratories. Direct analysis of the mostabundant species tends to result in high inter-laboratory con-cordance. Routine and robust methods capable of accessing
C© 2014 WILEY-VCH Verlag GmbH & Co. KGaA, Weinheim www.proteomics-journal.com

1140 X. Dang et al. Proteomics 2014, 14, 1130–1140
minor components appear to be the critical path forward fortop-down proteomics.
Funding is gratefully acknowledged from NIH(R01GM067193, 1R01NS065263), NSF (CHE-1012622,JSB; ABI-1062432, RDL; DMR-11-57490), and the WelchFoundation (F-1155, JSB). The authors at the University ofVictoria – Genome BC Proteomics Centre would like to thankGenome Canada and Genome BC for Science and TechnologyInnovation Centre funding and the Western Economic Diversifi-cation of Canada for platform support. A portion of this researchwas performed using EMSL, a national scientific user facilitysponsored by the Department of Energy’s Office of Biologicaland Environmental Research and located at Pacific NorthwestNational Laboratory. The authors would also like to thankNorthwestern University and the State of Florida.
The authors have declared no conflict of interest.
5 References
[1] Kelleher, N. L., Top-down proteomics. Anal. Chem. 2004, 76,196A–203A.
[2] Cui, W, Rohrs, H. W., Gross, M. L., Top-down mass spectrom-etry: Recent developments, applications and perspectives.Analyst 2011, 136, 3854–3864.
[3] Tran, J. C., Zamdborg, L., Ahlf, D. R., Lee, J. E. et al., Mappingintact protein isoforms in discovery mode using top-downproteomics. Nature 2011, 480, 254–258.
[4] Smith, L. M., Kelleher, N. L., CTDP, Proteoform: a singleterm describing protein complexity. Nat. Methods 2013, 10,186–187.
[5] Pesavento, J. J., Bullock, C. R., Leduc, R. D., Mizzen, C. A.,Kelleher, N. L., Combinatorial modification of human histoneH4 quantitated by two-dimensional liquid chromatographycoupled with top down mass spectrometry. J. Biol. Chem.2008, 283, 14927–14937.
[6] Pesavento, J. J., Mizzen, C. A., Kelleher, N. L., Quantitativeanalysis of modified proteins and their positional isomers bytandem mass spectrometry: Human histone H4. Anal. Chem.2006, 78, 4271–4280.
[7] Phanstiel, D., Brumbaugh, J., Berggren, W. T., Conard, K.et al., Mass spectrometry identifies and quantifies 74 uniquehistone H4 isoforms in differentiating human embryonicstem cells. PNAS 2008, 105, 4093–4098.
[8] Young, N. L., DiMaggio, P. A., Plazas-Mayorca, M. D., Bal-iban, R. C. et al., High Throughput Characterization of Com-binatorial Histone Codes. Mol. Cell. Proteomics 2009, 8,2266–2284.
[9] Siuti, N., Roth, M. J., Mizzen, C. A., Kelleher, N. L., Pesavento,J. J. Gene-specific characterization of human histone H2B byelectron capture dissociation. J. Proteome Res. 2006, 5, 233–239
[10] Shen, Y., Tolic, N., Hixson, K. K., Purvine, S. O. et al., De novosequencing of unique sequence tags for discovery of post-translational modifications of proteins. Anal. Chem. 2008,80, 7742–54.
[11] Shaw, J. B., Li, W., Holden, D. D., Zhang, Y. et al., Completeprotein characterization using top-down mass spectrometryand ultraviolet photodissociation, J. Am. Chem. Soc., 2013,135, 12646–12651.
[12] DiMaggio, P. A. Jr., Young, N. L., Baliban, R. C., Gar-cia, B. A., Floudas, C. A., A mixed integer linear optimiza-tion framework for the identification and quantification oftargeted post-translational modifications of highly modi-fied proteins using multiplexed electron transfer dissocia-tion tandem mass spectrometry. Mol. Cell. Proteomics 2008,8, 2527–2543.
[13] Zamdborg, L., LeDuc, R. D., Glowacz, K. J., Kim, Y. B. et al.,ProSight PTM 2.0: improved protein identification and char-acterization for top down mass spectrometry. Nucleic AcidsRes. 2007, 35(Web Server issue), W701–W706.
[14] Liu, X., Sirotkin, Y., Shen, Y., Anderson, G. et al., Proteinidentification using top-down. Mol. Cell Proteomics 2012,11, M111.008524.
C© 2014 WILEY-VCH Verlag GmbH & Co. KGaA, Weinheim www.proteomics-journal.com