The exposure of Sydney (Australia) to earthquake-generated tsunamis, storms and sea level rise: a...
11
The exposure of Sydney (Australia) to earthquake-generated tsunamis, storms and sea level rise: a probabilistic multi-hazard approach F. Dall’Osso 1 , D. Dominey-Howes 1 , C. Moore 2 , S. Summerhayes 3 & G. Withycombe 3 1 Asia – Pacific Natural Hazards Research Group, School of Geosciences, the University of Sydney, 2 NOAA Pacific Marine Environmental Laboratory, 3 Sydney Coastal Councils Group Inc. Approximately 85% of Australia’s population live along the coastal fringe, an area with high exposure to extreme inundations such as tsunamis. However, to date, no Probabilistic Tsunami Hazard Assessments (PTHA) that include inundation have been published for Australia. This limits the development of appropriate risk reduction measures by decision and policy makers. We describe our PTHA undertaken for the Sydney metropolitan area. Using the NOAA NCTR model MOST (Method for Splitting Tsunamis), we simulate 36 earthquake-generated tsunamis with annual probabilities of 15100, 151,000 and 1510,000, occurring under present and future predicted sea level conditions. For each tsunami scenario we generate a high-resolution inundation map of the maximum water level and flow velocity, and we calculate the exposure of buildings and critical infrastructure. Results indicate that exposure to earthquake-generated tsunamis is relatively low for present events, but increases significantly with higher sea level conditions. The probabilistic approach allowed us to undertake a comparison with an existing storm surge hazard assessment. Interestingly, the exposure to all the simulated tsunamis is significantly lower than that for the 15100 storm surge scenarios, under the same initial sea level conditions. The results have significant implications for multi-risk and emergency management in Sydney. A ustralia is at risk from tsunamis but due to its geographic proximity to different seismic source regions, the tsunami hazard around Australia varies significantly 1 (Figure 1a). Since the 2004 Indian Ocean tsunami disaster great effort has been made to understand the palaeo- and historic records of tsunamis affecting Australia, estimate future tsunami probabilities and to assess risk 1–3 . For the New South Wales (NSW) coast, the most likely sources of earthquake-generated tsunamis are the New Hebrides, Puysegur, Kermadec, Tonga and Chile Trenches 1 . Burbidge et al. 1,4 are the only team to publish a Probabilistic Tsunami Hazard Assessment (PTHA) for Australia. Burbidge et al. 1 estimated tsunami offshore wave amplitudes (i.e. at the -100m bathymetric contour) corresponding to various annual probabilities of occurrence (i.e. probability of a given wave amplitude to be reached or exceeded), triggered by all possible seismic sources around Australia. The methodology is based on the approach usually adopted for Probabilistic Seismic Hazard Assessments (PSAH). Burbidge et al. 1 simulated a number of earthquakes whose probability of occurrence was known for each of the selected tsunami sources (i.e. all subduction zones surrounding Australia). Other tsunami sources such as landslides and volcanic eruptions were not considered. The vertical component of the crustal deformation of each earthquake was used as the initial condition of a finite-difference numerical model to propagate each tsunami towards the coast reaching a bathy- metric contour of -100m. This produced a maximum tsunami wave amplitude (at the -100m contour) for each earthquake, associated to its probability of occurrence. The probabilistic hazard maps of Burbidge et al. 1 are given at an offshore bathymetric contour of -100m. Near- shore tsunami propagation and inundation modelling were not undertaken. To the best of our knowledge, no PTHAs that incorporate onshore inundation modelling have been published in Australia. In a pilot study, Dall’Osso et al. 2 explored the exposure and vulnerability of buildings to inundation that would be associated with a tsunami run-up of 7 m in the Sydney suburb of Manly. They showed that such a scenario OPEN SUBJECT AREAS: PLANETARY SCIENCE CLIMATE-CHANGE IMPACTS Received 27 August 2014 Accepted 18 November 2014 Published 10 December 2014 Correspondence and requests for materials should be addressed to F.D.O. (filippodallosso@ gmail.com) or D.D.-H. (dale.dominey- [email protected]. au) SCIENTIFIC REPORTS | 4 : 7401 | DOI: 10.1038/srep07401 1
-
Upload
independent -
Category
Documents
-
view
5 -
download
0
Transcript of The exposure of Sydney (Australia) to earthquake-generated tsunamis, storms and sea level rise: a...

The exposure of Sydney (Australia) toearthquake-generated tsunamis, stormsand sea level rise: a probabilisticmulti-hazard approachF. Dall’Osso1, D. Dominey-Howes1, C. Moore2, S. Summerhayes3 & G. Withycombe3
1Asia – Pacific Natural Hazards Research Group, School of Geosciences, the University of Sydney, 2NOAA Pacific MarineEnvironmental Laboratory, 3Sydney Coastal Councils Group Inc.
Approximately 85% of Australia’s population live along the coastal fringe, an area with high exposure toextreme inundations such as tsunamis. However, to date, no Probabilistic Tsunami Hazard Assessments(PTHA) that include inundation have been published for Australia. This limits the development ofappropriate risk reduction measures by decision and policy makers. We describe our PTHA undertaken forthe Sydney metropolitan area. Using the NOAA NCTR model MOST (Method for Splitting Tsunamis), wesimulate 36 earthquake-generated tsunamis with annual probabilities of 15100, 151,000 and 1510,000,occurring under present and future predicted sea level conditions. For each tsunami scenario we generate ahigh-resolution inundation map of the maximum water level and flow velocity, and we calculate theexposure of buildings and critical infrastructure. Results indicate that exposure to earthquake-generatedtsunamis is relatively low for present events, but increases significantly with higher sea level conditions. Theprobabilistic approach allowed us to undertake a comparison with an existing storm surge hazardassessment. Interestingly, the exposure to all the simulated tsunamis is significantly lower than that for the15100 storm surge scenarios, under the same initial sea level conditions. The results have significantimplications for multi-risk and emergency management in Sydney.
Australia is at risk from tsunamis but due to its geographic proximity to different seismic source regions, thetsunami hazard around Australia varies significantly1 (Figure 1a). Since the 2004 Indian Ocean tsunamidisaster great effort has been made to understand the palaeo- and historic records of tsunamis affecting
Australia, estimate future tsunami probabilities and to assess risk1–3. For the New South Wales (NSW) coast, themost likely sources of earthquake-generated tsunamis are the New Hebrides, Puysegur, Kermadec, Tonga andChile Trenches1.
Burbidge et al.1,4 are the only team to publish a Probabilistic Tsunami Hazard Assessment (PTHA) forAustralia. Burbidge et al.1 estimated tsunami offshore wave amplitudes (i.e. at the -100m bathymetric contour)corresponding to various annual probabilities of occurrence (i.e. probability of a given wave amplitude to bereached or exceeded), triggered by all possible seismic sources around Australia. The methodology is based on theapproach usually adopted for Probabilistic Seismic Hazard Assessments (PSAH). Burbidge et al.1 simulated anumber of earthquakes whose probability of occurrence was known for each of the selected tsunami sources (i.e.all subduction zones surrounding Australia). Other tsunami sources such as landslides and volcanic eruptionswere not considered. The vertical component of the crustal deformation of each earthquake was used as the initialcondition of a finite-difference numerical model to propagate each tsunami towards the coast reaching a bathy-metric contour of -100m. This produced a maximum tsunami wave amplitude (at the -100m contour) for eachearthquake, associated to its probability of occurrence.
The probabilistic hazard maps of Burbidge et al.1 are given at an offshore bathymetric contour of -100m. Near-shore tsunami propagation and inundation modelling were not undertaken. To the best of our knowledge, noPTHAs that incorporate onshore inundation modelling have been published in Australia.
In a pilot study, Dall’Osso et al.2 explored the exposure and vulnerability of buildings to inundation that wouldbe associated with a tsunami run-up of 7 m in the Sydney suburb of Manly. They showed that such a scenario
OPEN
SUBJECT AREAS:PLANETARY SCIENCE
CLIMATE-CHANGE IMPACTS
Received27 August 2014
Accepted18 November 2014
Published10 December 2014
Correspondence andrequests for materials
should be addressed toF.D.O.
([email protected]) or D.D.-H.
au)
SCIENTIFIC REPORTS | 4 : 7401 | DOI: 10.1038/srep07401 1

Figure 1 | Study area and off-shore Probabilistic Tsunami Hazard Assessment for Australia. (a) the red circle indicates the study area location: this is
part of the metropolitan area of Sydney, in which most of the NSW population is clustered. The colour bars surrounding Australia represent the
off-shore tsunami wave amplitude having a 1 in 1,000 chance of being exceeded per year.; (b) the case study area located south of central Sydney, NSW and
includes Botany Bay, Bate Bay and Port Hacking. These areas are located within the Councils of Botany Bay, Rockdale and Sutherland Shire. Points #1, #2
and #3 located by red stars were selected to extract the tsunami wave amplitude fields shown in Figures 2 and 3. The point coordinates are: point#1
(-33.9577; 151.1930), point#2 (-33.9877; 151.1490), point #3 (-34.0503; 151.1582) (Datum: CGS WGS84). Each point has a vertical elevation of -2m
AHD. Figure 1(a) was modified from Burbidge et al.1, with permission from Geoscience Australia. E Commonwealth of Australia (Geoscience Australia)
2014. Figure 1(b) was created by the first author (FD) using ESRI ArcGIS 10.
www.nature.com/scientificreports
SCIENTIFIC REPORTS | 4 : 7401 | DOI: 10.1038/srep07401 2
would inundate 12001 buildings. However, Dall’Osso et al.2 esti-mated the tsunami inundation using a deterministic, static ‘‘bathtubfilling’’ method that limited the scope of their work.
Historically, tide-gauge records show that only small tsunamishave affected NSW5. However, according to the ‘‘AustralianMegatsunami Hypothesis’’ (AMH) large palaeotsunamis may haveoccurred repeatedly throughout the Holocene although their sourcesremain unknown6. Although the AMH is controversial, the factremains that the exposed NSW coast (Figure 1a) is home to approxi-mately 80% of the State’s population. In addition to the AMH, geo-logical evidence of smaller tsunamis that occurred in the mid to lateHolocene has been found in various estuary locations along thesoutheast coast of Australia7. Although these events would have beensmaller than those proposed by the AMH, if repeated today, theirconsequences would be significant8.
In fact, Chen and McAneny9 estimated that in Sydney, some20,000 properties are at risk from inundation associated with a vari-ety of coastal processes being located ,1 km from the shoreline andat no more than 3m above sea level. However, this estimate did notinclude tsunamis.
The deficiency of PTHAs coupled with dynamic numerical inlandinundation modelling and building exposure assessments make itdifficult for state and local government authorities and the emer-gency services to implement comprehensive multi-hazard riskreduction strategies, including to the threat posed by tsunamis.The paucity of PTHAs in Australia means that the risk from tsuna-mis cannot be fully quantified nor compared against natural hazardswhose probabilities are known. Further, in the absence of thisinformation, the NSW Government10 defines tsunami risk in broadterms as ‘the entire population living within 1 km of the shoreline,and below 10m above sea level’. This approach can under or over-estimate exposure, particularly in areas featuring estuaries and ria-like coasts, such as Sydney11.
Our study produces a more accurate PTHA to assist and underpincoastal risk management and land-use planning strategies. In par-ticular, this work aims to:
a. Undertake a PTHA for a densely populated area in south Sydney,NSW. The study area comprises the bays of Botany and Bate, and
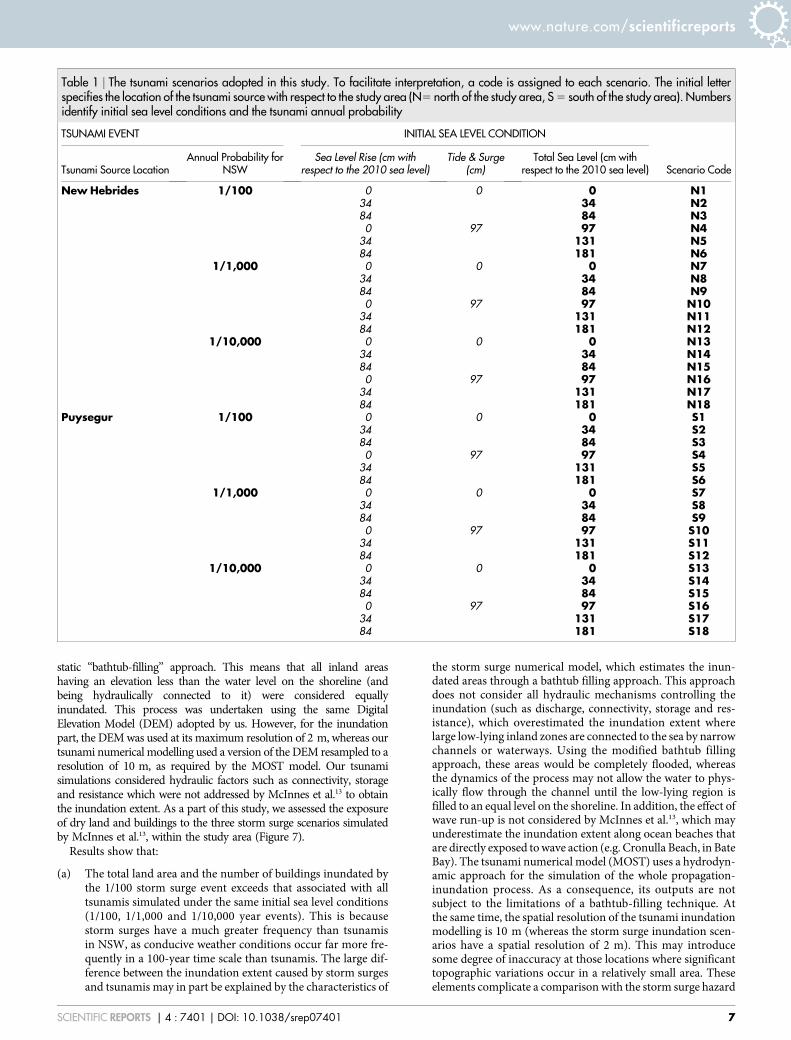
the estuary zone of Port Hacking (Figure 1b). The PTHAincludes hydrodynamic modelling of tsunami generation, trans-oceanic and near-shore propagation, and inland inundation.Using the model MOST (Method of Splitting Tsunamis)12, wesimulate 36 tsunami scenarios by combining three annual prob-abilities of occurrence (i.e. 1/100, 1/1,000 and 1/10,000), twotsunami source locations (i.e. New Hebrides and Puysegurtrenches) and six initial sea level states (accounting for tide fluc-tuations and sea level rise estimates). For each scenario we obtainthe tsunami arrival time, the wave amplitude field, the extent ofthe forecast area of maximum inundation, and estimates of themaximum water level and flow velocity in each point of the studyarea.
b. Assess the exposure of buildings and infrastructure to theselected tsunami scenarios. Exposure variations across differenttsunami scenarios are then discussed and compared based on thetsunami probability, source location and initial sea level condi-tions;
c. Demonstrate how the PTHA can be used in multi-hazard stud-ies. This is achieved by comparing the outputs of the PTHA andthe exposure assessment with a probabilistic storm surge hazardand exposure assessment undertaken by McInnes et al.11, whichused the same initial sea level conditions.
ResultsFor each tsunami scenario, MOST calculated the time series ofinundation depth and flow velocity reached in each cell of thetopo-bathymetric grids used as inputs. This information was usedto generate the following results:
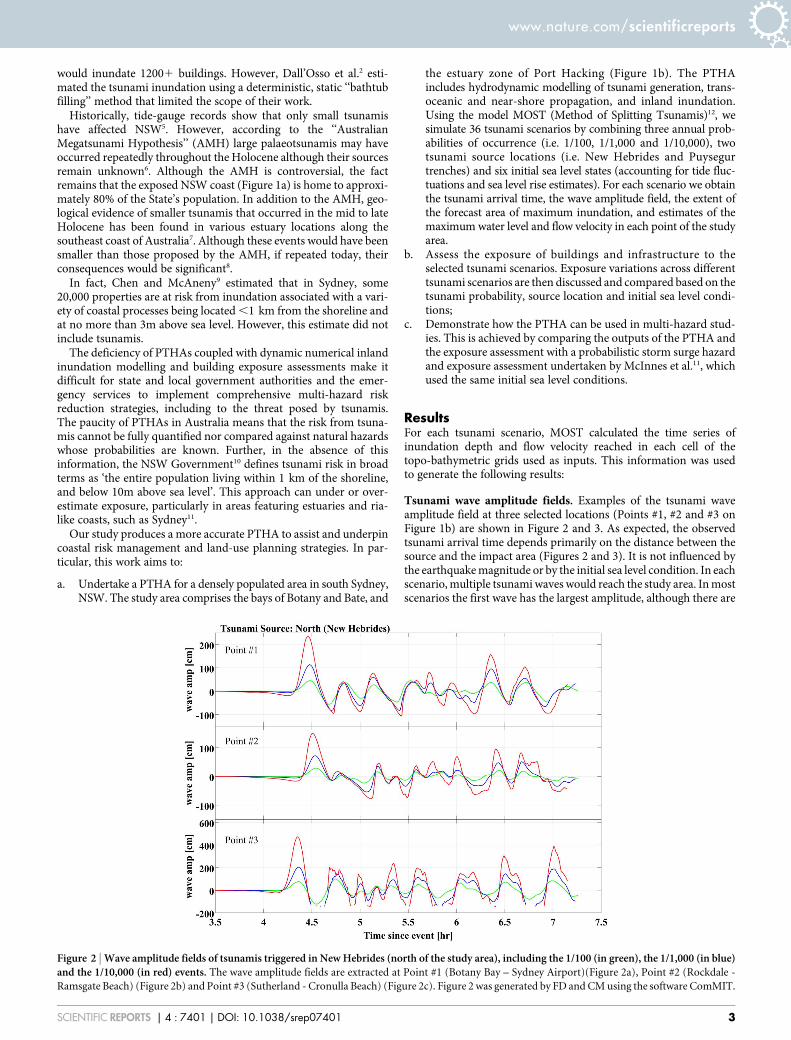
Tsunami wave amplitude fields. Examples of the tsunami waveamplitude field at three selected locations (Points #1, #2 and #3 onFigure 1b) are shown in Figure 2 and 3. As expected, the observedtsunami arrival time depends primarily on the distance between thesource and the impact area (Figures 2 and 3). It is not influenced bythe earthquake magnitude or by the initial sea level condition. In eachscenario, multiple tsunami waves would reach the study area. In mostscenarios the first wave has the largest amplitude, although there are
Figure 2 | Wave amplitude fields of tsunamis triggered in New Hebrides (north of the study area), including the 1/100 (in green), the 1/1,000 (in blue)and the 1/10,000 (in red) events. The wave amplitude fields are extracted at Point #1 (Botany Bay – Sydney Airport)(Figure 2a), Point #2 (Rockdale -
Ramsgate Beach) (Figure 2b) and Point #3 (Sutherland - Cronulla Beach) (Figure 2c). Figure 2 was generated by FD and CM using the software ComMIT.
www.nature.com/scientificreports
SCIENTIFIC REPORTS | 4 : 7401 | DOI: 10.1038/srep07401 3
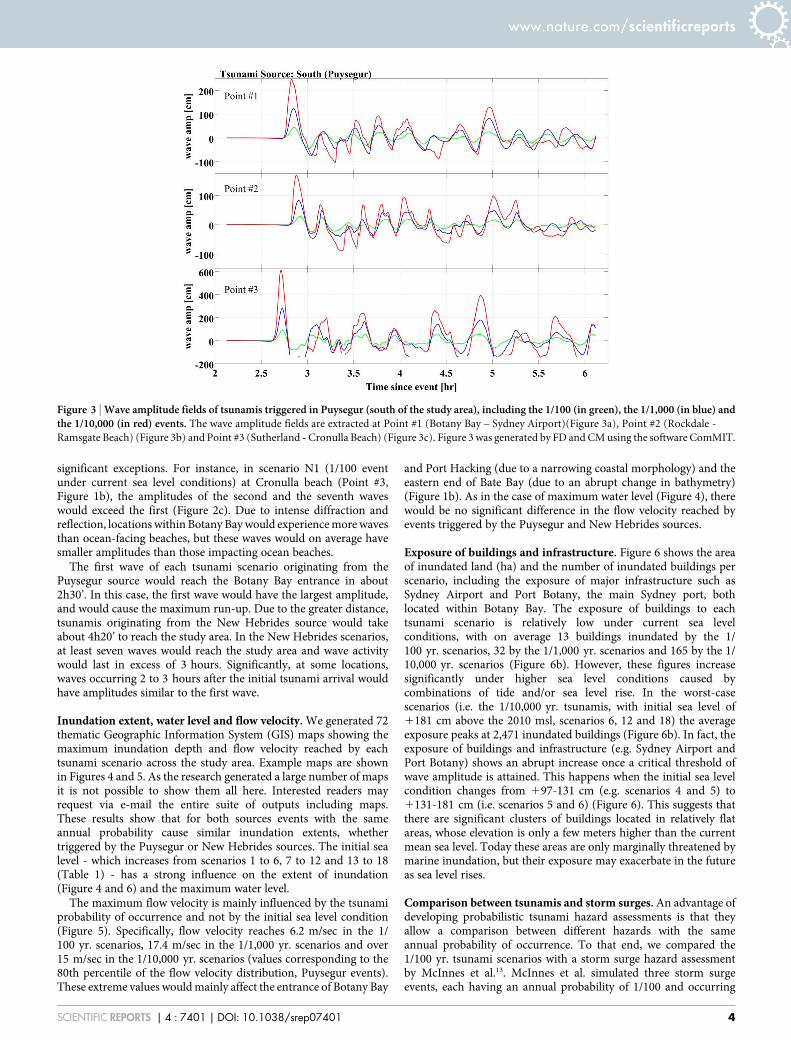
significant exceptions. For instance, in scenario N1 (1/100 eventunder current sea level conditions) at Cronulla beach (Point #3,Figure 1b), the amplitudes of the second and the seventh waveswould exceed the first (Figure 2c). Due to intense diffraction andreflection, locations within Botany Bay would experience more wavesthan ocean-facing beaches, but these waves would on average havesmaller amplitudes than those impacting ocean beaches.
The first wave of each tsunami scenario originating from thePuysegur source would reach the Botany Bay entrance in about2h30’. In this case, the first wave would have the largest amplitude,and would cause the maximum run-up. Due to the greater distance,tsunamis originating from the New Hebrides source would takeabout 4h20’ to reach the study area. In the New Hebrides scenarios,at least seven waves would reach the study area and wave activitywould last in excess of 3 hours. Significantly, at some locations,waves occurring 2 to 3 hours after the initial tsunami arrival wouldhave amplitudes similar to the first wave.
Inundation extent, water level and flow velocity. We generated 72thematic Geographic Information System (GIS) maps showing themaximum inundation depth and flow velocity reached by eachtsunami scenario across the study area. Example maps are shownin Figures 4 and 5. As the research generated a large number of mapsit is not possible to show them all here. Interested readers mayrequest via e-mail the entire suite of outputs including maps.These results show that for both sources events with the sameannual probability cause similar inundation extents, whethertriggered by the Puysegur or New Hebrides sources. The initial sealevel - which increases from scenarios 1 to 6, 7 to 12 and 13 to 18(Table 1) - has a strong influence on the extent of inundation(Figure 4 and 6) and the maximum water level.
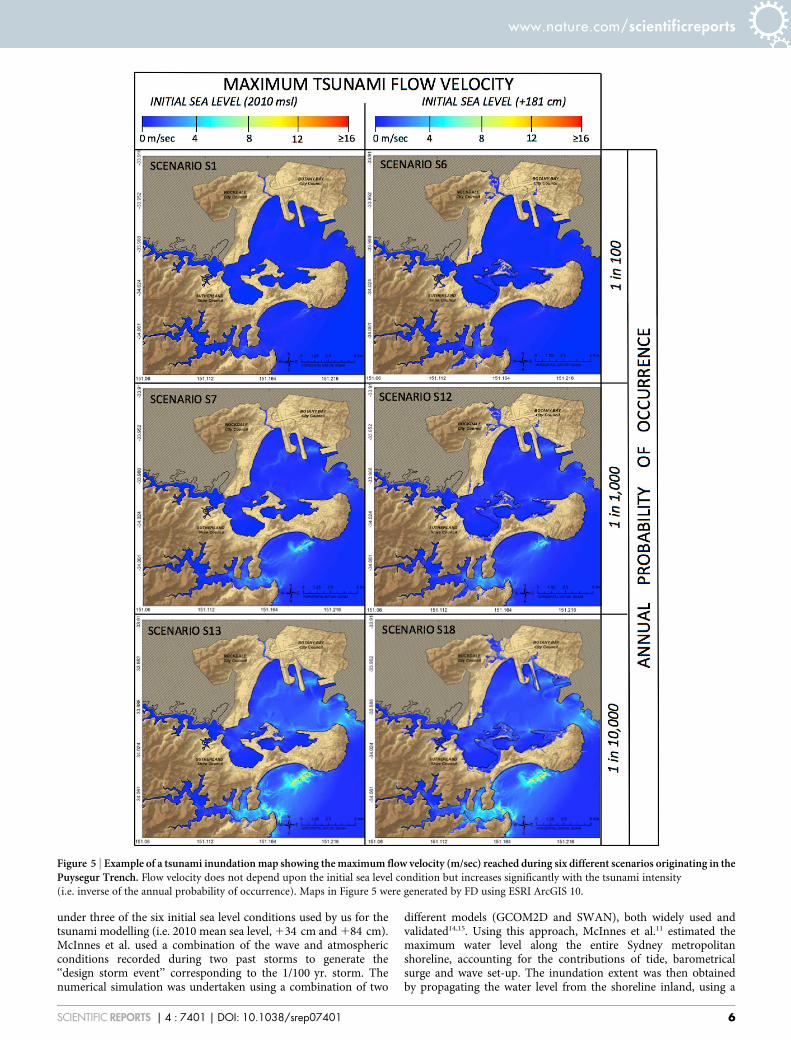
The maximum flow velocity is mainly influenced by the tsunamiprobability of occurrence and not by the initial sea level condition(Figure 5). Specifically, flow velocity reaches 6.2 m/sec in the 1/100 yr. scenarios, 17.4 m/sec in the 1/1,000 yr. scenarios and over15 m/sec in the 1/10,000 yr. scenarios (values corresponding to the80th percentile of the flow velocity distribution, Puysegur events).These extreme values would mainly affect the entrance of Botany Bay
and Port Hacking (due to a narrowing coastal morphology) and theeastern end of Bate Bay (due to an abrupt change in bathymetry)(Figure 1b). As in the case of maximum water level (Figure 4), therewould be no significant difference in the flow velocity reached byevents triggered by the Puysegur and New Hebrides sources.
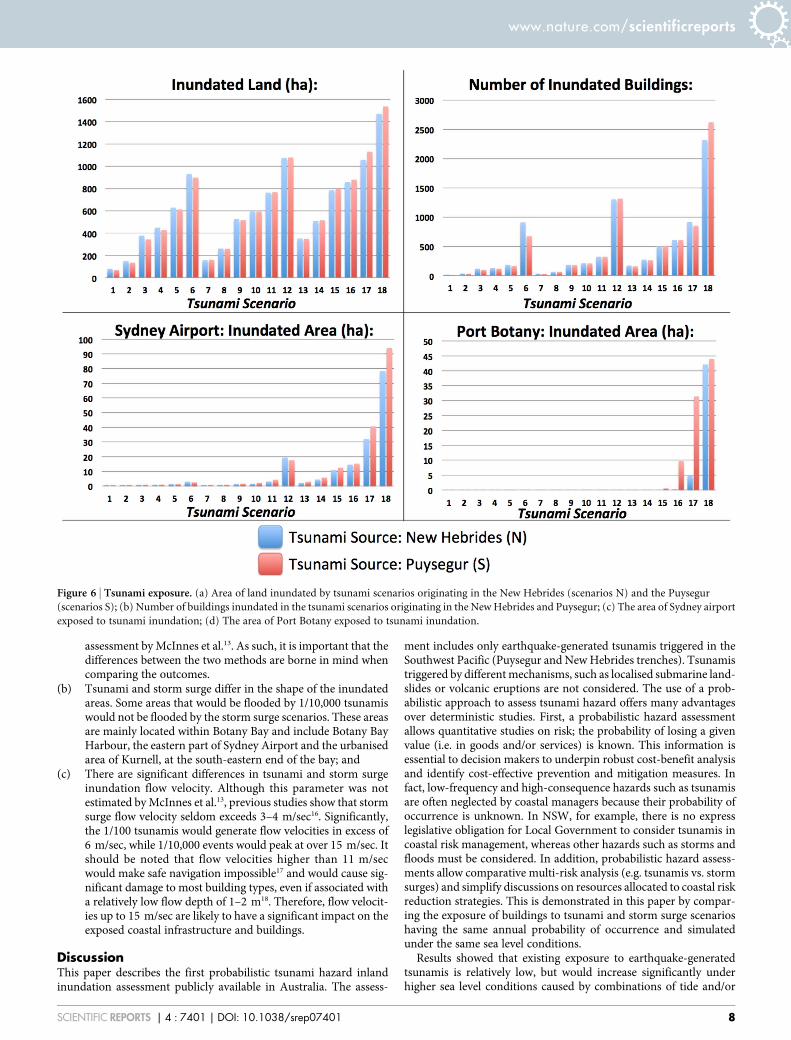
Exposure of buildings and infrastructure. Figure 6 shows the areaof inundated land (ha) and the number of inundated buildings perscenario, including the exposure of major infrastructure such asSydney Airport and Port Botany, the main Sydney port, bothlocated within Botany Bay. The exposure of buildings to eachtsunami scenario is relatively low under current sea levelconditions, with on average 13 buildings inundated by the 1/100 yr. scenarios, 32 by the 1/1,000 yr. scenarios and 165 by the 1/10,000 yr. scenarios (Figure 6b). However, these figures increasesignificantly under higher sea level conditions caused bycombinations of tide and/or sea level rise. In the worst-casescenarios (i.e. the 1/10,000 yr. tsunamis, with initial sea level of1181 cm above the 2010 msl, scenarios 6, 12 and 18) the averageexposure peaks at 2,471 inundated buildings (Figure 6b). In fact, theexposure of buildings and infrastructure (e.g. Sydney Airport andPort Botany) shows an abrupt increase once a critical threshold ofwave amplitude is attained. This happens when the initial sea levelcondition changes from 197-131 cm (e.g. scenarios 4 and 5) to1131-181 cm (i.e. scenarios 5 and 6) (Figure 6). This suggests thatthere are significant clusters of buildings located in relatively flatareas, whose elevation is only a few meters higher than the currentmean sea level. Today these areas are only marginally threatened bymarine inundation, but their exposure may exacerbate in the futureas sea level rises.
Comparison between tsunamis and storm surges. An advantage ofdeveloping probabilistic tsunami hazard assessments is that theyallow a comparison between different hazards with the sameannual probability of occurrence. To that end, we compared the1/100 yr. tsunami scenarios with a storm surge hazard assessmentby McInnes et al.13. McInnes et al. simulated three storm surgeevents, each having an annual probability of 1/100 and occurring
Figure 3 | Wave amplitude fields of tsunamis triggered in Puysegur (south of the study area), including the 1/100 (in green), the 1/1,000 (in blue) andthe 1/10,000 (in red) events. The wave amplitude fields are extracted at Point #1 (Botany Bay – Sydney Airport)(Figure 3a), Point #2 (Rockdale -
Ramsgate Beach) (Figure 3b) and Point #3 (Sutherland - Cronulla Beach) (Figure 3c). Figure 3 was generated by FD and CM using the software ComMIT.
www.nature.com/scientificreports
SCIENTIFIC REPORTS | 4 : 7401 | DOI: 10.1038/srep07401 4
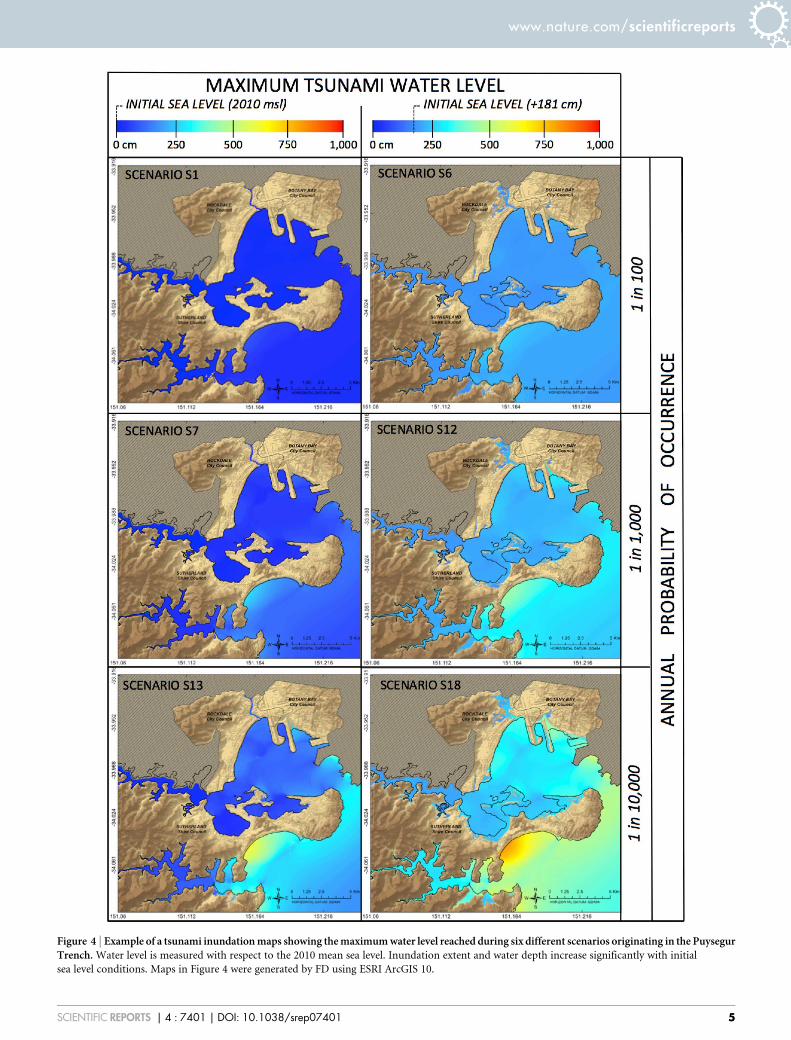
Figure 4 | Example of a tsunami inundation maps showing the maximum water level reached during six different scenarios originating in the PuysegurTrench. Water level is measured with respect to the 2010 mean sea level. Inundation extent and water depth increase significantly with initial
sea level conditions. Maps in Figure 4 were generated by FD using ESRI ArcGIS 10.
www.nature.com/scientificreports
SCIENTIFIC REPORTS | 4 : 7401 | DOI: 10.1038/srep07401 5
under three of the six initial sea level conditions used by us for thetsunami modelling (i.e. 2010 mean sea level, 134 cm and 184 cm).McInnes et al. used a combination of the wave and atmosphericconditions recorded during two past storms to generate the‘‘design storm event’’ corresponding to the 1/100 yr. storm. Thenumerical simulation was undertaken using a combination of two
different models (GCOM2D and SWAN), both widely used andvalidated14,15. Using this approach, McInnes et al.11 estimated themaximum water level along the entire Sydney metropolitanshoreline, accounting for the contributions of tide, barometricalsurge and wave set-up. The inundation extent was then obtainedby propagating the water level from the shoreline inland, using a
Figure 5 | Example of a tsunami inundation map showing the maximum flow velocity (m/sec) reached during six different scenarios originating in thePuysegur Trench. Flow velocity does not depend upon the initial sea level condition but increases significantly with the tsunami intensity
(i.e. inverse of the annual probability of occurrence). Maps in Figure 5 were generated by FD using ESRI ArcGIS 10.
www.nature.com/scientificreports
SCIENTIFIC REPORTS | 4 : 7401 | DOI: 10.1038/srep07401 6
static ‘‘bathtub-filling’’ approach. This means that all inland areashaving an elevation less than the water level on the shoreline (andbeing hydraulically connected to it) were considered equallyinundated. This process was undertaken using the same DigitalElevation Model (DEM) adopted by us. However, for the inundationpart, the DEM was used at its maximum resolution of 2 m, whereas ourtsunami numerical modelling used a version of the DEM resampled to aresolution of 10 m, as required by the MOST model. Our tsunamisimulations considered hydraulic factors such as connectivity, storageand resistance which were not addressed by McInnes et al.13 to obtainthe inundation extent. As a part of this study, we assessed the exposureof dry land and buildings to the three storm surge scenarios simulatedby McInnes et al.13, within the study area (Figure 7).
Results show that:
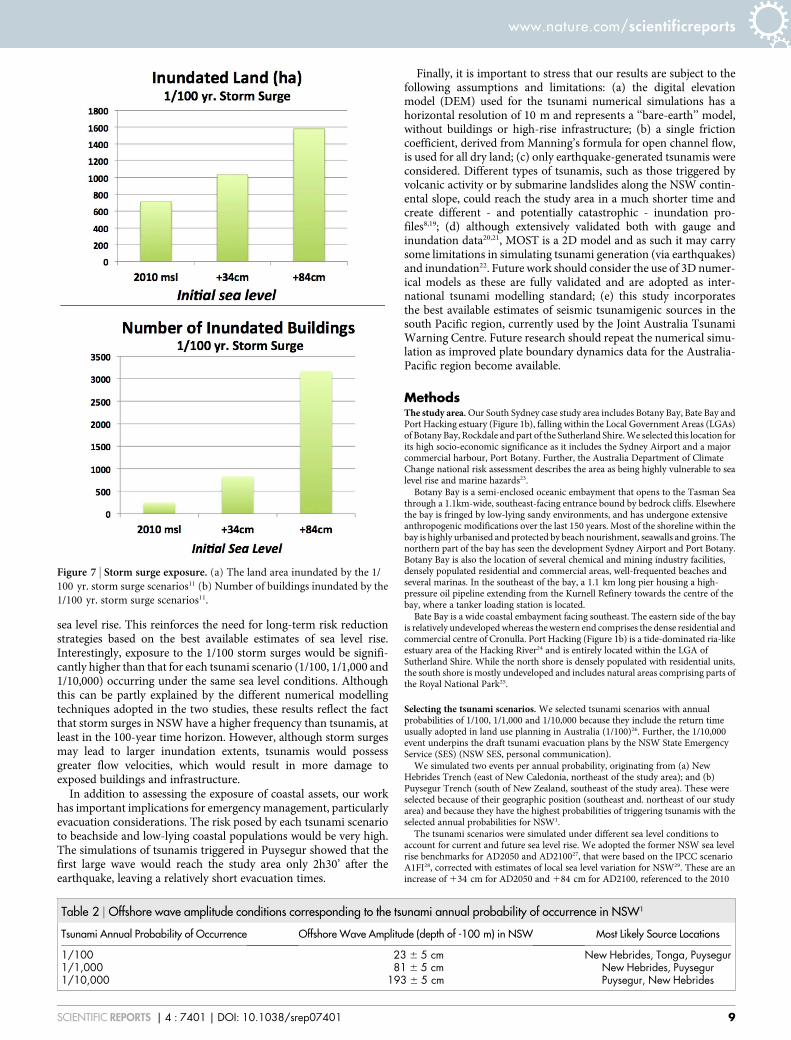
(a) The total land area and the number of buildings inundated bythe 1/100 storm surge event exceeds that associated with alltsunamis simulated under the same initial sea level conditions(1/100, 1/1,000 and 1/10,000 year events). This is becausestorm surges have a much greater frequency than tsunamisin NSW, as conducive weather conditions occur far more fre-quently in a 100-year time scale than tsunamis. The large dif-ference between the inundation extent caused by storm surgesand tsunamis may in part be explained by the characteristics of
the storm surge numerical model, which estimates the inun-dated areas through a bathtub filling approach. This approachdoes not consider all hydraulic mechanisms controlling theinundation (such as discharge, connectivity, storage and res-istance), which overestimated the inundation extent wherelarge low-lying inland zones are connected to the sea by narrowchannels or waterways. Using the modified bathtub fillingapproach, these areas would be completely flooded, whereasthe dynamics of the process may not allow the water to phys-ically flow through the channel until the low-lying region isfilled to an equal level on the shoreline. In addition, the effect ofwave run-up is not considered by McInnes et al.13, which mayunderestimate the inundation extent along ocean beaches thatare directly exposed to wave action (e.g. Cronulla Beach, in BateBay). The tsunami numerical model (MOST) uses a hydrodyn-amic approach for the simulation of the whole propagation-inundation process. As a consequence, its outputs are notsubject to the limitations of a bathtub-filling technique. Atthe same time, the spatial resolution of the tsunami inundationmodelling is 10 m (whereas the storm surge inundation scen-arios have a spatial resolution of 2 m). This may introducesome degree of inaccuracy at those locations where significanttopographic variations occur in a relatively small area. Theseelements complicate a comparison with the storm surge hazard
Table 1 | The tsunami scenarios adopted in this study. To facilitate interpretation, a code is assigned to each scenario. The initial letterspecifies the location of the tsunami source with respect to the study area (N5 north of the study area, S 5 south of the study area). Numbersidentify initial sea level conditions and the tsunami annual probability
TSUNAMI EVENT INITIAL SEA LEVEL CONDITION
Scenario CodeTsunami Source LocationAnnual Probability for
NSWSea Level Rise (cm with
respect to the 2010 sea level)Tide & Surge
(cm)Total Sea Level (cm with
respect to the 2010 sea level)
New Hebrides 1/100 0 0 0 N134 34 N284 84 N30 97 97 N4
34 131 N584 181 N6
1/1,000 0 0 0 N734 34 N884 84 N90 97 97 N10
34 131 N1184 181 N12
1/10,000 0 0 0 N1334 34 N1484 84 N150 97 97 N16
34 131 N1784 181 N18
Puysegur 1/100 0 0 0 S134 34 S284 84 S30 97 97 S4
34 131 S584 181 S6
1/1,000 0 0 0 S734 34 S884 84 S90 97 97 S10
34 131 S1184 181 S12
1/10,000 0 0 0 S1334 34 S1484 84 S150 97 97 S16
34 131 S1784 181 S18
www.nature.com/scientificreports
SCIENTIFIC REPORTS | 4 : 7401 | DOI: 10.1038/srep07401 7
assessment by McInnes et al.13. As such, it is important that thedifferences between the two methods are borne in mind whencomparing the outcomes.
(b) Tsunami and storm surge differ in the shape of the inundatedareas. Some areas that would be flooded by 1/10,000 tsunamiswould not be flooded by the storm surge scenarios. These areasare mainly located within Botany Bay and include Botany BayHarbour, the eastern part of Sydney Airport and the urbanisedarea of Kurnell, at the south-eastern end of the bay; and
(c) There are significant differences in tsunami and storm surgeinundation flow velocity. Although this parameter was notestimated by McInnes et al.13, previous studies show that stormsurge flow velocity seldom exceeds 3–4 m/sec16. Significantly,the 1/100 tsunamis would generate flow velocities in excess of6 m/sec, while 1/10,000 events would peak at over 15 m/sec. Itshould be noted that flow velocities higher than 11 m/secwould make safe navigation impossible17 and would cause sig-nificant damage to most building types, even if associated witha relatively low flow depth of 1–2 m18. Therefore, flow velocit-ies up to 15 m/sec are likely to have a significant impact on theexposed coastal infrastructure and buildings.
DiscussionThis paper describes the first probabilistic tsunami hazard inlandinundation assessment publicly available in Australia. The assess-
ment includes only earthquake-generated tsunamis triggered in theSouthwest Pacific (Puysegur and New Hebrides trenches). Tsunamistriggered by different mechanisms, such as localised submarine land-slides or volcanic eruptions are not considered. The use of a prob-abilistic approach to assess tsunami hazard offers many advantagesover deterministic studies. First, a probabilistic hazard assessmentallows quantitative studies on risk; the probability of losing a givenvalue (i.e. in goods and/or services) is known. This information isessential to decision makers to underpin robust cost-benefit analysisand identify cost-effective prevention and mitigation measures. Infact, low-frequency and high-consequence hazards such as tsunamisare often neglected by coastal managers because their probability ofoccurrence is unknown. In NSW, for example, there is no expresslegislative obligation for Local Government to consider tsunamis incoastal risk management, whereas other hazards such as storms andfloods must be considered. In addition, probabilistic hazard assess-ments allow comparative multi-risk analysis (e.g. tsunamis vs. stormsurges) and simplify discussions on resources allocated to coastal riskreduction strategies. This is demonstrated in this paper by compar-ing the exposure of buildings to tsunami and storm surge scenarioshaving the same annual probability of occurrence and simulatedunder the same sea level conditions.
Results showed that existing exposure to earthquake-generatedtsunamis is relatively low, but would increase significantly underhigher sea level conditions caused by combinations of tide and/or
Figure 6 | Tsunami exposure. (a) Area of land inundated by tsunami scenarios originating in the New Hebrides (scenarios N) and the Puysegur
(scenarios S); (b) Number of buildings inundated in the tsunami scenarios originating in the New Hebrides and Puysegur; (c) The area of Sydney airport
exposed to tsunami inundation; (d) The area of Port Botany exposed to tsunami inundation.
www.nature.com/scientificreports
SCIENTIFIC REPORTS | 4 : 7401 | DOI: 10.1038/srep07401 8
sea level rise. This reinforces the need for long-term risk reductionstrategies based on the best available estimates of sea level rise.Interestingly, exposure to the 1/100 storm surges would be signifi-cantly higher than that for each tsunami scenario (1/100, 1/1,000 and1/10,000) occurring under the same sea level conditions. Althoughthis can be partly explained by the different numerical modellingtechniques adopted in the two studies, these results reflect the factthat storm surges in NSW have a higher frequency than tsunamis, atleast in the 100-year time horizon. However, although storm surgesmay lead to larger inundation extents, tsunamis would possessgreater flow velocities, which would result in more damage toexposed buildings and infrastructure.
In addition to assessing the exposure of coastal assets, our workhas important implications for emergency management, particularlyevacuation considerations. The risk posed by each tsunami scenarioto beachside and low-lying coastal populations would be very high.The simulations of tsunamis triggered in Puysegur showed that thefirst large wave would reach the study area only 2h30’ after theearthquake, leaving a relatively short evacuation times.
Finally, it is important to stress that our results are subject to thefollowing assumptions and limitations: (a) the digital elevationmodel (DEM) used for the tsunami numerical simulations has ahorizontal resolution of 10 m and represents a ‘‘bare-earth’’ model,without buildings or high-rise infrastructure; (b) a single frictioncoefficient, derived from Manning’s formula for open channel flow,is used for all dry land; (c) only earthquake-generated tsunamis wereconsidered. Different types of tsunamis, such as those triggered byvolcanic activity or by submarine landslides along the NSW contin-ental slope, could reach the study area in a much shorter time andcreate different - and potentially catastrophic - inundation pro-files8,19; (d) although extensively validated both with gauge andinundation data20,21, MOST is a 2D model and as such it may carrysome limitations in simulating tsunami generation (via earthquakes)and inundation22. Future work should consider the use of 3D numer-ical models as these are fully validated and are adopted as inter-national tsunami modelling standard; (e) this study incorporatesthe best available estimates of seismic tsunamigenic sources in thesouth Pacific region, currently used by the Joint Australia TsunamiWarning Centre. Future research should repeat the numerical simu-lation as improved plate boundary dynamics data for the Australia-Pacific region become available.
MethodsThe study area. Our South Sydney case study area includes Botany Bay, Bate Bay andPort Hacking estuary (Figure 1b), falling within the Local Government Areas (LGAs)of Botany Bay, Rockdale and part of the Sutherland Shire. We selected this location forits high socio-economic significance as it includes the Sydney Airport and a majorcommercial harbour, Port Botany. Further, the Australia Department of ClimateChange national risk assessment describes the area as being highly vulnerable to sealevel rise and marine hazards23.
Botany Bay is a semi-enclosed oceanic embayment that opens to the Tasman Seathrough a 1.1km-wide, southeast-facing entrance bound by bedrock cliffs. Elsewherethe bay is fringed by low-lying sandy environments, and has undergone extensiveanthropogenic modifications over the last 150 years. Most of the shoreline within thebay is highly urbanised and protected by beach nourishment, seawalls and groins. Thenorthern part of the bay has seen the development Sydney Airport and Port Botany.Botany Bay is also the location of several chemical and mining industry facilities,densely populated residential and commercial areas, well-frequented beaches andseveral marinas. In the southeast of the bay, a 1.1 km long pier housing a high-pressure oil pipeline extending from the Kurnell Refinery towards the centre of thebay, where a tanker loading station is located.
Bate Bay is a wide coastal embayment facing southeast. The eastern side of the bayis relatively undeveloped whereas the western end comprises the dense residential andcommercial centre of Cronulla. Port Hacking (Figure 1b) is a tide-dominated ria-likeestuary area of the Hacking River24 and is entirely located within the LGA ofSutherland Shire. While the north shore is densely populated with residential units,the south shore is mostly undeveloped and includes natural areas comprising parts ofthe Royal National Park25.
Selecting the tsunami scenarios. We selected tsunami scenarios with annualprobabilities of 1/100, 1/1,000 and 1/10,000 because they include the return timeusually adopted in land use planning in Australia (1/100)26. Further, the 1/10,000event underpins the draft tsunami evacuation plans by the NSW State EmergencyService (SES) (NSW SES, personal communication).
We simulated two events per annual probability, originating from (a) NewHebrides Trench (east of New Caledonia, northeast of the study area); and (b)Puysegur Trench (south of New Zealand, southeast of the study area). These wereselected because of their geographic position (southeast and. northeast of our studyarea) and because they have the highest probabilities of triggering tsunamis with theselected annual probabilities for NSW1.
The tsunami scenarios were simulated under different sea level conditions toaccount for current and future sea level rise. We adopted the former NSW sea levelrise benchmarks for AD2050 and AD210027, that were based on the IPCC scenarioA1FI28, corrected with estimates of local sea level variation for NSW29. These are anincrease of 134 cm for AD2050 and 184 cm for AD2100, referenced to the 2010
Figure 7 | Storm surge exposure. (a) The land area inundated by the 1/
100 yr. storm surge scenarios11 (b) Number of buildings inundated by the
1/100 yr. storm surge scenarios11.
Table 2 | Offshore wave amplitude conditions corresponding to the tsunami annual probability of occurrence in NSW1
Tsunami Annual Probability of Occurrence Offshore Wave Amplitude (depth of -100 m) in NSW Most Likely Source Locations
1/100 23 6 5 cm New Hebrides, Tonga, Puysegur1/1,000 81 6 5 cm New Hebrides, Puysegur1/10,000 193 6 5 cm Puysegur, New Hebrides
www.nature.com/scientificreports
SCIENTIFIC REPORTS | 4 : 7401 | DOI: 10.1038/srep07401 9
mean sea level (msl). In this paper, we referenced the predicted sea level rise estimatesto the 2010 msl13. We also considered the following sea level states caused by tide andsurge:
. The mean sea level (no short-term sea level fluctuations)
. An increase of 197 cm above the mean sea level, corresponding to a tide andsurge peak having an ARI (Average Recurrence Interval) of 0.02 yr. (i.e. aboutonce per week)30.
The combination of these four factors (annual probability, source location, sea levelrise, tide and surge) generates 36 different tsunami events (Table 1).
Numerical simulation of tsunami generation, propagation and inundation usingComMIT and MOST. The numerical simulation of the tsunami scenarios wasundertaken using the MOST (Method for Splitting Tsunamis) model12, accessedthrough the ComMIT (Community Model Interface for Tsunamis) platform31–35.MOST simulates earthquake-generated tsunamis via integrating the nonlinearshallow-water equations in a three-step process that includes tsunami generation,transoceanic propagation, and inland inundation. Input data include: (a) the amountand distribution of the sea-floor dislocation induced by a seismic event; (b) off-shorelow-resolution bathymetry for the propagation phase; (c) a set of three high-resolution nested Digital Elevation Models (DEM) containing bathymetry andtopography for use during the inundation phase (i.e. grid A, B and C). These havespatial resolutions increasing from the outer ‘‘Grid A’’ (32.4 arc-second), to themiddle ‘‘Grid B’’ (3.6 arc-second), to the inner ‘‘Grid C’’ (0.4 arc-second), enabling themodel to fully resolve the incoming wave at the nest-grid boundaries. The easternboundary of Grid A extends off the shelf to 5,149 m depth to ensure accurateboundary conditions are transferred from the propagation phase.
While the open ocean bathymetric data required for the propagation are availablethrough the ComMIT platform, the nested DEMs for the inundation must bemanually entered. In this study, Grid A was obtained from the 9 arc-second(,260 m) national bathymetric grid created by Geoscience Australia. Grids B and Cwere obtained from a topo-bathymetric ‘‘bare-earth’’ DEM of the study area,developed by McInnes et al.13 by merging LiDAR data, multi-beam and echosounding surveys. The extent of the innermost grid is shown in Figure 1b, and has aspatial resolution of 10 m and a vertical accuracy ranging between 0.15 and 0.25 m.
The ComMIT initial conditions include the location and the number of the sourcefault planes triggering the tsunami, the magnitude of the earthquake and a set ofmodel parameters (e.g. time step, friction coefficient). In order to identify the initialconditions capable of triggering tsunamis with the selected annual probabilities (i.e. 1/100, 1/1,000 and 1/10,000), we ran tests adjusting the earthquake magnitude and thenumber of fault planes to meet the offshore wave amplitude condition estimated byBurbidge et al.1 for the NSW coast (Table 2). The initial conditions we used are shownin Table 3. In regards to friction during the inundation phase, overland flow velocitiesare limited by a Manning coefficient of 0.03, based on surface roughness typical of the"bare-earth" DEM used in this study36.
Notwithstanding the limitations associated with 2D tsunami numerical models22,MOST and ComMIT have been extensively benchmarked37, and, as MOST is in use
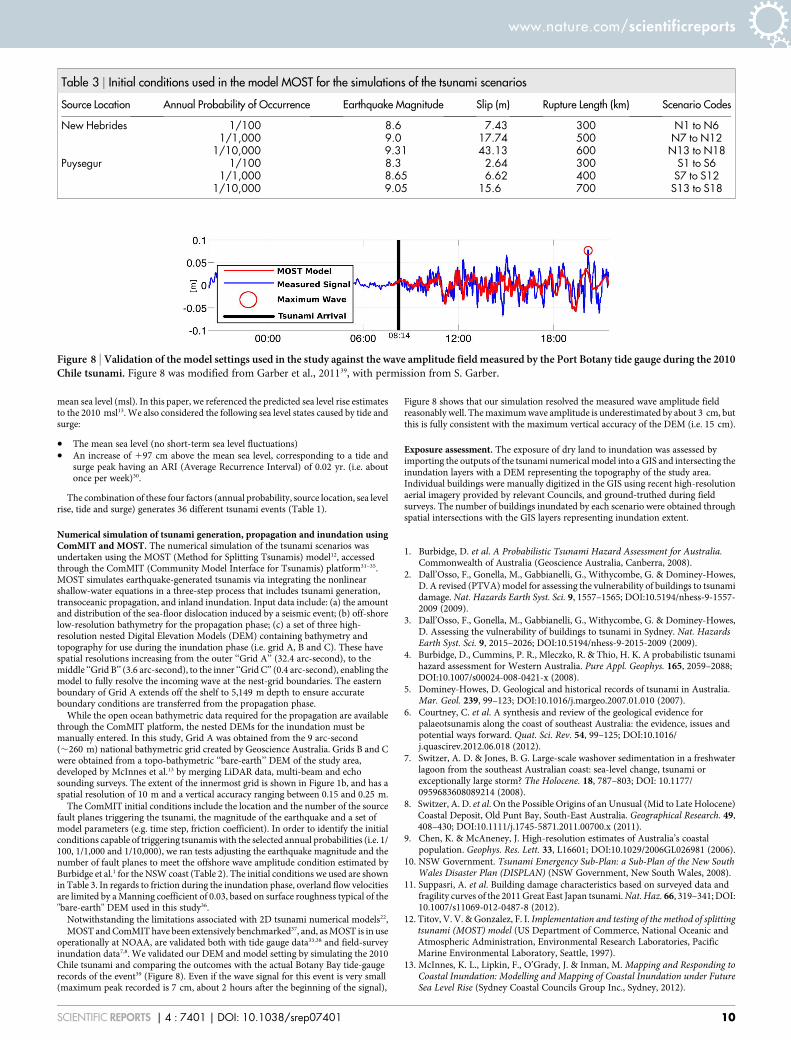
operationally at NOAA, are validated both with tide gauge data33,38 and field-surveyinundation data7,8. We validated our DEM and model setting by simulating the 2010Chile tsunami and comparing the outcomes with the actual Botany Bay tide-gaugerecords of the event39 (Figure 8). Even if the wave signal for this event is very small(maximum peak recorded is 7 cm, about 2 hours after the beginning of the signal),
Figure 8 shows that our simulation resolved the measured wave amplitude fieldreasonably well. The maximum wave amplitude is underestimated by about 3 cm, butthis is fully consistent with the maximum vertical accuracy of the DEM (i.e. 15 cm).
Exposure assessment. The exposure of dry land to inundation was assessed byimporting the outputs of the tsunami numerical model into a GIS and intersecting theinundation layers with a DEM representing the topography of the study area.Individual buildings were manually digitized in the GIS using recent high-resolutionaerial imagery provided by relevant Councils, and ground-truthed during fieldsurveys. The number of buildings inundated by each scenario were obtained throughspatial intersections with the GIS layers representing inundation extent.
1. Burbidge, D. et al. A Probabilistic Tsunami Hazard Assessment for Australia.Commonwealth of Australia (Geoscience Australia, Canberra, 2008).
2. Dall’Osso, F., Gonella, M., Gabbianelli, G., Withycombe, G. & Dominey-Howes,D. A revised (PTVA) model for assessing the vulnerability of buildings to tsunamidamage. Nat. Hazards Earth Syst. Sci. 9, 1557–1565; DOI:10.5194/nhess-9-1557-2009 (2009).
3. Dall’Osso, F., Gonella, M., Gabbianelli, G., Withycombe, G. & Dominey-Howes,D. Assessing the vulnerability of buildings to tsunami in Sydney. Nat. HazardsEarth Syst. Sci. 9, 2015–2026; DOI:10.5194/nhess-9-2015-2009 (2009).
4. Burbidge, D., Cummins, P. R., Mleczko, R. & Thio, H. K. A probabilistic tsunamihazard assessment for Western Australia. Pure Appl. Geophys. 165, 2059–2088;DOI:10.1007/s00024-008-0421-x (2008).
5. Dominey-Howes, D. Geological and historical records of tsunami in Australia.Mar. Geol. 239, 99–123; DOI:10.1016/j.margeo.2007.01.010 (2007).
6. Courtney, C. et al. A synthesis and review of the geological evidence forpalaeotsunamis along the coast of southeast Australia: the evidence, issues andpotential ways forward. Quat. Sci. Rev. 54, 99–125; DOI:10.1016/j.quascirev.2012.06.018 (2012).
7. Switzer, A. D. & Jones, B. G. Large-scale washover sedimentation in a freshwaterlagoon from the southeast Australian coast: sea-level change, tsunami orexceptionally large storm? The Holocene. 18, 787–803; DOI: 10.1177/0959683608089214 (2008).
8. Switzer, A. D. et al. On the Possible Origins of an Unusual (Mid to Late Holocene)Coastal Deposit, Old Punt Bay, South-East Australia. Geographical Research. 49,408–430; DOI:10.1111/j.1745-5871.2011.00700.x (2011).
9. Chen, K. & McAneney, J. High-resolution estimates of Australia’s coastalpopulation. Geophys. Res. Lett. 33, L16601; DOI:10.1029/2006GL026981 (2006).
10. NSW Government. Tsunami Emergency Sub-Plan: a Sub-Plan of the New SouthWales Disaster Plan (DISPLAN) (NSW Government, New South Wales, 2008).
11. Suppasri, A. et al. Building damage characteristics based on surveyed data andfragility curves of the 2011 Great East Japan tsunami. Nat. Haz. 66, 319–341; DOI:10.1007/s11069-012-0487-8 (2012).
12. Titov, V. V. & Gonzalez, F. I. Implementation and testing of the method of splittingtsunami (MOST) model (US Department of Commerce, National Oceanic andAtmospheric Administration, Environmental Research Laboratories, PacificMarine Environmental Laboratory, Seattle, 1997).
13. McInnes, K. L., Lipkin, F., O’Grady, J. & Inman, M. Mapping and Responding toCoastal Inundation: Modelling and Mapping of Coastal Inundation under FutureSea Level Rise (Sydney Coastal Councils Group Inc., Sydney, 2012).
Table 3 | Initial conditions used in the model MOST for the simulations of the tsunami scenarios
Source Location Annual Probability of Occurrence Earthquake Magnitude Slip (m) Rupture Length (km) Scenario Codes
New Hebrides 1/100 8.6 7.43 300 N1 to N61/1,000 9.0 17.74 500 N7 to N12
1/10,000 9.31 43.13 600 N13 to N18Puysegur 1/100 8.3 2.64 300 S1 to S6
1/1,000 8.65 6.62 400 S7 to S121/10,000 9.05 15.6 700 S13 to S18
Figure 8 | Validation of the model settings used in the study against the wave amplitude field measured by the Port Botany tide gauge during the 2010Chile tsunami. Figure 8 was modified from Garber et al., 201139, with permission from S. Garber.
www.nature.com/scientificreports
SCIENTIFIC REPORTS | 4 : 7401 | DOI: 10.1038/srep07401 10
14. Booij, N., Ris, R. C. & Holthuijsen, L. H. A third generation wave model for coastalregions. J. Geophys. Res. 14, 7649–7666; DOI:10.1029/98JC02622 (1999).
15. McInnes, K. L., Hubbert, G. D., Abbs, D. J. & Oliver, E. S. A numerical modellingstudy of coastal flooding. Meteorol. Atmos. Phys. 80, 217–233; DOI:10.1007/s007030200027 (2002).
16. Oey, L. Y. & Wang, D. P. Modeling Waves and Currents Produced by HurricanesKatrina, Rita, and Wilma (U.S. Department of the Interior, MineralsManagement Service, Gulf of Mexico OCS Region, New Orleans, 2009).
17. Fritz, H. M. et al. The 2011 Japan tsunami current velocity measurements fromsurvivor videos at Kesennuma Bay using LiDAR. Geophys. Res. Lett. 39, L00G23;DOI:10.1029/2011GL050686 (2012).
18. Nadal, N. C., Zapata, R. E., Pagan, I., Lopez, R. & Agudelo, J. Building damage dueto riverine and coastal floods. J. Water Resour. Plann. Manage. 136, 327–336;DOI:10.1061/(ASCE)WR.1943-5452.0000036 (2010).
19. Clarke, S. et al. [Submarine landslides on the upper southeast Australian passivecontinental margin - preliminary findings] Submarine Mass Movements andTheir Consequences: 5th International Symposium [Yamada Y. et al (eds.)](Springer Science & Business Media, London, 2012).
20. Synolakis, C. E., Bernard, E. N., Titov, V. V., Kanoglu, U. & Gonzalez, F. I.[Standards, criteria, and procedures for NOAA evaluation of tsunami numericalmodels] NOAA Tech. Memo. OAR PMEL-135 [NOAA/Pacific MarineEnvironmental Laboratory] (Seattle, 2007).
21. Wei, Y., Chamberlin, C., Titov, V., Tang, L. & Bernard, E. N. Modeling of the 2011Japan tsunami - Lessons for near-field forecast. Pure Appl. Geophys. 170,1309–1331; DOI: 10.1007/s00024-012-0519-z (2013).
22. Saito, T. & Furumura, T. Three-dimensional simulation of tsunami generationand propagation: Application to intraplate events. J. Geophys. Res. 114, B02307,DOI:10.1029/2007JB005523 (2009).
23. Commonwealth of Australia. Climate Change Risks to Coastal Buildings andInfrastructure: A Supplement to the First Pass National Assessment (Departmentof Climate Change and Energy Efficiency, Canberra, 2011).
24. Anthony, D. J., Harvey, M. D., Laronne, J. B. & Mosley, P. ApplyingGeomorphology to Environmental Management (Water Resources PublicationsLLC., Highlands Ranch, Colorado, 2001).
25. Albani, A. D. & Cotis, G. Port Hacking: Past and Present (New South WalesDepartment of Environment and Climate Change, Sydney, 2007).
26. Cummings. et al. Climate Change Adaptation Guidelines in Coastal Managementand Planning (Engineers Media, Crows Nest, NSW, Australia, 2012).
27. State of NSW and Department of Environment, Climate Change and Water NSW.Derivation of the NSW Government’s Sea Level Rise Planning Benchmarks,Technical Note (Department Environment, Climate Change and Water NSW,Sydney South, 2009).
28. IPCC. Climate Change 2007: The Physical Science Basis. Contribution of WorkingGroup I to the Fourth Assessment Report of the Intergovernmental Panel onClimate Change (Cambridge University Press, Cambridge, United Kingdom,2007).
29. McInnes, K. et al. Projected Changes in Climatological Forcing for Coastal Erosionin NSW (Commonwealth Scientific and Industrial Research Organisation,Australia, 2007).
30. State of NSW and Department of Environment, Climate Change and Water NSW.Coastal Risk Management Guide: Incorporating Sea Level Rise Benchmarks inCoastal Risk Assessments (Department Environment, Climate Change and WaterNSW, Sydney South, 2010).
31. Titov, V. V. et al. Real-time tsunami forecasting: challenges and solutions. Nat.Haz. 35, 41–58; DOI:10.1007/s11069-004-2403-3 (2005).
32. Titov, V. V. et al. A new tool for inundation modeling: Community ModelInterface for Tsunamis (ComMIT). Pure Appl. Geophys. 168, 2121–2131;DOI:10.1007/s00024-011-0292-4 (2011).
33. Wei, Y. et al. Real- time experimental forecast of the Peruvian tsunami of August2007 for U.S. coastlines. Geophys. Res. Lett. 35, L04609; DOI:10.1029/2007GL03225 (2008).
34. Titov, V. V. [Tsunami Forecasting] The Sea [371–400] (Harvard University Press,Cambridge, 2009).
35. Tang, L., Titov, V. V. & Chamberlein, C. D. Development, testing, andapplications of site-specific tsunami inundation models for real-time forecasting.J. Geophys. Res. 114, C12025; DOI:10.1029/2009JC005476 (2009).
36. Arcement, Jr, G. J. & Schneider, V. R. Guide for Selecting Manning’s RoughnessCoefficients for Natural Channels and Flood Plains (United States GeologicalSurvey, United States, 1984).
37. Synolakis, C. E., Bernard, E. N., Titov, V. V., Kanoglu, U. & Gonzalez, F. I.Validation and verification of tsunami numerical models. Pure Appl. Geophys.165, 2197–2228; DOI:10.1007/s00024-004-0427-y (2008).
38. Tang, L. et al. Direct energy estimation of the 2011 Japan tsunami using deep-ocean pressure measurements. J. Geophys. Res. 117, C08008; DOI:10.1029/2011JC007635 (2012).
39. Garber, S., Treloar, D., Beadle, C., Hanslow, D. & Opper, S. Validation of tsunamimodelling along the NSW coast. Paper presented at the 20th NSW CoastalConference, Tweed Heads, NSW, Australia. Coffs Harbour, NSW 2450: the NSWCoastal Conference Managers (1 November 2011).
AcknowledgmentsWe thank the NSW Natural Disaster Resilience Program for funding to support this work.We thank Mark Edwards and David Burbidge from Geoscience Australia for providingsupport and access to data. We thank 14 people who participated as members of anAdvisory Committee to guide and inform our work. This work was partially supported bythe NOAA Pacific Marine Environmental Laboratory (PMEL) and represents contributionno. 4200.
Author contributionsF.D. undertook the research, wrote the main manuscript text and prepared all figures andtables. D.D.H. supervised the research work and the writing of the manuscript. C.M.provided significant support with the tsunami numerical simulations. S.S. managed theresearch project. G.W. provided guidance and access to data. All authors reviewed themanuscript.
Additional informationCompeting financial interests: The authors declare no competing financial interests.
How to cite this article: Dall’Osso, F., Dominey-Howes, D., Moore, C., Summerhayes, S. &Withycombe, G. The exposure of Sydney (Australia) to earthquake-generated tsunamis,storms and sea level rise: a probabilistic multi-hazard approach. Sci. Rep. 4, 7401;DOI:10.1038/srep07401 (2014).
This work is licensed under a Creative Commons Attribution 4.0 InternationalLicense. The images or other third party material in this article are included in thearticle’s Creative Commons license, unless indicated otherwise in the credit line; ifthe material is not included under the Creative Commons license, users will needto obtain permission from the license holder in order to reproduce the material. Toview a copy of this license, visit http://creativecommons.org/licenses/by/4.0/
www.nature.com/scientificreports
SCIENTIFIC REPORTS | 4 : 7401 | DOI: 10.1038/srep07401 11