![ELECTRICAL SYLLABUS [NEW] - SCTEVT Odisha](https://static.fdokumen.com/doc/165x107/6317192cf68b807f88038180/electrical-syllabus-new-sctevt-odisha.jpg)
Disaster Vulnerability of Indian Coastal States-Cyclonic Storms and Odisha Coast Cyclonic Storms and...
10
Disaster Vulnerability of Indian Coastal States- Cyclonic Storms and Odisha Coast Page 1 of 10 | Dipankar C.Patnaik Cyclonic Storms and Odisha Coast Dipankar C. Patnaik and Dr. N. Sivagnanam Department of Geography, University of Madras, Chepauk Campus, Chennai- 600 005 E-Mail: [email protected] & [email protected] Abstract The state of Orissa on the east coast of India is called the disaster gateway as it is one of the most vulnerable states in the country with a very high probability of cyclonic hits. The present research analysed that the country has had a series of studies on the mathematical modelling of the cyclonic surges or social analysis of the human apathy. However, there are not many cases where a combination of technology and humanistic approach being tested. The research intends to bridge the gap between the technique and the need. The mix of social mapping and spatial analysis is seldom tried with an outcome poised to aid the community in being more aware and informed thereby leading to sustainable disaster risk reduction and resilience. Over the past decade, a range of agencies of disaster management have invested resources into developing geospatial (GIS) databases to support their risk management decision making. Similarly, recent work has attempted to develop physical models of the hazard phenomenon including hydraulic flood models, landslide probability models and earthquake probability models to name only a few. Most of these models generate results that are spatially explicit (mapped). Little work has been done to link the models with the GIS databases such as road networks, building locations and key utility databases in a decision support framework. Such initiatives can be brought into an integrated in GIS decision support system. The paper sets the premise about the coastal geography of the Odisha coast and also outlines the potential reasons for the heightened vulnerability of the Odisha Coast. Keywords: Cyclone, Tropical Monsoons, Coastal Activities, Vulnerability, Risk Cyclones: Genesis and the structure Cyclonic storms visit tropical areas every year and cause havoc to people either by destroying the properties or livelihood (temporarily or permanently) or by upsetting the normal life and economy. The origin of the tropical cyclone is invariably in the large seas or oceans. Even though rare occurrences of cyclonic storms have been witnessed in large river valleys and interior areas, the cyclone’s veracity is found always along the coastal areas than in the interior areas. When a large cold air mass is located above an organised cluster of tropical warm air mass over the sea or oceans, an unstable atmospheric condition prevails. This condition triggers up draft and down draft of the tropical wave. This instability increases the likelihood of convection, which leads to strong updrafts that lifts the air and moisture upwards, creating an environment favourable for the development of high towering clouds. A tropical disturbance is born when this moving mass of water maintains its identity for a period of 24 hours or more. This is the first stage of a developing tropical storm otherwise called a cyclone. The figure 1.1 shows that the surface convergence (are indicated by small horizontal arrows in the figure), causes raising motion around the surface cyclone (labelled as “L” in Fig 1.2). The air cools as it rises (shown by vertical arrows) and condensation occurs. The condensation of water vapour to liquid water releases the latent heat of the condensation into the atmosphere. This heating causes the air to expand, forcing the air to diverge at the upper levels (shown by horizontal arrows at the cloud tops). Since pressure is the measure of weight of the air above an area, removal of air at the upper levels subsequently reduces pressure at the surface. A further reduction in the surface pressure leads to increasing convergence due to a higher pressure gradient, which further intensifies the raising motion, latent heat release. Fig.1.1: First stage of developing cyclone Source: (Nelson)
-
Upload
independent -
Category
Documents
-
view
2 -
download
0
Transcript of Disaster Vulnerability of Indian Coastal States-Cyclonic Storms and Odisha Coast Cyclonic Storms and...
Disaster Vulnerability of Indian Coastal States- Cyclonic Storms and Odisha Coast
Page 1 of 10 | Dipankar C.Patnaik
Cyclonic Storms and Odisha Coast
Dipankar C. Patnaik and Dr. N. Sivagnanam
Department of Geography, University of Madras, Chepauk Campus, Chennai- 600 005
E-Mail: [email protected] & [email protected]
Abstract
The state of Orissa on the east coast of India is called the disaster gateway as it is one of the most vulnerable
states in the country with a very high probability of cyclonic hits. The present research analysed that the country
has had a series of studies on the mathematical modelling of the cyclonic surges or social analysis of the human
apathy. However, there are not many cases where a combination of technology and humanistic approach being
tested. The research intends to bridge the gap between the technique and the need. The mix of social mapping
and spatial analysis is seldom tried with an outcome poised to aid the community in being more aware and
informed thereby leading to sustainable disaster risk reduction and resilience.
Over the past decade, a range of agencies of disaster management have invested resources into developing
geospatial (GIS) databases to support their risk management decision making. Similarly, recent work has
attempted to develop physical models of the hazard phenomenon including hydraulic flood models, landslide
probability models and earthquake probability models to name only a few. Most of these models generate results
that are spatially explicit (mapped). Little work has been done to link the models with the GIS databases such as
road networks, building locations and key utility databases in a decision support framework. Such initiatives can
be brought into an integrated in GIS decision support system. The paper sets the premise about the coastal
geography of the Odisha coast and also outlines the potential reasons for the heightened vulnerability of the
Odisha Coast.
Keywords: Cyclone, Tropical Monsoons, Coastal Activities, Vulnerability, Risk
Cyclones: Genesis and the structure
Cyclonic storms visit tropical areas every year and cause havoc to people either by destroying the properties or
livelihood (temporarily or permanently) or by upsetting the normal life and economy. The origin of the tropical
cyclone is invariably in the large seas or oceans. Even though rare occurrences of cyclonic storms have been
witnessed in large river valleys and interior areas, the cyclone’s veracity is found always along the coastal areas
than in the interior areas. When a large cold air mass is located above an organised cluster of tropical warm air
mass over the sea or oceans, an unstable atmospheric condition prevails. This condition triggers up draft and
down draft of the tropical wave. This instability increases the likelihood of convection, which leads to strong
updrafts that lifts the air and moisture upwards, creating an environment favourable for the development of high
towering clouds. A tropical disturbance is born when this moving mass of water maintains its identity for a
period of 24 hours or more. This is the first stage of a developing tropical storm otherwise called a cyclone.
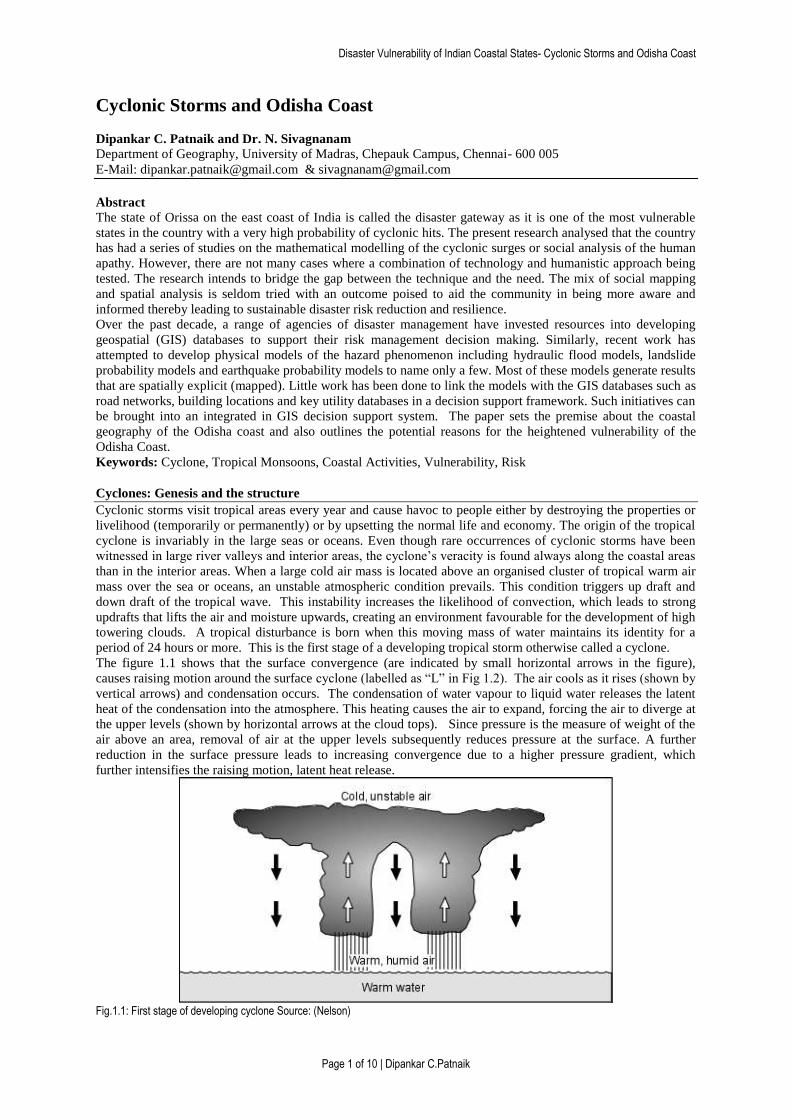
The figure 1.1 shows that the surface convergence (are indicated by small horizontal arrows in the figure),
causes raising motion around the surface cyclone (labelled as “L” in Fig 1.2). The air cools as it rises (shown by
vertical arrows) and condensation occurs. The condensation of water vapour to liquid water releases the latent
heat of the condensation into the atmosphere. This heating causes the air to expand, forcing the air to diverge at
the upper levels (shown by horizontal arrows at the cloud tops). Since pressure is the measure of weight of the
air above an area, removal of air at the upper levels subsequently reduces pressure at the surface. A further
reduction in the surface pressure leads to increasing convergence due to a higher pressure gradient, which
further intensifies the raising motion, latent heat release.
Fig.1.1: First stage of developing cyclone Source: (Nelson)

Disaster Vulnerability of Indian Coastal States- Cyclonic Storms and Odisha Coast
Page 2 of 10 | Dipankar C.Patnaik
Fig.1.2: Second stage of developing cyclone Source: (Nelson)
Fig 1.3 : Typical Areas where cyclones form and typical travel paths with Annual percentage of Cyclones in each region Source: (Abbott, 1996)
The birth of all tropical storms begins with intensifying of low pressure centre (consequent of heating/ warming
focused at certain areas) over the oceans/ seas. When the gradient of air pressure increases; the low pressure
transforms to depression; depressions to deep depression to cyclonic storms. However, this system is not always
manifested in a similar fashion. When the warming of the oceans along the global factors like El nino or
southern oscillations is active, the possibility is stronger for fast transformation from low pressure systems to
cyclonic storms (even jumping from lower stage to higher stage). Cyclonic formation is also related to the
teleconnectivity happening elsewhere in the globe and in the upper atmosphere. When cyclonic circulation
begins around the central low pressure areas, and wind speed reach 65 kmph the disturbance is considered a
tropical storm and is given a name. When wind speed reaches 119 kmph. It becomes a cyclone.
Fig 1.4 Anatomy of tropical cyclones (Encyclopedia Britannica, 2005)

Disaster Vulnerability of Indian Coastal States- Cyclonic Storms and Odisha Coast
Page 3 of 10 | Dipankar C.Patnaik
The favourable environmental conditions for the formation of tropical cyclones are:
a) Warm ocean waters of at least 26.5°C [80°F] throughout the upper 50m of the tropical ocean must be
present. The heat in these warm waters is necessary to fuel the tropical cyclone.
b) The atmosphere must cool fast enough with height, such that it is potentially unstable to moist
convection. It is the thunderstorm activity which allows the heat stored in ocean waters to be liberated
and used for tropical cyclone development.
c) The mid-troposphere (5Km altitude), retains enough moisture to sustain the thunderstorm. Dry mid-
levels are not conductive to the continuing development of widespread thunderstorm activity.
d) The disturbance must occur at a minimum distance of at least 500Km from the equator. For tropical
cyclonic storms to occur there is a requirement that the Coriolis force must be present. Since Coriolis
effect is zero near the equator and increases to the north and south of the equator, 500 Km (or beyond
5° N or S° of the equator) is considerable distance for the impact of Coriolis force with which the low
pressure of the disturbance can be maintained (John Hidore, Oct. 2009)
e) There must be pre-existing near-surface disturbance that shows convergence of moist air and is
beginning to rotate. Tropical cyclones cannot be generated spontaneously. They require a weakly
organised system that begins to spin and has low level in flow to moist air.
f) There must be low values (less than about 10mph of vertical wind shear between the surface and the
upper troposphere. Vertical wind sheet is the rate of change of wind velocity with altitude. Large
values of vertical wind sheet disrupt the incipient tropical cyclone by removing the raising moist air too
quickly, preventing the development of the tropical cyclone. Or, if a tropical cyclone has already
formed, large vertical sheer can weaken or destroy it by interfering with the organization around the
cyclone centre.
The tropical cyclones and Types
Tropical cyclones are non- frontal synoptic scale weather system originating over tropical waters with organised
convention and definite cyclonic surface wind circulation. Tropical Cyclones (TC) are the term used globally to
cover tropical weather systems in which wind equals or exceed ‘gale force’ (minimum of 34 Knot , i.e., 62
kmph). The phenomenon is called by different names in different parts of the world. In the Atlantic Ocean and
in the Eastern Pacific ocean they are called as hurricanes, in the Western Pacific they are called as typhoons,
and in the southern hemisphere they are called cyclones. Tropical cyclones are dangerous due to their high
winds, the storm surge caused as they approach coast, and severe thunder storms associated with them.
It should be noted that coastal areas are not the only areas affected by cyclonic damage. Although cyclone loose
strength as they move over land, they still carry vast amount of moisture onto the land causing thunder storm
with associated flash floods and mass-wasting hazards.
As they move across the oceans, their paths are steered by the presence of existing low and high pressure
systems, as well as the Coriolis force. The Coriolis force eventually start turning to the right in the northern
hemisphere and to the left in the Southern hemisphere about 12% of all tropical cyclones develop in Atlantic
Ocean. Those that begin to form near the coast of Africa are often referred to as “Capre Verde” hurricanes,
because the area in which they develop is near the Cape Verde Islands. About 15% of all tropical cyclones
develop in the Western Pacific Ocean, about 24% in the Indian Ocean, both north and south of the equator and
another 12% develop in the Southern Pacific Ocean. It is notable that essentially no tropical cyclones develop
south of the Equator in Atlantic Ocean, although one occurred off the coast of Brazil in March of 2004 (Abbott,
1996)
Technically cyclones are classified according to their wind speed. The classification, however, varies from
region to region (Technical Document, 2007). The table 1.1 shows the classification of the tropical disturbances
by the Indian Meteorological Department. In India, the low pressure areas starts with wind speeds less than 31
Kmph and runs along till 49 Kmph when it is termed a depression. Severe cyclones occur when the wind speed
reaches 119-221 kmph and super cyclone when the wind speed is more than 222 Kmph.
Type Wind Speed in Kmph Wind Speed in knots
Low pressure area Less than 31 Less than 17
Depression 31-49 17-27
Deep depression 50-61 28-33
Cyclonic storm 62-88 34-47
Severe cyclonic storm 89-118 48-63
Very severe cyclonic storm 119-221 64-119
Super cyclone 222 or more 20 or more
Table 1.1: Indian Classifications of Cyclonic Disturbances in the North Indian Ocean (Bay of Bengal and Arabian Sea) Source: India Meteorological Department, 1999.

Disaster Vulnerability of Indian Coastal States- Cyclonic Storms and Odisha Coast
Page 4 of 10 | Dipankar C.Patnaik
Frequency, Occurrence and Impact
It is generally accepted that, all over the world, property damage from tropical cyclones have increased over the
years. But deaths due to cyclones has decreased due to advanced methods of forecasting and establishment of
early warning system, the economic damage from these have increased when development takes place more and
more along the coast line (Raghavan S, 2003). There is common perception in media, and even in government
and management circles, that this is due to the increase in the tropical cyclone frequency and also in the
intensity due to the global climatic change (Raghavan S, 2003). (Mooley, 1983) found an (apparent) increase in
cyclones in 1965–80, compared to earlier decades, and attributed it to better detection by satellites. This points
to the need for separating apparent trends created by better observing techniques or even by changes in
definitions of tropical cyclones, from real trends (Nicholls, 1998). (Jayanthi, 1997) found large decadal
variations in the frequency of NIO basin cyclones with a maximum in 1921–30 and a minimum in 1981– 90, but
did not report any long-term trend. (Joseph, 1999) found a 40-yr periodicity in the frequency of TCs in the North
Indian Ocean basin with maxima around 1930 and 1970 and minima round 1950 and 1990. They also reported a
decreasing trend in monsoon depressions but none in pre- and post monsoon systems.
The east coast of India experiences regular cyclones in the months of September – October and occasionally
during March-April. The map 1.1 shows the significant cyclone tracks hitting the state of Orissa. Some cyclones
are also known to dissipate and re-enter the seas only to recurve and hit back the coast with added ferocity and
speeds. Over the past decades the frequency of tropical cyclones in the north Indian ocean has registered
significant increasing trends (20% per hundred years) during November and May which account for maximum
number of intense cyclones (Singh, 2000). Strangely there has not been a single major cyclone affecting the
Orissa Coast after the 1999 super cyclone which is a clear indication of the randomness of the occurrences of the
cyclones.
(De, 1995) (De U.S. & Joshi, 1998) have used the data set of tropical disturbances including tropical storm for
the period 1891 to 1990 over the Bay of Bengal and the Arabian Sea. Their analysis has shown that number of
such disturbances varied from one decade to another. The maximum number of tropical disturbances (163)
occurred during the decade 1941- 50 and minimum number occurred in 1911-1920. The last decade of the past
century had only 85 disturbances. The number of Cyclonic Storm (CS) was highest (47) during the decade
1921-30 while the number of Severe Cyclonic Storm (SCS) was highest (41) during 1971-80. Their numbers
were smallest in the decade 1981-90 being 14 and 18 in the decade 1941-50 respectively. The decade 1991-2000
showed a decrease in the number of T.C. storm and MDs forming in this region. The number of TCs was 42 and
that of MDs was 43 during the decade only as against a Long Term Average of 6 and 13 per year respectively.
The damage and destruction from such systems do not seem to decrease. Loss of life however, tend to show a
fall as a consequence of better weather forecasts and warnings, their dissemination and disaster management
strategies put in place by the National Weather Services world over in conjunction with the significant role
played by the WMO through its Regional Meteorological Centres (RMCs) specially dealing with Tropical
Cyclones. The Tropical Cyclone of 1970 in the Bay of Bengal killed about 2 lakh people while a similar cyclone
in 1991 showed a marked decrease in number of deaths
Cyclone and Storm Surges
Storm surge, which is a coastal phenomenon, is the inherent catastrophic feature of cyclones world over. When
a cyclone reaches the coast and begins to travel over land, it is called land fall. A storm surge is a rise in the
ocean as the result of strong winds from a cyclone or other intense storm. This flooding can be most dangerous
part of the cyclone, potentially causing many deaths. The height of the storm surge is the difference between the
level of the ocean and the level that would have occurred normally. A Storm surge is usually estimated by
subtracting the regular high tide level from the observed storm. The ocean water crashes onto the land in a
powerful surge. The storm surge combined with heavy rains that comes along with cyclones can cause
dangerous flooding in low-lying coastal areas, especially when a storm surges combines with high tide.
The degree of disaster potential depends on the storm surge amplitude associated with the cyclone at the time of
land fall, characteristics of the coast, phases of the tide and vulnerability of the area and community. The
world’s highest record of storm tide was about 12.5m m (about 41 ft) and it was associated with the Backergunj
cyclone in 1876 near the Meghna estuary in present-day Bangladesh. A storm tide of closer magnitude (12.1 m)
was also observed in West Bengal at the mouth of the Hooghly River in association with a severe cyclone in
October 1737.
Cyclonic storms in India
India is one of the most disaster prone countries in the world due to its geo climatic conditions [Note]. Cyclones
in India generally strike the East Coast; some of the Arabian Sea Cyclones strike the west coast of India as well
mainly the Gujarat and North Maharashtra coast. Out of the storms that develop in the Bay of Bengal, over 58
percent approach or cross the east coast in October and November. India has a very long coastline of 8041 km,
large parts of which are vulnerable to cyclone. On an average, one or four cyclones or deep depressions hit
Disaster Vulnerability of Indian Coastal States- Cyclonic Storms and Odisha Coast
Page 5 of 10 | Dipankar C.Patnaik
eastern coast of India. As a general rule, the depressions and cyclones face a death soon after they hit a river
mouth along the east coast. Therefore, the river mouths, be it small or large are known for cyclone prone areas.
Cuddalore region of Tamil Nadu, Godavari mouth of Andhra Pradesh, entire coast of Orissa and the mouth of
Padma (Indus –Ganges) of Bangladesh are known for large number of hits of cyclones and resultant storm surge
havoc.
Cyclones are characterised by their destructive potential to damage structures such as houses, lifeline
infrastructures such as power and communication towers, hospitals, food storages, roads, bridges, culverts, crops
etc., due to high velocity of winds. Exceptionally moderate to heavy rainfall causes flooding due to the low
elevation difference existing in the coastal areas. About 2-5 metres profile rise is the common feature of the
coastal lands. However, there are coastal ridges found along the coast which are elevated bars bordering old
coastal plains (which are lower in elevation). The sand bars/ ridges are safe locations during inland flooding
from the river but in times of storm surges tend to aggravate the woes of the communities inland due to the no
egress options to the surge waters. Storm surge inundates low-lying areas in the coastal areas resulting in loss of
life and destruction of property, besides eroding beaches and embankments, destroying vegetation and reducing
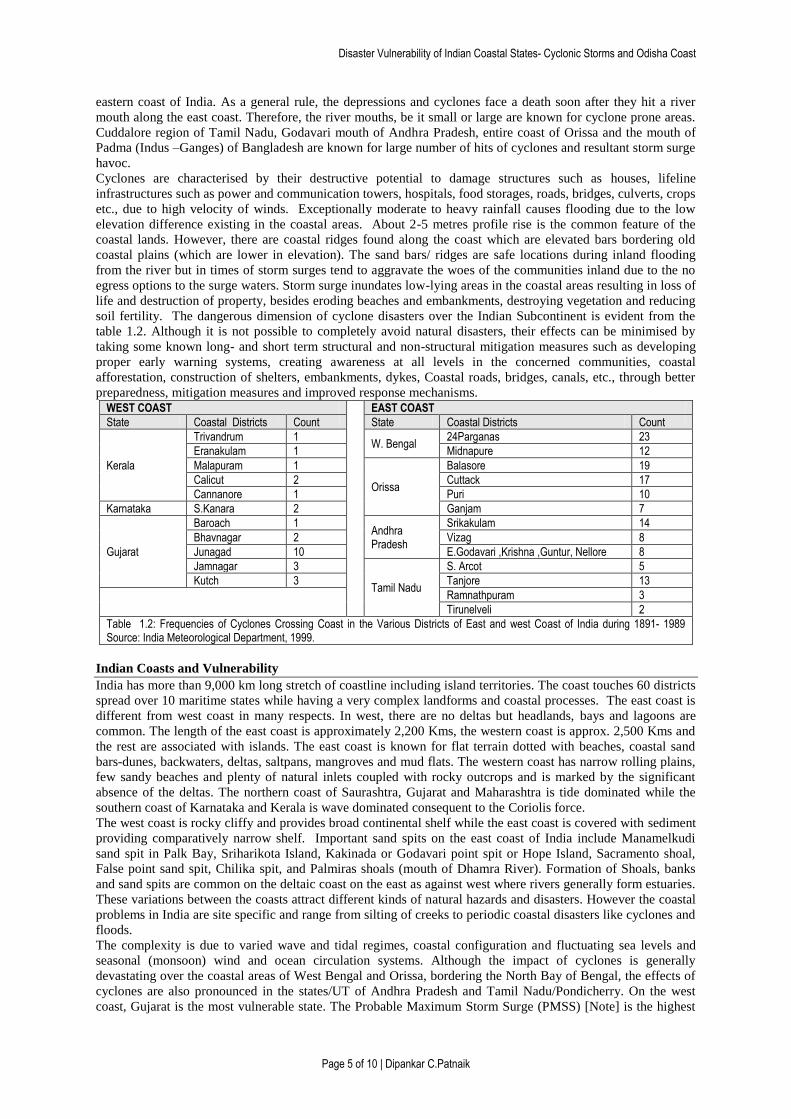
soil fertility. The dangerous dimension of cyclone disasters over the Indian Subcontinent is evident from the
table 1.2. Although it is not possible to completely avoid natural disasters, their effects can be minimised by
taking some known long- and short term structural and non-structural mitigation measures such as developing
proper early warning systems, creating awareness at all levels in the concerned communities, coastal
afforestation, construction of shelters, embankments, dykes, Coastal roads, bridges, canals, etc., through better
preparedness, mitigation measures and improved response mechanisms.
WEST COAST EAST COAST State Coastal Districts Count State Coastal Districts Count
Kerala
Trivandrum 1 W. Bengal
24Parganas 23
Eranakulam 1 Midnapure 12
Malapuram 1
Orissa
Balasore 19
Calicut 2 Cuttack 17
Cannanore 1 Puri 10
Karnataka S.Kanara 2 Ganjam 7
Gujarat
Baroach 1 Andhra Pradesh
Srikakulam 14
Bhavnagar 2 Vizag 8
Junagad 10 E.Godavari ,Krishna ,Guntur, Nellore 8
Jamnagar 3
Tamil Nadu
S. Arcot 5
Kutch 3 Tanjore 13
Ramnathpuram 3
Tirunelveli 2
Table 1.2: Frequencies of Cyclones Crossing Coast in the Various Districts of East and west Coast of India during 1891- 1989 Source: India Meteorological Department, 1999.
Indian Coasts and Vulnerability
India has more than 9,000 km long stretch of coastline including island territories. The coast touches 60 districts
spread over 10 maritime states while having a very complex landforms and coastal processes. The east coast is
different from west coast in many respects. In west, there are no deltas but headlands, bays and lagoons are
common. The length of the east coast is approximately 2,200 Kms, the western coast is approx. 2,500 Kms and
the rest are associated with islands. The east coast is known for flat terrain dotted with beaches, coastal sand
bars-dunes, backwaters, deltas, saltpans, mangroves and mud flats. The western coast has narrow rolling plains,
few sandy beaches and plenty of natural inlets coupled with rocky outcrops and is marked by the significant
absence of the deltas. The northern coast of Saurashtra, Gujarat and Maharashtra is tide dominated while the
southern coast of Karnataka and Kerala is wave dominated consequent to the Coriolis force.
The west coast is rocky cliffy and provides broad continental shelf while the east coast is covered with sediment
providing comparatively narrow shelf. Important sand spits on the east coast of India include Manamelkudi
sand spit in Palk Bay, Sriharikota Island, Kakinada or Godavari point spit or Hope Island, Sacramento shoal,
False point sand spit, Chilika spit, and Palmiras shoals (mouth of Dhamra River). Formation of Shoals, banks
and sand spits are common on the deltaic coast on the east as against west where rivers generally form estuaries.
These variations between the coasts attract different kinds of natural hazards and disasters. However the coastal
problems in India are site specific and range from silting of creeks to periodic coastal disasters like cyclones and
floods.
The complexity is due to varied wave and tidal regimes, coastal configuration and fluctuating sea levels and
seasonal (monsoon) wind and ocean circulation systems. Although the impact of cyclones is generally
devastating over the coastal areas of West Bengal and Orissa, bordering the North Bay of Bengal, the effects of
cyclones are also pronounced in the states/UT of Andhra Pradesh and Tamil Nadu/Pondicherry. On the west
coast, Gujarat is the most vulnerable state. The Probable Maximum Storm Surge (PMSS) [Note] is the highest

Disaster Vulnerability of Indian Coastal States- Cyclonic Storms and Odisha Coast
Page 6 of 10 | Dipankar C.Patnaik
along the West Bengal coast where it ranges from 9–12.5 m. It reduces to about3.8 m in Khurdha district of
Orissa, increasing again to about 8.2 m along the south Andhra Pradesh coast in Krishna, Guntur and Prakasam
districts. A small region in south Tamil Nadu around Nagapattinam coast also has higher PMSS of about 8.4
meter along the west coast, the PMSS varies from about 2 m near Thiruvananthapuram to around 5 near the
Gulf of Khambat in the Saurashtra region of Gujarat.
The super cyclone of October 1999 generated a wind speed of 252 kmph with an ensuing surge of 7–9m close to
Paradip in Orissa which caused unprecedented inland inundation up to 35 km from the coast. Persistent standing
water was identified in the satellite imageries even 11 days after the cyclone landfall, as it happened in the
Krishna delta in May 1990 and in several other instances. The Andhra Pradesh cyclone in 1977 (known as the
killer cyclone) which hit Diviseema also generated winds exceeding 250 km per hour. The (Vulnerability Atlas
of India, 2006) contains cyclone hazard maps for the country as a whole, depicting the vulnerability of
states/UTs to cyclones on a macro scale.
Orissa – Storm surge and Vulnerability
Orissa, an ancient land of spectacular beauty lies on the eastern side of India between 81°24’ and 87° 29’ E
longitudes and 17°48’ and 22°34’ N latitudes. It extends over an area of 1, 55,842 sq.km. Jharkhand and West
Bengal surround it on the north, Chattisgarh on the west, Andhra Pradesh on the south and Bay of Bengal on the
east. A total of 105 towns and 51,124 villages make it the eleventh most populous state in the country.
Agriculture, fisheries and trade are the main occupations of the people along the coastal districts- there are a
number of cultural (Heritage) centres and resorts located along the coast.
Cyclonic hits and storm surges
The state of Orissa has been facing the wrath of the cyclone since time immemorial and the coastal communities
are the worst affected time and again. The detailed list of the all major cyclonic hits is mentioned in the
appendix and the major cyclones of the east coast are mentioned in the table 1.3. The table shows that the Bay of
Bengal region is one of the most vulnerable areas in the world.
Sl.No Year Country Deaths 1 1737 Hooghly, West Bengal, India 3,00,000
2 1779 Machilipatnam, Andhra Pradesh, India 20,000
3 1782 Coringa, Andhra Pradesh, India 20,000
4 1787 Coringa, Andhra Pradesh, India 20,000
5 1788 The Antilles, Carribbean Islands, West Indies 22,000
6 1822 Barisal/Backergunj, Bangladesh 50,000
7 1831 Balasore, Orissa, India 22,000
8 1833 Sagar Island, West Bengal, India 30,000
9 1839 Coringa, Andhra Pradesh, India 20,000
10 1864 Machiliatnam, Andhra Pradesh, India 30,000
11 1867 Contai, West Bengal, India 50,000
12 1876 Backergunj, Bangladesh 200,000-250,000
13 1881 China 3,00,000
14 1897 Bangladesh 1,75,000
15 1942 Contai, West Bengal, India 15,000
16 1961 Bangladesh 11,468
17 1963 Bangladesh 11,520
18 1965 Bangladesh 19,229
19 1970 Bangladesh 3,00,000
20 1971 Paradip, Orissa, India 10,000
21 1977 Divi Seema, Andhra Pradesh, India 10,000
22 1991 Bangladesh 1,38,000
23 1999 South of Paradip, Orissa, India 9,893*
* Population affected 15,681,072.
Table 1.3: Major Tropical Cyclone Disasters during the past 270 years in terms of Human Loss ( with Human Deaths 10,000 or more) Source: CRC Report; HPC Report, IMD Publications.
The Physical profile of the coast
The state of Orissa has three distinct physiographic divisions
(a) The northern plateau, undulating, often intersected by hill ranges that slope down from north to south.
(b) The central river basin characterized by the presence of Mahanadi, Brahmani and Baitarani that give rise to
vast stretches of fertile agriculture fields.
(c) The Eastern Ghats extending for about 248 Kms in NE-SW direction contain some of the high peaks, which
harbour diversified taxa.

Disaster Vulnerability of Indian Coastal States- Cyclonic Storms and Odisha Coast
Page 7 of 10 | Dipankar C.Patnaik
Forests are largely controlled by rainfall and temperature conditions of the region. Forests cover nearly 37
percent of the total area of the state. Mal-distribution poses a serious problem in the case of forest resources of
Orissa. The fertile coastal plains with a dense population lack forest cover. Forests are common in the hilly
tracts of the north and north eastern parts of the state. Coastal regions have few patches of tidal forest and
seasonal weeds. The coastal areas of Orissa face extreme summers and hence are devoid of any grass lands or
tall tress prior to the cyclone season; the cyclonic winds find little resistance on the coast. Therefore, the natural
vegetation cover has no way to absorb the forces of the storm surge in the coastal lands.
Rainfall, Floods and Cyclonic storm surges
Orissa, on the eastern sea board of India, enjoys a tropical monsoon type of climate like most other parts of the
country. The south-west monsoon normally sets in between 5th June in the coastal plain, and by 1st July the
whole of the state is under the full sway of the south-west monsoon. By 15th October, the south-west monsoon
withdraws completely from Orissa. Orissa, on the eastern coast of India, is not directly influenced by south-west
monsoon branch from the Bay of Bengal like the west coast, but the annual cyclones from the Bay of Bengal
influence it and bring copious rain with two seasonal peaks, July-August and October-November. Its annual
average rainfall is about 200 cm. The winter months in all areas except Northern Orissa (December - February),
except Northern Orissa, all other parts remain almost dry. Monsoon rainfall is of highest importance as it
directly controls the crop cultivation in Orissa.
Year Max Min Total Rainfall (mm) Relative Humidity 1990 NA NA 1865.8 NA
1991 31 21 1462.2 76
1992 30 21 1344.1 69
1993 32 21 1416 75
1994 31 20 1700.2 73
1995 32 22 1471.5 75
1996 32 21 988.9 73
1997 31.1 22 1463.3 78
1998 30 22 1279.8 70
1999 32 21 1433.8 77
2000 35 18 1022.9 74
2001 33 22 1611 72
2002 34 22 1005.5 70
2003 32 21 1658.7 72
2004 32 20 1273.6 71
2005 32 20 1519.5 72
2006 NA NA 1682.7 NA
Table 1.4: Climate data for the state of Orissa- 1990-2006 Source: Directorate of Statistics and Economics
Monsoon rainfall is considered 'high' when it is above 140cm and 'low' when it is less than 120 cm as this is
barely sufficient for a good paddy harvest. Winter rainfall helps the growth of the second crop in Orissa and
hence is of importance. A total meagre rainfall of above 5 cm during the winter has been taken to be 'high' while
less than 2.5cm is 'low' in Orissa.
Orissa- Socio Economics and Vulnerability
Socio-Economic Scenario
The total population of Orissa was 36,706,920 as per the provisional results of the Census of India 2001. In
terms of population it holds the same position (eleventh) among States and Union territories as at the previous
census. The population of the State rose by 15.94% between 1991to 2001.
Population Decadal Growth 1991 - 2001 Persons Males Females
36,706,920 18,612,340 18,094,580
Persons : Males : Females :
(+) 15.94 % (+) 15.86 % (+) 16.02 %
Sex Ratio: 972 Sex Ratio: 950(0 - 6 years)
Population (0 - 6 years) Percentage of Population (0-6) to Total Population Persons Males Females
5,180,551 2,656,046 2,524,505
Persons Males Females
14.11 % 14.27 % 13.95 %
Literacy Percentage of Literates to Total population: Persons Males
20,053,785 12,118,256
Persons Males
63.61 % 75.95 %

Disaster Vulnerability of Indian Coastal States- Cyclonic Storms and Odisha Coast
Page 8 of 10 | Dipankar C.Patnaik
Females 7,935,529 Females 50.97 %
Table 1.5: Orissa – Population Statistics Source: (Census of India, Provisional Population Totals: Orissa,, 2001)
The sex ratio (i.e., the number of females per thousand males) of population was recorded as 972. Total literacy
in the State has shown significant improvement. This has risen from 49.09% in 1991 to 63.61% in the 2001
Census. More than 80% of Orissa's population lives in villages. The most thickly populated areas are the fertile
coastal tracts and the least populated areas are the Eastern Ghats. About 24% of the population is tribal - their
love for song and dance and their simple enjoyment of life and their customs and institutions are fascinating
subjects of study. The main occupation of over 80% of the people of Orissa is agriculture.
S.No Districts Area in Sq Km Population Headquarters
1 Angul 6,347 9,61,037 Angul
2 Balasore 3,706 16,96,583 Balasore
3 Bolangir 6,552 12,30,938 Bolangir
4 Boudh 4,289 3,17,622 Boudh
5 Bhadrak 2,788 11,05,834 Bhadrak
6 Bargarh 5,832 12,07,172 Bargarh
7 Cuttack 3,915 19,72,739 Cuttack
8 Deogarh 2,781 2,34,238 Deogarh
9 Ganjam 8,033 27,04,056 Chatrapur
10 Dhenkanal 4,597 9,47,870 Dhenkanal
11 Gajapati 3,056 4,54,708 Parlakhemundi
12 Jagatsinghpur 1,759 10,14,242 Jagatsinghpur
13 Jaipur 2,885 13,86,177 Panikolli
14 Jharsuguda 2,202 4,46,726 Jharsuguda
15 Keonjhar 8,336 13,37,026 Keonjhar
16 Kalahandi 8,197 11,30,903 Kalahandi
17 Koraput 8,534 10,29,986 Koraput
18 Kendrapara 2,546 11,49,501 Kendrapara
19 Khurda 2,888 15,02,014 Khurda
20 Mayurbhanj 10,410 18,84,580 Baripara
21 Malkangiri 6,115 4,21,917 Malkangiri
22 Nawarangpur 5,135 8,46,659 Nawarangpur
23 Nayagarh 3,954 7,82,647 Nayagarh
24 Nawapara 3,408 4,69,482 Nawapara
25 Puri 3,055 13,05,365 Puri
26 Kandhamal 6,004 5,46,281 Phulbani
27 Rayagada 7,585 7,13,984 Rayagada
28 Sambalpur 6,702 8,09,017 Sambalpur
29 Sundargarh 9,942 15,73,617 Sundargarh
30 Sonepur 2,284 4,76,815 Sonepur
Table 1.6: Districts wise population of Orissa – 2001 Source (Census of India, Census of India, 2001)
The important crops are rice, pulses, oilseeds, jute, sugarcane and turmeric. Forests cover about 43 percent of
the area of the state. Iron-ore, manganese ore, limestone, dolomite, chromite, non-coking coal, bauxite, graphite,
china clay, nickel ore, fire clay and mineral sands are among the important minerals of Orissa. The major
mineral based industries of the state are the Rourkela steel plant, a pig iron plant at Barbil and a ferrochrome
plant at Jaipur Road, two Ferro-manganese plants, and a Ferro-silicon plant and an aluminium smelter plant. The
power projects in the state are Rengali, Upper Kolab and Kendupatna. Besides Hirakud and Talcher, work on
the new thermal and hydel projects like Sindol, Chiplima, Duburi, Naraj, Gopalpur, Durgapur and Hirma is in
progress. Because of its mineral wealth and strategic location it attracts foreign investment in steel, aluminium,
power, refineries, and infrastructure. Orissa is also emerging as a player in the outsourcing IT (Information
Technology) and IT services industry. The total planned investment in the state is projected to be 90 billion U.S.
dollars. However, there are environmental concerns and land acquisitions for some of these projects have been
opposed by the local people.
Agriculture
Over 76 percent of the people are dependent on agriculture. Out of the gross cropped area of 87.46 lakh
hectares, 18.79 lakh hectares are irrigated. Rice, pulses, oil seeds, jute, Mesta, sugarcane, coconut and turmeric
are important crops. There are also cash crops like tea, cotton and rubber. The state contributes one-tenth of the
rice production in India. Apart from irrigation, floods, droughts, low yield per hectare and division and

Disaster Vulnerability of Indian Coastal States- Cyclonic Storms and Odisha Coast
Page 9 of 10 | Dipankar C.Patnaik
fragmentation of holidays are the most important agricultural problem of the state. Jute, gram, sesame, ragi,
mustard, rape and maize are second-ranking crops in different districts. District-wise, jute ranks second in
Cuttack and Balasore, gram in Puri and Phulbani, Maize in Mayurbhanj.
Fisheries
The state has 1,263 mechanised boats and 3,500 country crafts operating from fishing centres like Chandipur,
Chudamani, Salugaon, Kalupadgha, Pathara and Najari, where fishing jetties have been constructed. At
Gopalpur, Dhamra and Astarang all -weather fishing ports have been built. While at Paradip a large deep sea
fishing port has come up. When Paradip is fully operational it will have a fleet of 50 deep sea fishing vessels
and 500 mechanised boats. Recently, Orissa shrimp seed production centre (OSSPC) which is the only one of its
kind in the country has been started. This centre is cultivating 'Bagda' type prawn which fetches a very high
price in foreign markets.
Freshwater Fishing
Freshwater resources have been estimated to be 80,000 ponds of various sizes, 4,000 Km of river channels and
canals and 0.25 million hectares of reservoirs which are suitable for fresh water fish cultivation, for which there
is a ready local market. The catch finds a ready market either in Calcutta or in Orissa. The Kaibartas of Ganjam,
the Nolias of Puri, the Gokhas of Cuttack and the Keatas of Balasore are the principal social groups who depend
primarily on fishing. The Hirakud, Balimela, Salandi and the Bhimakurd reservoirs are the potential places for
fish culture.
Industries and Livelihood
The infrastructure for the development of industry in Orissa is available. A combination of coal, iron ore,
limestone, bauxite and a host of other minerals on the one hand and port facilities on the other are the unique
features in Orissa. In addition, the bountiful forest resources and agricultural products provide ample scope for
the development of forest-based and agro-based industries. Availability of cheap, adequate and uninterrupted
power supply is an essential prerequisite for industrialisation. In Orissa, power is generated from two sources:
thermal (non-renewable) and hydel (renewable). Hydel power is being generated from the perennial rivers like
Mahanadi at Hirakud, Brahmani at Rengali, Machkund at Balimela and Machkund waterfall and Kolab.
Thermal power is being generated from coal, mined at Talcher in the Brahmani valley and at the Rampur-Hingir
coal fields in the IB valley. Talcher coal is suitable for blending with Coking coal from Jharia, which is being
used in the blast furnace at Rourkela steel plant.
Cultural Features- Transport and Communication
The transport and communications scenario in Orissa is not as well developed as the other parts of the country.
However, the capital city of Bhubaneswar is linked by Road, Rail and Air with all the important cities of the
country. The Paradip port and the upcoming Dhamra port are the largest ports in this part of Asia. Orissa’s
growth is owed vastly to it massive reserves of mineral deposits which warrant an efficient supply chain
mechanism and this is enabled by the development of an efficient system of roadways and complimentary rail
networks. The other areas suffer from extremely poor connectivity. This coupled with the frequency and the
ferocity of the disaster, accentuates the misery of the people and adds considerably to the poor development of
the state. The state is spending large amounts of capital in the construction of helipads in order to enable rapid
deployment of relief teams and related infrastructure in times of disasters like cyclones and floods.
Epilogue
Coastal Profile – Elevation
The elevation of the coast is uniformly ranging from 2-5 metres with a few exceptions. The sand bars/
ridge on the coast protect the inland low-lying areas which are at times lower than the coastal areas.
Lack of vegetative cover
The absence of the forests in the region compounds the vulnerability of the coast. The intense summers
make the vegetative cover on the coast very weak, and hence without any resistance to the cyclonic
winds.
Densely populated coastal areas
The coastal areas of Orissa are one of the most densely populated areas in the country. The dense areas
increase the vulnerability of the communities and also pose a severe challenge to the disaster
management efforts of the agencies.
Cyclonic occurrences and surges
Cyclonic storm surges in the state of Orissa are usually associated with the intense winds and tidal
actions over the coast. The coastal areas face surges to the height of 5-10 meter at many places.

Disaster Vulnerability of Indian Coastal States- Cyclonic Storms and Odisha Coast
Page 10 of 10 | Dipankar C.Patnaik
Surge intensity
The degree of disaster potential depends on the storm surge amplitude associated with the cyclone at
the time of land fall, characteristics of the coast, phases of the tide and vulnerability of the area and
community.
Notes
Cyclone and Flood: Today more than ever before, India is vulnerable to natural disasters as well as t
manmade disasters. About 60% of the land mass is prone to earthquakes and over 40 million hectares
(about 8%) is prone to floods and about 68% of the area is susceptible to Drought. The problem is
more aggravated due to economic and population pressure on the land. Every year, a substantial portion
of the East coast is devastated by cyclones or floods. It may be known that about 20-25% of the
population is found in the East coast region.
Probable Maximum Storm Surge (PMSS): The PMSS gives the highest surge height along the coasts of
the Bay of Bengal and the Arabian Sea and is used to assess the vulnerability of the coastal zone.
Below Poverty Line: Below Poverty Line is an economic benchmark and poverty threshold used by the
government of India to indicate economic disadvantage and to identify individuals and households in
need of government assistance and aid. It is determined using various parameters which vary from state
to state and within states. The present criteria are based on a survey conducted in 2002. Going into a
survey due for a decade, India's central government is undecided on criteria to identify families below
poverty line.
SC/ST: Scheduled Caste and Scheduled Tribes: The Scheduled Castes (SCs), also known as the Dalit,
and the Scheduled Tribes (STs) are two groupings of historically disadvantaged people that are given
express recognition in the Constitution of India. The Scheduled Castes and Scheduled Tribes make up
around 15% and 7.5% respectively of the population of India, or around 24% altogether, according to
the 2001 Census.
Works Cited
Encyclopedia Britannica. (2005).
Abbott, P. L. (1996). Natural Disasters. Wm. C. Brown Publishing Co.
Census of India. (2001). Census of India. Census of India.
Census of India. (2001). Provisional Population Totals: Orissa,. Census of India.
De U.S. & Joshi, K. (1998). Natural Disasters and their impacts on developing countries. WMO
Bulletin-47, 336-343.
De, U. &. (1995). Genesis of cyclonic disturbances over the North Indian Ocean - 1991-1990. PPSR-3
issued by India, Meteorological Department.
Jayanthi, N. (1997). An objective analysis of tropical cyclones of the Narth Indian Ocean with special
reference to track prediction capabilities over the Bay of Bengal and Arabian Sea. Madras: PhD thesis,
University of Madras.
John Hidore, H. O. (Oct. 2009). Climatology: An Atmospheric Science (3 ed.). Pearson UK.
Joseph, P. a. (1999). Monsoon –rainfall and frequencies of monsoon depression and tropical cyclones
of recent 100 years and an outlook for the first decades of the 21st century. Proceedings- TROPMET-
99 (pp. 364-371). Indian Meteriological Scoiety.
Mooley, D. a. (1983). A study of cyclonic storms incident in the different sections on the coast around
Bay of Bengal. Mausam, 34, pp. 139-152.
Nelson, P. S. (n.d.). Retrieved January 30, 2011, from Tulane University:
http://www.tulane.edu/~sanelson/geol204/tropical_cyclones.pdf
Nicholls, N. C. (1998). Recent trends in Australian region tropical cyclone activity. Meteor. Atmos.
Phys., pp. 197-205.
Puri, D. A. (2009). Puri District Statistical Handbook . Govt. of Orissa.
Raghavan S, R. S. (2003, May). Trends in Tropical Cyclone Impact: A Study in Andhra Pradesh, India.
Bulletin of American Meteorological Society, 84, p. 623.
Singh, O. A. (2000). Changes in the frequency of tropical cyclones. Meteorol. Atmos. Phys. 75, 11-20.
Technical Document. (2007). Tropical Cyclone Operation Plan For The bay of Bengal and Arabian
Sea, Report No TCP-21. Geneva: World Metrological Organisation.
Vulnerability Atlas of India. (2006). Vulnerability Atlas of India. Building Materials and Technology
Promotion Council, Ministry of Housing & Urban Poverty Aleviation, Government of India.
End of Document