The effects of shoe traction and obstacle height on lower extremity coordination dynamics during...
19
The Effects of Shoe Traction and Obstacle Height on Lower Extremity Coordination Dynamics during Walking Leslie Decker 1 , Jeremy J. Houser 3 , John M. Noble 1 , Gregory M. Karst 4 , and Nicholas Stergiou 1,2,* 1 Nebraska Biomechanics Core Facility, University of Nebraska at Omaha, 6001 Dodge Street, Omaha, NE 68182-0216, USA 2 Environmental, Agricultural and Occupational Health, College of Public Health, University of Nebraska Medical Center, 987850 Nebraska Medical Center, Omaha, NE 68198-7850, USA 3 Department of Health and Exercise Sciences, School of Health Sciences and Education, Truman State University, 212 Pershing Building, 100 E. Normal St., Kirksville, MO 63501, USA 4 Division of Physical Therapy Education, University of Nebraska Medical Center, 984420 Nebraska Medical Center, Omaha, NE 68198-4420, USA Abstract This study aims to investigate the effects of shoe traction and obstacle height on lower extremity relative phase dynamics (analysis of intralimb coordination) during walking to better understand the mechanisms employed to avoid slippage following obstacle clearance. Ten participants walked at a self-selected pace during eight conditions: four obstacle heights (0%, 10%, 20%, and 40% of limb length) while wearing two pairs of shoes (low and high traction). A coordination analysis was used and phasing relationships between lower extremity segments were examined. The results demonstrated that significant behavioral changes were elicited under varied obstacle heights and frictional conditions. Both decreasing shoe traction and increasing obstacle height resulted in a more in-phase relationship between the interacting lower limb segments. The higher the obstacle and the lower the shoe traction, the more unstable the system became. These changes in phasing relationship and variability are indicators of alterations in coordinative behavior, which if pushed further may have lead to falling. Keywords Dynamical systems theory; Shoe traction; Obstacle clearance; Locomotion 1. Introduction Injuries associated with slips, trips and falls continue to pose a significant burden to society both in terms of human suffering and economic losses (Grönqvist & Roine, 1993; Kemmlert & Lundholm, 1998; Leamon & Murphy, 1995; Manning et al., 1988; National Safety Council, 1995). According to statistics from the Health and Safety Executive (HSE), slips and trips are *Corresponding author. Nicholas Stergiou. Tel.: 402-5543247; fax: 402-5543693. [email protected]. Publisher's Disclaimer: This is a PDF file of an unedited manuscript that has been accepted for publication. As a service to our customers we are providing this early version of the manuscript. The manuscript will undergo copyediting, typesetting, and review of the resulting proof before it is published in its final citable form. Please note that during the production process errors may be discovered which could affect the content, and all legal disclaimers that apply to the journal pertain. NIH Public Access Author Manuscript Appl Ergon. Author manuscript; available in PMC 2010 September 1. Published in final edited form as: Appl Ergon. 2009 September ; 40(5): 895–903. doi:10.1016/j.apergo.2008.12.005. NIH-PA Author Manuscript NIH-PA Author Manuscript NIH-PA Author Manuscript
Transcript of The effects of shoe traction and obstacle height on lower extremity coordination dynamics during...

The Effects of Shoe Traction and Obstacle Height on LowerExtremity Coordination Dynamics during Walking
Leslie Decker1, Jeremy J. Houser3, John M. Noble1, Gregory M. Karst4, and NicholasStergiou1,2,*1 Nebraska Biomechanics Core Facility, University of Nebraska at Omaha, 6001 Dodge Street,Omaha, NE 68182-0216, USA2 Environmental, Agricultural and Occupational Health, College of Public Health, University ofNebraska Medical Center, 987850 Nebraska Medical Center, Omaha, NE 68198-7850, USA3 Department of Health and Exercise Sciences, School of Health Sciences and Education, TrumanState University, 212 Pershing Building, 100 E. Normal St., Kirksville, MO 63501, USA4 Division of Physical Therapy Education, University of Nebraska Medical Center, 984420 NebraskaMedical Center, Omaha, NE 68198-4420, USA
AbstractThis study aims to investigate the effects of shoe traction and obstacle height on lower extremityrelative phase dynamics (analysis of intralimb coordination) during walking to better understand themechanisms employed to avoid slippage following obstacle clearance. Ten participants walked at aself-selected pace during eight conditions: four obstacle heights (0%, 10%, 20%, and 40% of limblength) while wearing two pairs of shoes (low and high traction). A coordination analysis was usedand phasing relationships between lower extremity segments were examined. The resultsdemonstrated that significant behavioral changes were elicited under varied obstacle heights andfrictional conditions. Both decreasing shoe traction and increasing obstacle height resulted in a morein-phase relationship between the interacting lower limb segments. The higher the obstacle and thelower the shoe traction, the more unstable the system became. These changes in phasing relationshipand variability are indicators of alterations in coordinative behavior, which if pushed further mayhave lead to falling.
KeywordsDynamical systems theory; Shoe traction; Obstacle clearance; Locomotion
1. IntroductionInjuries associated with slips, trips and falls continue to pose a significant burden to societyboth in terms of human suffering and economic losses (Grönqvist & Roine, 1993; Kemmlert& Lundholm, 1998; Leamon & Murphy, 1995; Manning et al., 1988; National Safety Council,1995). According to statistics from the Health and Safety Executive (HSE), slips and trips are
*Corresponding author. Nicholas Stergiou. Tel.: 402-5543247; fax: 402-5543693. [email protected]'s Disclaimer: This is a PDF file of an unedited manuscript that has been accepted for publication. As a service to our customerswe are providing this early version of the manuscript. The manuscript will undergo copyediting, typesetting, and review of the resultingproof before it is published in its final citable form. Please note that during the production process errors may be discovered which couldaffect the content, and all legal disclaimers that apply to the journal pertain.
NIH Public AccessAuthor ManuscriptAppl Ergon. Author manuscript; available in PMC 2010 September 1.
Published in final edited form as:Appl Ergon. 2009 September ; 40(5): 895–903. doi:10.1016/j.apergo.2008.12.005.
NIH
-PA Author Manuscript
NIH
-PA Author Manuscript
NIH
-PA Author Manuscript

the single most common cause of injuries at work, and account for over a third of all majorwork injuries. In the US, falls accounted for 19% of all nonfatal occupational injuries in 2001,and 13% of fatal occupational injuries in 2002 (Department of Health and Human Services,2003). The annual direct cost occupational injuries due to slips, trips and falls in the US hasbeen estimated to be in excess of 6 billion US dollars (Courtney et al., 2001), and a cause ofserious public health problem with costs expected to exceed $43.8 billion by the year 2020 inthe US alone (Englander et al., 1996).
Both slips and trips result from unintended or unexpected changes in the contact between thefeet and the walking surface. Thus, conventional biomechanical analyses (i.e. gait analysis)have been used to investigate human factors that cause slips, trips, and falls and their complexinteraction with environmental factors (Moyer et al. 2006; Petrarca et al. 2006). Human factorsinclude gait biomechanics, expectation, the health of the sensory systems (i.e. vision,proprioception, and vestibular) and the health of the neuromuscular system (Moyer et al.2006). Among the most important environmental factors that could potentially cause instabilityduring walking are the presence of obstacles and the loss of traction between the shoe sole andfloor surface (Cohen & Compton, 1982). Therefore, numerous studies have investigated theeffect of obstacle perturbations during walking (Begg et al., 1998; Chen et al., 1994; Chen andLu, 2006; Chou & Draganich, 1997; Jaffe et al., 2004; McFadyen & Prince, 2002; Patla et al.,1991; Patla & Rietdyk, 1993; Petrarca et al., 2006; Sparrow et al., 1996). However, this researchhas focused on the approach to an obstacle by collecting gait data of the trailing and leadinglimb while negotiating the obstacle. In addition, there have been numerous studies that haveused biomechanics of gait to examine the shoe–floor interface to understand slips (Burnfield& Powers, 2006; Bring, 1982; Cham & Redfern, 2001, 2002a, 2002b; Gao et al., 2003, 2004;James, 1980; Lockhart et al., 2003, 2005; Perkins, 1978; Perkins & Wilson, 1983; Redfern &Dipasquale, 1997; Strandberg, 1983; Strandberg & Lanshammar, 1981; Winter, 1991).However, limited attention was devoted to the combined effect of obstacles and low frictionshoe–floor interface on the landing strategies adopted to avoid slipping after obstacle clearance(Patla & Rietdyk, 1993; Bentley & Haslam, 1998; Leclercq, 1999). Two main categories ofadaptive strategies are used when an individual encounters both an obstacle and a more slipperyzone: “strategies of avoidance” that consist of modifying walking patterns in order to stepover the obstacle, and “strategies of accommodation” that consist of the modification ofwalking patterns in order to adapt to the low friction footwear-floor interface (Patla, 1991).The question thus arises: how these strategies interact and what kinds of corrective reactionsoccur in an attempt to avoid a fall.
Conventional kinematic gait analysis of slip, trip, and fall events rely on angular position-time,velocity-time, or angle-angle presentations (e.g. Cham & Redfern, 2001; Fong et al., 2005).However, such presentations do not reveal the direct relationship between velocity changesand position (Burgess-Limerick et al., 1993; Kurz et al., 2005; Van Uden et al., 2003; Winstein& Garfinkel, 1989). It is important to evaluate this relationship since the joint and muscleproprioceptors, and the visual and vestibular receptors provide sensory feedback on bothvelocity and position. This means that the multiple sensory cues will potentially compete forgovernance of the evoked behavioral response (Misiaszek, 2006). Furthermore, quantificationof interjoint (e.g., thigh-shank) coordination is very difficult with the above-mentionedpresentations (Burgess-Limerick et al., 1993; Davids et al., 2003; Scholz, 1990; Scholz &Kelso, 1989; Sparto et al., 1997). Coordination analysis using relative phase dynamics cansolve the above problems and provide a window of particular types of causal motor controlprocesses that are not usually revealed by conventional time-based plots (Gottlieb et al.,1983; Hamill et al., 1999; Heiderscheit et al., 1999; Kurz et al., 2005; Kwakkel & Wagenaar,2002; Sparto et al. 1997; Van den Berg et al., 2000; Van Uden et al., 2003; Winstein &Garfinkel, 1989). Relative phase dynamics utilizes the displacements and velocities of thesegments that surround a joint to quantify the joint’s coordination. For example, the continuous
Decker et al. Page 2
Appl Ergon. Author manuscript; available in PMC 2010 September 1.
NIH
-PA Author Manuscript
NIH
-PA Author Manuscript
NIH
-PA Author Manuscript
relative phase, a measure from relative phase dynamics, quantifies the coordination betweenthe shank and thigh segments that compose the knee joint. Such a measure is appealing forquantifying signs of gait instability because it can reveal the compensatory reactions evokedin the lower extremity coordination patterns that may be due to changing task (obstacleclearance) and environmental (low friction) demands.
Therefore, the purpose of this study was to use a coordination analysis to investigate the effectsof shoe traction and obstacle height on lower extremity coordination during walking to betterunderstand the control strategies adopted to avoid slippage following obstacle clearance innormal young adults. In this study, we examined the intralimb phasing relationships betweenthe foot, the shank and the thigh of the landing limb (Kurz et al., 2005). We hypothesized thatstepping over obstacles with low shoe traction will challenge the motor control of theneuromuscular system and will affect intralimb phasing relationships. In this study, obstacleheight was adjusted to percentages (0%, 10%, 20%, and 40%) of limb length to ensure thatindividuals of different heights would make the same qualitative adaptation in going overobstacles.
2. Methods2.1. Participants
Ten healthy young adult males between the ages of 18 and 35 from the general studentcommunity of the University of Nebraska at Omaha volunteered as participants (age: 25.8 ±4.29 years; body mass: 82.8 ± 8.25 kg; height: 179.6 ± 6.34 cm; leg length — as measuredfrom the right anterosuperior iliac spine to the right lateral malleolus: 95.6 ± 4.49 cm; shoesize: 10). All participants were without appreciable leg length discrepancy and had no injuriesor abnormalities that would affect their gait. Prior to testing, each participant provided aninformed consent approved by the University of Nebraska Medical Center Institutional ReviewBoard.
2.2. InstrumentationA sagittal view of the right lower extremity was obtained for all trials using a Panasonic WV-CL350 (Osaka, Japan) video camera with a sampling frequency of 60 Hz. The video camerawas located 8-meter perpendicular to the walking pathway. A zoom lens (COSMICAR TV,8–48 mm zoom lens, COSMICAR/PENTAX Precision Co., Tokyo, Japan) was used inconjunction with the video camera to optimize image size and minimize perspective error. Alight source (Pallite VIII using eight ELH 300 W tungsten-halogen projection lamps at 120VAC) was mounted with the camera lens in the center of the ring to better illuminate thereflective markers.
Reflective markers were positioned on the participant’s right lower extremity, here referred toas the leading limb (i.e. the limb crossing the obstacle first). All positional markers were placedon the participants by the same examiner. Sagittal plane marker placement was as follows: (1)mid-distance between the greater trochanter of the hip and the lateral joint line of the knee, (2)lateral joint line of the knee, (3) lateral malleolus, (4) outsole of the shoe approximately at thebottom of the calcaneus, and (5) outsole of the shoe approximately at the fifth metatarsal head.An additional marker was positioned at the obstacle to assist in determining the location of theobstacle in the field of view.
The video images were stored on SVHS video tapes via a Panasonic AG-1970P video camerarecorder, which was interfaced with a Magnavox TV for an instant qualitative evaluation ofthe video recording. The video data were transformed to digital format and digitized via thePEAK MOTUS video system (Peak Performance Technologies, Inc., Englewood, CO). A
Decker et al. Page 3
Appl Ergon. Author manuscript; available in PMC 2010 September 1.
NIH
-PA Author Manuscript
NIH
-PA Author Manuscript
NIH
-PA Author Manuscript

single camera was used because sagittal view measures of walking correspond well in two-and three-dimensions (Doriot & Cheze, 2004; Eng & Winter, 1995). GRF data were alsocollected using a force platform. These data were presented elsewhere (Houser et al., 2008).
Two pairs of men’s shoes (Pro-wing Joggers, size 10), with homogenous midsoles and rubberoutsoles, were used in this experiment. The same shoes and shoe size were used for allparticipants to minimize any effects from the shoe characteristics on the results of the study.The shoe size of 10 was selected because it is the most common shoe size among males in theUSA. To decrease the coefficient of friction (COF) of one pair of the shoes, withoutsignificantly modifying their weight, flexibility and general performance, 88 metallic one-halfinch diameter disc thumbtacks were inserted into the outsole of both the left and right shoe.The thumbtacks were carefully placed in order to ensure that no part of the actual shoe wasable to contact the ground during walking locomotion. They were also roughed and cleansedto expose the metal originally covered with enamel. The thumbtacks increased the weight ofthe shoes by 25 g (475 g without the tacks vs. 500 g with the tacks). The pair with the hightraction had dynamic COF (DCOF) of 0.7 and static COF (SCOF) of 0.8. The pair with thelow traction had DCOF of 0.3 and SCOF of 0.35. The two selected tractions were based uponprevious literature (Perkins, 1978; Denoth, 1989) and pilot test work suggesting the hightraction pair was a very safe shoe, while the low a borderline safe shoe. Both high and lowtraction shoes were roughed with 20 passes of the 100 grit sand paper, and then the surfaceswere cleansed with rubbing alcohol to remove from the outsoles any solvents or residues ofthe shoe manufacturing process.
2.3. Experimental protocolParticipants wore shoes provided by the investigator, and minimal clothing to achieve correctpositioning of reflective markers by using the anatomical landmark points. They were givenample time to acclimate to the experimental set-up prior to testing. Walking trials wereconducted on a 30-meter level oval track with a 0.6 meter wide lane; however, data were notrecorded along the curved portion of the walkway. Data collection was performed along thestraight 10-meter walkway section of the track; the force platform is embedded at the middleof this straight walkway. Walking speed was monitored around the location of the forceplatform and over a 3-m interval using a custom-made photocell timing system.
During familiarization, the investigator asked the participants if there was any shoe discomfortthat may alter their natural gait. If no problems were reported, the participants proceeded inestablishing a comfortable self-selected walking speed which was recorded. Based upon theparticipant’s self-selected walking speed, a range that allowed ±5% deviation of this speed wasused for the subsequent testing and a trial was considered acceptable only when the walkingspeed was within this predetermined range. The investigator also asked the participants not tolook at the floor to locate the force platform for proper right foot placement, as this couldinfluence the participant’s natural walking. For this purpose, a foot placement marker waslocated approximately 7 m before the force platform to allow for a normal right foot contactwith the force platform. This distance was determined through trial and error during the practicetrials. Each trial was visually monitored to insure that the stride was normal and the foot wascompletely on the force platform. Data transfer from the cameras to the computer allowed foran inter-trial rest interval of one minute.
All participants were asked to walk at their previously established self-selected speed underfour different obstacle conditions. The first condition was walking on a level surface while theother three conditions were walking over obstacles of three different heights. The averageheight of the obstacles was approximately: 8–10 cm (low, 10% leg length), 18–20 cm (medium,20% leg length) and 36–40 cm (high, 40% leg length). These obstacle heights were establishedbased upon pilot work, previous literature and obstacle dimensions commonly encountered in
Decker et al. Page 4
Appl Ergon. Author manuscript; available in PMC 2010 September 1.
NIH
-PA Author Manuscript
NIH
-PA Author Manuscript
NIH
-PA Author Manuscript

the everyday environment (Chen et al., 1991; Chen et al., 1994; Chou & Draganich, 1997;Patla et al., 1991; Patla & Rietdyk, 1993; Patla et al., 1996). The 10% obstacle heightcharacterizes door thresholds, the 20% obstacle height represents typical curbstones separatingcars in parking lots and stair risers, and 40% obstacle height corresponds to bathtub rims, wherefrequent falls occur especially among the elderly. The obstacles were placed directly beforethe force platform so that the participant had to clear the obstacle with the right leg and landon the force platform. The obstacles were made of light weight wood so that if a participantstepped on or hit the obstacle by mistake while walking, the obstacle was destroyed. Thisminimized the risk of tripping and falling. All participants were required to complete thebaseline and obstacle conditions with the two pairs of shoes (high and low traction outsole) asdescribed previously.
Each experimental condition (shoe traction × obstacle) consisted of ten trials for a total ofeighty trials per participant. The order of the presentation of conditions was predetermined asfollows: (1) low traction – 0%; (2) low traction – 10%; (3) low traction – 20%; (4) low traction– 40%; (5) high traction – 0%; (6) high traction – 10%; (7) high traction – 20%; (8) high traction– 40%. Furthermore, participants were given several practice trials prior to each condition tofamiliarize themselves with the task and the environmental constraints.
2.4. Data reduction and analysisKinematic data were analyzed during the stance period only. All kinematic coordinates werescaled and smoothed using a Butterworth low-pass filter with a selective cut-off algorithmbased on Jackson (1979). The cut-off values were 8–14 Hz. Subsequently, from the planarcoordinates, foot, shank, and thigh angular displacements were calculated in a counter-clockwise direction relative to the right horizontal axis. From the angular displacements, theangular velocities were calculated using a finite difference approach. All kinematic angulardisplacements and velocities were normalized to 100 points for the stance period using a cubicspline routine to enable mean ensemble curves to be derived for each participant and for eachcondition. The touchdown and toe-off timing occurrences as well as the transition time(crossover) from braking to propulsion were identified from the anterior-posterior groundreaction force data using laboratory software. Since the kinetic and kinematic data files weretime matched, the time of the transition (crossover) from braking to propulsion was used toevaluate each footfall for two periods: (1) heel contact to transition (absorption or brakingperiod) and (2) transition to toe-off (propulsion period). It was decided to divide the stanceperiod at the transition time (crossover) from braking to propulsion for two main reasons: (1)this event separates the absorption and propulsion periods, during which different kinematicstrategies may exist (Bates et al.,1978), (2) the measurements over the entire stance can maskdifferences for a single period (Byrne et al., 2002).
The angular kinematic data were then subjected to a coordination analysis (Kurz & Stergiou,2004a, 2004b, 2004c; Kurz et al., 2005; Scholz, 1990; Stergiou, 2001a, 2001b). Phase portraitsfor the sagittal foot, shank and thigh were generated. A phase portrait is a plot of a segment’sangular displacement versus its angular velocity (Barela et al., 2000; Winstein & Garfinkel,1989). The angular displacements and velocities were normalized to their maximum absolutevalues (Van Emmerik & Wagenaar, 1996; Kurz & Stergiou, 2004c). The resulting phase planetrajectories were then transformed from Cartesian (x, y) to polar (r, θ) coordinates, where theradius was r = (x2 + y2)1/2 and the phase angle was θ = tan−1 [y/x] (Kurz & Stergiou, 2002;Kurz et al., 2005; Rosen, 1970). Phase angles calculated from these trajectories had a range of0° to 180°. Phase angles allow for the incorporation of angular displacements and velocitiesto examine coordinative strategies. Subsequently, the normalized phase angles were used todetermine the phasing relationships between the segments. The foot and the shank can beviewed as respectively rotating clockwise and counterclockwise around the ankle joint axis,
Decker et al. Page 5
Appl Ergon. Author manuscript; available in PMC 2010 September 1.
NIH
-PA Author Manuscript
NIH
-PA Author Manuscript
NIH
-PA Author Manuscript

while the shank and the thigh can be viewed as rotating clockwise and counterclockwise aroundthe knee joint axis. Continuous relative phase represents the phasing relationships orcoordination between the actions of the two interacting segments at every point during aspecific time period (i.e., it depicts how the two segments are coupled in their movements whileperforming the task) (Barela et al., 2000; Hamill et al., 1999; Heiderscheit et al., 1999, 2000;Kwakkel & Wagenaar, 2002; Scholz, 1990). Relative phase was calculated throughout thestance period by subtracting the phase angles of the corresponding segments:
and
Values close to 0° indicate that the two segments are moving in a similar fashion or in-phase.Values close to 180° indicate that the two segments are moving in opposite directions or out-of-phase. The relative phase curves for each segmental relationship (ankle and knee) wereaveraged across trials, and mean ensemble curves were generated for each participant for allconditions. The participant mean ensemble curves were also averaged to generate group meanensemble curves for all conditions. However, to statistically test differences between relativephase curves, it was necessary to characterize the curves by single numbers. Therefore, twoadditional parameters were calculated using the participant mean ensemble curves (Byrne etal., 2002; Hamill et al., 1999; Heiderscheit et al., 1999, 2000; Kurz & Stergiou, 2004b,2004c; Stergiou et al., 2001a, 2001b; Van Emmerik & Wagenaar, 1996).
The first parameter was the Mean Absolute value of the ensemble Relative Phase curve values(MARP). This parameter was calculated by averaging the absolute values of the ensemblecurve points for the designated periods (stance, absorption and propulsion):
where N is the number of points in the relative phase mean ensemble. Functionally, a lowMARP value indicated that the oscillating segments have a more in-phase coordinatedrelationship; a high MARP value indicates that the oscillating segments have a more out-of-phase coordinated relationship.
The second parameter was the Deviation Phase (DP) of the relative phase for the two interactingsegments provides a measure of stability of the neuromuscular system. Deviation phase wascalculated by averaging the standard deviations of the ensemble relative phase curve points forthe designated periods (stance, absorption and propulsion):
where N is the number of points in the relative phase mean ensemble and SD is the standarddeviation of the mean ensemble at the ith point. Functionally, a low DP value indicates a more
Decker et al. Page 6
Appl Ergon. Author manuscript; available in PMC 2010 September 1.
NIH
-PA Author Manuscript
NIH
-PA Author Manuscript
NIH
-PA Author Manuscript

stable organization of the neuromuscular system (i.e., a less variable relationship between thetwo segments’ actions); a high DP value indicates less stability in the organization of theneuromuscular system.
2.5. Statistical treatmentGroup means and standard deviations were calculated for MARP and DP for each segmentalrelationship, for each period, and for each condition. A two-way repeated measures ANOVA(shoe traction × obstacle) was performed on the group means for MARP and DP. Statisticalanalysis was performed for each coordinative relationship (foot-shank and shank-thigh) andfor each period (stance, absorption and propulsion). In tests that resulted in significant F-ratios(P < 0.05), post-hoc analysis was performed using Tukey tests.
3. ResultsThe shank-thigh (S-T) MARP group results were statistically significant for both factors (shoetraction × obstacle) during all the three periods (stance, braking, and propulsion; Tables 1 and2). The S-T MARP values were significantly larger for the high traction shoe, and decreasedas the obstacle height increased in both shoes. Specifically, the decrease in the S-T MARPvalues was symmetrical between obstacle conditions for the stance and the propulsive periodsin both shoes. However, for the braking period this decrease was only noticeable from the levelwalking to the 10% obstacle conditions; the post-hoc analysis showed no statistical differencesbetween the obstacle conditions. Regarding the foot-shank (F-S) MARP group results, nostatistically significant differences were found between conditions.
The DP group results were statistically significant for both S-T and F-S segmental relationshipsfor all three periods analyzed regarding the obstacle factor (Tables 1 and 2). For the shoe factorall S-T segmental relationships were significant, while for the F-S only the propulsive periodwas significantly different. All the DP group results increased in value as the obstacle heightincreased for both shoes. Furthermore, the S-T DP results were larger for the low traction shoesfor all periods.
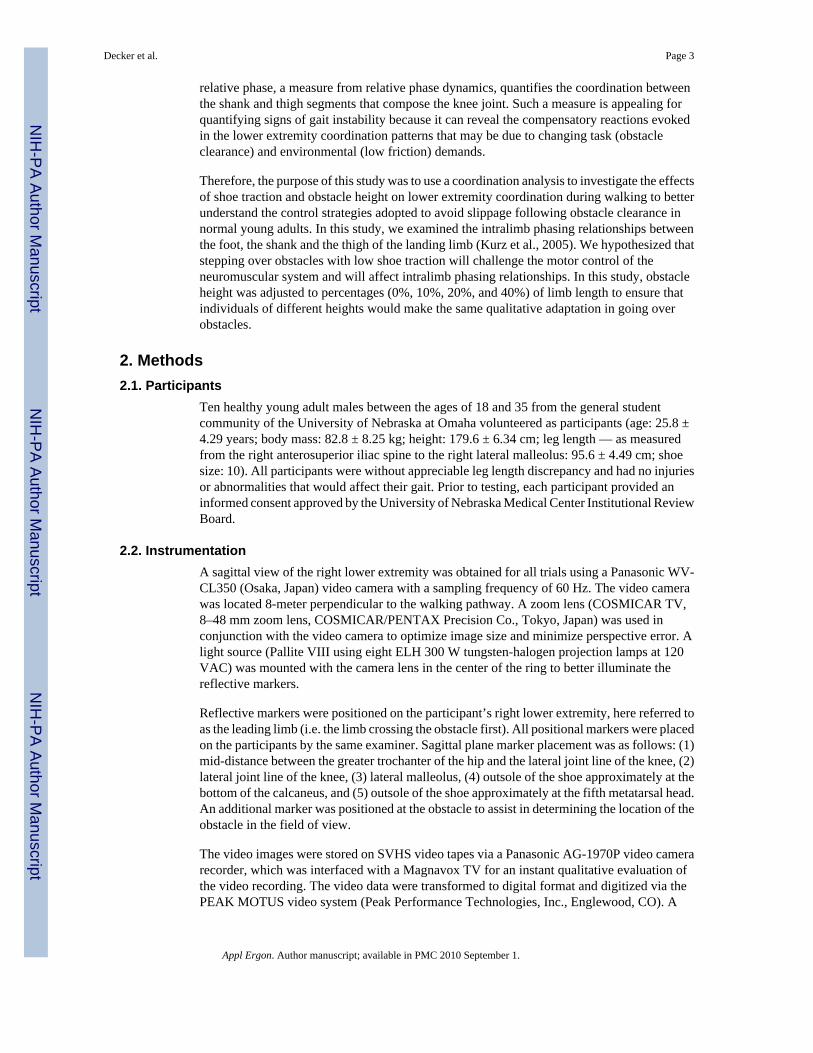
Graphically, the thigh segment during the stance phase showed a segmental reversal whichoccurs towards the later part of stance (Figure 1a). Functionally, every time that a trajectorygoes through zero a segmental reversal is observed. It is worth noting that the thigh exhibiteda fairly constant velocity during the middle part of the stance period, especially in the noobstacle conditions. Constant velocity is depicted by flat horizontal sections. However, spatialaspects of the phase portraits expressed the same general shape from one condition to the next.However, in level-walking (0% obstacle) and low-obstacle (10%) conditions, low tractionshoes caused an additional curve segment to be developed within the original pattern duringlate stance. The shank segment phase portraits revealed no reversals, indicating a backwardonly rotation around the knee joint during the stance phase of walking (Figure 1b). However,the foot behaved differently than the other lower extremity segments (Figure 1c). The footsegment during stance displayed a cusp shape. Cusps in the foot trajectory path, when thevelocity is near zero, indicate sudden interruption in the movement pattern. This is due to thefact that the foot remained flat on the ground for a period of time during midstance. The foottrajectories were more similar geometrically between conditions; however, the angular velocityof the foot segment appeared to increase during the later part of the stance period in the hightraction condition, as compared to the low traction situation. This observation was graphicallyvisible thought a more pronounced concave-down configuration during the later portion of thestance phase.
The group mean ensemble foot-shank (F-S) and shank-thigh (S-T) relative phase curves forthe stance period are displayed in Figure 2. In general, it can be observed that segmental relative
Decker et al. Page 7
Appl Ergon. Author manuscript; available in PMC 2010 September 1.
NIH
-PA Author Manuscript
NIH
-PA Author Manuscript
NIH
-PA Author Manuscript

phase relationships are non linear i.e., neither in-phase (~0° values) nor out-of-phase (~180°values) by a constant magnitude during stance. In addition, during level-walking, F-S and S-T relative phases began differently than for obstacle conditions. Indeed, both segmental relativephases began around 0° for the no obstacle conditions, whereas F-S relative phase began around−25° and S-T relative phase around +50° for the obstacle conditions. Therefore, the effect ofthe obstacle on the relative phase caused the segments to be more out of phase at touchdown.
The group mean ensemble F-S relative phase curves had similar configurations for allconditions (Figure 2a). All curves began with negative values (or negative zero values for thelevel-walking conditions) that indicated that the shank was leading the foot (i.e., the shank wasmoving faster in phase space) during the first initial portion of stance. Early in stance, therelationship between the foot and shank reversed. Reversal in the relationship between the twosegments was evident by the local minimum in the relative phase graph. The positive slopeafter the local minimum indicated that the foot was leading the shank segment (i.e., the footwas moving faster in phase space). During mid-stance, the foot-shank relationship becamemore out of phase, and the foot clearly was leading the shank (positive values: 25–50°).Moreover, there was not a distinct (unique) local maximum in the F-S relative phase. In fact,inspection of the F-S relative phase curve indicated that there were multiple fluctuations duringmidstance. Local minimums and maximums suggest a change in direction of the relationshipbetween the two segments. During the late portions of the stance, the relationship between thefoot and shank became progressively in-phase.
The group mean ensemble S-T relative phase curves also displayed quite similar trends (Figure2b). For the obstacle conditions, all curves began with positive values that indicated that theshank was leading the thigh. Immediately after the shank-thigh relationship became more in-phase (0°) during mid-stance. During late stance, the relationship between the shank and thighbecame progressively out of phase with the thigh leading. A slightly different segmentalrelationship occurred for the level-walking conditions. As previously mentioned, the S-Tsegments began more in-phase (i.e., close to zero degree). However, early in stance the relativephase became more-out-of-phase with the thigh leading the shank before returning to a morein-phase relationship throughout the middle portion of the stance period. During late stance,the relationship became progressively out of phase, similarly to what was observed in theobstacle conditions.
4. DiscussionBoth our graphical and statistical results revealed that stepping over obstacles of differentheight with shoes of varied traction may affect the motor control of the neuromuscular systemand will affect intralimb phasing relationships. The partitioning of the stance period assistedin further understanding the strategies used and better evaluate the results functionally.
Specifically, the phasing relationship between the foot and the shank segments was not affectedby either shoe traction or obstacle height changes. Graphically, ensemble curves displayingthe F-S relative phase support this statistical result (Figure 4a). However, the more in-phaserelationship observed at initial foot contact in walking-level conditions did change to becomemore out-of-phase in obstacle conditions. Furthermore, early in stance, the magnitude of thecurves’ concavity was more prominent when the obstacle height was increased. Even thoughthese differences were not found to be significant, probably due to the large similarities of thecurves throughout the remaining portion of the braking and the stance periods, they may beimportant due to the increased danger of slipping during the braking period. Indeed, accordingto Perkins (1978), the most dangerous slipping is most likely to occur in this period due to alow initial vertical ground reaction force at heel strike, which produces a small amount offriction. If friction is not sufficient during the braking period, an anterior slip of the foot would
Decker et al. Page 8
Appl Ergon. Author manuscript; available in PMC 2010 September 1.
NIH
-PA Author Manuscript
NIH
-PA Author Manuscript
NIH
-PA Author Manuscript

likely occur. This slip could be particularly dangerous due to the rapid transfer of weight tothe landing foot.
Contrary to F-S, S-T MARP showed significant differences for both factors during all periods.The introduction of low traction shoes had as a result a more in-phase relationship.Furthermore, the increasing obstacle height resulted in a more in-phase relationship for bothshoes. Thus, it seems that both independent variables affected the coordinative behavior of thesystem at the knee. The more in-phase S-T segmental relationship may indicate a tendencytowards a behavioral change that eventually could result in the emergence of a new behavioralstate (i.e., slipping and/or falling). Therefore, this relationship deserves more attention in futureergonomics studies that want to explore the relationship between shoe-floor traction followingobstacle clearance.
In the present study, stability of the coordinated relationship between the two interactingsegments was measured by DP which describes the variability of the relative phase. Aninteresting observation is that the increases in obstacle height resulted in significantly increasedF-S DP values. Thus, even though the F-S relative phase remained similar (as indicated by thelack of differences for F-S MARP values), the F-S DP increased significantly as the obstacleheight increased. This result can be explained as an increased instability based on the theoreticalpremises of the coordination analysis performed (Kurz & Stergiou, 2004b). For the shoetraction factor, only F-S DP values during propulsive period showed significant differences.The fact that DP increased for the F-S segmental relationship in the low traction shoes indicatesinstability and lack of coordination at the ankle joint during the propulsive period. This isfurther supported by the fact that the smaller F-S DP values during propulsion were present atthe high traction conditions, which theoretically means that when the system is under normalpreferred conditions (normal walking) it would be highly stable. Furthermore, the S-T DPincreased as the obstacles height increased for both shoes in all periods. Moreover, the lowtraction shoe had generally larger S-T values. These findings further supported the hypothesisthat increased instability would be present when the obstacle height and shoe traction changedand became more unsafe.
Previously, angle-angle diagrams have been used to depict the organization of the multipledegrees of freedom needed to complete one walking gait cycle (Grieve, 1968), and severalinvestigators have suggested methods for quantifying the coordination that is qualitativelyobservable in these relative patterns (Sidaway et al., 1995; Sparrow et al., 1987; Whiting andZernicke, 1982). However, quantitatively understanding the control mechanisms cannot beachieved with this methodology alone (Burgess-Limerick et al., 1993). The usage of phaseportraits and subsequently of relative phase, allows the incorporation of both angulardisplacement and velocity to examine coordination and movement (Kurz & Stergiou, 2004a,2004b, 2004c; Kurz et al., 2005; Kwakkel & Wagenaar, 2002; Scholz, 1990). Functionally,this approach is advantageous since there is evidence that receptors exist within the musclesand tendons for controlling both displacement and velocity (McCloskey, 1978). This is aparticular strength of the present study.
However, we should also consider several limitations of our study. First and most importantly,the sample procedure lacks randomization. Indeed, from a practical and methodological pointof view randomization was in fact difficult to achieve. Because the participants knew the shoecondition, it was not possible to eliminate the awareness of a potential slip/fall (while wearingshoes with low friction) or trip/fall (while avoiding obstacles). Accordingly, some caution withregard to generalization of the results must be taken due to the lack of randomization. On theother hand, in our pilot work we found that the order of the testing conditions did not revealsignificant learning effects. Additionally, participants were given one or more practice trialsprior to each condition to familiarize themselves with the task and the environmental
Decker et al. Page 9
Appl Ergon. Author manuscript; available in PMC 2010 September 1.
NIH
-PA Author Manuscript
NIH
-PA Author Manuscript
NIH
-PA Author Manuscript

constraints. Our results in terms of gait adaptations are also in agreement with those found inthe literature (obstacle clearance strategies: e.g. Begg et al., 1998; Chen et al., 1991; correctivereactions to slip events: e.g. Perkins, 1978; Frederick, 1993; Cham & Redfern, 2001).
A second limitation of the present study is the extent to which the findings can be generalized,as it is not possible to know how the laboratory slipping responses differed from those thatoccur in a non-laboratory environment (Brady et al., 2000). It has been proven that reproducingthe unexpected nature of real-life slip, trip, and fall accidents in laboratory settings is quitedifficult. Therefore, the conclusions reported here underline the importance of beingconservative when applying research findings from slip, trip, and fall experiments using humanparticipants to design criteria of environmental safety (e.g. friction requirements).
However, the findings of this investigation can provide the necessary foundation to furtherinvestigate the coordinative control strategies utilized in more challenging environments thatmay actually be associated with slips and falls. Additionally, further investigation should beconducted to explore the anticipatory intralimb coordinative strategies leading up to the stancephase of gait, as such adaptations could be critical in order to successfully avoid slips, trips,and eventual falls. From an ergonomic perspective, such investigations can have crucialimplications to slip, trip, and fall injury-prevention strategies in occupational and non-occupational environments, and how a potentially hazardous situation is perceived.
5. ConclusionsOur approach provided information to understand how young healthy adults change their gaitto reduce the likelihood of a slip following clearance of obstacles of varied heights and landingwith shoes of low traction. The changes in phasing relationship and variability are possibleindicators of alterations in coordinative behavior, which may emerge to reduce the risk to theparticipant when confronted with an environment characterized by low traction and highobstacles. Changes do not suggest that falling or slipping did or will occur. However, if shoetraction and/or obstacle height would have been more extreme, falling may have occurred.Qualitative analysis during data processing did reveal that slippage occurred at initial footcontact. This slippage was of the type “slip-sticks” as described by Standberg and Lanshammar(1981). These slips never resulted in obvious postural or upper extremity adjustments. Slippingalso occurred late in the propulsive period just prior to toe-off. This slipping was of littleconsequence, due to majority of weight acceptance to the opposing limb (Perkins, 1978).
AcknowledgmentsThe study was supported by the University Committee on Research of the University of Nebraska at Omaha, theNebraska Research Initiative, the NIDRR (H133G040118) and the NIH (K25HD047194).
ReferencesBarela J, Whitall J, Black P, Clark JE. An examination of constraints in patients with chronic hemiparetic
gait. Hum Mov Sci 2000;19:251–73.Bates, BT.; Osternig, LR.; Mason, BR.; James, SL. Lower extremity function during the support phase
of running. In: Asmussen, E.; Jorgensen, K., editors. Biomechanics. Vol. IV-B. University Park Press;Baltimore: 1978. p. 30-9.
Begg RK, Sparrow WA, Lythgo ND. Time-domain analysis of foot-ground reaction forces in negotiatingobstacles. Gait Posture 1998;7:99–109. [PubMed: 10200379]
Bentley TA, Haslam RA. Slip, trip, and fall accidents occurring during the delivery of mail. Ergonomics1998;41:1859–72. [PubMed: 9857843]
Brady RA, Pavol MJ, Owings TM, Grabiner MD. Foot displacement but not velocity predicts the outcomeof a slip induced in young subjects while walking. J Biomech 2000;33:803–8. [PubMed: 10831754]
Decker et al. Page 10
Appl Ergon. Author manuscript; available in PMC 2010 September 1.
NIH
-PA Author Manuscript
NIH
-PA Author Manuscript
NIH
-PA Author Manuscript

Bring, C. Document D5: 1982. Stockholm: Swedish Council for Building Research; 1982. Testing ofslipperiness: forces applied to the floor and movements of the foot in walking and in slipping on theheel.
Burgess-Limerick R, Abernethy B, Neal RJ. Relative phase quantifies interjoint coordination. J Biomech1993;26:91–4. [PubMed: 8423174]
Burnfield JM, Powers CM. Prediction of slips: an evaluation of utilized coefficient of friction andavailable slip resistance. Ergonomics 2006;49:982–95. [PubMed: 16803728]
Byrne JE, Stergiou N, Blanke D, Houser JJ, Kurz MJ, Hageman PA. Comparison of gait patterns betweenyounger and elderly women: an examination of coordination. Percept Mot Skills 2002;94:265–80.[PubMed: 11883574]
Cham R, Redfern MS. Lower extremity corrective reactions to slip events. J Biomech 2001;34:1439–45.[PubMed: 11672718]
Cham R, Redfern MS. Changes in gait when anticipating slippery floors. Gait Posture 2002a;15:159–71.[PubMed: 11869910]
Cham R, Redfern MS. Heel contact dynamics during slip events on level and inclined surfaces. Saf Sci(Special Issue) 2002b;40:559–76.
Chen HC, Ashton-Miller JA, Alexander NB, Schultz AB. Stepping over obstacles: Gait patterns of healthyyoung and old adults. J Gerontol 1991;46:M196–M203. [PubMed: 1940078]
Chen HC, Ashton-Miller JA, Alexander NB, Schultz AB. Age effects on strategies to avoid obstacles.Gait Posture 1994;2:139–46.
Chen HL, Lu TW. Comparisons of the joint moments between leading and trailing limb in young adultswhen stepping over obstacles. Gait Posture 2006;23:69–77. [PubMed: 16311197]
Chou L, Draganich L. Stepping over an obstacle increases the motions and moments of the joint of thetrailing limb in young adults. J Biomech 1997;30:331–7. [PubMed: 9075000]
Cohen HH, Compton DM. Fall accident patterns: characterization of most frequent work surface-relatedinjuries. Prof Saf 1982;27:16–22. [PubMed: 10255743]
Courtney TK, Sorock GS, Manning DP, Collins JW, Holbein-Jenny MA. Occupational slip, trip, andfall-related injuries - can the contribution of slipperiness be isolated? Ergonomics 2001;20:1118–37.[PubMed: 11794761]
Davids K, Glazier P, Araujo D, Bartlett R. Movement systems as dynamical systems: the functional roleof variability and its implications for sports medicine. Sports Med 2003;33:245–60. [PubMed:12688825]
Denoth, J. Indoor athletic playing surfaces: floor vs. shoe. In: Segesser, B.; Pforringer, W., editors. Theshoe in sport. Year Book Medical Publishers, Inc; Chicago: 1989. p. 65-9.
Doriot N, Cheze L. A three-dimensional kinematic and dynamic study of the lower limb during the stancephase of gait using an homogeneous matrix approach. IEEE Trans Biomed Eng 2004;51:21–7.[PubMed: 14723490]
Eng JJ, Winter DA. Kinetic analysis of the lower limbs during walking: what information can be gainedfrom a three-dimensional model? J Biomech 1995;28:753–58. [PubMed: 7601875]
Englander F, Hodson TJ, Terregrossa RA. Economic dimensions of slip and fall injuries. J Forensic Sci1996;41:733–46. [PubMed: 8789837]
Fong DT, Hong Y, Li JX. Lower-extremity gait kinematics on slippery surfaces in construction worksites.Med Sci Sports Exerc 2005;37:447–54. [PubMed: 15741844]
Frederick, EC. Optimal frictional properties for sport shoes and sport surfaces. In: Hamill, J.; Derrick,TR.; Elliot, EH., editors. Biomechanics in Sports XI. Proceedings of the XIth Symposium of theInternational Society of Biomechanics in Sports; Amherst, MA: University of Massachusetts; 1993.p. 15-22.
Gao C, Abeysekera J. Slips and falls on ice and snow in relation to experience in winter climate andwinter sport. Saf Sci 2003;42:537–45.
Gao C, Abeysekera J, Hirvonen M, Grönqvist R. Slip resistant properties of footwear on ice. Ergonomics2004;47:710–16. [PubMed: 15204296]
Gottlieb GL, Agarwal GC, Jaeger RJ. Response of sudden torques about ankle in man. V. Effect ofperipheral ischemia. J Neurophys 1983;50:297–312.
Decker et al. Page 11
Appl Ergon. Author manuscript; available in PMC 2010 September 1.
NIH
-PA Author Manuscript
NIH
-PA Author Manuscript
NIH
-PA Author Manuscript

Grieve DW. Gait patterns and the speed of walking. Biomed Eng 1968;3:119–22.Grönqvist, R.; Roine, J. Serious occupational accidents caused by slipping. In: Nielsen, R.; Jorgensen,
R., editors. Advances in Industrial Ergonomics and Safety. Vol. V. Taylor and Francis Publishers;London: 1993. p. 515-19.
Hamill J, van Emmerik REA, Heidercsheit BC, Li L. A dynamical systems approach to lower extremityrunning injuries. Clin Biomech 1999;14:297–308.
Heiderscheit BC, Hamill J, Caldwell GE. Influence of Q-angle on lower-extremity running kinematics.J Orthop Sports Phys Ther 2000;30:271–8. [PubMed: 10817414]
Heiderscheit BC, Hamill J, Van Emmerik RE. Q-angle influences on the variability of lower extremitycoordination during running. Med Sci Sports Exerc 1999;31:1313–9. [PubMed: 10487374]
Houser JJ, Decker LM, Stergiou S. Stepping over obstacles of different heights and varied shoe tractionalter the kinetic strategies of the leading limb. Ergonomics 2008;7:1–13.
Jackson KM. Fitting of mathematical functions to biomechanical data. IEEE Trans Biomed Eng1979;26:515–21.
Jaffe DL, Brown DA, Pierson-Carey CD, Buckley EL, Lew HL. Stepping over obstacles to improvewalking in individuals with poststroke hemiplegia. J Rehabil Res Dev 2004;41:283–92. [PubMed:15543446]
James DI. A broader look at pedestrian friction. Rubber Chem Tech 1980;53:512–41.Kemmlert K, Lundholm L. Slips, trips and falls in different work groups with reference to age. Saf Sci
1998;28:59–75.Kurz M, Stergiou N. The effect of normalization and phase angle calculations on continuous relative
phase. J Biomech 2002;35:369–74. [PubMed: 11858813]Kurz, MJ.; Stergiou, N. Mathematical measures of coordination and variability in gait patterns. In:
Stergiou, N., editor. Innovative analyses of human movement. Human Kinetics Publ; Champaign:2004a. p. 163-86.
Kurz, MJ.; Stergiou, N. Applied dynamic systems theory for the analysis of movement. In: Stergiou, N.,editor. Innovative analyses of human movement. Human Kinetics Publ; Champaign: 2004b. p.93-119.
Kurz MJ, Stergiou N. Does Footwear Affect Ankle Coordination Strategies? J Am Podiatr Med Assoc2004c;94:53–8. [PubMed: 14729992]
Kurz MJ, Stergiou N, Buzzi UH, Georgoulis AD. The effect of anterior cruciate ligament reconstructionon lower extremity relative phase dynamics during walking and running. Knee Surg Sports TraumatolArthrosc 2005;13:107–15. [PubMed: 15756615]
Kwakkel G, Wagenaar RC. Effect of duration of upper- and lower-extremity rehabilitation sessions andwalking speed on recovery of interlimb coordination in hemiplegic gait. Phys Ther 2002;82:432–48.[PubMed: 11991797]
Leclercq S. Prevention of same level falls: a more global appreciation of this type of accident. J Saf Res1999;30:103–12.
Lockhart TE, Smith JL, Woldstad JC. Effects of aging on the biomechanics of slips and falls. Hum Fact2005;47:708–729.
Lockhart TE, Woldstad JC, Smith JL. Effects of age-related gait changes on the biomechanics of slipsand falls. Ergonomics 2003;46:1136–60. [PubMed: 12933077]
Leamon TB, Murphy PL. Occupational slips and falls: more than a trivial problem. Ergonomics1995;38:487–98. [PubMed: 7729391]
Manning DP, Ayers I, Jones C, Bruce M, Cohen K. The incidence of underfoot accidents during 1985 ina working population of 10,000 Merseyside people. J Occup Acc 1988;10:121–30.
McCloskey DI. Kinesthetic sensibility. Physiol Rev 1978;58:763–820. [PubMed: 360251]McFadyen BJ, Prince F. Avoidance and accommodation of surface height changes by healthy,
community-dwelling, young, and elderly men. J Gerontol A Biol Sci Med Sci 2002;57:B166–74.[PubMed: 11909882]
Misiaszek JE. Neural control of walking balance: if falling then react else continue. Exerc Sport Sci Rev2006;34:128–34. [PubMed: 16829740]
Decker et al. Page 12
Appl Ergon. Author manuscript; available in PMC 2010 September 1.
NIH
-PA Author Manuscript
NIH
-PA Author Manuscript
NIH
-PA Author Manuscript

Moyer BE, Chambers AJ, Redfern MS, Cham R. Gait parameters as predictors of slip severity in youngerand older adults. Ergonomics 2006;49:329–43. [PubMed: 16690563]
National Safety Council (NSC). International Accident Facts. Itasca, IL, USA: 1995.Patla AE, Prentice SD, Robinson C, Neufeld J. Visual control of locomotion: strategies for changing
direction and for going over obstacles. J Exp Psychol Hum Percept Perform 1991;3:603–34.[PubMed: 1834781]
Patla AE, Rietdyk S. Visual control of limb trajectory over obstacles during locomotion: effect of obstacleheight and width. Gait Posture 1993;1:45–60.
Patla AE, Rietdyk S, Martin C, Prentice S. Locomotor patterns of the leading and the trailing limbs assolid and fragile obstacles are stepped over: some insights into the role of vision during locomotion.J Mot Behav 1996;28:35–47. [PubMed: 12529222]
Perkins, PJ. Measurement of slip between the shoe and ground during walking. In: Anderson, C.; Senne,J., editors. Walkway surfaces: measurement of slip resistance. American Society for Testing andMaterials; Baltimore: 1978. p. 71-87.
Perkins PJ, Wilson P. Slip resistance testing of shoes-new developments. Ergonomics 1983;26:73–82.Petrarca M, Rosa D, Cappa P, Patanè F. Stepping over obstacles of different heights: kinematic and kinetic
strategies of leading limb in hemiplegic children. Gait Posture 2006;24:331–41. [PubMed: 16359868]Redfern MS, Dipasquale J. Biomechanics of descending ramps. Gait Posture 1997;6:119–25.Rosen, R. Dynamical Systems Theory in Biology. Volume I: Stability Theory and Its Applications. Wiley-
Interscience; New York, NY, USA: 1970.Scholz JP. Dynamic pattern theory–some implications for therapeutics. Phys Ther 1990;70:827–43.
[PubMed: 2236226]Scholz JP, Kelso JAS. A quantitative approach to understanding the formation and change of coordinated
movement patterns. J Mot Behav 1989;21:122–44. [PubMed: 15132941]Sidaway B, Heise G, Schoenfelder-Zohdi B. Quantifying the variability of angle-angle plots. J Hum Mov
Stud 1995;29:181–97.Sparrow WA, Donovan E, van Emmerik R, Barry EB. Using relative motion plots to measure changes
in intra-limb and inter-limb coordination. J Mot Behav 1987;19:115–29.Sparrow WA, Shinkfield AJ, Chow S, Begg RK. Characteristics of gait in stepping over obstacles. Hum
Mov Sci 1996;15:605–22.Sparto PJ, Parnianpour M, Reinsel TE, Simon S. The effect of fatigue on multijoint kinematics,
coordination, and postural stability during a repetitive lifting test. J Orthop Sports Phys Ther1997;25:3–12. [PubMed: 8979170]
Strandberg L. On accident analysis and slip-resistance measurement. Ergonomics 1983;26:11–32.[PubMed: 6832129]
Standberg L, Lanshammar H. The dynamics of slipping accidents. J Occup Accid 1981;3:153–62.Stergiou N, Jensen JL, Bates BT, Scholten SD, Tzetzis G. A dynamical systems investigation of lower
extremity coordination during running over obstacles. Clin Biomech 2001a;16:213–21.Stergiou N, Scholten SD, Jensen JL, Blanke D. Intralimb coordination following obstacle clearance
during running: the effect of obstacle height. Gait Posture 2001b;13:210–20. [PubMed: 11323227]Van Uden CJ, Bloo JK, Kooloos JG, van Kampen A, de Witte J, Wagenaar RC. Coordination and stability
of one-legged hopping patterns in patients with anterior cruciate ligament reconstruction: preliminaryresults. Clin Biomech (Bristol, Avon) 2003;18:84–7.
Van den Berg C, Beek PJ, Wagenaar RC, van Wieringen PC. Coordination disorders in patients withParkinson’s disease: a study of paced rhythmic forearm movements. Exp Brain Res 2000;134(2):174–186. [PubMed: 11037284]
Van Emmerik REA, Wagenaar RC. Effects of walking velocity on relative phase dynamics in the trunkin human walking. J Biomech 1996;29:1175–84. [PubMed: 8872274]
Whiting WC, Zernicke RF. Correlation of movement patterns via pattern recognition. J Mot Behav1982;14:135–42. [PubMed: 15155175]
Winstein CJ, Garfinkel A. Qualitative dynamics of disordered human locomotion: a preliminaryinvestigation. J Mot Behav 1989;21:373–91. [PubMed: 15136252]
Decker et al. Page 13
Appl Ergon. Author manuscript; available in PMC 2010 September 1.
NIH
-PA Author Manuscript
NIH
-PA Author Manuscript
NIH
-PA Author Manuscript

Winter, DA. The Biomechanics and Motor Control of Human Gait: Normal, Elderly, and Pathological.University of Waterloo Press; Ontario, Canada: 1991.
Decker et al. Page 14
Appl Ergon. Author manuscript; available in PMC 2010 September 1.
NIH
-PA Author Manuscript
NIH
-PA Author Manuscript
NIH
-PA Author Manuscript

Figure 1.Phase portraits (or phase planes) of the sagittal (a) thigh, (b) shank, and (c) foot motions froma representative trial for all conditions during stance. Black solid lines: low traction shoes; greysolid lines: high traction shoes.
Decker et al. Page 15
Appl Ergon. Author manuscript; available in PMC 2010 September 1.
NIH
-PA Author Manuscript
NIH
-PA Author Manuscript
NIH
-PA Author Manuscript

Figure 2.Relative phase curves for the sagittal foot-shank (a) and shank-thigh (b) segmental relationshipsfrom the same representative trial for all conditions during stance. Each curve is an ensembleaverage over all trials. The standard deviation curves are not represented on the graphs. Blacksolid lines: low traction shoes; grey solid lines: high traction shoes. Heel contact occurs at 0%of the stance phase, and toe-off occurs at 100% of the stance phase.
Decker et al. Page 16
Appl Ergon. Author manuscript; available in PMC 2010 September 1.
NIH
-PA Author Manuscript
NIH
-PA Author Manuscript
NIH
-PA Author Manuscript

NIH
-PA Author Manuscript
NIH
-PA Author Manuscript
NIH
-PA Author Manuscript
Decker et al. Page 17
Tabl
e 1
Gro
up m
eans
(M) a
nd st
anda
rd d
evia
tions
(SD
) for
MA
RP
and
DP.
Var
iabl
esL
ow tr
actio
nH
igh
trac
tion
0%10
%20
%40
%0%
10%
20%
40%
MA
RP
Stan
ceF-
SM
16.3
2416
.449
16.1
3016
.719
16.4
0617
.198
16.6
7516
.657
SD2.
439
3.63
03.
727
4.33
82.
464
3.61
33.
161
4.30
5
S-T
M37
.046
*10,
20,4
0%31
.279
*40%
30.7
71*4
0%27
.547
*41
.960
10,2
0,40
%36
.129
40%
33.9
5140
%30
.459
SD3.
022
4.48
13.
958
3.35
72.
415
3.43
74.
006
3.03
2
Bra
king
F-S
M21
.178
21.6
5021
.834
22.2
1420
.335
22.2
6421
.765
22.3
03
SD3.
079
4.26
24.
591
5.25
22.
973
5.10
54.
549
6.59
9
S-T
M21
.253
*10,
20,4
0%13
.993
13.3
6112
.278
24.8
2810
,20,
40%
16.5
9414
.567
13.2
41
SD5.
504
5.45
05.
912
5.03
14.
459
5.22
75.
360
3.28
4
Prop
ulsi
onF-
SM
10.4
8110
.097
9.48
712
.205
12.0
9011
.488
11.2
4212
.249
SD2.
671
3.38
33.
867
4.84
92.
678
2.72
02.
427
3.47
3
S-T
M55
.767
*20,
40%
51.7
90*4
0%48
.787
*40%
38.7
02*
60.6
920,
40%
57.1
3620
,40%
52.3
7640
%42
.620
SD3.
775
5.70
54.
651
5.35
93.
613
4.38
07.
155
5.61
5
DP
Stan
ceF-
SM
3.29
320,
40%
3.81
120,
40%
4.64
640%
5.95
32.
9381
0,20
,40%
3.91
620,
40%
4.97
340%
5.63
1
SD0.
376
0.47
30.
738
1.29
60.
470
0.67
10.
905
1.03
7
S-T
M5.
826*
10,2
0,40
%6.
7732
0,40
%8.
148*
8.74
84.
9091
0,20
,40%
6.66
440%
7.40
840%
8.65
0
SD0.
714
1.25
11.
860
1.79
40.
572
1.36
11.
147
1.56
3
Bra
king
F-S
M3.
9741
0,20
,40%
5.43
540%
6.77
940%
9.88
03.
6041
0,20
,40%
5.27
120,
40%
7.70
540%
9.35
2
SD0.
498
1.98
11.
705
3.17
20.
603
1.14
52.
572
1.33
4
S-T
M5.
7092
0,40
%6.
980†
20,4
0%9.
094†
40%
10.6
82†
5.12
510,
20,4
0%7.
7272
0,40
%10
.082
40%
11.6
74
SD1.
543
1.34
81.
444
2.58
70.
847
1.89
22.
034
2.01
6
Appl Ergon. Author manuscript; available in PMC 2010 September 1.

NIH
-PA Author Manuscript
NIH
-PA Author Manuscript
NIH
-PA Author Manuscript
Decker et al. Page 18
Var
iabl
esL
ow tr
actio
nH
igh
trac
tion
0%10
%20
%40
%0%
10%
20%
40%
Prop
ulsi
onF-
SM
2.80
320,
40%
3.05
620,
40%
3.78
940%
4.93
5†2.
3942
0,40
%2.
6762
0,40
%3.
7694
0%4.
462
SD0.
316
0.77
40.
934
1.03
90.
455
0.56
71.
077
0.69
5
S-T
M7.
276*
20,4
0%8.
465*
40%
9.58
210
.704
5.61
020,
40%
6.54
540%
8.04
29.
518
SD1.
448
2.00
12.
573
2.83
00.
571
1.20
42.
290
1.95
1
MA
RP:
Mea
n A
bsol
ute
valu
e of
the
ense
mbl
e R
elat
ive
Phas
e; D
P: D
evia
tion
Phas
e of
the
rela
tive
phas
e). T
he v
alue
s (in
deg
rees
) pre
sent
ed a
re fo
r eac
h co
ordi
nativ
e re
latio
nshi
p (F
S: fo
ot-s
hank
and
S-T
:sh
ank-
thig
h) a
nd fo
r eac
h pe
riod
(sta
nce,
bra
king
, and
pro
puls
ion)
.
* sign
ifica
ntly
diff
eren
t bet
wee
n sh
oes w
ithin
the
sam
e ob
stac
le h
eigh
t (p
< 0.
01).
† sign
ifica
ntly
diff
eren
t bet
wee
n sh
oes w
ithin
the
sam
e ob
stac
le h
eigh
t (p
< 0.
05).
10,2
0,40
%si
gnifi
cant
ly d
iffer
ent b
etw
een
obst
acle
hei
ghts
with
in th
e sa
me
shoe
(p <
0.0
1).
Appl Ergon. Author manuscript; available in PMC 2010 September 1.

NIH
-PA Author Manuscript
NIH
-PA Author Manuscript
NIH
-PA Author Manuscript
Decker et al. Page 19
Tabl
e 2
F-ra
tios f
rom
the
two-
way
AN
OV
A w
ith re
peat
ed m
easu
res o
n bo
th fa
ctor
s: sh
oe tr
actio
n (s
) × o
bsta
cles
(o).
Var
iabl
esFs
p <
Fop
<Fs
×op
<
MA
RP
Stan
ceF-
S0.
8156
-0.
319
-1.
509
-
S-T
79.0
080.
0139
.485
0.01
3.26
20.
05
Bra
king
F-S
0.00
84-
1.05
4-
1.02
0-
S-T
10.6
240.
0117
.225
0.01
1.97
2-
Prop
ulsi
onF-
S4.
431
-2.
094
-2.
551
-
S-T
29.8
130.
0150
.598
0.01
0.47
4-
DP
Stan
ceF-
S0.
2423
-51
.665
0.01
0.98
3-
S-T
14.8
280.
0137
.800
0.01
0.74
6-
Bra
king
F-S
0.03
21-
49.5
620.
010.
631
-
S-T
10.4
080.
0543
.859
0.01
0.87
2-
Prop
ulsi
onF-
S8.
296
0.05
36.7
720.
010.
460
-
S-T
17.8
910.
0111
.749
0.01
0.24
8-
MA
RP:
Mea
n A
bsol
ute
valu
e of
the
ense
mbl
e R
elat
ive
Phas
e; D
P: D
evia
tion
Phas
e of
the
rela
tive
phas
e; F
-S: f
oot-s
hank
; S-T
: sha
nk-th
igh.
Fs:
bet
wee
n sh
oes;
Fo:
bet
wee
n ob
stac
les;
Fs×
o: in
tera
ctio
n.
Appl Ergon. Author manuscript; available in PMC 2010 September 1.