The importance of venous Doppler velocimetry for evaluation of intrauterine growth restriction

The Effects of Intrauterine Malnutrition on Birthand Fertility Outcomes: Evidence From the 1974Bangladesh Famine
Rey Hernández-Julián & Hani Mansour &
Christina Peters
# Population Association of America 2014
Abstract This article uses the Bangladesh famine of 1974 as a natural experiment toestimate the impact of intrauterine malnutrition on sex of the child and infant mortality.In addition, we estimate the impact of malnutrition on post-famine pregnancy out-comes. Using the 1996 Matlab Health and Socioeconomic Survey (MHSS), we findthat women who were pregnant during the famine were less likely to have malechildren. Moreover, children who were in utero during the most severe period of theBangladesh famine were 32 % more likely to die within one month of birth comparedwith their siblings who were not in utero during the famine. Finally, we estimate theimpacts of the famine on subsequent pregnancy outcomes. Controlling for pre-faminefertility, we find that women who were pregnant during the famine experienced ahigher number of stillbirths in the post-famine years. This increase appears to be drivenby an excess number of male stillbirths.
Keywords Famine . Fertility . Fetal origins . Trivers-Willard . Infantmortality
Introduction
Famines have been associated with increased mortality in several regions of the worldand in many different periods. Although this association has been documented for allage groups, increased rates of mortality have been especially striking among infants.For instance, Lindeboom et al. (2010) estimated that approximately 25 % of childrenyounger than 1 died during the Dutch Potato Famine of 1847–1864. Infant mortality
DemographyDOI 10.1007/s13524-014-0326-5
R. Hernández-Julián : C. PetersDepartment of Economics, Metropolitan State University of Denver,CB 77, P.O. Box 173352, Denver, CO 80217, USA
H. Mansour (*)Department of Economics, University of Colorado Denver,CB 181, P.O. Box 173364, Denver, CO 80217, USAe-mail: [email protected]

rates also increased substantially during the Finnish famine of 1866–1868, the 1941–1944 siege of Leningrad, and the World War II Dutch famine (Hart 1993; Kannistoet al. 1997).
Large-scale famine events have also offered researchers the opportunity to study theimpact of intrauterine nutrition on the health and survival probabilities of infants(Almond et al. 2008; Lumey and Stein 1997; Razzaque et al. 1990; Stein and Susser1975). This is particularly important in light of Barker’s (1990) “fetal origins” hypoth-esis, which argues that in utero malnutrition adversely impacts the health of the fetusand leads to increased risk for future diseases (Almond and Currie 2011). Althoughserious famines are relatively rare, they enable researchers to circumvent factors such ashousehold environment and socioeconomic background that might confound the resultsof studies relying on self-reports of maternal nutrition. Thus, they present a uniquemethod of analyzing the impacts of fetal nutrition on child and adult outcomes.
The most comprehensive evidence on the impact of intrauterine malnutrition oninfant and adult outcomes comes from the 1944–1946 Dutch famine (Almond et al.2008). Stein and Susser (1975) found that pregnant women exposed to the Dutchfamine in their third trimester had lower postpartum weight, and their infants had lowerhead circumference and reduced length at birth compared with non-exposed womenand their infants. Lumey and Stein (1997) found that infants who were exposed to theDutch famine during the first trimester of gestation had lower birth weight, whileRoseboom et al. (2001a) found that late-term exposure was associated with increasedmortality among male infants. Hart (1993), on the other hand, compared the outcomesof infants who were exposed to different levels of famine intensity. She found noevidence that children in areas most affected by the famine had higher mortality.Exposure to the Dutch famine is also associated with negative adult outcomes, suchas increased risk of coronary heart disease (Roseboom et al. 2001b; Painter et al. 2005)and higher rates of antisocial personality disorders (Neugebauer et al. 1999). Studies ofother famines corroborate these results. Razzaque et al. (1990) found that childrenconceived during the 1974–1975 Bangladesh famine were at a higher risk of dyingbefore the age of 1 month but had a lower risk of death during their second year of lifecompared with children who were not conceived during the famine. Scott et al. (1995)found that a 1623 famine in northern England increased infant mortality, especiallyamong those who were exposed during the later stages of gestation. More recently,economists have documented a link between fetal malnutrition and subsequent adulteconomic outcomes. For instance, Almond et al. (2008) found that Chinesecohorts exposed to intrauterine malnutrition during the Chinese famine of1959–1962 had a higher probability of being illiterate as adults and were lesslikely to work.
Beyond their effects on health and economic outcomes, famines have also beenhypothesized to increase the ratio of female-to-male births. Such a link can beinterpreted in light of the Trivers-Willard (Trivers and Willard 1973) hypothesis thatmale infants will fare worse when parental conditions, such as health, are bad. From anevolutionary perspective, the reproductive advantage that females have during badconditions enables their mothers to maximize their number of grandchildren(Rosenfeld and Roberts 2004). If mothers in good conditions are able to have high-quality sons, then they can obtain more grandchildren through sons rather thandaughters given that those sons would be able to acquire multiple mates. In contrast,
R. Hernández-Julián et al.

mothers in bad conditions will obtain more grandchildren through daughters thanthrough sons (Almond and Edlund 2007; Cameron 2004).
Although this pattern has been observed among some nonhuman mammals (Hucket al. 1986; Meikle and Drickamer 1986; Rosenfeld and Roberts 2004), its existenceamong human populations is controversial, with studies continuing to provide mixedevidence (Cameron 2004). For example, Almond and Edlund (2007) found thatmarried mothers in the United States are more likely to give birth to a son comparedwith unmarried mothers, and also that poorly educated women are more likely to givebirth to daughters than more highly educated women. Further supporting thishypothesis, Almond et al. (2008) found an excess number of females among middle-aged Chinese cohorts who had been exposed in utero to the Chinese famine. Incontrast, neither Stein et al. (2004) nor Anderson and Bergstrom (1998) foundan association between intrauterine exposure to malnutrition and an excess offemale births.
Even when researchers have found an impact on the sex ratio, it has been difficult topin down the mechanism for this adjustment (Cameron 2004). One possibility is thatprenatal determination of an infant’s sex could lead to selective abortions, thus chang-ing the sex ratio at birth. However, without the ability to determine the sex of the infant,higher rates of infant male mortality is another mechanism that may lead to animbalance in the sex ratio. Consistent with this argument, Almond and Edlund(2007), using U.S. data, found that being married lowered the probability that adeceased infant was male. It is not clear, however, whether similar patternsemerge in the context of a developing country, particularly in one wherepreference for sons is pronounced.
Intrauterine malnutrition has also been shown to impact long-term reproductiveoutcomes. Despite the fact that no association was found between intrauterinemalnutrition and completed fertility, age at first pregnancy, or child spacing, Lumeyand Stein (1997) provided evidence that women who were in utero during the Dutchfamine had a higher risk of experiencing stillbirths and perinatal deaths later in life,especially those who were affected in the third trimester. More recently, Almond et al.(2008) provided evidence that intrauterine nutritional deprivation is linked to thereproductive outcomes of the next generation. Specifically, they found that childrenof those mothers who were exposed in utero to the Chinese famine were less likely tobe male. Existing studies, however, have not examined whether exposure to malnutri-tion during pregnancy will also impact the future outcomes of the mother herself inaddition to those of her exposed offspring.
Although this specific hypothesis has not been previously investigated, studies havedocumented a negative link between episodes of eating disorders and future pregnancyoutcomes. Bulik et al. (1999), for instance, found that women with a history of anorexianervosa had significantly more miscarriages and were more likely to deliver prematurebabies compared with a control group of women with no previous history of eatingdisorders. These findings are consistent with the findings of retrospective studies thatrelied on women’s own reporting of nutrition and pregnancy outcomes (Katz andVollenhoven 2000).
Despite this growing literature, some important questions remain unanswered, andothers need to be reexamined. First, do women exposed to malnutrition during preg-nancy have a higher probability of a female live birth? Second, conditional on being a
Intrauterine Malnutrition and Birth and Fertility Outcomes

live birth, do male infants exposed to fetal malnutrition have a higher probability ofearly mortality? We use the Bangladesh famine of 1974 (henceforth, “the famine”) as anatural experiment to answer these questions. Although Razzaque et al. (1990) alsoanalyzed mortality outcomes in the context of the Bangladesh famine, our analysiscompares the outcomes of siblings, only one of whom was exposed to the famine. Thiswithin-family analysis is an important methodological contribution because it controlsfor all time-invariant confounding factors at the family level; and unlike existingstudies, it does not rely on geographical variation in the intensity of famines or oncomparing children exposed at different stages of gestation.1 We also examine a thirdquestion: Does severe undernutrition during pregnancy impact the reproductiveoutcomes of exposed women in future pregnancies after the famine event is over? Inparticular, are women who experience a famine while pregnant more likely to havefuture miscarriages and stillbirths? Do these reproductive outcomes vary by the sex ofthe child? Despite the importance of understanding whether nutritional deprivationduring pregnancy impacts future reproductive outcomes, this is the first study that usesa natural experiment to link maternal malnutrition with subsequent fertility outcomes.
Famine Background
Bangladesh, formerly a part of India (known as East Bengal, and then East Pakistan),became independent in 1971. While part of the Indian colony, Bangladesh experiencedmassive death and suffering during the Great Bengal Famine of 1943. Both the IndiaFamine Inquiry Commission (1976) and Sen (1981) studied the causes and severity ofthis famine. Bangladesh suffered another significant famine in 1974, following asmaller one in 1971. Toward the middle of 1974, severe flooding led to a sharp risein unemployment, particularly among rural farmers and laborers (Sen 1981). Althoughfood availability remained unaffected until the harvest period later in the year, foodprices began to rise immediately, eventually increasing by 500 % (Dyson 1991).Although the precise cause of these increased prices remains unclear, the most likelyfactors appear to be macroeconomic and include a combination of inflation andspeculation about future price increases (Sen 1981). Regardless, the unemploymentand dramatic price increases placed a severe burden on rural areas.
The famine began in March of 1974, reaching its peak between July and October. Itbegan to subside by the end of that year, although the impact of high food prices andincreased mortality lasted well into 1975 (Alamgir 1980). Figure 1 depicts the price ofmedium rice in Bangladesh between July 1972 and June 1976 (Alamgir and Salimullah1977). The nationwide price of rice did not peak until February 1975, returning to pre-famine levels by the end of that year.
1 There are several other smaller differences between our studies. Razzaque et al. (1990) defined the period ofthe famine-born as July 1974 through June 1975 and compared the outcomes during that period with thoseduring a famine-conceived period of July 1975–1976 and a non-famine period between July 1976 and March1977. Our study uses a different definition of the famine—August 1974 to October 1975—based on themonths when the price of rice was more than 50 % higher than the pre-famine price. Our study also uses awider window of time as a control group and has other minor differences, such as our use of a multivariatelogistic regression instead of a univariate one.
R. Hernández-Julián et al.

The famine and high food prices led to increased mortality rates that persistedthrough 1976 (Razzaque et al. 1990). Estimates of fatalities range from 450,000 towell over 1 million (Alamgir 1980), which accounts for approximately 0.6 % to 1.3 %of the estimated national population (United Nations Secretariat 2003). Dyson(1991:287) used data from Matlab, the region of particular interest in this study, toplot mortality rates in Bangladesh before, during, and after the famine, showing a peakdeath rate in early 1975 that remained high well after the famine ended because manyremained weakened and sick. In fact, the death rate for both infants and the populationoverall was higher in 1975 than in 1974.
Although child mortality rates tend to be higher for females than for males in Matlabduring normal years (Choe and Razzaque 1990; Fauveau and Chakraborty 1994;Langsten 1981), the famine resulted in significant but similar increases in childmortality rates among male and female children (Bairagi 1986; Koenig and D’Souza1986). Moreover, fertility rates declined by about 34 % during 1974–1975, beforeincreasing by 17 % in the post-famine years, thereby partially offsetting the famine’seffect (Razzaque 1988).
Data
The 1996 Matlab Health and Socioeconomic Survey is a cross-sectional data setsampling 4,364 households in Matlab district, a poor rural and agricultural area ofBangladesh approximately 55 km southeast of Dhaka (Rahman et al. 1999). Thesehouseholds cover 2,687 baris (groups of households living and working together,sharing a common outdoor space), which account for a one-third random sample ofall Matlab baris. All women aged 15 and older in the sample were asked about theirfertility history, including any subsequent mortality outcomes for their children. Fromthis information, we are able to gather the date, sex, birth outcome (miscarriage,stillbirth, or live birth), and neonatal and infant mortality outcomes for 24,916 children
0
50
100
150
200
250
300
Fig. 1 Average retail price of coarse rice in Bangladesh
Intrauterine Malnutrition and Birth and Fertility Outcomes

born between 1919 and 1996. We then supplement this information on births withdemographic characteristics of the mother, including her age at the pregnancy outcome,age at first marriage, years of education (in years), adult height (in centimeters), and thenumber of male and female children she had prior to 1974. We also use informationabout the relative size of the infant at birth compared with other infants (i.e., muchbigger, bigger, smaller, or the same size); the number of prenatal visits that the motherhad during a given pregnancy; whether the infant was breast-fed; whether the child wasborn in a hospital, a clinic, or at home; and whether there was a skilled care providerpresent at the time of birth. These variables are important to account for in the empiricalanalysis because they could have an impact on the health and survival rates of theinfants and may be correlated with famine exposure.
The reliability of the women’s fertility histories depends on their ability to recallevery fertility event, but the events are cross-checked against birth records in the vitalevents database of Matlab. Thus, the mortality records should be unaffected by anyrecall bias. However, in terms of prenatal outcomes that would not be recorded in thevital events database (such as miscarriages or stillbirths), a small possibility remainsthat women are intentionally biased in the recall of their fertility history toward (oragainst) remembering stillborn male children compared with stillborn females, or theymay have better recall for instances that happen near dramatic events, such asthe famine. We discuss the potential implications of any such recall bias later inour Results section.
Our goal is to examine the effects of the 1974 famine on birth outcomes andsubsequent fertility outcomes. Examining the prices of rice in Fig. 1 suggeststhat the most severe period of the famine occurred between August 1974 andOctober 1975, when prices were more than 50 % higher than pre-famine levels.Thus, we first compare the birth outcomes for all live births occurring betweenSeptember 1974 and December 1975 to live births occurring in other periodsbetween 1970 and 1980.2 Children born within the treatment window ofSeptember 1974–December 1975 were in utero during the most severe part ofthe famine for at least one full month of the third trimester. A child born inSeptember 1974 would have experienced the famine for the full month ofAugust 1974. Assuming an average gestation length of 38 weeks (266 days),a child born in December 1975 would have experienced the famine for at leastone full month of the third trimester. Thus, we exclude from this initialtreatment group those infants who were exposed to the famine only in the firsttrimester as well as those infants exposed only in the first and second trimes-ters. This definition of the treatment is guided by the famine literature that hasprovided evidence that malnutrition may be particularly harmful to fetusesduring the last trimester (Lumey and Stein 1997). The timeline in Fig. 2 shows
2 When the specific month of birth was not remembered or unavailable, fieldworkers often coded the birth asoccurring in January. Thus, the data include an inaccurately large number of January births. The mainspecifications in this article are estimated with these January births included. However, all results (availableupon request) are qualitatively robust to the exclusion of January births from the sample. In addition, the years1970–1972 were also associated with bad crops, high food prices, and political turmoil. We estimated similarregressions in which we limited the sample to the years 1974–1980, effectively eliminating the war, earlierfamine, and hardship from the control group; we found similar qualitative and quantitative results, which areavailable upon request.
R. Hernández-Julián et al.

the span of this treatment as well as alternate treatment windows, which wediscuss in detail in The Empirical Model section.
Our outcomes of interest include whether the child is male, whether the child diedduring the first 29 days of life (neonatal mortality), and whether the child died duringthe 1–12 months after birth (postneonatal mortality). Table 1 presents the mean valuesof these key outcomes for children who were in utero during the famine, the means forchildren who were in utero in other periods, and the difference between them.Compared with nonaffected children, children in utero during the famine had signifi-cantly higher mortality rates in the first month after birth but had similar postneonatalmortality rates compared with non-affected children. Children exposed in utero are lesslikely to be male, although this difference is not statistically significant. The rates ofmiscarriages and stillbirths, however, are not statistically different between childrenwho were in utero during the famine and children who were not. There is no otherstatistically significant difference between children on any other observable character-istic, such as mother’s age at first marriage or mother’s age at birth.
To determine whether the famine had a lasting impact on subsequent fertility,Table 2 compares key post-famine fertility outcomes of women who becamepregnant after a long period of exposure to the famine (had a live birth, stillbirth,or miscarriage between January 1976 and July 1976) with all other women aged15 and older who were not pregnant during the famine. Women who experienceda pregnancy outcome between January 1976 and July 1976 would have becomepregnant after at least nine months of exposure to the famine but before thefamine was over. Thus, in contrast to the immediate effects we expect to see onchildren in utero, we hypothesize that malnutrition may take longer to affect theadult mothers themselves.
After separating women who were fertile during the famine according to whetherthey became pregnant before the famine ended but still following at least nine monthsof famine exposure, we then examine their post-famine fertility outcomes for everypregnancy outcome that occurred after 1977. Limiting the post-famine pregnancyoutcomes to only those occurring after 1977 ensures that these outcomes are notaffected by any direct impacts of the famine itself, which had been over for one yearby that time. Specifically, we are interested in whether the post-famine pregnanciesresulted in miscarriages or stillbirths. As shown in Table 2, we find little evidence that
Rice prices more than 50% above pre-famine levels
Exposed at least one month of third trimester
Exposed for9 months
Exposed full third trimester plus at least one month of second trimester
Birthdates
Fig. 2 Famine and treatment timeline
Intrauterine Malnutrition and Birth and Fertility Outcomes

women who became pregnant after exposure to the famine were more likely tohave a post-famine miscarriage. In contrast, the simple mean comparisonsuggests that women who were pregnant during the famine were more likelyto have a stillbirth in a future, post-famine pregnancy and particularly morelikely to have a male stillbirth.
The descriptive statistics also suggest that women who were pregnant duringthe famine are positively selected on observable characteristics: they havehigher educational levels, are married to more-educated husbands, and marriedat a younger age. Moreover, they had a larger number of sons before thefamine. Although our empirical specifications control for these factors, wepresent results that decompose the sample by spouse’s education and landhold-ings. This analysis allows us to examine whether the results vary by socioeco-nomic background.
Table 1 Descriptive statistics on the children
Child OutcomeIn UteroDuring Famine N
In UteroOther Years N Difference
Male 0.53 539 0.55 4,510 –0.02
(0.50) (0.50) (0.02)
Death by 1 Month 0.08 633 0.06 5,523 0.02*
(0.27) (0.23) (0.01)
Death Between 1 Month and 1 Year 0.05 581 0.05 5,202 0.00
(0.22) (0.21) (0.01)
Miscarriage 0.04 588 0.03 4,825 0.01
(0.19) (0.16) (0.01)
Stillbirth 0.03 588 0.02 4,825 0.01
(0.16) (0.14) (0.01)
Mother’s Education 1.43 539 1.36 4,510 0.07
(2.45) (2.36) (0.11)
Mother’s Age at First Marriage 14.35 539 14.24 4,510 0.11
(4.69) (3.40) (0.16)
Mother’s Age When Child Was Born 25.71 539 26.25 4,510 –0.54
(6.73) (7.04) (0.32)
Mother’s Adult Height (cm) 148.74 539 148.85 4,510 –0.10
(5.99) (6.02) (0.27)
Number of Older Brothers 1.60 539 1.59 4,510 0.01
(1.53) (1.60) (0.07)
Number of Older Sisters 1.45 539 1.49 4,510 –0.03
(1.50) (1.50) (0.07)
Notes: Standard deviations are shown in parentheses for means. Standard errors are shown in parentheses forthe difference. Child outcomes include all live births during 1970–1980. “Born during famine” refers to birthsbetween September 1974 and December 1975. The number of older brothers and sisters include onlylive births.
*p < .05
R. Hernández-Julián et al.

The Empirical Model
Children Specifications
We start by estimating the following probit regression for children born between 1970and 1980:3
Ci ¼ α þ β1Faminei þ β2YOBi þ Xiδþ εi; ð1Þ
Table 2 Descriptive statistics on the mothers
Maternal OutcomesExperienced FaminePregnancy N
No Experience ofFamine Pregnancy N Difference
Post-Famine Pregnancy Resultedin Miscarriage
0.06 712 0.06 4,760 –0.01
(0.23) (0.25) (0.01)
Post-Famine Pregnancy Resultedin Stillbirth
0.05 712 0.03 4,760 0.02**
(0.54) (0.54) (0.02)
Post-Famine Pregnancy Resultedin Male Stillbirth
0.06 356 0.03 2,204 0.03**
(0.24) (0.17) (0.01)
Post-Famine Pregnancy Resultedin Female Stillbirth
0.05 356 0.03 2,556 0.02†
(0.21) (0.17) (0.01)
Years of Education 1.88 712 1.31 2,760 0.57**
(2.70) (2.34) (0.10)
Age at First Marriage 14.53 712 14.46 2,760 0.07
(2.29) (3.35) (0.13)
Age When Child Was Born 26.73 712 27.35 2,760 –0.62*
(6.69) (6.97) (0.28)
Spouse’s Education (years) 4.13 712 3.52 2,760 0.61**
(4.18) (3.88) (0.16)
Adult Height (cm) 148.92 712 149.18 2,760 –0.26
(5.36) (6.13) (0.24)
Number of Sons Born BeforeFamine
1.01 712 0.91 2,760 0.61**
(1.27) (1.21) (0.16)
Number of Daughters Born BeforeFamine
0.82 712 0.74 2,760 0.10*
(1.02) (1.14) (0.05)
Number of Sons Born AfterFamine
1.91 712 1.99 2,760 –0.08
(1.50) (1.36) (0.06)
Number of Daughters Born AfterFamine
1.80 712 1.98 2,760 –0.18**
(1.31) (1.43) (0.06)
Notes: Standard deviations are shown in parentheses for means. Standard errors are shown in parentheses forthe difference. “Famine Pregnancy” refers to birth outcomes (live, stillbirth, or miscarriage) during January1976–July 1976. The number of older brothers and sisters include only live births.†p < .10; *p < .05; **p < .01
3 The different empirical specifications follow those used in the literature. See, for example, Almond (2006),Almond et al. (2008), Almond and Mazumder (2011), Camacho (2008) and Mansour and Rees (2012).
Intrauterine Malnutrition and Birth and Fertility Outcomes
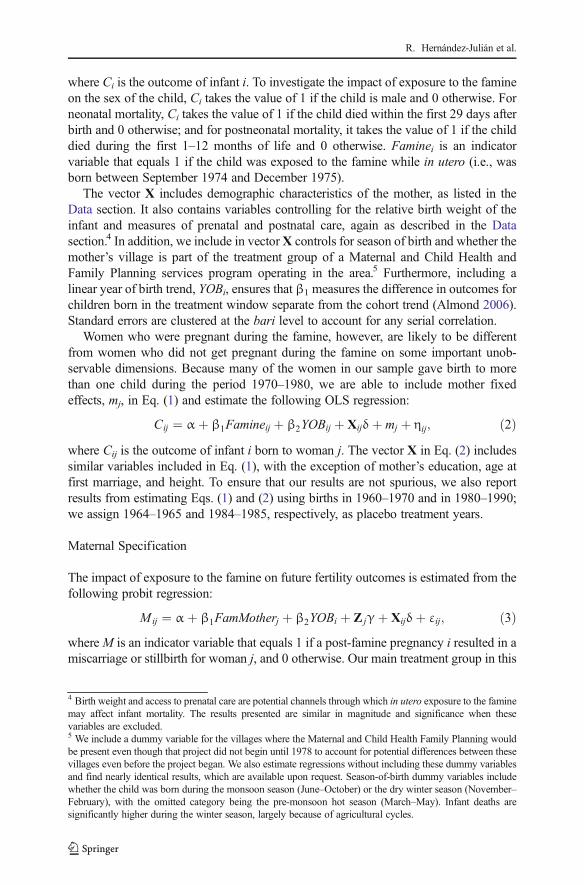
where Ci is the outcome of infant i. To investigate the impact of exposure to the famineon the sex of the child, Ci takes the value of 1 if the child is male and 0 otherwise. Forneonatal mortality, Ci takes the value of 1 if the child died within the first 29 days afterbirth and 0 otherwise; and for postneonatal mortality, it takes the value of 1 if the childdied during the first 1–12 months of life and 0 otherwise. Faminei is an indicatorvariable that equals 1 if the child was exposed to the famine while in utero (i.e., wasborn between September 1974 and December 1975).
The vector X includes demographic characteristics of the mother, as listed in theData section. It also contains variables controlling for the relative birth weight of theinfant and measures of prenatal and postnatal care, again as described in the Datasection.4 In addition, we include in vectorX controls for season of birth and whether themother’s village is part of the treatment group of a Maternal and Child Health andFamily Planning services program operating in the area.5 Furthermore, including alinear year of birth trend, YOBi, ensures that β1 measures the difference in outcomes forchildren born in the treatment window separate from the cohort trend (Almond 2006).Standard errors are clustered at the bari level to account for any serial correlation.
Women who were pregnant during the famine, however, are likely to be differentfrom women who did not get pregnant during the famine on some important unob-servable dimensions. Because many of the women in our sample gave birth to morethan one child during the period 1970–1980, we are able to include mother fixedeffects, mj, in Eq. (1) and estimate the following OLS regression:
Cij ¼ α þ β1Famineij þ β2YOBij þ Xijδþ mj þ ηij; ð2Þwhere Cij is the outcome of infant i born to woman j. The vector X in Eq. (2) includessimilar variables included in Eq. (1), with the exception of mother’s education, age atfirst marriage, and height. To ensure that our results are not spurious, we also reportresults from estimating Eqs. (1) and (2) using births in 1960–1970 and in 1980–1990;we assign 1964–1965 and 1984–1985, respectively, as placebo treatment years.
Maternal Specification
The impact of exposure to the famine on future fertility outcomes is estimated from thefollowing probit regression:
Mij ¼ α þ β1FamMotherj þ β2YOBi þ Z jγþ Xijδþ εij; ð3ÞwhereM is an indicator variable that equals 1 if a post-famine pregnancy i resulted in amiscarriage or stillbirth for woman j, and 0 otherwise. Our main treatment group in this
4 Birth weight and access to prenatal care are potential channels through which in utero exposure to the faminemay affect infant mortality. The results presented are similar in magnitude and significance when thesevariables are excluded.5 We include a dummy variable for the villages where the Maternal and Child Health Family Planning wouldbe present even though that project did not begin until 1978 to account for potential differences between thesevillages even before the project began. We also estimate regressions without including these dummy variablesand find nearly identical results, which are available upon request. Season-of-birth dummy variables includewhether the child was born during the monsoon season (June–October) or the dry winter season (November–February), with the omitted category being the pre-monsoon hot season (March–May). Infant deaths aresignificantly higher during the winter season, largely because of agricultural cycles.
R. Hernández-Julián et al.

specification differs from the one that we considered for the child’s outcomes.Specifically, the indicator variable FamMother takes the value of 1 if the mother hadany pregnancy outcome between January 1976 and July 1976 (miscarriage, stillbirth, orlive birth). This birth window implies that the mother conceived between April 1975and October 1975 and would have been exposed to at least nine months of the faminebefore becoming pregnant, assuming an average gestation length of 38 weeks. Thus,we compare the likelihood of a miscarriage and stillbirth for women who becamepregnant after a lengthy period of exposure to the famine with women who did notbecome pregnant after their exposure to malnutrition. The vector X includes controlssimilar to those included in Eq. (1), with the exception of prenatal and postnatalhealthcare indicators, which cannot be included in a sample of pregnancy outcomesthat are not all carried to term. In addition to the total number of pre-famine (pre-1974)livemale and female births for woman j included inX, vectorZ includes post-famine livebirths by sex (post-1976) and spouse’s education. Later in the article, we reproduce theresults using different periods of exposure to the famine. Because FamMother does notvary by pregnancy outcome, we cannot include mother fixed effects in this specification.
Results
Children Findings
Table 3 presents the estimation results for Eqs. (1) and (2). Looking at the impliedmarginal effects, children born between September 1974 and December 1975 are 2percentage points less likely to be male (column 2), although this estimate is notsignificant at conventional levels. As one would expect, because the sex of a childcan be considered random, the coefficient estimates for most of the controls listed in theprevious section (not reported in Table 3) are small and not statistically significant.
Columns 4 and 7 of Table 3 show estimation results of Eq. (1) using infant mortality atone month, and between one month and one year as the outcomes. Marginal effectsevaluated at the mean are shown in columns 5 and 8. Children born during the treatmentperiod are 2 percentage points more likely to die within their first month after birth (a 32%increase over the mean) but have no difference in life expectancy between one month andone year. Consistent with the findings of Razzaque et al. (1990), exposure to the famine inutero increased the probability of neonatal mortality. Although not presented in this article,the controls in the regressions have expected signs. For instance, mother’s age at birth isnegatively correlated with mortality within one month of birth, and children who werereported as being smaller than average at birth have a higher likelihood of mortality.
Perhaps mothers who opt to get pregnant during famine periods are unobservablydifferent from mothers who do not. For instance, maybe more cautious mothers whoare concerned about their potential child’s health avoid becoming pregnant during foodshortages.6 To control for such traits, we include mother fixed effects in the regressions
6 This type of selection implies that women who choose to become pregnant during a famine are negativelyselected. Based on observable measures, the descriptive statistics from Table 2 suggest the opposite: althoughthe magnitude of the difference is not large, women who became pregnant during the famine were moreeducated and married spouses who were more educated, compared with women who avoided pregnancy.
Intrauterine Malnutrition and Birth and Fertility Outcomes

in columns 3, 6, and 9, thereby limiting the sample to children whose mothershad both a famine-affected birth and a birth that was not affected within thesample period. The infant mortality results remain similar in both magnitudeand significance to our original probit models when mother fixed effects are notincluded, which gives us confidence that the natural experiment is indeed valid.However, in contrast to the findings of Razzaque et al. (1990), the fixed-effectsspecification in column 3 indicates a clear and significant decrease in theprobability of male birth. Specifically, women who were pregnant during thefamine are 4 % less likely to have a male birth compared with women whowere pregnant during the surrounding years (significant at the 5 % level). Thus,our results provide evidence in favor of the Trivers-Willard hypothesis thatwomen are less likely to give birth to sons during lean times.
Although the mother fixed effects capture relevant time-invariant characteristics ofthe mother, one lingering concern may be the possibility of nonrandom migration bymales during the famine. We are unable to observe the presence of the father or toaccount for the pregnancies and births that did not take place because the father wasabsent. However, Kuhn (2005) found that single men in Matlab were most likely tomigrate for work compared with married men and men who own less land. We would
Table 3 Impact of famine on sex ratio and infant mortality
Likelihood ofMale Birth
Death During First0–29 Days
Death During First1–12 Months
Probit ME FE Probit ME FE Probit ME FE
(1) (2) (3) (4) (5) (6) (7) (8) (9)
In Utero During Famine –0.05 –0.02 –0.04* 0.19* 0.02 0.02† 0.02 0.00 –0.01
(1970–1980 cohorts) (0.06) (0.02) (0.08) (0.01) (0.01) (0.01)
N 5,049 4,441 6,156 5,601 5,783 5,195
Placebo Famines
In utero during 1964 famine –0.05 –0.02 –0.04 –0.09 –0.01 –0.01 –0.06 –0.01 –0.01
(1960–1970 cohorts) (0.08) (0.03) (0.10) (0.01) (0.10) (0.01)
N 2,963 2,495 4,809 4,460 4,474 4,133
In utero during 1984 famine –0.00 –0.00 –0.01 –0.04 –0.00 –0.00 –0.18 –0.01 –0.01
(1980–1990 cohorts) (0.05) (0.01) (0.01) (0.01) (0.11) (0.01)
N 5,998 5,254 6,349 5,611 6,034 5,256
Notes: “In utero during famine” refers to births between September 1, 1974, and December 31, 1975. Standarderrors, corrected for clustering at the bari level, are shown in parentheses. Marginal effects, labeled ME, areevaluated at the mean. Mother fixed effects are included in columns labeled FE. All regressions includecontrols for year-of-birth linear trend; mother’s education, age at first marriage, age at birth, and age at birthsquared; height in 1996; number of older brothers and sisters; indicators for size at birth; indicators for seasonat birth; the number of prenatal checkups; whether the child was breast-fed; whether the child was bornin a hospital, a clinic, or at home; whether there was a skilled care provider present at birth; and anindicator for whether the mother’s village is in the treatment group of a Maternal and Child HealthPlanning services program.†p < .10; *p < .05
R. Hernández-Julián et al.

be most concerned about this type of selection bias if our data showed larger famineeffects on children from families with fewer landholdings. In a later section of thisarticle, we show that wealthier families faced the largest impacts during the famine,which leads us to conclude that selective migration is likely not a significant mecha-nism driving our results. Another concern could be that the famine changed access oravailability of family planning methods. Although possible, it is unlikely in theBangladeshi context. Access to family planning clinics and availability of contracep-tives was extremely limited in Matlab prior to 1978 (Janowitz et al. 1997), and thegovernment-run clinics providing counseling on family planning were mostly run bymale workers and were often dirty and unsterile (Joshi and Schultz 2007).
To test whether our results are spurious, we conduct two sets of placebo tests. Weestimate Eqs. (1) and (2) using the same outcomes as the previous regressions butredefining the treatment and sample around the years 1964 and 1984. Neither 1964 nor1984 were affected by famine, war, monsoon, or other catastrophic events. The samplefor the 1964 placebo test includes births between 1960 and 1970. For the 1984 placebotest, the sample includes births between 1980 and 1990. The results of these analysesare presented in Table 3. Unlike our results for the famine cohort, we find no significantdifference between the likelihood of a male birth in the placebo treatment year and theother birth years in the samples. In addition, estimates from the infant mortalityregressions remain small and insignificant, further supporting our findings that the1974–1975 famine is the driving factor behind the increased infant mortality observedin our main results. We do not believe that recall bias is a concern given that ouroutcomes of interest are verifiable using the vital statistics registries.
As an alternative to placebo years, we also estimate each of our main specificationsafter incorporating decade-of-birth dummy variables interacted with the famine treat-ment window, using the full record of births covering 1919–1996. Results are qualita-tively similar to our findings for the placebo years and are available upon request. Wealso estimate a regression that limits the sample to births between 1974 and 1980 giventhat Bangladesh suffered a war and a lesser famine from 1970–1973. Results fromthose regressions are nearly identical to those presented here and are also availableupon request. In other results not presented, we estimate whether the famine increasedthe likelihood of miscarriage or stillbirth and find a small (2 %) increase in thelikelihood of miscarriage but no relationship with stillbirths.
Table 4 presents infant mortality results separately for male and female infants. Thecoefficient estimates suggest that the results from Table 3 are in fact driven by malemortality. The results given in columns 2 and 3 imply that male infants who wereexposed to the famine in utero were 3 to 4 percentage points more likely to die withinthe first month after birth. Female infants, on the other hand, do not have significantlydifferent survival rates associated with famine exposure. The estimates using 1964 or1984 as placebo famine years do not indicate any positive relationship with infantmortality rates.
In Table 5, we vary the window of treatment to better understand the impact ofexposure to malnutrition through the different stages of pregnancy. The first rowrepeats the main results from Table 3, and the second and third rows alter the lengthof the treatment, effectively increasing the amount of time that the infant is exposed tothe famine while in utero. The treatment window of births in the next row—betweenDecember 1, 1974, and October 31, 1975—means that the child would have been
Intrauterine Malnutrition and Birth and Fertility Outcomes

exposed to the famine for the full third trimester and at least one month of the secondtrimester. The treatment window of April 1, 1975, through October 31, 1975, meansthat the child would have been exposed to the famine during the entire nine months inutero. The results from Table 5 suggest that as the time of exposure to faminelengthens, the adverse impacts of malnutrition become worse but possibly at a decreas-ing rate. The marginal effects for infant mortality at one month become slightly largerin magnitude when we include possible second-trimester exposure but become statis-tically insignificant when we examine the impact of being exposed for the full ninemonths of pregnancy. Moreover, the likelihood of a male birth is consistently negativeand statistically significant across the different exposure windows but increases (inabsolute value) only when we include possible second-trimester exposure. Thus, theresults suggest that male fetuses are especially vulnerable to malnutrition during theirfirst and second trimesters in utero.
Taken together, the results of Tables 3, 4, and 5 suggest that famine exposuresignificantly decreases the likelihood of a male birth while increasing the likelihoodof infant mortality by one month, particularly for male infants. However, theadverse effects of the famine appear to fade as the child reaches age 1: the famine
Table 4 Impact of famine on infant mortality, by sex
Death During 0–29 Days Death During First 1–12 Months
Male Female Male Female
Probit ME FE Probit ME FE Probit ME FE Probit ME FE
(1) (2) (3) (4) (5) (6) (7) (8) (9) (10) (11) (12)
In Utero DuringFamine
0.34** 0.04 0.04** 0.05 0.01 0.01 0.06 –0.00 –0.00 0.07 0.01 0.01
(1970–1980cohorts)
(0.108) (0.16) (0.13) (0.02) (0.13) (0.02) (0.12) (0.02)
N 3,236 2,296 2,965 2,068 3,014 2,080 2,740 1,863
Placebo Famines
In utero during1964 famine
–0.05 –0.01 –0.00 –0.16 –0.01 –0.05* –0.14 –0.01 –0.01 0.01 0.00 0.00
(1960–1970cohorts)
(0.12) (0.02) (0.17) (0.02) (0.15) (0.02) (0.13) (0.03)
N 2,486 1,874 2,297 1,737 2,286 1,696 2,141 1,584
In utero during1984 famine
0.07 0.01 0.01 –0.19 –0.01 –0.03* –0.41* –0.02 –0.01 –0.02 –0.00 –0.00
(1980–1990cohorts)
(0.11) (0.02) (0.12) (0.02) (0.20) (0.02) (0.12) (0.02)
N 3,191 2,275 2,943 2,048 2,979 1,916 2,961 1,871
Notes: “In utero during famine” refers to births between September 1, 1974, and December 31, 1975. Standarderrors, corrected for clustering at the bari level, are shown in parentheses. Marginal effects, labeled ME, areevaluated at the mean. Mother fixed effects are included in columns labeled FE. See the notes to Table 3 for alist of controls.
*p < .05; **p < .01
R. Hernández-Julián et al.

coefficients on the likelihood of death between one month and one year arestatistically insignificant.
Maternal Findings
The previous estimations focused on the effect of the famine on children in utero.However, a famine pregnancy could also affect the mother. The next regressionsestimate how experiencing a pregnancy after famine exposure is related to women’slong-term fertility outcomes. The results from estimating Eq. (3) are reported inTable 6. We find no evidence of a relationship between exposure to the famine andfuture miscarriages. However, the results suggest that becoming pregnant after expo-sure to famine increases the likelihood of a stillbirth by about 2 percentage points (a61 % increase over the mean; see column 4). Because it is possible to identify the sex ofa stillborn child, we estimate the number of stillbirths separately for male and femalestillbirths. Although future female stillbirths are more common among women whobecame pregnant during exposure to the famine, this difference is not significant. Incontrast, male stillbirths (which are always more common than female stillbirths)become significantly even more common among these women.
In a culture with some preference toward males, perhaps this difference is driven bya bias in recall: male stillbirths may be more often remembered than female ones. Toalleviate this concern, we estimate the same regression using placebo famines in 1964and 1984, finding no evidence of an increased likelihood of male stillbirth among thesecohorts. Furthermore, we do not believe that any recall bias in the timing of thestillbirths would be correlated with the famine because all these stillbirths took placeafter the famine. There may be some recall bias on whether the mother experienced apost-famine pregnancy; however, because any such bias would misassign some treatedwomen to the comparison group, it would place only a downward bias on our results.
Table 5 Impact of famine on sex ratio and infant mortality: Alternative measures of exposure
Likelihood of MaleBirth
Death During First0–29 Days
Death During First 1–12 Months
Probit ME FE Probit ME FE Probit ME FE
Famine Exposure in Utero (1) (2) (3) (4) (5) (6) (7) (8) (9)
At Least 1 Month of Third Trimester –0.05 –0.02 –0.04* 0.19* 0.02 0.02 0.02 0.00 –0.01
(0.06) (0.02) (0.08) (0.01) (0.01) (0.01)
Third Trimester + at Least 1 Monthof Second Trimester
–0.08 –0.03 –0.06* 0.26* 0.03 0.03† 0.01 0.00 –0.00
(0.07) (0.02) (0.09) (0.01) (0.11) (0.01)
Full 9 Months –0.06 –0.03 –0.06† 0.20 0.02 0.02 –0.13 –0.01 –0.02
(0.09) (0.03) (0.15) (0.02) (0.19) (0.02)
N 5,049 4,441 6,156 5,601 5,783 5,195
Notes: Standard errors, corrected for clustering at the bari level, are shown in parentheses. Samples include allbirths that occurred during 1970–1980. Marginal effects, labeled ME, are evaluated at the mean. Mother fixedeffects are included in columns labeled FE. See the notes to Table 3 for a list of controls.†p < .10; *p < .05
Intrauterine Malnutrition and Birth and Fertility Outcomes

To check the sensitivity of the results to the treatment window chosen in Table 6,Table 7 presents estimates of Eq. (3), where we vary the definition of exposure to thefamine. The first row repeats the original specification from Table 6, where treatedwomen are those who had a pregnancy outcome between January 1, 1976, and July 31,1976. The next two rows follow the same rule that the woman must become pregnantbefore the famine is over but reduces famine exposure to six months (pregnancyoutcome between October 1, 1975, and July 31, 1976). The third row reduces timeof exposure to the famine to three months (pregnancy outcome between July 1, 1975,and July 31, 1976). The effect of the famine on future stillbirths is consistentlysignificant at the 1 % or 5 % level, with a marginal effect around 2 percentage points.Moreover, this effect becomes stronger when the fetus is male. For purposes ofcomparison, the last row of Table 7 restricts the treatment to the same window usedfor infants in Table 3. This window does not generate significant results, whichsuggests that malnutrition resulting from famine may take longer to affect adults thanchildren. This result is consistent with the medical literature on malnutrition amongadults (Collins 1995; Davis 1996).
The Role of Demographic Characteristics
Finally, we investigate whether the results vary by family’s wealth or education level.As reported earlier, the descriptive statistics suggest that women who became pregnant
Table 6 Impact of famine on post-famine pregnancy outcomes
Miscarriage StillbirthStillbirthMale Fetus
StillbirthFemale Fetus
Probit ME Probit ME Probit ME Probit ME
(1) (2) (3) (4) (5) (6) (7) (8)
Pregnancy Outcome Jan. 1976–July 1976 –0.10 –0.01 0.27** 0.02 0.35** 0.03 0.20 0.01
(9 months of exposure, thenbecame pregnant)
(0.09) (0.01) (0.13) (0.14)
N 5,472 5,472 2,560 2,558
Placebo Famines
Pregnancy outcome Jan. 1966–July 1966 –0.02 –0.00 –0.17 –0.01 –0.11 –0.01 –0.19 –0.01
(1960–1970 cohorts) (0.10) (0.11) (0.15) (0.19)
N 5,502 5,502 2,669 2,568
Pregnancy outcome Jan. 1986–July 1986 0.02 0.00 0.01 0.00 –0.13 –0.01 0.20 0.01
(1980–1990 cohorts) (0.10) (0.12) (0.18) (0.17)
N 3,862 3,862 1,765 1,799
Notes: Standard errors, corrected for clustering at the bari level, are shown in parentheses. Marginal effects,labeledME, are evaluated at the mean. Controls include education, age at first marriage, age at child’s birth, ageat birth squared, height, indicator for whether the mother resides in a treatment group village of a Maternal andChild Health and Family Planning services program, total number of sons born before the famine (live births),total number of daughters born before the famine (live births), spouse’s years of education, total number of sonsborn after the famine (live births), and total number of daughters born after the famine (live births).
**p < .01
R. Hernández-Julián et al.

during the famine may have been positively selected on observable characteristics.Unfortunately, our data set does not provide direct information on wealth or income atthe time of birth. However, our data include information on landholdings by householdin 1996 (the year of the survey). Because land is the largest household asset in Matlab,it provides a good proxy for wealth. Moreover, the inactive nature of land exchanges inthe South Asian land market (at least during the period of our data) enables us to makethe reasonable assumption that households that reported owning land at the time of thesurvey were also landholders at the time of their child’s birth (for more detaileddescriptions of the land market, see Binswinger and Rosenzweig (1986), Pitt andKhandker (1998) and Rosenzweig and Wolpin (1985)). In fact, several studies havefound turnover in landownership to be so low that they have suggested that land may beused as an exogenous variable (e.g., Pitt and Khandker 1998).
Table 8 reports results on the impact of exposure to the famine in utero bylandholdings and years of schooling of the husband, another proxy for socioeconomicstatus. To facilitate the comparison, the first row repeats the results from Table 3. Thesecond and third rows report the results for the top and bottom tercile in landholdings(measured in decimals), respectively. Although the results in column 3 suggest anegative association between exposure to in utero malnutrition and the likelihood ofa male birth across the different socioeconomic groups, the results are statistically
Table 7 Impact of famine on post-famine pregnancy outcomes: Alternative measures of exposure
Miscarriage StillbirthStillbirthMale Fetus
StillbirthFemaleFetus
Probit ME Probit ME Probit ME Probit ME
(1) (2) (3) (4) (5) (6) (7) (8)
Pregnancy Outcome Jan. 1976–July 1976 –0.10 –0.01 0.27** 0.02 0.35** 0.03 0.20 0.01
(9 months of exposure, and thenbecame pregnant)
(0.09) (0.01) (0.13) (0.14)
Pregnancy Outcome Oct. 1975–July 1976 –0.02 –0.00 0.16* 0.01 0.19† 0.01 0.18† 0.01
(6 months of exposure, and thenbecame pregnant)
(0.06) (0.08) (0.11) (0.11)
Pregnancy Outcome July 1975–July 1976 –0.11 –0.01 0.22** 0.02 0.31** 0.02 0.15 0.01
(3 months of exposure, and then becamepregnant)
(0.07) (0.08) (0.11) (0.12)
Pregnancy Outcome Sept. 1974–Dec. 1975 0.03 0.00 0.07 0.00 0.12 0.01 0.08 0.00
(treatment window used for child outcomes) (0.07) (0.08) (0.12) (0.11)
Number of Observations 5,472 5,472 2,560 2,558
Notes: Standard errors, corrected for clustering at the bari level, are shown in parentheses. The sample is allwomen fertile during the 1975 famine. Marginal effects, labeled ME, are evaluated at the mean. Controlsinclude education, age at first marriage, age at child’s birth, age at birth squared, height, indicator for whethermother resides in a treatment group village of a Maternal and Child Health and Family Planning servicesprogram, total number of sons born before the famine (live births), total number of daughters born before thefamine (live births), spouse’s years of education, total number of sons born after the famine (live births), andtotal number of daughters born after the famine (live births).†p < .10; *p < .05; **p < .01
Intrauterine Malnutrition and Birth and Fertility Outcomes

insignificant, perhaps because of the significantly reduced sample size. The results forinfant mortality, however, do vary by landholdings. Specifically, we find that childrenborn to mothers in the top tercile of landholdings are more likely to die within onemonth of birth compared with children born to mothers in the bottom tercile of thelandholdings distribution. This pattern of results is consistent with the finding reportedearlier that women who became pregnant during the famine are more educated (whensurveyed in 1996) and are married to more-educated husbands compared with womenwho avoid getting pregnant during the famine. The results for infant mortality byhusband’s years of schooling are generally not statistically significant, but the magni-tude of the results suggests that children of women with more-educated spouses faced ahigher likelihood of mortality, further supporting the idea that women who becamepregnant during the famine are positively selected in terms of wealth and education.
We also repeat the analysis of post-famine pregnancy outcomes by landholdings andeducation. The results, shown in Table 9, suggest that women from households in bothparts of the landholdings distribution are more likely to have post-famine stillbirths.Similar to the results in the full sample, the excess stillbirths are mainly driven bymales. The magnitude of the results is slightly larger for women in the bottom tercile ofthe landholdings distribution, but the estimates between the two terciles are not
Table 8 Impact of famine on sex ratio and infant mortality: Subsamples by landholdings and spouse’seducation
Likelihood of MaleBirth
Death DuringFirst 0–29 Days
Death DuringFirst 1–12 Months
Probit ME FE Probit ME FE Probit ME FE
In Utero During Famine (1) (2) (3) (4) (5) (6) (7) (8) (9)
Full Sample –0.05 –0.02 –0.04* 0.19* 0.02 0.02† 0.02 0.00 –0.01
(0.06) (0.02) (0.08) (0.01) (0.01) (0.01)
N 5,049 4,441 6,156 5,601 5,783 5,195
Top Tercile in Landholdings 0.00 0.00 –0.03 0.32* 0.04 0.04* –0.09 –0.01 –0.00
(0.06) (0.02) (0.13) (0.02) (0.19) (0.02)
N 1,809 1,609 2,155 1,991 1,989 1,849
Bottom Tercile in Landholdings –0.00 –0.00 –0.14 0.18 0.02 0.03 0.19 0.02 –0.01
(0.11) (0.10) (0.16) (0.02) (0.13) (0.02)
N 1,451 1,239 1,827 1,626 1,717 1,505
Top Tercile in Spouse’s Schooling 0.10 0.04 –0.02 0.30† 0.03 0.03 –0.00 –0.00 –0.00
(0.09) (0.04) (0.17) (0.02) (0.17) (0.02)
N 1,510 1,318 1,614 1,553 1,640 1,458
Bottom Tercile in Spouse’sSchooling
–0.10 –0.04 –0.04 0.12 0.01 0.01 –0.05 –0.00 –0.01
(0.09) (0.11) (0.11) (0.02) (0.14) (0.02)
N 2,160 1,911 2,751 2,529 2,565 2,326
Notes: Standard errors, corrected for clustering at the bari level, are shown in parentheses. Samples include allbirths that occurred in 1970–1980. Marginal effects, labeled ME, are evaluated at the mean. Mother fixedeffects are included in columns labeled FE. See the notes to Table 3 for a list of all other controls.†p < .10; *p < .05; **p < .01
R. Hernández-Julián et al.

statistically different from each other. Similar patterns are found when we analyze theresults by terciles of the education distribution.
Discussion
Male infants who were exposed to the 1974 Bangladesh famine for at least one fullmonth of their third trimester experienced higher rates of neonatal mortality comparedwith their siblings who were not exposed. This result is robust to variations in thelength of exposure to the famine and is not present in alternative “placebo” famineyears. Factors other than malnutrition, however, could have contributed to the increasein neonatal mortality. For instance, women who choose to become pregnant during afamine could possibly have unobserved characteristics that contribute to increasedinfant mortality. The siblings comparison, however, accounts for time-invariant factorsrelated to the mother or the family that could impact the health of the infant. Moreover,
Table 9 Impact of famine on post-famine pregnancy outcomes: Subsamples by landholdings and spouse’seducation
Miscarriage StillbirthStillbirthMale Fetus
StillbirthFemale Fetus
Probit ME Probit ME Probit ME Probit ME
Pregnancy Outcome Jan. 1976–July 1976 (1) (2) (3) (4) (5) (6) (7) (8)
Full Sample –0.10 –0.01 0.27** 0.02 0.35** 0.03 0.20 0.01
(0.09) (0.01) (0.13) (0.14)
N 5,472 5,472 2,560 2,558
Top Tercile in Landholdings –0.24 –0.03 0.30* 0.02 0.37† 0.02 0.26 0.01
(0.15) (0.15) (0.21) (0.24)
N 1,837 1,837 854 856
Bottom Tercile in Landholdings –0.07 –0.01 0.40* 0.04 0.55* 0.05 0.28 0.02
(0.17) (0.18) (0.22) (0.26)
N 1,795 1,795 821 851
Top Tercile in Spouse’s Schooling 0.14 0.02 0.19 0.01 0.54* 0.04 –0.35 –0.01
(0.15) (0.17) (0.22) (0.32)
N 1,555 1,555 751 697
Bottom Tercile in Spouse’s Schooling –0.18 –0.02 0.31† 0.02 0.61** 0.03 0.09 0.00
(0.15) (0.16) (0.22) (0.24)
N 2,426 2,426 1,120 1,157
Notes: Standard errors, corrected for clustering at the bari level, are shown in parentheses. Marginal effects,labeled ME, are evaluated at the mean. Controls include education, age at first marriage, age at child’s birth,age at birth squared, height, an indicator for whether mother resides in a treatment group village of a Maternaland Child Health and Family Planning services program, total number of sons born before the famine (livebirths), total number of daughters born before the famine (live births), total number of sons born after thefamine (live births), and total number of daughters born after the famine (live births). With the exception ofregressions by spouse’s education, all regressions also control for spouse’s years of schooling.†p < .10; *p < .05; **p < .01
Intrauterine Malnutrition and Birth and Fertility Outcomes

the effects for infant mortality are stronger for women with more landholdings,suggesting positive selection into motherhood during the famine.
Other factors during pregnancy—such as limited access to quality care, increasedmaternal stress, increased burdens of infectious disease, and selective migration ofspouses—also could have impacted infant mortality. However, the results withregard to infant mortality are robust to the inclusion of a set of variables thatmeasure access to health care. Unfortunately, our data contain no information aboutretrospective stress measures, infectious diseases, or about the presence of thespouse during pregnancy. Thus, we remain unable to definitely rule out thesealternative explanations or to document how their impact interacts with the impact ofreduced access to food.
Pregnant mothers during the 1974 famine were also less likely to give birth to a soncompared with other live births they had during the 1970–1980 period. This resultsupports the Trivers-Willard hypothesis and contributes to a growing literature about itsrelevance to human populations. Although we are unable to identify the exact mech-anism through which intrauterine malnutrition affects the sex of the infant, the resultssuggest that male infants are particularly vulnerable to the in utero environment theyface. Of course, the generalizability of this finding is limited because it may be drivenby specific factors that are unique to Bangladesh. Thus, further research about thesensitivity of male infants to intrauterine factors as well as the mechanisms throughwhich they operate is warranted.
Finally, exposure to the famine during pregnancy affected not only the exposedinfants but also the post-famine reproductive outcomes of mothers. Controlling for pre-famine fertility, women who conceived after at least nine months of exposure to thefamine experienced a higher likelihood of a future male stillbirth compared with otherfertile women who did not become pregnant during the famine. As with the infant-related findings, these results are robust to variations in the length of exposure to thefamine and are not present in alternative “placebo” famine years. To our knowledge,this is the first study to document a long-run impact of intrauterine exposure tomalnutrition on subsequent pregnancy outcomes. These results, however, should beinterpreted cautiously. In contrast to the analysis of infant outcomes, we are unable toaccount for time-invariant factors about the mother or the household. Instead, we relyon a comparison between women who conceived after a lengthy period of malnutritionand women who did not. Thus, we cannot rule out the possibility that at least part of theeffects we document may be related to unobserved traits of the mother that impact herreproductive outcomes. Moreover, miscarriages are typically difficult to identify be-cause they depend on the age at which a pregnancy is recognized, which could also beaffected by the famine. Nonetheless, these findings are relevant to the literature on thereproductive outcomes of women with eating disorders as well as for relief agenciesoperating in areas facing nutritional constraints.
In summary, the results of this article suggest that malnutrition during famine is likelyto have an especially adverse effect on both male infants and pregnant women. Theseimpacts may be long-lasting: they appear to affect women not only in their currentpregnancy but in their future pregnancies as well. An important area for future researchmay be to explore the mechanisms through which malnutrition impacts infant mortalityrates and future fertility outcomes as well as howmalnutrition interacts with other factors,such as access to health and maternal stress. A deeper understanding of the importance of
R. Hernández-Julián et al.

different channels, whether biological or behavioral, would provide insight into how tomitigate the health effects of famine episodes in developing countries.
Acknowledgments We are grateful to Daniel Rees, Angela Dills, and Martha Bailey for useful commentson an earlier version of this article.
References
Alamgir, M. (1980). Famine in South Asia: Political economy of mass starvation. Cambridge, MA:Oelgeschlager, Gunn and Hain.
Alamgir, M., & Salimullah. (1977). Famine, 1974: Political economy of mass starvation in Bangladesh: Astatistical annexe. Dacca: Bangladesh Institute of Development Studies.
Almond, D. (2006). Is the 1918 influenza pandemic over? Long-term effects of in utero influenza exposure inthe post-1940 U.S. population. Journal of Political Economy, 114, 672–712.
Almond, D., & Currie, J. (2011). Killing me softly: The fetal origin hypothesis. Journal of EconomicPerspectives, 25, 153–172.
Almond, D., & Edlund, L. (2007). Trivers-Willard at birth and one year: Evidence from US natality data1983–2001. Proceedings of the Royal Society B, 274, 2491–2496.
Almond, D., Edlund, L., Li, H., & Zhang, J. (2008). Long-term effects of early life development: Evidencefrom the 1959–1961 China famine. In T. Ito & A. Rose (Eds.), The economic consequences ofdemographic change in East Asia (pp. 321–345). Cambridge, MA: National Bureau of EconomicResearch.
Almond, D., & Mazumder, B. (2011). Health capital and the pre-natal environment: The effect of Ramadanobservance during pregnancy. American Economic Journals: Applied Economics, 3(4), 56–85.
Anderson, R., & Bergstrom, S. (1998). Is maternal malnutrition associated with a low sex ratio at birth?Human Biology, 70, 1101–1106.
Bairagi, R. (1986). Food crisis, nutrition, and female children in rural Bangladesh. Population andDevelopment Review, 12, 307–315.
Barker, D. J. (1990). The fetal and infant origins of adult disease. BMJ, 301, 1111.Binswinger, H., & Rosenzweig, M. (1986). Behavioural and material determinants of production relations in
agriculture. Journal of Development Studies, 22, 503–539.Bulik, C. M., Sullivan, P. F., Fear, J. L., Pickering, A., Dawn, A., & McCullin, M. (1999). Fertility and
reproduction in women with anorexia nervosa: A controlled study. Journal of Clinical Psychiatry, 60,130–135.
Camacho, A. (2008). Stress and birth weight: Evidence from terrorist attack. American Economic Review, 98,511–515.
Cameron, E. Z. (2004). Facultative adjustment of mammalian sex ratios in support of the Trivers-Willardhypothesis: Evidence for a mechanism. Proceedings of the Royal Society, 271, 1723–1728.
Choe, M. K., & Razzaque, A. (1990). Effect of famine on child survival in Matlab, Bangladesh. Asia-PacificPopulation Journal, 5(2), 53–72.
Collins, S. (1995). The limit of human adaptation to starvation. Nature Medicine, 1, 810–814.Davis, A. P. (1996). Targeting the vulnerable in emergency situations: Who is vulnerable? The Lancet, 348,
868–871.Dyson, T. (1991). On the demography of South Asian famines—Part II. Population Studies, 45, 279–297.Fauveau, V., & Chakraborty, J. (1994). Family planning and maternal and child health services in Matlab. In V.
Fauveau (Ed.), Matlab: Women, children and health (Special Publication No. 35, pp. 89–107). Dhaka,Bangladesh: International Centre for Diarrhoeal Disease Research.
Hart, N. (1993). Famine, maternal nutrition and infant mortality: A re-examination of the Dutch HungerWinter. Population Studies, 47, 27–46.
Huck, W. U., Labov, J. B., & Lisk, R. D. (1986). Food restricting young hamsters (Mesocricetus auratus)affects sex ratio and growth of sebsequent offspring. Biology of Reproduction, 35, 592–598.
India Famine Inquiry Commission. (1976). Report on Bengal. New York, NY: Arno Press.Janowitz, B., Holtman, M., Hubacher, D., & Jamil, K. (1997). Can the Bangladeshi Family Planning Program
meet rising needs without raising costs? International Family Planning Perspectives, 23, 116–121.
Intrauterine Malnutrition and Birth and Fertility Outcomes

Joshi, S., & Schultz, P. T. (2007). Family planning as an investment in development: Evaluation of aprogram’s consequences in Matlab, Bangladesh (Economic Growth Center Discussion Paper No. 951).New Haven, CT: Yale University.
Kannisto, V., Christensen, K., & Vaupel, J. W. (1997). No increased mortality in later life for cohorts bornduring famine. American Journal of Epidemiology, 145, 987–994.
Katz, M., & Vollenhoven, B. (2000). The reproductive endocrine consequences of anorexia nervosa. BritishJournal of Obstetrics and Gynaecology, 107, 707–713.
Koenig, M. A., & D’Souza, S. (1986). Sex differences in childhood mortality in rural Bangladesh. SocialScience & Medicine, 22, 15–22.
Kuhn, R. S. (2005). The determinants of family and individual migration: A case-study of rural Bangladesh(Research Program on Population Processes Working Paper POP2005-05). Boulder, CO: Institute ofBehavioral Science.
Langsten, R. (1981). The effects of crises on differential mortality by sex in Bangladesh. BangladeshDevelopment Studies, 9(2), 75–96.
Lindeboom, M., Portrait, F., & van den Berg, G. J. (2010). Long-run effects on longevity of a nutritional shockearly in life: The Dutch Potato Famine of 1846–1847. Journal of Health Economics, 29, 617–629.
Lumey, L. H., & Stein, A. D. (1997). Offspring birth weights after maternal intrauterine undernutrition: Acomparison within sibships. American Journal of Epidemiology, 146, 810–819.
Mansour, H., & Rees, D. I. (2012). Armed conflict and birth weight: Evidence from the Al-Aqsa Intifada.Journal of Development Economics, 99, 190–199.
Meikle, D. B., & Drickamer, L. C. (1986). Food availability and secondary sex ratio variation in wildlaboratory house mice (Mus musculus). Journal of Reproduction and Fertility, 78, 587–591.
Neugebauer, R., Hoek, H. W., & Susser, E. (1999). Prenatal exposure to wartime famine and development ofantisocial personality disorder in early adulthood. Journal of the AmericanMedical Association, 282, 455–462.
Painter, R. C., Rosenboom, T. J., & Bleker, O. P. (2005). Prenatal exposure to the Dutch famine and disease inlater life: An overview. Reproductive Toxicology, 20, 345–352.
Pitt, M., & Khandker, S. (1998). The impact of group-based credit programs on poor households inBangladesh: Does the gender of participants matter? Journal of Political Economy, 106, 958–996.
Rahman, O., Menken, J., Foster, A., Peterson, C. E., Khan, M. N., Kuhn, R., & Gertler, P. (1999). The 1996Matlab Health and Socioeconomic Survey: Overview and user’s guide (Unrestricted Draft Series No.DRU-2018/1-NIA). Santa Monica, CA: RAND.
Razzaque, A. (1988). Effect of famine on fertility in an area of rural Bangladesh. Journal of Biosocial Science,20, 287–294.
Razzaque, A., Alam, N., Wai, L., & Foster, A. (1990). Sustained effects of the 1974–5 famine on infant andchild mortality in a rural area of Bangladesh. Population Studies, 44, 145–154.
Roseboom, T. J., van der Meulen, J. H. P., Osmond, C., Barker, D. J. P., Ravelli, A. C. J., & Bleker, O. P.(2001a). Adult survival after prenatal exposure to Dutch famine 1944–45. Paediatric and PerinatalEpidemiology, 16, 220–225.
Roseboom, T. J., van der Meulen, J. H. P., Ravelli, A. C., Osmond, C., Barker, D. H., & Bleker, O. P. (2001b).Effects of prenatal exposure to the Dutch famine on adult disease in later life: An overview. TwinResearch, 4, 293–298.
Rosenfeld, C. S., & Roberts, R. M. (2004). Maternal diet and other factors affecting offspring sex ratio: Areview. Biology of Reproduction, 71, 1063–1070.
Rosenzweig, M., & Wolpin, K. (1985). Specific experience, household structure, and intergenerationaltransfers: Farm family land and labor arrangements in developing countries. Quarterly Journal ofEconomics, 100(Suppl), 961–987.
Scott, S., Duncan, S. R., & Duncan, C. J. (1995). Infant mortality and famine: A study in historicalepidemiology in Northern England. Journal of Epidemiology and Community Health, 49, 145–252.
Sen, A. (1981). Ingredients of famine analysis: Availability and entitlements.Quarterly Journal of Economics,96, 433–464.
Stein, A. D., Zybert, P. A., & Lumey, L. H. (2004). Acute undernutrition is not associated with excess of femalesat birth in humans: The Dutch Hunger Winter. Proceedings of the Royal Society B, 271, S138–S141.
Stein, Z., & Susser, M. (1975). The Dutch Famine, 1944–1945, and the reproductive process. I. Effects on sixindices at birth. Pediatric Research, 9, 70–76.
Trivers, R. L., & Willard, R. E. (1973). Natural selection and the ability to vary the sex ratio of offspring.Science, 179, 90–92.
United Nations Secretariat. (2003). World population prospects: The 2000 revision. New York, NY: UnitedNations. Retrieved from http://www.un.org/esa/population/publications/wpp2002/WPP2002-HIGHLIGHTSrev1.PDF
R. Hernández-Julián et al.
Copyright © 2022 FDOKUMEN