The effects of image acquisition control of digital X-ray system on radiodensity quantification
8
©Copyrights 2013. The Korean Academy of Conservative Dentistry. 146 This is an Open Access article distributed under the terms of the Creative Commons Attribution Non-Commercial License (http://creativecommons.org/licenses/ by-nc/3.0) which permits unrestricted non-commercial use, distribution, and reproduction in any medium, provided the original work is properly cited. The effects of image acquisition control of digital X-ray system on radiodensity quantification Objectives: Aluminum step wedge (ASW) equivalent radiodensity (eRD) has been used to quantify restorative material’s radiodensity. The aim of this study was to evaluate the effects of image acquisition control (IAC) of a digital X-ray system on the radiodensity quantification under different exposure time settings. Materials and Methods: Three 1-mm thick restorative material samples with various opacities were prepared. Samples were radiographed alongside an ASW using one of three digital radiographic modes (linear mapping (L), nonlinear mapping (N), and nonlinear mapping and automatic exposure control activated (E)) under 3 exposure time settings (underexposure, normal-exposure, and overexposure). The ASW eRD of restorative materials, attenuation coefficients and contrasts of ASW, and the correlation coefficient of linear relationship between logarithms of gray-scale value and thicknesses of ASW were compared under 9 conditions. Results: The ASW eRD measurements of restorative materials by three digital radiographic modes were statistically different (p = 0.049) but clinically similar. The relationship between logarithms of background corrected grey scale value and thickness of ASW was highly linear but attenuation coefficients and contrasts varied significantly among 3 radiographic modes. Varying exposure times did not affect ASW eRD significantly. Conclusions: Even though different digital radiographic modes induced large variation on attenuation of coefficient and contrast of ASW, E mode improved diagnostic quality of the image significantly under the under- exposure condition by improving contrasts, while maintaining ASW eRDs of restorative materials similar. Under the condition of this study, underexposure time may be acceptable clinically with digital X-ray system using automatic gain control that reduces radiation exposure for patient. (Restor Dent Endod 2013;38(3):146-153) Key words: Aluminum step wedge equivalent radiodensity; Digital radiographic mode; Digital radiography; Image acquisition control; Image quality Introduction Digital radiographs are being used widely in clinical practice due to its convenience and lower X-ray dosage compared to traditional analogue radiographs using film. 1 X-ray photons that pass through objects with certain attenuation coefficients can activate pixels of the digital sensor and the data are transformed into the digital images on the monitor by the image acquisition control (IAC) of a system. The radiodensity of the digital X-ray images are expressed by the grey scale, ranging from 0 (black) to 255 (white). Digital imaging systems typically employ a variety of IACs to enhance their images. X-ray data sensed by a pixel of a digital sensor can be mapped into a pixel of a digital image linearly or non-linearly (using a sine wave) to boost the certain range Wook-Jin Seong 1 , Hyeon- Cheol Kim 2 *, Soocheol Jeong 1 , Youngcheul Heo 1 , Woo-Bin Song 3 , Mansur Ahmad 4 1 Department of Restorative Science, University of Minnesota School of Dentistry, Minneapolis, MN, USA 2 Department of Conservative Dentistry, Pusan National University School of Dentistry and Institute of Translational Dental Sciences, Yangsan, Korea 3 Process Development Team, Memory Division R&D Center, Samsung Electronics Co., Ltd., Yongin, Korea 4 Department of Diagnostic and Biological Sciences, University of Minnesota School of Dentistry, Minneapolis, MN, USA Received May 15, 2013; Revised June 27, 2013; Accepted July 2, 2013. 1 Seong WJ; Jeong S; Heo Y, Department of Restorative Science, University of Minnesota School of Dentistry, Minneapolis, MN, USA 2 Kim HC, Department of Conservative Dentistry, Pusan National University School of Dentistry and Institute of Translational Dental Sciences, Yangsan, Korea 3 Song WB, Process Development Team, Memory Division R&D Center, Samsung Electronics Co., Ltd., Yongin, Gyeonggi, Korea 4 Ahmad M, Department of Diagnostic and Biological Sciences, University of Minnesota School of Dentistry, Minneapolis, MN, USA *Correspondence to Hyeon-Cheol Kim, DDS, MS, PhD. Associate Professor, Department of Conservative Dentistry, Pusan National University School of Dentistry, 20, Geumo-ro, Mulgeum, Yangsan, Korea 626-787 TEL, +82-55-360-5222; FAX, +82-55-360- 5214; E-mail, [email protected] Research article ISSN 2234-7658 (print) / ISSN 2234-7666 (online) http://dx.doi.org/10.5395/rde.2013.38.3.146
-
Upload
independent -
Category
Documents
-
view
0 -
download
0
Transcript of The effects of image acquisition control of digital X-ray system on radiodensity quantification

©Copyrights 2013. The Korean Academy of Conservative Dentistry.146
This is an Open Access article distributed under the terms of the Creative Commons Attribution Non-Commercial License (http://creativecommons.org/licenses/by-nc/3.0) which permits unrestricted non-commercial use, distribution, and reproduction in any medium, provided the original work is properly cited.
The effects of image acquisition control of digital X-ray system on radiodensity quantification
Objectives: Aluminum step wedge (ASW) equivalent radiodensity (eRD) has been used to quantify restorative material’s radiodensity. The aim of this study was to evaluate the effects of image acquisition control (IAC) of a digital X-ray system on the radiodensity quantification under different exposure time settings. Materials and Methods: Three 1-mm thick restorative material samples with various opacities were prepared. Samples were radiographed alongside an ASW using one of three digital radiographic modes (linear mapping (L), nonlinear mapping (N), and nonlinear mapping and automatic exposure control activated (E)) under 3 exposure time settings (underexposure, normal-exposure, and overexposure). The ASW eRD of restorative materials, attenuation coefficients and contrasts of ASW, and the correlation coefficient of linear relationship between logarithms of gray-scale value and thicknesses of ASW were compared under 9 conditions. Results: The ASW eRD measurements of restorative materials by three digital radiographic modes were statistically different (p = 0.049) but clinically similar. The relationship between logarithms of background corrected grey scale value and thickness of ASW was highly linear but attenuation coefficients and contrasts varied significantly among 3 radiographic modes. Varying exposure times did not affect ASW eRD significantly. Conclusions: Even though different digital radiographic modes induced large variation on attenuation of coefficient and contrast of ASW, E mode improved diagnostic quality of the image significantly under the under-exposure condition by improving contrasts, while maintaining ASW eRDs of restorative materials similar. Under the condition of this study, underexposure time may be acceptable clinically with digital X-ray system using automatic gain control that reduces radiation exposure for patient. (Restor Dent Endod 2013;38(3):146-153)
Key words: Aluminum step wedge equivalent radiodensity; Digital radiographic mode; Digital radiography; Image acquisition control; Image quality
Introduction
Digital radiographs are being used widely in clinical practice due to its convenience and lower X-ray dosage compared to traditional analogue radiographs using film.1 X-ray photons that pass through objects with certain attenuation coefficients can activate pixels of the digital sensor and the data are transformed into the digital images on the monitor by the image acquisition control (IAC) of a system. The radiodensity of the digital X-ray images are expressed by the grey scale, ranging from 0 (black) to 255 (white). Digital imaging systems typically employ a variety of IACs to enhance their images. X-ray data sensed by a pixel of a digital sensor can be mapped into a pixel of a digital image linearly or non-linearly (using a sine wave) to boost the certain range
Wook-Jin Seong1, Hyeon-Cheol Kim2*, Soocheol Jeong1, Youngcheul Heo1, Woo-Bin Song3, Mansur Ahmad4
1Department of Restorative Science, University of Minnesota School of Dentistry, Minneapolis, MN, USA 2Department of Conservative Dentistry, Pusan National University School of Dentistry and Institute of Translational Dental Sciences, Yangsan, Korea3Process Development Team, Memory Division R&D Center, Samsung Electronics Co., Ltd., Yongin, Korea 4Department of Diagnostic and Biological Sciences, University of Minnesota School of Dentistry, Minneapolis, MN, USA
Received May 15, 2013; Revised June 27, 2013; Accepted July 2, 2013.
1Seong WJ; Jeong S; Heo Y, Department of Restorative Science, University of Minnesota School of Dentistry, Minneapolis, MN, USA 2Kim HC, Department of Conservative Dentistry, Pusan National University School of Dentistry and Institute of Translational Dental Sciences, Yangsan, Korea3Song WB, Process Development Team, Memory Division R&D Center, Samsung Electronics Co., Ltd., Yongin, Gyeonggi, Korea 4Ahmad M, Department of Diagnostic and Biological Sciences, University of Minnesota School of Dentistry, Minneapolis, MN, USA*Correspondence to Hyeon-Cheol Kim, DDS, MS, PhD. Associate Professor, Department of Conservative Dentistry, Pusan National University School of Dentistry, 20, Geumo-ro, Mulgeum, Yangsan, Korea 626-787TEL, +82-55-360-5222; FAX, +82-55-360-5214; E-mail, [email protected]
Research articleISSN 2234-7658 (print) / ISSN 2234-7666 (online)http://dx.doi.org/10.5395/rde.2013.38.3.146

147www.rde.ac
of grey levels, enhancing its overall image. This process is called automatic exposure control (AEC) or automatic gain control (AGC) and allows for an image that is underexposed or overexposed to be adjusted automatically before displaying it.2-4 International standards, ISO 4049 and ISO 9917, define
radiopacity measurement protocol in analogue film based radiography.5,6 The aluminum equivalent (mm) is calculated from the linear regression of the logarithm of optical density and aluminum thickness of the step wedge.5 For X-ray traveling a media, the Lambert-Beer law applies as follows:T = I/I0 = e-µx (1)where T is the transmittance, I is the intensity of the
X-ray traveled through the material, I0 is the intensity of the incident X-ray, µ is the attenuation coefficient, and x is the material thickness. When equation (1) is rewritten, using time and optical density factors and taking logarithm, the following equation is obtained:2
ln(D-f) = ln(atI0) - µx (2)where D is the optical density of a processed analogue
film, f is the baseline background optical density of the unexposed but normally processed film, a is the scale factor of the efficiency of the image forming process, and t is the time of exposure. From equation (2), the attenuation coefficient (µ) of a material can be calculated using the slope between the logarithm of background (unexposed) corrected optical density (ln(D-f)) and the thickness of a material (x). In a digital image, the grey scale (G) value can be
approximately related to the optical density (D) of analogue film: D ≈ k(255-G), where k is a scale constant and equation (2) can be transformed as follows:2 ln(g-G) = ln(atI0) - µx (3)where g is the baseline background grey scale of the
unexposed digital sensor. Equations (2) and (3) show that there is a linear relation between the logarithm of background (unexposed) corrected optical density (ln(D-f)) or the grey scale value (ln(g-G)) and the thickness of a material (x), and that the slope of the linear relation is the attenuation coefficient (µ) of a material. The attenuation coefficient (µ) is a material property dependant on X-ray energy level.7 As long as the energy level of an X-ray source stays constant, the attenuation coefficient of a material calculated from the equations (2) and (3) should
be constant as well, unless IACs of a digital radiograph system distort the grey scale values of the image, thus inducing error in the calculated attenuation coefficients. To quantify the radiodensity of a material, it is important that the optical density of a processed analogue film or the grey scale values of a digital image manipulated by IAC are within the range of the Lambert-Beer law. In other words, the relationship between the logarithm of background (unexposed) grey scale value and the thickness of ASW should be highly linear. Several studies have compared digital radiography to
analogue film by evaluating the radiodensity of restorative materials.2,8-10 Studies using digital storage phosphor plates found that the radiopacity values of the digital system were generally lower than those obtained by the analogue films.9,10 Nomoto et al. reported that AGC used with digital imaging plate distorted its image, and concluded that the use of AGC is inappropriate for radiopacity quantification of restorative materials.2 Studies have also utilized digital sensors to examine the effects of exposure time choices and compared digital systems to the analogue films.8,11 However, these studies rarely focused on whether the different modes of IACs of a digital system distorted its image inducing error in radiodensity quantification process or not.Intraoral radiographs employing aluminum step wedge
(ASW) equivalent radiodensity (eRD) has been used to quantify the radiopacity of restorative material and to measure jawbone density.12,13 The main purpose of this study was to evaluate the effects of IAC of a digital X-ray system on the ASW eRD quantification of 3 opacity-varying restorative materials under 3 different exposure time settings. Secondly, this study aimed to evaluate how different IAC modes (L, N, E) of a digital X-ray system and different exposure time settings affect the (1) linear relationship (R2) between logarithm of background (unexposed) corrected grey scale values of ASW and corresponding ASW thicknesses, (2) attenuation coefficient, and (3) contrast of ASW.
Materials and methods
Independent variables included 3 restorative materials, 3 radiographic modes, and 3 exposure time settings for digital radiographs (Table 1).
Table 1. Independent variables
Restorative materials Modes of digital sensor* Exposure time (second)Resin (Revolution Formula 2)a Linear mapping 0.04 (underexposure)
Cement (Variolink II)b Nonlinear mapping 0.08 (normal exposure)
Sealer (AH plus jet)c Nonlinear mapping & AEC activated 0.12 (overexposure)a Lot # 3073482, Kerr, Orange, CA, USA, b Lot # H26167, Ivoclar Vivadent, Schaan, Liechtenstein, c Lot # 0711002101, Dentsply Caulk, Milford, DE, USA.
Quality assurance of digital radiography systems
http://dx.doi.org/10.5395/rde.2013.38.3.146

148 www.rde.ac
Sample preparation
Three non-metallic restorative materials of varying opacity were included in this study. They were flowable resin (Revolution Formula 2, Kerr, Orange, CA, USA), resin cement (Variolink II, Ivoclar Vivadent, Schaan, Liechtenstein), and endodontic sealer (AH Plus Jet, Dentsply Caulk, Milford, DE, USA). Each material was prepared according to the manufacturer and placed into a metal washer of 5 mm internal diameter and 1 mm thickness. Glass slabs were positioned on top of the washer until the materials polymerized to create uniform 1 mm thick samples. One set of 3 restorative material samples was used throughout the experiment.
ASW fabrication
An ASW was fabricated using 99.6% pure aluminum (aluminum alloy 1100, Alcoa Inc., Pittsburgh, PA, USA) and was 2 mm high, 2 mm wide, and ranged from 1 to 13 mm thick (Figure 1). The thickness was divided into 11 steps where the first step was 1 mm thick and each of the next steps increased in thickness by 1.2 mm. The ASW was secured inside of brass housing which can be attached to an X-ray aligning device (XCP, Dentsply Rinn, Elgin, IL, USA).
Digital radiograph taking
A dental X-ray machine (Soredex 20/20, Soredex, Tuusula, Finland) was operated at 70 kV and 7 mA and the source to film/sensor distance was fixed to 30 cm. Three restorative material samples and ASW were exposed under 3 exposure time settings (underexposure 0.04 s, normal-exposure 0.08 s, and overexposure 0.12 s). A digital X-ray system (CDR, Schick technologies Inc., Long Beach, CA, USA) with size 2 complementary metal-oxide-semiconductor (CMOS) sensor (APS sensor, Schick technologies Inc.) in conjunction with its software (CDR DICOM, Schick technologies Inc.) was used next. Three different modes of IAC were tested: L mode with linear mapping, N mode with nonlinear mapping (this is a default setting by the manufacturer), and E mode with nonlinear mapping and AEC activated. E mode also corrects underexposure or overexposure conditions. All radiograph experiments were repeated 3 times.
Attenuation coefficient and contrast of ASW
The digital image files produced by the digital X-ray system sensor and software with 3 different IAC modes (L, N, E) were saved in bitmap image files. The grey scale values (ranges from 0 to 255) of all 11 steps of ASW, 3 restoration material samples, and background (0th step) were measured on the images of bitmap file using X-ray image software (cAD-meter, University of Minnesota, Minneapolis, MN, USA). The grey scale value of an unexposed digital sensor background was obtained. The natural logarithm value of background (unexposed)
corrected grey scale values from digital sensor of each step (0 - 11) of ASW was plotted against the thickness (mm) of corresponding step of ASW. Then the plot was linearly regressed and an attenuation coefficient of ASW was calculated as a slope of a line using Eq. (3). The square of correlation coefficient (R2) was also obtained from the linear regression. The contrasts of identical ASW from different X-ray images
radiographed under 9 different conditions (3 radiographic modes × 3 exposure time settings) were calculated. The slope of a regression line between grey scale values of ASW and thicknesses of corresponding step of ASW was measured as a contrast, and presented as grey scale per one millimeter of ASW (GS/mm).
ASW eRD
The radiodensitiy of 1 mm thick restorative material samples were recorded as an equivalent thickness (mm) of aluminum according to ISO 4049.5 It was named ASW eRD. Grey scale values of restorative material samples measured from digital images were converted into ASW eRD using the piecewise linear regression relations between grey scale
Seong WJ et al.
Figure 1. Aluminum step wedge and brass housing used in this study.
Aluminum step wedge
Brass housing
2.0
2.0
11.89.4
7.04.6
2.2 1.03.4
5.88.2
10.613.0
(Unit: mm)
http://dx.doi.org/10.5395/rde.2013.38.3.146

149www.rde.ac
Quality assurance of digital radiography systems
values and the thicknesses of ASW.14
Statistical Analysis
Multivariate analysis of variance (MANOVA) was performed to assess the significance of the effects of radiographic modes (L, N, and E) and exposure time settings (underexposure, normal exposure, and overexposure) on dependent variables, attenuation coefficient, its R2, and contrast. A second MANOVA was carried out to assess the significance of effects of the materials (resin, cement, and sealer), modes, and exposure time settings on the dependent variable, ASW eRD. The post-hoc analyses were carried out only for the significant predictors in MANOVA. The post-hoc analysis was adjusted for multiple testing using Tukey's Honestly Significant Difference. All of the above analyses used the GLM procedure in the SAS statistical package ver. 8.2 (SAS Institute Inc., Cary, NC, USA).
Results
Representative radiographic images obtained with a digital sensor under 9 different combinations of radiographic modes and exposure time settings are presented in Figure 2. The attenuation coefficients of ASW, its square of correlation coefficient (R2) of linear regression between the logarithms of background (unexposed) corrected grey scale values and thicknesses of ASW, and contrasts under 9 different conditions are given in Table 2. In Figure 3, the slope of a line represents attenuation
Figure 2. Radiographic images of ASW and 3 restorative material samples under 9 different conditions (3 radio-graphic modes x3 exposure time settings).
Lmode
Nmode
Emode
L 0.04s L 0.08s L 0.12s
N 0.04s N 0.08s N 0.12s
E 0.04s E 0.08s E 0.12s
under normal overexposure exposure exposure
Table 2. Attenuation coefficient of ASW (Mean (SE)), its square of correlation coefficient (R2) of linear regression, and contrast under 9 different conditions (3 radiographic modes x 3 exposure time settings)
Modes of digital sensor Exposure time (sec)
Attenuation coefficient (mm-1) R2 Contrast
(GS/mm)a
Linear mapping (L)
0.04* -0.1898 (0.0025) 0.9953 (0.0010) 5.13 (0.09)
0.08** -0.1554 (0.0019) 0.9950 (0.0007) 13.0 (0.32)
0.12*** -0.1249 (0.0005) 0.9889 (0.0006) 16.4 (0.05)
Nonlinear mapping (N)
0.04* -0.1872 (0.0014) 0.9962 (0.0009) 7.59 (0.25)
0.08** -0.1358 (0.0006) 0.9993 (0.0000) 15.7 (0.05)
0.12*** -0.0917 (0.0004) 0.9633 (0.0017) 14.9 (0.03)
Nonlinear mapping & AEC activated (E)
0.04* -0.1757 (0.0039) 0.9975 (0.0001) 17.7 (0.10)
0.08** -0.1351 (0.0023) 0.9967 (0.0003) 16.7 (0.11)
0.12*** -0.0954 (0.0020) 0.9632 (0.0021) 15.3 (0.17)
* underexposure; ** normal exposure; *** overexposure.a(GS/mm) denotes “grey scale per 1 mm ASW”. AEC, automatic exposure control.
http://dx.doi.org/10.5395/rde.2013.38.3.146

150 www.rde.ac
coefficient of ASW. The relationships between logarithm of background corrected grey scale value and thickness of ASW from 9 conditions were highly linear (R2 were very close to 1). However, calculated attenuation coefficients from their regression relations of the only ASW used in these experiments varied significantly among 3 radiographic modes and under 3 different exposure time settings. Table 3 presents ASW eRD (mm) of three 1 mm thick restorative material samples under 9 different conditions. The ASW eRD measurements of restorative materials by 3 digital radiographic modes were clinically similar to one another. Inaccuracy of ASW eRD measurements were noticed when low opacity restoration materials were overexposed (Figure 2 and Table 3). Changing exposure time settings did not affect ASW eRD significantly. The summaries of p-values and adjusted estimates of fixed effect tests are shown in Table 4.
Discussion
Digital radiography system sensors can be of 3 types: photo-stimulable phosphor (PSP) image plates, charge-coupled device (CCD), or CMOS. This study was done to evaluate the effects of different IAC modes on ASW eRD quantification of restoration materials under different exposure conditions. Studies have shown that there are no significant differences in image quality of the various sensor systems currently available.15-18 For the current study, we have used a CMOS based digital radiography system.The correlations (R2) between the logarithms of
background corrected grey scale values and thicknesses of ASW were highly linear and these results agree with the earlier study that investigated relations between the absorbance and thickness of ASW.11 This indicates that ASW eRD technique is valid under the current 9 different conditions (3 radiographic modes and 3 exposure time settings) except two overexposure time settings on N and E modes. Overexposure (0.12 second) setting on digital radiographic modes N and E blacked out the first 3 - 4 ASW images (Figure 2) and induced the curvatures of the slope near the first 3 - 4 steps of ASW (Figure 3). As a result, the correlations (R2) were lower (0.96) in those 2 overexposure conditions in modes N and E, while the rest of the conditions had an R2 of 0.99 (Table 2). Non-linearity noticed in the overexposure-low radiodensity object condition further explained why the low opacity flowable composite resin sample used in current study had erroneous ASW eRD in overexposure conditions (Table 3). Even though the correlations (R2) among 3 radiographic modes (L, N, E) were linear and similar, experimentally obtained attenuation coefficients of an identical ASW showed significant variations over 3 radiographic modes and 3 exposure time settings. According to equations (2)
Figure 3. Plots for ASW attenuation coefficient (slope) determination. X-axis denotes the ASW thickness (mm) and Y-axis denotes logarithm of background (unexposed) corrected grey scale value (LN(g-G)) for digital sensor (L, N, E modes). Square, round, and triangle lines indicate underexposure, normal exposure, and overexposure time settings, respectively.
Aluminum step wedge thickness (mm)
LN (
g-G)
6
5
4
3
2
1
00 1.0 2.2 3.4 4.6 5.8 7.0 8.2 9.4 10.6 11.8 13.0
L mode
LN (
g-G)
6
5
4
3
2
1
00 1.0 2.2 3.4 4.6 5.8 7.0 8.2 9.4 10.6 11.8 13.0
N mode
LN (
g-G)
6
5
4
3
2
1
00 1.0 2.2 3.4 4.6 5.8 7.0 8.2 9.4 10.6 11.8 13.0
E mode
Seong WJ et al.
http://dx.doi.org/10.5395/rde.2013.38.3.146

151www.rde.ac
Quality assurance of digital radiography systems
and (3), the exposure time (t) affects only the y-intercept (ln(atI0)) and, theoretically, should not affect the slope which is the attenuation coefficient (µ). Also, the attenuation coefficient (µ) is a material property which should not change unless the X-ray energy level changes. The current experiment design kept the X-ray source energy level constant throughout the experiments; however, in digital modes (L, N, E), the attenuation coefficients changed significantly (ranged 0.095 in overexposure
to 0.189 in underexposure) as exposure time settings changed. It is not clear what the underlining mechanism for this phenomenon is but IACs of current digital radiograph system should be responsible for this variation of attenuation coefficient. Nomoto et al. reported the attenuation coefficients of
98.96% aluminum alloy ASW used under 65 kV and 10 mA X-ray source as 0.187 mm-1 in PSP imaging plate.2 The average calculated attenuation coefficients of current
Table 4. p-values and adjusted estimates for ANOVA type fixed effects test
Effects Attenuation coefficient (mm-1) R2 Contrast (GS/mm)a eRD (mm)
Restorative materials - - -
p < 0.0001*
Resin: 1.55
Cement: 4.27
Sealer: 9.31
Radiographic modesb
p = 0.0076* p = 0.2757 p < 0.0001* p = 0.0494*
L: -0.1567 L: 0.9931 L: 11.51 L: 5.00
N: -0.1382 N: 0.9863 N: 12.74 N: 4.98
E: -0.1354 E: 0.9859 E: 16.57 E: 4.88
Exposure timesc
p < 0.0001* p < 0.0001* p < 0.0001* p = 0.7057
U: -0.1731 U: 0.9939 U: 8.85 U: 5.10
N: -0.1395 N: 0.9934 N: 13.94 N: 4.99
O: -0.1104 O: 0.9762 O: 14.09 O: 5.03
* Indicates significant differences (p < 0.05).a(GS/mm) denotes “grey scale per 1 mm ASW”.bL, Digital sensor with linear mapping; N, Digital sensor with nonlinear mapping; E, Digital sensor with nonlinear mapping & AEC activated. cU, underexposure (0.04 sec); N, normal exposure (0.08 sec); O, overexposure (0.12 sec).
Table 3. ASW eRD (Mean (SE)) of 3 restorative materials under 9 different conditions (3 radiographic modes x 3 exposure time settings)
Modes of digital sensor Exposure time (sec)ASW eRD (mm)
Sealer Cement Resin
Linear mapping (L)
0.04* 8.86 (0.02) 4.17 (0.05) 1.5 (0.02)
0.08** 8.9 (0.07) 4.35 (0.02) 1.62 (0.01)
0.12*** 8.96 (0.06) 4.35 (0.02) 2.27 (0.01)
Nonlinear mapping (N)
0.04* 8.81(0.07) 4.12 (0.06) 1.49 (0.02)
0.08** 8.95 (0.02) 4.35 (0.03) 1.58 (0)
0.12*** 8.93 (0.05) 4.33 (0.02) 2.23 (0.03)
Nonlinear mapping & AEC activated (E)
0.04* 8.74 (0.14) 4.09 (0.07) 1.43 (0.02)
0.08** 8.93 (0.01) 4.3 (0.02) 1.49 (0.01)
0.12*** 8.92 (0.21) 4.3 (0.17) 1.7 (0.16)
* underexposure; ** normal exposure; *** overexposure. ASW, aluminum step wedge; AEC, automatic exposure control.
http://dx.doi.org/10.5395/rde.2013.38.3.146
152 www.rde.ac
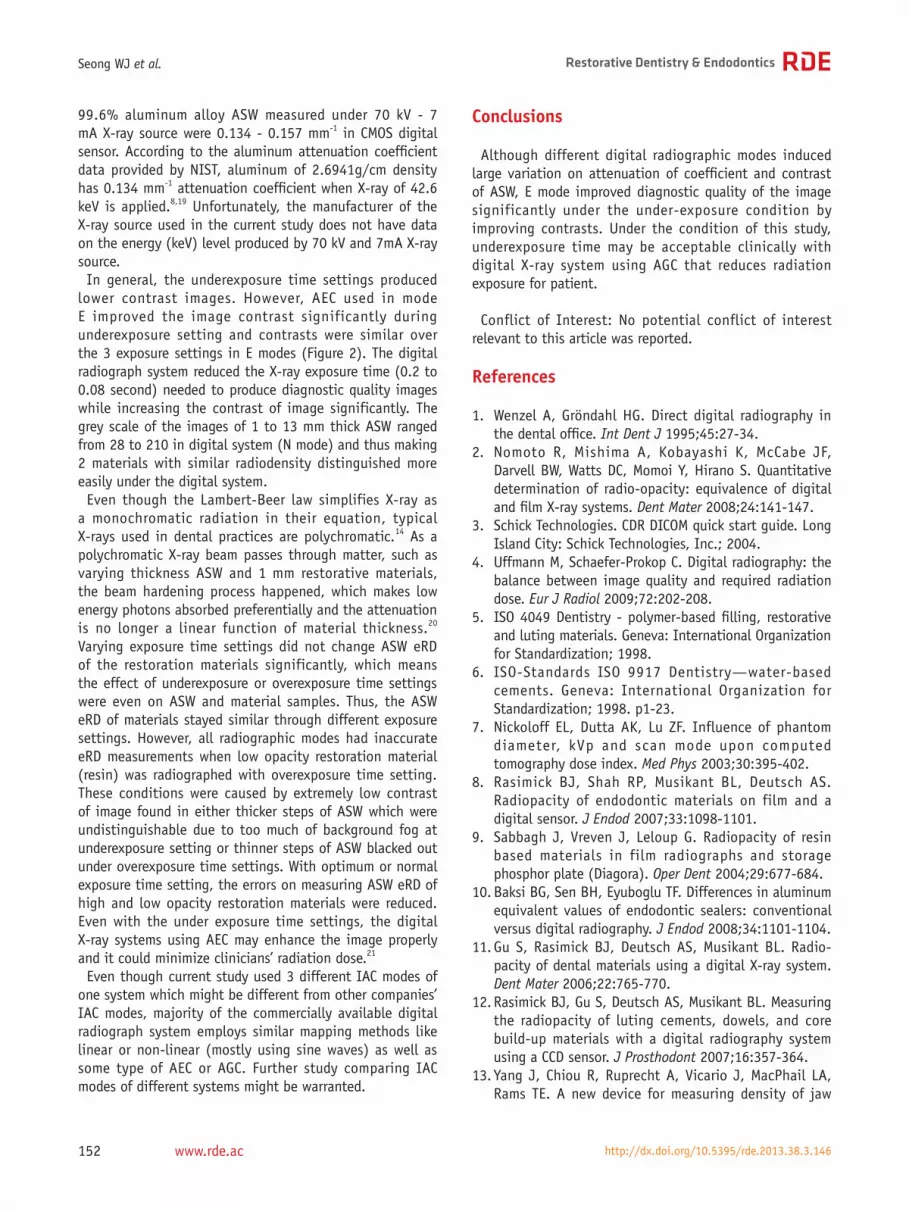
99.6% aluminum alloy ASW measured under 70 kV - 7 mA X-ray source were 0.134 - 0.157 mm-1 in CMOS digital sensor. According to the aluminum attenuation coefficient data provided by NIST, aluminum of 2.6941g/cm density has 0.134 mm-1 attenuation coefficient when X-ray of 42.6 keV is applied.8,19 Unfortunately, the manufacturer of the X-ray source used in the current study does not have data on the energy (keV) level produced by 70 kV and 7mA X-ray source.In general, the underexposure time settings produced
lower contrast images. However, AEC used in mode E improved the image contrast significantly during underexposure setting and contrasts were similar over the 3 exposure settings in E modes (Figure 2). The digital radiograph system reduced the X-ray exposure time (0.2 to 0.08 second) needed to produce diagnostic quality images while increasing the contrast of image significantly. The grey scale of the images of 1 to 13 mm thick ASW ranged from 28 to 210 in digital system (N mode) and thus making 2 materials with similar radiodensity distinguished more easily under the digital system.Even though the Lambert-Beer law simplifies X-ray as
a monochromatic radiation in their equation, typical X-rays used in dental practices are polychromatic.14 As a polychromatic X-ray beam passes through matter, such as varying thickness ASW and 1 mm restorative materials, the beam hardening process happened, which makes low energy photons absorbed preferentially and the attenuation is no longer a linear function of material thickness.20 Varying exposure time settings did not change ASW eRD of the restoration materials significantly, which means the effect of underexposure or overexposure time settings were even on ASW and material samples. Thus, the ASW eRD of materials stayed similar through different exposure settings. However, all radiographic modes had inaccurate eRD measurements when low opacity restoration material (resin) was radiographed with overexposure time setting. These conditions were caused by extremely low contrast of image found in either thicker steps of ASW which were undistinguishable due to too much of background fog at underexposure setting or thinner steps of ASW blacked out under overexposure time settings. With optimum or normal exposure time setting, the errors on measuring ASW eRD of high and low opacity restoration materials were reduced. Even with the under exposure time settings, the digital X-ray systems using AEC may enhance the image properly and it could minimize clinicians’ radiation dose.21
Even though current study used 3 different IAC modes of one system which might be different from other companies’ IAC modes, majority of the commercially available digital radiograph system employs similar mapping methods like linear or non-linear (mostly using sine waves) as well as some type of AEC or AGC. Further study comparing IAC modes of different systems might be warranted.
Conclusions
Although different digital radiographic modes induced large variation on attenuation of coefficient and contrast of ASW, E mode improved diagnostic quality of the image significantly under the under-exposure condition by improving contrasts. Under the condition of this study, underexposure time may be acceptable clinically with digital X-ray system using AGC that reduces radiation exposure for patient.
Conflict of Interest: No potential conflict of interest relevant to this article was reported.
References
1. Wenzel A, Gröndahl HG. Direct digital radiography in the dental office. Int Dent J 1995;45:27-34.
2. Nomoto R, Mishima A, Kobayashi K, McCabe JF, Darvell BW, Watts DC, Momoi Y, Hirano S. Quantitative determination of radio-opacity: equivalence of digital and film X-ray systems. Dent Mater 2008;24:141-147.
3. Schick Technologies. CDR DICOM quick start guide. Long Island City: Schick Technologies, Inc.; 2004.
4. Uffmann M, Schaefer-Prokop C. Digital radiography: the balance between image quality and required radiation dose. Eur J Radiol 2009;72:202-208.
5. ISO 4049 Dentistry - polymer-based filling, restorative and luting materials. Geneva: International Organization for Standardization; 1998.
6. ISO-Standards ISO 9917 Dentistry—water-based cements. Geneva: International Organization for Standardization; 1998. p1-23.
7. Nickoloff EL, Dutta AK, Lu ZF. Influence of phantom diameter, kVp and scan mode upon computed tomography dose index. Med Phys 2003;30:395-402.
8. Rasimick BJ, Shah RP, Musikant BL, Deutsch AS. Radiopacity of endodontic materials on film and a digital sensor. J Endod 2007;33:1098-1101.
9. Sabbagh J, Vreven J, Leloup G. Radiopacity of resin based materials in film radiographs and storage phosphor plate (Diagora). Oper Dent 2004;29:677-684.
10. Baksi BG, Sen BH, Eyuboglu TF. Differences in aluminum equivalent values of endodontic sealers: conventional versus digital radiography. J Endod 2008;34:1101-1104.
11. Gu S, Rasimick BJ, Deutsch AS, Musikant BL. Radio-pacity of dental materials using a digital X-ray system. Dent Mater 2006;22:765-770.
12. Rasimick BJ, Gu S, Deutsch AS, Musikant BL. Measuring the radiopacity of luting cements, dowels, and core build-up materials with a digital radiography system using a CCD sensor. J Prosthodont 2007;16:357-364.
13. Yang J, Chiou R, Ruprecht A, Vicario J, MacPhail LA, Rams TE. A new device for measuring density of jaw
Seong WJ et al.
http://dx.doi.org/10.5395/rde.2013.38.3.146

153www.rde.ac
Quality assurance of digital radiography systems
bones. Dentomaxillofac Radiol 2002;31:313-316.14. Southard TE, Wunderle DM, Southard KA, Jakobsen
JR. Geometric and densitometric standardization of intraoral radiography through use of a modified XCP system. Oral Surg Oral Med Oral Pathol Oral Radiol Endod 1999;87:253-257.
15. Kitagawa H, Scheetz JP, Farman AG. Comparison of complementary metal oxide semiconductor and charge-coupled device intraoral X-ray detectors using subjective image quality. Dentomaxillofac Radiol 2003; 32:408-411.
16. Schulze D, Rother UJ, Fuhrmann AW, Tietke M. A comparison of two intraoral CCD sensor systems in terms of image quality and interobserver agreement. Int J Comput Dent 2003;6:141-150.
17. Benediktsdottir IS, Hintze H, Petersen JK, Wenzel A. Image quality of two solid-state and three photostimulable phosphor plate digital panoramic systems, and treatment planning of mandibular third molar removal. Dentomaxillofac Radiol 2003;32:39-44.
18. Walsh C, Gorman D, Byrne P, Larkin A, Dowling A, Malone JF. Quality assurance of computed and digital radiography systems. Radiat Prot Dosimetry 2008;129:271-275.
19. Chantler CT, Olsen K, Dragoset RA, Chang J, Kishore AR, Kotochigova SA, Zucker DS. X-Ray Form Factor, Attenuation and Scattering Tables (version 2.1). [Online] Available: http://physics.nist.gov/ffast [Monday, 29-Jul-2013 23:22:42 EDT]. National Institute of Standards and Technology, Gaithersburg, MD. Originally published as Chantler CT. J Phys Chem Ref Data 2000;29:597-1048.
20. Brooks RA, Di Chiro G. Beam hardening in x-ray reconstructive tomography. Phys Med Biol 1976;21:390-398.
21. Cho JY, Han WJ. The reduction methods of operator’s radiation dose for portable dental X-ray machines. Restor Dent Endod 2012;37:160-164.
http://dx.doi.org/10.5395/rde.2013.38.3.146