Dust revolutions. Dust, informe, architecture (notes for a reading of Dust in Bataille)
INTERNATIONAL JOURNAL OF CLIMATOLOGYInt. J. Climatol. (2014)Published online in Wiley Online Library(wileyonlinelibrary.com) DOI: 10.1002/joc.4028
The effects of ENSO under negative AO phase on spring dustactivity over northern China: an observational investigation
Yun Gon Lee,a,b Jhoon Kim,a* Chang-Hoi Ho,b Soon-Il An,a Hi-Ku Cho,a Rui Mao,c Baijun Tian,d
Dong Wu,d† Jae N. Lee,d† Olga Kalashnikova,d Yunsoo Choie and Sang-Wook Yehfa Department of Atmospheric Sciences/IEAA BK21, Yonsei University, Seoul, Koreab School of Earth and Environmental Sciences, Seoul National University, Korea
c State Key Laboratory of Land Surface Processes and Resource Ecology, Beijing Normal University, Chinad Jet Propulsion Laboratory, California Institute of Technology, Pasadena, CA, USAe Department of Earth and Atmospheric Sciences, University of Houston, TX, USA
f Department of Marine Sciences and Convergent Technology, Hanyang University, Ansan, Korea
ABSTRACT: The effects of El Niño/Southern Oscillation (ENSO) under negative Arctic Oscillation (AO) phase on theAsian dust activity are investigated for springs of the period 1961–2002. The spring dust index (DI) describing the monthlyfrequencies of three types of dust events (e.g. dust storm, blowing dust, and floating dust) exhibits a significant increase in theyears of negative AO phase (hereafter AO−) and El Niño, compared with that in the years of AO− and La Niña. Averaged overall observation stations, the spring DI (49.7) during the El Niño/AO− years is higher by 11.4% or 29.8% than that (38.3) duringthe La Niña/AO− years.We suggest possible physical mechanism that the anomalous large-scale environments associated withAO− and El Niño are more effective to provide favourable conditions to enhance Asian dust activity. During the El Niño/AO−years, meridional gradients of pressure and temperature over the dust source regions are significantly enhanced by decreasingthe geopotential height and warming air temperature that originated from the north and south of source regions, respectively,under the influence of AO− and El Niño. These also intensify the zonal wind shear and atmospheric baroclinicity, therebyproducing enhanced cyclogenesis and dust occurrences over the major source regions. At the same time, dust transport pathswith the stronger westerly winds are developed by the combined constraints of anomalous cyclone over the Siberia and theMongolia and anomalous anticyclone over the western North Pacific, and thus strengthen dust transport to the downwindregions.
KEY WORDS Asian dust; dust index; Arctic Oscillation; El Niño/Southern Oscillation
Received 28 April 2013; Revised 2 March 2014; Accepted 1 April 2014
1. Introduction
‘Asian dust’ is a well-known spring season phenomenonoriginating from arid or semiarid highlands in northernChina and Mongolia (e.g. Prospero et al., 2002; Wash-ington et al., 2003; Zhao et al., 2006; Chun et al., 2008).Many previous studies suggested that the occurrence andtransport of Asian dust (i.e. dust activity) are closelyrelated to variations in large-scale climate variables andlocal to regional climate conditions, and demonstratedthe physical and dynamic mechanisms behind these rela-tionships (e.g. Zhang et al., 1997a, 1997b, 2003; Qianet al., 2002; Gao et al., 2003; Zhang and Ren, 2003; Fanand Wang, 2004; Zhao et al., 2004; Ding et al., 2005;Gong et al., 2006a, 2006b, 2007a, 2007b; Hara et al.,2006; Mao et al., 2011). In regard to the long-term trendsof dust storms in the different areas of northern China,
*Correspondence to: J. Kim, Global Environment Laboratory/Department of Atmospheric Sciences, Yonsei University, Seoul120-749, Korea. E-mail: [email protected]
†Present address: NASA GSFC, Greenbelt, MD, USA.
previous studies have demonstrated that dust outbreaksin northwestern China have been decreasing since themid-1980s (Ding et al., 2005; Gong et al., 2006a; Zhanget al., 2006) and have suggested that this tendency isrelated to decreased Eurasian snow cover and atmosphericbaroclinicity (Zhu et al., 2008; Lee et al., 2013), proba-bly associated with global warming. On the other hand,dust outbreaks in the central region of Inner Mongolia andadjacent regions of northeastern China have occurred withincreasing frequency since 2000 (Lim and Chun, 2006;Tian et al., 2007; Zhang and Gao, 2007; Zhang et al.,2008), and desertification resulting from drought condi-tions and anthropogenic factors (e.g. reduced precipita-tion/soil moisture, degraded surface vegetation, and over-grazing) in these regions has been identified as a majorcause of this increased frequency (Lee and Sohn, 2011;Gao et al., 2012).Arctic Oscillation (AO), a dominant pattern for varia-
tions of sea level pressure (SLP) to the north of 20∘N,is described by SLP anomalies of one sign in the Arcticand anomalies of the opposite sign centred at approxi-mately 37∘N to 45∘N. When AO is in a positive phase
© 2014 Royal Meteorological Society

Y. G. LEE et al.
(or negative phase), the pattern of SLP exhibits relativelylow (or high) pressures over the polar region and rela-tively high (or low) pressures at the mid-latitudes (Thomp-son and Wallace, 1998). Previous studies revealed that AOaccounts for 20%–30% in the variance of the extratropi-cal geopotential height, and is one of the most significantpatterns in the mid-high latitudes of the Northern Hemi-sphere (Thompson and Wallace, 2000; Thompson et al.,2000; Higgins et al., 2002; Wettstein and Mearns, 2002).Gong et al. (2001) and Jeong and Ho (2005) also sug-gested that colder surface temperatures, stronger weatherfluctuations, and frequent cold surges over northern Chinaare observed during the negative AO phase. The reverse istrue for the positive AO phase. Therefore, AO has signifi-cant influences on Asian climate, and can also affect Asiandust activity (Song et al., 2004; Gong et al., 2006a, 2006b;Hara et al., 2006; Liu and Ding, 2007; Gao and Washing-ton, 2010; Mao et al., 2011).On the other hand, the El Niño/Southern Oscillation
(ENSO) is a coupled ocean–atmosphere phenomenon oninterannual time scale that impacts the global climate.ENSO events are characterized by an interannual seesawpattern in the sea surface temperature (SST) and SLPbetween the eastern and western tropical Pacific. Previousstudies have shown that the East Asia winter monsoon(EAWM) tends to be weak in the El Niño years (e.g. Li,1990; Zhang et al., 1997a, 1997b). Li (1990) suggestedthat Ferrell cell is activated by the intensified Hadley cellin the El Niño years, and then the strong westerlies nearthe surface constrain the intensification of the Siberianhigh during winter season. Chen et al. (2000) also showedthat the EAWM tends to be weaker (or stronger) in the ElNiño (or La Niña) years when tropical SSTs in the westernNorth Pacific are lower (or higher). With regard to therelationship between Asian dust activity and ENSO, it hasbeen shown that spring dust activities are closely relatedto ENSO via the variations in dust transport path ratherthan those in dust occurrence over dust source regions (e.g.Gong et al., 2006b; Hara et al., 2006).Although previous studies suggested individual relation-
ships between Asian dust activity and large-scale climatevariables such as the AO and ENSO, the combined effectsof such two climate variability on dust activity have notyet been examined. It is noted that the AO and ENSOcan develop different combinations due to the differencein their phases and periods. Thus, these combinations canjointly result in conditions that strengthen or weaken dustactivity in the mid-latitudes since the effects of the AO andENSO originate, respectively, from the polar and tropicalregions. Therefore, it is intriguing to investigate the com-bined effects of the AO and ENSO in terms of both dustoccurrence in source regions and dust transport over thesurrounding areas.This article is organized as follows. Section 2 describes
the data and methodology used in this study. In Section3.1, the observed composite differences in spring dustactivity, respectively, for two AO phases and two ENSOphases under the negative AO phase are presented. Section3.2 analyses the detailed physical mechanisms that link
Table 1. The meteorological conditions for three categories ofdust events.
Type Wind Visibility Atmospheric condition
Floating dust (FD) Low 1–10 km SuspendedBlowing dust (BD) Strong 1–10 km TurbidDust storm (DS) Strong <1 km Turbid
atmospheric circulation with the Asian dust activity: theindividual differences for AO and ENSO phases, theanomalies between two combined phases and climatol-ogy, the composite differences for two combined phases,and the comparison between combined phases and onlyone phase are described in subsections. In Section 4,the present results are summarized and implications arediscussed.
2. Data and methodology
2.1. Data
The ground-based monthly meteorological data wereused to analyse the changes of dust activities for theperiod 1961–2002. These data were obtained from theNational Meteorological Center of the China Meteorolog-ical Administration. The observations of dust events at701 meteorological stations in China were classified intothree categories: dust storm (DS), blowing dust (BD), andfloating dust (FD). Table 1 shows the meteorological con-ditions for the three categories of dust events. The dustssuspended in the air and lifted off the ground by winds aredivided into FD and BD category, respectively, with hori-zontal visibility below 10 km. The DS category indicatesthe dusts are frictionally lifted from the ground by strongwinds above 5ms−1 under turbid atmospheric condition,causing horizontal visibility below 1 km (Gillette, 1978;Wang et al., 2008). However, it should be noted that DSmay be caused locally but BD and FD may be transportedfrom other source regions. Thus, the weight coefficientsfor three categories need to describe dust activity at thesite. In order to obtain an indicator of dust activity thatincludes all dust event categories, many studies haveanalysed long-term statistical relationships among DS,BD, and FD (e.g. Wang et al., 2003; Zhou and Zhang,2003; Wang et al., 2008). Here, we adopted the dust index(DI) defined by Wang et al. (2008):
DI = 9 × DS + 3 × BD + FD,
where DS, BD, and FD are the respective monthly fre-quencies for the aforementioned three dust events. Thisrelationship implies that, if a DS occurs at a station, theintensity of dust activity is almost three times greater thana BD, or nine times greater than a FD. Thus, the DIdescribes the overall intensity of dust events. Theoretically,this spring DI can be as high as 399, but the highest DIvalue ever observed is 181.6 for the period 1961–2002.In this study, we restricted our analysis to 61 stations
where DS persistently occur above 10consecutive springs
© 2014 Royal Meteorological Society Int. J. Climatol. (2014)
THE COMBINED EFFECTS OF AO AND ENSO ON SPRING DUST ACTIVITY
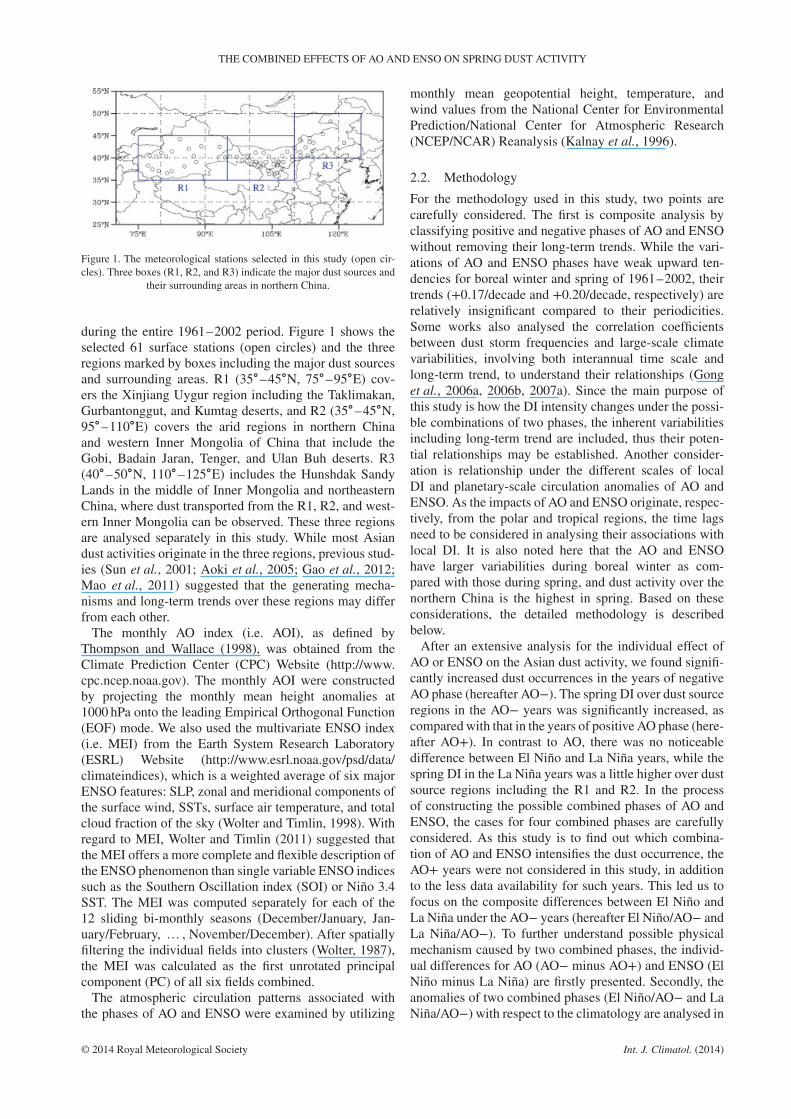
Figure 1. The meteorological stations selected in this study (open cir-cles). Three boxes (R1, R2, and R3) indicate the major dust sources and
their surrounding areas in northern China.
during the entire 1961–2002 period. Figure 1 shows theselected 61 surface stations (open circles) and the threeregions marked by boxes including the major dust sourcesand surrounding areas. R1 (35∘–45∘N, 75∘–95∘E) cov-ers the Xinjiang Uygur region including the Taklimakan,Gurbantonggut, and Kumtag deserts, and R2 (35∘–45∘N,95∘–110∘E) covers the arid regions in northern Chinaand western Inner Mongolia of China that include theGobi, Badain Jaran, Tenger, and Ulan Buh deserts. R3(40∘–50∘N, 110∘–125∘E) includes the Hunshdak SandyLands in the middle of Inner Mongolia and northeasternChina, where dust transported from the R1, R2, and west-ern Inner Mongolia can be observed. These three regionsare analysed separately in this study. While most Asiandust activities originate in the three regions, previous stud-ies (Sun et al., 2001; Aoki et al., 2005; Gao et al., 2012;Mao et al., 2011) suggested that the generating mecha-nisms and long-term trends over these regions may differfrom each other.The monthly AO index (i.e. AOI), as defined by
Thompson and Wallace (1998), was obtained from theClimate Prediction Center (CPC) Website (http://www.cpc.ncep.noaa.gov). The monthly AOI were constructedby projecting the monthly mean height anomalies at1000 hPa onto the leading Empirical Orthogonal Function(EOF) mode. We also used the multivariate ENSO index(i.e. MEI) from the Earth System Research Laboratory(ESRL) Website (http://www.esrl.noaa.gov/psd/data/climateindices), which is a weighted average of six majorENSO features: SLP, zonal and meridional components ofthe surface wind, SSTs, surface air temperature, and totalcloud fraction of the sky (Wolter and Timlin, 1998). Withregard to MEI, Wolter and Timlin (2011) suggested thatthe MEI offers a more complete and flexible description ofthe ENSO phenomenon than single variable ENSO indicessuch as the Southern Oscillation index (SOI) or Niño 3.4SST. The MEI was computed separately for each of the12 sliding bi-monthly seasons (December/January, Jan-uary/February, … , November/December). After spatiallyfiltering the individual fields into clusters (Wolter, 1987),the MEI was calculated as the first unrotated principalcomponent (PC) of all six fields combined.The atmospheric circulation patterns associated with
the phases of AO and ENSO were examined by utilizing
monthly mean geopotential height, temperature, andwind values from the National Center for EnvironmentalPrediction/National Center for Atmospheric Research(NCEP/NCAR) Reanalysis (Kalnay et al., 1996).
2.2. Methodology
For the methodology used in this study, two points arecarefully considered. The first is composite analysis byclassifying positive and negative phases of AO and ENSOwithout removing their long-term trends. While the vari-ations of AO and ENSO phases have weak upward ten-dencies for boreal winter and spring of 1961–2002, theirtrends (+0.17/decade and +0.20/decade, respectively) arerelatively insignificant compared to their periodicities.Some works also analysed the correlation coefficientsbetween dust storm frequencies and large-scale climatevariabilities, involving both interannual time scale andlong-term trend, to understand their relationships (Gonget al., 2006a, 2006b, 2007a). Since the main purpose ofthis study is how the DI intensity changes under the possi-ble combinations of two phases, the inherent variabilitiesincluding long-term trend are included, thus their poten-tial relationships may be established. Another consider-ation is relationship under the different scales of localDI and planetary-scale circulation anomalies of AO andENSO. As the impacts of AO and ENSO originate, respec-tively, from the polar and tropical regions, the time lagsneed to be considered in analysing their associations withlocal DI. It is also noted here that the AO and ENSOhave larger variabilities during boreal winter as com-pared with those during spring, and dust activity over thenorthern China is the highest in spring. Based on theseconsiderations, the detailed methodology is describedbelow.After an extensive analysis for the individual effect of
AO or ENSO on the Asian dust activity, we found signifi-cantly increased dust occurrences in the years of negativeAO phase (hereafter AO−). The spring DI over dust sourceregions in the AO− years was significantly increased, ascomparedwith that in the years of positive AO phase (here-after AO+). In contrast to AO, there was no noticeabledifference between El Niño and La Niña years, while thespring DI in the La Niña years was a little higher over dustsource regions including the R1 and R2. In the processof constructing the possible combined phases of AO andENSO, the cases for four combined phases are carefullyconsidered. As this study is to find out which combina-tion of AO and ENSO intensifies the dust occurrence, theAO+ years were not considered in this study, in additionto the less data availability for such years. This led us tofocus on the composite differences between El Niño andLa Niña under the AO− years (hereafter El Niño/AO− andLa Niña/AO−). To further understand possible physicalmechanism caused by two combined phases, the individ-ual differences for AO (AO− minus AO+) and ENSO (ElNiño minus La Niña) are firstly presented. Secondly, theanomalies of two combined phases (El Niño/AO− and LaNiña/AO−) with respect to the climatology are analysed in
© 2014 Royal Meteorological Society Int. J. Climatol. (2014)
Y. G. LEE et al.
detail. In addition, together with the composite differencesbetween El Niño/AO− and La Niña/AO−, the anomalouspatterns during El Niño/AO− years are compared withthose in El Niño only (or AO− only) years.In selecting typical years for AO and ENSO phases, two
seasons of boreal winter (December–January–February;DJF) and spring (March–April–May; MAM) are consid-ered since the AO and ENSO have the largest variabil-ity during boreal winter, and their effects persist till thefollowing spring season. Typical El Niño (or La Niña)years were determined when the mean MEI values forwinter–spring seasons were higher (or lower) than thetemporal mean of all positive (or negative) MEI valuesfor the 42 winter–spring seasons from December 1960to May 2002. Similarly, typical years of AO+ and AO−were selected. The AO+, AO−, El Niño/AO−, and LaNiña/AO− years selected in this study are summarized inTable 2. Based on the typical years for El Niño/AO− andLa Niña/AO−, the composite differences in spring DI andatmospheric circulations were calculated for the 42 springseasons (MAM) of 1961–2002, as the dust activity is thehighest in spring over the northern China.
Table 2. The list of typical years for the 42winter–spring seasonsfromDecember 1960 toMay 2002 showing AO+, El Niño/AO−,
and La Niña/AO−.
1960–2002 (DJF/MAM) Typical years
AO+ 1975–1976, 1988–1989, 1989–1990,1991–1992
AO− El Niño 1965–1966, 1968–1969, 1976–1977,1979–1980, 1997–1998
La Niña 1962–1963, 1964–1965, 1984–1985,1995–1996, 2000–2001
3. Results
3.1. Variations in the spring DI
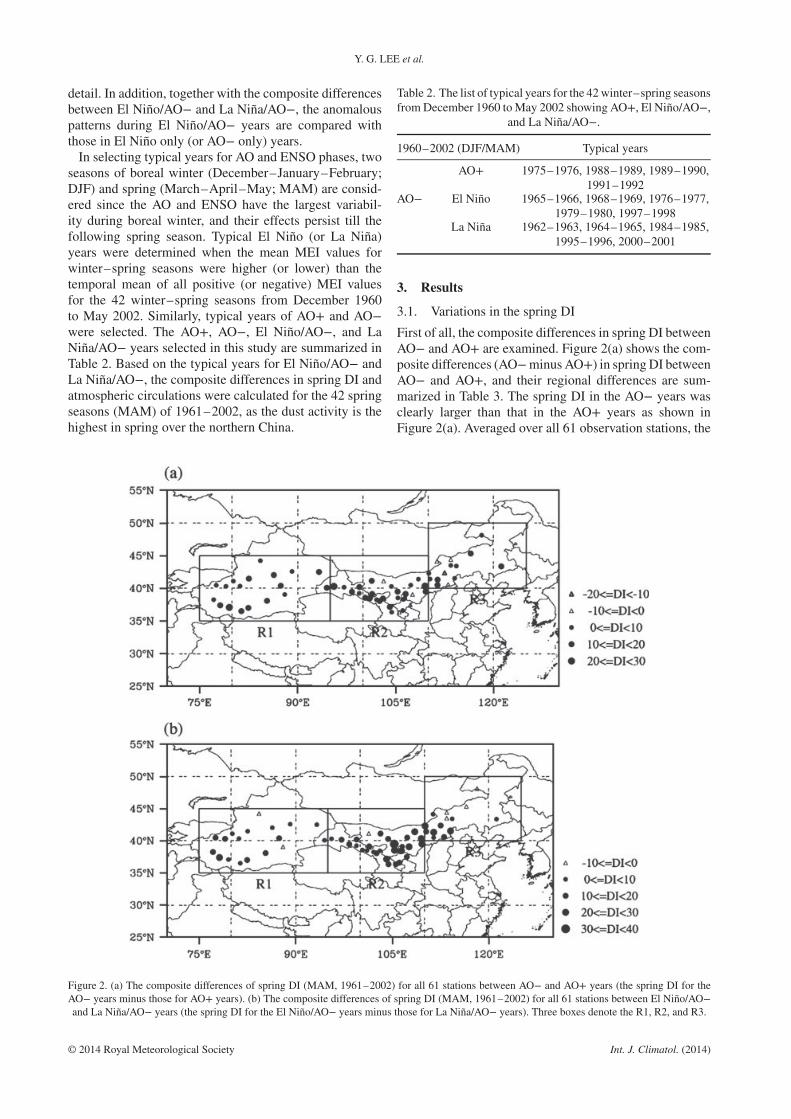
First of all, the composite differences in spring DI betweenAO− and AO+ are examined. Figure 2(a) shows the com-posite differences (AO−minusAO+) in springDI betweenAO− and AO+, and their regional differences are sum-marized in Table 3. The spring DI in the AO− years wasclearly larger than that in the AO+ years as shown inFigure 2(a). Averaged over all 61 observation stations, the
Figure 2. (a) The composite differences of spring DI (MAM, 1961–2002) for all 61 stations between AO− and AO+ years (the spring DI for theAO− years minus those for AO+ years). (b) The composite differences of spring DI (MAM, 1961–2002) for all 61 stations between El Niño/AO−and La Niña/AO− years (the spring DI for the El Niño/AO− years minus those for La Niña/AO− years). Three boxes denote the R1, R2, and R3.
© 2014 Royal Meteorological Society Int. J. Climatol. (2014)

THE COMBINED EFFECTS OF AO AND ENSO ON SPRING DUST ACTIVITY
Table 3. Composite differences of spring DI between AO− and AO+ over the R1, R2, R3, and all 61 stations (spring DI for AO−years minus those for AO+ years).
AO− AO+
R1, 18 stations (35∘–45∘N, 75∘–95∘E) Clim. = 51.4 Composite mean 54.4 42.6
Composite difference11.8 (p= 0.163)
Min.= 3.1, Max.= 24.2
R2, 29 stations (35∘–45∘N, 95∘–110∘E) Clim.= 41.2 Composite mean 54.7 35.3
Composite difference19.4** (p= 0.002)
Min.=−13.7, Max.= 50.1
R3, 14 stations (40∘–50∘N, 110∘–125∘E) Clim.= 22.4 Composite mean 31.8 20.6
Composite difference11.2* (p= 0.011)
Min.=−10.2, Max.= 42.2
All 61 stations Clim.= 39.9 Composite mean 43.1 34.0Composite difference 9.1* (p= 0.013)
Number in parenthesis is p value using a Student’s t test between two groups. Composite differences exceeding the 95% significance level are markedby single asterisks (*) and those exceeding the 99% significance level are marked by double asterisks (**).
Table 4. Composite differences of spring DI between El Niño/AO− and La Niña/AO− over the R1, R2, R3, and all 61 stations (springDI for El Niño/AO− years minus those for La Niña/AO− years).
El Niño/AO− La Niña/AO−
R1, 18 stations (35∘–45∘N, 75∘–95∘E) Clim.= 51.4 Composite mean 59.1 51.3
Composite difference7.8 (p= 0.375)
Min.=−9.5, Max.= 23.9
R2, 29 stations (35∘–45∘N, 95∘–110∘E) Clim.= 41.2 Composite mean 52.5 37.6
Composite difference14.9** (p= 0.001)
Min.=−6.5, Max. = 34.9
R3, 14 stations (40∘–50∘N, 110∘–125∘E) Clim.= 22.4 Composite mean 31.6 23.2
Composite difference8.4* (p= 0.047)
Min.=−8.6, Max.= 23.9
All 61 stations Clim.= 39.9 Composite mean 49.7 38.3Composite difference 11.4** (p= 0.004)
Number in parenthesis is p value using a Student’s t test between two groups. Composite differences exceeding the 95% significance level are markedby single asterisks (*) and those exceeding the 99% significance level are marked by double asterisks (**).
spring DI (43.1) in the AO− years is larger by 9.1 thanthat (34.0) in the AO+ years, this difference (p= 0.013using a Student’s t test) between two groups exceeds the95% significance level. In particular, the stations show-ing a significant increase in spring DI are mainly locatedover the R2 and R3, respectively, at the 99% and 95% sig-nificance level. It can be inferred that the R2 and R3 arelocated in the downwind path of westerly winds from theTarimBasin with unique topographical characteristics, andare easily affected by dusts originated from the Mongolianareas. This AO dependency is consistent with the previ-ous findings from the observation andmodel studies (Gonget al., 2006a; Hara et al., 2006; Mao et al., 2011).On the basis of the significant increases of spring DI
under the AO− years, Figure 2(b) shows the compos-ite differences (El Niño/AO− minus La Niña/AO−) ofspring DI between El Niño/AO− and La Niña/AO− yearsover all 61 stations. When AO− is coupled with El Niño,the spring DI is clearly increased at most stations. The
spring DI (49.7) averaged over all stations in the ElNiño/AO− years is higher by 11.4 than that (38.3) in theLa Niña/AO− years, while the difference in spring DIbetween the AO− and AO+ years was 9.1. Furthermore,the difference of 11.4 (p= 0.004) between El Niño/AO−and La Niña/AO− years exceeds the 99% significancelevel. Compared with the average spring DI (39.9) overall stations for the entire 42-year period, the spring DI inthe El Niño/AO− years is larger by 29%. Interestingly, thestations (R2 and R3) located in the downward path of west-erly winds from major source regions of the Asian dust,including R1 and R2, show significant increases of thespring DI.To further examine this difference by regions, the com-
posite differences of spring DI for classified three regionsare presented in Table 4. In 18 stations over the R1 includ-ing the Taklimakan, Gurbantonggut, and Kumtag deserts,the composite differences of spring DI range from −9.5 to23.9 with an average of 7.8. The spring DI (59.1) in the El
© 2014 Royal Meteorological Society Int. J. Climatol. (2014)
Y. G. LEE et al.
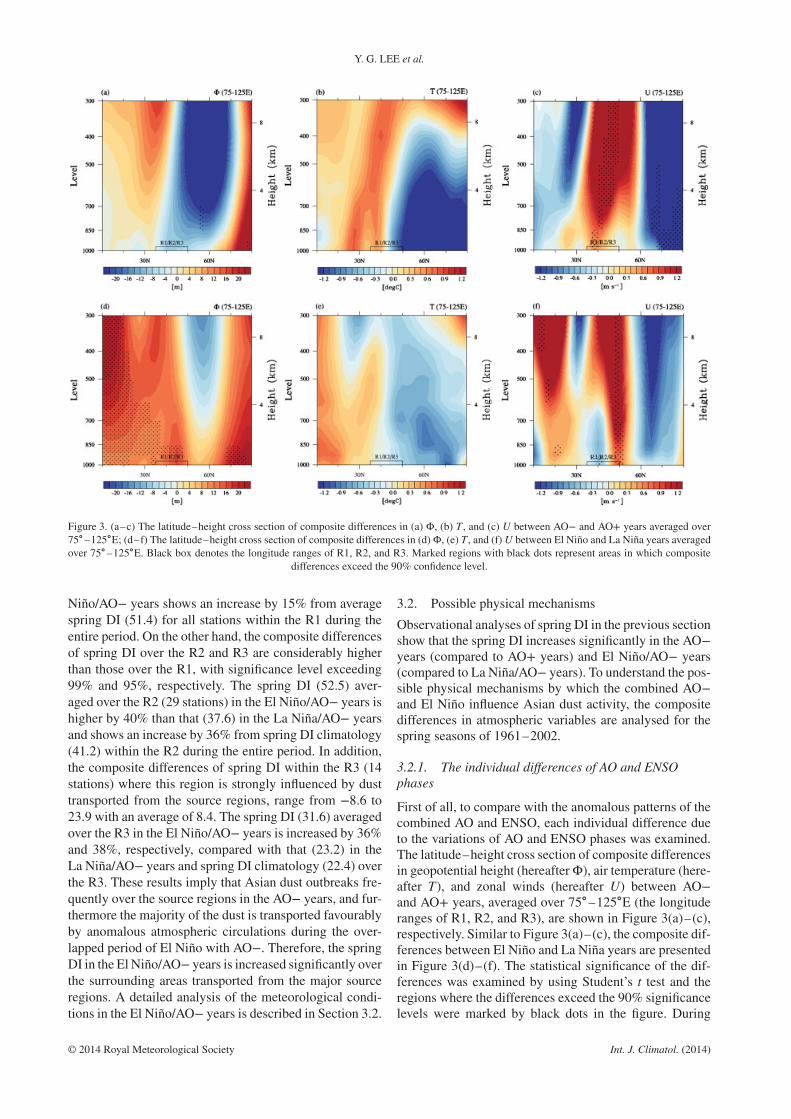
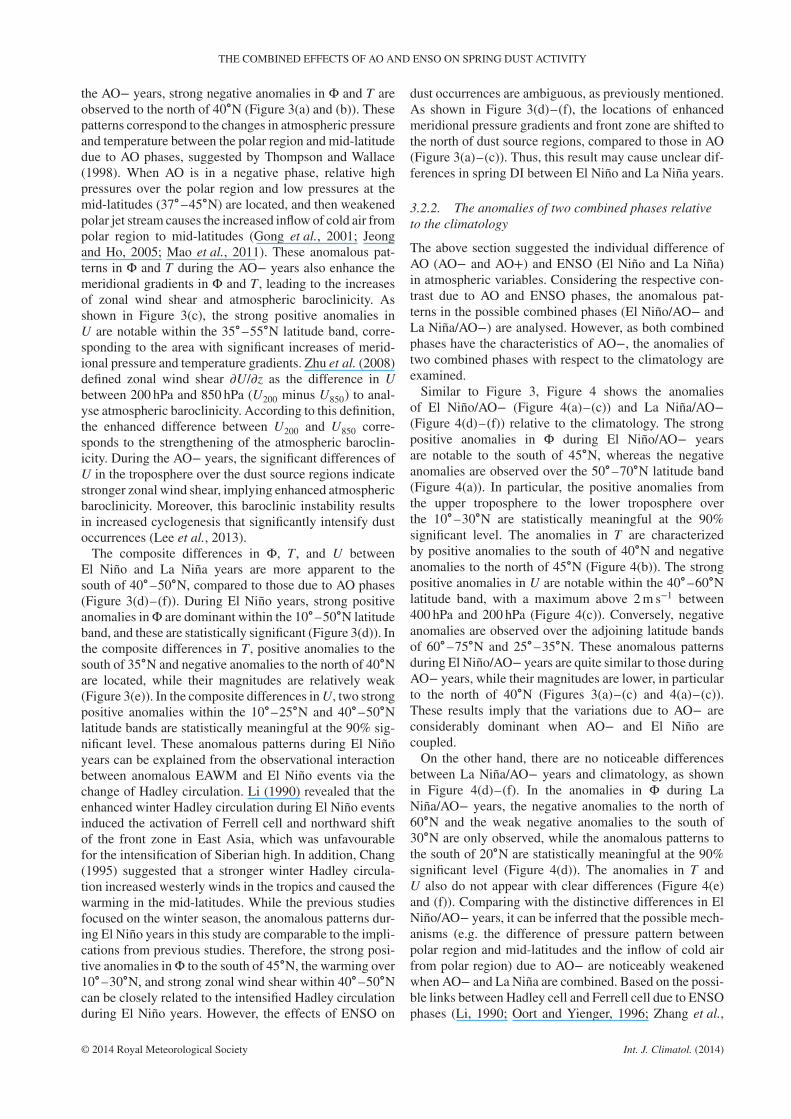
Figure 3. (a–c) The latitude–height cross section of composite differences in (a) Φ, (b) T , and (c) U between AO− and AO+ years averaged over75∘ –125∘E; (d–f) The latitude–height cross section of composite differences in (d)Φ, (e) T , and (f) U between El Niño and La Niña years averagedover 75∘–125∘E. Black box denotes the longitude ranges of R1, R2, and R3. Marked regions with black dots represent areas in which composite
differences exceed the 90% confidence level.
Niño/AO− years shows an increase by 15% from averagespring DI (51.4) for all stations within the R1 during theentire period. On the other hand, the composite differencesof spring DI over the R2 and R3 are considerably higherthan those over the R1, with significance level exceeding99% and 95%, respectively. The spring DI (52.5) aver-aged over the R2 (29 stations) in the El Niño/AO− years ishigher by 40% than that (37.6) in the La Niña/AO− yearsand shows an increase by 36% from spring DI climatology(41.2) within the R2 during the entire period. In addition,the composite differences of spring DI within the R3 (14stations) where this region is strongly influenced by dusttransported from the source regions, range from −8.6 to23.9 with an average of 8.4. The spring DI (31.6) averagedover the R3 in the El Niño/AO− years is increased by 36%and 38%, respectively, compared with that (23.2) in theLa Niña/AO− years and spring DI climatology (22.4) overthe R3. These results imply that Asian dust outbreaks fre-quently over the source regions in the AO− years, and fur-thermore the majority of the dust is transported favourablyby anomalous atmospheric circulations during the over-lapped period of El Niño with AO−. Therefore, the springDI in the El Niño/AO− years is increased significantly overthe surrounding areas transported from the major sourceregions. A detailed analysis of the meteorological condi-tions in the El Niño/AO− years is described in Section 3.2.
3.2. Possible physical mechanisms
Observational analyses of spring DI in the previous sectionshow that the spring DI increases significantly in the AO−years (compared to AO+ years) and El Niño/AO− years(compared to La Niña/AO− years). To understand the pos-sible physical mechanisms by which the combined AO−and El Niño influence Asian dust activity, the compositedifferences in atmospheric variables are analysed for thespring seasons of 1961–2002.
3.2.1. The individual differences of AO and ENSOphases
First of all, to compare with the anomalous patterns of thecombined AO and ENSO, each individual difference dueto the variations of AO and ENSO phases was examined.The latitude–height cross section of composite differencesin geopotential height (hereafterΦ), air temperature (here-after T), and zonal winds (hereafter U) between AO−and AO+ years, averaged over 75∘–125∘E (the longituderanges of R1, R2, and R3), are shown in Figure 3(a)–(c),respectively. Similar to Figure 3(a)–(c), the composite dif-ferences between El Niño and La Niña years are presentedin Figure 3(d)–(f). The statistical significance of the dif-ferences was examined by using Student’s t test and theregions where the differences exceed the 90% significancelevels were marked by black dots in the figure. During
© 2014 Royal Meteorological Society Int. J. Climatol. (2014)
THE COMBINED EFFECTS OF AO AND ENSO ON SPRING DUST ACTIVITY
the AO− years, strong negative anomalies in Φ and T areobserved to the north of 40∘N (Figure 3(a) and (b)). Thesepatterns correspond to the changes in atmospheric pressureand temperature between the polar region and mid-latitudedue to AO phases, suggested by Thompson and Wallace(1998). When AO is in a negative phase, relative highpressures over the polar region and low pressures at themid-latitudes (37∘–45∘N) are located, and then weakenedpolar jet stream causes the increased inflow of cold air frompolar region to mid-latitudes (Gong et al., 2001; Jeongand Ho, 2005; Mao et al., 2011). These anomalous pat-terns in Φ and T during the AO− years also enhance themeridional gradients in Φ and T , leading to the increasesof zonal wind shear and atmospheric baroclinicity. Asshown in Figure 3(c), the strong positive anomalies inU are notable within the 35∘–55∘N latitude band, corre-sponding to the area with significant increases of merid-ional pressure and temperature gradients. Zhu et al. (2008)defined zonal wind shear �U/�z as the difference in Ubetween 200 hPa and 850 hPa (U200 minus U850) to anal-yse atmospheric baroclinicity. According to this definition,the enhanced difference between U200 and U850 corre-sponds to the strengthening of the atmospheric baroclin-icity. During the AO− years, the significant differences ofU in the troposphere over the dust source regions indicatestronger zonal wind shear, implying enhanced atmosphericbaroclinicity. Moreover, this baroclinic instability resultsin increased cyclogenesis that significantly intensify dustoccurrences (Lee et al., 2013).The composite differences in Φ, T , and U between
El Niño and La Niña years are more apparent to thesouth of 40∘–50∘N, compared to those due to AO phases(Figure 3(d)–(f)). During El Niño years, strong positiveanomalies inΦ are dominant within the 10∘–50∘N latitudeband, and these are statistically significant (Figure 3(d)). Inthe composite differences in T , positive anomalies to thesouth of 35∘N and negative anomalies to the north of 40∘Nare located, while their magnitudes are relatively weak(Figure 3(e)). In the composite differences inU, two strongpositive anomalies within the 10∘–25∘N and 40∘–50∘Nlatitude bands are statistically meaningful at the 90% sig-nificant level. These anomalous patterns during El Niñoyears can be explained from the observational interactionbetween anomalous EAWM and El Niño events via thechange of Hadley circulation. Li (1990) revealed that theenhanced winter Hadley circulation during El Niño eventsinduced the activation of Ferrell cell and northward shiftof the front zone in East Asia, which was unfavourablefor the intensification of Siberian high. In addition, Chang(1995) suggested that a stronger winter Hadley circula-tion increased westerly winds in the tropics and caused thewarming in the mid-latitudes. While the previous studiesfocused on the winter season, the anomalous patterns dur-ing El Niño years in this study are comparable to the impli-cations from previous studies. Therefore, the strong posi-tive anomalies inΦ to the south of 45∘N, the warming over10∘–30∘N, and strong zonal wind shear within 40∘–50∘Ncan be closely related to the intensified Hadley circulationduring El Niño years. However, the effects of ENSO on
dust occurrences are ambiguous, as previously mentioned.As shown in Figure 3(d)–(f), the locations of enhancedmeridional pressure gradients and front zone are shifted tothe north of dust source regions, compared to those in AO(Figure 3(a)–(c)). Thus, this result may cause unclear dif-ferences in spring DI between El Niño and La Niña years.
3.2.2. The anomalies of two combined phases relativeto the climatology
The above section suggested the individual difference ofAO (AO− and AO+) and ENSO (El Niño and La Niña)in atmospheric variables. Considering the respective con-trast due to AO and ENSO phases, the anomalous pat-terns in the possible combined phases (El Niño/AO− andLa Niña/AO−) are analysed. However, as both combinedphases have the characteristics of AO−, the anomalies oftwo combined phases with respect to the climatology areexamined.Similar to Figure 3, Figure 4 shows the anomalies
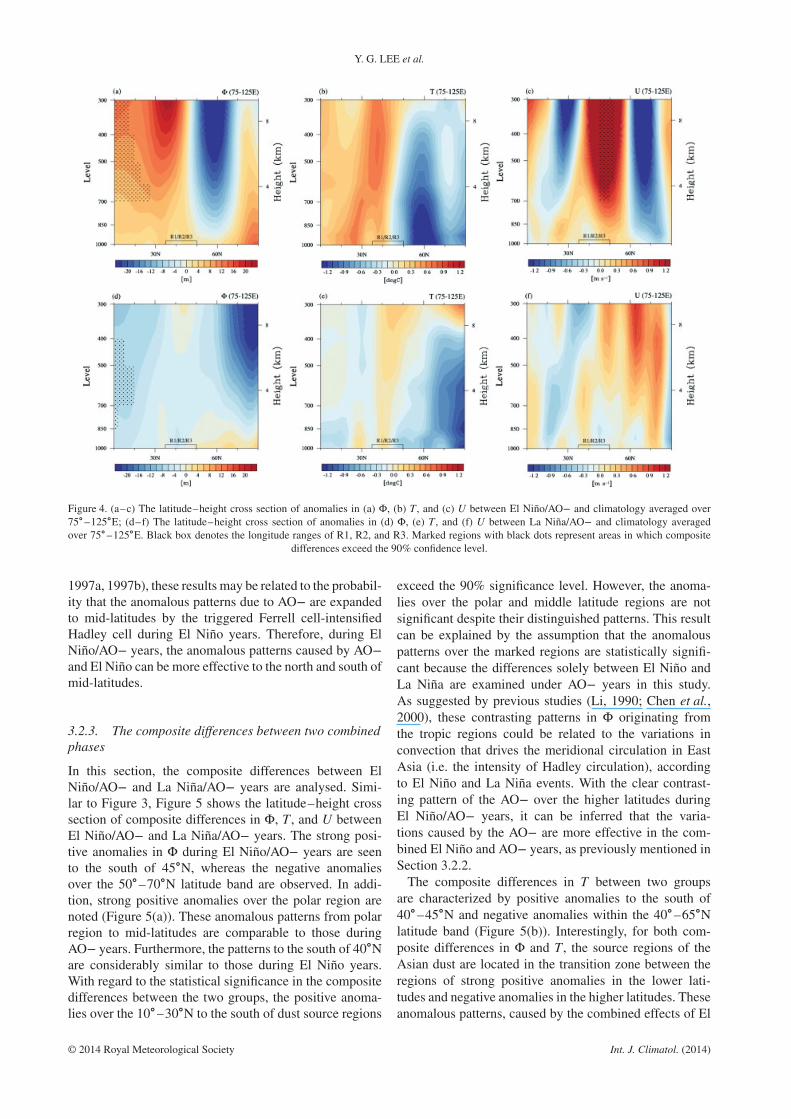
of El Niño/AO− (Figure 4(a)–(c)) and La Niña/AO−(Figure 4(d)–(f)) relative to the climatology. The strongpositive anomalies in Φ during El Niño/AO− yearsare notable to the south of 45∘N, whereas the negativeanomalies are observed over the 50∘–70∘N latitude band(Figure 4(a)). In particular, the positive anomalies fromthe upper troposphere to the lower troposphere overthe 10∘–30∘N are statistically meaningful at the 90%significant level. The anomalies in T are characterizedby positive anomalies to the south of 40∘N and negativeanomalies to the north of 45∘N (Figure 4(b)). The strongpositive anomalies in U are notable within the 40∘–60∘Nlatitude band, with a maximum above 2m s−1 between400 hPa and 200 hPa (Figure 4(c)). Conversely, negativeanomalies are observed over the adjoining latitude bandsof 60∘–75∘N and 25∘–35∘N. These anomalous patternsduring El Niño/AO− years are quite similar to those duringAO− years, while their magnitudes are lower, in particularto the north of 40∘N (Figures 3(a)–(c) and 4(a)–(c)).These results imply that the variations due to AO− areconsiderably dominant when AO− and El Niño arecoupled.On the other hand, there are no noticeable differences
between La Niña/AO− years and climatology, as shownin Figure 4(d)–(f). In the anomalies in Φ during LaNiña/AO− years, the negative anomalies to the north of60∘N and the weak negative anomalies to the south of30∘N are only observed, while the anomalous patterns tothe south of 20∘N are statistically meaningful at the 90%significant level (Figure 4(d)). The anomalies in T andU also do not appear with clear differences (Figure 4(e)and (f)). Comparing with the distinctive differences in ElNiño/AO− years, it can be inferred that the possible mech-anisms (e.g. the difference of pressure pattern betweenpolar region and mid-latitudes and the inflow of cold airfrom polar region) due to AO− are noticeably weakenedwhen AO− and La Niña are combined. Based on the possi-ble links between Hadley cell and Ferrell cell due to ENSOphases (Li, 1990; Oort and Yienger, 1996; Zhang et al.,
© 2014 Royal Meteorological Society Int. J. Climatol. (2014)
Y. G. LEE et al.
Figure 4. (a–c) The latitude–height cross section of anomalies in (a) Φ, (b) T , and (c) U between El Niño/AO− and climatology averaged over75∘ –125∘E; (d–f) The latitude–height cross section of anomalies in (d) Φ, (e) T , and (f) U between La Niña/AO− and climatology averagedover 75∘–125∘E. Black box denotes the longitude ranges of R1, R2, and R3. Marked regions with black dots represent areas in which composite
differences exceed the 90% confidence level.
1997a, 1997b), these results may be related to the probabil-ity that the anomalous patterns due to AO− are expandedto mid-latitudes by the triggered Ferrell cell-intensifiedHadley cell during El Niño years. Therefore, during ElNiño/AO− years, the anomalous patterns caused by AO−and El Niño can be more effective to the north and south ofmid-latitudes.
3.2.3. The composite differences between two combinedphases
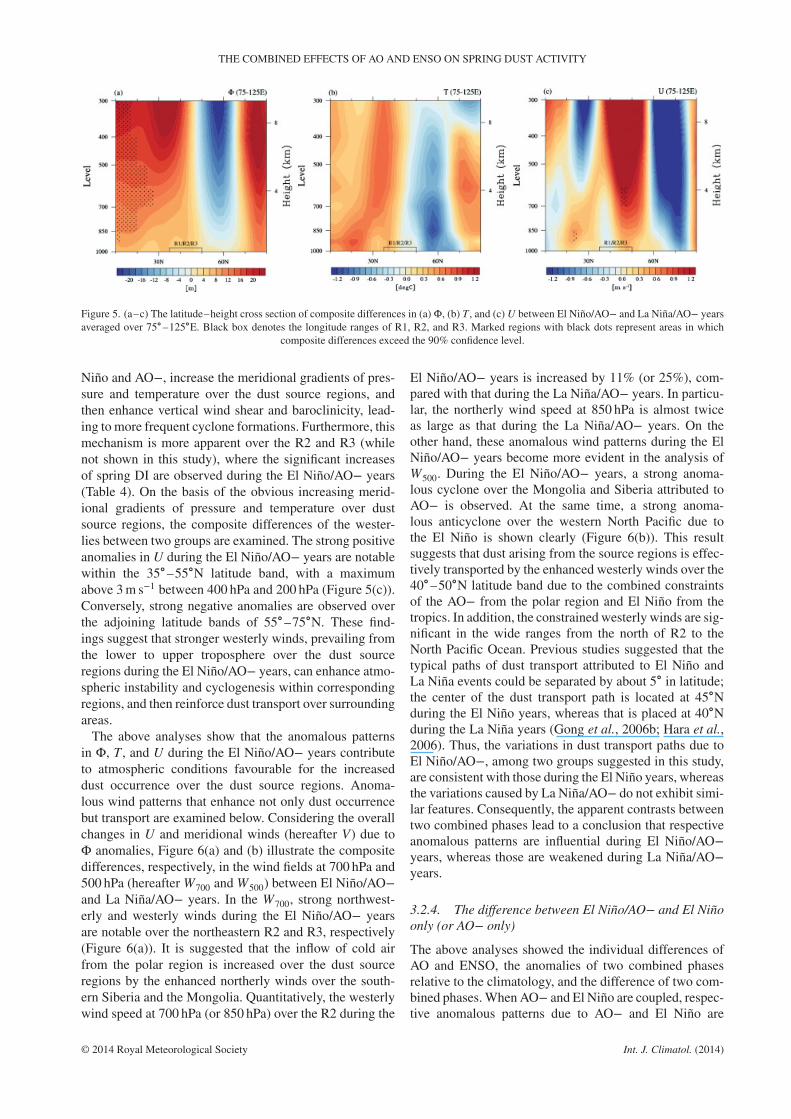
In this section, the composite differences between ElNiño/AO− and La Niña/AO− years are analysed. Simi-lar to Figure 3, Figure 5 shows the latitude–height crosssection of composite differences in Φ, T , and U betweenEl Niño/AO− and La Niña/AO− years. The strong posi-tive anomalies in Φ during El Niño/AO− years are seento the south of 45∘N, whereas the negative anomaliesover the 50∘–70∘N latitude band are observed. In addi-tion, strong positive anomalies over the polar region arenoted (Figure 5(a)). These anomalous patterns from polarregion to mid-latitudes are comparable to those duringAO− years. Furthermore, the patterns to the south of 40∘Nare considerably similar to those during El Niño years.With regard to the statistical significance in the compositedifferences between the two groups, the positive anoma-lies over the 10∘–30∘N to the south of dust source regions
exceed the 90% significance level. However, the anoma-lies over the polar and middle latitude regions are notsignificant despite their distinguished patterns. This resultcan be explained by the assumption that the anomalouspatterns over the marked regions are statistically signifi-cant because the differences solely between El Niño andLa Niña are examined under AO− years in this study.As suggested by previous studies (Li, 1990; Chen et al.,2000), these contrasting patterns in Φ originating fromthe tropic regions could be related to the variations inconvection that drives the meridional circulation in EastAsia (i.e. the intensity of Hadley circulation), accordingto El Niño and La Niña events. With the clear contrast-ing pattern of the AO− over the higher latitudes duringEl Niño/AO− years, it can be inferred that the varia-tions caused by the AO− are more effective in the com-bined El Niño and AO− years, as previously mentioned inSection 3.2.2.The composite differences in T between two groups
are characterized by positive anomalies to the south of40∘–45∘N and negative anomalies within the 40∘–65∘Nlatitude band (Figure 5(b)). Interestingly, for both com-posite differences in Φ and T , the source regions of theAsian dust are located in the transition zone between theregions of strong positive anomalies in the lower lati-tudes and negative anomalies in the higher latitudes. Theseanomalous patterns, caused by the combined effects of El
© 2014 Royal Meteorological Society Int. J. Climatol. (2014)
THE COMBINED EFFECTS OF AO AND ENSO ON SPRING DUST ACTIVITY
Figure 5. (a–c) The latitude–height cross section of composite differences in (a)Φ, (b) T , and (c) U between El Niño/AO− and La Niña/AO− yearsaveraged over 75∘ –125∘E. Black box denotes the longitude ranges of R1, R2, and R3. Marked regions with black dots represent areas in which
composite differences exceed the 90% confidence level.
Niño and AO−, increase the meridional gradients of pres-sure and temperature over the dust source regions, andthen enhance vertical wind shear and baroclinicity, lead-ing to more frequent cyclone formations. Furthermore, thismechanism is more apparent over the R2 and R3 (whilenot shown in this study), where the significant increasesof spring DI are observed during the El Niño/AO− years(Table 4). On the basis of the obvious increasing merid-ional gradients of pressure and temperature over dustsource regions, the composite differences of the wester-lies between two groups are examined. The strong positiveanomalies in U during the El Niño/AO− years are notablewithin the 35∘–55∘N latitude band, with a maximumabove 3m s−1 between 400 hPa and 200 hPa (Figure 5(c)).Conversely, strong negative anomalies are observed overthe adjoining latitude bands of 55∘–75∘N. These find-ings suggest that stronger westerly winds, prevailing fromthe lower to upper troposphere over the dust sourceregions during the El Niño/AO− years, can enhance atmo-spheric instability and cyclogenesis within correspondingregions, and then reinforce dust transport over surroundingareas.The above analyses show that the anomalous patterns
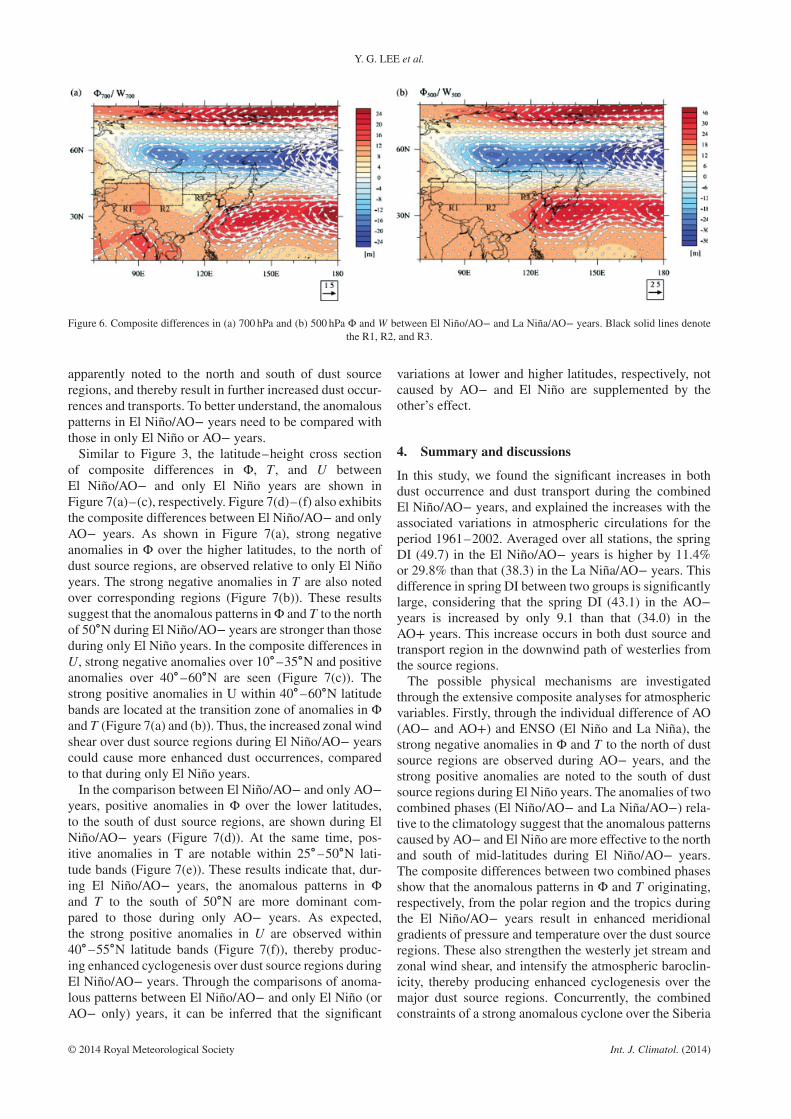
in Φ, T , and U during the El Niño/AO− years contributeto atmospheric conditions favourable for the increaseddust occurrence over the dust source regions. Anoma-lous wind patterns that enhance not only dust occurrencebut transport are examined below. Considering the overallchanges in U and meridional winds (hereafter V) due toΦ anomalies, Figure 6(a) and (b) illustrate the compositedifferences, respectively, in the wind fields at 700 hPa and500 hPa (hereafterW700 andW500) between El Niño/AO−and La Niña/AO− years. In the W700, strong northwest-erly and westerly winds during the El Niño/AO− yearsare notable over the northeastern R2 and R3, respectively(Figure 6(a)). It is suggested that the inflow of cold airfrom the polar region is increased over the dust sourceregions by the enhanced northerly winds over the south-ern Siberia and the Mongolia. Quantitatively, the westerlywind speed at 700 hPa (or 850 hPa) over the R2 during the
El Niño/AO− years is increased by 11% (or 25%), com-pared with that during the La Niña/AO− years. In particu-lar, the northerly wind speed at 850 hPa is almost twiceas large as that during the La Niña/AO− years. On theother hand, these anomalous wind patterns during the ElNiño/AO− years become more evident in the analysis ofW500. During the El Niño/AO− years, a strong anoma-lous cyclone over the Mongolia and Siberia attributed toAO− is observed. At the same time, a strong anoma-lous anticyclone over the western North Pacific due tothe El Niño is shown clearly (Figure 6(b)). This resultsuggests that dust arising from the source regions is effec-tively transported by the enhanced westerly winds over the40∘–50∘N latitude band due to the combined constraintsof the AO− from the polar region and El Niño from thetropics. In addition, the constrained westerly winds are sig-nificant in the wide ranges from the north of R2 to theNorth Pacific Ocean. Previous studies suggested that thetypical paths of dust transport attributed to El Niño andLa Niña events could be separated by about 5∘ in latitude;the center of the dust transport path is located at 45∘Nduring the El Niño years, whereas that is placed at 40∘Nduring the La Niña years (Gong et al., 2006b; Hara et al.,2006). Thus, the variations in dust transport paths due toEl Niño/AO−, among two groups suggested in this study,are consistent with those during the El Niño years, whereasthe variations caused by La Niña/AO− do not exhibit simi-lar features. Consequently, the apparent contrasts betweentwo combined phases lead to a conclusion that respectiveanomalous patterns are influential during El Niño/AO−years, whereas those are weakened during La Niña/AO−years.
3.2.4. The difference between El Niño/AO− and El Niñoonly (or AO− only)
The above analyses showed the individual differences ofAO and ENSO, the anomalies of two combined phasesrelative to the climatology, and the difference of two com-bined phases.WhenAO− and El Niño are coupled, respec-tive anomalous patterns due to AO− and El Niño are
© 2014 Royal Meteorological Society Int. J. Climatol. (2014)
Y. G. LEE et al.
Figure 6. Composite differences in (a) 700 hPa and (b) 500 hPa Φ and W between El Niño/AO− and La Niña/AO− years. Black solid lines denotethe R1, R2, and R3.
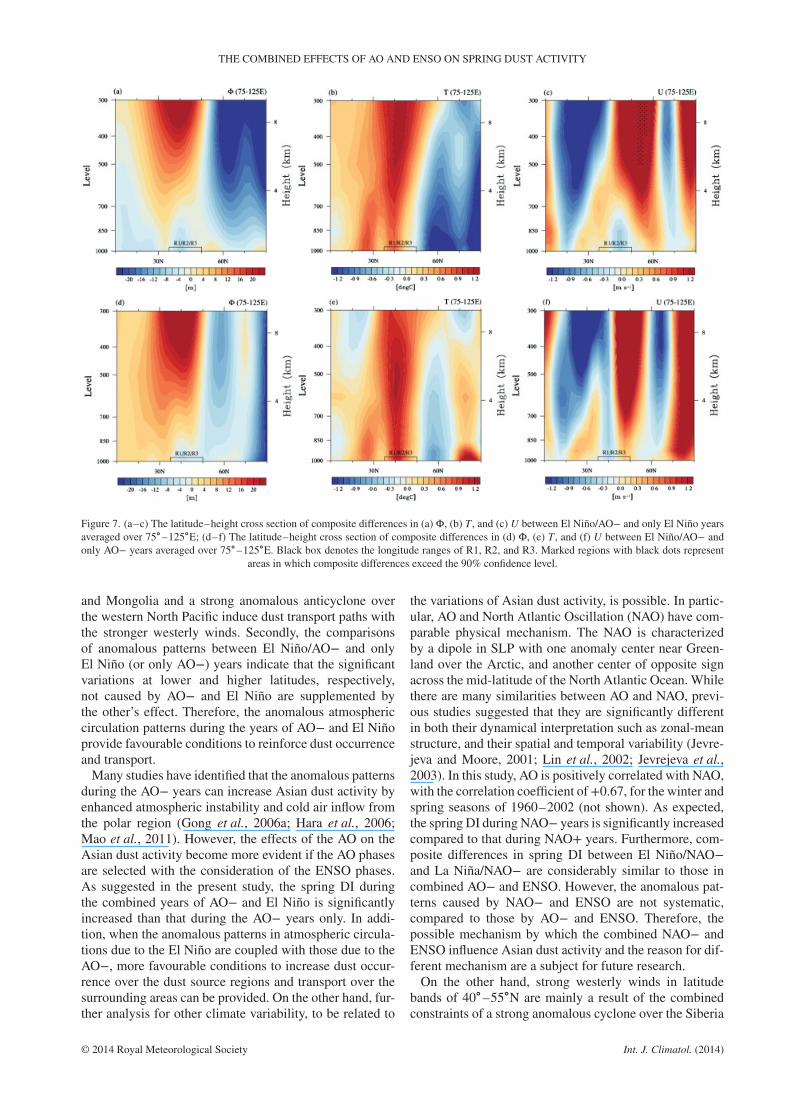
apparently noted to the north and south of dust sourceregions, and thereby result in further increased dust occur-rences and transports. To better understand, the anomalouspatterns in El Niño/AO− years need to be compared withthose in only El Niño or AO− years.Similar to Figure 3, the latitude–height cross section
of composite differences in Φ, T , and U betweenEl Niño/AO− and only El Niño years are shown inFigure 7(a)–(c), respectively. Figure 7(d)–(f) also exhibitsthe composite differences between El Niño/AO− and onlyAO− years. As shown in Figure 7(a), strong negativeanomalies in Φ over the higher latitudes, to the north ofdust source regions, are observed relative to only El Niñoyears. The strong negative anomalies in T are also notedover corresponding regions (Figure 7(b)). These resultssuggest that the anomalous patterns inΦ and T to the northof 50∘N during El Niño/AO− years are stronger than thoseduring only El Niño years. In the composite differences inU, strong negative anomalies over 10∘–35∘N and positiveanomalies over 40∘–60∘N are seen (Figure 7(c)). Thestrong positive anomalies in U within 40∘–60∘N latitudebands are located at the transition zone of anomalies in Φand T (Figure 7(a) and (b)). Thus, the increased zonal windshear over dust source regions during El Niño/AO− yearscould cause more enhanced dust occurrences, comparedto that during only El Niño years.In the comparison between El Niño/AO− and only AO−
years, positive anomalies in Φ over the lower latitudes,to the south of dust source regions, are shown during ElNiño/AO− years (Figure 7(d)). At the same time, pos-itive anomalies in T are notable within 25∘–50∘N lati-tude bands (Figure 7(e)). These results indicate that, dur-ing El Niño/AO− years, the anomalous patterns in Φand T to the south of 50∘N are more dominant com-pared to those during only AO− years. As expected,the strong positive anomalies in U are observed within40∘–55∘N latitude bands (Figure 7(f)), thereby produc-ing enhanced cyclogenesis over dust source regions duringEl Niño/AO− years. Through the comparisons of anoma-lous patterns between El Niño/AO− and only El Niño (orAO− only) years, it can be inferred that the significant
variations at lower and higher latitudes, respectively, notcaused by AO− and El Niño are supplemented by theother’s effect.
4. Summary and discussions
In this study, we found the significant increases in bothdust occurrence and dust transport during the combinedEl Niño/AO− years, and explained the increases with theassociated variations in atmospheric circulations for theperiod 1961–2002. Averaged over all stations, the springDI (49.7) in the El Niño/AO− years is higher by 11.4%or 29.8% than that (38.3) in the La Niña/AO− years. Thisdifference in spring DI between two groups is significantlylarge, considering that the spring DI (43.1) in the AO−years is increased by only 9.1 than that (34.0) in theAO+ years. This increase occurs in both dust source andtransport region in the downwind path of westerlies fromthe source regions.The possible physical mechanisms are investigated
through the extensive composite analyses for atmosphericvariables. Firstly, through the individual difference of AO(AO− and AO+) and ENSO (El Niño and La Niña), thestrong negative anomalies in Φ and T to the north of dustsource regions are observed during AO− years, and thestrong positive anomalies are noted to the south of dustsource regions during El Niño years. The anomalies of twocombined phases (El Niño/AO− and La Niña/AO−) rela-tive to the climatology suggest that the anomalous patternscaused by AO− and El Niño are more effective to the northand south of mid-latitudes during El Niño/AO− years.The composite differences between two combined phasesshow that the anomalous patterns in Φ and T originating,respectively, from the polar region and the tropics duringthe El Niño/AO− years result in enhanced meridionalgradients of pressure and temperature over the dust sourceregions. These also strengthen the westerly jet stream andzonal wind shear, and intensify the atmospheric baroclin-icity, thereby producing enhanced cyclogenesis over themajor dust source regions. Concurrently, the combinedconstraints of a strong anomalous cyclone over the Siberia
© 2014 Royal Meteorological Society Int. J. Climatol. (2014)
THE COMBINED EFFECTS OF AO AND ENSO ON SPRING DUST ACTIVITY
Figure 7. (a–c) The latitude–height cross section of composite differences in (a) Φ, (b) T , and (c) U between El Niño/AO− and only El Niño yearsaveraged over 75∘ –125∘E; (d–f) The latitude–height cross section of composite differences in (d) Φ, (e) T , and (f) U between El Niño/AO− andonly AO− years averaged over 75∘–125∘E. Black box denotes the longitude ranges of R1, R2, and R3. Marked regions with black dots represent
areas in which composite differences exceed the 90% confidence level.
and Mongolia and a strong anomalous anticyclone overthe western North Pacific induce dust transport paths withthe stronger westerly winds. Secondly, the comparisonsof anomalous patterns between El Niño/AO− and onlyEl Niño (or only AO−) years indicate that the significantvariations at lower and higher latitudes, respectively,not caused by AO− and El Niño are supplemented bythe other’s effect. Therefore, the anomalous atmosphericcirculation patterns during the years of AO− and El Niñoprovide favourable conditions to reinforce dust occurrenceand transport.Many studies have identified that the anomalous patterns
during the AO− years can increase Asian dust activity byenhanced atmospheric instability and cold air inflow fromthe polar region (Gong et al., 2006a; Hara et al., 2006;Mao et al., 2011). However, the effects of the AO on theAsian dust activity become more evident if the AO phasesare selected with the consideration of the ENSO phases.As suggested in the present study, the spring DI duringthe combined years of AO− and El Niño is significantlyincreased than that during the AO− years only. In addi-tion, when the anomalous patterns in atmospheric circula-tions due to the El Niño are coupled with those due to theAO−, more favourable conditions to increase dust occur-rence over the dust source regions and transport over thesurrounding areas can be provided. On the other hand, fur-ther analysis for other climate variability, to be related to
the variations of Asian dust activity, is possible. In partic-ular, AO and North Atlantic Oscillation (NAO) have com-parable physical mechanism. The NAO is characterizedby a dipole in SLP with one anomaly center near Green-land over the Arctic, and another center of opposite signacross the mid-latitude of the North Atlantic Ocean. Whilethere are many similarities between AO and NAO, previ-ous studies suggested that they are significantly differentin both their dynamical interpretation such as zonal-meanstructure, and their spatial and temporal variability (Jevre-jeva and Moore, 2001; Lin et al., 2002; Jevrejeva et al.,2003). In this study, AO is positively correlated with NAO,with the correlation coefficient of+0.67, for the winter andspring seasons of 1960–2002 (not shown). As expected,the spring DI during NAO− years is significantly increasedcompared to that during NAO+ years. Furthermore, com-posite differences in spring DI between El Niño/NAO−and La Niña/NAO− are considerably similar to those incombined AO− and ENSO. However, the anomalous pat-terns caused by NAO− and ENSO are not systematic,compared to those by AO− and ENSO. Therefore, thepossible mechanism by which the combined NAO− andENSO influence Asian dust activity and the reason for dif-ferent mechanism are a subject for future research.On the other hand, strong westerly winds in latitude
bands of 40∘–55∘N are mainly a result of the combinedconstraints of a strong anomalous cyclone over the Siberia
© 2014 Royal Meteorological Society Int. J. Climatol. (2014)
Y. G. LEE et al.
andMongolia and a strong anomalous anticyclone over thewestern North Pacific. The stronger westerly winds due tothe combined effects of AO− and El Niño can reinforce thetrans-Pacific outflow of dust, whose effects are of scientificimportance in terms of their global influences. Additionalstudies using long-term and global datasets from satelliteremote sensing, such as TOMS, OMI, MISR, andMODIS,would be desirable to better understand the effects of AOand ENSO on the trans-Pacific transport of dust.
Acknowledgements
This research was supported by the GEMS programof the Ministry of Environment, Korea and the EcoInnovation Program of KEITI (2012000160002). Inaddition, this research was partially supported by theNational Research Foundation of Korea (NRF) project(NRF-2012R1A1A2039649). BT, DW, JNL and OK’scontribution was carried out on behalf of the Jet Propul-sion Laboratory, California Institute of Technology, undera contract with NASA. R. Mao was supported by project‘Investigation of Climate Change Mechanism by Obser-vation and Simulation of Polar Climate for the Past andPresent (PE14010) of Korea Polar Research Institute’.
References
Aoki I, Kurosaki Y, Osada R, Sato T, Kimura F. 2005. Dust storms gen-erated by mesoscale cold fronts in the Tarim basin, northwest China.Geophys. Res. Lett. 32: L06807, DOI: 10.1029/2004GL021776.
Chang EKM. 1995. The influence of Hadley circulation intensitychanges on extratropical climate in an idealized model. J. Atmos. Sci.52: 2006–2024.
Chen W, Graf HF, Huang R. 2000. The interannual variability of EastAsian winter monsoon and its relation to the summer monsoon. Adv.Atmos. Sci. 17: 48–60.
Chun Y, Cho HK, Chung HS, Lee M. 2008. Historical records ofAsian dust events (Hwangsa) in Korea. Bull. Am. Meteorol. Soc. 89:823–827.
Ding RQ, Li JP, Wang SG, Ren FM. 2005. Decadal change of the springdust storm in northwest China and the associated atmospheric circula-tion. Geophys. Res. Lett. 32: L02808, DOI: 10.1029/2004GL021561.
Fan K, Wang H. 2004. Antarctic Oscillation and the dust weatherfrequency in North China. Geophys. Res. Lett. 31: L10201, DOI:10.1029/2004GL019465.
Gao H, Washington R. 2010. Arctic Oscillation and the interannualvariability of dust emissions from the Tarim Basin: a TOMS AI basedstudy. Clim. Dyn. 35: 511–522, DOI: 10.1007/s00382-009-0687-4.
Gao T, Su L,MaQ, Li H, Li X, Yu X. 2003. Climatic analysis on increas-ing dust storm frequency in the spring of 2000 and 2001 in InnerMongolia. Int. J. Climatol. 23: 1743–1755, DOI: 10.1002/joc970.
Gao T, Han J,WangY, Pei H, Lu S. 2012. Impacts of climate abnormalityon remarkable dust storm increase of the Hunshdak Sandy Landsin northern China during 2001–2008. Meteorol. Appl. 19: 265–278,DOI: 10.1002/met.251.
Gillette D. 1978. A wind tunnel simulation of the erosion of soil: effectof soil texture, sand-blasting, wind speed, and soil consolidation onthe dust production. Atmos. Environ. 12: 1735–1743.
Gong DY, Wang SW, Zhu JH. 2001. East Asian winter monsoon andArctic Oscillation. Geophys. Res. Lett. 28: 2073–2076.
Gong DY, Mao R, Fan YD. 2006a. East Asian dust storm and weatherdisturbance: possible links to the Arctic Oscillation. Int. J. Climatol.26: 1379–1396, DOI: 10.1002/joc.1324.
Gong SL, Zhang XY, Zhao TL, Zhang XB, Barrie LA, McKendry IG,Zhao CS. 2006b. A simulated climatology of Asian dust aerosol andits trans-Pacific transport. Part II: Interannual variability and climateconnections. J. Clim. 19: 104–122.
Gong DY, Mao R, Shi PJ, Fan YD. 2007a. Correlation between eastAsian dust storm frequency and PNA.Geophys. Res. Lett. 34: L14710,DOI: 10.1029/2007GL029944.
Gong G, Cohen J, Entekhabi D, Ge Y. 2007b. Hemispheric-scale climateresponse to northern Eurasia land surface characteristics and snowanomalies. Glob. Planet. Change 56: 359–370.
Hara Y, Uno I, Wang Z. 2006. Long-term variation of Asian dustand related climate factors. Atmos. Environ. 40: 6730–6740, DOI:10.1016/j.atmosenv.2006.05.080.
Higgins RW, Leetmaa A, Kousky VE. 2002. Relationship betweenclimate variability and winter temperature extremes in the UnitedStates. J. Clim. 15: 1555–1572.
Jeong JH, Ho CH. 2005. Changes in occurrence of cold surges over EastAsia in association with Arctic Oscillation. Geophys. Res. Lett. 32:L14704, DOI: 10.1029/2005GL023024.
Jevrejeva S,Moore JC. 2001. Singular spectrum analysis of Baltic Sea iceconditions and large-scale atmospheric patterns since 1708. Geophys.Res. Lett. 28: 4503–4507.
Jevrejeva S,Moore JC, Grinsted A. 2003. Influence of the Arctic Oscilla-tion and El Niño-Southern Oscillation (ENSO) on ice conditions in theBaltic Sea: the wavelet approach. J. Geophys. Res. 108(D21): 4677,DOI: 10.1029/2003JD003417.
Kalnay E, Kanamitsu M, Kistler R, Collins W, Deaven D, Gandin L,Iredell M, Saha S, White G, Woollen J. 1996. The NCEP/NCARreanalysis project. Bull. Am. Meteorol. Soc. 77: 437–471.
Lee EH, Sohn BJ. 2011. Recent increasing trend in dust frequency overMongolia and inner Mongolia regions and its association with climateand surface condition change. Atmos. Environ. 45: 4611–4616, DOI:10.1016/j.atmosenv.2011.05.065.
Lee YG, Ho CH, Kim J, Kim J. 2013. Potential impacts of northeasternEurasian snow cover on generation of dust storms in northwesternChina during spring. Clim. Dyn. 41: 721–733.
Li C. 1990. Interaction between anomalous winter monsoon in East Asiaand El Niño events. Adv. Atmos. Sci. 7: 36–46.
Lim JY, Chun Y. 2006. The characteristics of Asian dust events inNortheast Asia during the springtime from 1993 to 2004.Glob. Planet.Change 52: 231–247.
Lin H, Derome J, Greatbath RJ, Peterson KA, Lu J. 2002. Tropicallinks of the Arctic Oscillation.Geophys. Res. Lett. 29(20): 1943, DOI:10.1029/2002GL015822.
Liu XH, Ding RQ. 2007. The relationship between the spring Asianatmospheric circulation and the previous winter Northern Hemisphereannular mode. Theor. Appl. Climatol. 88: 71–81.
Mao R, Ho CH, Shao Y, Gong DY, Kim J. 2011. Influence of ArcticOscillation on dust activity over northeast Asia. Atmos. Environ. 45:326–337, DOI: 10.1016/j.atmosenv.2010.10.020.
Oort AH, Yienger JJ. 1996. Observed interannual variability inthe Hadley circulation and its connection to ENSO. J. Clim. 9:2751–2767.
Prospero JM, Ginoux P, Torres O, Nicholson SE, Gill TE. 2002. Envi-ronmental characterization of global sources of atmospheric soil dustidentified with the Nimbus 7 Total Ozone Mapping Spectrometer(TOMS) absorbing aerosol product. Rev. Geophys. 40: 1002, DOI:10.1029/2000RG000095.
Qian W, Quan L, Shi S. 2002. Variations of the dust storm in China andits climatic control. J. Clim. 15: 1216–1229.
Song LC, Yu YX, Sun XY, Sun GW. 2004. Relationship between ArcticOscillation and spring severe sandstorm in North China. PlateauMeteorol. 23: 835–839 (in Chinese).
Sun J, ZhangM, Liu T. 2001. Spatial and temporal characteristics of duststorms in China and its surrounding regions, 1960–1999: Relations tosource area and climate. J. Geophys. Res. 106(D10): 10325–10333,DOI: 10.1029/2000JD900665.
Thompson DWJ, Wallace JM. 1998. The Arctic Oscillation signature inthe wintertime geopotential height and temperature fields. Geophys.Res. Lett. 25: 1297–1300.
Thompson DWJ, Wallace JM. 2000. Annular modes in the extrat-ropical circulation. Part I: Month-to-month variability. J. Clim. 13:1000–1016.
Thompson DWJ, Wallace JM, Hegerl GC. 2000. Annular modes in theextratropical circulation Part II: Trends. J. Clim. 13: 1018–1036.
Tian SF, Inoue M, Du M. 2007. Influence of dust storm frequencyin northern China on fluctuations of Asian dust frequencyobserved in Japan. Sci. Online Lett. Atmos. 3: 121–124, DOI:10.2151/sola.2007-031.
Wang S, Wang J, Zhou Z, Shang K, Yang D, Zhao Z. 2003. Regionalcharacteristics of dust events in China. J. Geogr. Sci. 13: 35–44, DOI:10.1007/BF02873145.
© 2014 Royal Meteorological Society Int. J. Climatol. (2014)
THE COMBINED EFFECTS OF AO AND ENSO ON SPRING DUST ACTIVITY
Wang X, Huang J, Ji M, Higuchi K. 2008. Variability of East Asia dustevents and their long-term trend. Atmos. Environ. 42: 3156–3165.
Washington R, Todd M, Middleton NJ, Goudie AS. 2003. Dust-stormsource areas determined by the Total Ozone Monitoring Spectrometerand surface observations. Ann. Assoc. Am. Geogr. 93: 297–313.
Wettstein JJ, Mearns LO. 2002. The influence of the North AtlanticOscillation-Arctic Oscillation on mean, variance, and extremes oftemperature in the northeastern United States and Canada. J. Clim.15: 3586–3600.
Wolter K. 1987. The Southern Oscillation in surface circulationand climate over the tropical Atlantic, Eastern Pacific, and IndianOceans as captured by cluster analysis. J. Clim. Appl. Meteorol. 26:540–558.
Wolter K, Timlin MS. 1998. Measuring the strength of ENSO events:How does 1997/98 rank? Weather 53: 315–324.
Wolter K, TimlinMS. 2011. El Niño/Southern Oscillation behavior since1871 as diagnosed in an extendedmultivariate ENSO index (MEI.ext).Int. J. Climatol. 31: 1074–1087, DOI: 10.1002/joc.2336.
Zhang K, Gao H. 2007. The characteristics of Asian-dust storms dur-ing 2000–2002: from the source to the sea. Atmos. Environ. 41:9136–9145, DOI: 10.1016/j.atmosenv.2007.08.007.
Zhang L, Ren GY. 2003. Change in dust storm frequency and theclimatic controls in northern China. Acta Meteorol. Sin. 61: 744–750(in Chinese).
Zhang XY, Arimoto R, An ZS. 1997a. Dust emission from Chinesedesert sources linked to variations in atmospheric circulation. J. Geo-phys. Res. 102(D23): 28041–28047, DOI: 10.1029/97JD02300.
Zhang Y, Sperber KR, Boyle JS. 1997b. Climatology and interannualvariation of East Asian winter monsoon: result from the 1979–95NCEP/NCAR reanalysis. Mon. Weather Rev. 125: 2605–2619.
Zhang XY, Gong SL, Zhao TL, Arimoto R, Wang YQ, Zhou ZJ. 2003.Sources of Asian dust and role of climate change versus desertifi-cation in Asian dust emission. Geophys. Res. Lett. 30: 2272, DOI:10.1029/2003GL018206.
Zhang J, Peng G, Huang M, Zhang S. 2006. Are dust storm activities inNorth China related to Arctic ice-snow cover? Glob. Planet. Change52: 225–230.
Zhang B, Tsunekawa A, Tsubo M. 2008. Contributions of sandylands and stony deserts to long-distance dust emission in Chinaand Mongolia during 2000–2006. Glob. Planet. Change 60(3–4):487–504, DOI: 10.1016/j.gloplacha.2007.06.001.
Zhao C, Dabu X, Li Y. 2004. Relationship between climatic factors anddust storm frequency in Inner Mongolia of China. Geophys. Res. Lett.31: L01103, DOI: 10.1029/2003GL018351.
Zhao TL, Gong SL, Zhang XY, Blanchet JP, McKendry IG, ZhouZJ. 2006. A simulated climatology of Asian dust aerosol and itstrans-Pacific transport. Part I: Mean climate and validation. J. Clim.19: 88–103.
Zhou Z, Zhang G. 2003. Typical severe dust storms in northernChina during 1954–2002. Chin. Sci. Bull. 48: 2366–2370, DOI:10.1360/03wd0029.
Zhu C, Wang B, QianW. 2008. Why do dust storms decrease in northernChina concurrently with the recent global warming? Geophys. Res.Lett. 35: L18702, DOI: 10.1029/2008GL034886.
© 2014 Royal Meteorological Society Int. J. Climatol. (2014)
Copyright © 2022 FDOKUMEN