Salt-induced changes in the vegetative anatomy of Prosopis strombulifera (Leguminosae
Upload
independentCategory
view
1download
0
Journal of Hydrology (2006) xxx, xxx–xxx
ARTICLE IN PRESS
ava i lab le a t www.sc iencedi rec t . com
journal homepage: www.elsevier .com/ locate / jhydrol
The effects of changes in vegetative coveron river flows in the Purapel river basinof central Chile
Roberto Pizarro a, Sandra Araya a, Cristian Jordan a, Cesar Farıas a,Juan P. Flores a, Per Bj. Bro b,*
a Department of Forestry and Environmental Management, Faculty of Forest Sciences, Universidad de Talca, Talca, Chileb Department of Engineering Science, Faculty of Engineering, Universidad de Talca, Curico, Chile
Received 25 May 2005; received in revised form 4 November 2005; accepted 8 November 2005
Summary The distribution of peak river flows was studied over the period 1960–2000 in thewatershed of Purapel River (Maule Region, Chile) in order to evaluate the relationship of theseflows to vegetation cover. Maximum annual and summer flows, between decades and betweenperiods, monthly and yearly were compared with multi-temporal analysis for 1955, 1978 and1997. The evolution of peak flows over the period was irregular, and did not show significantdifferences in the majority of comparisons. The variation in vegetation cover during the studyperiod was caused by migration from native forests to commercial plantation of Pinus radiata(D. Don). The data from this watershed does not permit the conclusion that variation in peakflows is due to variation in vegetative cover. The peak flows are more highly dependant onprecipitation values. For the watershed and period of study the native forest and plantationsof P. radiata (D. Don) have a similar hydrological behavior.� 2005 Elsevier B.V. All rights reserved.
KEYWORDSPeak flows;Rainfall–runoff–vegetation relationships;Peak flows–vegetationrelationships;Water balance
0d
Introduction
Water flows registered at the exit of a watershed depend ona number of variables, such as rainfall, morphometric char-acteristics and vegetation cover (Llamas, 1993). The greaterthe amount and intensity of rainfall and the larger the area
022-1694/$ - see front matter � 2005 Elsevier B.V. All rights reservedoi:10.1016/j.jhydrol.2005.11.020
* Corresponding author. Tel.: +56 75 201717.E-mail address: [email protected] (P.B. Bro).
of the watershed, the greater the flow volumes. Vegetation,especially in the case of forests, plays an important role inregulating runoff, as it reduces dramatically surface watervolume, runoff velocity and peak discharge (Lopez, 1998).Removal of vegetative cover causes alterations of thehydrological cycle, mainly by eliminating evapotranspira-tion and redistributing and modifying the amount of rainfallthat reaches the ground, thus increasing surface runoff(Reinhart et al., 1963; Wright et al., 1990; Lavabre et al.,
.
2 R. Pizarro et al.
ARTICLE IN PRESS
1991). Substitution or elimination of vegetation cover af-fects peak flows and total flow volumes, especially duringsummer (dry season) months, since at that time peak flowsare not influenced as much by rainfall as by the existence ofwater reserves (Meunier, 1996). Deforestation of speciescharacterized by rapid growth and high water consumptionis especially critical in hydrological regime alteration (Boschand Hewlett, 1982; Huber et al., 1985; Anderson et al.,1990; Bosch and Smith, 1991).
As removing vegetation cover causes important changesin the hydrological balance of a watershed, afforestationand reforestation generate opposite effects on flows,although the magnitude of the response is highly variableand unpredictable (Hibbert, 1966). Increased forest cover,replacing pasture areas, can trigger a reduction of annualflow of up to 40% (Calder, 1992). Forest cover leads to theinterception of major amounts of rainfall (Huber and Oyar-zun, 1983; Oyarzun et al., 1985), as well as to a significantreduction of flows (Iroume and Huber, 2000), with a corre-sponding reduction of the magnitude of peak flows duringfloods (Meunier, 1996) and of peak flows during summer(Ayer, 1968; Singh, 1982). In this framework, the presentpaper analyzes the influence of changes in vegetative coveron the generation of peak flows over a period of 40 yearsfrom 1960 to 2000, in the watershed of Purapel River inthe Maule Region of Chile.
Pizarro et al., 2005, studied runoff coefficients, and theirrelation with vegetal cover and water yield in Purapel Riverbasin, as influenced by land use and the substitution of na-tives forest by Pinus radiata plantations. Results showed nodifferences throughout the 40 studied years, though runoffcoefficients tend to increase in the decade of the 80s, main-taining similar values for decades 60, 70 and 90. Variationsobserved in runoff coefficient, were concluded to be a re-sult of greater rainfall in the 80s, and were not be relatedwith the change of vegetation cover.
The establishment of a clear precipitation–runoff–vege-tative cover relationship is difficult due to the large numberof variables which affect the process as shown by the stud-ies of Cosandey et al. (cited by Cognard-Plancq et al., 2001)working in three different watersheds in the Mediterraneanregion of France. Their conclusions included that the princi-pal factor controlling runoff is not the type of vegetation,but rather whether the soil is covered or denuded of cover.In the same context, Cognard-Plancq et al. (2005), com-pared two watersheds, one with forest cutting and the otherwithout. By means of simulation, they showed that the cut-ting process could increase vegetative cover by 10% in sub-Mediterranean watersheds in France. Braud et al. (2001)studied Andean watersheds in Argentina with the ANSWERSmodel to evaluate runoff and sediment production. Theyfound that precipitation and surface geology to the principalfactors controlling these variables. Viramontes and Descroix(2003) studied the hydrological characteristics of Mexicanwatersheds. They determined that the runoff coefficientshave not varied over five decades, but other hydrologicalvariables indicated drastic land use changes, which couldbe increased in the future. Beschta et al. (2000), workingin Oregon, USA, analyzed the effect of lumbering on peakflows. They found that these operations could explain only7% of the flow variability. Similarily, Caissie et al. (2002)compared flows before and after lumbering in a Canadian
forest and found that average flows were not altered,though peak flows under extreme events were affected byforest cutting.
Study area
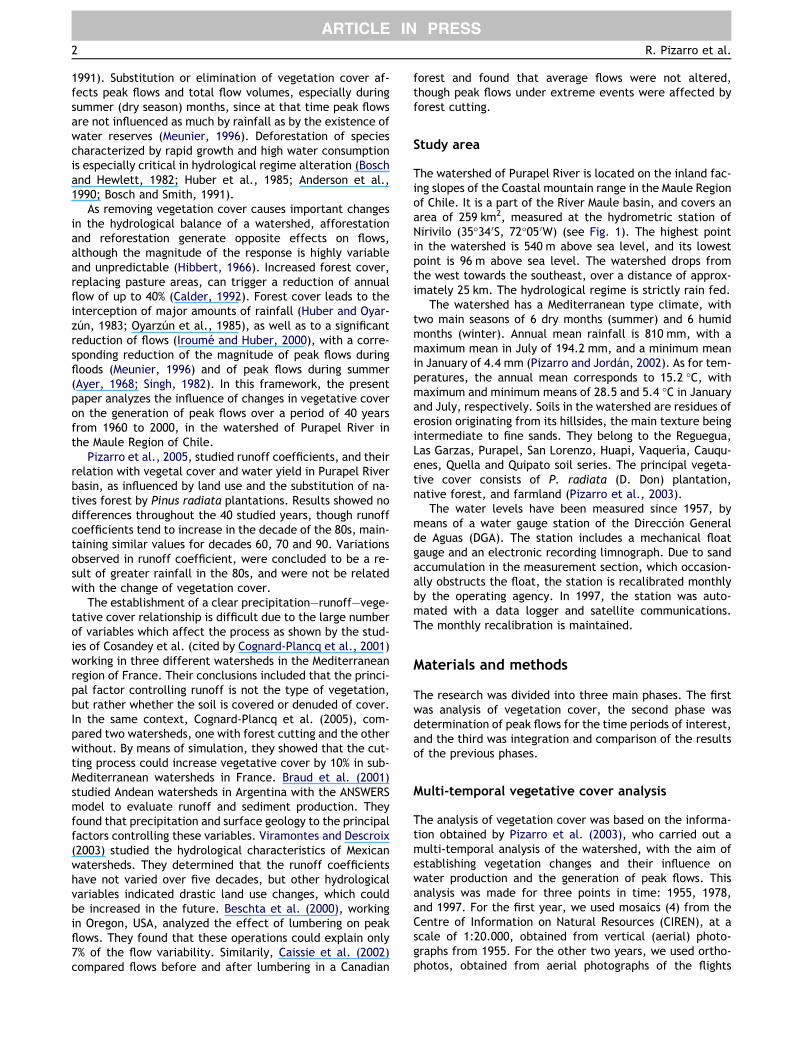
The watershed of Purapel River is located on the inland fac-ing slopes of the Coastal mountain range in the Maule Regionof Chile. It is a part of the River Maule basin, and covers anarea of 259 km2, measured at the hydrometric station ofNirivilo (35�34 0S, 72�05 0W) (see Fig. 1). The highest pointin the watershed is 540 m above sea level, and its lowestpoint is 96 m above sea level. The watershed drops fromthe west towards the southeast, over a distance of approx-imately 25 km. The hydrological regime is strictly rain fed.
The watershed has a Mediterranean type climate, withtwo main seasons of 6 dry months (summer) and 6 humidmonths (winter). Annual mean rainfall is 810 mm, with amaximum mean in July of 194.2 mm, and a minimum meanin January of 4.4 mm (Pizarro and Jordan, 2002). As for tem-peratures, the annual mean corresponds to 15.2 �C, withmaximum and minimum means of 28.5 and 5.4 �C in Januaryand July, respectively. Soils in the watershed are residues oferosion originating from its hillsides, the main texture beingintermediate to fine sands. They belong to the Reguegua,Las Garzas, Purapel, San Lorenzo, Huapi, Vaquerıa, Cauqu-enes, Quella and Quipato soil series. The principal vegeta-tive cover consists of P. radiata (D. Don) plantation,native forest, and farmland (Pizarro et al., 2003).
The water levels have been measured since 1957, bymeans of a water gauge station of the Direccion Generalde Aguas (DGA). The station includes a mechanical floatgauge and an electronic recording limnograph. Due to sandaccumulation in the measurement section, which occasion-ally obstructs the float, the station is recalibrated monthlyby the operating agency. In 1997, the station was auto-mated with a data logger and satellite communications.The monthly recalibration is maintained.
Materials and methods
The research was divided into three main phases. The firstwas analysis of vegetation cover, the second phase wasdetermination of peak flows for the time periods of interest,and the third was integration and comparison of the resultsof the previous phases.
Multi-temporal vegetative cover analysis
The analysis of vegetation cover was based on the informa-tion obtained by Pizarro et al. (2003), who carried out amulti-temporal analysis of the watershed, with the aim ofestablishing vegetation changes and their influence onwater production and the generation of peak flows. Thisanalysis was made for three points in time: 1955, 1978,and 1997. For the first year, we used mosaics (4) from theCentre of Information on Natural Resources (CIREN), at ascale of 1:20.000, obtained from vertical (aerial) photo-graphs from 1955. For the other two years, we used ortho-photos, obtained from aerial photographs of the flights
Figure 1 Location of Purapel River Basin, in Chile.
The effects of changes in vegetative cover on river flows in the Purapel river basin of central Chile 3
ARTICLE IN PRESS
Chile 60 and Geotech, respectively. Thereafter, throughphoto-interpretation techniques, the existing vegetationwas identified and classified at each point in time. Theinformation was digitized and integrated with Arc/Info 3.5GIS software.
Peak flows
Peak daily discharges (instantaneous readings) were esti-mated were estimated for the time period of 1960–2000for both monthly and annual periods. They were obtainedthrough the continuous record of water levels establishedby the limnograph of the Purapel hydrometric station atNirivilo (35�33 0S, 72�05 0W). Daily maximum instantaneousflows for monthly periods were determined on the basis ofthe reading of maximum water levels (m) in the limnograph,and the subsequent transformation into flow values (m3/s)on the basis of the discharge curves. This curve is similarto the results of Pizarro et al. (2003), who determined a ser-ies of discharge curves for this watershed, having obtainedstatistical relations between discharge and water level.The data series presented a deficit of 20 data points duringthe total period of 480 months caused by sand embankmentof the float. The data series was completed using the histor-ical means method (UNESCO, 1982) in order to preserve thecontinuity of the time series. After having determined thebasic data, peak flows were differentiated between dry sea-son flows and wet season flows: dry period extends fromNovember to March, whereas the humid period coversApril–October.
Statistical analysis
The statistical analysis of peak flows was performed withthe non-parametric Mann–Whitney U-test. Inter-decade
comparisons for months, yearly totals, maximum peak flowswere performed on a yearly basis and for the dry season.Preliminary results of the multi-temporal analysis indicatedthat the main changes in terms of vegetation cover occurredin 1978. Therefore, we also compared the same variablesbetween the following two periods: 1960–1978 and 1979–2000 (Pizarro et al., 2003) at a confidence level of 95%(a = 0.05).
The graphical analysis was made with moving averages,which were determined for the yearly total, as well as forthe humid and dry periods at the monthly level. The valueat each point on the graph corresponds to the average be-tween a value Qi, and the peak flows Q(i � 1) and Q(i + 1)
(Mendelhall and Reinmuth, 1981; Mason and Lind, 1995).In addition, peak flows were adjusted to the Gumbel, Good-rich and Pearson III probability distribution functions(PDF’s), to determine probabilities of peak flows, at yearlyand monthly levels, for return periods of 10, 20, 30 and 40years. The analysis was performed on yearly and monthlyflows over the period 1960–1980. This base period was thenextended by 10 years to cover 1960–1990, and then by 20years to cover 1960–2000. Each extension results in an in-crease in the number of data points, which allows us to ana-lyze whether the incorporation of additional informationcauses any change in the estimation of peak flow. Such achange would indicate that one could argue that pine plan-tation in the watershed influences the production of peakflows.
Each function was adjusted to the above mentioned peri-ods, and peak flows were estimated for return periods of 10,20, 30 and 40 years. The selection of the PDF was made onthe basis of the Kolmogorov–Smirnov goodness-of-fit testand the determination coefficient R2. The months for whichthe adjustment was rejected were those for which the K–Stest was rejected, and in addition for which the value of R2
was lower than 0.9.

4 R. Pizarro et al.
ARTICLE IN PRESS
Results and discussion
Variation of vegetation cover in the watershed ofPurapel river
The main results of the multi-temporal analysis of vegeta-tive cover appear in Table 1 and Figs. 2 and 3. These showimportant changes in vegetation cover, which affected thewatershed during the period of interest. These correspondto a very significant removal of native forest, mainly ofthe sclerophyllous type as well as Nothofagus obliqua(Mirb.) Oerst (roble) and Nothofagus glauca (Phil.) Krasser(hualo) which decreased from 63.2% of the area in 1955 to19.2% in 1997. The native species were replaced by planta-tions of almost exclusively P. radiata (D. Don), which wereabsent in 1955 and reached 51.7% of the area in 1997. Thissurface had been previously occupied by native forest(43.5%), open and semidense shrub (6%) and grassland(2%). The year 1978 corresponds to an inflection point interms of vegetation changes; from that year on there is a
Table 1 Vegetation cover in variation in Purapel RiverBasin, 1960–2000
Classification Area (ha)
1955 1978 1997
Native forest 16,737.9 13,698.8 5214.6Pinus radiata 0.0 5115.5 13,677.9Meadows 2486.4 1926.3 984.7Open shrubs 2885.4 1708.9 942.3Semidense shrubs 2557.9 2081.0 2172.2Dense shrubs 317.3 826.2 1047.0Agricultural land use 1464.9 1092.3 2393.4Villages and towns 16.8 17.5 34.4
Total 26,466.5 26,466.5 26,466.5
Figure 2 Vegetation cover in Purapel River Basin, 1955.
significant increase in areas of P. radiata plantations, anda corresponding decrease of other plant formations.
Peak flows
The effect of precipitation on annual flow rates is illustratedin Fig. 4. The increase in annual precipitation during the dec-ade of the 80’s is accompanied by a similar increase in flowsdischarge. A Mann–Whitney test comparing the wet and dryseasons, as well as annual values, during the period 1961–1978 with the period 1979–2000 does not show significantdifferences (0.05 level) between the two periods. TheMann–Whitney U-test applied to the average maximum an-nual flow indicates significant differences only between thedecades 1960–1980 and 1970–1980. The yearly maximuminstantaneous flow and the dry season maximum instanta-neous flow show no significant differences between decades.The fact that the summer (dry season) flows do not show sig-nificant differences between decades is a relevant point,since the summer flows are not affected by precipitation,
Figure 3 Vegetation cover in Purapel River Basin, 1997.
Figure 4 Time series of annual precipitation and streamflow.

Figure 5 (a) Peak flows monthly average, for each year (m3/s) and (b) rainfall (mm), for to the period 1960–2000.
Table 2 Maximum and minimum peak flows per decade andperiod (m3/s)
Decade/period
Dry (Oct–Mar) Wet (Apr–Sep)
Maximum Minimum Maximum Minimum
60 5.8(Dec 66)
0.01(Feb 62)
163.9(Aug 65)
0.01(Apr 63)
70 7.9(Nov 73)
0.01(Dec 73)
192.5(Jul 74)
0.01(Apr 72)
80 69.2(Nov 86)
0.01(Mar 84)
225.4(Jul 84)
0.01(Apr 88)
90 20.2(Mar 90)
0.01(Jan 96)
265.1(Jun 92)
0.01(Apr 88)
The effects of changes in vegetative cover on river flows in the Purapel river basin of central Chile 5
ARTICLE IN PRESS
but instead are generated from soil moisture and aquifer re-serves. Both these factors are affected by the vegetativecover, so that changes in vegetation should be reflected insummer flow rates, which is not the case in this watershed.
Peak yearly flows did not present any clear tendency dur-ing the period. Fig. 5a shows a large number of values belowthe mean at the beginning of the period and larger volumesat the end. The increase in peak flows during that periodcould be mainly due to higher than normal rainfall amountsin the watershed, as can be noted in Fig. 5b. Considering810 mm as the mean annual rainfall for the watershed (Pi-zarro et al., 2003), the decade of the 80’s witnessed onaverage, rainfall amounts superior to the normal average,which has a direct influence in the runoff generation.
By analyzing the results for the comparisons of the peakflows on the annual average level, there are differences forthe comparisons done between the decades of the 60’s–80’s and the 70’s–80’s, which are noted by observingFig. 5a. The former confirms the importance of the amountsof precipitation in the generation of peak flows. These re-sults coincide with those obtained by Pizarro and Jordan(2002), who studied the runoff coefficient for the river ba-sin, noting differences between peak flows of the 80’s andother decades.
According to the test for the maximum annual peakflows, there are no significant differences in any of the com-parisons. It is the same in the case of the maximum summerpeak flows, which also did not display significant differencesin their values when doing the comparisons between dec-ades. This indicates that the peak flows every year have re-mained steady for the period 1960–2000. The behavior ofthe peak monthly flows for both dry and wet season is quite
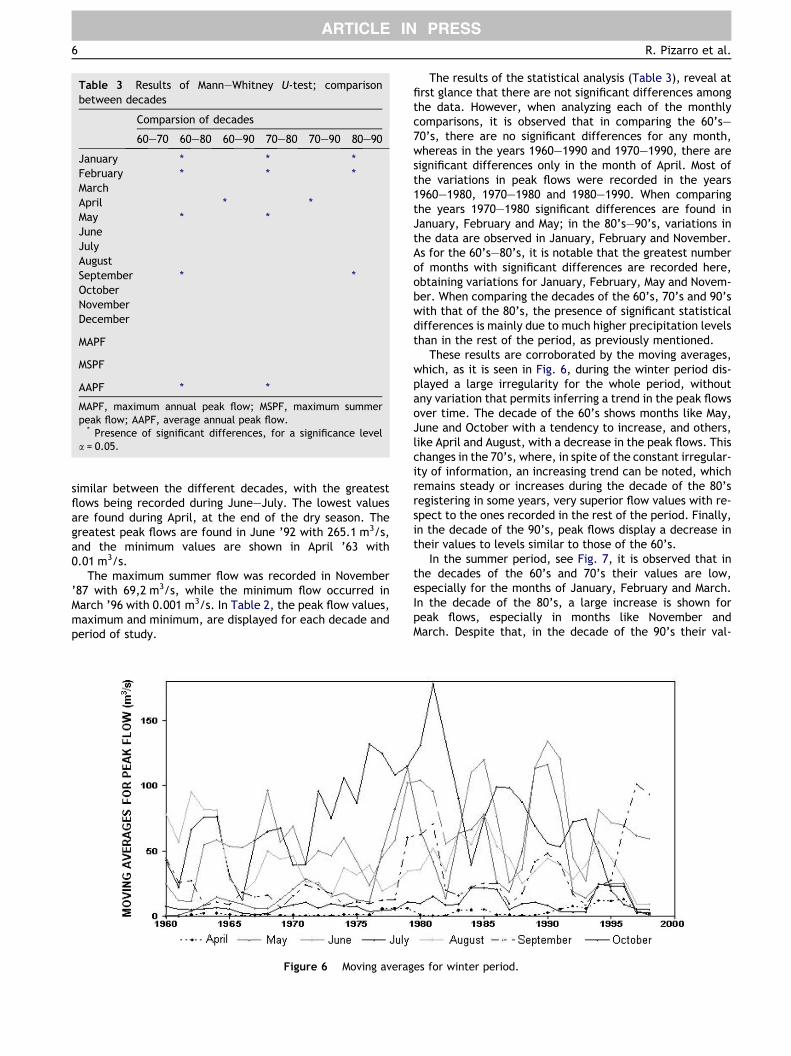
Table 3 Results of Mann–Whitney U-test; comparisonbetween decades
Comparsion of decades
60–70 60–80 60–90 70–80 70–90 80–90
January * * *February * * *MarchApril * *May * *JuneJulyAugustSeptember * *OctoberNovemberDecember
MAPF
MSPF
AAPF * *
MAPF, maximum annual peak flow; MSPF, maximum summerpeak flow; AAPF, average annual peak flow.
* Presence of significant differences, for a significance levela = 0.05.
6 R. Pizarro et al.
ARTICLE IN PRESS
similar between the different decades, with the greatestflows being recorded during June–July. The lowest valuesare found during April, at the end of the dry season. Thegreatest peak flows are found in June ’92 with 265.1 m3/s,and the minimum values are shown in April ’63 with0.01 m3/s.
The maximum summer flow was recorded in November’87 with 69,2 m3/s, while the minimum flow occurred inMarch ’96 with 0.001 m3/s. In Table 2, the peak flow values,maximum and minimum, are displayed for each decade andperiod of study.
Figure 6 Moving averag
The results of the statistical analysis (Table 3), reveal atfirst glance that there are not significant differences amongthe data. However, when analyzing each of the monthlycomparisons, it is observed that in comparing the 60’s–70’s, there are no significant differences for any month,whereas in the years 1960–1990 and 1970–1990, there aresignificant differences only in the month of April. Most ofthe variations in peak flows were recorded in the years1960–1980, 1970–1980 and 1980–1990. When comparingthe years 1970–1980 significant differences are found inJanuary, February and May; in the 80’s–90’s, variations inthe data are observed in January, February and November.As for the 60’s–80’s, it is notable that the greatest numberof months with significant differences are recorded here,obtaining variations for January, February, May and Novem-ber. When comparing the decades of the 60’s, 70’s and 90’swith that of the 80’s, the presence of significant statisticaldifferences is mainly due to much higher precipitation levelsthan in the rest of the period, as previously mentioned.
These results are corroborated by the moving averages,which, as it is seen in Fig. 6, during the winter period dis-played a large irregularity for the whole period, withoutany variation that permits inferring a trend in the peak flowsover time. The decade of the 60’s shows months like May,June and October with a tendency to increase, and others,like April and August, with a decrease in the peak flows. Thischanges in the 70’s, where, in spite of the constant irregular-ity of information, an increasing trend can be noted, whichremains steady or increases during the decade of the 80’sregistering in some years, very superior flow values with re-spect to the ones recorded in the rest of the period. Finally,in the decade of the 90’s, peak flows display a decrease intheir values to levels similar to those of the 60’s.
In the summer period, see Fig. 7, it is observed that inthe decades of the 60’s and 70’s their values are low,especially for the months of January, February and March.In the decade of the 80’s, a large increase is shown forpeak flows, especially in months like November andMarch. Despite that, in the decade of the 90’s their val-
es for winter period.

Figure 7 Moving averages for summer period.
Table 4 Results of Mann–Whitney U-test, comparison between periods
Jan Feb Mar Apr May Jun Jul Aug Sep Oct Nov Dec MQA AQA
60/78 v/s 79/00 * * * * *
MQA, maximum flow annual; AQA, average flow annual.* Presence of significant differences, for a significance level a = 0.05.
Table 5 Kolmogorov–Smirnov test and R2
Gumbel Goodrich Pearson III
K–S * * *R2 0.99 0.99 0.99
Table 6 Variance of maximum annual peak flows, with respect
Return period T (years) Lapso 60–80 (m3/s) Lap
Gu Go Pe Gu
10 1 1 * 1.220 1 1 * 1.230 1 1 * 1.240 1 1 * 1.2
Table 7 Variation of maximum peak flows for January, with res
Return period T (years) Lapso 60–80 (m3/s) Lap
Gu Go Pe Gu
10 1 1 * 1.320 1 1 * 1.330 1 1 * 1.340 1 1 * 1.3
The effects of changes in vegetative cover on river flows in the Purapel river basin of central Chile 7
ARTICLE IN PRESS
ues decrease to levels similar to those at the beginning ofthe analyzed period.
With respect to the comparisons made during the periods1960–1978 and 1979–2000, the following can be noted: on amonthly scale, as is observed in Table 4, there are signifi-cant differences only for the months of January, April,May, September and December. These differences reveal
to reference period, 1960–1980
so 60–90 (m3/s) Lapso 60–2000 (m3/s)
Go Pe Gu Go Pe
4 1.27 1 1.29 1.33 1.025 1.30 1 1.31 1.39 1.035 1.33 1 1.31 1.42 1.046 1.34 1 1.32 1.44 1.04
pect to reference period, 1960–1980
so 60–90 (m3/s) Lapso 60–2000 (m3/s)
Go Pe Gu Go Pe
7 1.45 1 1.30 1.45 0.954 1.34 1 1.27 1.3 0.954 1.29 1 1.26 1.23 0.943 1.25 1 1.25 1.19 0.95

Table 8 Variation of maximum peak flows for July, with respect to reference period, 1960–1980
Return period T (years) Lapse 60–80 (m3/s) Lapse 60–90 (m3/s) Lapse 60–2000 (m3/s)
Gu Go Pe Gu Go Pe Gu Go Pe
10 1 1 1 1.1 1.11 1.40 1.01 1.03 1.2420 1 1 1 1.09 1.11 1.40 1.01 1.04 1.2130 1 1 1 1.09 1.11 1.40 1.01 1.05 1.2040 1 1 1 1.08 1.10 1.40 1.01 1.05 1.20
8 R. Pizarro et al.
ARTICLE IN PRESS
that the period of 1979–2000 registered greater flows thanthe period 1960–1978, which indicates that the increase inplantations of P. radiata (D. Don) have not generated a de-crease in peak flows but, on the contrary, for the monthswhen there are differences, these result from increasesrather than from decreases. On the other hand, and froman annual perspective, the results do not display significantdifferences in any of the three comparisons done. Thiswould be the result of specific and individual monthly vari-ations, given that, in most of the analyzed cases there areno differences, and they would most probably be the prod-uct of the precipitation occurring in the 80’s.
Probability distribution functions
With respect to the adjustment of the peak flow data toprobability distribution functions, Table 5 shows the resultsof the goodness-of-fit test on a yearly scale for the Gumbel,Goodrich and Pearson III distributions. Here, a very good fitachieved at the annual level is observed, however, not at amonthly level. For none of the functions used, were satis-factory fits achieved for most of the months. Thus, theGumbel function obtained a good fit for the months of Jan-uary, February, June, July, August and December; theGoodrich function for the months of January, February,June, July and August. And finally, for the Pearson III func-tion a good fit was obtained for the months of January,June, July, August and December.
The estimates of peak flows done for different periods ofreturn at the annual level are shown in Table 6. These re-sults indicate that peak flows increase their volumes whenincorporating the decades of the 80’s and subsequently,the decade of the 90’s, which confirms an increase in peakflows over time, and for different periods of return. For theGumbel and Goodrich functions, peak flows increased be-tween 24% and 34% during the 60’s–90’s, while during theperiod 1960–2000, they increased between 29% and 44%.The Pearson III function shows a poor fit for the base period,displaying increases between 2% and 4%, considering as abase the period 60’s–90’s. From the former, it is noted thatwith the incorporation of the decade of the 80’s, the prob-ability of finding higher flows increases notoriously. Withthe decade of the 90’s, increases are also shown, but of aminor magnitude.
The results of differencing monthly values demonstratethat peak flow behaviors are not equal for the different ana-lyzed months. For example, Tables 7 and 8 show the resultsobtained for January and July, the driest and the rainiestmonths, respectively. These indicate that during the periodof the 60’s–90’s an increase with respect to the base periodof the 60’s–80’s is produced; however, during the following
period of 1960–2000, their values decrease a little in rela-tion to the period of the 60’s–90’s. In contrast, in July asustained increase was produced as long as the decades ofthe 80’s and 90’s were added, with a similar behavior tothat which was observed in the annual average peak flows.August was the only month where there was a decrease ofthe differentials for the period 1960–1990 and even moreso during the period 1960–2000. For the months of Februaryand December in which the period 1960–1980 displayed apoor fit and the period 1960–1990 was taken as a base,the results were also different, since while February dis-played a decrease in the percentages for the period 1960–2000, in December the proportions of the period 1960–2000 increased slightly.
Multi-temporal analysis and peak flows
According to the results obtained from the multi-temporalanalysis, no significant land use changes from agriculturaluses to forestry can be observed. This hypothetical changein the vegetation cover would reduce the volumes of peakflows. The main changes in vegetation were from nativemulti species forests to homogeneous plantations of P. rad-iata (D. Don). According to the results obtained, the hydro-logic behavior for both covers is similar, as indicated byMann–Whitney U-tests and moving averages.
The evolution of peak flows can be attributed mainly toprecipitation as opposed to the change of vegetative cover-ing, since during the decade of the 80’s the amount andintensity of precipitation at a monthly and annual level in-creased, which produced an increase in peak flows duringthe latter part of the study period. The increases in peakflows, even when they are produced in the period of P. rad-iata (D. Don) cover, are not statistically significant.
Conclusions
According to the investigation done, it is possible to con-clude the following:
At a monthly level, the highest peak flow was registeredin Jun 91/92 with 265.1 m3/s, in contrast with the lowestpeak flow which was 0.001 m3/s, registered in January andMarch of the years 95/96, and in April of the years 62/63.
Statistically, according to the Mann–Whitney U-test andthe moving averages, there are no significant differences ata monthly level among the decades in study, except forsome comparisons of the decade of the 80’s with the rest.These differences are due to the high amounts of precipita-tion registered in this decade, which is corroborated by themoving averages.
The effects of changes in vegetative cover on river flows in the Purapel river basin of central Chile 9
ARTICLE IN PRESS
Comparing the period 1960–1978 and the period 1979–2000, it is noted that according to the Mann–Whitney U-testand the moving averages, no significant differences existbetween both periods at the annual level, and differencesare only noted for some months.
The adjustment of the Gumbel, Goodrich and Pearson IIIdistributions demonstrates that by first incorporating theseries of data for the decade of the 80’s and then of the90’s the probability of finding higher values of peak flows in-creases. This indicates that the presence of the forests P.radiata (D. Don) would not be causing a decrease of peakflows in the year or in the summer months, but rather thisincrease would be due to the higher precipitation and inten-sities that occurred in the decade of the 80’s.
Finally, it is not possible to conclude that P. radiata (D.Don) forests in Purapel river basin have generated a de-crease of annual and monthly peak flows, and more likely,the results tend to conclude that there are not significantdifferences in the hydrological behavior of the Maule nativeforest and the plantations of P. radiata (D. Don).
References
Anderson, A., Pyatt, D., Stannard, J., 1990. The effects ofclearfelling a Sitka spruce stand on the water balance of a peatygrey soil at Kershope Forest. Cumbria Forestry 63 (1), 51–71.
Ayer, G., 1968. Reforestation with conifers; its effects on stream-flow in Central New York. Water Resources Bulletin 4 (2), 13.
Beschta, R.L., Pyles, M.R., Skaugset, A.E., Surfleet, C.G., 2000.Peakflow responses to forest practices in the western cascadesof Oregon, USA. Journal of Hydrology 233, 102–120.
Bosch, J., Hewlett, J., 1982. A review of catchment experiments todetermine the effect of vegetation changes on water yield andevapotranspiration. Journal of Hydrology 55 (1), 3–23.
Bosch, J., Smith, R., 1991. The effect of afforestation of indigenousscrub forest with Eucalyptus on streamflow from a smallcatchment in the Transvaal, South Africa. Forestry Abstracts50 (11), 727.
Braud, I., Vich, A.I.J., Zuluaga, J., Fornero, L., Pedrani, A., 2001.Vegetation influence on runoff and sediment yield in the Andesregion: observation and modelling. Journal of Hydrology 254,124–144.
Calder, I., 1992. Hydrologic effects of land-use change. In:Maindment, D. (Ed.), Handbook of Hydrology. Mc Graw- Hill,Estados Unidos, p. i.
Caissie, D., Jolicoeur, S., Bouchard, M., Poncet, E., 2002. Compar-ison of streamflow between pre- and post-timber harvesting inCatamaran Brook (Canada). Journal of Hydrology 258 (2002),232–248.
Cognard-Plancq, A.-L., Marc, V., Ddon-Lescot, J.-F, Normand, M.,2001. The role of forest cover on streamflow down sub-Mediterranean mountain watersheds: a modelling approach.Journal of Hydrology 254 (2001), 229–243.
Hibbert, A., 1966. Forest treatment effects on water yield. In:Proceedings of a national science foundation advanced scienceseminar, International symposium on forest hydrology. Perg-amon Press, Estados Unidos, pp. 527–543.
Huber, A., Oyarzun, C., 1983. Precipitacion neta e intercepcion enun bosque adulto de Pinus radiata (D.Don). Revista Bosque 1 (5),13–20.
Huber, A., Oyarzun, C., Ellies, A., 1985. Water balance in tree Pinusradiata stands and in a meadow. II: Soil water content andevapotranspiration. Bosque 6, 74–82.
Iroume, A., Huber, A., 2000. Intercepcion de las lluvias por cubiertade bosques y efecto en los caudales de crecida en una cuencaexperimental en Malalcahuello, IX Region, Chile. Revista Bosque21 (1), 45–56.
Lavabre, I., Sempere-Torres, D., Cernesson, F., 1991. Etude ducomportement hydrologique d’un petit bassin versant mediter-raneen apres la destruction de I’ecosysteme forestier par unincendie. Journal de Hidrologie Continentale 6 (2), 121–132,France.
Llamas, J. 1993. Hidrologıa General, Principios y Aplicaciones.Servicio Editorial Universidad del Paıs Vasco, Espana, pp. 635.
Lopez, F., 1998. Restauracion Hidrologico Forestal y Control de laErosion. Ingenierıa Ambiental. Tragsa, Tragsatec, Ministerio delMedio Ambiente. Ediciones Mundiprensa, Madrid, Espana, pp.851.
Mason, R., Lind, D.A., 1995. Estadıstica para administracion yEconomıa. Editorial Alfaomega, Mexico, DF, pp. 520.
Mendelhall, W., Reinmuth, J., 1981. Estadıstica para administraciony economıa. Grupo Editorial Iberoamericana. Tercera Edicion,Mexico DF, Mexico, pp. 707.
Meunier, M., 1996. La cubierta forestal y las crecidas en laspequenas cuencas de montana. Revista Unasylva 47 (185), 29–37.
Oyarzun, C., Huber, A., VaSquezo, S., 1985. Balance hıdrico en tresplantaciones de Pinus radiata. I: Redistribucion de las precip-itaciones. Revista Bosque 1 (6), 3–14.
Pizarro, R., Jordan, C., 2002. Analisis de los coeficientes deescorrentıa para la cuenca del rıo Purapel, estacion Nirivilo,periodo 1962–1990. Primer Congreso Chileno de CienciasForestales, Universidad de Chile, Santiago, Chile.
Pizarro, R., Santibanez, F., Benıtez, A., Mena, C., Jordan, C.,Farıas, C., 2003. Informe Final Proyecto Fondecyt No. 1010590,‘‘Analisis de la influencia de los bosques de Pinus radiata (D.Don)en la produccion de agua y regimen hıdrico: rıo Purapel, VIIRegion’’. Talca, Chile. pp. 20.
Pizarro, R., Benitez, A., Farias, C., Jordan, C., Santibanez, F.,2005. Influencia de las masas boscosas en la produccion de augade una cuenca subhumeda, Chile, Ingenierıa Hidraulica enMexico, 10(3)7–20.
Reinhart, K., Eschner, A., Trimble, G., 1963. Effects on streamflowof four forests practices in the mountains of West Virginia, US.Forest Service Research Paper, NE-1, Washington, USA, pp. 79.
Singh, V. (Ed.), 1982. Applied modeling in catchment hydrology.Water Resources Publication, Colorado, USA, pp. 563.
UNESCO, 1982. Guıa metodologica para la elaboracion del balancehıdrico de America del Sur. Oficina Regional y Tecnologica de laUNESCO para America Latina y el Caribe, Uruguay, pp. 130.
Viramontes, D., Descroix, L., 2003. Changes in the surface waterhydrologic characteristics of an endoreic basin of northernMexico from 1970 to 1998. Hydrological Processes 17, 1291–1306.
Wright, K., Sendeck, K., Rice, R., Thomas, R., 1990. Logging effectson streamflow: storm runoff at Caspar Creek in NorthwesternCalifornia. Water Resources Research 26 (7), 1657–1667.
Copyright © 2022 FDOKUMEN