How to Govern Open Data ? The politics of open data portals.
Upload
independentCategory
view
1download
0
ECOHYDROLOGYEcohydrol. (2012)Published online in Wiley Online Library(wileyonlinelibrary.com) DOI: 10.1002/eco.1354
How hydromorphological constraints and regulated flowsgovern macroinvertebrate communities along an entire
lowland river?
S. Guareschi,1,3 A. Laini,1,2* E. Racchetti,1 T. Bo,4 S. Fenoglio4 and M. Bartoli11 Department of Life Sciences, University of Parma, Parma, Italy
2 Institute of Agricultural and Environmental Chemistry, ‘Sacro Cuore’ Catholic University, Piacenza, Italy3 Department of Ecology and Hydrology, University of Murcia, Murcia, Spain
4 Department of Science and Technological Innovation, University of Piemonte Orientale, Alessandria, Italy
*CUnE-m
Co
ABSTRACT
Macroinvertebrates’ response to hydromorphological alterations and regulated flows along lowland rivers is still poorly knowndespite ecohydrology’s fundamental role in river science. Along the Oglio River (Northern Italy), several water abstractions anddams break it into segments with varying hydraulic and morphological properties. Three types of a priori different environmentswere identified (dammed, downstream and free flowing sections), and macroinvertebrate communities were sampled from eachzone. This study aimed (i) to investigate patterns of macroinvertebrate communities along a regulated lowland river by testing thea priori zones; (ii) to find macroinvertebrate taxa that served as indicators of the various hydrological conditions and (iii) to verifyhydromorphological control over ecological macroinvertebrate traits resulting in different trait values in each identified zone.Macroinvertebrate community was characterized in a total of 63 stations by means of two quantitative approaches, eachexploring a surface of 0.5m2. The lowest richness values were found in dammed sites that tended toward lentic conditions.Ecnomidae (dammed zones), Limoniidae (downstream zones) and Heptageniidae (free flowing section) were identified as thebest indicators of varying hydrological conditions. As suggested by the results of 4th Corner Method, environmental constraintsdefine communities with different ecological traits. These results highlight hydromorphological control over macroinvertebratecommunity structure and reflect how regulated flows affect the Oglio River in terms of biodiversity, indicator taxa and ecologicaltraits. The authors wish to stress the importance of considering the ecological effects of dams and impoundments on riversystems in upstream areas as well as downstream. Copyright © 2012 John Wiley & Sons, Ltd.
KEY WORDS regulated river; lowland river; macroinvertebrate community; ecological traits; indicator taxa; hydromorphologicalconstraints
Received 11 June 2012; Revised 13 August 2012; Accepted 7 November 2012
INTRODUCTION
Rivers and streams are among the most vulnerable andsimultaneously exploited ecological systems on our planet(Allan and Castillo, 2007). Humans have broadly alteredriver systems’ hydrology through impoundments anddiversions to meet their water, energy and transport needs.In particular, dam construction has increased exponentiallyin recent decades, especially during the period 1960–1990(Rosenberg et al., 2000). Rivers and streams are shaped bytheir hydrology, which sets bottom features, the timing offlooding, transport of solids and dissolved materials,metabolic rates and biological communities (Allan andCastillo, 2007). Any alterations in hydrology, such as thoseresulting from dams, have consequences for a number oflotic ecosystem properties. This latter issue seems obvious,but the implications of hydrological regime, river continu-ity and morphological conditions (together termed hydro-morphology) for river and stream management were
orrespondence to: Alex Laini, Department of Environmental Sciences,iversity of Parma, Viale G.P. Usberti, 33/A 43124 Parma, Italy.ail: [email protected]
pyright © 2012 John Wiley & Sons, Ltd.
scarcely considered for a long time. Currently, there is aneed to understand the ecological effects of a wide range ofchanges in physical habitat, as rivers are increasinglyexploited, regulated or otherwise modified through flood-defence engineering, impoundments, restoration, climatechange and the spread of alien species (Vaughan et al.,2009). The need for studies linking hydromorphology andecological response is a priority for river research andmanagement that requires clearly stated hypotheses andadequate sampling programmes that are able to developrobust flow alteration–ecological response relationship(Vaughan et al., 2009; Poff and Zimmerman, 2010).
Hydromorphological elements and their assessment in loticecosystems were introduced recently in European legislation,with theWater FrameworkDirective (EuropeanCommission,2000) as a supporting tool for the comprehension ofbiological and chemical features. Unaltered hydromorphol-ogy is generally coupled with an elevated ecological statusand vice versa (European Commission, 2000).
Dam construction leads to a variety of demonstrated effectsin stream hydraulics and properties, such as the alteration ofsediment transport (Ward and Stanford, 1983, 1987; Syvitskiet al., 2005), inundation of terrestrial systems (Nilsson and
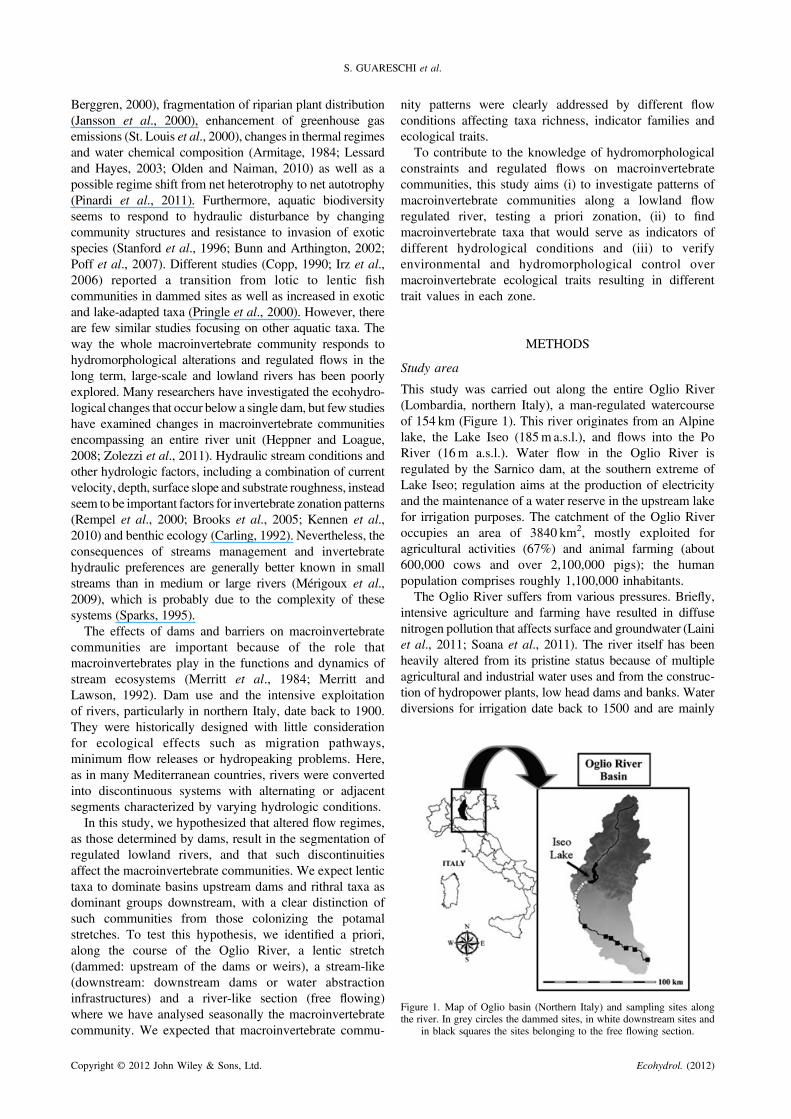
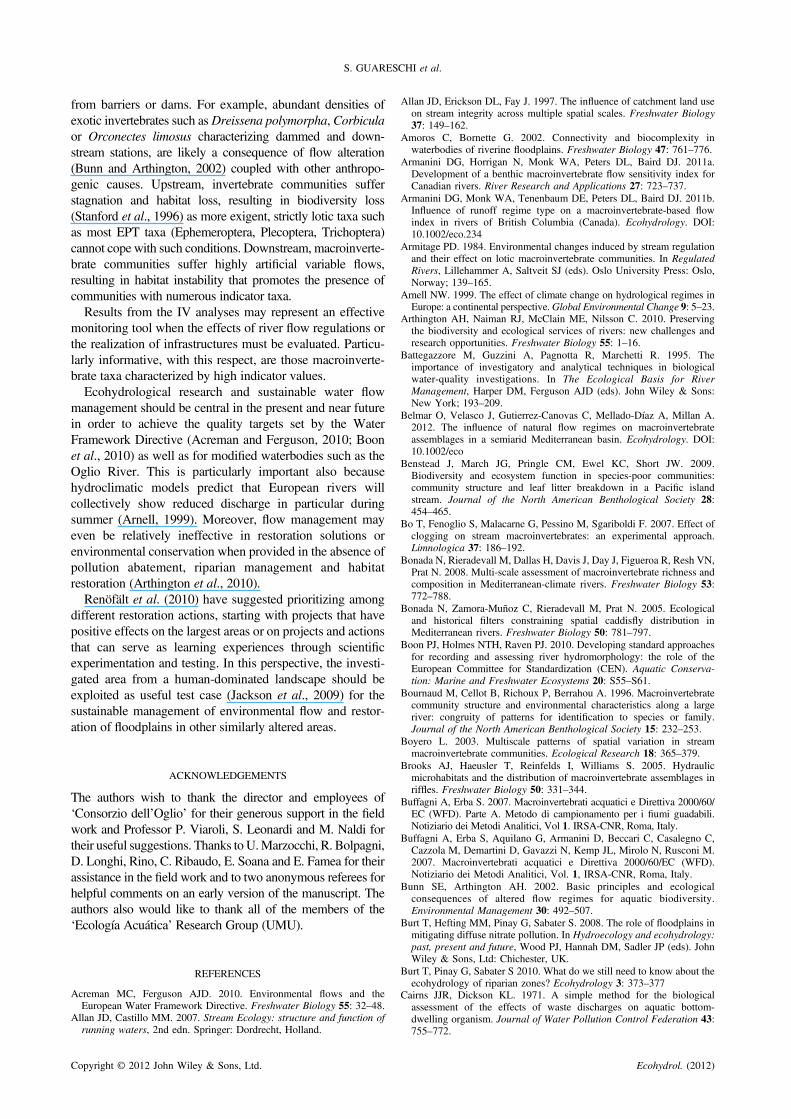
Figure 1. Map of Oglio basin (Northern Italy) and sampling sites alongthe river. In grey circles the dammed sites, in white downstream sites and
in black squares the sites belonging to the free flowing section.
S. GUARESCHI et al.
Berggren, 2000), fragmentation of riparian plant distribution(Jansson et al., 2000), enhancement of greenhouse gasemissions (St. Louis et al., 2000), changes in thermal regimesand water chemical composition (Armitage, 1984; Lessardand Hayes, 2003; Olden and Naiman, 2010) as well as apossible regime shift from net heterotrophy to net autotrophy(Pinardi et al., 2011). Furthermore, aquatic biodiversityseems to respond to hydraulic disturbance by changingcommunity structures and resistance to invasion of exoticspecies (Stanford et al., 1996; Bunn and Arthington, 2002;Poff et al., 2007). Different studies (Copp, 1990; Irz et al.,2006) reported a transition from lotic to lentic fishcommunities in dammed sites as well as increased in exoticand lake-adapted taxa (Pringle et al., 2000). However, thereare few similar studies focusing on other aquatic taxa. Theway the whole macroinvertebrate community responds tohydromorphological alterations and regulated flows in thelong term, large-scale and lowland rivers has been poorlyexplored. Many researchers have investigated the ecohydro-logical changes that occur below a single dam, but few studieshave examined changes in macroinvertebrate communitiesencompassing an entire river unit (Heppner and Loague,2008; Zolezzi et al., 2011). Hydraulic stream conditions andother hydrologic factors, including a combination of currentvelocity, depth, surface slope and substrate roughness, insteadseem to be important factors for invertebrate zonation patterns(Rempel et al., 2000; Brooks et al., 2005; Kennen et al.,2010) and benthic ecology (Carling, 1992). Nevertheless, theconsequences of streams management and invertebratehydraulic preferences are generally better known in smallstreams than in medium or large rivers (Mérigoux et al.,2009), which is probably due to the complexity of thesesystems (Sparks, 1995).The effects of dams and barriers on macroinvertebrate
communities are important because of the role thatmacroinvertebrates play in the functions and dynamics ofstream ecosystems (Merritt et al., 1984; Merritt andLawson, 1992). Dam use and the intensive exploitationof rivers, particularly in northern Italy, date back to 1900.They were historically designed with little considerationfor ecological effects such as migration pathways,minimum flow releases or hydropeaking problems. Here,as in many Mediterranean countries, rivers were convertedinto discontinuous systems with alternating or adjacentsegments characterized by varying hydrologic conditions.In this study, we hypothesized that altered flow regimes,
as those determined by dams, result in the segmentation ofregulated lowland rivers, and that such discontinuitiesaffect the macroinvertebrate communities. We expect lentictaxa to dominate basins upstream dams and rithral taxa asdominant groups downstream, with a clear distinction ofsuch communities from those colonizing the potamalstretches. To test this hypothesis, we identified a priori,along the course of the Oglio River, a lentic stretch(dammed: upstream of the dams or weirs), a stream-like(downstream: downstream dams or water abstractioninfrastructures) and a river-like section (free flowing)where we have analysed seasonally the macroinvertebratecommunity. We expected that macroinvertebrate commu-
Copyright © 2012 John Wiley & Sons, Ltd.
nity patterns were clearly addressed by different flowconditions affecting taxa richness, indicator families andecological traits.
To contribute to the knowledge of hydromorphologicalconstraints and regulated flows on macroinvertebratecommunities, this study aims (i) to investigate patterns ofmacroinvertebrate communities along a lowland flowregulated river, testing a priori zonation, (ii) to findmacroinvertebrate taxa that would serve as indicators ofdifferent hydrological conditions and (iii) to verifyenvironmental and hydromorphological control overmacroinvertebrate ecological traits resulting in differenttrait values in each zone.
METHODS
Study area
This study was carried out along the entire Oglio River(Lombardia, northern Italy), a man-regulated watercourseof 154 km (Figure 1). This river originates from an Alpinelake, the Lake Iseo (185m a.s.l.), and flows into the PoRiver (16m a.s.l.). Water flow in the Oglio River isregulated by the Sarnico dam, at the southern extreme ofLake Iseo; regulation aims at the production of electricityand the maintenance of a water reserve in the upstream lakefor irrigation purposes. The catchment of the Oglio Riveroccupies an area of 3840 km2, mostly exploited foragricultural activities (67%) and animal farming (about600,000 cows and over 2,100,000 pigs); the humanpopulation comprises roughly 1,100,000 inhabitants.
The Oglio River suffers from various pressures. Briefly,intensive agriculture and farming have resulted in diffusenitrogen pollution that affects surface and groundwater (Lainiet al., 2011; Soana et al., 2011). The river itself has beenheavily altered from its pristine status because of multipleagricultural and industrial water uses and from the construc-tion of hydropower plants, low head dams and banks. Waterdiversions for irrigation date back to 1500 and are mainly
Ecohydrol. (2012)
HYDROMORPHOLOGICAL CONSTRAINTS ON MACROINVERTEBRATE COMMUNITIES
located along the upper 29 km long reach; the sum of theirwater concession equals the average historical flow of theriver (about 80m3s�1), whichmeans that thewaterflow couldbe entirely diverted. The realization of hydropower plants is amore recent issue that dates back to 1950; six plants areoperating at present, all located in the same upper reachmentioned previously where the river is generally confined toa single channel, disconnected from its floodplain and withreduced sinuosity. Altered flow regime and dammingare probably major causes of habitat heterogeneity loss.Hydraulic infrastructures result in variable riverbed widths(from<30 to about 100m) and in variable water depths, fromseveral metres upstream from the dams to a few centimetresdownstream from the water abstraction. The Oglio River hasthe typical features of a plain river, with gentle slopes andmoderate water flow. The river substrate only partially variesalong the longitudinal gradient from a typical gravel-dominated substrate to a fine sand-dominated substrate inthe lowland areas. This is due to the presence of hydraulicinfrastructures in the upper sections that affect the gravelsubstrate converting it in silt and macrophyte-dominatedsubstrate upstream from the dams.
Macroinvertebrate and environmental data
The macroinvertebrate community was sampled from July2009 to May 2010 at 18 sites located along the Oglio Riverand representative of the a priori identified river typologies:(i) dammed sites (basins upstream hydropower plants orlow head dams); (ii) sites immediately downstream to thosedescribed as dammed and (iii) free flowing section in thelowland, meandering zone (Figure 1). Sampling wasseasonal for all considered sites with only a few exceptions(mainly in dammed and free flowing zones) because ofvandalism or excess flow/floods. Macrofauna communitywas characterized in a total of 63 stations by means of twodistinct quantitative approaches, each exploring a surfaceof 0.5m2. At those sites belonging to dammed and freeflowing zones, artificial substrates (hereinafter called AS)were employed, whereas at sites belonging to downstreamzones, a Surber net was used. At each station, downstreamhydropower plants or dams, a total of 10 Surber units (1 Surberunit = 0.05m2, with 500mm mesh size net) were collected oneach date by stirring and removing surface sediments andstones to dislodge any attached invertebrates. Explored areaswithin each station were proportional to the relative surfaceof all the microhabitats identified, according to Buffagni andErba (2007).Reliable and accurate collection of macroinvertebrates
presents a certain degree of difficulty in deep sections ofupstream dams and where flows are elevated. Here, the use
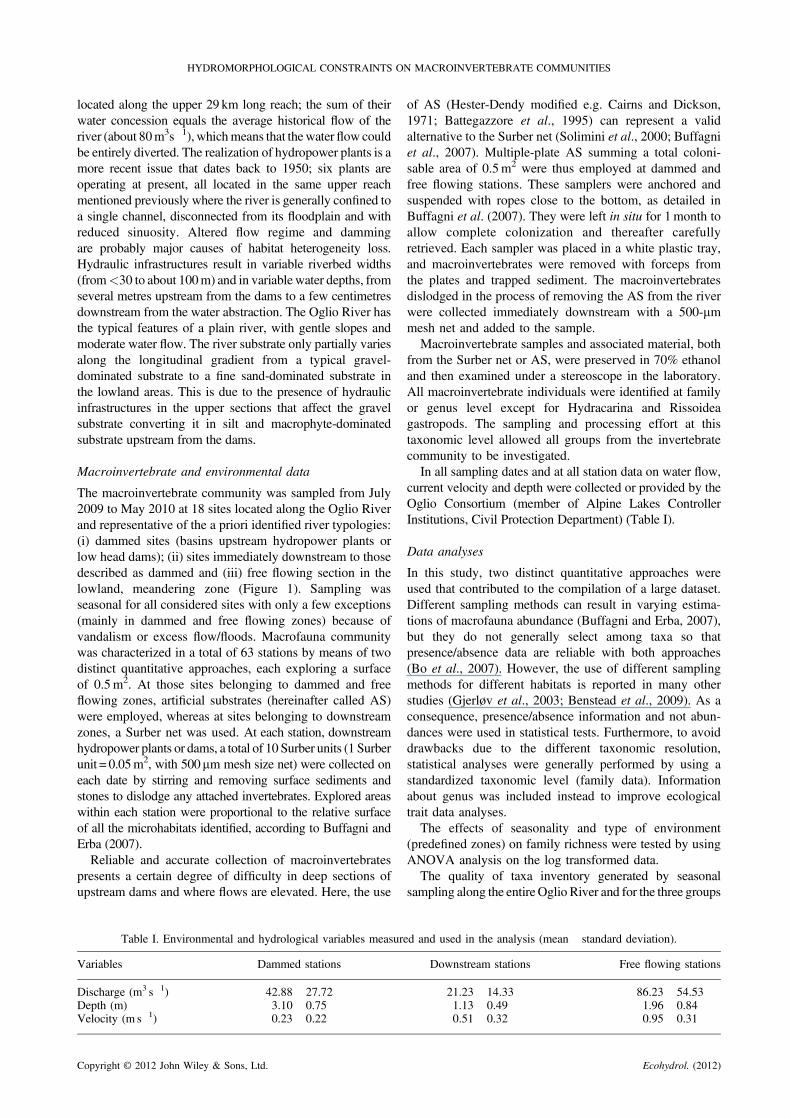
Table I. Environmental and hydrological variables measur
Variables Dammed stations
Discharge (m3 s�1) 42.88� 27.72Depth (m) 3.10� 0.75Velocity (m s�1) 0.23� 0.22
Copyright © 2012 John Wiley & Sons, Ltd.
of AS (Hester-Dendy modified e.g. Cairns and Dickson,1971; Battegazzore et al., 1995) can represent a validalternative to the Surber net (Solimini et al., 2000; Buffagniet al., 2007). Multiple-plate AS summing a total coloni-sable area of 0.5m2 were thus employed at dammed andfree flowing stations. These samplers were anchored andsuspended with ropes close to the bottom, as detailed inBuffagni et al. (2007). They were left in situ for 1month toallow complete colonization and thereafter carefullyretrieved. Each sampler was placed in a white plastic tray,and macroinvertebrates were removed with forceps fromthe plates and trapped sediment. The macroinvertebratesdislodged in the process of removing the AS from the riverwere collected immediately downstream with a 500-mmmesh net and added to the sample.
Macroinvertebrate samples and associated material, bothfrom the Surber net or AS, were preserved in 70% ethanoland then examined under a stereoscope in the laboratory.All macroinvertebrate individuals were identified at familyor genus level except for Hydracarina and Rissoideagastropods. The sampling and processing effort at thistaxonomic level allowed all groups from the invertebratecommunity to be investigated.
In all sampling dates and at all station data on water flow,current velocity and depth were collected or provided by theOglio Consortium (member of Alpine Lakes ControllerInstitutions, Civil Protection Department) (Table I).
Data analyses
In this study, two distinct quantitative approaches wereused that contributed to the compilation of a large dataset.Different sampling methods can result in varying estima-tions of macrofauna abundance (Buffagni and Erba, 2007),but they do not generally select among taxa so thatpresence/absence data are reliable with both approaches(Bo et al., 2007). However, the use of different samplingmethods for different habitats is reported in many otherstudies (Gjerløv et al., 2003; Benstead et al., 2009). As aconsequence, presence/absence information and not abun-dances were used in statistical tests. Furthermore, to avoiddrawbacks due to the different taxonomic resolution,statistical analyses were generally performed by using astandardized taxonomic level (family data). Informationabout genus was included instead to improve ecologicaltrait data analyses.
The effects of seasonality and type of environment(predefined zones) on family richness were tested by usingANOVA analysis on the log transformed data.
The quality of taxa inventory generated by seasonalsampling along the entire Oglio River and for the three groups
ed and used in the analysis (mean� standard deviation).
Downstream stations Free flowing stations
21.23� 14.33 86.23� 54.531.13� 0.49 1.96� 0.840.51� 0.32 0.95� 0.31
Ecohydrol. (2012)
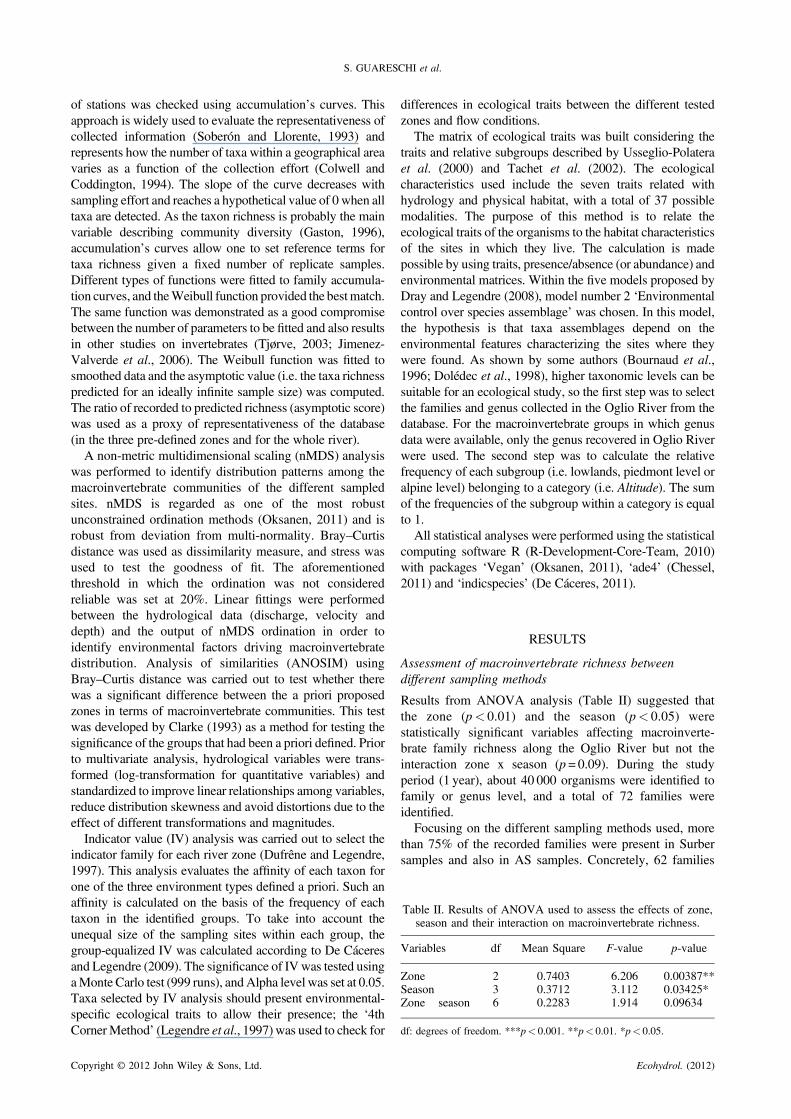
Table II. Results of ANOVA used to assess the effects of zone,season and their interaction on macroinvertebrate richness.
Variables df Mean Square F-value p-value
Zone 2 0.7403 6.206 0.00387**Season 3 0.3712 3.112 0.03425*Zone� season 6 0.2283 1.914 0.09634
df: degrees of freedom. ***p< 0.001. **p< 0.01. *p< 0.05.
S. GUARESCHI et al.
of stations was checked using accumulation’s curves. Thisapproach is widely used to evaluate the representativeness ofcollected information (Soberón and Llorente, 1993) andrepresents how the number of taxa within a geographical areavaries as a function of the collection effort (Colwell andCoddington, 1994). The slope of the curve decreases withsampling effort and reaches a hypothetical value of 0 when alltaxa are detected. As the taxon richness is probably the mainvariable describing community diversity (Gaston, 1996),accumulation’s curves allow one to set reference terms fortaxa richness given a fixed number of replicate samples.Different types of functions were fitted to family accumula-tion curves, and theWeibull function provided the bestmatch.The same function was demonstrated as a good compromisebetween the number of parameters to be fitted and also resultsin other studies on invertebrates (Tjørve, 2003; Jimenez-Valverde et al., 2006). The Weibull function was fitted tosmoothed data and the asymptotic value (i.e. the taxa richnesspredicted for an ideally infinite sample size) was computed.The ratio of recorded to predicted richness (asymptotic score)was used as a proxy of representativeness of the database(in the three pre-defined zones and for the whole river).A non-metric multidimensional scaling (nMDS) analysis
was performed to identify distribution patterns among themacroinvertebrate communities of the different sampledsites. nMDS is regarded as one of the most robustunconstrained ordination methods (Oksanen, 2011) and isrobust from deviation from multi-normality. Bray–Curtisdistance was used as dissimilarity measure, and stress wasused to test the goodness of fit. The aforementionedthreshold in which the ordination was not consideredreliable was set at 20%. Linear fittings were performedbetween the hydrological data (discharge, velocity anddepth) and the output of nMDS ordination in order toidentify environmental factors driving macroinvertebratedistribution. Analysis of similarities (ANOSIM) usingBray–Curtis distance was carried out to test whether therewas a significant difference between the a priori proposedzones in terms of macroinvertebrate communities. This testwas developed by Clarke (1993) as a method for testing thesignificance of the groups that had been a priori defined. Priorto multivariate analysis, hydrological variables were trans-formed (log-transformation for quantitative variables) andstandardized to improve linear relationships among variables,reduce distribution skewness and avoid distortions due to theeffect of different transformations and magnitudes.Indicator value (IV) analysis was carried out to select the
indicator family for each river zone (Dufrêne and Legendre,1997). This analysis evaluates the affinity of each taxon forone of the three environment types defined a priori. Such anaffinity is calculated on the basis of the frequency of eachtaxon in the identified groups. To take into account theunequal size of the sampling sites within each group, thegroup-equalized IV was calculated according to De Cáceresand Legendre (2009). The significance of IVwas tested usingaMonte Carlo test (999 runs), andAlpha level was set at 0.05.Taxa selected by IV analysis should present environmental-specific ecological traits to allow their presence; the ‘4thCornerMethod’ (Legendre et al., 1997) was used to check for
Copyright © 2012 John Wiley & Sons, Ltd.
differences in ecological traits between the different testedzones and flow conditions.
The matrix of ecological traits was built considering thetraits and relative subgroups described by Usseglio-Polateraet al. (2000) and Tachet et al. (2002). The ecologicalcharacteristics used include the seven traits related withhydrology and physical habitat, with a total of 37 possiblemodalities. The purpose of this method is to relate theecological traits of the organisms to the habitat characteristicsof the sites in which they live. The calculation is madepossible by using traits, presence/absence (or abundance) andenvironmental matrices. Within the five models proposed byDray and Legendre (2008), model number 2 ‘Environmentalcontrol over species assemblage’ was chosen. In this model,the hypothesis is that taxa assemblages depend on theenvironmental features characterizing the sites where theywere found. As shown by some authors (Bournaud et al.,1996; Dolédec et al., 1998), higher taxonomic levels can besuitable for an ecological study, so the first step was to selectthe families and genus collected in the Oglio River from thedatabase. For the macroinvertebrate groups in which genusdata were available, only the genus recovered in Oglio Riverwere used. The second step was to calculate the relativefrequency of each subgroup (i.e. lowlands, piedmont level oralpine level) belonging to a category (i.e. Altitude). The sumof the frequencies of the subgroup within a category is equalto 1.
All statistical analyses were performed using the statisticalcomputing software R (R-Development-Core-Team, 2010)with packages ‘Vegan’ (Oksanen, 2011), ‘ade4’ (Chessel,2011) and ‘indicspecies’ (De Cáceres, 2011).
RESULTS
Assessment of macroinvertebrate richness betweendifferent sampling methods
Results from ANOVA analysis (Table II) suggested thatthe zone (p< 0.01) and the season (p< 0.05) werestatistically significant variables affecting macroinverte-brate family richness along the Oglio River but not theinteraction zone x season (p = 0.09). During the studyperiod (1 year), about 40 000 organisms were identified tofamily or genus level, and a total of 72 families wereidentified.
Focusing on the different sampling methods used, morethan 75% of the recorded families were present in Surbersamples and also in AS samples. Concretely, 62 families
Ecohydrol. (2012)
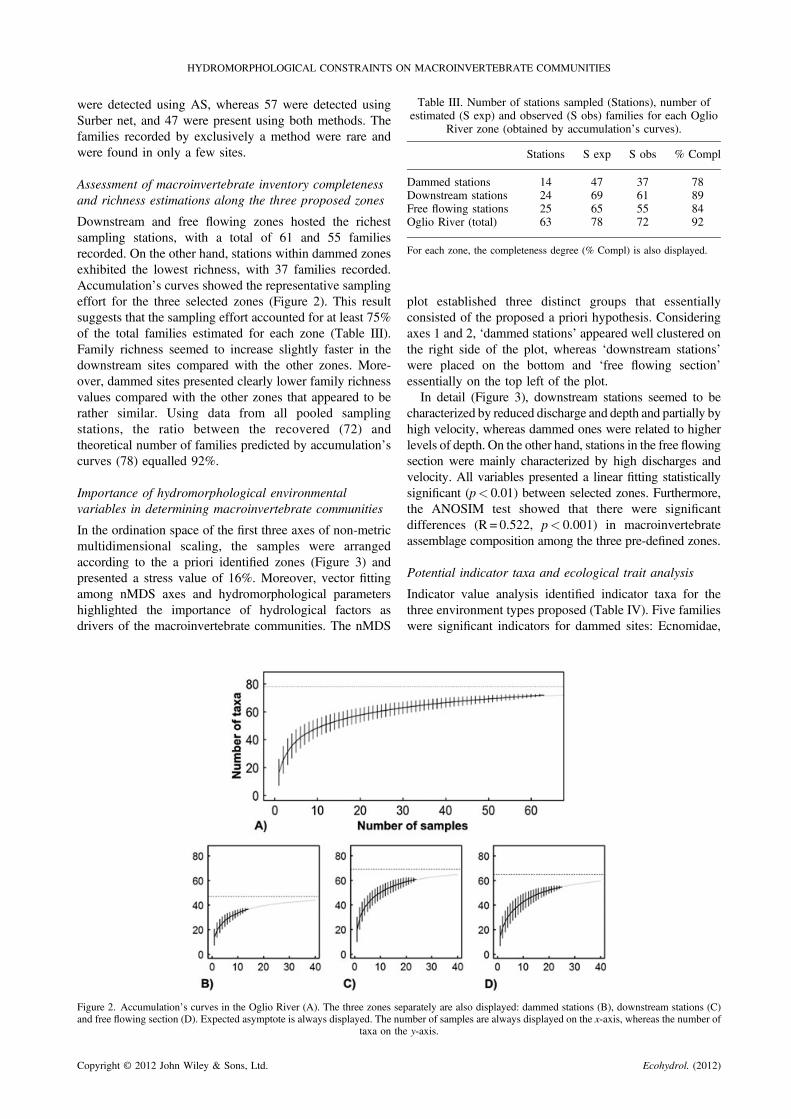
Table III. Number of stations sampled (Stations), number ofestimated (S exp) and observed (S obs) families for each Oglio
River zone (obtained by accumulation’s curves).
Stations S exp S obs % Compl
Dammed stations 14 47 37 78Downstream stations 24 69 61 89Free flowing stations 25 65 55 84Oglio River (total) 63 78 72 92
For each zone, the completeness degree (% Compl) is also displayed.
HYDROMORPHOLOGICAL CONSTRAINTS ON MACROINVERTEBRATE COMMUNITIES
were detected using AS, whereas 57 were detected usingSurber net, and 47 were present using both methods. Thefamilies recorded by exclusively a method were rare andwere found in only a few sites.
Assessment of macroinvertebrate inventory completenessand richness estimations along the three proposed zones
Downstream and free flowing zones hosted the richestsampling stations, with a total of 61 and 55 familiesrecorded. On the other hand, stations within dammed zonesexhibited the lowest richness, with 37 families recorded.Accumulation’s curves showed the representative samplingeffort for the three selected zones (Figure 2). This resultsuggests that the sampling effort accounted for at least 75%of the total families estimated for each zone (Table III).Family richness seemed to increase slightly faster in thedownstream sites compared with the other zones. More-over, dammed sites presented clearly lower family richnessvalues compared with the other zones that appeared to berather similar. Using data from all pooled samplingstations, the ratio between the recovered (72) andtheoretical number of families predicted by accumulation’scurves (78) equalled 92%.
Importance of hydromorphological environmentalvariables in determining macroinvertebrate communities
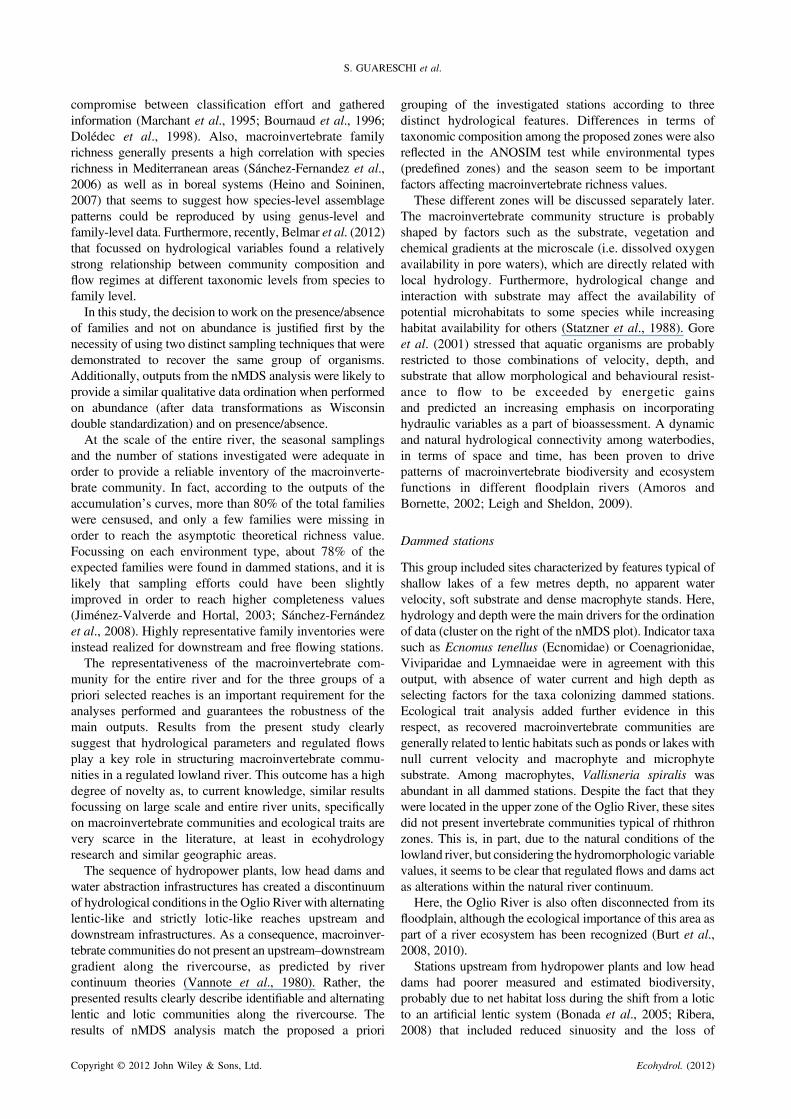
In the ordination space of the first three axes of non-metricmultidimensional scaling, the samples were arrangedaccording to the a priori identified zones (Figure 3) andpresented a stress value of 16%. Moreover, vector fittingamong nMDS axes and hydromorphological parametershighlighted the importance of hydrological factors asdrivers of the macroinvertebrate communities. The nMDS
Figure 2. Accumulation’s curves in the Oglio River (A). The three zones sepand free flowing section (D). Expected asymptote is always displayed. The nu
taxa on the
Copyright © 2012 John Wiley & Sons, Ltd.
plot established three distinct groups that essentiallyconsisted of the proposed a priori hypothesis. Consideringaxes 1 and 2, ‘dammed stations’ appeared well clustered onthe right side of the plot, whereas ‘downstream stations’were placed on the bottom and ‘free flowing section’essentially on the top left of the plot.
In detail (Figure 3), downstream stations seemed to becharacterized by reduced discharge and depth and partially byhigh velocity, whereas dammed ones were related to higherlevels of depth. On the other hand, stations in the free flowingsection were mainly characterized by high discharges andvelocity. All variables presented a linear fitting statisticallysignificant (p< 0.01) between selected zones. Furthermore,the ANOSIM test showed that there were significantdifferences (R = 0.522, p< 0.001) in macroinvertebrateassemblage composition among the three pre-defined zones.
Potential indicator taxa and ecological trait analysis
Indicator value analysis identified indicator taxa for thethree environment types proposed (Table IV). Five familieswere significant indicators for dammed sites: Ecnomidae,
arately are also displayed: dammed stations (B), downstream stations (C)mber of samples are always displayed on the x-axis, whereas the number ofy-axis.
Ecohydrol. (2012)

Figure 3. nMDS plot and the a priori identified zones coloured. In blackcolour sites belonging to the free flowing section, in grey dammed sitesand in white downstream sites (stress = 16%). Hydromorphological
variables are also displayed.
Table IV. Results of IV analysis for each zone.
Dammed stationsOrder Family IV p-valueTRI Ecnomidae 64.3 0.001ODO Coenagrionidae 38.6 0.001ARC Viviparidae 25.5 0.004PUL Lymnaeidae 25.0 0.024TRI Limnephilidae 14.3 0.039
Downstrem stationsOrder Family IV p-valueDIT Limoniidae 54.8 0.001TRI Psychomyidae 53.7 0.001OPI Lumbricidae 53.3 0.001EFE Baetidae 46.0 0.001NER Neritidae 42.0 0.001EFE Ephemerellidae 40.7 0.002VEN Dreissenidae 40.2 0.011TRI Rhyacophilidae 39.9 0.001TRI Lepidostomatidae 37.5 0.003DIT Empididae 33.6 0.005ARH Erpobdellidae 30.6 0.045HEM Naucoridae 25.5 0.005VEN Corbiculidae 24.1 0.044DIT Tipulidae 17.4 0.04
Free flowing stationsOrder Family IV p-valueEFE Heptageniidae 74.3 0.001ODO Calopterygidae 49.0 0.001ANP Gammaridae 48.0 0.004ODO Platycnemidae 44.4 0.001TRI Hydropsychidae 43.8 0.035ODO Gomphidae 42.9 0.001TUB Tubificidae 23.2 0.033
Indicator value and significant p-value are displayed.
S. GUARESCHI et al.
Coenagrionidae, Viviparidae, Lymnaeidae and Limnephi-lidae. Some authors (Bonada et al., 2008, followingDufrêne and Legendre, 1997) considered an IV> 25 askey value to judge adequate an indicator taxa, so the firsttwo presented an important IV value and great significancelevel (p< 0.001). Stations included in the downstreamzones presented a heterogeneous list composed by 14indicator families: Limoniidae, Psychomyidae, Lumbrici-dae, Baetidae, Neritidae and Rhyacophilidae with the best
Copyright © 2012 John Wiley & Sons, Ltd.
significance level (p< 0.001). These stations presented aheterogeneous clustering of taxa, with different ecologicalcharacteristics and varying taxonomic positions. Finally,seven families were good indicators for the free flowingsection with Heptageniidae (essentially genus Heptagenia)with the highest IV followed by Calopterygidae (genusCalopteryx), Gammaridae, Platycnemididae, Hydropsychidae,Gomphidae and lastly Tubificidae.
Results from the ‘4th Corner Method’ showed distinctpatterns of ecological traits in the three different a priorihypothesized zones: dammed, downstream and free flow-ing stretch (Table V). When focussing upon ecologicaltraits such as transversal distribution, longitudinal distri-bution or current velocity, it is very interesting to note thatthe three pre-defined zones presented macroinvertebratecommunities with different ecological traits. In these cases,dammed and downstream zones presented almost alwaysopposite and complementary values. In particular, analys-ing transversal distribution, dammed zones presented amacroinvertebrate community with negative correlationwith habitats such as river channel and a strong andpositive relation with habitats such as ponds and pools(0.255; p< 0.01) and also with lakes (0.071; p< 0.01). Onthe other hand, macroinvertebrate communities inhabitingdownstream zones presented a negative relationship withhabitats such as lakes (�0.087; p< 0.01) and ponds(�0.107; p< 0.05) and positive value with banks habitats(0.116; p< 0.01). In the free flowing section, significant andnegative relationships were obtained with ponds (�0.095,p< 0.05) and temporary waters (�0.088; p< 0.01).Focussing on longitudinal distribution, dammed zonespresented negative relationships with crenon and epirhithronzones (�0.113 and �0.210; p< 0.01) and a positiverelationship with metapotamon habitats (0.171; p< 0.01).Again, downstream zones presented opposite values com-pared with dammed stations (except for estuary value)with positive relationships with crenon and epirhithron areas(0.093 and 0.120; p< 0.01) and negative relationships withepipotamon (�0.82; p< 0.01) and metapotamon (�0.080;p< 0.05). In this ecological trait, free flowing sites presentedcomplex results with positive relationships with metarhithronzones (0.114; p< 0.01) and negative with estuary (�0.124;p< 0.01) and metapotamon (�0.055; p< 0.05).
Also, considering the altitude trait, macroinvertebratecommunities inhabiting dammed and downstream zonespresented opposite signs between lowlands, piedmont andalpine levels. Observing substrate preference, dammed zoneswere essentially related to microphytes and macrophytes(0.141 and 0.120; p< 0.01), whereas downstream zones withflags, twigs and roots (0.069 and 0.088; p< 0.01) and silt(�0.085; p< 0.01). The free flowing section was positivelyrelated to silt, sand and gravel (0.140; 0.115; 0.093 withp< 0.01). Furthermore, considering current velocity,dammed zones presented negative and significant relation-ships with medium and fast velocity (�0.246 and �0.189;p< 0.01), whereas the others presented a positive relation,although less significant. Analysing the trophic status, it wasinteresting to note that dammed zones were positively relatedwith eutrophic conditions (0.130; p< 0.01), whereas the
Ecohydrol. (2012)

Table V. Ecological traits analysis following the traits description by Usseglio-Polatera et al. (2000) and Tachet et al. (2002).
Ecological traits F-test p-value Dammed Downstream Free flowing
r-value p-value r-value p-value r-value p-value
Transversal distributionRiver_channel 13.705 0.001 *** �0.16 0.003 0.054 0.034 0.072 0.016Banks_ 15.167 0.001 *** �0.160 0.003 0.116 0.003 0.008 0.408Ponds_pools 36.554 0.001 *** 0.255 0.003 �0.107 0.014 �0.095 0.014Marshes_peat_bogs 1.284 0.126 0.026 0.282 0.027 0.282 �0.049 0.084Temporary_waters 4.066 0.001 *** 0.032 0.098 0.060 0.016 �0.088 0.003Lakes 4.702 0.001 *** 0.071 0.004 �0.087 0.003 0.034 0.113Groundwaters 2.813 0.001 *** 0.016 0.208 �0.071 0.003 0.061 0.003
Longitudinal distributionCrenon 8.075 0.001 *** �0.113 0.003 0.093 0.003 �0.005 0.417Epirhithron 24.772 0.001 *** �0.210 0.003 0.120 0.003 0.045 0.106Metarhithron 21.290 0.001 *** �0.191 0.003 0.038 0.120 0.114 0.003Hyporhithron 6.407 0.001 *** �0.110 0.003 0.051 0.032 0.035 0.068Epipotamon 4.446 0.009 ** 0.073 0.014 �0.082 0.009 0.026 0.194Metapotamon 15.750 0.001 *** 0.171 0.003 �0.080 0.022 �0.055 0.034Estuary 8.242 0.001 *** 0.040 0.037 0.088 0.003 �0.124 0.003Outside_river_system 17.688 0.001 *** 0.175 0.003 �0.118 0.003 �0.019 0.293
AltitudeLowlands 9.678 0.001 *** 0.135 0.003 �0.056 0.052 �0.050 0.052Piedmont_level 10.184 0.001 *** �0.135 0.003 0.033 0.129 0.075 0.008Alpine_level 5.319 0.002 ** �0.091 0.003 0.077 0.004 �0.006 0.413
Substrate (preferendum)Flags 3.083 0.005 ** �0.001 0.487 0.069 0.004 �0.071 0.003Gravel 7.247 0.001 *** �0.099 0.003 �0.013 0.324 0.093 0.003Sand 12.812 0.001 *** �0.137 0.003 �0.005 0.451 0.115 0.003Silt 10.609 0.001 *** �0.064 0.004 �0.085 0.004 0.140 0.003Macrophytes 8.486 0.001 *** 0.120 0.003 �0.019 0.230 �0.078 0.006Microphytes 10.592 0.001 *** 0.141 0.003 �0.060 0.044 �0.052 0.044Twigs_roots 4.278 0.001 *** �0.054 0.010 0.088 0.003 �0.049 0.011Organic_detritus 0.774 0.164 0.032 0.153 �0.033 0.153 0.009 0.325Mud 2.024 0.059 0.027 0.151 �0.062 0.018 0.043 0.134
Current velocity (preferendum)Null 31.875 0.001 *** 0.239 0.003 �0.087 0.013 �0.103 0.008Slow 6.559 0.001 *** 0.107 0.003 �0.020 0.200 �0.066 0.004Medium 35.694 0.001 *** �0.246 0.003 0.056 0.068 0.140 0.003Fast 19.390 0.001 *** �0.189 0.003 0.087 0.008 0.062 0.022
Trophic status (preferendum)Oligotrophic 9.936 0.001 *** �0.133 0.003 0.086 0.006 0.018 0.266Mesotrophic 3.372 0.008 ** 0.050 0.058 �0.078 0.009 0.041 0.059Eutrophic 9.031 0.001 *** 0.130 0.003 �0.047 0.041 �0.056 0.024
TemperaturePsychrophilic 5.234 0.001 *** �0.099 0.003 0.043 0.062 0.036 0.066Thermophilic 0.409 0.411 0.024 0.333 0.003 0.446 �0.022 0.333Eurythermic 2.153 0.032 * 0.063 0.006 �0.037 0.126 �0.013 0.318
The results from the global test (F) and their significance p obtained by permutations in the ‘4th Corner Method’ are presented (Legendre et al., 1997).For dammed, downstream and free flowing sites, the r-values from the correlation traits-habitat matrix are given. The significance of r-value was alsotested by permutations (999 runs). All p-values include Holm correction. ***p< 0.001; **p< 0.01; *p< 0.05.
HYDROMORPHOLOGICAL CONSTRAINTS ON MACROINVERTEBRATE COMMUNITIES
other ones presented opposite results with negative relation-ship with eutrophic conditions. The temperature trait seemedimportant because dammed zones presented a negative andsignificant relationship with psychrophilic, i.e. cold-steno-thermal organism (�0.099; p< 0.01) and a positive relation-ship with eurythermic conditions (0.063; p< 0.01), whereasother zones did not present significant values.
Copyright © 2012 John Wiley & Sons, Ltd.
DISCUSSION
Species level resolution is preferable in ecohydrologicalresearches when it is available (Monk et al., 2012). However,the present study considered the taxonomic level used asadequate in order to characterize the ecological traits of mostgroups with respect to riverine hydrology and a good
Ecohydrol. (2012)
S. GUARESCHI et al.
compromise between classification effort and gatheredinformation (Marchant et al., 1995; Bournaud et al., 1996;Dolédec et al., 1998). Also, macroinvertebrate familyrichness generally presents a high correlation with speciesrichness in Mediterranean areas (Sánchez-Fernandez et al.,2006) as well as in boreal systems (Heino and Soininen,2007) that seems to suggest how species-level assemblagepatterns could be reproduced by using genus-level andfamily-level data. Furthermore, recently, Belmar et al. (2012)that focussed on hydrological variables found a relativelystrong relationship between community composition andflow regimes at different taxonomic levels from species tofamily level.In this study, the decision to work on the presence/absence
of families and not on abundance is justified first by thenecessity of using two distinct sampling techniques that weredemonstrated to recover the same group of organisms.Additionally, outputs from the nMDS analysis were likely toprovide a similar qualitative data ordination when performedon abundance (after data transformations as Wisconsindouble standardization) and on presence/absence.At the scale of the entire river, the seasonal samplings
and the number of stations investigated were adequate inorder to provide a reliable inventory of the macroinverte-brate community. In fact, according to the outputs of theaccumulation’s curves, more than 80% of the total familieswere censused, and only a few families were missing inorder to reach the asymptotic theoretical richness value.Focussing on each environment type, about 78% of theexpected families were found in dammed stations, and it islikely that sampling efforts could have been slightlyimproved in order to reach higher completeness values(Jiménez-Valverde and Hortal, 2003; Sánchez-Fernándezet al., 2008). Highly representative family inventories wereinstead realized for downstream and free flowing stations.The representativeness of the macroinvertebrate com-
munity for the entire river and for the three groups of apriori selected reaches is an important requirement for theanalyses performed and guarantees the robustness of themain outputs. Results from the present study clearlysuggest that hydrological parameters and regulated flowsplay a key role in structuring macroinvertebrate commu-nities in a regulated lowland river. This outcome has a highdegree of novelty as, to current knowledge, similar resultsfocussing on large scale and entire river units, specificallyon macroinvertebrate communities and ecological traits arevery scarce in the literature, at least in ecohydrologyresearch and similar geographic areas.The sequence of hydropower plants, low head dams and
water abstraction infrastructures has created a discontinuumof hydrological conditions in the Oglio River with alternatinglentic-like and strictly lotic-like reaches upstream anddownstream infrastructures. As a consequence, macroinver-tebrate communities do not present an upstream–downstreamgradient along the rivercourse, as predicted by rivercontinuum theories (Vannote et al., 1980). Rather, thepresented results clearly describe identifiable and alternatinglentic and lotic communities along the rivercourse. Theresults of nMDS analysis match the proposed a priori
Copyright © 2012 John Wiley & Sons, Ltd.
grouping of the investigated stations according to threedistinct hydrological features. Differences in terms oftaxonomic composition among the proposed zones were alsoreflected in the ANOSIM test while environmental types(predefined zones) and the season seem to be importantfactors affecting macroinvertebrate richness values.
These different zones will be discussed separately later.The macroinvertebrate community structure is probablyshaped by factors such as the substrate, vegetation andchemical gradients at the microscale (i.e. dissolved oxygenavailability in pore waters), which are directly related withlocal hydrology. Furthermore, hydrological change andinteraction with substrate may affect the availability ofpotential microhabitats to some species while increasinghabitat availability for others (Statzner et al., 1988). Goreet al. (2001) stressed that aquatic organisms are probablyrestricted to those combinations of velocity, depth, andsubstrate that allow morphological and behavioural resist-ance to flow to be exceeded by energetic gainsand predicted an increasing emphasis on incorporatinghydraulic variables as a part of bioassessment. A dynamicand natural hydrological connectivity among waterbodies,in terms of space and time, has been proven to drivepatterns of macroinvertebrate biodiversity and ecosystemfunctions in different floodplain rivers (Amoros andBornette, 2002; Leigh and Sheldon, 2009).
Dammed stations
This group included sites characterized by features typical ofshallow lakes of a few metres depth, no apparent watervelocity, soft substrate and dense macrophyte stands. Here,hydrology and depth were the main drivers for the ordinationof data (cluster on the right of the nMDS plot). Indicator taxasuch as Ecnomus tenellus (Ecnomidae) or Coenagrionidae,Viviparidae and Lymnaeidae were in agreement with thisoutput, with absence of water current and high depth asselecting factors for the taxa colonizing dammed stations.Ecological trait analysis added further evidence in thisrespect, as recovered macroinvertebrate communities aregenerally related to lentic habitats such as ponds or lakes withnull current velocity and macrophyte and microphytesubstrate. Among macrophytes, Vallisneria spiralis wasabundant in all dammed stations. Despite the fact that theywere located in the upper zone of the Oglio River, these sitesdid not present invertebrate communities typical of rhithronzones. This is, in part, due to the natural conditions of thelowland river, but considering the hydromorphologic variablevalues, it seems to be clear that regulated flows and dams actas alterations within the natural river continuum.
Here, the Oglio River is also often disconnected from itsfloodplain, although the ecological importance of this area aspart of a river ecosystem has been recognized (Burt et al.,2008, 2010).
Stations upstream from hydropower plants and low headdams had poorer measured and estimated biodiversity,probably due to net habitat loss during the shift from a loticto an artificial lentic system (Bonada et al., 2005; Ribera,2008) that included reduced sinuosity and the loss of
Ecohydrol. (2012)

HYDROMORPHOLOGICAL CONSTRAINTS ON MACROINVERTEBRATE COMMUNITIES
meandering zones (Garcia et al., 2012). Aquatic environ-ments such as rivers display large habitat heterogeneity,including pool-riffle sequences (Vannote et al., 1980; Allanand Castillo, 2007) as well as a number of differentmicrohabitats at reach scale (Cogerino et al., 1995; Allanet al., 1997; Boyero, 2003). The habitat heterogeneity of loticecosystems may allow the presence of a higher number oftaxa in comparison to ponds or lakes, although under naturalconditions, these environments generally contribute to thepresence of rare and unique species (Williams et al., 2003).Furthermore, dammed stations, essentially in the upper zoneof Oglio River, presented macroinvertebrate communitiesnegatively related with psychrophilic conditions, which seemsto emphasize the importance of thermal regimes (Olden andNaiman, 2010) in environmental flows assessments.
Downstream stations
Current velocity, reduced depth and type of substrate (mainlyflags or mesolithal) suggested that stations downstream fromthe dams or water abstraction structures had those featuresthat characterize pristine, rhithral and stream-like environ-ments. This is another artificial condition that is aconsequence of a sudden decrease in water flow for multiplewater uses. The reversal of lentic-like features and there-establishment of lotic characteristics were described in theserial discontinuity concept (Ward and Stanford, 1983) and inother studies (Odum, 1997). The serial discontinuity conceptviewed dams as clear discontinuities within the rivercontinuum and proposed that rivers have a tendency to resetecological conditions toward unregulated or natural condi-tions as distance downstream from the point of regulationincreases (Stanford and Ward, 2001).In downstream stations, selected indicator families such as
Psychomyidae, Ephemerellidae (Ephemerella) or Rhyaco-philidae were typical of rhithral ecosystems, whereas otherfamilies provided multiple information with respect toenvironmental features. For example, the presence ofNeritidae (Theodoxus) could be an indicator of a hyporhithralor potamal environment, whereas that of Dreissena poly-morpha does not, and its presence is probably because of adrift effect from dammed upstream coupled with the highdispersive capacity of this invasive species.The ecological traits analysis and in particular, the traits
transversal distribution, longitudinal distribution, currentvelocity and altitude, suggested negative relationshipsbetween macroinvertebrate communities at downstreamstations with lakes, potamal zones and null velocity andpositive relation with alpine level altitude, fast velocity andrhithron zones, features that are generally typical of stream-like environments with limited water discharge.
Free flowing stations
These stations characterized a lowland, ~100 km long free-flowing river course that was devoid of infrastructures thatcreated longitudinal discontinuities of relevant water flowvariations. Flows and water velocity were constant ortended to increase, and the upstream–downstream varia-tions of chemical and biological features probably
Copyright © 2012 John Wiley & Sons, Ltd.
followed the predictions of the Vannote et al. (1980)conceptual model.
Because of its length, this reach included a number ofdifferent habitats whose features could partially overlap thosecharacterizing downstream stations (i.e. the substrate, atits beginning) aswell as those characterizing dammed stations(i.e. water depth, toward its end). Such heterogeneity isreflected by the results of the IV and ecological traits analyses.In fact, selected macroinvetebrate indicator taxa of freeflowing stations such as Gammaridae, Heptagenia ordifferent taxa of Odonata are essentially related with lowlandrivers. However, results from the ecological trait analysis, andin particular those related to the trait longitudinal distribution,suggested a rhithral more than potamal macrofauna commu-nity. In terms of altitude traits, this section presented amacroinvertebrate fauna more related with a piedmont levelcommunity than with a lowland level.
The use of different analyses (IV and traits analyses) canimprove the quality of the results bringing additionalecohydrological information. This section that would beexpected to present macroinvertebrate communities closelyrelated with a potamon condition really presented hetero-geneous communities that may be partially associated withan alteration of the rhithron–potamon boundary. The topicregarding a possible shift in the rhithron–potamonboundary was in part stressed by Stanford et al. (1996)who suggested that in rivers that are free flowing for longdistances downstream from large dams, the position of therhithron–potamon transition could be predicted from theoperational mode of the dams relative to the influence oftributaries. Furthermore, this topic is quite specific andnecessarily requires supplementary researches.
Final considerations
The relationship between habitat alteration and river ecologyis finally receiving increasing attention (Vaughan et al., 2009;Poff and Zimmerman, 2010), and specific macroinvertebrateindex or invertebrate preferences research, related to flowalteration and hydroecology topics, has been recentlydeveloped (Extence et al., 1999; Mérigoux et al., 2009;Armanini et al., 2011a, 2011b). However, biomonitoringactivities by environmental agencies and scientific interestfocus widely on the impact of dams and hydroelectric plantson downstream sections (Ligon et al., 1995; Power et al.,1996; Galbraith and Vaughn, 2011), whereas less attention tothe macroinvertebrate communities is generally devoted forupstream, dammed stations. Here, drastic changes inmacroinvertebrate communities can occur, as demonstratedby the present study in terms of indicator taxa and selection ofdifferent macroinvertebrate ecological traits. The authorssuggest that monitoring activities should also prioritize thosezones where human intervention has created river reacheswith lentic features. Pringle (1997), focussing on fishcommunities, had already stressed the importance ofconsidering the upstream as well as downstream effects ofdams and impoundments because disturbances can also betransmitted upstream.
Results from the present study suggest altered macrofaunacommunities in zones located both upstream and downstream
Ecohydrol. (2012)
S. GUARESCHI et al.
from barriers or dams. For example, abundant densities ofexotic invertebrates such asDreissena polymorpha, Corbiculaor Orconectes limosus characterizing dammed and down-stream stations, are likely a consequence of flow alteration(Bunn and Arthington, 2002) coupled with other anthropo-genic causes. Upstream, invertebrate communities sufferstagnation and habitat loss, resulting in biodiversity loss(Stanford et al., 1996) as more exigent, strictly lotic taxa suchas most EPT taxa (Ephemeroptera, Plecoptera, Trichoptera)cannot cope with such conditions. Downstream, macroinverte-brate communities suffer highly artificial variable flows,resulting in habitat instability that promotes the presence ofcommunities with numerous indicator taxa.Results from the IV analyses may represent an effective
monitoring tool when the effects of river flow regulations orthe realization of infrastructures must be evaluated. Particu-larly informative, with this respect, are those macroinverte-brate taxa characterized by high indicator values.Ecohydrological research and sustainable water flow
management should be central in the present and near futurein order to achieve the quality targets set by the WaterFramework Directive (Acreman and Ferguson, 2010; Boonet al., 2010) as well as for modified waterbodies such as theOglio River. This is particularly important also becausehydroclimatic models predict that European rivers willcollectively show reduced discharge in particular duringsummer (Arnell, 1999). Moreover, flow management mayeven be relatively ineffective in restoration solutions orenvironmental conservation when provided in the absence ofpollution abatement, riparian management and habitatrestoration (Arthington et al., 2010).Renöfält et al. (2010) have suggested prioritizing among
different restoration actions, starting with projects that havepositive effects on the largest areas or on projects and actionsthat can serve as learning experiences through scientificexperimentation and testing. In this perspective, the investi-gated area from a human-dominated landscape should beexploited as useful test case (Jackson et al., 2009) for thesustainable management of environmental flow and restor-ation of floodplains in other similarly altered areas.
ACKNOWLEDGEMENTS
The authors wish to thank the director and employees of‘Consorzio dell’Oglio’ for their generous support in the fieldwork and Professor P. Viaroli, S. Leonardi and M. Naldi fortheir useful suggestions. Thanks to U.Marzocchi, R. Bolpagni,D. Longhi, Rino, C. Ribaudo, E. Soana and E. Famea for theirassistance in the field work and to two anonymous referees forhelpful comments on an early version of the manuscript. Theauthors also would like to thank all of the members of the‘Ecología Acuática’ Research Group (UMU).
REFERENCES
Acreman MC, Ferguson AJD. 2010. Environmental flows and theEuropean Water Framework Directive. Freshwater Biology 55: 32–48.
Allan JD, Castillo MM. 2007. Stream Ecology: structure and function ofrunning waters, 2nd edn. Springer: Dordrecht, Holland.
Copyright © 2012 John Wiley & Sons, Ltd.
Allan JD, Erickson DL, Fay J. 1997. The influence of catchment land useon stream integrity across multiple spatial scales. Freshwater Biology37: 149–162.
Amoros C, Bornette G. 2002. Connectivity and biocomplexity inwaterbodies of riverine floodplains. Freshwater Biology 47: 761–776.
Armanini DG, Horrigan N, Monk WA, Peters DL, Baird DJ. 2011a.Development of a benthic macroinvertebrate flow sensitivity index forCanadian rivers. River Research and Applications 27: 723–737.
Armanini DG, Monk WA, Tenenbaum DE, Peters DL, Baird DJ. 2011b.Influence of runoff regime type on a macroinvertebrate-based flowindex in rivers of British Columbia (Canada). Ecohydrology. DOI:10.1002/eco.234
Armitage PD. 1984. Environmental changes induced by stream regulationand their effect on lotic macroinvertebrate communities. In RegulatedRivers, Lillehammer A, Saltveit SJ (eds). Oslo University Press: Oslo,Norway; 139–165.
Arnell NW. 1999. The effect of climate change on hydrological regimes inEurope: a continental perspective.Global Environmental Change 9: 5–23.
Arthington AH, Naiman RJ, McClain ME, Nilsson C. 2010. Preservingthe biodiversity and ecological services of rivers: new challenges andresearch opportunities. Freshwater Biology 55: 1–16.
Battegazzore M, Guzzini A, Pagnotta R, Marchetti R. 1995. Theimportance of investigatory and analytical techniques in biologicalwater-quality investigations. In The Ecological Basis for RiverManagement, Harper DM, Ferguson AJD (eds). John Wiley & Sons:New York; 193–209.
Belmar O, Velasco J, Gutierrez-Canovas C, Mellado-Díaz A, Millan A.2012. The influence of natural flow regimes on macroinvertebrateassemblages in a semiarid Mediterranean basin. Ecohydrology. DOI:10.1002/eco
Benstead J, March JG, Pringle CM, Ewel KC, Short JW. 2009.Biodiversity and ecosystem function in species-poor communities:community structure and leaf litter breakdown in a Pacific islandstream. Journal of the North American Benthological Society 28:454–465.
Bo T, Fenoglio S, Malacarne G, Pessino M, Sgariboldi F. 2007. Effect ofclogging on stream macroinvertebrates: an experimental approach.Limnologica 37: 186–192.
Bonada N, Rieradevall M, Dallas H, Davis J, Day J, Figueroa R, Resh VN,Prat N. 2008. Multi-scale assessment of macroinvertebrate richness andcomposition in Mediterranean-climate rivers. Freshwater Biology 53:772–788.
Bonada N, Zamora-Muñoz C, Rieradevall M, Prat N. 2005. Ecologicaland historical filters constraining spatial caddisfly distribution inMediterranean rivers. Freshwater Biology 50: 781–797.
Boon PJ, Holmes NTH, Raven PJ. 2010. Developing standard approachesfor recording and assessing river hydromorphology: the role of theEuropean Committee for Standardization (CEN). Aquatic Conserva-tion: Marine and Freshwater Ecosystems 20: S55–S61.
Bournaud M, Cellot B, Richoux P, Berrahou A. 1996. Macroinvertebratecommunity structure and environmental characteristics along a largeriver: congruity of patterns for identification to species or family.Journal of the North American Benthological Society 15: 232–253.
Boyero L. 2003. Multiscale patterns of spatial variation in streammacroinvertebrate communities. Ecological Research 18: 365–379.
Brooks AJ, Haeusler T, Reinfelds I, Williams S. 2005. Hydraulicmicrohabitats and the distribution of macroinvertebrate assemblages inriffles. Freshwater Biology 50: 331–344.
Buffagni A, Erba S. 2007. Macroinvertebrati acquatici e Direttiva 2000/60/EC (WFD). Parte A. Metodo di campionamento per i fiumi guadabili.Notiziario dei Metodi Analitici, Vol 1. IRSA-CNR, Roma, Italy.
Buffagni A, Erba S, Aquilano G, Armanini D, Beccari C, Casalegno C,Cazzola M, Demartini D, Gavazzi N, Kemp JL, Mirolo N, Rusconi M.2007. Macroinvertebrati acquatici e Direttiva 2000/60/EC (WFD).Notiziario dei Metodi Analitici, Vol. 1, IRSA-CNR, Roma, Italy.
Bunn SE, Arthington AH. 2002. Basic principles and ecologicalconsequences of altered flow regimes for aquatic biodiversity.Environmental Management 30: 492–507.
Burt T, Hefting MM, Pinay G, Sabater S. 2008. The role of floodplains inmitigating diffuse nitrate pollution. In Hydroecology and ecohydrology:past, present and future, Wood PJ, Hannah DM, Sadler JP (eds). JohnWiley & Sons, Ltd: Chichester, UK.
Burt T, Pinay G, Sabater S 2010. What do we still need to know about theecohydrology of riparian zones? Ecohydrology 3: 373–377
Cairns JJR, Dickson KL. 1971. A simple method for the biologicalassessment of the effects of waste discharges on aquatic bottom-dwelling organism. Journal of Water Pollution Control Federation 43:755–772.
Ecohydrol. (2012)

HYDROMORPHOLOGICAL CONSTRAINTS ON MACROINVERTEBRATE COMMUNITIES
Carling PA. 1992. The nature of the fluid boundary layer and the selectionof parameters for benthic ecology. Freshwater Biology 28: 273–284.
Chessel D. 2011. ade4 package. Version 1.4-17. Analysis of EcologicalData: Exploratory and Euclidean methods in Environmental sciences.Documentation for R: a language and environment for statisticalcomputing. R Foundation for Statistical Computing, Vienna, Austria.http://www.r-project.org
Clarke KR. 1993. Non-parametric multivariate analyses of changes incommunity structure. Australian Journal of Ecology 18: 117–143.
Cogerino L, Cellot B, Bournaud M. 1995. Microhabitat diversity andassociated macroinvertebrates in aquatic banks of a large Europeanriver. Hydrobiologia 304: 103–115.
Colwell RK, Coddington JA. 1994. Estimating terrestrial biodiversitythrough extrapolation. Philosophical Transactions of the Royal Societyof London 345: 101–118.
Copp GH. 1990. Effect of regulation on 0+ fish recruitment in the GreatOuse, a lowland river. Regulated Rivers: Research & Management 5:251–263.
De Cáceres M. 2011. Indicspecies package. Version 1.5.2. Functions toassess the strength and significance of relationship of species site groupassociations. Documentation for R: a language and environment forstatistical computing. R Foundation for Statistical Computing, Vienna,Austria. http://www.r-project.org
De Cáceres M, Legendre P. 2009. Associations between speciesand groups of sites: indices and statistical inference. Ecology 90:3566–3574.
Dolédec S, Statzner B, Frainay V. 1998. Accurate description offunctional community structure: identifying stream invertebrates tospecies-level? Bulletin of North American Benthological Society 15:154–155.
Dray S, Legendre P. 2008. Testing the species traits-environment relation-ships: the fourth-corner problem revisited. Ecology 89: 3400–3412.
Dufrêne M, Legendre P. 1997. Species assemblages and indicator species:the need for a flexible asymmetrical approach. Ecological Monographs67: 345–366.
European Commission 2000. Directive 2000/60/EC of the EuropeanParliament and of the Council of 23 October 2000. Establishing aframework for community action in the field of water policy officialjournal 22 December 2000L 327/1. European Commission: Brussels.
Extence CA, Balbi DM, Chadd RP. 1999. River flow indexing usingbenthic macroinvertebrate: a framework for setting hydrobiologicalobjectives. Regulated Rivers: Research & Management 15: 543–574.
Galbraith HS, Vaughn CC. 2011. Effects of reservoir management onabundance, condition, parasitism and reproductive traits of downstreammussels. River Research and Applications 27: 193–201.
Garcia XF, Schnauder I, Pusch MT. 2012. Complex hydromorphology ofmeanders can support benthic invertebrate diversity in rivers. Hydro-biologia 685: 49–68.
Gaston KJ. 1996. Species richness: measure and measurement. InBiodiversity: a biology of numbers and difference, KJ Gaston (ed.).Blackwell Science: Oxford; 77–113.
Gjerløv C, Hildrew AG, Jones JI. 2003. Mobility of streaminvertebrates in relation to disturbance and refugia: a test of habitattemplet theory. Journal of the North American BenthologicalAssociation 22: 207–223.
Gore JA, Layzer JB, Mead J. 2001. Macroinvertebrate instream flow studyafter 20 years: a role in stream management and restoration. RegulatedRivers: Research & Management 17: 527–542.
Heino J, Soininen J. 2007. Are higher taxa adequate surrogates forspecies-level assemblage patterns and species richness in streamorganisms? Biological Conservation 137: 78–89.
Heppner CS, Loague K. 2008. A dam problem: simulated upstreamimpacts for a Searsville-like watershed. Ecohydrology 1: 408–424.
Irz P, Odion M, Argillier C, Pont D. 2006. Comparison between the fishcommunities of lakes, reservoirs and rivers: can natural systemshelp define the ecological potential of reservoirs? Aquatic Sciences 68:109–116.
Jackson RB, Jobbágy EG, Nosetto MD. 2009. Ecohydrology in a human-dominated landscape. Ecohydrology 2: 383–389.
Jansson R, Nilsson C, Renöfält B. 2000. Fragmentation of riparian florasin rivers with multiple dams. Ecology 81: 899–903.
Jiménez-Valverde A, Hortal J. 2003. Las curvas de acumulación deespecies y la necesidad de evaluar la calidad de los inventariosbiológicos. Revista Ibérica de Aracnología 8: 151–161.
Jimenez-Valverde A, Mendoza S, Cano J, Munguira M. 2006. Comparingrelative model fit of several species-accumulation functions to localPapilionoidea and Hesperioidea butterfly inventories of Mediterraneanhabitats. Biodiversity and Conservation 1: 163–176.
Copyright © 2012 John Wiley & Sons, Ltd.
Kennen JG, Riva-Murray K, Beaulieu KM. 2010. Determining hydrologicfactors that influence stream macroinvertebrate assemblages in thenortheastern US. Ecohydrology 3: 88–106.
Laini A, Bartoli M, Castaldi S, Viaroli P, Capri E, Trevisan M. 2011.Greenhouse gases (CO2, CH4 and N2O) in lowland springs within anagricultural impacted watershed (Po River plain, northern Italy).Chemistry and Ecology 27: 177–187.
Legendre P, Galzin R, Harmelin-Vivien M. 1997. Relating behavior tohabitat: solutions to the fourthcorner problem. Ecology 78: 547–562.
Leigh C, Sheldon F. 2009. Hydrological connectivity drives patterns ofmacroinvertebrate biodiversity in floodplain rivers of the Australianwet/dry tropics. Freshwater Biology 54: 549–571.
Lessard JL, Hayes DB. 2003. Effects of elevated water temperature on fishand macroinvertebrate communities below small dams. River Researchand Applications 19: 721–732.
Ligon FK, Dietrich WE, Trush WJ. 1995. Downstream ecological effectsof dams. BioScience 45: 183–192.
Marchant R, Barmuta LA, Chessman BC. 1995. Influence of samplequantification and taxonomic resolution on the ordination of macro-invertebrate communities from running waters in Victoria, Australia.Marine and Freshwater Research 46: 501–506.
Mérigoux S, Lamouroux N, Olivier J, Dolédec S. 2009. Invertebratehydraulic preferences and predicted impacts of changes in discharge ina large river. Freshwater Biology 54: 1343–1356.
Merritt RW, Lawson DL. 1992. The role of leaf litter macroinvertebratesin stream-floodplain dynamics. Hydrobiologia 248: 65–77.
Merritt RW, Cummins KW, Burton TM. 1984. The role of aquatic insectsin the cycling of nutrients. In The Ecology of Aquatic Insects, Resh VH,Rosenberg DM (eds). Praeger Publishers: New York; 134–163.
MonkWA,Wood PJ, HannahDM, Extence CA, ChaddRP, DunbarMJ. 2012.Howdoesmacroinvertebrate taxonomic resolution influence ecohydrologicalrelationships in riverine ecosystems. Ecohydrology 5: 36–45.
Nilsson C, Berggren K. 2000. Alterations of riparian ecosystems causedby river regulation. BioScience 50: 783–792.
Odum EP. 1997. Ecology: a bridge between science and society. SinauerAssociates Incorporated: Sunderland, MA; 330.
Oksanen J. 2011. The Vegan package. Version 1.17–11. CommunityEcology Package. Documentation for R: a language and environmentfor statistical computing. R Foundation for Statistical Computing,Vienna, Austria. http://www.r-project.org
Olden JD, Naiman RJ. 2010. Incorporating thermal regimes intoenvironmental flows assessments: modifying dam operations to restorefreshwater ecosystem integrity. Freshwater Biology 55: 86–107.
Pinardi M, Bartoli M, Longhi D, Viaroli P. 2011. Net autotrophy in afluvial lake: The relative role of phytoplankton and floating-leavedmacrophytes. Aquatic Sciences 73: 389–403.
Poff NL, Olden JD, Merritt DM, Pepin DM. 2007. Homogenization ofregional river dynamics by dams and global biodiversity implications.Proceedings of the National Academy of Sciences of the United Statesof America 104: 5732–5737.
Poff NL, Zimmerman JH. 2010. Ecological responses to altered flowregimes: a literature review to inform the science and management ofenvironmental flows. Freshwater Biology 55: 194–205.
Power ME, Dietrich WE, Finlay JC. 1996. Dams and downstream aquaticbiodiversity: potential food web consequences of hydrologic andgeomorphic change. Environmental Management 20: 887–895.
Pringle CM. 1997. Exploring how disturbance is transmitted upstream:Going against the flow. Journal of the North American BenthologicalSociety 16: 425–438.
Pringle CM, Freeman MC, Freeman BJ. 2000. Regional effects ofhydrologic alterations on riverine macrobiota in the new world:tropical–temperate comparisons. BioScience 50: 807–823.
R-Development-Core-Team. 2010. R: A Language and Environment forStatistical Computing, Vienna.
Rempel LL, Richardson JS, Healey MC. 2000. Macroinvertebratecommunity structure along gradients of hydraulic and sedimentaryconditions in a large gravel-bed river. Freshwater Biology 45: 57–73.
Renöfält BM, Jansson R, Nilsson C. 2010. Effects of hydropowergeneration and opportunities environmental flow management inSwedish ecosystems. Freshwater Biology 55: 49–67.
Ribera I. 2008. Habitat constraints and the generation of diversity infreshwater macroinvertebrates. In Aquatic insects: challengesto populations, Lancaster J, Briers RA (ed.). CAB International:Wallingford, UK; 289–311.
Rosenberg DM, McCully P, Pringle CM. 2000. Global-scale environmentaleffects of hydrological alterations: introduction. BioScience 50: 746–751.
Sánchez-Fernandez D, Abellán P, Mellado A, Velasco J, Millán A. 2006.Are water beetles good indicators of biodiversity in Mediterranean
Ecohydrol. (2012)

S. GUARESCHI et al.
aquatic ecosystems? The case of Segura river basin (SE Spain).Biodiversity and Conservation 15: 4507–4520.
Sánchez-Fernández D, Lobo JM, Abellán P, Ribera I, Millán A. 2008.Bias in freshwater biodiversity sampling: the case of Iberian waterbeetles. Diversity and Distributions 14: 754–762.
Soana E, Racchetti E, Laini A, Bartoli M, Viaroli P. 2011. Soil budget, netexport, and potential sinks of nitrogen in the lower Oglio Riverwatershed (northern Italy). CLEAN- Soil, Air, Water 39: 956–965.
Soberón J, Llorente J. 1993. The use of species accumulation functions forthe prediction of species richness. Conservation Biology 7: 480–488
Solimini AG, Gulia P, Monfrinotti M, Carchini G. 2000. Performance ofdifferent biotic indices and sampling methods in assessing water quality inthe lowland stretch of the Tiber River. Hydrobiologia 422–423: 197–208.
Sparks RE. 1995. Need for ecosystems management of large rivers andtheir floodplains. BioScience 45: 168–182.
St. Louis VL, Kelly CA, Duchemin E, Rudd JWM, Rosenberg DM. 2000.Reservoir Surfaces as Sources of Greenhouse Gases to the Atmosphere:A Global Estimate. BioScience 50: 766–775.
Stanford JA, Ward J. 2001. Revisiting the serial discontinuity concept.Regulated Rivers: Research & Management 17: 303–310.
Stanford JA, Ward JV, Liss WJ, Frissell CA, Williams RN, LichatowichJA, Coutant CC. 1996. A general protocol for restoration of regulatedrivers. Regulated Rivers: Research & Management 12: 391–413.
Statzner B, Gore JA, Resh VH. 1988. Hydraulic stream ecology: observedpatterns and potential applications. Journal of the North AmericanBenthological Society 7: 307–360.
Syvitski JPM, Vörösmarty CJ, Kettner AJ, Green P. 2005. Impact ofhumans on the flux of terrestrial sediment to the global coastal ocean.Science 308: 376–380.
Copyright © 2012 John Wiley & Sons, Ltd.
Tachet H, Richoux P, Bournaud M, Usseglio-Polatera P. 2002. Invertébrésd’Eau Douce: systématique, biologie, écologie. CNRS éditions: Paris,France.
Tjørve E. 2003. Shapes and functions of species–area curves: a review ofpossible models. Journal of Biogeography 30: 827–835.
Usseglio-Polatera P, Bournaud M, Richoux P, Tachet H. 2000. Biologicaland ecological traits of benthic freshwater macroinvertebrates: relation-ships and definition of groups with similar traits. Freshwater Biology43: 175–205.
Vannote RL, Wayne Minshall G, Cummins KW, Sedell JR, Cushing CE.1980. The River Continuum Concept. Canadian Journal of Fisheriesand Aquatic Sciences 37: 130–137.
Vaughan IP, Diamond M, Gurnell AM, Hall KA, Jenkins A, Milner NJ,Naylor LA, Sear DA, Woodward G, Ormerod SJ. 2009. Integratingecology with hydromorphology: a priority for river science andmanagement. Aquatic Conservation: Marine and Freshwater Ecosystems19: 113–125.
Ward JV, Stanford JA. 1983. The serial discontinuity concept of loticecosystems. In Dynamics of Lotic Ecosystems, Fontaine TD, Bartell SM(eds). Ann Arbor Science: Ann Arbor, MI; 29–42.
Ward JV, Stanford JA. 1987. The ecology of regulated streams: Pastaccomplishments and directions for future research. In RegulatedStreams Advances in Ecology Craig JF, Kemper JB (eds). PlenumPress: New York; 391–409.
Williams P, Whitfield M, Biggs J, Bray S, Fox G, Nicolet P, Sear D. 2003.Comparative biodiversity of rivers, streams, ditches andponds in an agriculturallandscape in Southern England. Biological Conservation 115: 329–341.
Zolezzi G, Siviglia A, ToffolonM,Maiolini B. 2011. Thermopeaking in Alpinestreams: event characterization and time scales. Ecohydrology 4: 564–576.
Ecohydrol. (2012)
Copyright © 2022 FDOKUMEN