The effect of the Glu342Lys mutation in 1-antitrypsin on its struc- ture, studied by molecular...
11
The effect of the Glu342Lys mutation in a 1 -antitrypsin on its struc- ture, studied by molecular modelling methods *+. Grzegorz Jezierski ½ and Marta Pasenkiewicz-Gierula Biophysics Department, Institute of Molecular Biology, Jagiellonian University, Kraków, Poland Received: 8 January, 2001; revised: 26 January, 2001; accepted: 6 February, 2001 Key words: molecular dynamics simulation, energy minimisation, serpins, protein structure The structure of native a 1 -antitrypsin, the most abundant protease inhibitor in human plasma, is characterised primarily by a reactive loop containing the centre of proteinase inhibition, and a b-sheet composed of five strands. Mobility of the reactive loop is confined as a result of electrostatic interactions between side chains of Glu342 and Lys290, both lo- cated at the junction of the reactive loop and the b structure. The most common mutation in the protein, resulting in its inactivation, is Glu342®Lys, named the Z mutation. The main goal of this work was to investigate the influence of the Z mutation on the structure of a 1 -antitrypsin. Commonly used molecular modelling methods have been ap- plied in a comparative study of two protein models: the wild type and the Z mutant. The results indicate that the Z mutation introduces local instabilities in the region of the reactive loop. Moreover, even parts of the protein located far apart from the mutation re- gion are affected. The Z mutation causes a relative change in the total energy of about 3%. Relatively small root mean square differences between the optimised structures of the wild type and the Z mutant, together with detailed analysis of ‘conformational searching’ process, lead to the hypothesis that the Z mutation principally induces a change in the dy- namics of a 1 -antitrypsin. Human a 1 -antitrypsin is a serine proteinase in- hibitor belonging to the group of serpins [1, 2]. It is the most abundant protease inhibitor in human plasma, and is widely investigated at present [3–6]. Structural features characteristic of serpins and crucial for biological function of a 1 -antitrypsin include: u a reactive loop, exposed to solvent and con- taining the centre of proteinase inhibition (see Fig. 1), Vol. 48 No. 1/2001 65–75 QUARTERLY * Presented at the International Conference on “Conformation of Peptides, Proteins and Nucleic Acids”, Debrzyno, Po- land, 2000. + The calculations were performed at the Interdisciplinary Centre for Mathematical Modelling, Warsaw, Poland, on Cray T3E ‘Tsunami’. . This work has been supported by the State Committee for Scientific Research (KBN); grant no. 4 P05A 081 14. ½ Corresponding author: Grzegorz Jezierski, Institute of Molecular Biology, al. A. Mickiewicza 3, 31-120 Kraków, Poland; phone: (12) 6341305, ext. 291, fax: 6336907, e-mail: [email protected] Abbreviations: AMBER, assisted model building for energy refinement; MD, molecular dynamics; FFT, fast Fourier transform; NMR, nuclear magnetic resonance; OPLS, optimized potentials for liquid simulations; r.m.s., root mean square; r.m.s.d., root mean square displacement.
-
Upload
independent -
Category
Documents
-
view
0 -
download
0
Transcript of The effect of the Glu342Lys mutation in 1-antitrypsin on its struc- ture, studied by molecular...
The effect of the Glu342Lys mutation in �1-antitrypsin on its struc-
ture, studied by molecular modelling methods���
Grzegorz Jezierski� and Marta Pasenkiewicz-Gierula
Biophysics Department, Institute of Molecular Biology, Jagiellonian University, Kraków, Poland
Received: 8 January, 2001; revised: 26 January, 2001; accepted: 6 February, 2001
Key words: molecular dynamics simulation, energy minimisation, serpins, protein structure
The structure of native �1-antitrypsin, the most abundant protease inhibitor in human
plasma, is characterised primarily by a reactive loop containing the centre of proteinase
inhibition, and a �-sheet composed of five strands. Mobility of the reactive loop is confined
as a result of electrostatic interactions between side chains of Glu342 and Lys290, both lo-
cated at the junction of the reactive loop and the � structure. The most common mutation
in the protein, resulting in its inactivation, is Glu342�Lys, named the Z mutation.
The main goal of this work was to investigate the influence of the Z mutation on the
structure of �1-antitrypsin. Commonly used molecular modelling methods have been ap-
plied in a comparative study of two protein models: the wild type and the Z mutant.
The results indicate that the Z mutation introduces local instabilities in the region of the
reactive loop. Moreover, even parts of the protein located far apart from the mutation re-
gion are affected. The Z mutation causes a relative change in the total energy of about 3%.
Relatively small root mean square differences between the optimised structures of the
wild type and the Z mutant, together with detailed analysis of ‘conformational searching’
process, lead to the hypothesis that the Z mutation principally induces a change in the dy-
namics of �1-antitrypsin.
Human �1-antitrypsin is a serine proteinase in-
hibitor belonging to the group of serpins [1, 2]. It
is the most abundant protease inhibitor in human
plasma, and is widely investigated at present
[3–6]. Structural features characteristic of
serpins and crucial for biological function of
�1-antitrypsin include:�a reactive loop, exposed to solvent and con-
taining the centre of proteinase inhibition
(see Fig. 1),
Vol. 48 No. 1/2001
65–75
QUARTERLY
�Presented at the International Conference on “Conformation of Peptides, Proteins and Nucleic Acids”, Debrzyno, Po-
land, 2000.�
The calculations were performed at the Interdisciplinary Centre for Mathematical Modelling, Warsaw, Poland, on Cray
T3E ‘Tsunami’.�
This work has been supported by the State Committee for Scientific Research (KBN); grant no. 4 P05A 081 14.�
Corresponding author: Grzegorz Jezierski, Institute of Molecular Biology, al. A. Mickiewicza 3, 31-120 Kraków, Poland;
phone: (12) 6341305, ext. 291, fax: 6336907, e-mail: [email protected]
Abbreviations: AMBER, assisted model building for energy refinement; MD, molecular dynamics; FFT, fast Fourier
transform; NMR, nuclear magnetic resonance; OPLS, optimized potentials for liquid simulations; r.m.s., root mean
square; r.m.s.d., root mean square displacement.
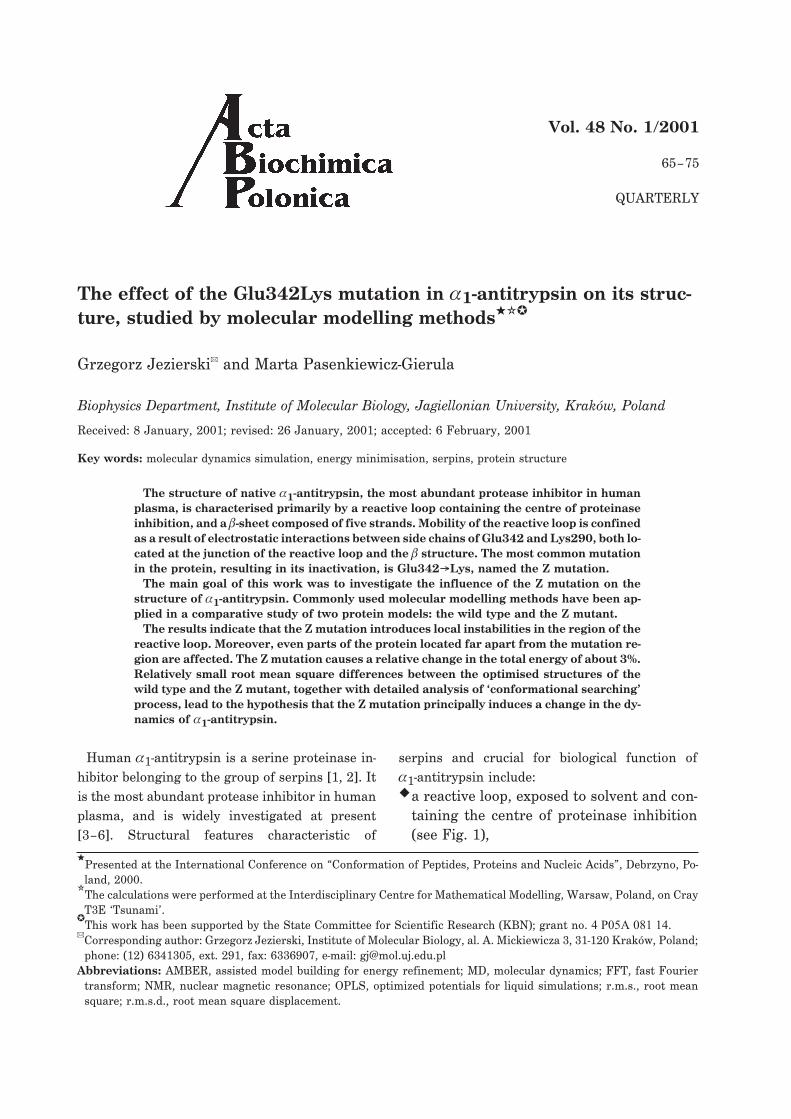
�a large A sheet consisting of 5 �-strands
(see Fig. 6a),�a small C sheet consisting of 4 �-strands
and linked strictly to the A sheet (see
Fig. 1).
Mobility of the reactive loop is confined as a re-
sult of electrostatic interactions between side
chains of Glu342 and Lys290, both located at the
junction of the reactive loop and the � structure
(see Fig. 6b). �1-Antitrypsin can adopt several
structural forms that differ mainly by conforma-
tion of the reactive loop. One of them is the native
form, which is able to inhibit proteinases and
which circulates in human plasma. Another is the
cleaved form, with a cleaved peptide bond on the
reactive loop and a part of the loop inserted to the
A sheet as a �-strand. Upon proteolytic cleavage
in the centre of inhibition or in its vicinity, the re-
active loop is broken into two strands; one of
them is incorporated into the five-stranded
�-sheet, thus forming a six-stranded �-sheet [7].
Three-dimensional structures of these two forms
were determined by X-ray diffraction [7, 8].
Numerous genetic variants of �1-antitrypsin
have been identified; many of them undergo spon-
taneous polymerisation, leading to retention of
the protein within hepatocytes and, in conse-
quence, to a decrease in its concentration in
plasma. This phenomenon causes several dis-
eases, most notably emphysema and liver cirrho-
sis [9–12]. The most common variant of
�1-antitrypsin, Glu342�Lys, named the Z variant
or — as in this paper — the Z mutant, is known to
polymerise in vivo [13] but has also been shown to
polymerise spontaneously in vitro [14]. The struc-
tural changes involved in polymerisation are not
known, although two crystal structures of poly-
merised �1-antitrypsin in its cleaved forms have
been reported [15, 16]. Based on these structures,
and on other experimental data [17] it is com-
monly assumed that the Z mutant polymerises by
insertion of a part of its reactive loop to the A
sheet of another molecule. In this way,
self-repeated units assemble into linear or circular
polymers. However, much evidence exists for an-
other mechanism of �1-antitrypsin polymerisa-
tion, in which the reactive loop interacts with the
C sheet of another molecule. Polymers of this type
are induced by sodium citrate or result from the
point mutation �Phe52 [18, 19].
Investigation of Glu342�Lys mutation in terms
of conformation of �1-antitrypsin is important for
understanding the mechanism of its polymerisa-
tion. Application of computational techniques
such as simulated annealing and energy minimi-
sation is, according to the authors of this paper,
justified by complementarity of these methods to
other methods of structural analysis (e.g. X-ray
diffraction, fluorometric methods).
66 G. Jezierski and M. Pasenkiewicz-Gierula 2001
A sheet
C sheetReactive loop
Fig. 1
s2C
hF
hI
hBhE
hA
hC
hH
hG
hD
Figure 1. Secondary structure of �1-antitrypsin in its
native form [8].
The picture shows �-helical (red cylinders) and �-struc-
tured (blue ribbons) fragments of the polypeptide chain.
The model was oriented so that all helices are visible.
There are nine helices, denoted hA, hB,..., hH; the G helix
is not shown as a cylinder but is indicated by an arrow. The
�-sheet situated on the right-hand side of the model, in ver-
tical position, is identified as ‘A sheet’. A small �-sheet,
identified as ‘C sheet’, is visible at the top of the model. It
contains strand No. 2, denoted s2C, which is coloured ma-
genta.
METHODS
The study comprised three stages: construction
of a model of the mutant, a protocol of ‘sequential’
simulated annealing, and energy minimisation of
structures obtained sequentially during the
course of simulation. Identical procedures were
carried out for the mutant and the wild type pro-
tein models.
1. The model of the Z mutant was constructed
based on the structure of �1-antitrypsin in its na-
tive (uncleaved) form [7]. The obtained structure
was minimised using the ‘steepest descents’ and
then the ‘conjugate gradients’ algorithm; 5000 it-
erations were calculated with each algorithm.
2. Each model was then subjected to a simulated
annealing protocol. The protocol included molecu-
lar dynamics (MD) simulation with temperature
changes (see Fig. 2). The temperature was in-
creased linearly from 10 K to 500 K during the
first 10 ps of the simulation. The resulting struc-
ture was simulated at 500 K for 10 ps (high tem-
perature MD) and then the temperature was de-
creased exponentially to 310 K during 40 ps
(‘cooling’). The protocol of a high temperature
MD and cooling was repeated 20 times, starting
from structures after 10, 20, 30, etc. ps of the high
temperature MD. This yielded 20 structures for
each of the two models.
3. Each of the 20 structures for each model was
optimised. For further studies, the structure of
the lowest energy and the lowest r.m.s. fluctua-
tion values was selected for each model. The se-
lected structures were those after 170 ps (struc-
ture no. 17) of the high temperature MD for the
wild type, and 140 ps (structure No. 14) — for the
mutant.
The protein was simulated with the OPLS united
atom force field [20]. In all simulations reported
here the cutoff radius was 12.0 Å. Distance de-
pendent dielectric ‘constant’ equal to 1.0 r was
used in order to account for solvent screening ef-
fects. It was assumed that including of explicit sol-
vent could destabilise the protein structure at 500
K, as a significant part of the polypeptide chain
was restrained with a flat-bottomed potential (see
below).
The algorithms for energy minimisation were
‘steepest descents’, and then ‘conjugate gradients’
— 10000 iterations were calculated with each algo-
rithm. These algorithms do not become unstable
when a structure is far from minimum, therefore
they are suitable for coarse minimisation of large
structures having many possible metastable con-
formations, e.g. proteins. No other algorithm was
applied as we did not intend to obtain a com-
pletely refined structure.
During simulated annealing procedure the
SHAKE [21] algorithm was applied for bonds in-
volving hydrogen, and 1 fs time step was used.
Constant temperature was controlled using the al-
gorithm of Berendsen [22].
During simulated annealing, dihedral angles
within the protein backbone were restrained with
soft parabolic-linear potential. For helical and
�-sheet fragments, the potential well was para-
bolic within � ± � rad around an actual dihedral
angle. For the remaining fragments, the potential
value was equal to zero within � ± (�/2) rad and
the potential well was parabolic outside this
range. For both potentials, the force constant was
equal to 600 kcal/(mol*rad2), and for angles ex-
ceeding � ± �, the potential values were scaled lin-
early with �. These restraints were applied to pre-
vent regions with clearly defined secondary struc-
ture from significant unfolding at high tempera-
ture. The restraints were imposed as imple-
mented in AMBER [23]. The parameters were ob-
tained based on procedures of structure determi-
nation by NMR and simulated annealing proto-
cols [24, 25], as well as on tests performed by G.J.
on a model tripeptide (to be published later).
Construction of the model (stage 1), visualisa-
tion procedures and protein drawings were made
using MSI software: InsightII (ver. 97.0) and
WebLab ViewerLite (ver. 3.5) [26]. Molecular dy-
namics simulations, energy minimisation and
most of data analysis were performed using the
AMBER software package (ver. 4.1) [23]. For com-
parative analyses of secondary structure, dia-
grams produced by DSSP program [27] were
used. DSSP was developed by Kabsch and
Sander, based on their classification of secondary
structures of proteins.
Vol. 48 Modelling of the Z mutation in antitrypsin 67
RESULTS AND DISCUSSION
Preliminary remarks
The goals of calculations described in this paper
were:
1. Analysis of conformational changes in the Z
mutant of �1-antitrypsin, during high tempera-
ture simulation, relative to changes in the wild
type.
2. Generation of a model of the Z mutant, which
would serve as a starting structure for further
simulations.
It has been assumed that the optimal protocol of
simulation in this time scale is to generate an MD
trajectory at high temperature and several trajec-
tories at temperatures decreasing from 500 K to
the physiological temperature. A plot of the sys-
tems temperature during generation of an ensem-
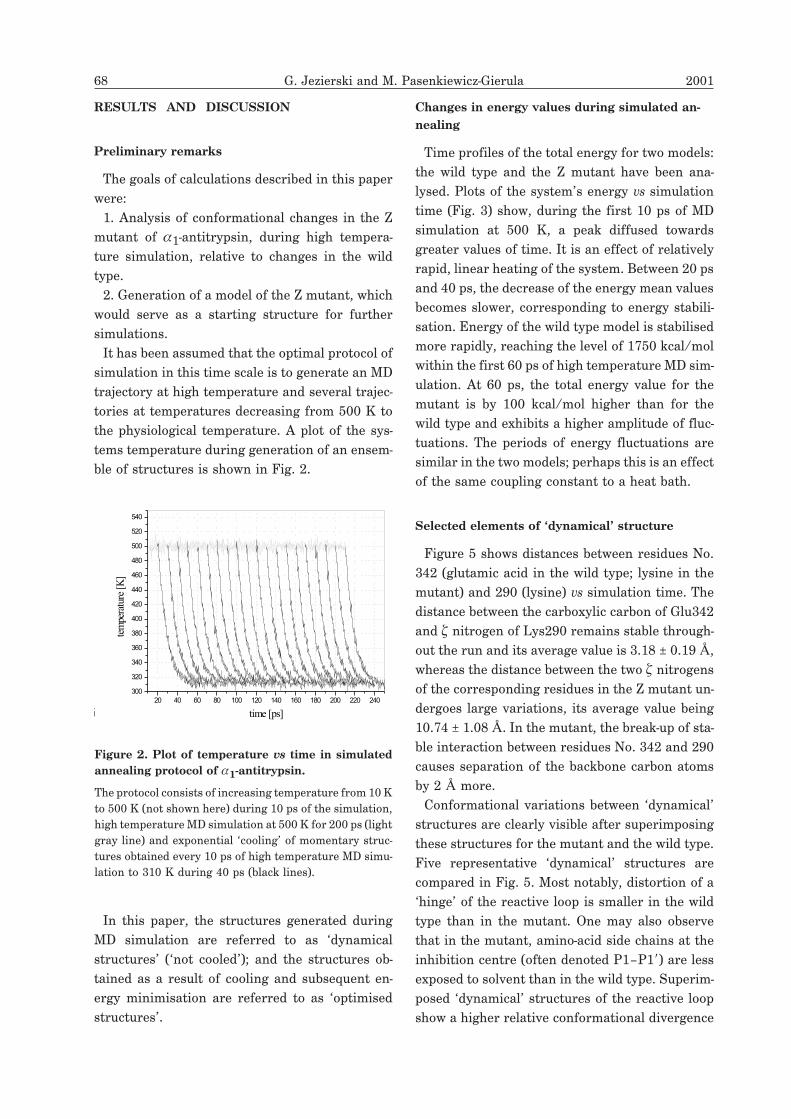
ble of structures is shown in Fig. 2.
In this paper, the structures generated during
MD simulation are referred to as ‘dynamical
structures’ (‘not cooled’); and the structures ob-
tained as a result of cooling and subsequent en-
ergy minimisation are referred to as ‘optimised
structures’.
Changes in energy values during simulated an-
nealing
Time profiles of the total energy for two models:
the wild type and the Z mutant have been ana-
lysed. Plots of the system’s energy vs simulation
time (Fig. 3) show, during the first 10 ps of MD
simulation at 500 K, a peak diffused towards
greater values of time. It is an effect of relatively
rapid, linear heating of the system. Between 20 ps
and 40 ps, the decrease of the energy mean values
becomes slower, corresponding to energy stabili-
sation. Energy of the wild type model is stabilised
more rapidly, reaching the level of 1750 kcal/mol
within the first 60 ps of high temperature MD sim-
ulation. At 60 ps, the total energy value for the
mutant is by 100 kcal/mol higher than for the
wild type and exhibits a higher amplitude of fluc-
tuations. The periods of energy fluctuations are
similar in the two models; perhaps this is an effect
of the same coupling constant to a heat bath.
Selected elements of ‘dynamical’ structure
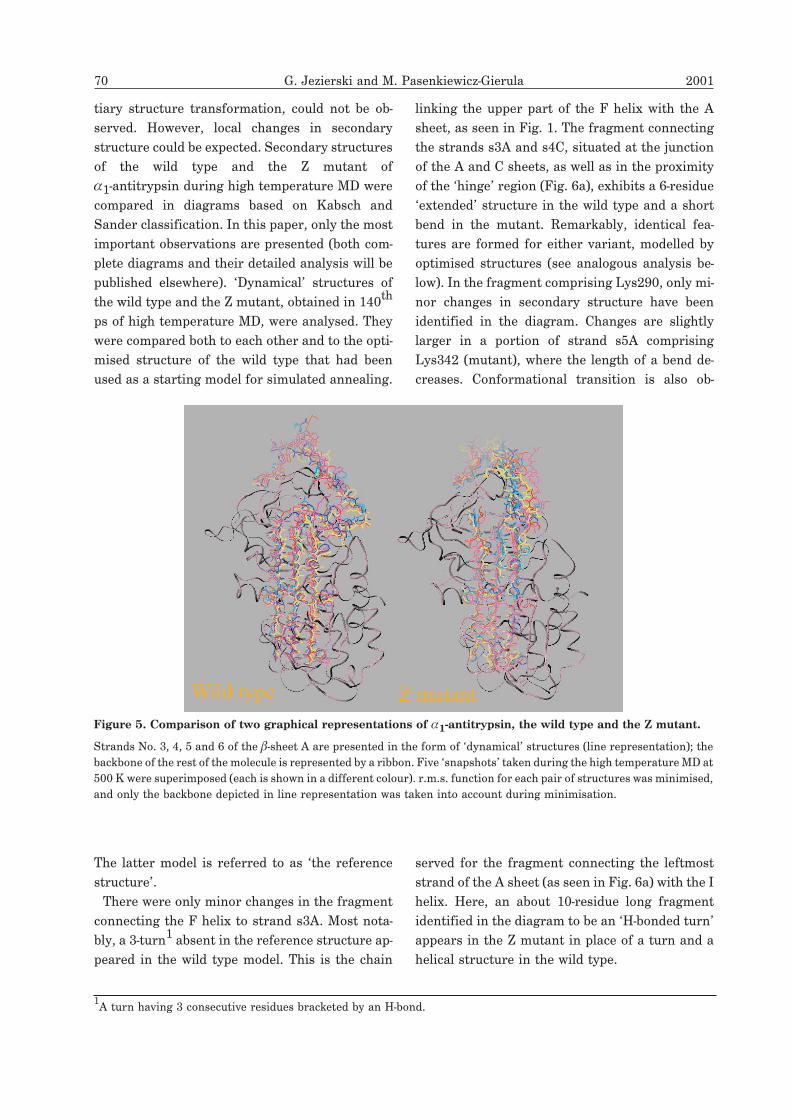
Figure 5 shows distances between residues No.
342 (glutamic acid in the wild type; lysine in the
mutant) and 290 (lysine) vs simulation time. The
distance between the carboxylic carbon of Glu342
and � nitrogen of Lys290 remains stable through-
out the run and its average value is 3.18 ± 0.19 Å,
whereas the distance between the two � nitrogens
of the corresponding residues in the Z mutant un-
dergoes large variations, its average value being
10.74 ± 1.08 Å. In the mutant, the break-up of sta-
ble interaction between residues No. 342 and 290
causes separation of the backbone carbon atoms
by 2 Å more.
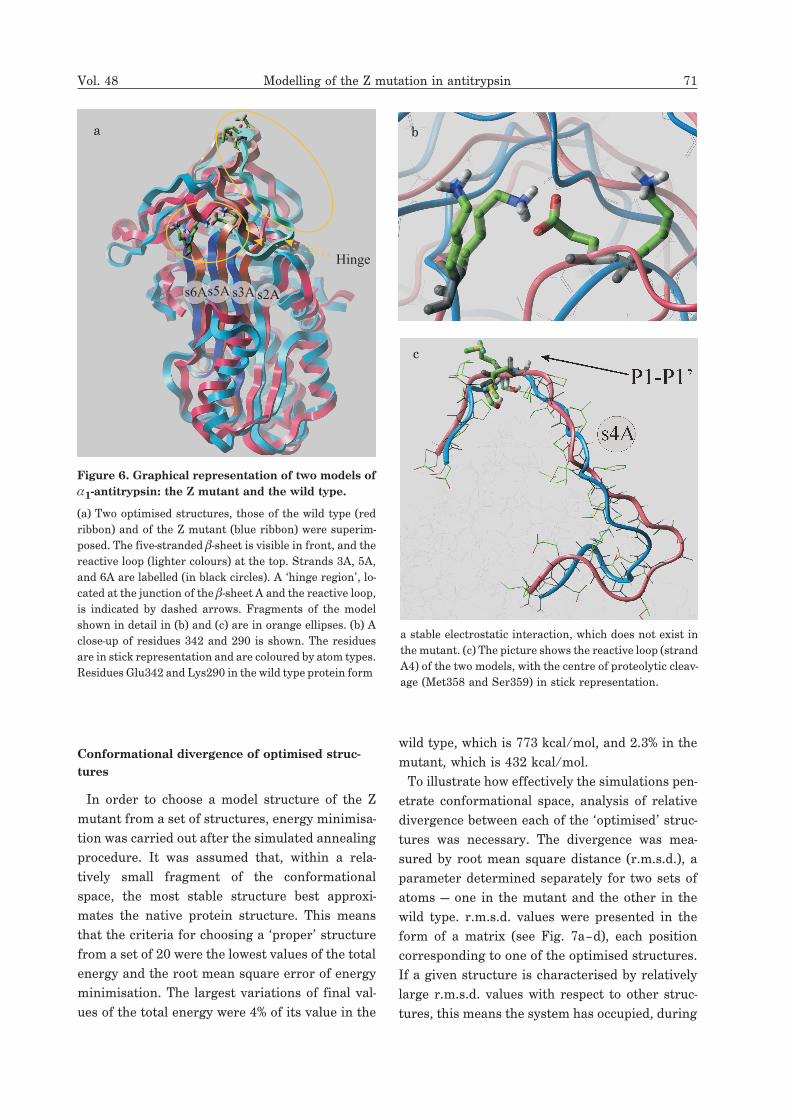
Conformational variations between ‘dynamical’
structures are clearly visible after superimposing
these structures for the mutant and the wild type.
Five representative ‘dynamical’ structures are
compared in Fig. 5. Most notably, distortion of a
‘hinge’ of the reactive loop is smaller in the wild
type than in the mutant. One may also observe
that in the mutant, amino-acid side chains at the
inhibition centre (often denoted P1–P1�) are less
exposed to solvent than in the wild type. Superim-
posed ‘dynamical’ structures of the reactive loop
show a higher relative conformational divergence
68 G. Jezierski and M. Pasenkiewicz-Gierula 2001
20 40 60 80 100 120 140 160 180 200 220 240
300
320
340
360
380
400
420
440
460
480
500
520
540
ig. 2
tem
pera
ture
[K]
time [ps]
Figure 2. Plot of temperature vs time in simulated
annealing protocol of �1-antitrypsin.
The protocol consists of increasing temperature from 10 K
to 500 K (not shown here) during 10 ps of the simulation,
high temperature MD simulation at 500 K for 200 ps (light
gray line) and exponential ‘cooling’ of momentary struc-
tures obtained every 10 ps of high temperature MD simu-
lation to 310 K during 40 ps (black lines).
as compared to the wild type. Interestingly, the
latter observation is not confirmed by root mean
square (r.m.s.) values of the best fit (quantitative
measurement of similarity of superimposed ‘dy-
namical’ structures). The r.m.s. values vary from
1.34 Å to 2.57 Å for the wild type model and from
1.23 Å to 2.33 Å for the mutant model (see Ta-
ble 1). This may be due to the way the values were
calculated, i.e. strands no. 3A, 4A, 5A and 6A
were taken together into account.
Secondary structure variation of ‘dynamical’
models
Due to limited MD simulation time, major
changes in conformation of the models, e.g. ter-
Vol. 48 Modelling of the Z mutation in antitrypsin 69
20 40 60 80 100 120 140 160 180 200
1600
1650
1700
1750
1800
1850
1900
1950
2000
2050
2100
2150
2200
Fig. 3
(a)
Total energy30-point FFT smoothing120-point FFT smoothing
Eto
t(t
)[kc
al/m
ol]
time [ps]
20 40 60 80 100 120 140 160 180 200
1600
1650
1700
1750
1800
1850
1900
1950
2000
2050
2100
2150
2200
Fig. 3
Total energy30-point FFT smoothing120-point FFT smoothing
(b)
Eto
t(t
)[kc
al/m
ol]
time [ps]
Figure 3. Plots of the total energy (Etot) vs time in the
simulated annealing protocol of �1-antitrypsin, dur-
ing MD simulation at 500 K.
Plots for the wild type (a) and the Z mutant (b) are shown
for comparison. The total energy curves (scatter plot, light
grey) smoothed by fast Fourier transform are shown (solid
lines). The smoothing is accomplished by removing Fou-
rier components with frequencies higher than 1/(n*ät)
where n is the number of data points considered at a time,
and ät is the time (or more generally the abscissa) spacing
between two adjacent data points. The function used to
clip out the high-frequency components is a parabola with
its maximum of 1 at zero frequency and falling to zero at
the cutoff frequency defined above. The parameters of this
parabolic clipping function are determined by the total
number of points and the number of points considered at
one time. The more points are considered at a time, the
greater is the degree of smoothing. 30-Point FFT smooth-
ing (grey line) illustrates a period of energy fluctuations,
here about 10 ps for both models. 120-Point FFT smooth-
ing (black line) represents approximately the running av-
erage of energy values during the simulation.
0 20 40 60 80 100 120 140 160 180 200
3
4
5
6
7
8
9
10
11
12
13
14
Fig. 4
(b)
C�- C� <d> = 9.94 +/- 0.85 [C]N�- N� <d> = 10.74 +/- 1.08 [C]
dist
ance
[C]
time [ps]
Figure 4. Plots of distances vs time between atoms in
residues No. 342 and 290 in the wild type (a) and the
Z mutant (b) of �1-antitrypsin.
Here are shown distances during the high temperature
MD simulation at 500 K (see Methods) between side-chain
(scatter plot) and backbone C� atoms (black line). Mean
values of distances with standard errors are given.
0 20 40 60 80 100 120 140 160 180 200
3
4
5
6
7
8
9
10
11
12
13
14
Fig. 4
C�- C� <d> = 8.17 +/- 0.52 [C]
(a)
C�- N� <d> = 3.18 +/- 0.19 [C]
dist
ance
[C]
time [ps]
[Å][Å]
[Å]
[Å]
[Å]
[Å]
tiary structure transformation, could not be ob-
served. However, local changes in secondary
structure could be expected. Secondary structures
of the wild type and the Z mutant of
�1-antitrypsin during high temperature MD were
compared in diagrams based on Kabsch and
Sander classification. In this paper, only the most
important observations are presented (both com-
plete diagrams and their detailed analysis will be
published elsewhere). ‘Dynamical’ structures of
the wild type and the Z mutant, obtained in 140th
ps of high temperature MD, were analysed. They
were compared both to each other and to the opti-
mised structure of the wild type that had been
used as a starting model for simulated annealing.
The latter model is referred to as ‘the reference
structure’.
There were only minor changes in the fragment
connecting the F helix to strand s3A. Most nota-
bly, a 3-turn1
absent in the reference structure ap-
peared in the wild type model. This is the chain
linking the upper part of the F helix with the A
sheet, as seen in Fig. 1. The fragment connecting
the strands s3A and s4C, situated at the junction
of the A and C sheets, as well as in the proximity
of the ‘hinge’ region (Fig. 6a), exhibits a 6-residue
‘extended’ structure in the wild type and a short
bend in the mutant. Remarkably, identical fea-
tures are formed for either variant, modelled by
optimised structures (see analogous analysis be-
low). In the fragment comprising Lys290, only mi-
nor changes in secondary structure have been
identified in the diagram. Changes are slightly
larger in a portion of strand s5A comprising
Lys342 (mutant), where the length of a bend de-
creases. Conformational transition is also ob-
served for the fragment connecting the leftmost
strand of the A sheet (as seen in Fig. 6a) with the I
helix. Here, an about 10-residue long fragment
identified in the diagram to be an ‘H-bonded turn’
appears in the Z mutant in place of a turn and a
helical structure in the wild type.
70 G. Jezierski and M. Pasenkiewicz-Gierula 2001
1A turn having 3 consecutive residues bracketed by an H-bond.
Wild type Z mutantFigure 5. Comparison of two graphical representations of �1-antitrypsin, the wild type and the Z mutant.
Strands No. 3, 4, 5 and 6 of the �-sheet A are presented in the form of ‘dynamical’ structures (line representation); the
backbone of the rest of the molecule is represented by a ribbon. Five ‘snapshots’ taken during the high temperature MD at
500 K were superimposed (each is shown in a different colour). r.m.s. function for each pair of structures was minimised,
and only the backbone depicted in line representation was taken into account during minimisation.
Conformational divergence of optimised struc-
tures
In order to choose a model structure of the Z
mutant from a set of structures, energy minimisa-
tion was carried out after the simulated annealing
procedure. It was assumed that, within a rela-
tively small fragment of the conformational
space, the most stable structure best approxi-
mates the native protein structure. This means
that the criteria for choosing a ‘proper’ structure
from a set of 20 were the lowest values of the total
energy and the root mean square error of energy
minimisation. The largest variations of final val-
ues of the total energy were 4% of its value in the
wild type, which is 773 kcal/mol, and 2.3% in the
mutant, which is 432 kcal/mol.
To illustrate how effectively the simulations pen-
etrate conformational space, analysis of relative
divergence between each of the ‘optimised’ struc-
tures was necessary. The divergence was mea-
sured by root mean square distance (r.m.s.d.), a
parameter determined separately for two sets of
atoms — one in the mutant and the other in the
wild type. r.m.s.d. values were presented in the
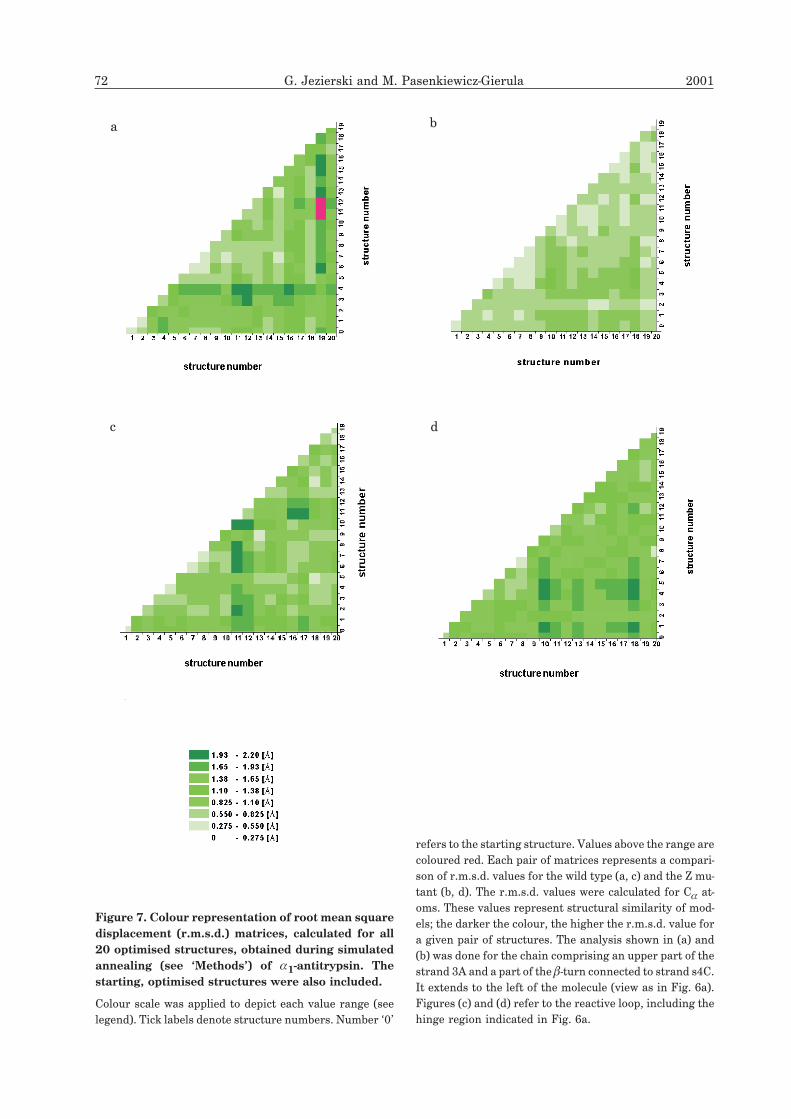
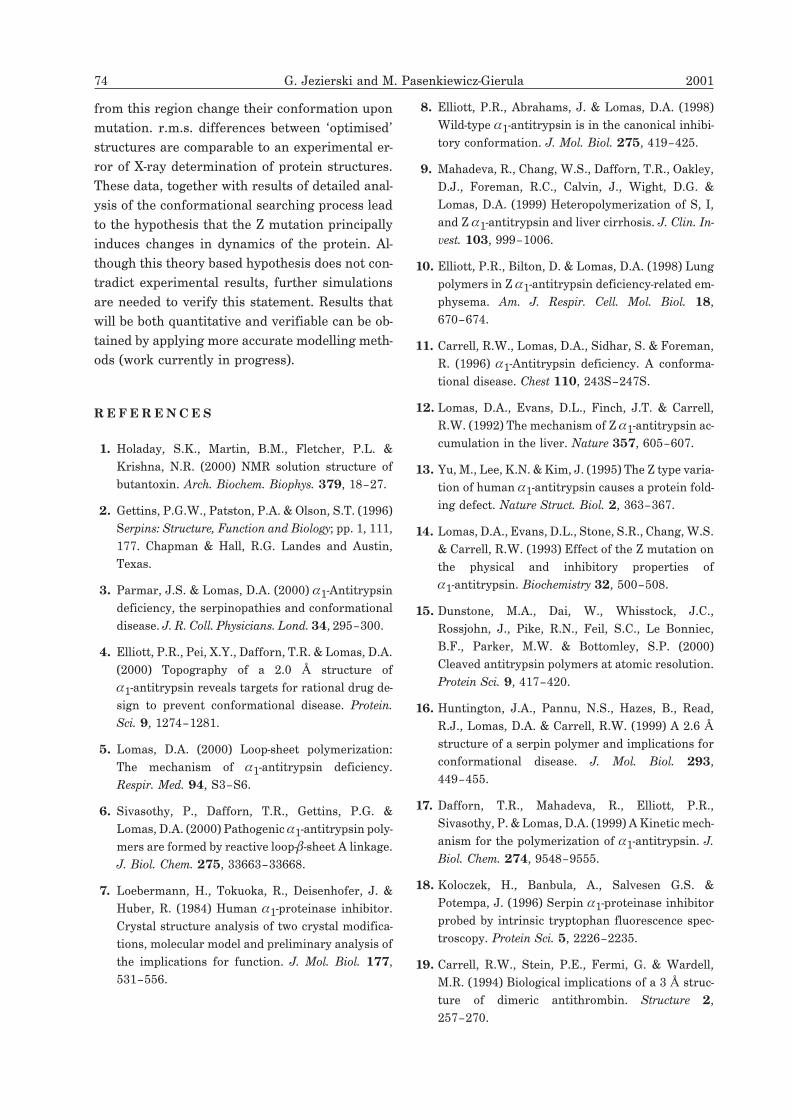
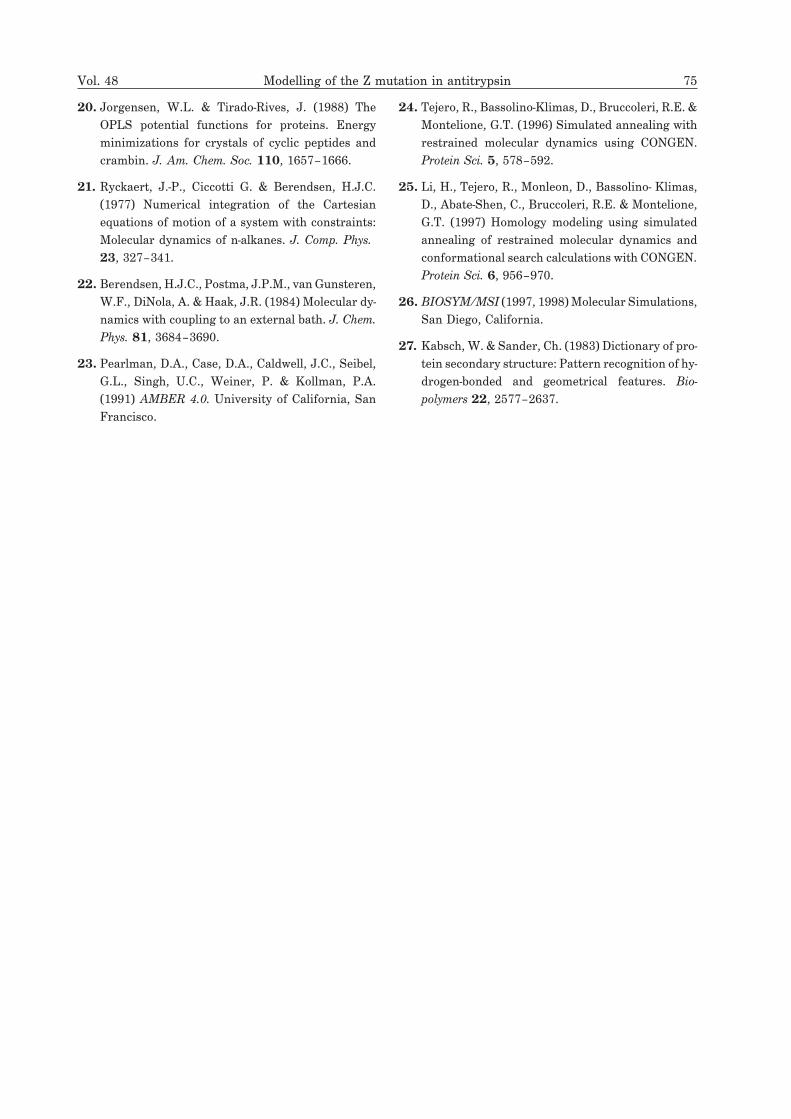
form of a matrix (see Fig. 7a–d), each position
corresponding to one of the optimised structures.
If a given structure is characterised by relatively
large r.m.s.d. values with respect to other struc-
tures, this means the system has occupied, during
Vol. 48 Modelling of the Z mutation in antitrypsin 71
Hinge
s6A s2As3As5A
Figure 6. Graphical representation of two models of
�1-antitrypsin: the Z mutant and the wild type.
(a) Two optimised structures, those of the wild type (red
ribbon) and of the Z mutant (blue ribbon) were superim-
posed. The five-stranded �-sheet is visible in front, and the
reactive loop (lighter colours) at the top. Strands 3A, 5A,
and 6A are labelled (in black circles). A ‘hinge region’, lo-
cated at the junction of the �-sheet A and the reactive loop,
is indicated by dashed arrows. Fragments of the model
shown in detail in (b) and (c) are in orange ellipses. (b) A
close-up of residues 342 and 290 is shown. The residues
are in stick representation and are coloured by atom types.
Residues Glu342 and Lys290 in the wild type protein form
a stable electrostatic interaction, which does not exist in
the mutant. (c) The picture shows the reactive loop (strand
A4) of the two models, with the centre of proteolytic cleav-
age (Met358 and Ser359) in stick representation.
a b
c
72 G. Jezierski and M. Pasenkiewicz-Gierula 2001
refers to the starting structure. Values above the range are
coloured red. Each pair of matrices represents a compari-
son of r.m.s.d. values for the wild type (a, c) and the Z mu-
tant (b, d). The r.m.s.d. values were calculated for C� at-
oms. These values represent structural similarity of mod-
els; the darker the colour, the higher the r.m.s.d. value for
a given pair of structures. The analysis shown in (a) and
(b) was done for the chain comprising an upper part of the
strand 3A and a part of the �-turn connected to strand s4C.
It extends to the left of the molecule (view as in Fig. 6a).
Figures (c) and (d) refer to the reactive loop, including the
hinge region indicated in Fig. 6a.
Figure 7. Colour representation of root mean square
displacement (r.m.s.d.) matrices, calculated for all
20 optimised structures, obtained during simulated
annealing (see ‘Methods’) of �1-antitrypsin. The
starting, optimised structures were also included.
Colour scale was applied to depict each value range (see
legend). Tick labels denote structure numbers. Number ‘0’
a b
c d
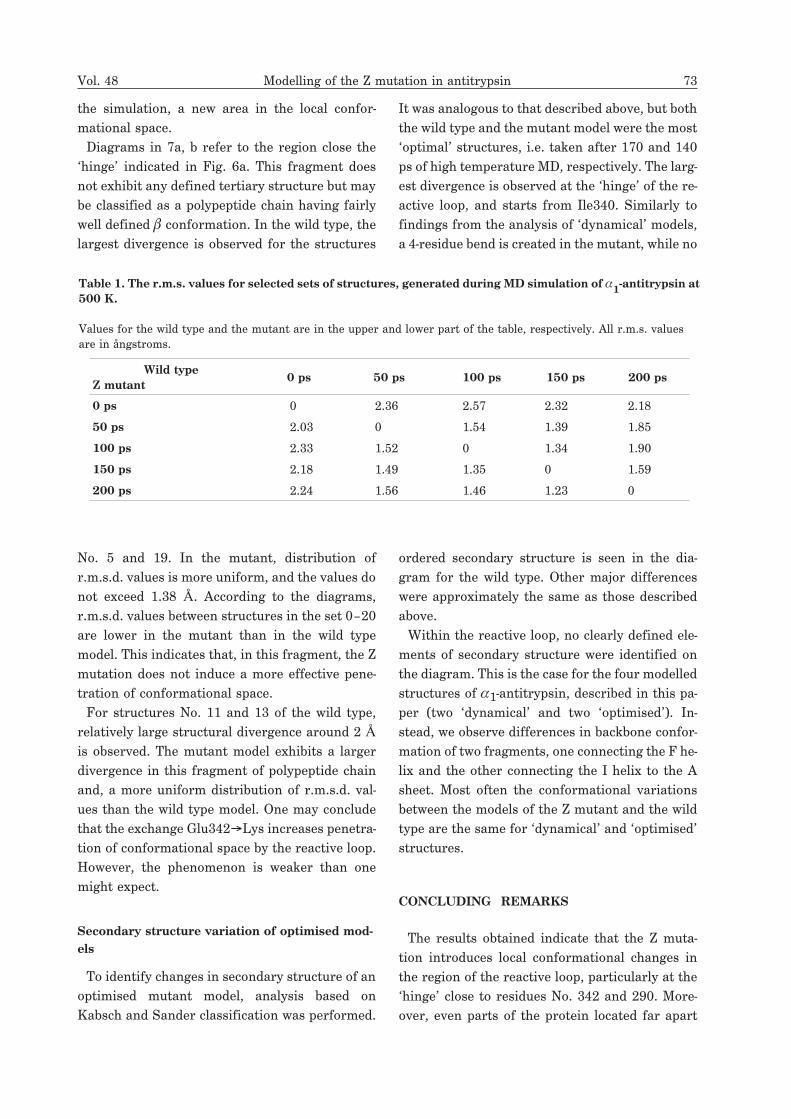
the simulation, a new area in the local confor-
mational space.
Diagrams in 7a, b refer to the region close the
‘hinge’ indicated in Fig. 6a. This fragment does
not exhibit any defined tertiary structure but may
be classified as a polypeptide chain having fairly
well defined � conformation. In the wild type, the
largest divergence is observed for the structures
No. 5 and 19. In the mutant, distribution of
r.m.s.d. values is more uniform, and the values do
not exceed 1.38 Å. According to the diagrams,
r.m.s.d. values between structures in the set 0–20
are lower in the mutant than in the wild type
model. This indicates that, in this fragment, the Z
mutation does not induce a more effective pene-
tration of conformational space.
For structures No. 11 and 13 of the wild type,
relatively large structural divergence around 2 Å
is observed. The mutant model exhibits a larger
divergence in this fragment of polypeptide chain
and, a more uniform distribution of r.m.s.d. val-
ues than the wild type model. One may conclude
that the exchange Glu342�Lys increases penetra-
tion of conformational space by the reactive loop.
However, the phenomenon is weaker than one
might expect.
Secondary structure variation of optimised mod-
els
To identify changes in secondary structure of an
optimised mutant model, analysis based on
Kabsch and Sander classification was performed.
It was analogous to that described above, but both
the wild type and the mutant model were the most
‘optimal’ structures, i.e. taken after 170 and 140
ps of high temperature MD, respectively. The larg-
est divergence is observed at the ‘hinge’ of the re-
active loop, and starts from Ile340. Similarly to
findings from the analysis of ‘dynamical’ models,
a 4-residue bend is created in the mutant, while no
ordered secondary structure is seen in the dia-
gram for the wild type. Other major differences
were approximately the same as those described
above.
Within the reactive loop, no clearly defined ele-
ments of secondary structure were identified on
the diagram. This is the case for the four modelled
structures of �1-antitrypsin, described in this pa-
per (two ‘dynamical’ and two ‘optimised’). In-
stead, we observe differences in backbone confor-
mation of two fragments, one connecting the F he-
lix and the other connecting the I helix to the A
sheet. Most often the conformational variations
between the models of the Z mutant and the wild
type are the same for ‘dynamical’ and ‘optimised’
structures.
CONCLUDING REMARKS
The results obtained indicate that the Z muta-
tion introduces local conformational changes in
the region of the reactive loop, particularly at the
‘hinge’ close to residues No. 342 and 290. More-
over, even parts of the protein located far apart
Vol. 48 Modelling of the Z mutation in antitrypsin 73
Table 1. The r.m.s. values for selected sets of structures, generated during MD simulation of �1-antitrypsin at
500 K.
Values for the wild type and the mutant are in the upper and lower part of the table, respectively. All r.m.s. values
are in ångstroms.
Wild type
Z mutant0 ps 50 ps 100 ps 150 ps 200 ps
0 ps 0 2.36 2.57 2.32 2.18
50 ps 2.03 0 1.54 1.39 1.85
100 ps 2.33 1.52 0 1.34 1.90
150 ps 2.18 1.49 1.35 0 1.59
200 ps 2.24 1.56 1.46 1.23 0
from this region change their conformation upon
mutation. r.m.s. differences between ‘optimised’
structures are comparable to an experimental er-
ror of X-ray determination of protein structures.
These data, together with results of detailed anal-
ysis of the conformational searching process lead
to the hypothesis that the Z mutation principally
induces changes in dynamics of the protein. Al-
though this theory based hypothesis does not con-
tradict experimental results, further simulations
are needed to verify this statement. Results that
will be both quantitative and verifiable can be ob-
tained by applying more accurate modelling meth-
ods (work currently in progress).
R E F E R E N C E S
1. Holaday, S.K., Martin, B.M., Fletcher, P.L. &
Krishna, N.R. (2000) NMR solution structure of
butantoxin. Arch. Biochem. Biophys. 379, 18–27.
2. Gettins, P.G.W., Patston, P.A. & Olson, S.T. (1996)
Serpins: Structure, Function and Biology; pp. 1, 111,
177. Chapman & Hall, R.G. Landes and Austin,
Texas.
3. Parmar, J.S. & Lomas, D.A. (2000) �1-Antitrypsin
deficiency, the serpinopathies and conformational
disease. J. R. Coll. Physicians. Lond. 34, 295–300.
4. Elliott, P.R., Pei, X.Y., Dafforn, T.R. & Lomas, D.A.
(2000) Topography of a 2.0 Å structure of
�1-antitrypsin reveals targets for rational drug de-
sign to prevent conformational disease. Protein.
Sci. 9, 1274–1281.
5. Lomas, D.A. (2000) Loop-sheet polymerization:
The mechanism of �1-antitrypsin deficiency.
Respir. Med. 94, S3–S6.
6. Sivasothy, P., Dafforn, T.R., Gettins, P.G. &
Lomas, D.A. (2000) Pathogenic �1-antitrypsin poly-
mers are formed by reactive loop-�-sheet A linkage.
J. Biol. Chem. 275, 33663–33668.
7. Loebermann, H., Tokuoka, R., Deisenhofer, J. &
Huber, R. (1984) Human �1-proteinase inhibitor.
Crystal structure analysis of two crystal modifica-
tions, molecular model and preliminary analysis of
the implications for function. J. Mol. Biol. 177,
531–556.
8. Elliott, P.R., Abrahams, J. & Lomas, D.A. (1998)
Wild-type �1-antitrypsin is in the canonical inhibi-
tory conformation. J. Mol. Biol. 275, 419–425.
9. Mahadeva, R., Chang, W.S., Dafforn, T.R., Oakley,
D.J., Foreman, R.C., Calvin, J., Wight, D.G. &
Lomas, D.A. (1999) Heteropolymerization of S, I,
and Z �1-antitrypsin and liver cirrhosis. J. Clin. In-
vest. 103, 999–1006.
10. Elliott, P.R., Bilton, D. & Lomas, D.A. (1998) Lung
polymers in Z �1-antitrypsin deficiency-related em-
physema. Am. J. Respir. Cell. Mol. Biol. 18,
670–674.
11. Carrell, R.W., Lomas, D.A., Sidhar, S. & Foreman,
R. (1996) �1-Antitrypsin deficiency. A conforma-
tional disease. Chest 110, 243S–247S.
12. Lomas, D.A., Evans, D.L., Finch, J.T. & Carrell,
R.W. (1992) The mechanism of Z �1-antitrypsin ac-
cumulation in the liver. Nature 357, 605–607.
13. Yu, M., Lee, K.N. & Kim, J. (1995) The Z type varia-
tion of human �1-antitrypsin causes a protein fold-
ing defect. Nature Struct. Biol. 2, 363–367.
14. Lomas, D.A., Evans, D.L., Stone, S.R., Chang, W.S.
& Carrell, R.W. (1993) Effect of the Z mutation on
the physical and inhibitory properties of
�1-antitrypsin. Biochemistry 32, 500–508.
15. Dunstone, M.A., Dai, W., Whisstock, J.C.,
Rossjohn, J., Pike, R.N., Feil, S.C., Le Bonniec,
B.F., Parker, M.W. & Bottomley, S.P. (2000)
Cleaved antitrypsin polymers at atomic resolution.
Protein Sci. 9, 417–420.
16. Huntington, J.A., Pannu, N.S., Hazes, B., Read,
R.J., Lomas, D.A. & Carrell, R.W. (1999) A 2.6 Å
structure of a serpin polymer and implications for
conformational disease. J. Mol. Biol. 293,
449–455.
17. Dafforn, T.R., Mahadeva, R., Elliott, P.R.,
Sivasothy, P. & Lomas, D.A. (1999) A Kinetic mech-
anism for the polymerization of �1-antitrypsin. J.
Biol. Chem. 274, 9548–9555.
18. Koloczek, H., Banbula, A., Salvesen G.S. &
Potempa, J. (1996) Serpin �1-proteinase inhibitor
probed by intrinsic tryptophan fluorescence spec-
troscopy. Protein Sci. 5, 2226–2235.
19. Carrell, R.W., Stein, P.E., Fermi, G. & Wardell,
M.R. (1994) Biological implications of a 3 Å struc-
ture of dimeric antithrombin. Structure 2,
257–270.
74 G. Jezierski and M. Pasenkiewicz-Gierula 2001
20. Jorgensen, W.L. & Tirado-Rives, J. (1988) The
OPLS potential functions for proteins. Energy
minimizations for crystals of cyclic peptides and
crambin. J. Am. Chem. Soc. 110, 1657–1666.
21. Ryckaert, J.-P., Ciccotti G. & Berendsen, H.J.C.
(1977) Numerical integration of the Cartesian
equations of motion of a system with constraints:
Molecular dynamics of n-alkanes. J. Comp. Phys.
23, 327–341.
22. Berendsen, H.J.C., Postma, J.P.M., van Gunsteren,
W.F., DiNola, A. & Haak, J.R. (1984) Molecular dy-
namics with coupling to an external bath. J. Chem.
Phys. 81, 3684–3690.
23. Pearlman, D.A., Case, D.A., Caldwell, J.C., Seibel,
G.L., Singh, U.C., Weiner, P. & Kollman, P.A.
(1991) AMBER 4.0. University of California, San
Francisco.
24. Tejero, R., Bassolino-Klimas, D., Bruccoleri, R.E. &
Montelione, G.T. (1996) Simulated annealing with
restrained molecular dynamics using CONGEN.
Protein Sci. 5, 578–592.
25. Li, H., Tejero, R., Monleon, D., Bassolino- Klimas,
D., Abate-Shen, C., Bruccoleri, R.E. & Montelione,
G.T. (1997) Homology modeling using simulated
annealing of restrained molecular dynamics and
conformational search calculations with CONGEN.
Protein Sci. 6, 956–970.
26. BIOSYM/MSI (1997, 1998) Molecular Simulations,
San Diego, California.
27. Kabsch, W. & Sander, Ch. (1983) Dictionary of pro-
tein secondary structure: Pattern recognition of hy-
drogen-bonded and geometrical features. Bio-
polymers 22, 2577–2637.
Vol. 48 Modelling of the Z mutation in antitrypsin 75