Photophysical properties of Re(pbt)(CO) 4 studied by high resolution spectroscopy
6
Photophysical properties of Re(pbt)(CO) 4 studied by high resolution spectroscopy Rafał Czerwieniec a , Walter J. Finkenzeller a , Thomas Hofbeck a , Alexander Starukhin a,b , Armin Wedel c , Hartmut Yersin a, * a Universität Regensburg, Institut für Physikalische und Theoretische Chemie, 93053 Regensburg, Germany b National Academy of Sciences of Belarus, Institute of Molecular and Atomic Physics, 220072 Minsk, Belarus c Fraunhofer Institut für Angewandte Polymerforschung, 14476 Potsdam, Germany article info Article history: Received 17 November 2008 In final form 26 November 2008 Available online 3 December 2008 abstract Photophysical properties of Re(pbt)(CO) 4 are investigated at cryogenic temperatures and high magnetic fields. The highly resolved spectra show that the zero field splitting of the lowest triplet T 1 into three sub- states is smaller than 2 cm 1 . With this result, the T 1 state can be classified as only slightly MLCT-per- turbed 3 LC ( 3 pp * ) state. Consistently, spin-lattice relaxation times are slow at T = 1.2 K and emission decay times with s I = 960 ls, s II = 320 ls, and s III = 24 ls are long due to only small singlet admixtures. The vibrational satellite structures observed reflect different vibrational deactivation mechanisms and reveal similar geometries of the emitting triplet and the ground state. Ó 2008 Elsevier B.V. All rights reserved. 1. Introduction Over the past years, phosphorescent transition metal complexes of Ru 2+ , Os 2+ , Ir 3+ , Pt 2+ , and Re + have gained importance with re- spect to various possible applications. Especially, the use of phos- phorescent emitters for organic light-emitting diodes (OLEDs) [1– 7] and sensors [8–10] is well established. These complexes emit from their lowest excited triplet state T 1 to the singlet ground state S 0 . The formally spin-forbidden T 1 ? S 0 transition gains allowed- ness due to spin–orbit coupling (SOC) of the emitting triplet state to higher lying 1 MLCT states. SOC is responsible for favorable emis- sion properties such as a short emission decay time and a high emission quantum yield (compare Refs. [11,12]). In particular Ir(III)-complexes often exhibit very suitable properties and thus are frequently applied as OLED emitters [1–7]. On the other hand, Re(I)-complexes have only rarely been considered as electrolumi- nescent materials [13–20], despite the fact that rhenium belongs to the third row of transition metals and thus the lowest triplet state of rhenium complexes could also experience strong SOC. It seems that Re(I)-complexes are less well suited for OLED applica- tions than Ir(III)-complexes. Since this circumstance is not readily understandable, it is worth to investigate photophysical properties of corresponding complexes in detail. Re(CO) 3 (a-diimine)(Cl) com- plexes have already been discussed extensively (for example, see Refs. [21–25]), while only a few investigations with complexes based on the Re(CO) 4 + fragment have been reported [26–30]. In this publication, the green light-emitting complex Re(pbt)(CO) 4 (pbt = 2-phenylbenzothiazole, in the literature also abbreviated as ‘bt’) is studied by means of high resolution site- selective spectroscopy. Re(pbt)(CO) 4 has first been reported in Ref. [30]. It exhibits a high emission quantum yield of 30% in a degassed acetonitrile solution and shows an emission decay time of 15 ls at ambient temperature. It is subject of this investigation to classify the emitting triplet state T 1 of Re(pbt)(CO) 4 according to its metal-to-ligand charge transfer (MLCT)/ligand-centered (LC) character on the basis of the magnitude of zero field splitting (ZFS) of the T 1 into substates. Moreover, the emission decay behav- ior of the substates I, II, and III, and the vibrational satellite structures observed in emission and excitation are investigated. The results are shortly discussed with respect to the behavior of the complex when applied in OLEDs. 2. Experimental section Re(pbt)(CO) 4 was prepared as described in Ref. [30] by reacting Re(CO) 5 Cl with 2-phenylbenzothiazole in boiling hexane continu- ously purged with Ar in the presence of a stoichiometric amount of proton scavenging 1,8-bis-(dimethylamino)naphthalene (proton sponge). The pure product was obtained by column chromatogra- phy on a neutral Al 2 O 3 eluted with hexane. IR spectra of Re(pbt)(CO) 4 were measured in a KBr pellet with a Perkin–Elmer Spectrum 2000 spectrometer and UV–vis absorption spectra were registered from a dichloromethane solution (c 5 10 5 mol/L) with a Varian Cary 300 double beam spec- trometer. Emission and excitation spectra at 300 K and 77 K were measured with a steady-state fluorescence spectrometer (Jobin Yvon Fluorolog 3). Low-temperature investigations were carried out in a helium bath cryostat, in which the temperature was regu- lated by control of the helium vapor pressure. The optical setup 0009-2614/$ - see front matter Ó 2008 Elsevier B.V. All rights reserved. doi:10.1016/j.cplett.2008.11.086 * Corresponding author. E-mail address: [email protected] (H. Yersin). Chemical Physics Letters 468 (2009) 205–210 Contents lists available at ScienceDirect Chemical Physics Letters journal homepage: www.elsevier.com/locate/cplett
-
Upload
uni-regensburg -
Category
Documents
-
view
1 -
download
0
Transcript of Photophysical properties of Re(pbt)(CO) 4 studied by high resolution spectroscopy

Chemical Physics Letters 468 (2009) 205–210
Contents lists available at ScienceDirect
Chemical Physics Letters
journal homepage: www.elsevier .com/locate /cplet t
Photophysical properties of Re(pbt)(CO)4 studied by high resolution spectroscopy
Rafał Czerwieniec a, Walter J. Finkenzeller a, Thomas Hofbeck a, Alexander Starukhin a,b,Armin Wedel c, Hartmut Yersin a,*
a Universität Regensburg, Institut für Physikalische und Theoretische Chemie, 93053 Regensburg, Germanyb National Academy of Sciences of Belarus, Institute of Molecular and Atomic Physics, 220072 Minsk, Belarusc Fraunhofer Institut für Angewandte Polymerforschung, 14476 Potsdam, Germany
a r t i c l e i n f o
Article history:Received 17 November 2008In final form 26 November 2008Available online 3 December 2008
0009-2614/$ - see front matter � 2008 Elsevier B.V. Adoi:10.1016/j.cplett.2008.11.086
* Corresponding author.E-mail address: [email protected]
a b s t r a c t
Photophysical properties of Re(pbt)(CO)4 are investigated at cryogenic temperatures and high magneticfields. The highly resolved spectra show that the zero field splitting of the lowest triplet T1 into three sub-states is smaller than 2 cm�1. With this result, the T1 state can be classified as only slightly MLCT-per-turbed 3LC (3pp*) state. Consistently, spin-lattice relaxation times are slow at T = 1.2 K and emissiondecay times with sI = 960 ls, sII = 320 ls, and sIII = 24 ls are long due to only small singlet admixtures.The vibrational satellite structures observed reflect different vibrational deactivation mechanisms andreveal similar geometries of the emitting triplet and the ground state.
� 2008 Elsevier B.V. All rights reserved.
1. Introduction
Over the past years, phosphorescent transition metal complexesof Ru2+, Os2+, Ir3+, Pt2+, and Re+ have gained importance with re-spect to various possible applications. Especially, the use of phos-phorescent emitters for organic light-emitting diodes (OLEDs) [1–7] and sensors [8–10] is well established. These complexes emitfrom their lowest excited triplet state T1 to the singlet ground stateS0. The formally spin-forbidden T1 ? S0 transition gains allowed-ness due to spin–orbit coupling (SOC) of the emitting triplet stateto higher lying 1MLCT states. SOC is responsible for favorable emis-sion properties such as a short emission decay time and a highemission quantum yield (compare Refs. [11,12]). In particularIr(III)-complexes often exhibit very suitable properties and thusare frequently applied as OLED emitters [1–7]. On the other hand,Re(I)-complexes have only rarely been considered as electrolumi-nescent materials [13–20], despite the fact that rhenium belongsto the third row of transition metals and thus the lowest tripletstate of rhenium complexes could also experience strong SOC. Itseems that Re(I)-complexes are less well suited for OLED applica-tions than Ir(III)-complexes. Since this circumstance is not readilyunderstandable, it is worth to investigate photophysical propertiesof corresponding complexes in detail. Re(CO)3(a-diimine)(Cl) com-plexes have already been discussed extensively (for example, seeRefs. [21–25]), while only a few investigations with complexesbased on the Re(CO)4
+ fragment have been reported [26–30].In this publication, the green light-emitting complex
Re(pbt)(CO)4 (pbt = 2-phenylbenzothiazole, in the literature also
ll rights reserved.
sburg.de (H. Yersin).
abbreviated as ‘bt’) is studied by means of high resolution site-selective spectroscopy. Re(pbt)(CO)4 has first been reported inRef. [30]. It exhibits a high emission quantum yield of �30% in adegassed acetonitrile solution and shows an emission decay timeof 15 ls at ambient temperature. It is subject of this investigationto classify the emitting triplet state T1 of Re(pbt)(CO)4 according toits metal-to-ligand charge transfer (MLCT)/ligand-centered (LC)character on the basis of the magnitude of zero field splitting(ZFS) of the T1 into substates. Moreover, the emission decay behav-ior of the substates I, II, and III, and the vibrational satellitestructures observed in emission and excitation are investigated.The results are shortly discussed with respect to the behavior ofthe complex when applied in OLEDs.
2. Experimental section
Re(pbt)(CO)4 was prepared as described in Ref. [30] by reactingRe(CO)5Cl with 2-phenylbenzothiazole in boiling hexane continu-ously purged with Ar in the presence of a stoichiometric amountof proton scavenging 1,8-bis-(dimethylamino)naphthalene (protonsponge). The pure product was obtained by column chromatogra-phy on a neutral Al2O3 eluted with hexane.
IR spectra of Re(pbt)(CO)4 were measured in a KBr pellet with aPerkin–Elmer Spectrum 2000 spectrometer and UV–vis absorptionspectra were registered from a dichloromethane solution(c � 5 � 10�5 mol/L) with a Varian Cary 300 double beam spec-trometer. Emission and excitation spectra at 300 K and 77 K weremeasured with a steady-state fluorescence spectrometer (JobinYvon Fluorolog 3). Low-temperature investigations were carriedout in a helium bath cryostat, in which the temperature was regu-lated by control of the helium vapor pressure. The optical setup
206 R. Czerwieniec et al. / Chemical Physics Letters 468 (2009) 205–210
used was similar to the one described in Ref. [31]. For resonantexcitation, a Lambda Physik FL2000 dye laser pumped by a Spec-tron S1803 Nd:YAG laser with a pulse width of 12 ns was used.For UV-excitation a nitrogen laser with kexc = 337.1 nm and a pulseduration of 4 ns was applied. All emission spectra were correctedfor the wavelength dependence of the monochromator and thephotomultiplier. Emission decay curves were measured using aFAST ComTec multichannel scaler PC-card.
3. Results and discussion
3.1. Emission and absorption at 300 K and 77 K – a spectroscopicsurvey
Fig. 1 shows the electronic absorption and the emission spec-trum of Re(pbt)(CO)4 in CH2Cl2 recorded at ambient temperatureand the excitation and the emission spectrum measured atT = 77 K. The transitions observed in these spectra are assigned inanalogy to Re(ppy)(CO)4 (ppy = 2-phenylpyridine) [27,29].
The strong absorptions in the wavelength region below�350 nm (28570 cm�1) are assigned to be largely of 1LC (pbtpp*) character. Corresponding absorption bands are found withtheir maxima at 321 nm (31155 cm�1), 311 nm (32155 cm�1),and 265 nm (37735 cm�1). Transitions manifested in the absorp-tion spectrum between �350 nm and �410 nm (24390 cm�1) areassigned to metal-to-ligand charge transfer transitions (corre-sponding to 1MLCT (Re5d-pbtp*) states). Weak transitions, whichare observed in the excitation spectrum registered at 77 K (solidline) or in absorption spectra of highly concentrated samples (notdepicted), are found in the longer wavelength region between�415 nm (24095 cm�1) and �500 nm (20000 cm�1). Three lineslocated at 489 nm (20450 cm�1), 457 nm (21880 cm�1), and427 nm (23420 cm�1) are related to absorptions from the S0
ground state to the lowest triplet state T1. Since the lowest energyabsorption peak at 20450 cm�1 overlaps with the peak of highestenergy in the emission spectrum, it corresponds to the electronic0–0 transition to the T1 state. The other two lines at 21880 cm�1
and 23420 cm�1, separated from the peak at 20450 cm�1 by�1430 cm�1 and �2970 cm�1, respectively, can be attributed tooverlapping vibrational satellites from fundamentals and combina-tions/progressions of the S0 ? T1 transition (for details, see below).
Fig. 1. Absorption and emission spectra of Re(pbt)(CO)4 in CH2Cl2 registered atT = 300 K (dashed lines) and excitation and emission spectra recorded at T = 77 K(solid lines). The emission spectra were measured under cw excitation at 365 nm.The assignments to 1MLCT (metal-to-ligand charge transfer) and 1LC (ligand-centered) ranges of states should only be taken as a rough guide, since MLCT and LCstates can be mixed significantly.
The emission spectrum of Re(pbt)(CO)4 recorded in CH2Cl2 atT = 300 K shows one broad band with a maximum at 540 nm(18520 cm�1) and two shoulders at 504 nm (19840 cm�1) and580 nm (17240 cm�1). Upon temperature decrease to 77 K, thespectral features are narrowed and a structured emission is re-vealed. The peak at 494 nm corresponds to the electronic origintransition from the T1 substates to the S0 ground state. The otherstructures with peaks at 18800 cm�1, 17340 cm�1, and15900 cm�1 represent overlapping and broadened vibrational sat-ellites of the 0–0 transition and a progression-like structure withmembers separated by�1450 cm�1. Indeed, at lower temperaturescorresponding satellites of 1416, 1449, and 1472 cm�1 are identi-fied (see below), which form weak progressions and combinations.The fact that the emission bands observed at 77 K are compara-tively narrow with half-widths of �250 cm�1 together with a rela-tively long emission decay time of s = 98 ls at this temperature isindicative of a dominant 3LC character with only a weak MLCT per-turbation of the emitting T1 state. A high degree of MLCT characterwould induce more intense metal-ligand vibrational satellites inthe energy region below �600 cm�1 and probably also strong elec-tron–phonon coupling, which both would lead to a less well re-solved spectrum (compare, e.g. [11,32]). The characterizationbased on the high resolution studies, as presented below, supportsthis assignment.
3.2. Spectroscopic sites
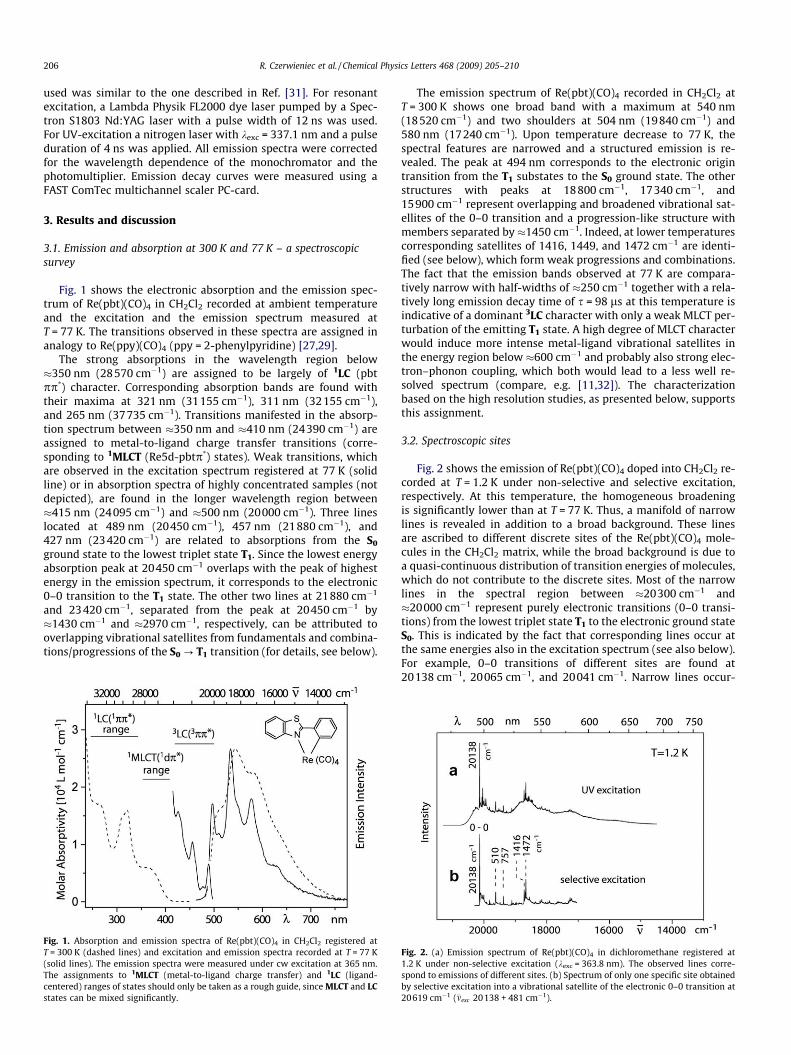
Fig. 2 shows the emission of Re(pbt)(CO)4 doped into CH2Cl2 re-corded at T = 1.2 K under non-selective and selective excitation,respectively. At this temperature, the homogeneous broadeningis significantly lower than at T = 77 K. Thus, a manifold of narrowlines is revealed in addition to a broad background. These linesare ascribed to different discrete sites of the Re(pbt)(CO)4 mole-cules in the CH2Cl2 matrix, while the broad background is due toa quasi-continuous distribution of transition energies of molecules,which do not contribute to the discrete sites. Most of the narrowlines in the spectral region between �20300 cm�1 and�20000 cm�1 represent purely electronic transitions (0–0 transi-tions) from the lowest triplet state T1 to the electronic ground stateS0. This is indicated by the fact that corresponding lines occur atthe same energies also in the excitation spectrum (see also below).For example, 0–0 transitions of different sites are found at20138 cm�1, 20065 cm�1, and 20041 cm�1. Narrow lines occur-
Fig. 2. (a) Emission spectrum of Re(pbt)(CO)4 in dichloromethane registered at1.2 K under non-selective excitation (kexc = 363.8 nm). The observed lines corre-spond to emissions of different sites. (b) Spectrum of only one specific site obtainedby selective excitation into a vibrational satellite of the electronic 0–0 transition at20619 cm�1 (�mexc 20138 + 481 cm�1).

R. Czerwieniec et al. / Chemical Physics Letters 468 (2009) 205–210 207
ring at energies below �20000 cm�1 represent mostly vibrationalsatellites to the electronic origin lines. The emission spectrum ofone selected site is obtained by selective laser excitation of thatindividual site. For example, under excitation into the 481 cm�1
vibrational satellite of the (dominating) site with the 0–0 transitionat 20138 cm�1 the spectrum reproduced in Fig. 2b is obtained.Clearly, the smearing out due to overlapping emissions of mole-cules at different sites as well as the inhomogeneous backgroundare largely eliminated. For the subsequent detailed studies, justthis specific site is investigated.
3.3. Electronic 0–0 transitions and vibrational satellite structures
Fig. 3 shows the highly resolved emission spectrum of Re(-pbt)(CO)4 in dichloromethane obtained at 1.2 K by selective excita-tion of one individual site. The excitation spectrum of the same siteis presented in Fig. 4. The spectra reveal a number of interestingproperties of the studied compound.
Fig. 3. Emission spectrum of Re(pbt)(CO)4 in CH2Cl2 recorded at a temperature of 1.2138 + 481 cm�1 mode). The vibrational satellite lines are labeled according to their relativan asterisk is ascribed to another site. For comparison, also the broad emission at 77 K undthe electronic origins (on an enlarged scale) under application of a magnetic field of B = 1from Zeeman splitting of the T1 state into substates.
Fig. 4. Excitation spectrum of Re(pbt)(CO)4 in CH2Cl2 registered at T = 1.2 K and B = 0 T unThe satellite lines are labeled with respect to the vibrational energies of the correspondin
The dominating line at (20138 ± 1) cm�1 lies at the same energyin the emission and in the excitation spectrum. Therefore, this lineis assigned as purely electronic (0–0) transition between the low-est excited triplet T1 and the singlet ground state S0. Further lineswhich could correspond to electronic origins of the same site arenot observed. This indicates that the energies of the transitionsfrom/to the three substates I, II, and III of T1 lie within the widthof about 2 cm�1 of the line at 20138 cm�1. Indeed, application ofa high magnetic field of B = 10 T shows that the line at20138 cm�1 splits into three lines (see inset of Fig. 3). These linescorrespond to the emissions from the three B-field perturbed trip-let substates. The observation of this Zeeman splitting can be re-garded as a direct proof of the triplet character of the emittingstate. The separations of the triplet substates at 10 T amount toDEðBÞIII-I � 16:5 cm�1 and DEðBÞII-I � 8 cm�1.
The emission and the excitation spectrum both exhibit rich sa-tellite structures. These are assigned to vibrational transitions in-volved in the electronic transitions between the S0 ground state
K under site-selective excitation into a vibrational satellite at 20 619 cm�1 (20e energies with respect to the electronic origin at 20 138 cm�1. The line marked wither UV excitation is given (dashed line). The inset shows the emission in the region of0 T. The spectrum was registered at 8.0 K and shows three emission lines resulting
der site-selective detection at 19381 cm�1 (20138�757 cm�1 vibrational satellite).g modes. The spectrum is not corrected with respect to the exciting laser intensity.

Table 1Vibrational energies (in cm�1) of Re(pbt)(CO)4 from site-selective emission andexcitation spectra measured in dichloromethane at T = 1.2 K (Figs. 3 and 4) and IRabsorption spectrum of the complex measured in KBr (vs = very strong, s = strong,m = medium, w = weak).
EmissionT = 1.2 K
ExcitationT = 1.2 K
IR absorptionT = 300 K
Assignment
20138 cm�1 20138 cm�1 Electronic 0–0 transition95 Other site132 s 130 w
191 m315 sb 312 m FCa
327 wc HTd
353 m 350 m FC371 mc HT405 mc HT417 wc HT437 wc HT441 wc HT455 mc FC
481 vs FCe
510 sb FC547 wc HT
590 s621 s
626 m647 mb FC
655 m718 s
725 s757 sb 761 s FC
927 m938 m962 s 2 � 481 FCe
994 m1015 m
1024 sb FC1076 w 1077 m
1087 s FC1161 m FC
1198 s FC1224 s FC
1262 m1269 w 510 + 757
1309 s FC1416 sb 1409 m FC1449 sb 1443 m FC
1464 m1472 vsb 1472 w 1465 w FC
1488 m1515 w1543 s FC
1546 w1567 m
1582 m 1580 w1729 w 315 + 14161785 w 315 + 1472
1905 vs1925 w 510 + 14161959 w 510 + 1449
1977 vs1981 w 510 + 1472
2013 vs2092 s
2173 w 757 + 14162228 w 757 + 14722496 w 1024 + 14722827 w 2 � 1416 FC2879 m 1416 + 14722898 m 2 � 1449 FC2919 m 1449 + 1472
2922 w2938 w 2 � 1472 FC
3039 w
a Franck-Condon active mode.b Fundamental which forms combinations and progressions.c Fundamental observed in a time resolved emission spectrum with a delay time
t = 1 ms and a time window of Dt = 4 ms.d Herzberg–Teller active fundamental.e Due to the fact that the excitation spectrum is not corrected with respect to the
intensity distribution, these satellites are not suited to determine Huang-Rhysparameters.
208 R. Czerwieniec et al. / Chemical Physics Letters 468 (2009) 205–210
and the triplet T1 substates. The satellites observed in emissionrepresent ground state vibrational modes, while those observedin excitation correspond to excited state vibrational modes. In Figs.3 and 4, the satellite lines are labeled according to the vibrationalenergies of the corresponding modes, which are given by the en-ergy separations of the lines to the respective electronic origin lineat 20138 cm�1. Modes of energies below �600 cm�1 mainly repre-sent metal-ligand vibrational modes, whereas modes of higher en-ergy are mainly regarded as intra-ligand vibrations. Almost eachvibrational satellite line, as well as the electronic 0–0 transition,is accompanied by a weak phonon sideband of a width of�50 cm�1.
The vibrational energies of the ground state modes are com-pared to those of the excited state modes in Table 1. Moreover, Ta-ble 1 summarizes also the vibrational energies obtained from IR-absorption measurements of the complex in KBr. A mirror symme-try between the emission spectrum and the excitation spectrum isnot apparent. Yet, several vibrational energies of modes in the elec-tronically excited state can be related to energies of ground statemodes. This means that, for the respective modes, the force con-stants in the electronically excited state T1 are similar to those ofthe ground state S0.
Most of the vibrational satellites of the emission spectrum ob-served in the spectral range up to �1600 cm�1 correspond to fun-damentals. At higher energies also combinations of fundamentals(e.g. 315 + 1416, 315 + 1472, 510 + 1472, 1416 + 1472 cm�1, etc.)and progressions are identified (see Table 1). For example, theprominent modes of 1416 cm�1, 1449 cm�1, and 1472 cm�1 formprogressions with the second members at 2827, 2898, and2938 cm�1 separated from the electronic origin. For these modes,the so-called Huang-Rhys parameter S, which represents a mea-sure of the changes of the equilibrium molecular geometry be-tween the excited state and the ground state [33,34], can bedetermined from the intensity ratio of the subsequent membersof the progressions. For the observed progressions in the emissionspectrum the Huang-Rhys parameters turn out to be smaller than0.25. From this small value, it can be concluded that the equilib-rium geometries of Re(pbt)(CO)4 are only slightly different in theelectronic ground state S0 and the excited state T1. This is at leastvalid for the compound situated in a rigid n-alkane matrix cageat low-temperature. Interestingly, the Huang-Rhys parameters be-come even smaller for compounds with typical 3MLCT emittingstates. For example, the low-temperature emission spectrum ofIr(pbt)2(acac) reveals a maximum S parameter of less than 0.1[35]. The decrease of this parameter with increasing MLCT charac-ter of the emitting triplet state has also been observed for a seriesof other organo-transition metal compounds and has been ascribedto the more extended charge distribution and thus to a less distinctcharge density change of an individual bond in a 3MLCT state incomparison to a 3LC state (compare Refs. [11,34,36,37]).
The progressions described above are also manifested in theemission spectrum at 77 K reproduced in Fig. 1. However, a com-parison to the emission spectrum at 1.2 K shows that several vibra-tional satellites overlap and contribute to each of the bandspeaking at 18800 cm�1, 17340 cm�1, and 15900 cm�1. Therefore,an assessment of the Huang-Rhys parameter(s) on the basis ofthe 77 K spectrum is not possible and would lead to misinterpreta-tions with respect to the extent of shifts of the molecular equilib-rium geometries.
The classification of vibrational satellite lines at 1925, 1959, and1981 cm�1 is not straightforward. These lines could correspond tocarbonyl stretching vibrations. Such an assignment would be justi-fied by the fact that in the corresponding region of the IR spectra ofRe(pbt)(CO)4 very strong absorptions corresponding to thesemodes occur. In dichloromethane, three such IR bands with max-ima at 1927, 1974, and 1992 cm�1 were found [30]. Thus, one

Fig. 5. Emission decay curve at T = 1.2 K of Re(pbt)(CO)4 in dichloromethanedetected at 18580 cm�1 after pulsed excitation in the UV at 29665 cm�1
(337.1 nm). The inset shows the energy level diagram of the lowest triplet T1 andthe singlet ground state S0 including the emission decay times of the threesubstates.
R. Czerwieniec et al. / Chemical Physics Letters 468 (2009) 205–210 209
might expect that vibrational satellites corresponding to thesevibrational energies would occur also in the emission spectrum,especially in case of a significant participation of rhenium or car-bonyl orbitals in the molecular orbitals of Re(pbt)(CO)4 involvedin the S0 M T1 transition. On the other hand, these satellites canalso represent combinations of strong fundamentals:510 + 1416 cm�1 (=1926 cm�1), 510 + 1449 cm�1 (=1959 cm�1),and 510 + 1472 cm�1 (=1982 cm�1). This latter interpretation isstrongly supported by a comparison with emission spectra ofPt(pbt)(acac), with no carbonyl ligands. In these spectra, satellitesof similar energies (1931, 1971, and 1995 cm�1) are observed[38]. These vibrational satellites most probably represent combina-tions of a 513 cm�1 fundamental with the fundamentals at 1416,1459, and 1484 cm�1. This is in close analogy to the situation con-sidered for Re(pbt)(CO)4 and strongly indicates that the 1925,1959, and 1981 cm�1 satellites represent combinations, but notCO fundamentals. Moreover, this assignment is in agreement withthe 3LC classification of the T1 state (compare also Section 4).
The vibrational energies given in Table 1 are in part labeledaccording to Franck–Condon (FC) and Herzberg–Teller (HT) activ-ity, respectively. The assignment of the progression forming modesof 1416, 1449, and 1472 cm�1 as FC active is straightforward. A fur-ther classification is based on time resolved emission spectra. Itwill be shown in the next section that the electronic transitionsfrom the three substates of T1 to the singlet ground state S0 showsignificantly different allowednesses. This behavior is reflected inthe decay times of the substate emissions of sI = 960 ls,sII = 320 ls, and sIII = 24 ls. Since, in particular the 0–0 transitionI ? S0 is electronically strongly forbidden, spin-vibronic HT activ-ity is expected to be important for this triplet ? singlet transition(compare, e.g. Refs. [11,34,39]). The 0–0 transition III ? S0, in con-trast, is fairly allowed and therefore, substate III is assumed to bedeactivated radiatively mainly by FC active modes [11,34,39]. Sim-ilarly, all strong satellites in the excitation spectrum, which isbased mainly on the S0 ? III transition, are induced by FC activity.The situation of different vibronic activity is typical for organo-transition metal complexes and was found, for example for Ir(ppy)3
[11,32], [Ru(bpy)3]2+ [36,37], Pd(thpy)2 [40], and Pt(thpy)2 [34,41].As a consequence, the vibrational satellite structures occurringwith the electronically only weakly allowed transition I ? S0 andwith the strong III ? S0 transition are usually different. Indeed,when time-resolved emission spectra of Re(pbt)(CO)4 are regis-tered at (T = 1.2 K), the corresponding vibrational satellite struc-tures can be distinguished. Registration of the spectrum in ashort delay-time regime, e.g. from 0 to 50 ls after the excitationpulse, mainly yields the short-lived emission from substate III,which largely resembles the time-integrated emission spectrumreproduced in Fig. 3. Strong vibrational satellites occurring withthis emission are tentatively labeled to be activated by FC-modesin Table 1. In a long delay-time regime of, e.g. 1–5 ms after the la-ser pulse, only emission from the substate I occurs. In this case, dif-ferent vibrational modes are observed, which are labeled as HT-active modes in Table 1.
3.4. Emission decay behavior
Fig. 5 shows a decay curve of the emission of Re(pbt)(CO)4 indichloromethane registered at T = 1.2 K. The emission was detectedat 18580 cm�1 after pulsed excitation in the UV at 29665 cm�1
(337.1 nm). Clearly, the decay behavior is not mono-exponential.However, a fit to this decay curve is possible assuming a superpo-sition of three mono-exponential decay components. Such a tri-exponential decay is usually found, if the population of the threetriplet substates is not in thermal equilibrium during the emission.As a consequence, the individual substates emit independentlyfrom each other according to their radiative decay rates and their
initial populations. Thus, the observed three components reflectthe individual decays of the three triplet substates I, II, and III.For Re(pbt)(CO)4, such a behavior is well comprehensible, sincethe times of relaxation between the triplet substates, i.e. thespin-lattice relaxation (SLR) times, are very long at low tempera-tures [40–44]. For example, for a small energy separation of DE(ZFS) < 1 cm�1 the SLR time can be as long as many ms [43]. Thus,a Boltzmann distribution is not established during the emission de-cay time. However, at higher temperatures, SLR times are substan-tially shorter and, for example above 10 K, the emission decayusually becomes mono-exponential [40,43].
The observed emission decay times of Re(pbt)(CO)4 in dichloro-methane are comparatively long with sI = 960 ls, sII = 320 ls, andsIII = 24 ls. Such values are typical for emitters with a ligand-cen-tered character of the electronic T1 ? S0 transition [11,34,40]. Inparticular, the decay time of substate III indicates that this substatecontains small admixtures of higher lying singlets, while substate Ilargely retains its triplet substate character. Such a situation hasalso been found for many other complexes (see e.g. Refs.[11,34,41]). Note that, in a strict sense, the electronic allowednessof the 0–0 transition I ? S0 is not reflected by the emission decaytime, since – in contrast to substate III – substate I is to a signifi-cant extent radiatively deactivated by vibronic paths (vibrationalHerzberg–Teller satellites). Therefore, the observed decay time sI
is substantially shorter than expected solely on the basis of theelectronic allowedness of the 0–0 transition I ? S0.
4. Assignment and conclusion
Photophysical properties of Re(pbt)(CO)4 have been investi-gated in a dichloromethane matrix by use of highly-resolving opti-cal spectroscopy at cryogenic temperatures. In the frame ofemission and excitation spectra, it was not possible to resolvethe emissions from the different substates I, II, and III of the emit-ting triplet T1. Therefore, all three substates lie close in energy witha zero field splitting (ZFS) smaller than 2 cm�1. However, under anapplied high magnetic field, a Zeeman splitting of emission lines isobserved, demonstrating the triplet character of the emitting state.
In organo-transition metal compounds, the ZFS of the emittingstate T1 results dominantly from different mixings of the individualsubstates to higher lying 1,3MLCT states induced by spin–orbit cou-plings (SOC). Therefore, the ZFS can be used to classify the T1 stateof an organo-transition metal complex with respect to its MLCTadmixtures or MLCT character [11,12,34]. According to the order-ing scheme developed by Yersin et al. [11,34], small ZFS values,

210 R. Czerwieniec et al. / Chemical Physics Letters 468 (2009) 205–210
e.g. ZFS below 1 cm�1, are indicative of largely ligand-centered 3LCstates, while larger ZFS values, e.g. ZFS > 50 cm�1, manifest a largeMLCT character of the T1 state. Since Re(pbt)(CO)4 exhibits a smallZFS of <2 cm�1, its emitting triplet T1 is classified as ligand-cen-tered 3LC (3pp*) state with only minor MLCT admixtures. A similarassignment as 3LC (3pp*) has also been reported for the emittingstate of Re(ppy)(CO)4 [27,29]. The small value of ZFS of the T1 stateof Re(pbt)(CO)4 is mainly a consequence of the high ligand fieldstrength of pbt and the CO ligands. This leads to a large energysplitting of the d-orbitals. In such a case, the occupied d-orbitalsare expected to be strongly stabilized and therefore, the lowest3MLCT state lies at higher energy than the ligand-centered 3pp*
state. Moreover, the low-lying 3pp* (3LC) can experience only veryinefficient mixing by SOC to 1dp*(1MLCT) states [11,12] and there-fore the singlet admixtures to the emitting triplet substates aresmall for Re(pbt)(CO)4. Indeed, the decay times of the emissionsfrom the triplet substates I, II, and III with sI = 960 ls, sII = 320 ls,and sIII = 24 ls are comparatively long. This obviously implies thatsubstate I can be regarded as an almost pure triplet substate, whilethe substate III is perturbed by some singlet admixture, presum-ably by an indirect SOC path via configuration interaction [11].However, even the decay time sIII is long compared to other com-plexes, such as Ir(ppy)3 which exhibits a decay time of substate IIIof only 750 ns [32].
Obviously, in the case of Re(pbt)(CO)4, the MLCT admixtures tothe T1 state are too small to enable efficient spin–orbit coupling tohigher-lying singlets. Presumably, this is one of the reasons, whyOLED devices we fabricated with Re(pbt)(CO)4 showed only lowefficiencies. In a recent publication, we proposed that the ZFS val-ues of organo-transition metal complexes should be larger thanabout 10 cm�1 to obtain emission properties favorable for OLEDs(compare Ref. [45]). Accordingly, for example Re(phen)(CO)3(Cl)(with phen = 1,10-phenanthroline), for which a ZFS value of about50 cm�1 has been determined, shows a comparatively good OLEDperformance [17,46]. This property can be related to the signifi-cantly stronger SOC to the T1 state of Re(phen)(CO)3(Cl) than ofRe(pbt)(CO)4. For Re(phen)(CO)3(Cl), the ligand field strength isdistinctly smaller which leads to a destabilization of the occupiedd-orbitals and thus to a triplet state being largely of MLCT charac-ter. In particular, this property is favorable for good OLED perfor-mance. This example demonstrates the potential of controllingphoto-physical properties of organo-transition metal complexesin order to achieve better suited OLED emitters.
Acknowledgment
We thank the Bundesministerium für Bildung und Forschung(BMBF) for providing the funding of this investigation.
References
[1] H. Yersin (Ed.), Highly Efficient OLEDs with Phosphorescent Materials, Wiley-VCH, Weinheim, 2008.
[2] T. Sajato, P.I. Djurovich, A. Tamayo, M. Yousufuddin, R. Bau, M.E. Thompson,Inorg. Chem. 44 (2005) 7992.
[3] A.B. Tamayo, S. Garon, T. Sajoto, P.I. Djurovich, I.M. Tsyba, R. Bau, M.E.Thompson, Inorg. Chem. 44 (2005) 8723.
[4] K. Walzer, B. Männig, M. Pfeiffer, K. Leo, Chem. Rev. 107 (2007) 1233.[5] P.I. Djurovich, M.E. Thompson, in: Ref. [1], p. 131.[6] R.C. Evans, P. Douglas, C.J. Winscom, Coord. Chem. Rev. 250 (2006) 2093.[7] L. Flamigni, A. Barbieri, C. Sabatini, B. Ventura, Top. Curr. Chem. 281 (2007).[8] M.-J. Li, C.-C. Ko, G.-P. Duan, N. Zhu, V.W.-W. Yam, Organomet. 26 (2007) 6091.[9] R. Narayanaswamy, O.S. Wolfbeis (Eds.), Optical Sensors for Industrial,
Environmental and Clinical Applications, Springer, Berlin-Heidelberg,Germany, 2004.
[10] D. Pentlehner, C.S.K. Mak, M. Stich, O.S. Wolfbeis, W.K. Chan, H. Yersin,submitted for publication.
[11] H. Yersin, W.J. Finkenzeller, in: Ref. [1], p. 1.[12] A.F. Rausch, H.H.H. Homeier, P.I. Djurovich, M.E. Thompson, H. Yersin, Proc.
SPIE 6655 (2007) 66550F.[13] C.S.K. Mak, W.K. Chan, in: Ref. [1], p. 329.[14] K. Wang, L. Huang, L. Gao, L. Jin, C. Huang, Inorg. Chem. 41 (2002) 3353.[15] V.W.-W. Yam, B. Li, Y. Yang, B.W.K. Chu, K.M.C. Wong, K.K. Cheung, Eur. J.
Inorg. Chem. (2003) 4035.[16] Y. Li, Y. Liu, J. Guo, F. Wu, W. Tian, B. Li, Y. Wang, Synth. Met. 118 (2001) 175.[17] F. Li, M. Zhang, G. Cheng, J. Feng, Y. Zhao, Y. Ma, S. Liu, J. Shen, Appl. Phys. Lett.
84 (2004) 148.[18] S. Ranjan, S.-Y. Lin, K.-C. Hwang, W.L. Ching, C.-S. Liu, Y.-T. Tao, C.-H. Chien, S.-
M. Peng, G.-H. Lee, Inorg. Chem. 42 (2003) 1248.[19] Y.-Y. Lue, C.-C. Jue, D. Guo, Z.-B. Deng, K.-Z. Wang, J. Phys. Chem. C 111 (2007)
5211.[20] M. Obata, A. Kitamura, A. Mori, C. Kameyama, J. Czaplewska, R. Tanaka, I.
Kinoshita, T. Kusumoto, H. Hashimoto, M. Harada, Y. Mikata, T. Funabiki, S.Yano, Dalton Trans. (2008) 3292.
[21] C.C. Ko, W.-M. Kwok, V.W.-W. Yam, D.L. Phillips, Chem. Eur. J. 12 (2006) 5840.[22] A. Kumar, S.-S. Sun, A.J. Lees, Topics in Organometallic Chemistry, Springer,
Berlin-Heidelberg, Germany, in press.[23] A. Cannizzo, A.M. Blanco-Rodriguez, A. El Nahhas, J. Sebera, S. Zališ, A. Vlcek Jr.,
M. Chergui, J. Am. Chem. Soc. 130 (2008) 8967.[24] A. Vlcek Jr., S. Zališ, Coord. Chem. Rev. 251 (2007) 258.[25] D.J. Stufkens, A. Vlcek Jr., Coord. Chem. Rev. 177 (1998) 127.[26] P. Spellane, R.J. Watts, A. Vogler, Inorg. Chem. 32 (1993) 5633.[27] F.W.M. Vanhelmont, G.F. Strouse, H.U. Güdel, A.C. Stückl, H.W. Schmalle, J.
Phys. Chem. A 101 (1997) 2946.[28] F.W.M. Vanhelmont, H.U. Güdel, M. Förtsch, H.-B. Bürgi, Inorg. Chem. 36
(1997) 5512.[29] F.W.M. Vanhelmont, M.V. Rajasekharan, H.U. Güdel, S.C. Capelli, A. Hauser, H.-
B. Bürgi, J. Chem. Soc. Dalton Trans. 17 (1998) 2893.[30] R. Czerwieniec, A. Kapturkiewicz, J. Nowacki, Inorg. Chem. Comm. 8 (2005)
1101.[31] E. Gallhuber, G. Hensler, H. Yersin, J. Am. Chem. Soc. 109 (1987) 4818.[32] W.J. Finkenzeller, H. Yersin, Chem. Phys. Lett. 377 (2003) 299.[33] B. Henderson, G.F. Imbusch, Optical Spectroscopy of Inorganic Solids, Oxford
University Press, Oxford, UK, 2006.[34] H. Yersin, D. Donges, Top. Curr. Chem. 214 (2001) 81.[35] D. Pentlehner, Diplomarbeit, Universität Regensburg, 2006.[36] H. Yersin, W. Humbs, J. Strasser, Coord. Chem. Rev. 159 (1997) 325.[37] H. Yersin, W. Humbs, J. Strasser, Top. Curr. Chem. 191 (1997) 153.[38] T. Hofbeck, R. Czerwieniec, H. Yersin, unpublished results.[39] G. Fischer, Vibronic Coupling, Academic Press, London, UK, 1984.[40] J. Schmidt, H. Wiedenhofer, A. von Zelewsky, H. Yersin, J. Phys. Chem. 99
(1995) 226.[41] H. Wiedenhofer, S. Schützenmeier, A. von Zelewsky, H. Yersin, J. Phys. Chem.
99 (1995) 13385.[42] H. Yersin, J. Strasser, Coord. Chem. Rev. 208 (2000) 331.[43] D. Becker, H. Yersin, A. von Zelewsky, Chem. Phys. Lett. 235 (1995) 490.[44] J. Strasser, H.H.H. Homeier, H. Yersin, Chem. Phys. 255 (2000) 301.[45] W.J. Finkenzeller, T. Hofbeck, M.E. Thompson, H. Yersin, Inorg. Chem. 46 (2007)
5076.[46] R. Czerwieniec, W. Finkenzeller, T. Hofbeck, X.H. Yang, D. Neher, A. Starukhin,
H. Yersin, in: XXII International Conference on Organometallic Chemistry,Book of Abstracts, vol. 2, Zaragoza, Spain, 2006, p. 882.