Photophysical Properties and Photobiological Activity of the Furanochromones Visnagin and Khellin
13
Photophysical Properties and Photobiological Behavior of Amodiaquine, Primaquine and Chloroquine Giampietro Viola* 1 , Alessia Salvador 1 , Laura Cecconet 2 , Giuseppe Basso 2 , Daniela Vedaldi 1 , Francesco Dall’Acqua 1 , Gian Gaetano Aloisi 3 , Matteo Amelia 3 , Arianna Barbafina 3 , Loredana Latterini 3 and Fausto Elisei 3 1 Dipartimento di Scienze Farmaceutiche, Universita ` di Padova, Padova, Italy 2 Dipartimento di Pediatria, Universita ` di Padova, Padova, Italy 3 Dipartimento di Chimica, Universita ` di Perugia, and Centro di Eccellenza sui Materiali innovativi Nanostrutturati (CEMIN), Perugia, Italy Received 4 November 2006; accepted 26 May 2007; DOI: 10.1111/j.1751-1097.2007.00181.x ABSTRACT This article describes the results of a coupled photophysical and photobiological study aimed at understanding the phototoxicity mechanism of the antimalarial drugs amodiaquine (AQ), pri- maquine (PQ) and chloroquine (CQ). Photophysical experi- ments were carried out in aqueous solutions by steady-state and time-resolved spectrometric techniques to obtain information on the different decay pathways of the excited states of the drugs and on the transient species formed upon laser irradiation. The results showed that all three drugs possess very low fluorescence quantum yields (10 )2 –10 )4 ). Laser flash photolysis experiments proved the occurrence of photoionization processes leading to the formation of a radical cation in all three systems. In the case of AQ the lowest triplet state was also detected. Together with the photophysical properties the photobiological properties of the antimalarial drugs were investigated under UV irradiation, on various biological targets through a series of in vitro assays. Phototoxicity on mouse 3T3 fibroblast and human keratinocyte cell lines NCTC-2544 was detected for PQ and CQ but not for AQ. In particular, PQ- and CQ-induced apoptosis was revealed by the externalization of phosphatidylserine. Furthermore, upon UV irradiation, the drugs caused significant variations of the mitochondrial potential (Dw mt ) measured by flow cytometry. The photodamages produced by the drugs were also evaluated on proteins, lipids and DNA. The combined approaches were useful in understanding the mechanism of phototoxicity induced by these antimalarial drugs. INTRODUCTION Generally, natural and synthetic antimalarials based on a quinoline template possess undesirable phototoxic properties that produce dangerous side effects both in the skin and in the eyes (1,2). Light exposure may cause cutaneous and ocular effects ranging from skin pigmentation alterations to corneal opacity, cataract formation and other irreversible retinal damages (e.g., retinopathy) leading to blindness (2) in the worst cases. (For an exhaustive review concerning the photo- physical, photochemical, photosensitizing and historical as- pects of quinine and the other synthetic antimalarial drugs, see Ref. [3]). The mechanism for these dangerous reactions in humans is not yet completely understood, although singlet molecular oxygen, O 2 ( 1 D g ) and free radicals, including super- oxide ⁄ hydroperoxyl or peroxyl adducts, carbon-centered and nitrogen-centered radicals, have been invoked as responsible for the phototoxic effects (4). A recent photophysical and photobiological investigation on some quinoline derivatives (quinine, mefloquine and quinacrine) added novel information on the mechanism of phototoxicity (5). In particular, these antimalarial drugs induced cellular toxic effects and protein photodamages mainly through oxygen active species; these findings are in agreement with the significant values of quantum yield for O 2 ( 1 D g ) production (u D ) measured by Motten et al. for these compounds (4). However, in some cases the involvement of radical species in the phototoxicity mechanism cannot be excluded, especially for the compounds that show a nonneg- ligible photoionization efficiency in aqueous media (5). In the present study the photophysical and photobiological studies are extended to other synthetic antimalarial drugs endowed with quinoline moiety, such as amodiaquine (AQ), chloroquine (CQ) and primaquine (PQ) (Scheme 1), which belong to the same class of quinoline derivatives previously investigated (5). In particular CQ and AQ belong to the family of 4-aminoquinoline while PQ belongs to the 8-aminoquino- line class. The purpose of the present study was to get a complete and comparative picture of the photophysical behavior of these drugs at physiologic conditions and of the photoinduced effects versus the main cellular targets, including a description of the action mechanism and a characterization of the transient species involved in the photoprocesses by ns time- resolved techniques. Moreover, the description of the drug– DNA binding association and of DNA photocleavaging activity will be reported. A correlation between the photo- biological activity and the photophysical properties of these antimalarial drugs will be also discussed. *Corresponding author email: [email protected] (Giampietro Viola) ȑ 2007 The Authors. Journal Compilation. The American Society of Photobiology 0031-8655/07 Photochemistry and Photobiology, 2007, 83: 1415–1427 1415
-
Upload
independent -
Category
Documents
-
view
4 -
download
0
Transcript of Photophysical Properties and Photobiological Activity of the Furanochromones Visnagin and Khellin

Photophysical Properties and Photobiological Behavior of Amodiaquine,Primaquine and Chloroquine
Giampietro Viola*1, Alessia Salvador1, Laura Cecconet2, Giuseppe Basso2, Daniela Vedaldi1,Francesco Dall’Acqua1, Gian Gaetano Aloisi3, Matteo Amelia3, Arianna Barbafina3, Loredana Latterini3
and Fausto Elisei3
1Dipartimento di Scienze Farmaceutiche, Universita di Padova, Padova, Italy2Dipartimento di Pediatria, Universita di Padova, Padova, Italy3Dipartimento di Chimica, Universita di Perugia, and Centro di Eccellenza sui Materiali innovativi Nanostrutturati (CEMIN),Perugia, Italy
Received 4 November 2006; accepted 26 May 2007; DOI: 10.1111/j.1751-1097.2007.00181.x
ABSTRACT
This article describes the results of a coupled photophysical and
photobiological study aimed at understanding the phototoxicity
mechanism of the antimalarial drugs amodiaquine (AQ), pri-
maquine (PQ) and chloroquine (CQ). Photophysical experi-
ments were carried out in aqueous solutions by steady-state and
time-resolved spectrometric techniques to obtain information on
the different decay pathways of the excited states of the drugs
and on the transient species formed upon laser irradiation. The
results showed that all three drugs possess very low fluorescence
quantum yields (10)2–10)4). Laser flash photolysis experiments
proved the occurrence of photoionization processes leading to the
formation of a radical cation in all three systems. In the case of
AQ the lowest triplet state was also detected. Together with the
photophysical properties the photobiological properties of the
antimalarial drugs were investigated under UV irradiation, on
various biological targets through a series of in vitro assays.
Phototoxicity on mouse 3T3 fibroblast and human keratinocyte
cell lines NCTC-2544 was detected for PQ and CQ but not for
AQ. In particular, PQ- and CQ-induced apoptosis was revealed
by the externalization of phosphatidylserine. Furthermore, upon
UV irradiation, the drugs caused significant variations of the
mitochondrial potential (Dwmt) measured by flow cytometry. The
photodamages produced by the drugs were also evaluated on
proteins, lipids and DNA. The combined approaches were useful
in understanding the mechanism of phototoxicity induced by
these antimalarial drugs.
INTRODUCTION
Generally, natural and synthetic antimalarials based on aquinoline template possess undesirable phototoxic properties
that produce dangerous side effects both in the skin and in theeyes (1,2). Light exposure may cause cutaneous and oculareffects ranging from skin pigmentation alterations to cornealopacity, cataract formation and other irreversible retinal
damages (e.g., retinopathy) leading to blindness (2) in the
worst cases. (For an exhaustive review concerning the photo-physical, photochemical, photosensitizing and historical as-pects of quinine and the other synthetic antimalarial drugs, see
Ref. [3]). The mechanism for these dangerous reactions inhumans is not yet completely understood, although singletmolecular oxygen, O2(
1Dg) and free radicals, including super-
oxide ⁄ hydroperoxyl or peroxyl adducts, carbon-centered andnitrogen-centered radicals, have been invoked as responsiblefor the phototoxic effects (4). A recent photophysical andphotobiological investigation on some quinoline derivatives
(quinine, mefloquine and quinacrine) added novel informationon the mechanism of phototoxicity (5). In particular, theseantimalarial drugs induced cellular toxic effects and protein
photodamages mainly through oxygen active species; thesefindings are in agreement with the significant values of quantumyield for O2(
1Dg) production (uD) measured byMotten et al. for
these compounds (4). However, in some cases the involvementof radical species in the phototoxicity mechanism cannot beexcluded, especially for the compounds that show a nonneg-ligible photoionization efficiency in aqueous media (5).
In the present study the photophysical and photobiologicalstudies are extended to other synthetic antimalarial drugsendowed with quinoline moiety, such as amodiaquine (AQ),
chloroquine (CQ) and primaquine (PQ) (Scheme 1), whichbelong to the same class of quinoline derivatives previouslyinvestigated (5). In particular CQ and AQ belong to the family
of 4-aminoquinoline while PQ belongs to the 8-aminoquino-line class.
The purpose of the present study was to get a complete and
comparative picture of the photophysical behavior of thesedrugs at physiologic conditions and of the photoinducedeffects versus the main cellular targets, including a descriptionof the action mechanism and a characterization of the
transient species involved in the photoprocesses by ns time-resolved techniques. Moreover, the description of the drug–DNA binding association and of DNA photocleavaging
activity will be reported. A correlation between the photo-biological activity and the photophysical properties of theseantimalarial drugs will be also discussed.*Corresponding author email: [email protected] (Giampietro Viola)
� 2007TheAuthors. JournalCompilation.TheAmericanSociety ofPhotobiology 0031-8655/07
Photochemistry and Photobiology, 2007, 83: 1415–1427
1415

MATERIALS AND METHODS
Chemicals. Amodiaquine dihydrochloride (AQ), chloroquine diphos-phate (CQ) and primaquine diphosphate (PQ) were SIGMA products.Benzophenone (Aldrich, gold label) and acetonitrile (Fluka, spectro-photometric grade) were used as received. Chloranil (Fluka) wasrecrystallized from acetone and sublimed under vacuum. Disodium3,3¢-disulfonatobenzophenone was a kind gift from Prof. G. Favaro(6). Thiobarbituric acid (TBA), sodium azide (NaN3), N-N¢ dimethylthiourea (DMTU), superoxide dismutase (SOD), catalase (CAT),bovine serum albumin (BSA), 2,6-di-tert-butylhydroxyanisole (BHA)glutathione reduced form (GSH) (St. Louis, MO) and salmon testesDNA (sodium salt) were obtained from Sigma Co. pBR322 plasmidDNA and ethidium bromide solution were from Amersham PharmaciaBiotech AB (Uppsala, Sweden). Nucleic acid concentrations weredetermined spectrophotometrically at 260 nm using the value13 200 MM
)1 cm)1 bp for the molar absorption coefficient at thiswavelength (�260).
Photophysical measurements. All measurements were carried out at22 ± 2�C; the solutions were saturated by bubbling with nitrogen, ifother conditions were not specified. Absorption spectra were recordedwith a Perkin-Elmer Lambda 800 spectrophotometer. Fluorescencespectra, corrected for the instrumental response, and quantum yieldswere measured with a Fluorolog (Spex F112AI) spectrophotofluo-rometer (absorbance <0.10 at kexc) using anthracene in ethanol,uF = 0.27 (7 and references therein) as standard.
The fluorescence lifetimes, sF (mean deviation of three independentexperiments, �5%) were measured by a Spex Fluorolog-s2 systembased on the phase-modulation technique (excitation wavelengthmodulated in the 1–300 MHz range; time resolution �10 ps). Thefrequency-domain intensity decays (phase angle and modulation vsfrequency) were analyzed with the Global UnlimitedTM (rev.3) globalanalysis software (8 and references therein).
The transient behavior was investigated using a flash photolysissetup previously described (9,10) based on an Nd:YAG Continuumlaser (Surelite II, third harmonics, kexc = 355 nm, pulse width ca. 7 nsand energy £1 mJ pulse)1) or an excimer laser (Lambda Physik)kexc = 308 nm, pulse width �20 ns and energy £1 mJ pulse)1). Thetransient spectra were obtained by monitoring the optical densitychanges each 5–10 nm over the 300–800 nm range and averaging atleast 10 decays at each wavelength. The kinetic analysis of the signalsat selected wavelengths allowed the transient decay time to bedetermined; transient lifetimes were measured at an absorbance ofabout 0.2; the concentration effect on lifetimes was not investigated.For the experiments concerning the triplet state, the D�T · uT product(where D�T is the difference between the extinction coefficients of thetriplet and that of the ground state and uT is the triplet quantum yield)
was measured at the transient absorption maxima. The calibration ofthe experimental setup was carried out with an optically matchedsolution of benzophenone in acetonitrile (triplet quantum yield,uT = 1 and D�T = 6500 MM
)1 cm)1) (11). In case of a triplet the D�T(and then uT values) were determined by the energy transfer methodby using disodium 3,3¢-disulfonatobenzophenone as an energy donorassuming for it the same triplet characteristics of benzophenone (12).The experimental errors on sT values were estimated to be about±10% while those on D�T and uT were ±15%.
Linear dichroism. Linear dichroism (LD) measurements wereperformed with a Jasco J500A spectropolarimeter equipped with anIBM PC and a Jasco J interface. The sample orientation was producedby a device designed by Wada and Kozawa (13) at a shear gradient of700 rpm (1400 g) in ETN (EDTA 1 mMM, Tris-HCl 10 mMM, NaCl10 mMM; pH = 7.0 buffer).
Phototoxicity tests. Cell cultures: Cultures of Balb ⁄ c mouse 3T3fibroblast and human keratinocytes (NCTC-2544) were grown inDulbecco’s modified Eagle medium (Sigma Co.) supplemented with115 U mL)1 of penicillin G (Invitrogen, Milan, Italy), 115 lg mL)1
streptomycin (Invitrogen) and 10% fetal calf serum (Invitrogen).Individual wells of 96-well tissue culture microtiter plate (Falcon;Becton-Dickinson) were inoculated with 100 lL of complete mediumcontaining 5 · 103 3T3 or NCTC-2544 cells. The plate was incubatedat 37�C in a humidified atmosphere of 5% CO2 for 24 h to form amonolayer of approximately 100% confluence. After the medium wasremoved, 100 lL of the drugs, dissolved in phosphate buffer, wereadded to each well after dilution with Hank’s balanced salt solution(HBSS; pH=7.2). The plate was then incubated for 30 min in anatmosphere of 5% CO2 at 37�C, the control plate was placed in thedark. After irradiation, the solution was replaced by the medium andthe plates were placed in the incubator for 72 h. Cell viability wasassayed by the MTT [3-(4,5-dimethylthiazol-2-yl)-2,5-diphenyl tetra-zolium) bromide] test as described previously (5).
Irradiation procedure: One or two PL-S 9 W ⁄ 12 Philips lamps (280–370 nm; peak at 315 nm) were used for irradiation experiments asdescribed before (5). To restrict the incident radiation to the range 310–370 nm, a glass filter (Schott SWG-320) was used. The total energy wasdetected by a radiometer model 97503–00 Cole-Parmer InstrumentCompany (Niles, IL) equipped with a sensor (model CX-312).
Cell cycle analysis: For DNA flow cytometric analysis, 5 · 105
NCTC-2544 cells in exponential growth were irradiated in the presenceof different concentrations of the test compounds and analyzed after24, 48 and 72 h. After an incubation period, the cells were centrifuged,fixed in ice-cold ethanol (70%), then treated with lysis buffercontaining ribonuclease A (RNAseA), and finally stained withpropidium iodide (PI). Samples were analyzed on a Becton CoulterEpics XL-MCL flow cytometer. For cell cycle analysis, DNAhistograms were analyzed using MultiCycle� for Windows (PhoenixFlow Systems, San Diego, CA).
Externalization of phosphatidylserine: Surface exposure of phos-phatidylserine (PS) by apoptotic cells was measured by flow cytometrywith a Coulter Cytomics FC500 (Coulter) by adding Annexin-V-FITCto cells according to the manufacturer’s instructions (Annexin-VFluos; Roche Diagnostic). Simultaneously cells were stained with PI.Excitation was set at 488 nm and the emission filters were at 525 and585 nm, respectively.
Assessment of mitochondrial changes and reactive oxygen speciesproduction: The mitochondrial membrane potential was measured withthe lipophilic cation 5,5¢,6,6¢ tetrachlo-1,1¢,3,3¢-tetraethylbenzimidazol-carbocyanine (JC-1; Molecular Probes, Eugene, OR) as describedpreviously (14). Briefly, 24 h after irradiation the NCTC-2544 cells weretrypsinized, collected by centrifugation and resuspended in HBSScontaining JC-1 at the concentration of 1 lMM. The cells were thenincubated for 10 min at 37�C, centrifuged, washed and resuspendedagain in HBSS. The fluorescence was recorded by flow cytometry. Theproduction of reactive oxygen species (ROS) and the oxidation ofcardiolipin were measured by flow cytometry using hydroethidine(HE;Molecular Probes), dihydrochlorofluorescein-diacetate (DCFDA;Molecular Probes) and 10-N-nonyl-acridine orange (NAO; MolecularProbes), respectively, as described previously (14). Twenty-four hoursafter irradiation the cells were collected by centrifugation and resus-pended in HBSS containing the fluorescence probes HE, DCFDA orNAO at the concentration of 2.5, 5.0 and 0.1 lMM, respectively. The cellswere then incubated for 30 min at 37�C, centrifuged and resuspended
Scheme 1
1416 Giampietro Viola et al.
again in HBSS. The fluorescence was directly recorded with the flowcytometer using the 488 nmwavelength as excitation and the emission at585 for HE and 530 nm for DCFDA and NAO.
Lysosomal stability assessment: NCTC-2544 cells were assessed forlysosomal stability using the acridine orange (AO) uptake method(15,16). After irradiation in the presence of the test compounds, thecells were stained with AO at the concentration of 5 lg mL)1 for15 min at 37�C, washed and then analyzed by flow cytometry using asexcitation wavelength 488 nm and detecting the emission at 546 nm.
Lipid peroxidation: For the experiments concerning the lipidperoxidation, the NCTC 2544 cells were seeded at the concentrationof 50 000 cells mL)1 in 35 mm petri dishes and grown for 2 days toreach confluence, and were irradiated in HBSS in the presence of thetest compounds. At the indicated times the supernatant was collectedand frozen after addition of 2,6-di-tert-butylhydroxytoluene (2% inethanol). Cells were removed with the aid of a cell scraper after theaddition of 500 lL of water. Lipid peroxidation both in the supern-atants and in the cell extracts was measured using a TBA assay asdescribed by Morliere et al. (17). A standard curve of 1,1,3,3tetraethxypropane was used to quantify the amount of producedmalonaldehyde. Data are expressed in terms of nanomoles ofthiobarbituric acid reactive substances (TBARS) normalized to thetotal protein content, measured as described (18), in an aliquot of thecell extract.
Studies on isolated proteins: Solutions of BSA (0.5 mg mL)1) inphosphate buffer 10 mMM were irradiated in the presence of the testcompounds for various times in a quartz cuvette. At each time, thetryptophane (Trp) content was followed by monitoring the character-istic Trp fluorescence as described by Balasubramanian and Zigler(19). Solutions of RNAseA, 0.5 mg mL)1 in phosphate buffer 10 mMM
were irradiated in the presence of the test compounds for various timesin a quartz cuvette. Analogous experiments were performed in thepresence of SOD during the irradiation. The degree of proteinoxidation was monitored spectrophotometrically, by the methods ofLevine et al. (20), by derivatization with 2,4-dinitrophenylhydrazine.
pBR322 DNA strand breaks: Each pBR322 DNA sample (100 ng)dissolved in TE buffer (10 mMM Tris-HCl, 1 mMM EDTA, pH 7.5) wasirradiated by increasing UV doses in the presence of the compoundsunder examination. After irradiation, two aliquots of the sample wereincubated at 37�C with Fpg (formamydo-pyrimidine glycosilase) andendonuclease III (Endo III), respectively, as previously described (21).Samples were loaded on 1% agarose gel, and the run was carried out inTAE buffer (0.04 MM Tris-acetate, 1 mMM EDTA) at 50 V for 4 h. Afterstaining in ethidium bromide solution, the gel was washed with water,and the DNA bands were detected under UV radiation by a UVtransilluminator. Photographs were taken by a digital photocamera(Kodak DC256), and the quantitation of the bands was achieved byimage analyzer software Quantity One (BIO-RAD, Milan, Italy).
Statistical analysis. The differences between irradiated and nonir-radiated samples were analyzed, where appropriate, using one-wayanalysis of variance and the Student’s t-test.
RESULTS AND DISCUSSION
Absorption and emission properties
The absorption and emission spectra of AQ, PQ and CQrecorded in acetonitrile, water and phosphate-buffered saline
(PBS) are reported in Fig. 1 (upper panel). The three drugsabsorb mainly the UVA and UVB light; furthermore, AQ andPQ also possess a small cross section in the visible spectrum.
The absorption coefficients of AQ, PQ and CQ are in the range0.3–4.1·104 MM
)1 cm)1 and their features are typical of p fi p*transitions, as already reported for other antimalarial drugs
(quinine, mefloquine and acridine) (5). The absorption prop-erties of AQ, PQ and CQ are summarized in Table 1. The lowsolubility of PQ and CQ prevented measuring their absorption
properties in acetonitrile.The fluorescence spectra of the antimalarial drugs were
recorded in PBS buffer (pH = 7.2) and they are reported in
the lower panel of Fig. 1. For all the drugs the emission spectraare featureless, and for AQ and PQ they are centered at 480and 520 nm, respectively; the CQ spectrum shows a main
maximum at 380 nm and a shoulder at 475 nm. Spectroscopicproperties (absorption, fluorescence and phosphorescencespectra) of CQ and hydroxychloroquine were previously
reported by Nord et al. (22) and the two findings are inagreement.
The fluorescence quantum yields in PBS are very low
(<10)2) for all three compounds (Table 2), indicating that theradiative channel is not an efficient decay pathway of theexcited state for these compounds. Despite the low fluores-
cence efficiency of AQ (uF < 10)4) together with the lowsolubility in aqueous solutions, the lifetime was estimated to belower than the instrumental resolution (< 20 ps) for calcula-ting the lowest limit of kF (see Table 2). The fluorescence
lifetimes of PQ and CQ were measured in PBS buffer. In bothcases the decays were well described by a biexponentialfunction and the results are reported in Table 2. The
3000
2
Wavelength (nm)
ε (1
04 M-1 c
m-1)
0
2
CQ
PQ0
2
4 AQ
400
CQ AQ PQ
Flu
ores
cenc
e in
tens
ity (
a.u.
)
Wavelength (nm)
400
500 600
Figure 1. Absorption spectra (upper panel) of AQ, PQ and CQ inMeCN (full line), water (dashed line) and in PBS buffer (dotted line).Normalized fluorescence spectra (lower panel) of CQ (kexc = 330 nm),AQ (kexc = 310 nm) and PQ (kexc = 330 nm) in PBS.
Photochemistry and Photobiology, 2007, 83 1417

two-decay components of CQ were assigned to the biproto-nated and monoprotonated species on the basis of pKa values
(8.4 and 10.2) (23); in particular, the short component isattributed to the biprotonated species as the fluorescencemeasurements carried out in water (pH = 5.5) show asubstantial decrease in fluorescence quantum yield (8 · 10)3)
and a monoexponential decay with a lifetime of about 0.07 ns,which is assignable to the biprotonated form. The latter is inagreement with literature data (24). The PQ short-lived
component (sF = 0.06 ns) prevails and it is likely due to themonoprotonated species on the basis of pKa values (3.2 and10.4) (25). From the fluorescence quantum yield and the sFvalue of the most significant emitting component, the radiativerate constants kF were calculated (see Table 2). When kF wasdetermined, values of the order of 107 s)1 were obtained,which can be related to a partially forbidden transition from a
pp* excited state, as already observed for the antimalarialdrugs previously investigated (5).
Transient properties of the drugs alone
The transient species formed upon direct laser excitation of thecompounds under investigation were studied by laser flashphotolysis and their time-resolved spectra are shown in Fig. 2.
In particular, the transient species formed upon direct excita-tion at 355 nm of AQ in PBS buffer are reported. For this drugtwo transient species were detected: their presence was solvent
independent, as in acetonitrile (MeCN) and PBS buffer similarspectral features were observed. One transient showed anabsorption maximum centered at 390 nm and a first-order
kinetic decay (sT = 0.43 ls); moreover, a longer specie wasobserved at 300 nm. The latter transient can be assigned to thelowest triplet state of AQ because it (1) was formed during the
laser pulse, (2) decayed by first-order kinetics, (3) wasquenched by molecular oxygen with a rate constant close tothe diffusional limit (ca.1 · 109 MM
)1 s)1) and (4) was sensitizedby a higher energy donor (3,3¢-disulfonatobenzophenone).The transient at 390 nm was assigned to the radical cation ofthe drug through sensitization experiments with chloranil, awell-known electron acceptor (26–28) (Fig. 3, upper panel).
For AQ, the photoionization process occurred in the singletmanifold as the radical cation was formed during the laserpulse; moreover, the sensitization of the triplet by use of
benzophenone in MeCN did not lead to the formation of thesignal at 390 nm (Fig. 3, lower panel). Upon direct excitationof PQ in PBS two transient absorptions with maxima at 410and 700 nm were detected (Fig. 2), which were assigned to the
radical cation of PQ and to the solvated electron, respectively.The assignment was based upon spectral and kinetic analysisof the signals that gave the results in Table 3 and for
Table 1. Absorption properties of AQ, PQ and CQ in differentsolvents.
Compound Solvent k (nm) e (103 MM)1 cm)1)
AQ PBS (pH 7.2) 237 32250 23340 19
Water 238 27251 23341 19
MeCN 223 41253 20343 13
PQ PBS (pH 7.2) 259 23350 3.2
Water 259 37350 5.8
CQ PBS (pH 7.2) 342 19329 18255 16
Water 342 20329 18255 17
AQ = amodiaquine; PQ = primaquine; CQ = chloroquine;PBS = phosphate-buffered saline.
Table 2. Fluorescence properties of AQ, PQ and CQ in MeCN, waterand PBS.
CompoundSolvent(pH)
kmax
(nm) uF
sF(%) (ns)
kF(s)1)
AQ MeCN 410 1.5 · 10)2 – <1.0 · 107
Water 480 £10)4 <0.02PQ Water (5.5) 516 1.0 · 10)3 – 5.8 · 107
PBS (7.2) 522 3.5 · 10)3 0.06 (0.94)3.6 (0.06)
CQ Water (3.0) 380 7.0 · 10)3 0.06 (1.0) 2.9 · 107
Water (5.5) 380 8.0 · 10)3 0.07 (1.0)PBS (7.2) 380 5.0 · 10)2 0.03 (0.31)
1.7 (0.69)
AQ = amodiaquine; PQ = primaquine; CQ = chloroquine;PBS = phosphate-buffered saline.
300
0.00
0.02
0.00
0.01
-0.01
0.00
CQ
Wavelength (nm)
PQ
AQ
500400 600 700 800
Figure 2. Time-resolved absorption spectra in nitrogen-saturated PBSsolution of AQ recorded 0.06 (s), 0.38 (4), 1.19 (r) and 3.18 ()) ls,PQ 0.08 (s), 0.22 (4), 1.7 (r) and 3.2 ()) ls and CQ 1.4 (s), 7.8 (4)and 32 (r) ls after laser pulse.
1418 Giampietro Viola et al.

comparison with literature data. In particular, the solvated
electron assignment (absorbance centered at 700 nm) wasconfirmed by quenching it completely (within the instrumentaltime window) with N2O, that is a well-known electronscavenger (see Supplemental Materials). Once the D�T · uT
value was measured at kmax of the solvated electron (700 nm)using the literature value for its absorption coefficient (29), the
quantum yield for the photoionization process was determinedobtaining a value of 0.01. In the case of CQ, the transientabsorbing at 360 nm was formed upon excitation at 308 nmthat was tentatively assigned to the radical cation of the drug
(Fig. 2) for analogy with the other quinoline derivatives eventhough in the experimental conditions used for this drug, theabsorption due to the solvated electron could not be observed.
On the other hand, due to the low solubility of CQ inacetonitrile, the assignment through the experiment withchloranil was prevented. However, for quinacrine at pH 7.2,
laser excitation induces the radical cation formation, eventhough the solvated electron was not detectable by ns laserflash photolysis (5) due to its short lifetime (30). The
occurrence of dechlorination process was excluded, under thedescribed experimental conditions, by the absorption spectraoverlap, before and after flash photolysis measurements.
No transient signals were detected for CQ and PQ when
directly excited in acetonitrile, thus for both the drugs notriplet state was detected upon laser irradiation, although theformation of a short-living triplet state cannot be excluded.
These results are in agreement with the low values of singletoxygen quantum yields measured on the drugs under investi-gation in acetonitrile and in D2O reported in the literature. In
fact, for AQ, uD in D2O is 0.011(4), while for CQ and PQ, it islower than 0.005 (31), indicating that the drugs underinvestigation practically do not produce singlet oxygen inphysiologic conditions. Generally, these compounds are less
efficient than quinine at sensitizing singlet oxygen likelybecause of their short triplet lifetimes (<50 ms) and tripletstate (which are shorter than that of quinine), although a low
intersystem crossing efficiency cannot be excluded.
Cellular phototoxicity
The phototoxicity of AQ, CQ and PQ was studied in two cell
lines: 3T3 murine fibroblast cells, a widely accepted in vitromodel for skin irritation and photosensitization, and NCTC-2544, a human keratinocyte cell line (for a complete picture of
the biological assays used in this study, see SupplementalMaterials).
As shown in Fig. 4 (upper and lower panels), irradiation inthe presence of the three compounds resulted in a low
decrease in cell viability. Cellular phototoxicity was assessedwith the MTT assay carried out 72 h after irradiation atdifferent UV doses. The results are similar, within the
experimental error, between the two cell lines; PQ induces a20% and 40% decrease in cell viability at the concentrationsof 100 and 200 lMM, respectively, whereas AQ and CQ induce
a lower effect. For evaluating which reactive species areinvolved in the mechanism(s) of photoinduced cell toxicity,analogous experiments were performed with NCTC-2544 cellsfor CQ and PQ, irradiating (0.75 J cm)2) them in the
presence of different additives (scavengers). It can beobserved from Table 4 that BHA and GSH, two radicalscavengers, significantly increase the cell viability for both
compounds. DMTU, which is an efficient scavenger ofhydroxyl radicals (OH·), also significantly protects the cellsfrom the photoinduced damage. Interestingly, both CAT and
SOD extensively increase the cell viability, indicating that thesuperoxide anion and hydrogen peroxide may also beinvolved in the mechanism of action.
Figure 3. Time-resolved absorption spectra of AQ (upper panel) andchloranil in nitrogen-saturated MeCN solution recorded 0.032 (s),0.13 (4), 0.37 (r), 1.23 ()) and 3.44 (*) ls after laser pulse(kexc = 355 nm). Time-resolved absorption spectra of AQ (lowerpanel) and 3,3¢-disulfonatobenzophenone in nitrogen-saturated MeCNsolution recorded 0.032 (s), 0.22 (4), 0.46 (r), 1.42 ()) and 3.58 (*)ls after laser pulse (kexc = 355 nm).
Table 3. Properties of the transients of AQ, PQ and CQ produced bydirect irradiation in PBS buffer (kexc = 355 nm).
Compoundkmax
(nm)sTr(ls)
D�Tr · uTr
(MM)1 cm)1)D�Tr
(MM)1 cm)1) uTr
AQ 300 1.1 50 <10)2
390 0.43 73PQ 410 t½ = 650 145 1.0 · 10)2
700 0.21 179 18 700 1.0 · 10)2
CQ 360 7.7 1550 <10)2
AQ = amodiaquine; PQ = primaquine; CQ = chloroquine;PBS = phosphate-buffered saline.
Photochemistry and Photobiology, 2007, 83 1419

Assessment of apoptosis
To characterize the mode of cell death (necrosis or apoptosis)photoinduced by the antimalarial drugs, a biparametriccytofluorimetric analysis was performed with PI and Annex-
in-V-FITC, which stain DNA and PS residues, respectively.Annexin-V is a Ca2+-dependent phospholipid binding proteinwith high affinity for PS. Annexin-V staining precedes the loss
of membrane integrity that accompanies the latest stages ofcell death resulting from either apoptotic or necrotic processes(32). Considering that externalization of PS occurs in the
earlier stages of apoptosis, Annexin-V staining identifiesapoptosis at an earlier stage than sub-G1 appearance, whichrepresents a later stage of apoptosis, being based on nuclear
changes, such as DNA fragmentation.Figure 5 shows the results of human keratinocytes 24 h
after irradiation (0.75 J cm)2) in the presence of antimalarialdrugs at the concentration of 100 lMM. In good agreement with
the MTT test, the two most active compounds were CQ andPQ, which induce a remarkable percentage of Annexin-V-positive cells. Also in this case AQ was found to be ineffective.
It is also noteworthy that a very small percentage of necroticcells (2–3%) was observed (data not shown).
Cell cycle effects
To investigate the effects of antimalarial drugs upon UVirradiation on the cell cycle, NCTC cells were treated with thetest compounds at the concentration of 100 lMM and at the lightdose of 0.75 J cm)2. After 24, 48 and 72 h from the time of
irradiation, the cells were fixed and labeled with PI. Thedifferent phases of the cell cycle were analyzed by flowcytometry. The treatment of keratinocytes with the three
compounds did not induce any variation in comparison withthe irradiated control as shown in Table 5 by the similarpercentage of the different phases of the cell cycle.
Mitochondrial and lysosomal assessment
To investigate which cellular sites are involved in the photo-toxicity induced by antimalarial drugs, mitochondria and
Figure 4. Percentage of viability of 3T3 mouse fibroblasts (upperpanel) and NCTC-2544 human keratinocytes (lower panel), after UVirradiation in the presence of antimalarial drugs. Cells were irradiatedat different UV doses and at different concentrations of drugs. Cellviability was measured by the MTT test after 72 h from the timeof irradiation. Data represent mean ± SEM for at least threeindependent experiments.
Table 4. Effects of different scavengers on the phototoxicity inducedin NCTC-2544 cells by PQ and CQ.
CompoundsScavenger
(concentration)% cellviability
CQ 200 lMM None 70.0 ± 3.4BHA (10 lMM) 87.2 ± 5.1NaN3 (20 mMM) 70.6 ± 4.5DMTU (1 mMM) 94.4 ± 2*GSH (1 mMM) 99.0 ± 3*CAT (1000 IU mL)1) 100 ± 7.6*SOD (2000 IU mL)1) 88.9 ± 8.7
PQ 200 lMM None 50.1 ± 5.2BHA (10 lMM) 80.0 ± 7.8*NaN3 (20 mMM) 63.0 ± 6.9DMTU (1 mMM) 86.6 ± 4.6*GSH (1 mMM) 83.5 ± 3.8*CAT (1000 IU mL)1) 100 ± 9.8*SOD (2000 IU mL)1) 85.8 ± 5.7*
Cells were irradiated at the UV dose of 0.75 J cm)2 and the cell viabilitywasmeasured 72 h from the treatment. PQ = primaquine; CQ = chlo-roquine; BHA = 2,6-di-tert-butylhydroxyanisole; NaN3 = sodiumazide; DMTU = N-N¢ dimethyl thiourea; GSH = glutathionereduced form; CAT = catalase; SOD = superoxide dismutase.*P<0.01 vs none (Student’s t-test).
Figure 5. Percentage of Annexin-V-positive cells for the test com-pounds after 24 h from the time of irradiation. The NCTC-2544 cellswere irradiated (0.75 J cm)2) in the presence of the antimalarial drugsat the concentration of 100 lMM and analyzed after 24 h by flowcytometry as described in Materials and Methods. Data representmean ± SEM for three experiments.
1420 Giampietro Viola et al.

lysosomes were employed. It has been previously shown thatmitochondrial and ⁄ or lysosomial alterations are involved incell death caused by many photosensitizers including fluoro-
quinolones (33) and porphyrins (34). Thus, experiments toassess changes in mitochondrial functions were performedmeasuring mitochondrial potential (Dwmt). Possible modifica-tions photoinduced by the three drugs on Dwmt were monit-
ored by flow cytometry using the JC-1 dye, which is considereda reliable probe to assess such events (35). JC-1 has theproperty of forming red fluorescent aggregates locally and
spontaneously under high mitochondrial Dwmt, whereas themonomeric form fluoresces green. Flow cytometric analysis ofNCTC-2544 cells 24 h after irradiation in the presence of the
compounds shows (Fig. 6, upper panel) a slight reduction ofDwmt in the presence of PQ and a significant effect with CQ,whereas the sample treated with AQ exhibits values similar to
that of the irradiated control.To investigate the integrity of lysosomes after irradiation
with the test compounds, flow cytometric analysis was per-formed using the fluorescent dye AO. AO is a lysosomotropic
base and a metachromatic fluorochrome exhibiting red fluores-cence when highly concentrated, as in the case of intactlysosomes where AO is retained in its protonated form, or a
green fluorescence at low concentration as in the case ofdamaged lysosomes. AO relocates in the cytosol mainly in thedeprotonated form (15,16). The number of cells with intact
lysosomes can be evaluated by assaying red fluorescence afterthe staining by AO of the cells exposed to the photosensitizer bymeans flow cytometric analysis. As can be observed from Fig. 6(lower panel), a very low extent of lysosomal damage was
photoinducedby the three drugs under investigation.Altogetherthe results suggest that lysosomes are not a preferential site ofphotosensitization for these antimalarials.
Production of reactive oxygen species
Mitochondrial membrane depolarization has been associated
with the mitochondrial production of ROS (36). Therefore,whether ROS production increases after treatment with the testcompounds was investigated. We utilized the fluorescence
probes HE and dichlorofluorescein diacetate (DCFDA), whosefluorescence appears if ROS are generated (37). HE is oxidizedby superoxide anion into ethidium ion which emits red fluores-cence. Superoxide is produced by mitochondria due to a change
from the normal 4-electron reduction of O2 to a 1-electronreduction when cytochrome c is released in the cytosol. ROSgeneration was also measured with the dye DCFDA, which is
oxidized to the fluorescent compound dichlorofluorescein(DCF) by a variety of peroxides including hydrogen peroxide.The results in Fig. 7 show a remarkable production of ROS as
evidenced by the high percentage of HE-positive cells. DCFDAanalysis shows no significant variations.
The damage caused by ROS in mitochondria was alsoevaluated by assessing the oxidation state of cardiolipin, a
phospholipid restricted to the inner mitochondrial membrane,using the specific dye NAO (38). This fluorescent probespecifically interacts with cardiolipin; its binding affinity and
fluorescence properties depend on the oxidation state of car-diolipin. NAO binds with high affinity to a nonoxidizedcardiolipin in a 2:1 ratio, whereas, in the case of oxidized
cardiolipin, NAO binds this phospholipid with a decreased
Table 5. Effect of irradiation of antimalarial drugs on the cell cycle ofthe NCTC-2544 cell.
Treatment
Cell cycle phases
G1 S G2 ⁄M
24 hDark 62.6 36.0 2.4UV alone 16.2 62.9 20.9AQ 100 lMM 16.5 62.1 21.4CQ 100 lMM 17.8 60.1 21.1PQ 100 lMM 12.8 83.1 3.7
48 hDark 67.8 31.9 3.0UV alone 27.0 70.6 24.0AQ 100 lMM 26.5 63.2 10.3CQ 100 lMM 39.6 50.8 9.6PQ 100 lMM 38.2 55.0 6.8
72 hDark 70.8 21.3 7.9UV alone 54.8 35.2 10.2AQ 100 lMM 44.7 49.4 5.9CQ 100 lMM 52.5 35.3 12.1PQ 100 lMM 49.9 29.2 20.9
NCTC-2544 cells were irradiated (0.75 J cm)2) and the cell cycle wasanalyzed as described in the experimental section after 24, 48 and 72 hfrom the time of irradiation. The distribution of cells in the differentphases of the cell cycle was determined by the MultiCycle� cell cycleanalysis program.
Figure 6. Mitochondrial potential and lysosomal assessment inNCTC-2544 cells. The upper panel shows the percentage of cells withlow mitochondrial potential for the title compounds at the concentra-tion of 100 lMM after 24 h from the time of irradiation at the UV dose of0.75 J cm)2. In the lower panel the percentages of cells stained withAO (red fluorescence) are reported and analyzed by flow cytometry,after irradiation in the presence of the test compound as describedbefore.
Photochemistry and Photobiology, 2007, 83 1421

activity that reflects in a lower fluorescence intensity (39).Therefore, oxidative stress localized to mitochondria can beassessed by measuring the fluorescence of NAO. Irradiated
NCTC-2544 cells show (Fig. 7, lower panel) a remarkabledecrease inmeanNAOfluorescence with CQafter 48 h from thetime of treatment, which is consistent with a loss in cardiolipin
content. Differently, PQ does not induce a significant effect.
Lipid peroxidation
The antimalarial drugs are hydrophobic, as demonstrated by
their calculated partition coefficients (c log P: AQ = +4.66,CQ = +4.27, PQ = +2.44) (40), so they are expected to belocalizedmainly in the plasmaand ⁄ or in subcellularmembranes,rendering these structures particularly sensitive to photodam-
ages. The TBA assay was used to determine whether lipidperoxidation occurs upon irradiation of NCTC-2544 cellsincubated in the presence of test compounds. The TBA test
was performed both on themedium and in the cell homogenates,as described in the experimental section. Figure 8 presents theresults for the three drugs as a function of light doses. TBARS
are significantly produced in the supernatant (upper panel) andin the cell extract (lower panel) when human keratinocytes areexposed to UV in the presence of CQ and PQ.
Protein photodamage
To investigate more deeply the photosensitizing properties ofthe three compounds toward other components of the cell
membrane (such as proteins), PBS solutions of the three drugscontaining BSA or RNAseA as models were irradiated andanalyzed at different time intervals. The degree of oxidative
modification was measured by monitoring the carbonylcontent, which is an index of oxidative damage of the proteins(20). The results, reported in Fig. 9, demonstrate that both CQ
and PQ significantly increase the carbonyl content of BSA andRNAseA after irradiation.
Irradiated BSA showed an increase in carbonyl content of22% at the maximum UV dose used (2.4 J cm)2), while the
amount for CQ and PQ raised significantly by 58% and 35%,respectively. A similar picture can be observed with RNAseA,which after irradiation showed only a modest degree of
oxidation but after irradiation in the presence of the drugsshowed an increase in carbonyl content of 64% and 49% forCQ and PQ, respectively.
Moreover, the content of the aromatic amino acid trypto-phan (Trp) was directly analyzed in the solutions of BSA,irradiated in the presence of antimalarial drugs, by monitoringthe Trp residue fluorescence (19). As Fig. 9 (lower panels)
shows, a rapid decrease in emission fluorescence is observedfor CQ. No significant effects were observed when BSA wasirradiated alone with the same experimental conditions or in
the presence of PQ. RNAseA was selected as a protein model
Figure 7. Production of reactive oxygen species (upper panel) andcardiolipin oxidation (lower panel) in NCTC-2544 cells after 24 h fromthe time of irradiation at the concentration of 100 lMM of each drug andat the UV dose of 0.75 J cm)2. Data represent mean ± S.E.M. forthree experiments. *p < 0.05.
Figure 8. Lipid peroxidation induced in NCTC-2544 cells after 24 hfrom the time of irradiation (0.75 J cm)2) in the presence of the testcompounds at the concentration of 100 lMM. The TBA test was per-formed on the supernatant medium and on the cell homogenates asdescribed in Materials and Methods. Upper panel: supernatantmedium, lower panel: cell homogenates. Data represent mean ±S.E.M. for three experiments. *p < 0.05.
1422 Giampietro Viola et al.

because of the lack of Trp residues together with the presenceof Tyr residues in its sequence; as a consequence, its emission
band, centered at about 310 nm, completely arises from Tyrresidues. The emission band is significantly modified afterirradiation with CQ but not with PQ (as already observed with
BSA). Altogether, these results suggest that both Trp and Tyrare involved in the photodamage induced by CQ. Interestingly,in the presence of SOD, and only when BSA is involved, thephotoinduced protein oxidation exhibited by CQ is signifi-
cantly reduced, indicating that the protein photodamage mightbe due to the superoxide anion.
Antimalarial–DNA binding
Recently, we reported investigations on the binding of quinineand synthetic antimalarial drugs into DNA and on thephotodamages induced in this macromolecule (41). It was
worthy of extending the study to the DNA binding propertiesof AQ, CQ and PQ and to their potential ability tophotodamage DNA upon irradiation.
The absorption spectra of the drugs in the presence ofincreasing concentrations of salmon test DNA are shown inFig. 10. For all the investigated drugs, a decrease in theabsorbance at the lower energy maxima was observed by the
addition of DNA. The drug molecules appear to interactstrongly with DNA bases, causing a rather extensive hypo-chromicity in some cases accompanied by a batochromic shift
of the spectrum. The increase in DNA concentrations resultedin a strong decrease in the absorption intensity at both peaks
of CQ, accompanied by a shift toward higher wavelengths.Two isosbestic points were observed at 305 and 350 nm,respectively. The observed spectral changes were consistent
with the formation of one complex with a defined structureand stoichiometry, which do not change upon increasing the
Figure 9. Photosensitized protein oxidation by antimalarial drugs. BSA and RNAseA were irradiated at different UV doses in the presence of CQand PQ in PBS buffer at the concentration of 100 lMM. Protein oxidation was evaluated by monitoring the carbonyl content (upper panels) and theloss of emission intensity of the proteins (lower panels); measurements were also performed in the presence of SOD at the concentration of2000 IU mL)1. Data represent mean ± SEM for four experiments.
Figure 10. Absorption spectra of AQ, PQ and CQ in ETN 0.01 MM
pH= 7.0 buffer at increasing concentrations of DNA. Insets:m ⁄Lfree vs m plots.
Photochemistry and Photobiology, 2007, 83 1423
DNA concentration. The same spectral behavior was observedupon the addition of DNA to AQ and PQ solutions. Inparticular, for PQ, the addition of DNA brought about adecrease in the absorption maximum that was not coupled
with a significant red spectral shift. Schatchard plot analysis(42) was carried out on the absorbance value data of eachsystem to obtain the binding parameters for the interaction
process. Calculations of m and m ⁄C (where m is the bindingdensity in units of mole bound ligand per mole lattice and C isthe free ligand concentration) were performed by using the
absorbance values measured at the wavelengths chosen foreach drug–DNA system to minimize the error and extrapo-lating A where a plateau was reached. The insets in Fig. 10
report the plots of m ⁄Lfree vs m. Using a nonlinear least-squaresanalysis of the noncooperative neighbor exclusion model ofMcGhee and von Hippel (43) the intrinsic binding constants(Ka) and the apparent number of binding sites per base pair (n)
were evaluated and reported in Table 6. For all the com-pounds Ka values between 104 and 105 MM
)1 were determined,indicating that these drugs bind to DNA with a similar
affinity. The drugs under investigation present a less extendedaromatic area compared with the more commonly usedintercalators, acridines (two aromatic fused rings instead of
three). The latter and the association constant values renderthese compounds lying within the ‘‘minimal intercalatorconcept’’ proposed by Atwell et al. (44). The drug–DNAinteractions were further studied by fluorescence spectroscopy.
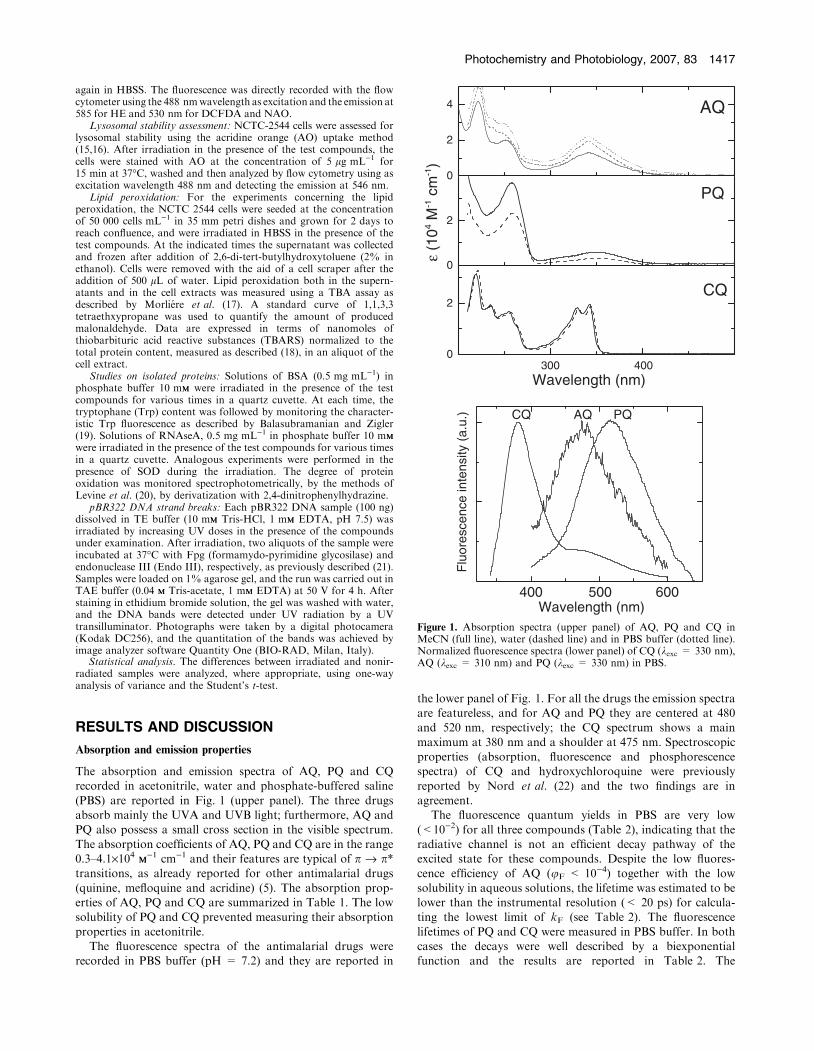
The fluorescence spectra with increasing concentrations ofDNA were recorded for CQ and PQ and are shown in Fig. 11.In both cases, upon addition of DNA, a fluorescence
quenching was observed. The quenching rate constants kqfor these molecules (Table 7), determined through the Stern–Volmer analysis, are higher than the diffusional rate constant,
confirming the occurrence of both static and dynamic inter-actions.
The binding geometry of antimalarial drugs was elucidated
by measuring the flow LD of the different drug–nucleic acidcomplexes. LD is a useful tool for the determination of thebinding of a dye–DNA complex (45,46). Figure 12 showsabsorbance and LD spectra for the three drugs at a different
[Drug] ⁄ [DNA] ratio. Inspection of the figures reveals that theLD spectra of AQ, CQ and PQ complexed with DNA arenegative in the 230–300 nm region where DNA absorbs. A
significant increase in the values of LD of the DNA band at260 nm for these antimalarial–DNA complexes is observed,indicating that the DNA becomes better oriented due to a
stiffening of the helix upon binding of the drugs. The LDbands of AQ and CQ complexed with DNA are also negativein the long-wavelength absorption region of the drugs (S0–S1transition, 300–550 nm). The negative LD signal in this
region is indicative of an intercalative mode of binding. Onthe contrary, PQ, despite a good absorption spectra in the300–450 nm range, does not present any LD signal in this
region, indicating that the drug is not intercalated in thedouble helix.
Laser flash photolysis experiments were carried out on AQ,CQandPQ in thepresence ofDNA. In all the cases no significant
spectral and kinetic changes were observed upon addition of themacromolecule reaching the same drug–DNA ratios used forabsorption and emission experiments.
Table 6. Association binding constant (Ka) and occupation number(n) of AQ, CQ and PQ in ETN buffer.
Compounds Ka (MM)1) n (bp)
AQ 1.42·105 ± 6 · 103 2.59 ± 0.05CQ 9.0·104 ± 2 · 103 2.45 ± 0.05PQ 1.8·104 ± 3 · 103 3.11 ± 0.16
AQ = amodiaquine; PQ = primaquine; CQ = chloroquine.
Figure 11. Quenching of fluorescence of CQ (upper panel) in ETN0.01 MM pH = 7.0 buffer by DNA, kexc = 330 nm. Inset: plot of I0 ⁄ I(at kmax = 380 nm) vs [DNA]. Quenching of fluorescence of PQ (lowerpanel) in ETN buffer by DNA, kexc = 330 nm. Inset: plot of I0 ⁄ I(at kmax = 522 nm) vs [DNA] concentration.
Table 7. Fluorescence properties and fluorescence quenching rateconstants (kq) by DNA of AQ, CQ and PQ in ETN buffer.
Compounds uF sF (ns) A1 ⁄A2 kqDNA (MM)1 s)1)
AQ £10)6 – – –CQ 0.0035 0.03 ⁄ 1.73 0.31 ⁄ 0.69 8.0 · 1012
PQ 0.050 0.06 ⁄ 3.60 0.94 ⁄ 0.06 4.8 · 1010
AQ = amodiaquine; PQ = primaquine; CQ = chloroquine.
1424 Giampietro Viola et al.

Photoinduced DNA damage
The photocleavaging properties of antimalarial drugs wereinvestigated using pBR322 plasmid DNA as a model system.Supercoiled circular DNA allows the detection of structural
alterations, such as strand breaks or damaged bases. DNAstrand breaks can be induced either directly (frank strandbreaks) or indirectly. In the latter case, DNA repair enzymes
were employed to determine the features of DNA modifica-
tions: Fpg protein recognizes 8-hydroxyguanine, purineswhose imidazole ring is open (Fapy residues) and sites of baseloss (apurinic sites) and Endo III recognizes apurinic sites and5,6-dihydropirimidine derivatives. Release of the damaged
base is followed first by a b-d reaction and later byb elimination step, resulting in DNA breakage (47). Togetherwith endonuclease modifications, the number of single strand
breaks generated by the excited photosensitizers was alsoquantified. The results indicate that the compounds underinvestigation did not induce DNA damage after UV irradi-
ation (see Supplemental Materials).
CONCLUSION
In this study the photobiological and photophysical proper-ties of three antimalarial drugs, namely CQ, PQ and AQ,have been investigated. The three drugs absorb mainly UVA
and UVB light and furthermore, AQ and PQ have a smallabsorption in the visible range. The first excited singlet stateinvolved in the absorption and emission processes has a p,p*nature. The related transition is partially forbidden as shownby extinction coefficient values and the fluorescence rateconstants (of the order of 107 s)1), close to those found forthe antimalarial drugs previously investigated (5). For the
three drugs under investigation in PBS buffer, transientspecies were detected under laser excitation, although theformation of quantum yields was very low. Radical cations
were observed for AQ and PQ, the triplet state only for AQand the transient state observed for CQ was attributed to theradical cation for analogy with similar quinolines. Taking
into account that the fluorescence quantum yields: theproduction of triplet and radical cation (Table 3) are verylow, the main decay pathway from the lowest excited singlet
states of AQ, PQ and CQ is the internal conversion. Theresults on the triplet formation are in agreement with the verylow quantum yields of singlet oxygen formation reported inthe literature (4,31).
For all the drugs investigated, significant modifications ofthe absorption band at lower energy were observed by theaddition of DNA. The spectral changes were consistent with
the formation of a complex with a defined structure andstoichiometry between the drugs and DNA. Using theMcGhee and von Hippel model, the intrinsic binding constants
(Ka) and the apparent number of binding sites per base pairwere evaluated; Ka values were about 105 MM
)1.Linear dichroism measurements of AQ and CQ complexed
with DNA show negative bands in the long-wavelength
absorption region of the drugs (S0–S1 transition, 300–550 nm). The negative LD signals in this region are indicativeof an intercalative mode of binding. On the contrary, PQ does
not present any LD signal in this region, suggesting that thedrug is not intercalated in the double helix.
The high values of the binding site size (exclusion param-
eter, n = 3) and LD spectra are consistent with a mixedbinding mechanism, likely corresponding to a coupling ofintercalation and external binding for AQ, CQ and with a
nonintercalative mechanism for PQ.In the framework of this general picture of the photophys-
ical behavior of three antimalarial drugs, photobiologicalexperiments were carried out to test their photoactivity against
several biological targets. The most important result obtained
Figure 12. Absorption and linear dichroism spectra of AQ (upperpanel) CQ (middle panel) and PQ (lower panel) recorded in ETNbuffer at different [drug] ⁄ [DNA] ratios: a = 0.00; b = 0.04; c = 0.08;d = 0.2.
Photochemistry and Photobiology, 2007, 83 1425
from this study is that the three molecules are less phototoxicthan quinine and mefloquine (5).
The results obtained for cell phototoxicity in two cellularlines indicated a slight decrease in cell viability for PQ and CQ
and an almost inactivity for AQ. Experiments carried out onNCTC-2544 cells in the presence of different scavengersshowed that in the case of PQ and CQ the addition of free
radical scavengers, SOD and CAT, has a marked protectiveaction for cell survival, whereas the addition of other scaven-gers (in particular scavengers of singlet oxygen) appears to
have no significant effects. This is in agreement with the lowquantum yield for the production of singlet oxygen by thesecompounds (4,31). The protective effect of SOD is also
confirmed when BSA is irradiated in the presence of CQ.The data reported by Motten et al. (4) in which theydemonstrated that these antimalarial drugs are able to producesuperoxide, hydroperoxyl or peroxy radical, are in agreement
with the reported findings.The various flow cytometry and biochemical experiments
reported here contribute to an understanding of the mechan-
ism of cell death induced by CQ and PQ. Both cell cycleanalysis and the externalization of PS indicate that treatmentwith the two drugs induces cell death by apoptosis after UV
irradiation. In particular, the two compounds cause relativelylittle perturbations of the cell cycle but induce cells to exit fromthe cycle and rapidly enter in apoptosis.
Primaquine and CQ induce mitochondrial damage as
demonstrated by the loss of the mitochondrial potential; it iswell known that in many models of apoptosis, if not in all,cells exhibit a dissipation of the mitochondrial inner
transmembrane potential that precedes nuclear DNA degra-dation (48). Lysosomes do not appear to be a site ofphotosensitization. Mitochondrial generation of ROS was
detected by flow cytometry analysis of HE and DCFDA. Infact, loss of the mitochondrial membrane potential is usuallyfollowed by an increase in the mitochondrial production of
ROS that are originated by the escape of electrons from thetransport chain. Moreover, mitochondrial changes, such asloss of cardiolipin content, are indicative of failure of themitochondrial matrix integrity. A very remarkable produc-
tion of ROS and cardiolipin oxidation was observed aftertreatment of cells with CQ, suggesting that mitochondriaplay a central role in the apoptosis induction by the
photoexcited drug.Other cellular structures seem to be involved in the
mechanism of phototoxicity exerted by CQ and PQ; in
particular, membrane lipids and protein appear to be photo-oxidized by treatment with these drugs. Converse to otherantimalarial drugs (41), AQ, CQ and PQ do not induce anyDNA photodamage, although they exhibit a significant
binding to the macromolecule. This effect is probably relatedto the absence, upon excitation of the drug–DNA complexes,of photocleavaging transient species and ⁄or the absence or
weakness of the interactions between the drug transients(triplets and radical cations) and DNA.
In conclusion, the photosensitizing activity of PQ and CQ is
lower than that of the other antimalarials, such as mefloquinecommonly used in the treatment of the disease. AQ seems to bethe only drug that does not induce significant photodamage in
all the assays carried out.
Acknowledgements—The authors gratefully acknowledge the financial
support of the Universita di Perugia e di Padova and of the Ministero
per l’Universita e la Ricerca Scientifica e Tecnologica (Rome).
SUPPLEMENTAL MATERIALS
The following supplemental materials are available for thisarticle:
Scheme S1 The scheme shows the potential targets involved
in the antimalarial phototoxicity investigated at the cellularand molecular levels with the various biological assaysemployed in the study
Figure S1 Induction of strand breaks in supercoiled pBR322plasmid DNA, by CQ (upper panel) and PQ (lower panel B)after UV irradiation for the indicated times. After irradiation,
the photosensitized DNA was treated with the enzymes Fpgand Endo III as described in Materials and Methods. Whitebars: pBR322 alone; gray bars: pBR322 plus drug at the molarratio 1:1. Data are expressed as percentage of form II obtained
after densitometric analysis of the digital picture of the agarosegel, and represent the mean ± SEM of three independentexperiments.
Figure S2 Decay kinetics of the solvated electron at 700 nmof PQ in PBS, recorded in N2 and N2O equilibrated solutions,produced upon laser irradiation (kexc = 355 nm).
This material is available as part of the online articlefrom: http://www.blackwell-synergy.com/doi/full/10.1111/j.1751-1097.2007.00181.x
Please note: Blackwell Publishing is not responsible for thecontent or functionality of any supplementary materialssupplied by the authors. Any queries (other than missingmaterial) should be directed to the corresponding author for
the article.
REFERENCES1. Butler, D. (1997) Time to put malaria control on the global
agenda. Nature 386, 535–540.2. Moore, D. E. and V. J. Hemmens (1982) Photosensitization by
antimalarial drugs. Photochem. Photobiol. 36, 71–77.3. Spikes, J. D. (1998) Photosensitizing properties of quinine and
synthetic antimalarials. J. Photochem. Photobiol. B, Biol. 42, 1–11.4. Motten, A. G., L. J. Martınez, N. Holt, R. H. Sik, K. Reszka, C.
F. Chignell, H. H. Tonnesen and J. E. Roberts (1999) Photo-physical studies on antimalarial drugs. Photochem. Photobiol. 69,282–287.
5. Aloisi, G. G., A. Barbafina, M. Canton, F. Dall’Acqua, F. Elisei,L. Facciolo, L. Latterini and G. Viola (2004) Photophysical andphotobiological behaviour of antimalarial drugs in aqueoussolutions. Photochem. Photobiol. 79, 248–258.
6. Favaro, G. and A. Romani (1993) Acid-base properties of diso-dium 3,3’-disulfonatobenzophenone (DBS) in the ground andexcited states. J. Chem. Soc. Faraday Trans. 89, 699–702.
7. Eaton, D. F. (1989) Luminescence spectroscopy. In Handbook ofOrganic Photochemistry, Vol. 1 (Edited by J. C. Scaiano), pp. 231–239. CRC Press, Boca Raton, FL.
8. Beechem, J. M., E. Gratton, M. Ameloot, J. R. Kutson and L.Brand (1988) The global analysis and Fluorescence intensity andanisotropy decay data: second generation theory and programs.In Fluorescence Spectroscopy, Vol. 1 Principles and Techniques(Edited by J. R. Lakowicz), pp. 241–305. Plenum Press, NewYork.
9. Gorner, H., F. Elisei andG.G. Aloisi (1992) Photoinduced electrontransfer between styrylanthracenes and electron donors andacceptors in acetonitrile. J. Chem. Soc. Faraday Trans. 88, 29–34.
1426 Giampietro Viola et al.

10. Romani, A., F. Elisei, F. Masetti and G. Favaro (1992) pH-induced effects on the photophysics of dipyridyl ketones. J. Chem.Soc. Faraday Trans. 88, 2147–2154.
11. Carmichael, I. and G. L. Hug (1786) Triplet–triplet absorption oforganic molecules in condensed phase. J. Chem. Phys. Ref. Data15, 1–204.
12. Fouassier, J. P., D. J. Lougnot, I. Zuchowics, P. N. Green, H. J.Timpe, K. P. Kronfeld and U. Muller (1987) Photoinitiationmechanism of acrylamide polymerization in the presence of water-soluble benzophenone. J. Photochem. 36, 347–363.
13. Wada, A. and S. Kozawa (1964) Instrument for the studies ofdifferential flow dichroism of polymer solution. J. Polimer. Sci.A2, 853–864.
14. Viola, G., A. Salvador, D. Vedaldi, E. Fortunato, S. Disaro, G.Basso and M. R. J. C. Queiroz (2006) Induction of apoptosis byphotoexcited tetracyclic compounds derivatives of benzo[b]thio-phenes and pyridines. J. Photochem. Photobiol. B, Biol. 82,110–116.
15. Zhao, M., J. W. Eaton and U. F. Brunk (2000) Protection againstoxidant mediated lysosomal rupture: A new antiapoptotic activityof Bcl-2? FEBS Lett. 485, 104–108.
16. Antunes, F., E. Cadenas and U. F. Brunk (2001) Apoptosisinduced by exposure to a low steady-state concentration of H2O2
is a consequence of lysosomal rupture. Biochem. J. 356, 549–555.17. Morliere, P., A. Mysan, R. Santus, R. Huppe, J. C. Maziere and
L. Dubertret (1991) UVA-induced lipid peroxidation in culturedhuman fibroblast. Biochim. Biophys. Acta 1084, 261–268.
18. Peterson, G. L. (1977) A simplification of the protein assaymethod of Lowry et al. which is more generally applicable. Anal.Biochem. 83, 346–356.
19. Balasubramanian, D. and J. S. Zigler (1990) The reaction ofsinglet oxygen with proteins, with special reference to crystallins.Photochem. Photobiol. 52, 761–768.
20. Levine, L. R., D. Garland, C. N. Oliver, A. Amici, I. Climent, A.G. Lenz, B. G. Ahn, S. Shaltiel and E. R. Stadtman (1990)Determination of carbonyl content in oxidatively modified pro-teins. Methods Enzymol. 186, 464–480.
21. Viola, G., L. Latterini, D. Vedaldi, G. G. Aloisi, F. Dall’Acqua,N. Gabellini, F. Elisei and A. Barbafina (2003) Photosensitizationof DNA strand breaks by three phenothiazine derivatives. Chem.Res. Toxicol. 16, 644–651.
22. Nord, K., J. Karlsen and H. H. Tonnesen (1994) Photochemicalstability of biologically active compounds. IX. Characterization ofthe spectroscopic properties of the 4-aminoquinolines, chloroqu-ine and hydroxyquinoline and of selected metabolites by absorp-tion fluorescence and phosphorescence measurements. Photochem.Photobiol. 60, 427–431.
23. Rosenberg, L. S. and S. G. Schulman (1978) Tautomerism ofsingly protonated chloroquine and quinacrine. J. Pharm. Sci. 67,1770–1772.
24. Ferrari, V. and D. J. Cutler (1987) Temperature dependence of theacid dissociation constants of chloroquine. J. Pharm. Sci. 76,554–556.
25. Hufford, C. D., J. D. McChesney and J. K. Baker (1983)Assignments of dissociation constants of primaquine by carbon-13NMR spectroscopy. J. Heterocycl. Chem. 20, 273–275.
26. Delcourt, M. O. and M. J. Rossi (1982) Photoionization of unsat-urated hydrocarbons at 249 nm in acetonitrile. Visible absorptionspectra of radical cations. J. Phys. Chem. 86, 3233–3239.
27. Gschwind, R. and E. Haselbach (1979) Laser-flash photolysis ofthe p-chloranil ⁄ naphthalene system: Characterization of thenaphthalene radical cation in a fluid medium.Helv. Chim. Acta 62,941–955.
28. Baciocchi, E., T. Del Giacco, F. Elisei and O. Lanzalunga (1998)Homolytic vs heterolytic C-H bond cleavage in alkylaromaticradical cations. Formation of diarylmethyl cation in the photo-induced electron transfer reaction of bis(4-methoxyphe-nyl)methane sensitized by chloranil. J. Am. Chem. Soc. 120,11800–11801.
29. Hart, E. J. and J. W. Boag (1962) Absorption spectrum of thehydrated electron in water and aqueous solution. J. Am. Chem.Soc. 84, 4090–4095.
30. Forest, S. E., M. J. Stimpson and D. J. Simon (1999) Mechanismfor the photochemical production of superoxide by quinacrine.J. Phys. Chem. B 103, 3963–3964.
31. Valencia, U. C., E. Lemp and L. A. Zanocco (2003) Quantumyields of singlet molecular oxygen, O2(
1Dg), produced by anti-malaric drugs in organic solvents. J. Chil. Chem. Soc. 48, 17–21.
32. Martin, S. J., C. P. Reutelingsperger, A. J. McGahon, J. A. Rader,R. C. van Schie, D. M. Laface and D. R. Green (1995) Earlyredistribution of plasma membrane phosphatidylserine is a generalfeature of apoptosis regardless of the initiating stimulus: Inhibi-tion by overexpression of Bcl-2 and Abl. J. Exp. Med. 182,1545–1556.
33. Ouedraogo, G., P. Morliere, M. Bazin, R. Santus, B. Kratzer, M.A. Miranda and J. V. Castell (1999) Lysosomes are sites offluoroquinolone photosensitization in human skin fibroblasts:A microspectrofluorometric approach. Photochem. Photobiol. 70,123–129.
34. Oleinick, N. L., R. L. Morris and I. Belichenko (2002) The role ofapoptosis in response to photodynamic therapy: What, where,why and how. Photochem. Photobiol. Sci. 1, 1–21.
35. Salvioli, S., A. Ardizzoni, C. Franceschi and A. Cossarizza (1997)JC-1 but not DiOC6(3) or rhodamine 123 is a reliable fluorescentprobe to assess DY changes in intact cells: Implications for studieson mitochondrial functionality during apoptosis. FEBS Lett. 411,77–82.
36. Zamzami, N., P. Marchetti, M. Castedo, D. Decaudin, A. Macho,T. Hirsch, S. A. Susin, P. X. Petit, B. Mignotte and G. Kroemer(1995) Sequential reduction of mitochondrial transmembranepotential and generation of reactive oxygen species in early pro-grammed cell death. J. Exp. Med. 182, 367–377.
37. Rothe, G. and G. Valet (1990) Flow cytometric analysis ofrespiratory burst activity in phagocytes with hydroethidine and2¢,7¢-dichlorofluorescein. J. Leukoc. Biol. 47, 440–448.
38. Petit, J. M., A. Maftah, M. H. Ratinaud and R. Julien (1992) 10N-nonyl acridine orange interacts with cardiolipin and allows thequantification of this phospholipid in isolated mitochondria. Eur.J. Biochem. 209, 267–273.
39. Gallet, P. F., A. Maftah, J. M. Petit, M. Denis-Gay and R. Julien(1995) Direct cardiolipin assay in yeast using the red fluorescenceemission of 10-N-nonyl acridine orange. Eur. J. Biochem. 228,113–119.
40. Ghoose, A. K. and G. M. Crippen (1986) Atomic physicochemicalparameters for three-dimensional structure-directed quantitativestructure–activity relationships I. Partition coefficients as ameasure of hydrophobicity. J. Comp. Chem. 7, 565–577.
41. Aloisi, G. G., M. Amelia, A. Barbafina, L. Latterini, F. Elisei, F.Dall’Acqua, D. Vedaldi, A. Faccio and G. Viola, (2007) DNAcleavage induced by photoexcited antimalarial drugs: A photo-physical and photobiological study. Photochem. Photobiol. 83,664–674. doi:10.1111/j.1751-1097.2007.00084.x.
42. Scatchard, G. (1949) The attraction of proteins for small mole-cules and ions. Ann. N. Y. Acad. Sci. 51, 660–672.
43. McGhee, J. D. and P. H. von Hippel (1974) Theorical aspects ofDNA–protein interactions: Co-operative and non-co-operativebinding of large ligands to a one-dimensional homogeneouslattice. J. Mol. Biol. 86, 469–489.
44. Atwell, G. J., C. D. Bos, B. C. Baguley and W. A. Denny (1988)Potential antitumor agents. 56. ‘‘Minimal’’ DNA-intercalatingligands as antitumor drugs: Phenylquinoline-8-carboxamides.J. Med. Chem. 31, 1048–1052.
45. Norden, B., M. Kubista and T. Kurucsev (1992) Linear dichroismspectroscopy of nucleic acid. Q. Rev. Biophys. 25, 51–171.
46. Norden, B. and T. Kurucsev (1994) Analysing DNA complexes bycircular and linear dichroism. J. Mol. Recognit. 7, 141–156.
47. Burrows, C. J. and J. G. Muller (1998) Oxidative nucleobasemodification leading to strand scission. Chem. Rev. 98, 1109–1151.
48. Ly, J. D., D. R. Grubb and A. Lawen (2003) The mitochondrialmembrane potential (Dwm) in apoptosis; an update. Apoptosis 3,115–128.
Photochemistry and Photobiology, 2007, 83 1427