A taxonomic revision of geoemydid turtles from ... - Semantic Scholar

Journal of Applied Ecology
2007
44
, 395–404
© 2007 The Authors. Journal compilation © 2007 British Ecological Society
Blackwell Publishing Ltd
The effect of the El Niño Southern Oscillation on the reproductive frequency of eastern Pacific leatherback turtles
VINCENT S. SABA,* PILAR SANTIDRIÁN-TOMILLO,† RICHARD D. REINA,‡ JAMES R. SPOTILA,† JOHN A. MUSICK,* DAVID A. EVANS* and FRANK V. PALADINO§
*
Department of Fisheries Science, Virginia Institute of Marine Science, College of William and Mary, Gloucester Point, VA 23062, USA;
†
Department of Bioscience and Biotechnology, Drexel University, Philadelphia, PA 19104, USA;
‡
School of Biological Sciences, Monash University, VIC 3800, Australia; and
§
Department of Biology, Indiana-Purdue University, Fort Wayne, IN 46805, USA
Summary
1.
Pacific leatherback turtle
Dermochelys coriacea
populations have been decliningprecipitously. It has been suggested that fishery-associated mortality is the leadingfactor causing the decline; however, the sensitivity of leatherbacks to climate variabilityrelative to their population ecology is unknown.
2.
We investigated the effects of interannual climate variability, as governed by the ElNiño Southern Oscillation (ENSO), on leatherback nesting ecology. We used equatorialPacific sea surface temperature (SST) anomaly data over various time scales derivedfrom both moored buoys and remote satellites as signals of ENSO. We then incorporatedthese data into a remigration probability model for the largest nesting population of easternPacific leatherbacks at Parque Nacional Marino Las Baulas (PNMB), Costa Rica.
3.
Our results showed that nesting females of PNMB exhibited a strong sensitivityto ENSO, as reflected in their nesting remigration probabilities. Cool La Niña eventscorresponded with a higher remigration probability and warm El Niño events corre-sponded with a lower remigration probability.
4.
We suggest that productivity transitions at leatherback foraging areas in the easternequatorial and south-eastern Pacific in response to El Niño/La Niña events result in vari-able remigration intervals and thus variable annual egg production. This phenomenonmay render the eastern Pacific leatherback population more vulnerable to anthropogenicmortality than other populations.
5.
Synthesis and applications
. Physical indices of environmental variation can be usedto estimate the probability of leatherbacks remigrating to nest at PNMB. This type ofmodelling approach can be extremely useful for understanding the effects of climaticvariation on the population dynamics of sea turtles. Our remigration probability modelcan be applied to any monitored sea turtle nesting population where nesting site fidelityand beach monitoring coverage remains high. This modelling approach can help nestingbeach monitoring programmes forecast remigrant numbers based on prior climate data,and can further quantify anthropogenic mortality by validating survival estimates.
Key-words
:
Dermochelys coriacea
, eastern Pacific leatherbacks, El Niño, ENSO,gelatinous zooplankton, interannual climate variability, La Niña, nesting remigrationinterval, Playa Grande, primary production
Journal of Applied Ecology
(2007)
44
, 395–404doi: 10.1111/j.1365-2664.2007.01276.x
Correspondence: Vincent S. Saba, Department of Fisheries Science–FSL 128, Virginia Institute of Marine Science, Rt. 1208Greate Road, Gloucester Point, VA 23062, USA (fax 804 684 7327; e-mail [email protected]).

396
V. S. Saba
et al.
© 2007 The Authors. Journal compilation © 2007 British Ecological Society,
Journal of Applied Ecology
,
44
, 395–404
Introduction
Understanding the effects of large-scale climate vari-ation on marine life is essential in order to single outanthropogenic influences. The highly stochastic natureof the Pacific Ocean, as governed by atmospheric andoceanic forcing, renders the productivity of its ecosys-tems variable (Chavez
et al
. 2003). Pacific leatherbackturtle
Dermochelys coriacea
Vandelli 1761 populationshave been declining precipitously over the past 15 years(Spotila
et al
. 2000), thus it is important to understandtheir sensitivity to climate variability relative to theirpopulation ecology. Incidental mortality among coastalgillnet fisheries is thought to be the major anthropo-genic influence on leatherback survival in the easternPacific (Kaplan 2005); however, the effect of environ-mental stochasticity on this population has yet to bedescribed.
Assessments of sea turtle populations are basedprimarily on the census of nesting females at specificbeaches. Mature female leatherbacks migrate tonesting beaches, where they lay several clutches of eggswithin a nesting season. The remigration interval is thetime between successive nesting seasons for a particularfemale and is heavily influenced by the ecological con-ditions in the turtle’s foraging areas (Carr & Carr 1970;Limpus & Nicholls 2000; Broderick, Godley & Hays2001; Chaloupka 2001; Solow, Bjorndal & Bolten 2002).Mature female sea turtles require a specific level ofenergy reserves to migrate to nesting beaches, undergovitellogenesis (egg formation) and successfully nest.If these energy requirements are not met, nesting willbe delayed until feeding conditions improve (Solow,Bjorndal & Bolten 2002). Egg fertilization by maturemale leatherbacks usually occurs near nesting beaches(Reina
et al
. 2005), suggesting that females have alreadymet their vitellogenesis energy requirements upon arrival.
The El Niño Southern Oscillation (ENSO) is the majorclimatic phenomenon that governs the overall inter-annual productivity of the equatorial Pacific (Chavez
et al
. 1999; Turk
et al
. 2001). Consequences of ENSOon the marine environment have also been demon-strated in the temperate latitudes of the North Pacific(Raskoff 2001; Marinovic
et al
. 2002; Franco-Gordo
et al
. 2004; Ruhl & Smith 2004) and South Pacific(Yáñez
et al
. 2001; Blanco
et al
. 2002; Carr
et al
. 2002;Escribano
et al
. 2004). Green turtles
Chelonia mydas
Linnaeus 1758 in the western Pacific have been shownto exhibit a sensitivity to ENSO that is reflected in theiregg production and nesting numbers (Limpus &Nicholls 2000; Chaloupka 2001).
In the north tropical Atlantic, sea surface tempera-ture (SST) anomalies are related to both ENSO and theNorth Atlantic Oscillation (Czaja, Van Der Vaart &Marshall 2002). Fluctuations in western Atlantic greenturtle annual nesting numbers at Tortuguero, Costa Rica,were attributed to a high sensitivity of their modelledremigration intervals to SST anomalies in south-westernPuerto Rico (Solow, Bjorndal & Bolten 2002). This
implies that populations of Atlantic sea turtles can alsobe influenced by interannual climate variation derivedfrom the tropical Pacific.
Among the leatherback nesting sites in the easternPacific, the beach complex at Parque Nacional MarinoLas Baulas (PNMB), Costa Rica, hosts the largestpopulation of mature females (Reina
et al
. 2002).Satellite tracking studies of post-nesting females atPNMB suggest that the turtles follow a south-westernmigration corridor along the Cocos Ridge towards theGalapagos Islands (Morreale
et al
. 1996; Shillinger &Block 2006), followed by an open migration throughthe eastern equatorial Pacific, the Chile-Peru HumboldtCurrent System, and the far off-shore waters of Peruand Chile (Shillinger & Block 2006), all of which aresubject to environmental variation via ENSO (Chavez
et al
. 1999; Turk
et al
. 2001; Yáñez
et al
. 2001; Escribano
et al
. 2004).Leatherbacks are foraging specialists relying on gelati-
nous zooplankton such as medusae, siphonophoresand salps (Frazier, Meneghel & Achaval 1985). Thehigh intrinsic growth rates of gelatinous organisms,coupled with their extreme sensitivity to the marineenvironment, render their abundance and distributionsporadic (Graham, Pagès & Hamner 2001; Mills 2001).Given the low caloric content of gelatinous organisms(Lutcavage & Lutz 1986; Hsieh, Leong & Rudloe 2001),mature female leatherbacks require large aggregationsof prey or areas that favour large prey items to buildtheir energy reserves required for nesting. If the marineenvironment of the equatorial and south-eastern Pacificis highly governed by ENSO, favourable leatherbackforaging areas are probably stochastic both spatiallyand temporally.
We introduce the first empirical analysis investigatingthe effects of interannual climate variability on leather-back ecology. We used equatorial Pacific SST anomalydata as signals of ENSO and incorporated these datainto a leatherback remigration probability model forthe nesting female population at PNMB. Information-theory principles (Burnham & Anderson 2002) wereapplied to identify areas of the equatorial Pacific thatproduced the best signal strength of ENSO for leather-back remigration probabilities. The spatial and temporaldynamics of SST anomalies at these areas were exam-ined through an empirical orthogonal function analysisand we elucidated their relationship to potential easternPacific leatherback foraging areas and ENSO strength.
Materials and methods
Leatherbacks on the Pacific coast of Costa Rica maintaina high site fidelity to their nesting beach (Santidrián-Tomillo
et al
. 2007). The nesting season at PNMBbegins in late September and ends in early March.Nesting females were tagged with passive integratedtransponder tags from 1993 to 2004. The majority of

397
ENSO influences Pacific leatherback nesting rate
© 2007 The Authors. Journal compilation © 2007 British Ecological Society,
Journal of Applied Ecology
,
44
, 395–404
the females were tagged in both flippers in case of singletag failure.
The nesting complex at PNMB consists of two mainbeaches: Playa Langosta and Playa Grande. Because90% of the females nest at Playa Grande in a given year(Santidrián-Tomillo
et al
. 2007), we based our remigrantanalysis only on turtles that were originally tagged at PlayaGrande. There is a small amount of beach exchange atPNMB (Santidrián-Tomillo
et al
. 2007); if a turtleoriginally tagged at Playa Grande nested exclusively atPlaya Langosta in a later year, we still counted the eventas a remigration. We did not include turtles that wereoriginally tagged at Playa Langosta and nested at PlayaGrande either within a year or thereafter. We thencalculated remigration intervals for 10 nesting seasonsfrom 1995 to 2004.
At PNMB, the mean observed internesting period,which is the time between ovipositions by an individualfemale, is 9·5 (
±
0·04) days and does not vary signifi-cantly from year to year (Reina
et al
. 2002). The numberof nests laid by an individual female in a particularnesting season can be measured by calculating the esti-mated clutch frequency (ECF) and/or the observedclutch frequency (OCF). The ECF is the preferredmethod because, unlike the OCF, it will not under-estimate clutch frequency if nesting events are missedin between a turtle’s first and last nesting. The study byReina
et al
. (2002) analysed ECF at PNMB from 1993to 1999; therefore, we calculated ECF from 2000 to2004 by using the first and last appearance dates for anindividual female and the mean observed internestingperiod, as in the previous study. This included femalesthat were observed nesting only once, resulting in anECF of 1. Because ECF at PNMB is positively corre-lated with beach coverage (Reina
et al
. 2002), we onlyincorporated prior ECF data into our analysis from1997 to 1999 where beach coverage was relatively high.
The predominating physical indices of ENSO areanomalies of SST in the equatorial Pacific (Chavez
et al
.1999; McPhaden & Yu 1999; Zelle
et al
. 2004; Burgers,Jin & Oldenborgh 2005). We used mean monthly SSTanomaly data from 59 individual moored buoys that arepart of the Tropical Atmosphere and Ocean/TriangleTrans-Ocean Buoy Network (TAO/TRITON) array(McPhaden
et al
. 2001) stretching across the equatorialPacific from 95
°
W to 156
°
E and 8
°
S to 8
°
N. We incor-porated the effect of SST on a turtle’s remigrationprobability by using a linear logistic model (Solow,Bjorndal & Bolten 2002):
where
β
0
and
β
1
are estimated parameters and SST
y
is a predictor variable representing the mean monthlySST anomaly (
°
C) from a particular TAO buoy averaged
from September of each year
y
to September of
y
−
13,
y
−
25 and
y
−
37 months. This allowed us to analysethe effects of mean environmental conditions on femaleremigration approximately 1, 2 and 3 years prior toeach nesting season.
We developed remigration models that determined theprobability of a turtle remigrating
R
iy
to Playa Grandein year
y
after
i
years using the following variables:annual survival,
s
i
; the effect of environmental con-ditions on the probability of remigrating,
p
y
; the effectof environmental conditions on the probability of notremigrating in previous years, ; and atime at sea influence,
t
. We constructed two models ofremigration:
where model B differs only by adding the (1/
i
)
t
term,indicating that turtles who did not remigrate after2 years may still have benefited from previous years’foraging. Two-year remigrant probabilities are missingthe term from both models because theydo not account for 1-year remigrants.
To estimate the random variable
R
iy
for 2–7 yearremigrants using the empirical tagging data from PlayaGrande, we derived the binomial likelihood probabilityfunction:
eqn 1
where
r
iy
is the number of remigrants nesting in year
y
that have not been observed nesting since year
y
−
i
,and
N
y
−
i
is the number of tagged turtles (both newand remigrant) from year
y
−
i
(see Appendix S1,Supplementary material). The term
R
iy
is the prob-ability of turtles surviving to year
y
and remigrating inyear
y
after 2–7 years, while 1
−
R
iy
is the probability ofturtles surviving 2–7 years but not remigrating to nest.The summarized log likelihood function of equation 1is:
eqn 2
accounting for 12 years of tagging data from 1993 to2004. Equation 2 is maximized by adjusting the para-meters
β
0
,
β
1
,
s
and
t
(model B only). Models A
0
and B
0
represent A and B under the condition that
β
1
=
0,
pyy
y
exp[ ( )]
exp[ ( )]=
++ +
β ββ β
0 1
0 11
SST
SST
∏ −=−
−ji
y jp12 1( )
for yrs
for yrs Model A
and
for yrs
for yrs Model B
i R s p
i R s p p
i R s p
i R s p i t p
iyi
y
iyi
y y jj
i
iyi
y
iyi
y y jj
i
( )
( / ) ( )
= =
≥ = −
= =
≥ = −
−=
−
−=
−
∏
∏
2
3 1
2
3 1 1
1
2
1
2
∏ −=−
−ji
y jp12 1( )
L r N RN
rR Ry iy y i iy
y i
iyiy
r
iy
N r
i
iy y i iy( | , ) ( ) ( )−− −
=
=
− −∏ 1
2
7
ln [ ln( ) ( ) ln( )],
,
L r R N r Riy iy y i iy iyi y
= + − −−= =∑ 1
2 1993
7 2004

398
V. S. Saba
et al.
© 2007 The Authors. Journal compilation © 2007 British Ecological Society,
Journal of Applied Ecology
,
44
, 395–404
eliminating the effect of SST
y
(Solow, Bjorndal &Bolten 2002). Each model’s remigrant estimate wasranked using the corrected Akaike information criterion(AIC
c
) (see Appendix S1, Supplementary material) among59 TAO buoys over three time scales and without theinclusion of SST
y
.
The linear logistic equation
p
y
is the probability ofremigration based purely on SSTy whereas Riy is thetotal probability of remigration based on py, s and t(model B). We used the empirical remigrant data fromPlaya Grande to calculate the likelihood function(equation 2) and then maximized it by adjusting theparameters β0, β1, s and t (model B only). This gives asignificant advantage over the model by Solow, Bjorndal& Bolten (2002) because they did not maximize theirlikelihood function using empirical remigrant data,they only used annual nesting numbers whereas weused both annual nesting numbers Ny−i and the annualremigrant numbers riy for 2–7 year remigrants. We alsoused the number of turtles that did not remigrate(Ny−i − riy) from the empirical data set so that our modeldid not assume that a female must remigrate in 2–7 years if she survives. By setting β1 = 0 in py (model A0
and B0), we eliminated the SSTy effect on remigration,leaving a constant probability for py such that Riy ispurely a function of time as annual survival is alsoconstant. The remigration probability Riy can be appliedto any remigration interval but it should be based onthe typical remigration interval range of the nestingpopulation in question.
We used Pathfinder 4-km advanced very high resolutionradiometer (AVHRR) satellite data (NASA 1985) toincrease the resolution of SSTy in the equatorial Pacific.Anomalies of SST were calculated at 5° × 5° gridsencompassing the same area as the 59 TAO buoys,and each grid was analysed under the remigrationprobability model over the three SSTy time periods (seeAppendix S1, Supplementary material).
We computed the first two principal components(PC1 and PC2) of AVHRR SST anomaly data via anempirical orthogonal function analysis (see AppendixS1, Supplementary material) that extended from20°N to 40°S. This enabled us to distinguish patterns ofSST variation in the equatorial and southern Pacificthat exhibited the greatest levels of SST variation. Wethen applied a harmonic analysis via a least-squaresmethod to compare the eigenvectors of the TAO arrayarea (95°W to 156°E and 8°S to 8°N) to the multivariateENSO index (MEI) (Wolter & Timlin 1998). Thisenabled us to elucidate the relationship of SST variationin the equatorial Pacific to ENSO strength variation(see Appendix S1, Supplementary material). We
determined the harmonic constituents of the MEIusing a Fourier analysis (Emery & Thompson 1998)and then applied them to a regression of the eigenvectorsof PC1 and PC2 to determine their variance explainedby the MEI.
Results
The remigration intervals of leatherbacks tagged atPlaya Grande typically ranged from 2 to 7 years (Fig. 1a).In some seasons, we observed 1-year, 8-years and 9-yearremigrants but they accounted for a very small per-centage of the total remigrant data set (1 year = 0·52%,8 years = 0·69%, 9 years = 0·52%). The number of rem-igrants from 1995 to 1997 was a function of the numberof turtles tagged since 1993 but did not explain theoscillations from 1998 to 2004 (Fig. 1b). Furthermore,when sufficient time passed to allow the observance of7-year remigrants, the remigrant composition was notconsistent from 2000 to 2004 (P < 0·05) (Fig. 1a).
From 1997 to 2004, the mean beach coverage was87·25% and the mean ECF was 6·50 (± 0·37) clutchesper season. The ECF did not vary significantly from1997 to 2004 (P = 0·16, n = 1183) and was not correlatedwith beach coverage (Pearson’s r = 0·36). Further-more, the ECF did not vary significantly between yearsthat followed El Niño (1997, 1998 and 2001–04) andthe years that followed La Niña (1999, 2000) (P = 0·16,n = 1183).
Fig. 1. Leatherback remigrant dynamics at Playa Grande. (a)The percentage of 2–7-year remigrants and (b) the totalnumber of individual 2–7-year remigrants observed nesting atPlaya Grande during each nesting season from 1995 to 2004.
399ENSO influences Pacific leatherback nesting rate
© 2007 The Authors. Journal compilation © 2007 British Ecological Society, Journal of Applied Ecology, 44, 395–404
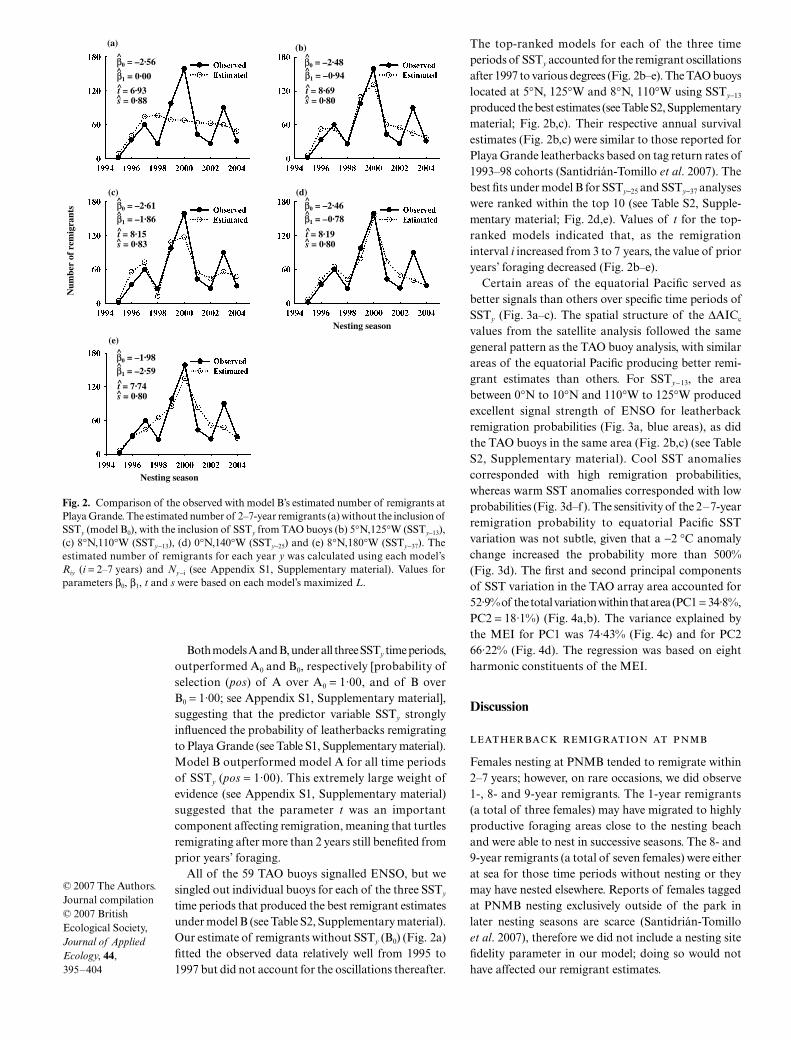
Both models A and B, under all three SSTy time periods,outperformed A0 and B0, respectively [probability ofselection (pos) of A over A0 = 1·00, and of B overB0 = 1·00; see Appendix S1, Supplementary material],suggesting that the predictor variable SSTy stronglyinfluenced the probability of leatherbacks remigratingto Playa Grande (see Table S1, Supplementary material).Model B outperformed model A for all time periodsof SSTy (pos = 1·00). This extremely large weight ofevidence (see Appendix S1, Supplementary material)suggested that the parameter t was an importantcomponent affecting remigration, meaning that turtlesremigrating after more than 2 years still benefited fromprior years’ foraging.
All of the 59 TAO buoys signalled ENSO, but wesingled out individual buoys for each of the three SSTy
time periods that produced the best remigrant estimatesunder model B (see Table S2, Supplementary material).Our estimate of remigrants without SSTy (B0) (Fig. 2a)fitted the observed data relatively well from 1995 to1997 but did not account for the oscillations thereafter.
The top-ranked models for each of the three timeperiods of SSTy accounted for the remigrant oscillationsafter 1997 to various degrees (Fig. 2b–e). The TAO buoyslocated at 5°N, 125°W and 8°N, 110°W using SSTy−13
produced the best estimates (see Table S2, Supplementarymaterial; Fig. 2b,c). Their respective annual survivalestimates (Fig. 2b,c) were similar to those reported forPlaya Grande leatherbacks based on tag return rates of1993–98 cohorts (Santidrián-Tomillo et al. 2007). Thebest fits under model B for SSTy−25 and SSTy−37 analyseswere ranked within the top 10 (see Table S2, Supple-mentary material; Fig. 2d,e). Values of t for the top-ranked models indicated that, as the remigrationinterval i increased from 3 to 7 years, the value of prioryears’ foraging decreased (Fig. 2b–e).
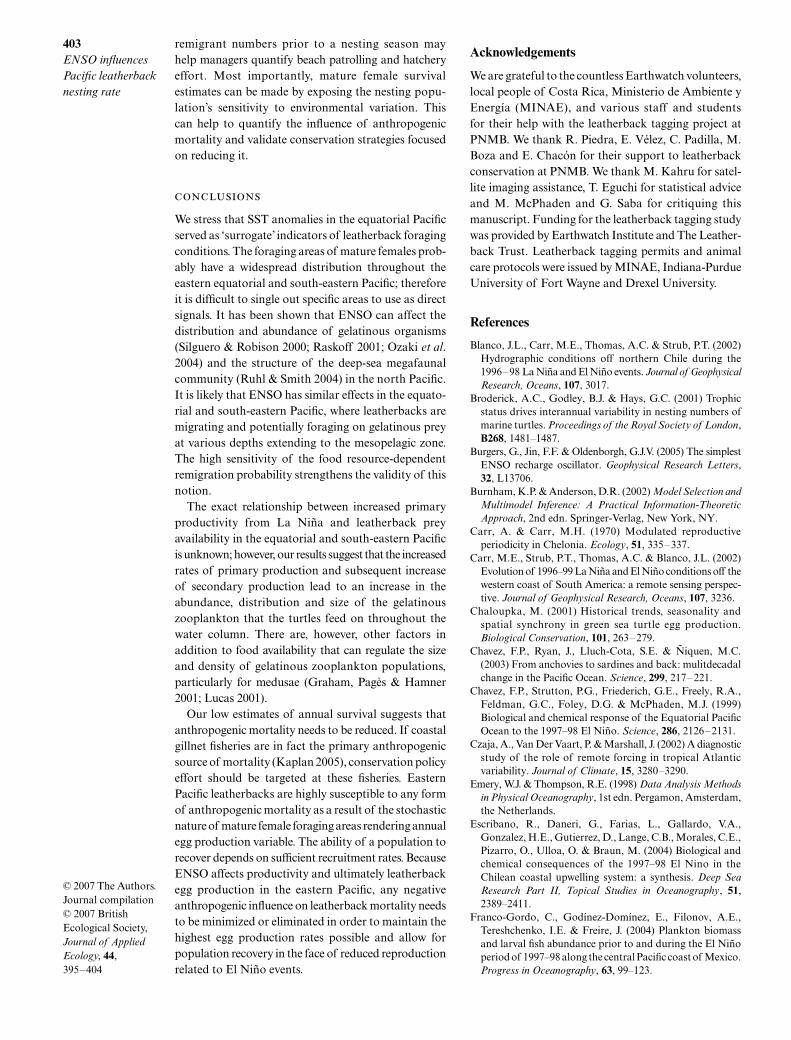
Certain areas of the equatorial Pacific served asbetter signals than others over specific time periods ofSSTy (Fig. 3a–c). The spatial structure of the ∆AICc
values from the satellite analysis followed the samegeneral pattern as the TAO buoy analysis, with similarareas of the equatorial Pacific producing better remi-grant estimates than others. For SSTy−13, the areabetween 0°N to 10°N and 110°W to 125°W producedexcellent signal strength of ENSO for leatherbackremigration probabilities (Fig. 3a, blue areas), as didthe TAO buoys in the same area (Fig. 2b,c) (see TableS2, Supplementary material). Cool SST anomaliescorresponded with high remigration probabilities,whereas warm SST anomalies corresponded with lowprobabilities (Fig. 3d–f). The sensitivity of the 2–7-yearremigration probability to equatorial Pacific SSTvariation was not subtle, given that a −2 °C anomalychange increased the probability more than 500%(Fig. 3d). The first and second principal componentsof SST variation in the TAO array area accounted for52·9% of the total variation within that area (PC1 = 34·8%,PC2 = 18·1%) (Fig. 4a,b). The variance explained bythe MEI for PC1 was 74·43% (Fig. 4c) and for PC266·22% (Fig. 4d). The regression was based on eightharmonic constituents of the MEI.
Discussion
Females nesting at PNMB tended to remigrate within2–7 years; however, on rare occasions, we did observe1-, 8- and 9-year remigrants. The 1-year remigrants(a total of three females) may have migrated to highlyproductive foraging areas close to the nesting beachand were able to nest in successive seasons. The 8- and9-year remigrants (a total of seven females) were eitherat sea for those time periods without nesting or theymay have nested elsewhere. Reports of females taggedat PNMB nesting exclusively outside of the park inlater nesting seasons are scarce (Santidrián-Tomilloet al. 2007), therefore we did not include a nesting sitefidelity parameter in our model; doing so would nothave affected our remigrant estimates.
Fig. 2. Comparison of the observed with model B’s estimated number of remigrants atPlaya Grande. The estimated number of 2–7-year remigrants (a) without the inclusion ofSSTy (model B0), with the inclusion of SSTy from TAO buoys (b) 5°N,125°W (SSTy−13),(c) 8°N,110°W (SSTy−13), (d) 0°N,140°W (SSTy−25) and (e) 8°N,180°W (SSTy−37). Theestimated number of remigrants for each year y was calculated using each model’sRiy (i = 2–7 years) and Ny−i (see Appendix S1, Supplementary material). Values forparameters β0, β1, t and s were based on each model’s maximized L.

400V. S. Saba et al.
© 2007 The Authors. Journal compilation © 2007 British Ecological Society, Journal of Applied Ecology, 44, 395–404
Our values of ECF from 1997 to 2004 did not varyand were not correlated with beach coverage, like thosecalculated by Reina et al. (2002) from 1993 to 1999. Wesuggest that the high beach coverage from 1997 to 2004(mean 87·25%) resulted in a stable ECF for each year.For this reason, we did not include the ECF valuesfrom 1993 to 1996 in our analysis because they were
calculated based on relatively low beach coverage(mean 66·00%). A full representation of 2–7-yearremigrants was not possible until 2000. The 2–7-yearremigration intervals and ECF were not correlated,suggesting that a leatherback’s time at sea betweennesting years does not affect its clutch frequency uponrenesting.
Fig. 3. ENSO signal strength for leatherback remigration probabilities Riy and the relationship of SSTy to Riy. (a) Model B’scontoured ∆AICc values from 88 5° × 5° grids using SSTy values from satellite AVHRR 4-km SST data 13 months (b), 25 monthsand (c) 37 months prior to each nesting season. Locations of the 59 TAO buoys are overlaid the contours with small black circles.Lower ∆AICc values correspond to higher ranked grids whose SSTy values produced better remigrant estimates. The relationshipbetween SSTy and Riy for the top-ranked TAO buoys (d) 5°N,125°W (SSTy−13), (e) 0°N,140°W (SSTy–25) and (f) 8°N,180°W(SSTy−37) under model B. The remigration probability is the mean Riy for 2–7-year remigrants each year. Anomalies of SST arenot in real-time. They are in the form of SSTy and thus they are lag corrected.

401ENSO influences Pacific leatherback nesting rate
© 2007 The Authors. Journal compilation © 2007 British Ecological Society, Journal of Applied Ecology, 44, 395–404
’
Our results suggest that interannual climate variability,as governed by ENSO, highly influenced the probabilityof leatherbacks remigrating to nest at Playa Grande.Cool periods of SST that corresponded with highremigration probabilities were indicative of highlyproductive La Niña events, when the thermocline ofthe central and eastern Pacific was elevated, resultingin an increased upwelling magnitude of cold, nutrient-rich water. Warmer episodes were less productive ElNiño events, when the thermocline was depressed.
Leatherback remigration probabilities exhibited astrong reaction to the 1997–98 El Niño/1998–99 La Niñatransition that was evident in all three SSTy timeperiods (Fig. 3d–f). The peak in the number of remi-grants (Fig. 2b–e) in 2000 was a result of the strong1998–99 La Niña event. Biological production rates inthe equatorial Pacific were affected substantially dur-ing the transition (30% decrease during El Niño, 40%increase during La Niña; Turk et al. 2001). The effectof the 1998–99 La Niña on productivity south of 15°Swas also evident (Yáñez et al. 2001; Escribano et al.2004) but not of the same magnitude observed near theequator (Chavez et al. 1999; Turk et al. 2001). Without
Fig. 4. Principal components of AVHRR 4-km SST variation in the Pacific Ocean comprised of the TAO array area and potential leatherback foragingareas in the south-eastern Pacific from 1985 to 2004. (a) The first principal component (PC1) and (b) second principal component (PC2) of SST variationfrom 20°N to 40°S and the west coast of the Americas to 140°E. The colour bar is unitless and represents the strength of eigenvector variability. Thelocations of the 59 TAO buoys are overlaid the PC with small black circles. The red star indicates the location of Playa Grande, Costa Rica, and the whiteenclosure is the potential migration area of the nesting females (Morreale et al. 1996; Shillinger & Block 2006). The relationship of (c) PC1 and (d) PC2eigenvectors of SST variation in the TAO array area to the standard departure of the MEI.

402V. S. Saba et al.
© 2007 The Authors. Journal compilation © 2007 British Ecological Society, Journal of Applied Ecology, 44, 395–404
tracking data from the late 1990s, we cannot confirmwhere the turtles were feeding during the productivitytransitions, we can only assume they followed migra-tion corridors similar to those suggested by studies inthe mid-1990s (Morreale et al. 1996) and more recently(Shillinger & Block 2006). Moreover, the trackingstudy by Shillinger & Block (2006) took place duringwarm El Niño events and their tracks may describe amigration that is specific to El Niño periods. The turtlesmay spend more time at or near the equator duringLa Niña events, but further satellite tracking duringthese episodes will be required to confirm this.
The time at sea, influence t, was an important com-ponent affecting remigration. Individuals that benefitedthe most from this factor were the 3-year remigrantsand this benefit decreased with increasing remigrationinterval. This means that if a turtle does not remigrateafter 2 years because of insufficient energy reserves,it can still use those energy reserves acquired initiallyplus what it gains from an additional year of foragingfor a 3-year remigration; however, the more timethe turtle spends at sea, the more energy it invests inforaging.
The best remigrant estimates failed to fit the peakobserved in 2003 (Fig. 2b–e) because of a low remigrationprobability for that season as a result of the 2002–03 ElNiño. It is possible that some females at PNMB migrateto foraging areas that are still highly productive duringEl Niño events (V. Saba, unpublished data). These areasare located along the west coast of South America,where productivity is dominated by coastal upwelling.Interestingly, only one of the post-nesting females fromPNMB had a migration pattern close to the coast(Shillinger & Block 2006). This suggests that a smallportion of the females at PNMB migrate to the coastalareas, which may explain why a peak in migrationoccurred in 2003 that our model did not estimate.Moreover, the lack of coastal foragers from PNMBmay be a result of high mortality rates from coastalgillnet fisheries, rendering these foragers a minoritywithin the population.
The wide area of signal strength for both SSTy−13 andSSTy−25 (Fig. 3a,b) and their similar ∆AICc values (seeTable S1 in the supplementary material) suggested thatenvironmental conditions approximately 1–2 yearsprior to each nesting season determined whether or notleatherbacks remigrated to Playa Grande. Further-more, the area of signal strength moved east as the SSTy
time period decreased (Fig. 3a–c). The eastward pro-gression existed because equatorial thermocline depthanomalies during the 1997–98 El Niño, and possiblyothers, originated in the west and propagated east(McPhaden & Yu 1999). Additionally, there was alongitude-dependent time lag of up to 1 year betweenthermocline depth variations in the west and SST
anomalies in the east, consistent with large-scale oceandynamics that control the ENSO cycle (Meinen &McPhaden 2000; Zelle et al. 2004).
The signal strength contour pattern shows thatcertain areas of the equatorial Pacific signalled theeffect of ENSO on leatherback remigration better thanothers (Fig. 3a,b). Similarities between Fig. 3a,b andFig. 4a,b can be observed. Dominated by equatorialand coastal upwelling, the equatorial cold ‘tongue’structure (Jin 1996) that extends to 165°E in Fig. 4a isevident in Fig. 3a. In Fig. 4b, the pocket of SST varia-tion (blue-purple) in the east was similar in structure tothe pocket of moderate ENSO signal strength (green)in Fig. 3a, both of which extended to about 100°W.The TAO buoys that produced excellent ENSO signalstrength for leatherback remigration (Fig. 3a, blue areas)were on the contour interval of SST variation in thenorth-eastern equatorial Pacific (Fig. 4b). Theseisotherms extended south to the off-shore areas ofPeru and Chile, which the turtles have also been shownto frequent (Shillinger & Block 2006). Furthermore,ENSO-governed interannual SST variability in thenorth-eastern equatorial Pacific was in synchrony withSST variability in the south-eastern areas near Peruand Chile, extending from 10°N to 20°S and the coastto 140°W (Montecinos, Purca & Pizarro 2003). Theempirical orthogonal function analysis confirmed thatthe similarity between the ENSO signal strength patterns(Fig. 3a,b) and the first two principal components ofSST variation in the TAO area (Fig. 4a,b) was a resultof the physical dynamics of ENSO in the equatorialPacific. This is because the majority of the variance inthe eigenvectors of PC1 and PC2 derived from theMEI (Fig. 4c,d).
Our model is not limited to any one population or onespecies of sea turtle. In this context, it is important thatturtle nesting site fidelity and monitoring coverageremain high at the nesting beach in question to avoidoverestimates of remigration intervals. The clutchfrequencies of the females also need to be taken intoconsideration when investigating reproductive frequency.Furthermore, the general location of the foraging areasof the post-nesting females should be known in orderto focus any environmental variation analysis.
The SSTy predictor variable in the equation for py
can be replaced with any environmental parameter.Moreover, additional environmental parameters canbe incorporated into the remigration model throughmultiple py linear logistic equations. It is important,however, to minimize the number of parameters in themodel to conserve parsimony.
The results will give nesting beach managers insightregarding which environmental variables are influ-encing turtle remigration, and allow them to predictthe coming season’s number of remigrants using theappropriately lagged environmental data. Forecasting
403ENSO influences Pacific leatherback nesting rate
© 2007 The Authors. Journal compilation © 2007 British Ecological Society, Journal of Applied Ecology, 44, 395–404
remigrant numbers prior to a nesting season mayhelp managers quantify beach patrolling and hatcheryeffort. Most importantly, mature female survivalestimates can be made by exposing the nesting popu-lation’s sensitivity to environmental variation. Thiscan help to quantify the influence of anthropogenicmortality and validate conservation strategies focusedon reducing it.
We stress that SST anomalies in the equatorial Pacificserved as ‘surrogate’ indicators of leatherback foragingconditions. The foraging areas of mature females prob-ably have a widespread distribution throughout theeastern equatorial and south-eastern Pacific; thereforeit is difficult to single out specific areas to use as directsignals. It has been shown that ENSO can affect thedistribution and abundance of gelatinous organisms(Silguero & Robison 2000; Raskoff 2001; Ozaki et al.2004) and the structure of the deep-sea megafaunalcommunity (Ruhl & Smith 2004) in the north Pacific.It is likely that ENSO has similar effects in the equato-rial and south-eastern Pacific, where leatherbacks aremigrating and potentially foraging on gelatinous preyat various depths extending to the mesopelagic zone.The high sensitivity of the food resource-dependentremigration probability strengthens the validity of thisnotion.
The exact relationship between increased primaryproductivity from La Niña and leatherback preyavailability in the equatorial and south-eastern Pacificis unknown; however, our results suggest that the increasedrates of primary production and subsequent increaseof secondary production lead to an increase in theabundance, distribution and size of the gelatinouszooplankton that the turtles feed on throughout thewater column. There are, however, other factors inaddition to food availability that can regulate the sizeand density of gelatinous zooplankton populations,particularly for medusae (Graham, Pagès & Hamner2001; Lucas 2001).
Our low estimates of annual survival suggests thatanthropogenic mortality needs to be reduced. If coastalgillnet fisheries are in fact the primary anthropogenicsource of mortality (Kaplan 2005), conservation policyeffort should be targeted at these fisheries. EasternPacific leatherbacks are highly susceptible to any formof anthropogenic mortality as a result of the stochasticnature of mature female foraging areas rendering annualegg production variable. The ability of a population torecover depends on sufficient recruitment rates. BecauseENSO affects productivity and ultimately leatherbackegg production in the eastern Pacific, any negativeanthropogenic influence on leatherback mortality needsto be minimized or eliminated in order to maintain thehighest egg production rates possible and allow forpopulation recovery in the face of reduced reproductionrelated to El Niño events.
Acknowledgements
We are grateful to the countless Earthwatch volunteers,local people of Costa Rica, Ministerio de Ambiente yEnergía (MINAE), and various staff and studentsfor their help with the leatherback tagging project atPNMB. We thank R. Piedra, E. Vélez, C. Padilla, M.Boza and E. Chacón for their support to leatherbackconservation at PNMB. We thank M. Kahru for satel-lite imaging assistance, T. Eguchi for statistical adviceand M. McPhaden and G. Saba for critiquing thismanuscript. Funding for the leatherback tagging studywas provided by Earthwatch Institute and The Leather-back Trust. Leatherback tagging permits and animalcare protocols were issued by MINAE, Indiana-PurdueUniversity of Fort Wayne and Drexel University.
References
Blanco, J.L., Carr, M.E., Thomas, A.C. & Strub, P.T. (2002)Hydrographic conditions off northern Chile during the1996–98 La Niña and El Niño events. Journal of GeophysicalResearch, Oceans, 107, 3017.
Broderick, A.C., Godley, B.J. & Hays, G.C. (2001) Trophicstatus drives interannual variability in nesting numbers ofmarine turtles. Proceedings of the Royal Society of London,B268, 1481–1487.
Burgers, G., Jin, F.F. & Oldenborgh, G.J.V. (2005) The simplestENSO recharge oscillator. Geophysical Research Letters,32, L13706.
Burnham, K.P. & Anderson, D.R. (2002) Model Selection andMultimodel Inference: A Practical Information-TheoreticApproach, 2nd edn. Springer-Verlag, New York, NY.
Carr, A. & Carr, M.H. (1970) Modulated reproductiveperiodicity in Chelonia. Ecology, 51, 335–337.
Carr, M.E., Strub, P.T., Thomas, A.C. & Blanco, J.L. (2002)Evolution of 1996–99 La Niña and El Niño conditions off thewestern coast of South America: a remote sensing perspec-tive. Journal of Geophysical Research, Oceans, 107, 3236.
Chaloupka, M. (2001) Historical trends, seasonality andspatial synchrony in green sea turtle egg production.Biological Conservation, 101, 263–279.
Chavez, F.P., Ryan, J., Lluch-Cota, S.E. & Ñiquen, M.C.(2003) From anchovies to sardines and back: mulitdecadalchange in the Pacific Ocean. Science, 299, 217–221.
Chavez, F.P., Strutton, P.G., Friederich, G.E., Freely, R.A.,Feldman, G.C., Foley, D.G. & McPhaden, M.J. (1999)Biological and chemical response of the Equatorial PacificOcean to the 1997–98 El Niño. Science, 286, 2126–2131.
Czaja, A., Van Der Vaart, P. & Marshall, J. (2002) A diagnosticstudy of the role of remote forcing in tropical Atlanticvariability. Journal of Climate, 15, 3280–3290.
Emery, W.J. & Thompson, R.E. (1998) Data Analysis Methodsin Physical Oceanography, 1st edn. Pergamon, Amsterdam,the Netherlands.
Escribano, R., Daneri, G., Farias, L., Gallardo, V.A.,Gonzalez, H.E., Gutierrez, D., Lange, C.B., Morales, C.E.,Pizarro, O., Ulloa, O. & Braun, M. (2004) Biological andchemical consequences of the 1997–98 El Nino in theChilean coastal upwelling system: a synthesis. Deep SeaResearch Part II, Topical Studies in Oceanography, 51,2389–2411.
Franco-Gordo, C., Godínez-Domínez, E., Filonov, A.E.,Tereshchenko, I.E. & Freire, J. (2004) Plankton biomassand larval fish abundance prior to and during the El Niñoperiod of 1997–98 along the central Pacific coast of Mexico.Progress in Oceanography, 63, 99–123.
404V. S. Saba et al.
© 2007 The Authors. Journal compilation © 2007 British Ecological Society, Journal of Applied Ecology, 44, 395–404
Frazier, J., Meneghel, M.D. & Achaval, F. (1985) A clarifica-tion on the feeding habits of Dermochelys coriacea. Journalof Herpetology, 19, 159–160.
Graham, W.M., Pagès, F. & Hamner, W.M. (2001) A physicalcontext for gelatinous zooplankton aggregations: a review.Hydrobiologia, 451, 199–212.
Hsieh, Y.-H.P., Leong, F.-M. & Rudloe, J. (2001) Jellyfish asfood. Hydrobiologia, 451, 11–17.
Jin, F.F. (1996) Tropical ocean–atmosphere interaction, thePacific cold tongue, and the El Niño-Southern Oscillation.Science, 274, 76–78.
Kaplan, I.C. (2005) A risk assessment for Pacific leatherbackturtles (Dermochelys coriacea). Canadian Journal of Fisheriesand Aquatic Sciences, 62, 1710–1719.
Limpus, C.J. & Nicholls, N. (2000) ENSO regulation ofIndo-Pacific green turtle populations. The AustralianExperience (eds G.L. Hammer, N. Nicholls & C. Mitchell),pp. 399–408. Kluwer Academic Publishers, Dordrecht,the Netherlands.
Lucas, C.H. (2001) Reproduction and life history strategies ofthe common jellyfish, Aurelia aurita, in relation to its ambientenvironment. Hydrobiologia, 451, 229–246.
Lutcavage, M.E. & Lutz, P.J. (1986) Metabolic rate and foodenergy requirements of the leatherback sea turtle, Dermo-chelys coriacea. Copeia, 1986, 796–798.
McPhaden, M.J. & Yu, X. (1999) Equatorial waves and the1997–98 El Niño. Geophysical Research Letters, 26, 2961–2964.
McPhaden, M.J., Delcroix, T., Hanawa, K., Kuroda, Y.,Meyers, G., Picaut, J. & Swenson, M. (2001) The El Niño-Southern Oscillation (ENSO) Observing System. Observingthe Ocean in the 21st Century (eds C.J. Koblinsky & N.R.Smith), pp. 231–246. Australian Bureau of Meterology,Melbourne, Australia.
Marinovic, B.B., Croll, D.A., Gong, N., Benson, S.R. &Chavez, F.P. (2002) Effects of the 1997–99 El Niño and LaNiña events on zooplankton abundance and eupausiidcommunity composition within the Monterey Baycoastal upwelling system. Progress in Oceanography, 54,265–277.
Meinen, C.S. & McPhaden, M.J. (2000) Observations ofwarm water volume changes in the equatorial Pacific andtheir relationship to El Niño and La Niña. Journal of Climate,13, 3551–3559.
Mills, C.E. (2001) Jellyfish blooms: are populations increasingglobally in response to changing ocean conditions? Hydro-biologia, 451, 55–68.
Montecinos, A., Purca, S. & Pizarro, O. (2003) Interannual-to-interdecadal sea surface temperature variability alongthe western coast of South America. Geophysical ResearchLetters, 30, 1570.
Morreale, S.J., Standora, E.A., Spotila, J.R. & Paladino, F.V.(1996) Migration corridor for sea turtles. Nature, 384, 319–320.
NASA (1985) AVHRR Oceans Pathfinder Global Equal-angleBest SST (NOAA/NASA). NASA JPL Physical Oceano-graphy DAAC, Pasadena, CA. http://poet.jpl.nasa.gov,accessed August 2005.
Ozaki, K., Uye, S.I., Kusumoto, T. & Hagino, T. (2004)Interannual variability of the ecosystem of the Kii Channel,the Inland Sea of Japan, as influenced by bottom intrusionof cold and nutrient-rich water from the Pacific Ocean, anda recent trend of warming and oligiotrophication. FisheriesOceanography, 13, 65–79.
Raskoff, K.A. (2001) The impact of El Niño events on popu-lations of mesopelagic hydromedusae. Hydrobiologia, 451,121–129.
Reina, R.D., Abernathy, K.J., Marshall, G.J. & Spotila, J.R.(2005) Respiratory frequency, dive behaviour and socialinteractions of leatherback turtles, Dermochelys coriacea,during the inter-nesting interval. Journal of ExperimentalMarine Biology and Ecology, 316, 1–16.
Reina, R.D., Mayor, P.A., Spotila, J.R., Piedra, R. & Paladino,F.V. (2002) Nesting ecology of the leatherback turtle, Dermo-chelys coriacea, at Parque Nacional Marino Las Baulas,Costa Rica: 1988–1989 to 1999–2000. Copeia, 2002, 653–664.
Ruhl, H.A. & Smith, K.L. (2004) Shifts in deep-sea commu-nity structure linked to climate and food supply. Science,305, 513–515.
Santidrián-Tomillo, P., Vélez, E., Reina, R.D., Piedra, R.,Paladino, F.V. & Spotila, J.R. (2007) Reassessment of theleatherback turtle (Dermochelys coriacea) population nestingat Parque Nacional Marino Las Baulas. Effects of conser-vation efforts. Chelonian Conservation and Biology, in press.
Shillinger, G. & Block, B.B. (2006) Tagging of Pacific Pelagics(TOPP). las.pfeg.noaa.gov/TOPP/, accessed August 2005.
Silguero, J.M.B. & Robison, B.H. (2000) Seasonal abundanceand vertical distribution of mesopelagic calycophoransiphonophores in Monterey Bay, CA. Journal of PlanktonResearch, 22, 1139–1153.
Solow, A.R., Bjorndal, K.A. & Bolten, A.B. (2002) Annualvariation in nesting numbers of marine turtles: the effect ofsea surface temperature on re-migration intervals. EcologyLetters, 5, 742–746.
Spotila, J.R., Reina, R.D., Steyermark, A.C., Plotkin, P.T. &Paladino, F.V. (2000) Pacific leatherback turtles face extinc-tion. Nature, 405, 529–530.
Turk, D., McPhaden, M.J., Busalacchi, A.J. & Lewis, M.R.(2001) Remotely sensed biological production in the equa-torial Pacific. Science, 293, 471–474.
Wolter, K. & Timlin, M.S. (1998) Measuring the strength ofENSO: how does 1997/98 rank? Weather, 53, 315–324.
Yáñez, E., Barbieri, M.A., Silva, C., Nieto, K. & Espíndola, F.(2001) Climate variability and pelagic fisheries in northernChile. Progress in Oceanography, 49, 581–596.
Zelle, H., Appeldoorn, G., Burgers, G. & van Oldenborgh, G.J.(2004) The relationship between sea surface temperatureand thermocline depth in the eastern equatorial Pacific.Journal of Physical Oceanography, 34, 643–655.
Received 25 July 2006; final copy received 29 November 2006Editor: Paul Giller
Supplementary material
The following supplementary material is availableas part of the online article (full text) from http://www.blackwell-synergy.com.
Appendix S1. Additional methods.
Table S1. AICc analysis results from both models Aand B using model averaging.
Table S2. AICc analysis results from model B.
Copyright © 2022 FDOKUMEN