Fossil turtles from the Neogene strata in the Sinda Basin, eastern Zaire
Upload
independentCategory
view
1download
0
385
Leatherback Turtles Are Capital Breeders: Morphometric and
Physiological Evidence from Longitudinal Monitoring
* Corresponding author; e-mail: [email protected].† Present address: National Oceanic and Atmospheric Association Southwest
Fisheries Science Center, Environmental Research Division, Pacific Grove, Cal-
ifornia 93950.
Physiological and Biochemical Zoology 86(4):385–397. 2013. � 2013 by TheUniversity of Chicago. All rights reserved. 1522-2152/2013/8604-2112$15.00.DOI: 10.1086/671127
Virginie Plot*Thomas JenkinsJean-Patrice RobinSabrina Fossette†
Jean-Yves GeorgesUniversite de Strasbourg, Institut Pluridisciplinaire HubertCurien, 23 rue Becquerel, 67087 Strasbourg, France, andCentre National de la Recherche Scientifique, Unite Mixte deRecherche 7178, 67087 Strasbourg, France
Accepted 4/14/2013; Electronically Published 6/4/2013
ABSTRACT
Organisms compensate for reproduction costs through two ma-jor strategies: capital breeders store body reserves before re-production and do not feed during the breeding season,whereas income breeders adjust their food intake dependingon concurrent reproductive needs. Sea turtles are commonlyconsidered capital breeders. Yet recent biometric and behavioralstudies have suggested that sea turtles may in fact feed duringreproduction. We tested this hypothesis in the leatherback turtleDermochelys coriacea, nesting in French Guiana. Our study isbased on the innovative use of longitudinal monitoring formorphological (body size, body mass, and body condition) andphysiological (plasma glucose, triacylglycerides, urea, calcium,and hematocrit) measurements in 35 females throughout the2006 nesting season. During their 71-d nesting period, leath-erbacks lost a mean (�SE) of kg (i.e., ∼11% of46.8 � 2.6their initial body mass of kg). Simultaneously, a409.0 � 8.9significant decrease in plasma concentrations of glucose, triac-ylglycerides, and urea was observed throughout the nestingseason, following typical patterns reported in other long-fastinganimals that rely on lipid body stores. At the end of the nestingseason, the interindividual variability in plasma concentrationswas very low, which may characterize some minimum thresh-olds associated with the end of reproduction. We also identifieda minimum necessary threshold for female body condition atthe onset of reproduction; the body condition of any femalesbeginning the nesting period below this threshold decreased
dramatically. This study makes a compelling case that, in FrenchGuiana, gravid leatherback females are anorexic during thenesting season (i.e., leatherback turtles are capital breeders).We further highlight the mechanisms that prevent this multip-arous reptile from jeopardizing its own body condition whilenot feeding during reproduction.
Introduction
Organisms exploit their environment to ensure survival, main-tenance, growth, and reproduction and ultimately to maximizetheir fitness (Stearns 1992). However, the temporal and spatialfluctuations in resources that are inherent to a heterogeneousnatural environment can entail variable periods of food dep-rivation for organisms (Mrosovsky and Sherry 1980). Organ-isms thus face trade-offs between competing life functions andcompensate for this by adopting adaptative strategies at dif-ferent levels (i.e., physiological, morphological, behavioral, andecological) to ensure an optimal balance between energy ac-quisition and expenditure (Le Maho 2002).
Reproduction is generally considered to be an energeticallyhighly costly life function. Organisms compensate for repro-duction expenses by increasing trophic resource quantitiesthrough two different strategies: capital breeders store largequantities of body reserves before reproduction and then ceasefeeding during the reproductive episode, and income breedersadjust food intake during reproduction (Drent and Daan 1980;Jonsson 1997). In the wild, some species complement previ-ously stored body reserves by feeding during the reproductiveseason. This type of intermediate strategy has been suggestedin mammals (Wheatley et al. 2008), birds (Drent and Daan1980; Senechal et al. 2011), and reptiles (Lourdais et al. 2002;Fossette et al. 2008a; Warner et al. 2008).
Sea turtles are commonly considered capital breeders (sensuDrent and Daan 1980), with females relying on body reservesstored during the preceding migration and ceasing to feed dur-ing reproduction (Miller 1997). However, recent morphometric(body mass change) and behavioral (diving and mouth-openingpatterns and esophageal temperature) studies have contradictedthis assertion in four of the seven sea turtle species. Oppor-tunistic feeding during the reproductive season has already beensuggested in green turtles Chelonia mydas (Hochscheid et al.1999), hawksbill turtles Eretmochelys imbricata (Santos et al.2010), loggerhead turtles Caretta caretta (Schoefield et al. 2006),and leatherback turtles Dermochelys coriacea (Southwood et al.2005; Fossette et al. 2008a; Casey et al. 2010).
This content downloaded from 128.200.28.208 on Sat, 29 Jun 2013 14:26:43 PMAll use subject to JSTOR Terms and Conditions
386 V. Plot, T. Jenkins, J.-P. Robin, S. Fossette, and J.-Y. Georges
At the physiological level, organisms adapt to food resourcedeprivation by using the supply-side strategy (McCue 2007a).The supply-side strategy results in successive specific metabolicpathways of body reserve mobilization. It has been extensivelydescribed in endotherms (birds [Groscolas 1986; Cherel et al.1988; Robin et al. 1998], mammals [Arnould and Rawlins 2001;Guinet et al. 2004]) and consists of three consecutive phases(Cherel et al. 1988). At the onset of the fast (phase I), post-prandial animals enter a period of adaptation characterized bythe exhaustion of glycogen stores and the progressive mobili-zation of lipid stores. As fasting continues (phase II), fat storesare preferentially mobilized, and low use is made of body pro-teins. Beyond a critical level of fat store depletion, long-fastinganimals enter a critical phase (phase III) in which body proteinsare increasingly catabolized. Recent studies on fasting ecto-therms report similar patterns, with snakes chiefly relying onlipid stores while sparing proteins (McCue 2007a, 2007b, 2008).Investigating metabolic pathways during the reproduction pe-riod could therefore be a valid new approach to assessing thereproductive strategy (i.e., income vs. capital strategy) used bysea turtles.
Reproduction in sea turtles is energetically costly, becauseadult females come ashore regularly during the nesting season(which lasts several weeks) to lay successive clutches of severaldozen eggs, with some interspecific differences (i.e., rangingfrom 50 eggs per clutch in the flatback turtle Natator depressusto 130 in the hawksbill turtles; Miller 1997). This high repro-ductive output most likely relies exclusively on previouslystored maternal body reserves (Miller 1997). Surprisingly, fewstudies have investigated the metabolic adjustments in nestingsea turtles, probably because of constraints in performing lon-gitudinal monitoring in the field (Hamann et al. 2002; Honar-var et al. 2011). Only a few studies on captive sea turtles havereported changes in plasma metabolites during periods of fooddeprivation (marginally shorter than during natural fasting inthe wild; Bonnet 1979; Moon et al. 1999). Hamann et al. (2002)showed patterns of plasma triacylglycerides (TG) and total pro-teins during the nesting season in green turtles and concludedthat nesting females chiefly rely on lipid stores and may shiftto protein catabolism at the end of the season. In the leath-erback, Honarvar et al. (2011) reported a decrease in plasmaproteins as the season proceeds. Although some recent studieshave reported plasma metabolite levels in leatherbacks whennesting or on foraging sites, these results were not interpretedin terms of fasting physiology, because they were based ontransversal monitoring (Innis et al. 2010; Harris et al. 2011).
The leatherback turtle is the largest sea turtle species; theaverage adult leatherback female weighs between 250 and 400kg, depending on the nesting population (Georges and Fossette2006). This species shows the highest reproductive effort amongsea turtles. Females lay an average of 6 clutches per season,with differences between nesting sites (Miller 1997) and be-tween individuals (from 2 to 14 clutches per season; Eckert etal. 2012). During a nesting season that may last up to 3 mo,leatherbacks lay successive clutches about 10 d apart. This pe-riod is defined as the internesting interval (Miller 1997).
In French Guiana, where nesting leatherbacks are larger andheavier (Georges and Fossette 2006) and lay more clutches(Girondot and Fretey 1996) compared with other sites, femaleshave been shown to disperse actively and extensively over thecontinental shelf during internesting intervals (Fossette et al.2007; Georges et al. 2007). Clear patterns of mouth-openingat depth on the Guianese continental shelf have also been re-ported (Fossette et al. 2008a). In addition, the occurrence ofjellyfish, which are the main prey of leatherbacks, has beenreported in the vicinity of these nesting beaches (Fossette et al.2009). These findings led to the hypothesis that leatherbacksin French Guiana may opportunistically feed during the nestingseason. Similar hypotheses based on body mass change (St.Croix, US Virgin Islands; Eckert et al. 1989), mouth-openingpatterns (Grenada, West Indies; Myers and Hays 2006), or guttemperature records (St. Croix, US Virgin Islands; Southwoodet al. 2005; Casey et al. 2010) have been proposed for otherleatherback nesting populations in the Atlantic Ocean. How-ever, these hypotheses are based on inference without any in-formation on the actual physiological status of the study in-dividuals. Here we aimed to test whether leatherback turtlesfeed during the nesting season in French Guiana using thelongitudinal monitoring of morphometric (body length, width,and mass) and physiological (glucose, TG, urea, calcium, andhematocrit) parameters as indicators of body condition andnutritional status in 35 leatherback females throughout theirnesting season.
Material and Methods
This project respected the legal requirements of the country inwhich the work was performed and followed all institutionalguidelines. This study was performed under Centre Nationalde la Recherche Scientifique–Institut Pluridisciplinaire HubertCurien (CNRS-IPHC) institutional license (B67-482-18 deliv-ered by Departmental Direction of the Veterinary Services,Strasbourg, France, and the Police Prefecture of Bas Rhin) andunder individual licences to J.-Y.G. (67-220 delivered by theDepartmental Direction of the Veterinary Services, Strasbourg,France, and the Police Prefecture of Bas-Rhin).
Study Site
This study was conducted throughout the entire 2006 nestingseason (March–July) at one of the world’s largest nesting sitesfor leatherback turtles (Fossette et al. 2008b): Awala Yalimapobeach (5.7�N, 53.9�W), French Guiana, South America. Mon-itoring programs on this beach have been running since thelate 1970s for individual identification, using first external metaltags (Monel tags, National Band and Tags) and then, since 1995,internal passive integrated transponder (PIT) tags (Trovan Eu-roid; Fossette et al. 2008b). All individuals considered in ourstudy were marked remigrants (i.e., females tagged as nestersduring previous seasons; Fossette et al. 2008b).
This content downloaded from 128.200.28.208 on Sat, 29 Jun 2013 14:26:43 PMAll use subject to JSTOR Terms and Conditions
Reproductive Strategy in Leatherback Turtles 387
Field Protocol
Between March 15 and July 21, 2006, a 4-km-long stretch ofthe beach where most nesting events historically occur (Fossetteet al. 2008b) was patrolled every night from 6:00 p.m. to 7:00a.m. All remigrant turtles encountered during these patrols wereindividually identified by their PIT tag. Our monitoring con-sisted of (i) recording identity, date of oviposition, and bodymorphometrics; (ii) counting yolked eggs, weighing the entireclutch at the first observed oviposition, and sampling threeyolked eggs from each clutch to estimate clutch mass; (iii)sampling blood during oviposition; and (iv) weighing femalesafter oviposition, when they were returning to the sea (detailsare given below). This sequence of manipulations ensured min-imal disturbance, as confirmed by direct observations of allmanipulated turtles completing their oviposition and returningto lay subsequent clutches. In total, 35 females were monitoredwith complete measurements and blood samples for almost allsuccessive clutches during their entire nesting season.
The longitudinal monitoring was performed as follows: (i)During each observed nesting event, morphometric measure-ments (standard curvilinear carapace length [SCCL] and stan-dard curvilinear carapace width [SCCW]) were taken using aflexible measuring tape (�0.5 cm, following Georges and Fos-sette 2006). (ii) At the first observed clutch of each turtle, beforethe first egg was laid, a fabric bag with its base closed by aknotted lace was fitted in the nest chamber. During oviposition,all eggs were collected in this fabric bag, and yolked eggs weresimultaneously counted using a hand tally counter. Threeyolked eggs were collected by hand during egg counting. Oncethe last egg was laid and before the female started covering itsnest, the bag was removed from the nest. A bucket was insertedin the nest chamber, and the female’s hind flippers were heldby hand out of reach of the sand to prevent the nest chamberfrom being filled with sand during the clutch weighing. Mean-while, the clutch was weighed in the bag (�0.05 kg) using ahandheld spring scale. After clutch weighing (∼20 s), the bucketwas removed, and the bag was replaced into the nest chamber.The lace was untied to open the bottom of the bag, which wasthen gently removed from the nest chamber. The eggs werehence redesposited into the nest chamber in a similar order tothe one in which they had been laid. The flippers were released,allowing the turtle to cover the nest. Because of the heavylogistical needs of this protocol, only the first observed clutchof each turtle was weighed in this way. The mass of subsequentclutches was estimated by calculating the mean mass of thethree yolked eggs collected during egg counting (�0.1 g), thenmultiplying this value by clutch size. This estimation methodfor individual clutch mass was validated for the first observedclutches, because no significant differences were found betweenclutch mass weighed with the bag and clutch mass estimatedfrom the three collected eggs ( kg vs. kg,7.0 � 0.3 6.7 � 0.3respectively; paired t-test, , ,P p 0.48 t p �0.70 n p 33clutches). (iii) During each observed oviposition, a 6-mL bloodsample was collected from the femoral rete system using asyringe. The blood was immediately transferred into heparin-
ized polypropylene microtubes and placed in a refrigerated coolbox until the patrol was finished. Hematocrit measurement wasthen performed (maximum 4 h after sampling) using one cap-illary tube of whole blood, and blood samples were centrifugedto separate plasma and blood cells. Samples were frozen(�20�C) until they could be analyzed at the IPHC, Strasbourg,France. (iv) After oviposition, turtles were weighed (�0.2 kg)when returning to the sea using a customized harness and anelectronic spring scale fixed to a 4.5-m-high carbon-fiber tripodequipped with a hoist (see details in Georges and Fossette 2006).
Reproductive Effort
For each individual, we defined the observed nesting period asthe period between the first and last observed clutches. Despiteour exhaustive night patrols, some clutches were not observed,because leatherbacks may nest outside the hours of our patrolschedule. Therefore, we calculated the estimated clutch fre-quency (ECF) for each female following Frazer and Richardson(1985). The ECF is the total number of clutches that a turtleis believed to have deposited during its nesting season, takinginto account the intermediate nonobserved clutches (based onthe mean internesting duration of 10 d in leatherbacks; Gi-rondot and Fretey 1996). This also permitted the calculationof cumulative clutch size and cumulative clutch mass for eachfemale by multiplying its ECF by the mean clutch size and bythe mean clutch mass of its observed clutches, respectively. Wealso defined the level of reproductive effort (LRE), adapted fromHamann et al. (2002), as an index of the progress of the season.For a given clutch (x), LRE was calculated as LRE pat clutch x
. LRE provides a better proxy of the relative(x/ECF) # 100reproductive effort through time compared with clutch rank.For instance, for one turtle laying 5 clutches ( ) and aECF p 5second turtle laying 10 clutches ( ), LRE for a givenECF p 10clutch (e.g., the fourth clutch) will be twice as high for theturtle with the lowest ECF ( ) in comparison withLRE p 80%the turtle with highest ECF ( ).LRE p 40%
Maternal Body Condition Index (BCI)
Maternal BCI was calculated for each individual at every ob-served clutch as an indicator of individual health (Peig andGreen 2009). Because variation in body mass can be associatedwith differences in nutritional status as well as structural size,differences between body mass and structural size thus con-stitute a good index of nutritional state (Schulte-Hostedde etal. 2005). BCI was calculated following Saraux et al. (2011).First, a structural size index (SSI) was calculated using bodylength and body width, both of which are good descriptors ofsea turtle structural size (Georges and Fossette 2006). BecauseSCCL and SCCW were correlated (linear regression, P !
, ), we used a principal component analysis to20.001 R p 0.41establish the SSI. The first principal component between thesetwo parameters explained 82% of the variation. Second, the
This content downloaded from 128.200.28.208 on Sat, 29 Jun 2013 14:26:43 PMAll use subject to JSTOR Terms and Conditions
388 V. Plot, T. Jenkins, J.-P. Robin, S. Fossette, and J.-Y. Georges
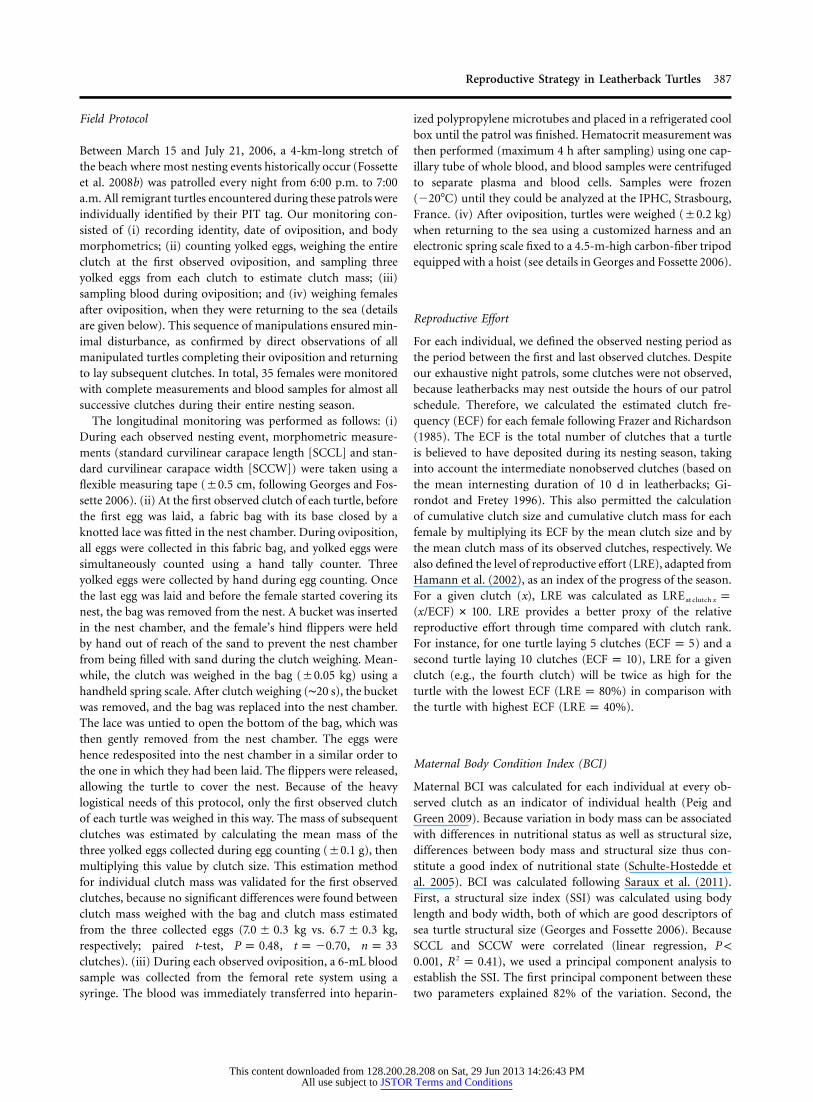
Figure 1. Relationships between maternal body condition index at firstobserved clutch and reproductive output indices: number of clutcheslaid per season (filled circles, solid line) and cumulative mass clutchesper season (open circles, dotted line).
body condition was defined as the residuals of a regression ofbody mass on SSI (Schulte-Hostedde et al. 2005; Saraux et al.2011). Because maternal BCI was calculated for each individualat every observed clutch throughout the observed nesting pe-riod, we used a linear mixed-effect (LME) model with theidentity of the turtle as a random factor.
Plasma Parameter Concentrations
Plasma metabolites (glucose, TG, and uric acid or urea) areassociated with specific metabolic pathways involved in themobilization of successive body reserves (Robin et al. 1998)and are commonly used as indicators of the physiological andnutritional status in animals. In turtles, urea is described as themain product of protein catabolism instead of the uric acidreported in birds (Dessauer 1970; Bonnet 1979). Furthermore,the fact that, in sea turtles, urea does not play the osmoregu-latory role reported in other marine vertebrates (Lutz 1997;Acher et al. 1999) gives assurance that plasma urea concentra-tions are not biased by any physiological processes other thanprotein metabolism. Urea was thus used as an indicator ofprotein catabolism.
Plasma concentrations of metabolites were measured using10 mL of undiluted plasma with commercial enzymatic col-orimetric kits (glucose: Glucose-RTU, 61 269/61 270; TG: TG-PAP 150, 61 236; urea: Urea-Kit S180, 61 912/61 913; bio-Merieux). Because calcium may be associated with eggproduction, plasma concentrations of calcium were also mea-sured using 6 mL of undiluted plasma with commercial col-orimetric method kits (Ca-Kit 61041, Thermo FicherScientific).
Statistical Analyses
Results are given as means � standard error (range). Statisticaltests were processed with R software (2.10.1). Normality waschecked before each test using the Shapiro-Wilk test. Tests forcorrelation were run with linear regression or the Spearmancorrelation test. Changes in morphometric measurements, bodycondition, physiological parameters, and clutch mass through-out the observed nesting period were investigated using LMEwhen residuals fitted with normal distribution and generalizedestimating equation (GEE) model when residuals did not fitwith normal distribution. This allows controlling for pseudo-replication by including individual identity as a random factor.Multiple comparisons were then applied with a Tukey’s posthoc test (after LME) or Wilcoxon paired test (after GEE). Po-tential changes in reproductive output, body mass, body con-dition, and physiological parameters throughout the observednesting period were investigated, considering LRE to be thetimescale.
Results
Morphometrics and Blood Values at First Observed Clutch
At the first observed clutch, the 35 nesting females were a meanof cm long (SCCL; range, 141.5–172.0 cm) and159.0 � 1.5
cm wide (SCCW; range, 107.5–125.0 cm) and116.0 � 1.0weighed kg (range, 289.6–508.0 kg), corresponding409.0 � 8.9to a mean maternal BCI of (range, 4.7–45.3). At25.1 � 1.8that time, mean physiological parameter values for the 35 fe-males were as follows: hematocrit, (range,40.5% � 1.0%26.1%–57.0%); glucose, mmol/L (range, 8.66–12.46 � 0.6424.00 mmol/L); TG, mmol/L (range, 2.10–19.6012.89 � 0.56mmol/L); urea, mmol/L (range, 0.33–2.13 mmol/1.14 � 0.08L); calcium, mmol/L (range, 1.40–5.81 mmol/L).3.25 � 0.18
At the first observed clutch, there were no significant rela-tionships between maternal BCI and plasma concentrations ofglucose, TG, and urea ( , 0.48, and 0.23, respectively).P p 0.32We did, however, find a positive trend between maternal BCIand calcium ( , ) and a significant positive2P p 0.067 R p 0.10relationship between maternal BCI and hematocrit ( ,P p 0.01
). Statistical significances were similar when maternal2R p 0.18body mass was considered instead of BCI.
Reproductive Parameters, Morphometrics, and Blood Values
The observed nesting period of the 35 study individuals (i.e.,the time elapsed between the first and the last observedclutches) lasted, on average, d (range, 40–98 d;71.2 � 2.6
), with a mean internesting interval of dn p 35 9.9 � 0.1(range, 8.7–11.1 d; ; individual means). Individual ECFn p 35averaged clutches per season (range, 5–12 clutches8.3 � 0.3
This content downloaded from 128.200.28.208 on Sat, 29 Jun 2013 14:26:43 PMAll use subject to JSTOR Terms and Conditions
Reproductive Strategy in Leatherback Turtles 389
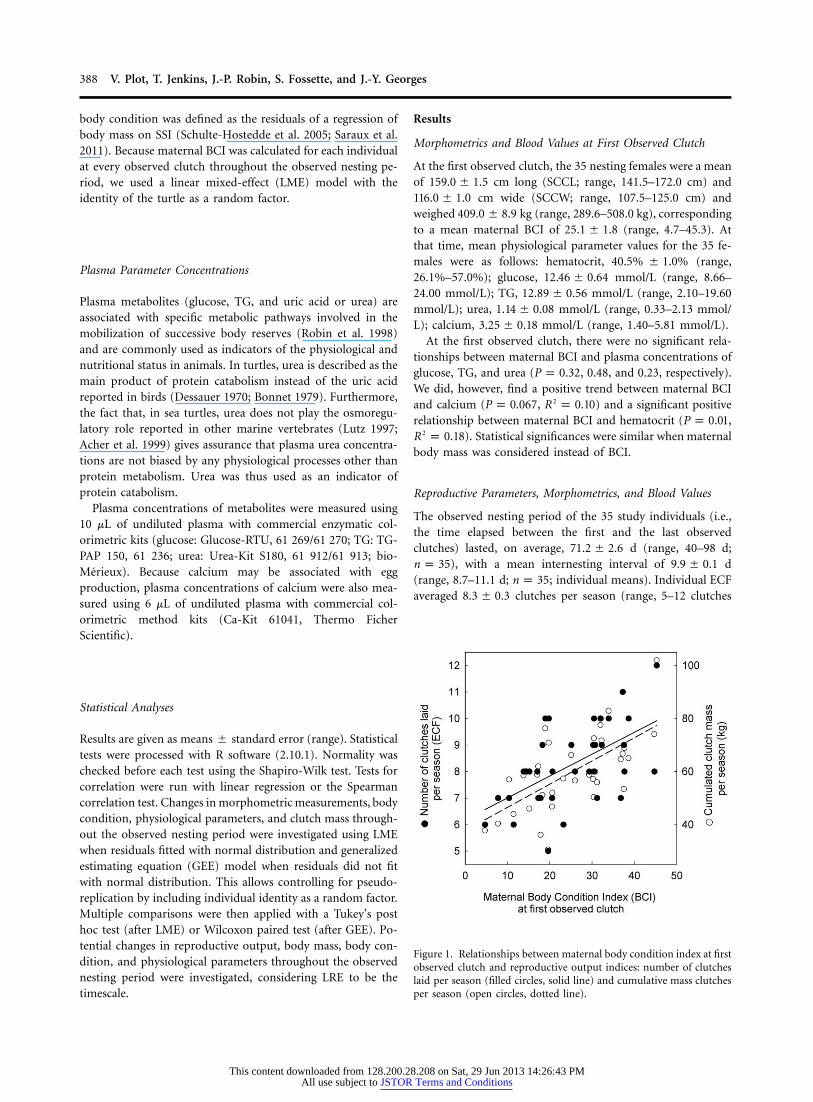
Figure 2. Changes in maternal morphometric (a–c) and physiological (d–h) values throughout the nesting period (represented by the level ofreproductive effort [LRE]). Values are means � standard error. Letters refer to significant differences ( ), numbers refer to the numberP ! 0.05of individuals represented in each LRE class, and vertical dashed gray lines refer to 30% and 70% LRE, where major physiological patternsoccurred (see “Results”). TG p triacylglyceride.
per season; ) and was positively related to the durationn p 35of the observed nesting period ( , , ).2P ! 0.001 R p 0.91 n p 35Over the entire nesting period, the mean clutch size was
eggs per clutch (range, 44–112 eggs; ) for a86.9 � 2.2 n p 35mean clutch mass of kg (range, 2.6–10.3 kg;7.2 � 0.2 n p
). During the entire nesting period, the cumulative clutch35size and cumulative clutch mass averaged eggs (range,717 � 28305–1,129 eggs; ) and kg (range, 30.6–102.2n p 35 59.7 � 2.4kg; ), respectively.n p 35
The duration of the observed nesting period and the ECF
were positively related to maternal morphometrics (SCCL, in both cases; maternal body mass at the2P p 0.02 R p 0.15
first observed clutch: , , and ,2P p 0.019 R p 0.15 P p 0.01, respectively; maternal BCI at first observed clutch:2R p 0.18
, , and , , respectively; fig.2 2P ! 0.001 R p 0.31 P ! 0.001 R p 0.661). The cumulative clutch size was positively related to maternalbody mass and BCI at the first observed clutch ( ,P p 0.01
, and , , respectively) and tended2 2R p 0.18 P ! 0.001 R p 0.34to be positively related to SCCL ( , ). The2P p 0.062 R p 0.10cumulative clutch mass was positively related to maternal body
This content downloaded from 128.200.28.208 on Sat, 29 Jun 2013 14:26:43 PMAll use subject to JSTOR Terms and Conditions
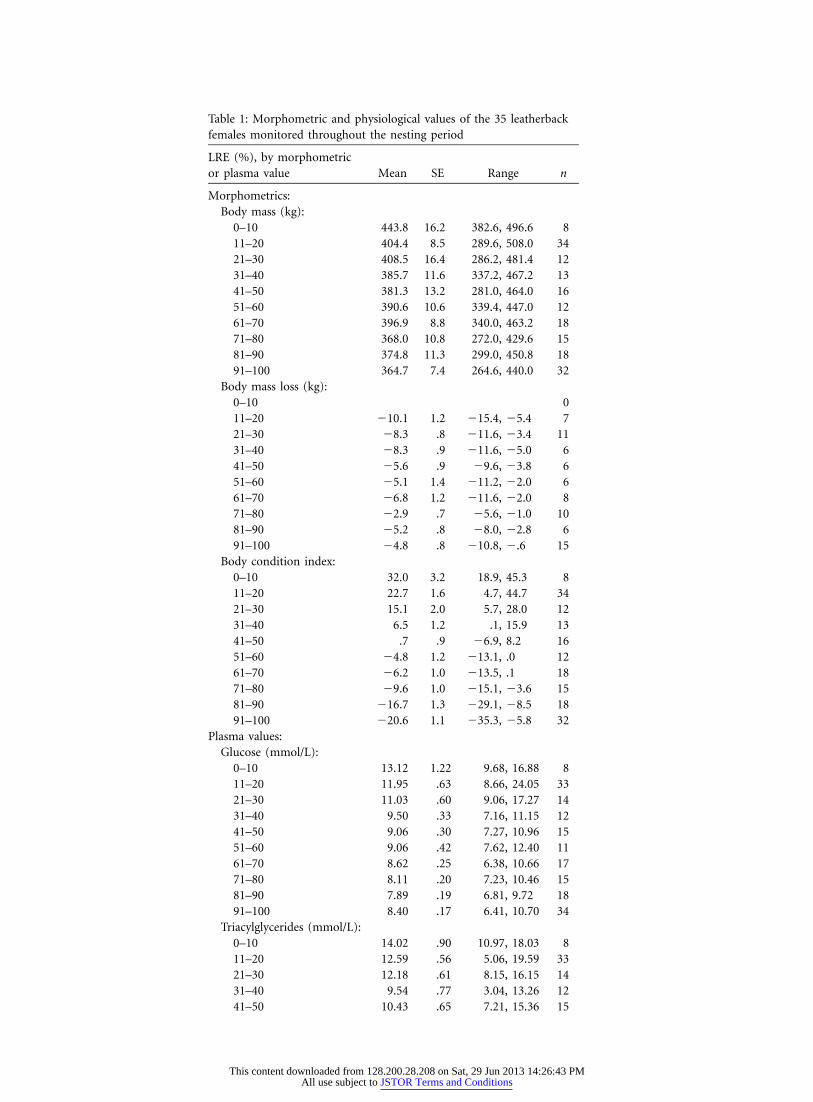
Table 1: Morphometric and physiological values of the 35 leatherbackfemales monitored throughout the nesting period
LRE (%), by morphometricor plasma value Mean SE Range n
Morphometrics:Body mass (kg):
0–10 443.8 16.2 382.6, 496.6 811–20 404.4 8.5 289.6, 508.0 3421–30 408.5 16.4 286.2, 481.4 1231–40 385.7 11.6 337.2, 467.2 1341–50 381.3 13.2 281.0, 464.0 1651–60 390.6 10.6 339.4, 447.0 1261–70 396.9 8.8 340.0, 463.2 1871–80 368.0 10.8 272.0, 429.6 1581–90 374.8 11.3 299.0, 450.8 1891–100 364.7 7.4 264.6, 440.0 32
Body mass loss (kg):0–10 011–20 �10.1 1.2 �15.4, �5.4 721–30 �8.3 .8 �11.6, �3.4 1131–40 �8.3 .9 �11.6, �5.0 641–50 �5.6 .9 �9.6, �3.8 651–60 �5.1 1.4 �11.2, �2.0 661–70 �6.8 1.2 �11.6, �2.0 871–80 �2.9 .7 �5.6, �1.0 1081–90 �5.2 .8 �8.0, �2.8 691–100 �4.8 .8 �10.8, �.6 15
Body condition index:0–10 32.0 3.2 18.9, 45.3 811–20 22.7 1.6 4.7, 44.7 3421–30 15.1 2.0 5.7, 28.0 1231–40 6.5 1.2 .1, 15.9 1341–50 .7 .9 �6.9, 8.2 1651–60 �4.8 1.2 �13.1, .0 1261–70 �6.2 1.0 �13.5, .1 1871–80 �9.6 1.0 �15.1, �3.6 1581–90 �16.7 1.3 �29.1, �8.5 1891–100 �20.6 1.1 �35.3, �5.8 32
Plasma values:Glucose (mmol/L):
0–10 13.12 1.22 9.68, 16.88 811–20 11.95 .63 8.66, 24.05 3321–30 11.03 .60 9.06, 17.27 1431–40 9.50 .33 7.16, 11.15 1241–50 9.06 .30 7.27, 10.96 1551–60 9.06 .42 7.62, 12.40 1161–70 8.62 .25 6.38, 10.66 1771–80 8.11 .20 7.23, 10.46 1581–90 7.89 .19 6.81, 9.72 1891–100 8.40 .17 6.41, 10.70 34
Triacylglycerides (mmol/L):0–10 14.02 .90 10.97, 18.03 811–20 12.59 .56 5.06, 19.59 3321–30 12.18 .61 8.15, 16.15 1431–40 9.54 .77 3.04, 13.26 1241–50 10.43 .65 7.21, 15.36 15
This content downloaded from 128.200.28.208 on Sat, 29 Jun 2013 14:26:43 PMAll use subject to JSTOR Terms and Conditions
Reproductive Strategy in Leatherback Turtles 391
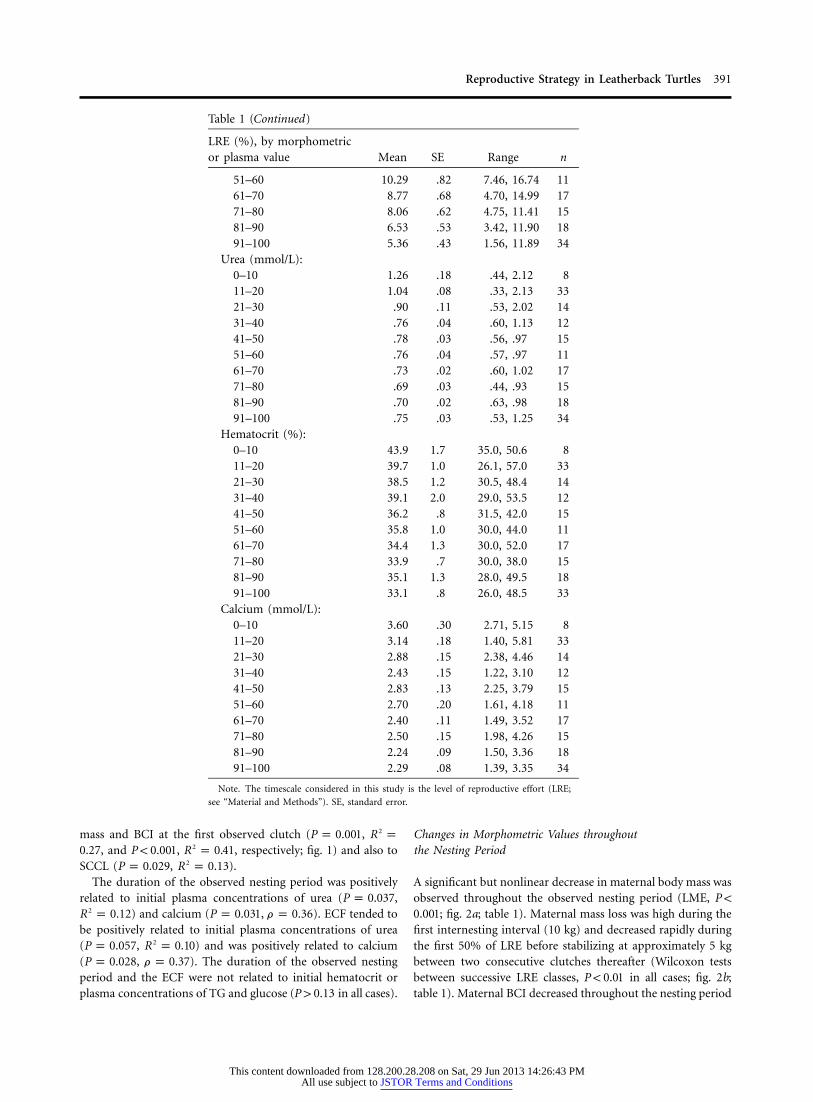
Table 1 (Continued)
LRE (%), by morphometricor plasma value Mean SE Range n
51–60 10.29 .82 7.46, 16.74 1161–70 8.77 .68 4.70, 14.99 1771–80 8.06 .62 4.75, 11.41 1581–90 6.53 .53 3.42, 11.90 1891–100 5.36 .43 1.56, 11.89 34
Urea (mmol/L):0–10 1.26 .18 .44, 2.12 811–20 1.04 .08 .33, 2.13 3321–30 .90 .11 .53, 2.02 1431–40 .76 .04 .60, 1.13 1241–50 .78 .03 .56, .97 1551–60 .76 .04 .57, .97 1161–70 .73 .02 .60, 1.02 1771–80 .69 .03 .44, .93 1581–90 .70 .02 .63, .98 1891–100 .75 .03 .53, 1.25 34
Hematocrit (%):0–10 43.9 1.7 35.0, 50.6 811–20 39.7 1.0 26.1, 57.0 3321–30 38.5 1.2 30.5, 48.4 1431–40 39.1 2.0 29.0, 53.5 1241–50 36.2 .8 31.5, 42.0 1551–60 35.8 1.0 30.0, 44.0 1161–70 34.4 1.3 30.0, 52.0 1771–80 33.9 .7 30.0, 38.0 1581–90 35.1 1.3 28.0, 49.5 1891–100 33.1 .8 26.0, 48.5 33
Calcium (mmol/L):0–10 3.60 .30 2.71, 5.15 811–20 3.14 .18 1.40, 5.81 3321–30 2.88 .15 2.38, 4.46 1431–40 2.43 .15 1.22, 3.10 1241–50 2.83 .13 2.25, 3.79 1551–60 2.70 .20 1.61, 4.18 1161–70 2.40 .11 1.49, 3.52 1771–80 2.50 .15 1.98, 4.26 1581–90 2.24 .09 1.50, 3.36 1891–100 2.29 .08 1.39, 3.35 34
Note. The timescale considered in this study is the level of reproductive effort (LRE;
see “Material and Methods”). SE, standard error.
mass and BCI at the first observed clutch ( , 2P p 0.001 R p, and , , respectively; fig. 1) and also to20.27 P ! 0.001 R p 0.41
SCCL ( , ).2P p 0.029 R p 0.13The duration of the observed nesting period was positively
related to initial plasma concentrations of urea ( ,P p 0.037) and calcium ( , ). ECF tended to2R p 0.12 P p 0.031 r p 0.36
be positively related to initial plasma concentrations of urea( , ) and was positively related to calcium2P p 0.057 R p 0.10( , ). The duration of the observed nestingP p 0.028 r p 0.37period and the ECF were not related to initial hematocrit orplasma concentrations of TG and glucose ( in all cases).P 1 0.13
Changes in Morphometric Values throughoutthe Nesting Period
A significant but nonlinear decrease in maternal body mass wasobserved throughout the observed nesting period (LME, P !
; fig. 2a; table 1). Maternal mass loss was high during the0.001first internesting interval (10 kg) and decreased rapidly duringthe first 50% of LRE before stabilizing at approximately 5 kgbetween two consecutive clutches thereafter (Wilcoxon testsbetween successive LRE classes, in all cases; fig. 2b;P ! 0.01table 1). Maternal BCI decreased throughout the nesting period
This content downloaded from 128.200.28.208 on Sat, 29 Jun 2013 14:26:43 PMAll use subject to JSTOR Terms and Conditions
392 V. Plot, T. Jenkins, J.-P. Robin, S. Fossette, and J.-Y. Georges
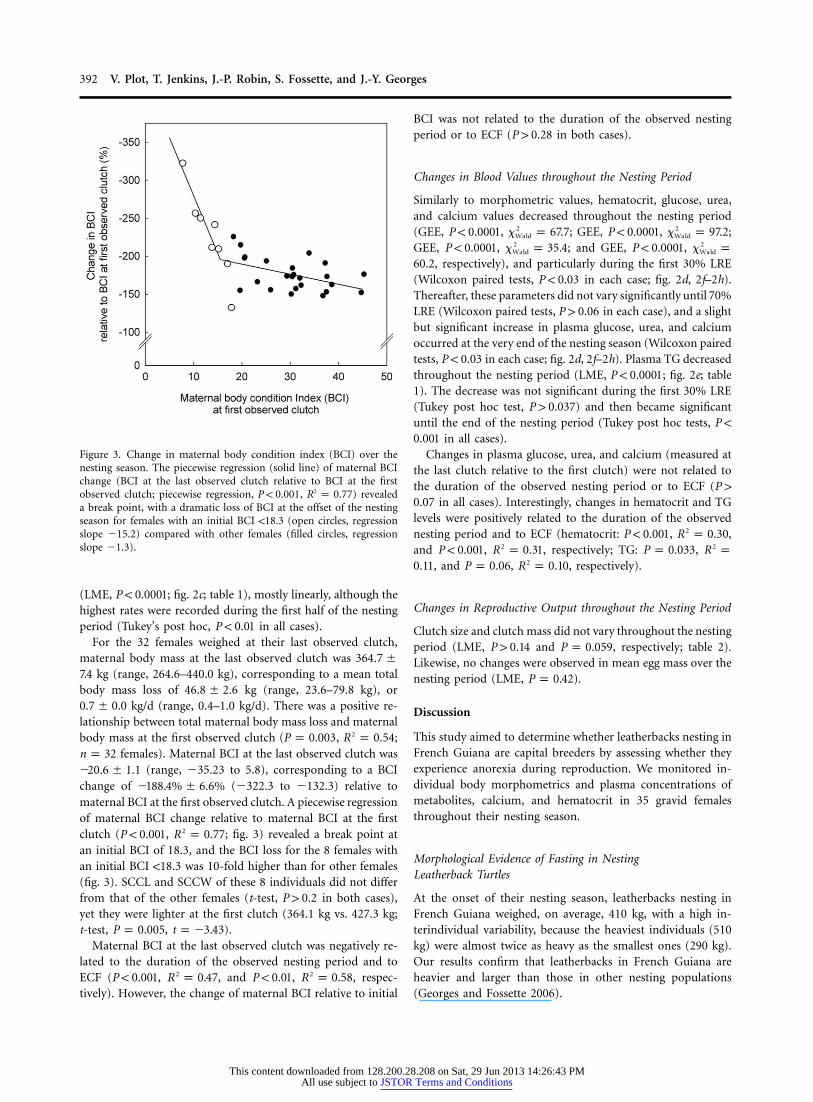
Figure 3. Change in maternal body condition index (BCI) over thenesting season. The piecewise regression (solid line) of maternal BCIchange (BCI at the last observed clutch relative to BCI at the firstobserved clutch; piecewise regression, , ) revealed2P ! 0.001 R p 0.77a break point, with a dramatic loss of BCI at the offset of the nestingseason for females with an initial BCI !18.3 (open circles, regressionslope �15.2) compared with other females (filled circles, regressionslope �1.3).
(LME, ; fig. 2c; table 1), mostly linearly, although theP ! 0.0001highest rates were recorded during the first half of the nestingperiod (Tukey’s post hoc, in all cases).P ! 0.01
For the 32 females weighed at their last observed clutch,maternal body mass at the last observed clutch was 364.7 �
kg (range, 264.6–440.0 kg), corresponding to a mean total7.4body mass loss of kg (range, 23.6–79.8 kg), or46.8 � 2.6
kg/d (range, 0.4–1.0 kg/d). There was a positive re-0.7 � 0.0lationship between total maternal body mass loss and maternalbody mass at the first observed clutch ( , ;2P p 0.003 R p 0.54
females). Maternal BCI at the last observed clutch wasn p 32(range, �35.23 to 5.8), corresponding to a BCI�20.6 � 1.1
change of (�322.3 to �132.3) relative to�188.4% � 6.6%maternal BCI at the first observed clutch. A piecewise regressionof maternal BCI change relative to maternal BCI at the firstclutch ( , ; fig. 3) revealed a break point at2P ! 0.001 R p 0.77an initial BCI of 18.3, and the BCI loss for the 8 females withan initial BCI !18.3 was 10-fold higher than for other females(fig. 3). SCCL and SCCW of these 8 individuals did not differfrom that of the other females (t-test, in both cases),P 1 0.2yet they were lighter at the first clutch (364.1 kg vs. 427.3 kg;t-test, , ).P p 0.005 t p �3.43
Maternal BCI at the last observed clutch was negatively re-lated to the duration of the observed nesting period and toECF ( , , and , , respec-2 2P ! 0.001 R p 0.47 P ! 0.01 R p 0.58tively). However, the change of maternal BCI relative to initial
BCI was not related to the duration of the observed nestingperiod or to ECF ( in both cases).P 1 0.28
Changes in Blood Values throughout the Nesting Period
Similarly to morphometric values, hematocrit, glucose, urea,and calcium values decreased throughout the nesting period(GEE, , ; GEE, , ;2 2P ! 0.0001 x p 67.7 P ! 0.0001 x p 97.2Wald Wald
GEE, , ; and GEE, ,2 2P ! 0.0001 x p 35.4 P ! 0.0001 x pWald Wald
, respectively), and particularly during the first 30% LRE60.2(Wilcoxon paired tests, in each case; fig. 2d, 2f–2h).P ! 0.03Thereafter, these parameters did not vary significantly until 70%LRE (Wilcoxon paired tests, in each case), and a slightP 1 0.06but significant increase in plasma glucose, urea, and calciumoccurred at the very end of the nesting season (Wilcoxon pairedtests, in each case; fig. 2d, 2f–2h). Plasma TG decreasedP ! 0.03throughout the nesting period (LME, ; fig. 2e; tableP ! 0.00011). The decrease was not significant during the first 30% LRE(Tukey post hoc test, ) and then became significantP 1 0.037until the end of the nesting period (Tukey post hoc tests, P !
in all cases).0.001Changes in plasma glucose, urea, and calcium (measured at
the last clutch relative to the first clutch) were not related tothe duration of the observed nesting period or to ECF (P 1
in all cases). Interestingly, changes in hematocrit and TG0.07levels were positively related to the duration of the observednesting period and to ECF (hematocrit: , ,2P ! 0.001 R p 0.30and , , respectively; TG: ,2 2P ! 0.001 R p 0.31 P p 0.033 R p
, and , , respectively).20.11 P p 0.06 R p 0.10
Changes in Reproductive Output throughout the Nesting Period
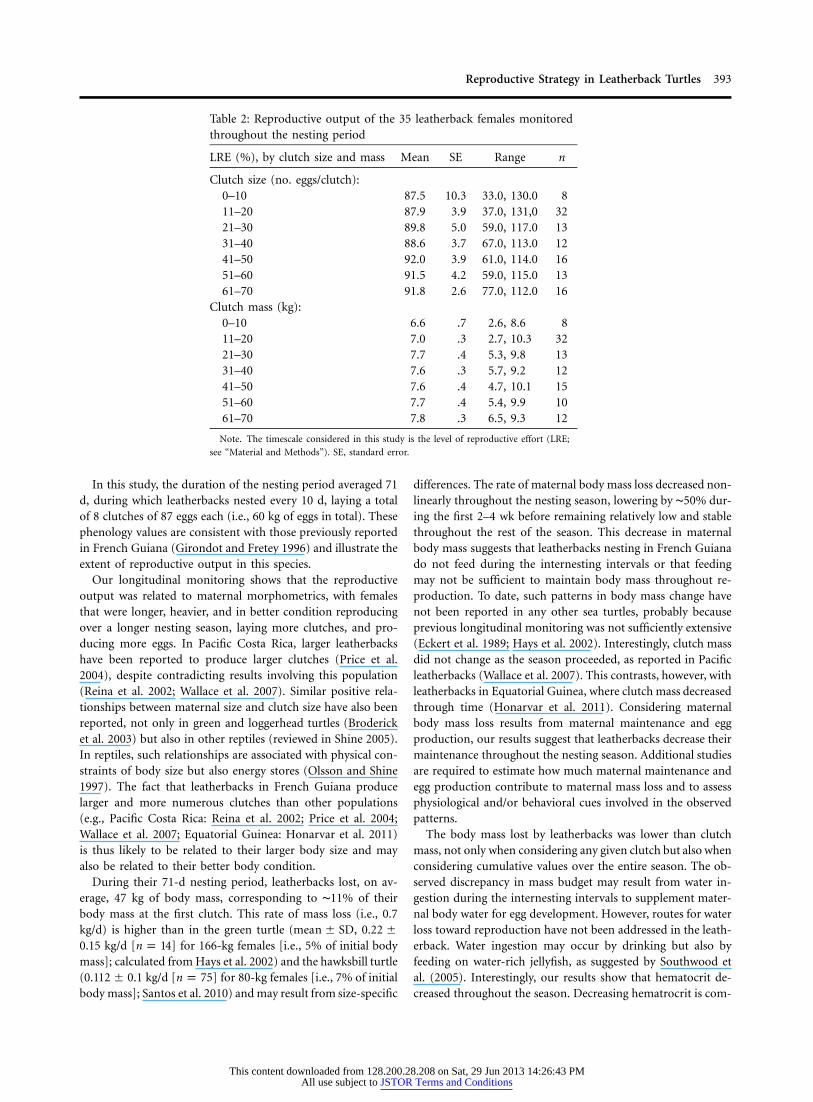
Clutch size and clutch mass did not vary throughout the nestingperiod (LME, and , respectively; table 2).P 1 0.14 P p 0.059Likewise, no changes were observed in mean egg mass over thenesting period (LME, ).P p 0.42
Discussion
This study aimed to determine whether leatherbacks nesting inFrench Guiana are capital breeders by assessing whether theyexperience anorexia during reproduction. We monitored in-dividual body morphometrics and plasma concentrations ofmetabolites, calcium, and hematocrit in 35 gravid femalesthroughout their nesting season.
Morphological Evidence of Fasting in NestingLeatherback Turtles
At the onset of their nesting season, leatherbacks nesting inFrench Guiana weighed, on average, 410 kg, with a high in-terindividual variability, because the heaviest individuals (510kg) were almost twice as heavy as the smallest ones (290 kg).Our results confirm that leatherbacks in French Guiana areheavier and larger than those in other nesting populations(Georges and Fossette 2006).
This content downloaded from 128.200.28.208 on Sat, 29 Jun 2013 14:26:43 PMAll use subject to JSTOR Terms and Conditions
Reproductive Strategy in Leatherback Turtles 393
Table 2: Reproductive output of the 35 leatherback females monitoredthroughout the nesting period
LRE (%), by clutch size and mass Mean SE Range n
Clutch size (no. eggs/clutch):0–10 87.5 10.3 33.0, 130.0 811–20 87.9 3.9 37.0, 131,0 3221–30 89.8 5.0 59.0, 117.0 1331–40 88.6 3.7 67.0, 113.0 1241–50 92.0 3.9 61.0, 114.0 1651–60 91.5 4.2 59.0, 115.0 1361–70 91.8 2.6 77.0, 112.0 16
Clutch mass (kg):0–10 6.6 .7 2.6, 8.6 811–20 7.0 .3 2.7, 10.3 3221–30 7.7 .4 5.3, 9.8 1331–40 7.6 .3 5.7, 9.2 1241–50 7.6 .4 4.7, 10.1 1551–60 7.7 .4 5.4, 9.9 1061–70 7.8 .3 6.5, 9.3 12
Note. The timescale considered in this study is the level of reproductive effort (LRE;
see “Material and Methods”). SE, standard error.
In this study, the duration of the nesting period averaged 71d, during which leatherbacks nested every 10 d, laying a totalof 8 clutches of 87 eggs each (i.e., 60 kg of eggs in total). Thesephenology values are consistent with those previously reportedin French Guiana (Girondot and Fretey 1996) and illustrate theextent of reproductive output in this species.
Our longitudinal monitoring shows that the reproductiveoutput was related to maternal morphometrics, with femalesthat were longer, heavier, and in better condition reproducingover a longer nesting season, laying more clutches, and pro-ducing more eggs. In Pacific Costa Rica, larger leatherbackshave been reported to produce larger clutches (Price et al.2004), despite contradicting results involving this population(Reina et al. 2002; Wallace et al. 2007). Similar positive rela-tionships between maternal size and clutch size have also beenreported, not only in green and loggerhead turtles (Brodericket al. 2003) but also in other reptiles (reviewed in Shine 2005).In reptiles, such relationships are associated with physical con-straints of body size but also energy stores (Olsson and Shine1997). The fact that leatherbacks in French Guiana producelarger and more numerous clutches than other populations(e.g., Pacific Costa Rica: Reina et al. 2002; Price et al. 2004;Wallace et al. 2007; Equatorial Guinea: Honarvar et al. 2011)is thus likely to be related to their larger body size and mayalso be related to their better body condition.
During their 71-d nesting period, leatherbacks lost, on av-erage, 47 kg of body mass, corresponding to ∼11% of theirbody mass at the first clutch. This rate of mass loss (i.e., 0.7kg/d) is higher than in the green turtle ( ,mean � SD 0.22 �
kg/d [ ] for 166-kg females [i.e., 5% of initial body0.15 n p 14mass]; calculated from Hays et al. 2002) and the hawksbill turtle( kg/d [ ] for 80-kg females [i.e., 7% of initial0.112 � 0.1 n p 75body mass]; Santos et al. 2010) and may result from size-specific
differences. The rate of maternal body mass loss decreased non-linearly throughout the nesting season, lowering by ∼50% dur-ing the first 2–4 wk before remaining relatively low and stablethroughout the rest of the season. This decrease in maternalbody mass suggests that leatherbacks nesting in French Guianado not feed during the internesting intervals or that feedingmay not be sufficient to maintain body mass throughout re-production. To date, such patterns in body mass change havenot been reported in any other sea turtles, probably becauseprevious longitudinal monitoring was not sufficiently extensive(Eckert et al. 1989; Hays et al. 2002). Interestingly, clutch massdid not change as the season proceeded, as reported in Pacificleatherbacks (Wallace et al. 2007). This contrasts, however, withleatherbacks in Equatorial Guinea, where clutch mass decreasedthrough time (Honarvar et al. 2011). Considering maternalbody mass loss results from maternal maintenance and eggproduction, our results suggest that leatherbacks decrease theirmaintenance throughout the nesting season. Additional studiesare required to estimate how much maternal maintenance andegg production contribute to maternal mass loss and to assessphysiological and/or behavioral cues involved in the observedpatterns.
The body mass lost by leatherbacks was lower than clutchmass, not only when considering any given clutch but also whenconsidering cumulative values over the entire season. The ob-served discrepancy in mass budget may result from water in-gestion during the internesting intervals to supplement mater-nal body water for egg development. However, routes for waterloss toward reproduction have not been addressed in the leath-erback. Water ingestion may occur by drinking but also byfeeding on water-rich jellyfish, as suggested by Southwood etal. (2005). Interestingly, our results show that hematocrit de-creased throughout the season. Decreasing hematrocrit is com-
This content downloaded from 128.200.28.208 on Sat, 29 Jun 2013 14:26:43 PMAll use subject to JSTOR Terms and Conditions
394 V. Plot, T. Jenkins, J.-P. Robin, S. Fossette, and J.-Y. Georges
monly associated with anaemia (i.e., a decrease in health status;Tavares-Dias et al. 2009) and is consistent with the decrease inmaternal body condition observed throughout the study season.The observation of a decrease in body condition as the seasonproceeds suggests that feeding does not occur and that wateringestion is most likely to happen by drinking. Consistently,drinking behavior has been previously suggested in leatherbacksnesting in French Guiana (Fossette et al. 2008a). We furthertested whether jellyfish are actually ingested by assessing plasmametabolite levels throughout the nesting season via a comple-mentary longitudinal monitoring of physiological parameters.
Plasma-Based Evidence of Fasting in NestingLeatherback Turtles
Concurrently with the decrease in morphometric values, sig-nificant decreases in plasma concentrations of glucose, TG, andurea over the nesting period corresponded to three phases.During the first 30% of the nesting season, plasma glucose andurea decreased concurrently with steady high levels of TG. Dur-ing most of the remaining nesting season, plasma glucose andurea levels remained low and steady, whereas TG levels de-creased linearly through time until the very end of the season,when glucose and urea levels increased slightly yet significantly.Those profiles of plasma metabolites are similar to those re-ported in long-term fasting animals (Groscolas 1986; Cherel etal. 1988; Castellini and Rea 1992) and thus strongly suggestthat leatherbacks are anorexic during the nesting season (Miller1997).
At the onset of the season, leatherbacks nesting in FrenchGuiana showed high levels of glucose compared with otherleatherback nesting populations (Deem et al. 2006; Harms etal. 2007; Harris et al. 2011; Honarvar et al. 2011), suggestingpossible feeding shortly before the first nesting event. After thefirst clutch, glucose levels decreased by 30%, as also reportedin fasting green (32%) and Kemp’s ridley (Lepidochelys kempii;36%) turtles (Moon et al. 1999). As the season proceeds, plasmaTG levels decreased dramatically by 50% from the first to thelast clutch, as also reported in nesting green turtles (Hamannet al. 2002). In long-term fasting animals, such TG decline hasbeen associated with the mobilization of fat stores (referred toas phase II of fasting; Cherel et al. 1988). In addition, thedecrease in plasma TG over the nesting period was positivelyrelated to the duration of the nesting season and ECF, sug-gesting that leatherbacks rely chiefly on lipid reserves duringreproduction. In sea turtles, body lipids may be stored in largequantities in visceral fat (Moon et al. 1999), the maternal yolkof atretic large follicles (Kuchling and Bradshaw 1993), andsubcarapace fat (Kwan 1994), particularly in the leatherback(Davenport et al. 2011). Concurrently, the low and steady levelsof plasma urea observed from the first third of the nestingseason indicate that leatherbacks use a protein-sparing strategysimilar to that observed in long-fasting birds and mammals(Cherel et al. 1988). This supports our conclusion that leath-erbacks are anorexic during the nesting season in French Gui-ana, contradicting recent conclusions (Fossette et al. 2008a). A
similar conclusion has been recently proposed in the hawksbillturtle by Goldberg et al. (2012), who reported high levels ofleptin, the appetite-suppressing hormone, during the nestingseason.
At the very end of the nesting period, urea increased slightlyyet significantly. This may indicate a shift from lipid to proteincatabolism, as reported during the transition toward the endof long-term fasting while lipid body stores are depleted andbody proteins are mobilized (phase III; Cherel et al. 1988) andas suggested in green turtles (Hamann et al. 2002). Hormonalrefeeding signals (via corticosterone) that lead animals to stopreproduction have been reported in sea birds (Groscolas et al.2008; Spee et al. 2010). Similar hormonal signals may occur insea turtles and are likely to be mediated by the hunger-stim-ulating ghrelin, as recently reported in nesting hawksbill turtles(Goldberg et al. 2012). Such hormonal pathways triggering theend of the reproduction should be investigated in leatherbacks.
Evidence of Morphological and Physiological Threshold inNesting Leatherback Turtles
When considering a maternal BCI based on morphologicalmetrics (SCCL, SCCW, and body mass), we showed that allleatherbacks began their reproduction with a positive BCI. SuchBCI values have been formerly reported as indicative of thehealth of individual animals (Peig and Green 2009) and suggestthat all leatherbacks had significant amounts of body reserveswhen entering in reproduction. Considering their reproductivestrategy, we expect that females should have reached a mini-mum level of body condition necessary to induce reproduction,as previously reported in capital breeding snakes (Naulleau andBonnet 1996) and suggested in sea turtles (Hays 2000). Inter-estingly, the body condition of females starting reproductionwith BCI !18 deteriorated dramatically during reproductioncompared with others (fig. 3). Furthermore, we showed thatfemales in better condition do indeed lay more clutches duringthe season than other individuals. This indicates that the costsof reproduction have more deleterious effects on females withpoorer body condition. Consistently, only a small proportionof study females (8 [25%] of 32 individuals) started repro-duction with BCI values below this threshold. The wide rangeof levels of physiological parameters recorded at the first clutchmakes it impossible to identify any particular threshold valuefor these parameters at the start of reproduction.
At the end of the nesting season, the interindividual vari-ability in plasma concentrations was very low (fig. 2; table 1).This may characterize some minimum thresholds associatedwith the end of reproduction. For instance, BCI values becamenegative during the period where leatherbacks rely on lipidreserves, which suggests a possible threshold in BCI changesthat is associated with the shift in metabolic paths. As far asmetabolites are concerned, the shift from lipid to protein me-tabolism indicates that lipid stores may be a limiting factor forreproduction in leatherbacks. Similarly, the positive relationshipthat we found between plasma calcium and both maternal con-dition and reproductive output suggests that calcium is a critical
This content downloaded from 128.200.28.208 on Sat, 29 Jun 2013 14:26:43 PMAll use subject to JSTOR Terms and Conditions
Reproductive Strategy in Leatherback Turtles 395
component of reproduction in leatherbacks. This may be re-lated to the fact that leatherback’s eggs are heavily calcified(∼1.23 g calcium per egg; Bilinsky et al. 2001) and that theirlarge cumulative clutch size may result in high calcium re-quirements throughout the entire season. The relevance of cal-cium in leatherback reproduction is further consistent with arecent study showing that hatching and emergence success arerelated to maternal calcium levels in this species (Perrault etal. 2012).
Drent and Daan (1980) emphasized the importance of bodycondition in reproduction and postulated that the amount ofreserves at the onset of breeding (i.e., the “capital”) acts on theamount of energy devoted to breeding. This is particularly truefor capital breeders (Naulleau and Bonnet 1996). As a whole,our results provide evidence that leatherback females are an-orexic during the nesting season and lead to the conclusionthat they operate as capital breeders by relying on stored bodyreserves to ensure their reproduction without jeopardizing theirown body condition while not feeding during reproduction.Similar combined approaches should be implemented at othersites where sea turtles have been suggested to feed during thenesting season to provide a better understanding of reproduc-tive strategies in these species.
Acknowledgments
This project respected the legal requirements of the country inwhich the work was performed. All of the institutional guide-lines were followed, and work was performed under CentreNational de la Recherche Scientifique institutional and J.-Y.G.’sindividual licenses. We are grateful to the two captains of Awalaand Yalimapo, M. Therese and D. William, and the inhabitantsof Awala-Yalimapo for their hospitality. We are also grateful tothe IPHC students who took part in the 2006 field session. Wewould also like to thank M. Spee and R. Groscolas for theirvaluable comments on a previous draft. V.P. was supported bya studentship from the French Ministry of Research. The studywas conducted during the MIRETTE project (http://projetmirette.fr), led by J.-Y.G. and supported by the AgenceNationale pour la Recherche (ANR-07-JCJC-0122). We thankthree anonymous reviewers for their constructive comments ofthe original version of the manuscript.
Literature Cited
Acher R., J. Chauvet, M.-T. Chauvet, and Y. Rouille. 1999.Unique evolution of neurohypophysial hormones in carti-laginous fishes: possible implications for urea-based osmo-regulation. J Exp Zool 284:475–484.
Arnould J.P.Y., J.A. Green, and D.R. Rawlins. 2001. Fastingmetabolism in Antarctic fur seal (Arctocephalus gazella) pups.Comp Biochem Physiol A 129:829–841.
Bilinsky J.J., R.D. Reina, J.R. Spotila, and F.V. Paladino. 2001.The effects of nest environment on calcium mobilization by
leatherback turtle embryos (Dermochelys coriacea) during de-velopment. Comp Biochem Physiol A 130:151–162.
Bonnet B. 1979. Influence of the nutritional conditions of theorganic composition of blood and urine in the juvenile seaturtle Chelonia mydas. Aquaculture 16:253–260.
Broderick A.C., F. Glen, B.J. Godley, and G.C. Hays. 2003.Variation in reproductive output of marine turtles. J ExpMar Biol Ecol 288:95–109.
Casey J., J. Garner, S. Garner, and A. Southwood Williard. 2010.Diel foraging behavior of gravid leatherback sea turtles indeep waters of the Caribbean Sea. J Exp Biol 213:3961–3971.
Castellini M.A. and L.D. Rea. 1992. The biochemestry of naturalfasting at its limits. Experientia 48:575–582.
Cherel Y., J.-P. Robin, O. Walch, H. Karmann, P. Netchitailo,and Y. Le Maho. 1988. Fasting in king penguin: hormonaland metabolic changes during breeding. Am J Physiol 254:R170–R177.
Davenport J., V. Plot, J.-Y. Georges, T.K. Doyle, and M.C. James.2011. Pleated turtle escapes the box: shape changes in Der-mochelys coriacea. J Exp Biol 214:3474–3479.
Deem S.L., E.S. Dierenfeld, G.P. Sounguet, A.R. Alleman, C.Cray, R.H. Poppenga, T.M. Norton, and W.B. Karesh. 2006.Blood values in free-ranging nesting leatherback sea turtles(Dermochelys coriacea) on the coast of the Republic of Gabon.J Zoo Wildl Med 37:464–471.
Dessauer H.C. 1970. Blood chemistry of reptiles: physiologicaland evolutionary aspects. Pp. 1–72 in C. Gans and T.S. Par-son, eds. Biology of the Reptilia. Academy Press, New York.
Drent R.H. and S. Daan. 1980. The prudent parent: energeticadjustments in avian breeding. Ardea 68:225–252.
Eckert K.L., B.P. Wallace, J.G. Frazier, S.A. Eckert, and P.C.H.Pritchard. 2012. Synopsis of the biological data on the leath-erback sea turtle (Dermochelys coriacea). Biological TechnicalPublication BTP-R4015-2012. US Fish and Wildlife Service.
Eckert S.A., K.L. Eckert, P. Ponganis, and G.L. Kooyman. 1989.Diving and foraging behavior of leatherback sea turtles (Der-mochelys coriacea). Can J Zool 67:2834–2840.
Fossette S., P. Gaspar, Y. Handrich, Y. Le Maho, and J.Y.Georges. 2008a. Fine-scale diving behaviour and beak move-ments in leatherback turtles (Dermochelys coriacea) nestingin French Guiana. J Anim Ecol 77:236–246.
Fossette S., C. Girard, T. Bastian, B. Calmettes, S. Ferraroli, P.Vendeville, F. Blanchard, and J.-Y. Georges. 2009. Thermaland trophic habitat of the leatherback turtle during the nest-ing season in French Guiana. J Exp Mar Biol Ecol 378:8–14.
Fossette S., L. Kelle, M. Girondot, E. Goverse, M.L. Hilterman,B. Verhage, B. de Thoisy, and J.-Y. Georges. 2008b. Theworld’s largest leatherback rookeries: conservation and re-search in French Guiana, Surinam and Gabon. J Exp MarBiol Ecol 356:69–82.
Fossette S., H. Tanaka, Y. Ropert-Coudert, S. Ferraroli, N. Arai,K. Sato, Y. Le Maho, and J.-Y. Georges. 2007. Dispersal anddive patterns in gravid leatherback turtles during the nestingseason in French Guiana. Mar Ecol Prog Ser 338:233–247.
Frazer N.B. and J.I. Richardson. 1985. Annual variation inclutch size and frequency for loggerhead turtles, Caretta ca-
This content downloaded from 128.200.28.208 on Sat, 29 Jun 2013 14:26:43 PMAll use subject to JSTOR Terms and Conditions
396 V. Plot, T. Jenkins, J.-P. Robin, S. Fossette, and J.-Y. Georges
retta, nesting at Little Cumberland Island, Georgia, USA.Herpetologica 41:246–251.
Georges J.-Y., A. Billes, S. Ferraroli, S. Fossette, J. Fretey, D.Gremillet, Y. Le Maho, A.E. Myers, H. Tanaka, and G.C.Hays. 2007. Meta-analysis of movements in Atlantic leath-erback turtles during nesting season: conservation implica-tions. Mar Ecol Prog Ser 338:225–232.
Georges J.-Y. and S. Fossette. 2006. Estimating body mass inleatherback turtles Dermochelys coriacea. Mar Ecol Prog Ser318:255–262.
Girondot M. and J. Fretey. 1996. Leatherback turtles, Dermo-chelys coriacea, nesting in French Guiana, 1978–1995. ChelConserv Biol 2:204–208.
Goldberg D.W., S.A. Tobar Leitao, A.J. Barsante, J. da CunhaBastos, and V.L. Freire da Cunha Bastos. 2012. Ghrelin, leptinand the nesting activity of the hawksbill sea turtle (Eret-mochelys imbricada Linnaeaus 1766). 32nd International SeaTurtle Symposium, Huatulco, Mexico.
Groscolas R. 1986. Changes in body mass, body temperatureand plasma fuel levels during the natural breeding fast inmale and female emperor penguins, Aptenodytes forsteri. JComp Physiol B 156:521–527.
Groscolas R., A. Lacroix, and J.-P. Robin. 2008. Spontaneousegg or chick abandonment in energy-depleted king penguins:a role for corticosterone and prolactin? Horm Behav 53:51–60.
Guinet C., N. Servera, S. Mangin, J.-Y. Georges, and A. Lacroix.2004. Change in plasma cortisol and metabolites during theattendance period ashore in fasting lactating subantarctic furseals. Comp Biochem Physiol A 137:523–531.
Hamann M., C.J. Limpus, and J.M.Whittier. 2002. Patterns oflipid storage and mobilisation in the female green sea turtle(Chelonia mydas). J Comp Physiol B 172:485–493.
Harms C.A., S.A. Eckert, S.A. Kubis, M. Campbell, D.H. Le-venson, and M.A. Crognale. 2007. Field anaesthesia of leath-erback sea turtles (Dermochelys coriacea). Vet Rec 161:15–21.
Harris H.S., S.R. Benson, K.V. Gilardi, R.H. Poppenga, P.H.Dutton, T.M. Work, and J.A.K. Mazet. 2011. Comparativehealth assessment of western Pacific leatherback turtles (Der-mochelys coriacea) foraging off the coast of California: 2005–2007. J Wildl Dis 47:321–337.
Hays G.C. 2000. The implications of variable remigration in-tervals for the assessment of population size in marine turtles.J Theor Biol 206:221–227.
Hays G.C., A.C. Broderick, F. Glen, and B.J. Godley. 2002.Change in body mass associated with fasting in marine rep-tile: the case of green turtles (Chelonia mydas) at AscensionIsland. Can J Zool 80:1299–1302.
Hochscheid S., B.J. Godley, A.C. Broderick, and R.P. Wilson.1999. Reptilian diving: highly variable dive patterns in thegreen turtle Chelonia mydas. Mar Ecol Prog Ser 185:101–112.
Honarvar S., M.C. Brodsky, M.C. Fitzgerald, K.L. Rosenthal,and G.W. Hearn. 2011. Changes in plasma chemistry and
reproductive output of nesting leatherbacks. Herpetologica67:222–235.
Innis C., C. Merigo, K. Dodge, M. Tlusty, M. Dodge, B. Sharp,A. Myers, et al. 2010. Health evaluation of leatherback turtles(Dermochelys coriacea) in the northwestern Atlantic duringdirect capture and fisheries gear disentanglement. Chelo-mannian Conserv Biol 9:205–222.
Jonsson K.I. 1997. Capital and income breeding of alternativetactics of resource use in reproduction. Oikos 78:57–66.
Kuchling G. and S.D. Bradshaw. 1993. Ovarian cycle and eggproduction of the western swamp tortoise Pseudemydura um-brina (Testudines: Chelidae) in the wild and in captivity. JZool 229:405–419.
Kwan D. 1994. Fat reserves and reproduction in the green turtle,Chelonia mydas. Wildl Res 21:257–266.
Le Maho Y. 2002. Nature and function. Nature 416:21.Lourdais O., X. Bonnet, R. Shine, D. DeNardo, G. Naulleau,
and M. Guillon. 2002. Capital-breeding and reproductiveeffort in a variable environment: a longitudinal study of aviviparous snake. J Anim Ecol 71:470–479.
Lutz P.L. 1997. Salt, water and pH balance in sea turtles. Pp.343–362 in P.L. Lutz and J.A. Musick, eds. The biology ofsea turtles. CRC, Boca Raton, FL.
McCue M.D. 2007a. Snakes survive starvation by employingsupply- and demand-side economic strategy. Zoology 110:318–327.
———. 2007b. Western diamondback rattlesnakes demonstratephysiological and biochemical strategies for tolerating pro-longed starvation. Physiol Biochem Zool 80:25–34.
———. 2008. Fatty acid analyses may provide insight into theprogression of starvation among squamate reptiles. CompBiochem Physiol 151:239–246.
Miller J.D. 1997. Reproduction in sea turtles. Pp. 51–82 in P.L.Lutz and J.A. Musick, eds. The biology of sea turtles. CRC,Boca Raton, FL.
Moon D.-Y., D.W. Owens, and D.S. MacKenzie. 1999. Theeffects of fasting and increased feeding on plasma thyroidhormones, glucose, and total protein in sea turtles. Zool Sci16:579–586.
Mrosovsky N. and D.F. Sherry. 1980. Animal anorexias. Science207:837–842.
Myers A.E. and G.C. Hays. 2006. Do leatherback turtles Der-mochelys coriacea forage during the breeding season? a com-bination of data-logging devices provide new insights. MarEcol Prog Ser 322:259–267.
Naulleau G. and X. Bonnet. 1996. Body condition thresholdfor breeding in a viviparous snake. Oecologia 107:301–306.
Olsson M. and R. Shine. 1997. The limits to reproductive out-put: offspring size versus number in the sand lizard (Lacertaagilis). Am Nat 149:179–188.
Peig J. and A.J. Green. 2009. New perspectives for estimatingbody condition from mass/length data: the scaled mass indexas an alternative method. Oikos 118:1883–1891.
Perrault J.R., D.L. Miller, E. Eads, C. Johnson, A. Merrill, L.J.Thompson, and J. Wyneken. 2012. Maternal health status
This content downloaded from 128.200.28.208 on Sat, 29 Jun 2013 14:26:43 PMAll use subject to JSTOR Terms and Conditions
Reproductive Strategy in Leatherback Turtles 397
correlates with nest success of leatherback sea turtles (Der-mochelys coriacea) from Florida. PLoS ONE 7:e31841.
Price E.R., B.P. Wallace, R.D. Reina, J.R. Spotila, F.V. Paladino,R. Piedra, and E. Velez. 2004. Size, growth, and reproductiveoutput of adult female leatherback turtles Dermochelys coria-cea. Endanger Species Res 5:1–8.
Reina R.D., P.A. Mayor, J.R. Spotila, R. Piedra, and F.V. Pala-dino. 2002. Nesting ecology of the leatherback turtle, Der-mochelys coriacea, at Parque Nacional Marino Las Baulas,Costa Rica: 1988–89 to 1999–2000. Copeia 3:653–664.
Robin J.-P., L. Boucontet, P. Chillet, and R. Groscolas. 1998.Behavioral changes in fasting emperor penguins: evidencefor a “refeeding signal” linked to a metabolic shift. Am JPhysiol 274:R746–R753.
Santos A.J.B., E.M.X. Freire, C. Bellini, and G. Corso. 2010.Body mass and the energy budget of gravid hawksbill turtles(Eretmochelys imbricata) during the nesting season. J Her-petol 44:352–359.
Saraux C., V.A. Viblanc, N. Hanuise, Y. Le Maho, and C. LeBohec. 2011. Effects of individual prefledging traits and en-vironmental conditions on return patterns in juvenile kingpenguins. PLoS ONE 6:e20407.
Schoefield G., J.D. Pantis, and G.C. Hays. 2006. Behaviouranalysis of the loggerhead sea turtle Caretta caretta fromdirect in-water observation. Endanger Species Res 2:71–79.
Schulte-Hostedde A., B. Zinner, J.S. Millar, and G. Hickling.2005. Restitution of mass size residuals: validating body con-dition indices. Ecology 86:155–163.
Senechal E., J. Bety, H.G. Gilchrist, K.A. Hobson, and S.E.Jamieson. 2011. Do purely capital layers exist among flying
birds? evidence of exogenous contribution to arctic-nestingcommon eider eggs. Oecologia 165:593–604.
Shine R. 2005. Life-history evolution in reptiles. Annu Rev EcolEvol Sys 36:23–46.
Southwood A.L., R.D. Andrews, F.V. Paladino, and D.R. Jones.2005. Effects of diving and swimming behavior on bodytemperatures of Pacific leatherback turtles in tropical seas.Physiol Biochem Zool 78:285–297.
Spee M., M. Beaulieu, A. Dervaux, O. Chastel, Y. Le Maho,and T. Raclot. 2010. Should I stay or should I go? hormonalcontrol of nest abandonment in a long-lived bird, the Adeliepenguin. Horm Behav 58:762–768.
Stearns S.C. 1992. The evolution of life histories. Oxford Uni-versity Press, Oxford.
Tavares-Dias M., A.A. Oliveira-Junior, M.G. Silva, J.L. Marcon,and J.F.M. Barcellos. 2009. Comparative hematological andbiochemical analysis of giant turtles from the Amazonfarmed in poor and normal nutritional conditions. Vet Arhiv79:601–610.
Wallace B.P., P.R. Sotherland, P.S. Tomillo, R.D. Reina, J.R.Spotila, and F.V. Paladino. 2007. Maternal investment in re-production and its consequences in leatherback turtles. Oe-cologia 152:37–47.
Warner D.A., X. Bonnet, K.A. Hobson, and R. Shine. 2008Lizards combine stored energy and recently acquired nutri-ents flexibly to fuel reproduction. J Anim Ecol 77:1242–1249.
Wheatley K.E., C.J.A. Bradshaw, R.G. Harcourt, and M.A.Hindell. 2008. Feast or famine: evidence for mixed capital–income breeding strategies in Weddell seals. Oecologia 155:11–20.
This content downloaded from 128.200.28.208 on Sat, 29 Jun 2013 14:26:43 PMAll use subject to JSTOR Terms and Conditions
Copyright © 2022 FDOKUMEN