Behaviour and buoyancy regulation in the deepest-diving reptile: the leatherback turtle
Upload
independentCategory
view
0download
0
MARINE ECOLOGY PROGRESS SERIESMar Ecol Prog Ser
Vol. 338: 233–247, 2007 Published May 24
INTRODUCTION
An understanding of how wild animals face trade-offs between survival and reproduction is importantfor species with high reproductive effort, particularlyfor critically endangered species where adult mortal-ity may be high enough to result in extinction. In seaturtles, reproduction takes place over 2 mo duringwhich females lay 1 to 14 clutches of 50 to 130 eggs
each, depending on the species (Miller 1997). Accord-ingly, sea turtles have high reproductive energy costs(IUCN RedList, available at: www.iucnredlist.org).Among sea turtles, the critically endangered leather-back turtle Dermochelys coriacea shows the highestreproductive output (Miller 1997): it may lay theequivalent of 20% of its body mass (J. Y. Georges etal. unpubl. data), and supposedly does not feed overthe nesting season (Miller 1997, Rivalan et al. 2005).
© Inter-Research 2007 · www.int-res.com*Corresponding author. Email: [email protected]
Dispersal and dive patterns in gravid leatherbackturtles during the nesting season in French Guiana
Sabrina Fossette1, 2, Sandra Ferraroli1, Hideji Tanaka3, 4, 5, Yan Ropert-Coudert4,Nobuaki Arai3, Katsufumi Sato4, Yasuhiko Naito4, Yvon Le Maho1, Jean-Yves Georges1,*
1Institut Pluridisciplinaire Hubert Curien-Département Ecologie, Physiologie et Ethologie, Université Louis Pasteur,CNRS-7178, 23 rue Becquerel, 67087 Strasbourg, France
2Université Louis Pasteur, 4 rue Blaise Pascal, 67070 Strasbourg, France3Department of Social Informatics, Graduate School of Informatics, Kyoto University,
Yoshida-Honmachi, Sakyo-ku, Kyoto 606-8501, Japan4National Institute of Polar Research, 1-9-10 Kaga, Itabashi-ku, Tokyo 173-8515, Japan
5Present address: Graduate School of Fisheries Sciences, Hokkaido University, 3-1-1 Minato-cho, Hakodate 041-8611, Japan
ABSTRACT: We present the first combined analysis of diving behaviour and dispersal data collectedfrom gravid leatherback turtles during 3 consecutive nesting seasons in French Guiana. In total, 23turtles were fitted with Argos satellite transmitters and 16 individuals (including 6 that were concur-rently satellite-tracked) were equipped with an electronic time-depth recorder for single inter-nesting intervals, i.e. between 2 consecutive ovi-positions. The leatherbacks dispersed over the con-tinental shelf—from the coastal zone to the shelf break—and moved over 546.2 ± 154.1 km (mean ±SD) in waters of French Guiana and neighbouring Suriname. They mostly performed shallow (9.4 ±9.2 m) and short (4.4 ± 3.4 min) dives with a slight diurnal pattern. They dived deeper as they movedaway from the coast, suggesting that they were predominantly following the seabed. Inter-nestingintervals could be divided into 2 phases: the first comprised 75% of the time turtles spent at sea, dur-ing which they dived on average 47 min h–1, while the second was characterised by lower and morevariable diving effort as the turtles returned to shore. The extended movements of leatherbacks andthe fine analysis of dive shapes suggest that, in French Guiana, leatherbacks may feed during theinter-nesting interval, probably to compensate for the energy costs associated with reproduction.Consequently, this critically endangered species is exposed to a high risk of interaction with localfisheries over the continental shelf.
KEY WORDS: Marine turtles · Dermochelys coriacea · Diving behaviour · Bottom phase · Continental shelf · Foraging strategy · Satellite tracking · French Guiana
Resale or republication not permitted without written consent of the publisher
Mar Ecol Prog Ser 338: 233–247, 2007
Consequently, during the inter-nesting intervals,leatherbacks might minimise energy expenditure tomaximize the amount of energy allocated to ovi-position and egg production (Reina et al. 2005, Wal-lace et al. 2005). This seems to be the case for gravidleatherbacks nesting along the Pacific coast of CostaRica, which have been reported to move very slowlynear the seabed (Reina et al. 2005) and display anextremely low metabolic rate (Wallace et al. 2005)during the nesting season.
In contrast, the gravid leatherbacks nesting on bothsides of the Atlantic cover great distances at sea(Georges et al. 2007, this volume) and swim at highspeed during inter-nesting intervals (Eckert et al. 1989,Eckert 2002). Atlantic leatherbacks nesting in theCaribbean perform shallow nocturnal dives and deepdiurnal dives (Eckert et al. 1989), consistent with thevertical migration of their main prey (i.e. gelatinousplankton; Hays 2003) and indicative of nocturnal for-aging activity (Myers & Hays 2006). In other words,between 2 consecutive nesting events, leatherbackturtles may compensate for high reproductive costseither by reducing their activity or by feeding, assuggested for the Pacific and Atlantic populations,respectively.
The diving behaviour of marine animals has beenstudied in several different ways, such as byanalysing depth profiles concurrently with e.g. swimspeed (e.g. Eckert 2002, Ropert-Coudert et al. 2000),3-dimensional compass data (e.g. Mitani et al. 2003)or underwater video (e.g. Reina et al. 2005, Watan-abe et al. 2006). Concurrent study of diving and dis-persal behaviour (Georges et al. 1997) providesimportant information regarding the areas in whichparticular behaviours occurs, and defines the oceaniczones where individuals tend to congregate. Such
information is crucial for the management of pro-tected species whose distribution overlaps with areasof natural and/or anthropogenic threats (e.g. Georgeset al. 2007).
Here we present the first combined analysis of div-ing and dispersal patterns of the critically-endangeredleatherback turtle, inferred from data collected duringtheir inter-nesting intervals over 3 consecutive nestingseasons in French Guiana. Following the extendeddispersal reported for this population (Georges etal. 2007), we predicted that leatherbacks in FrenchGuiana do not reduce their activity, as suggested forpopulations in the Pacific Ocean (Reina et al. 2005), butrather dive consistently and display feeding activity, assuggested for the Caribbean Sea (Eckert et al. 1989,Myers & Hays 2006). In addition, because leatherbacksface lethal interactions with industrial fisheries whiledispersing widely over the continental shelf in FrenchGuiana (Delamare 2005, Georges et al. 2007), ourstudy aimed to identify those areas and depths wherethese interactions are more likely to occur.
MATERIALS AND METHODS
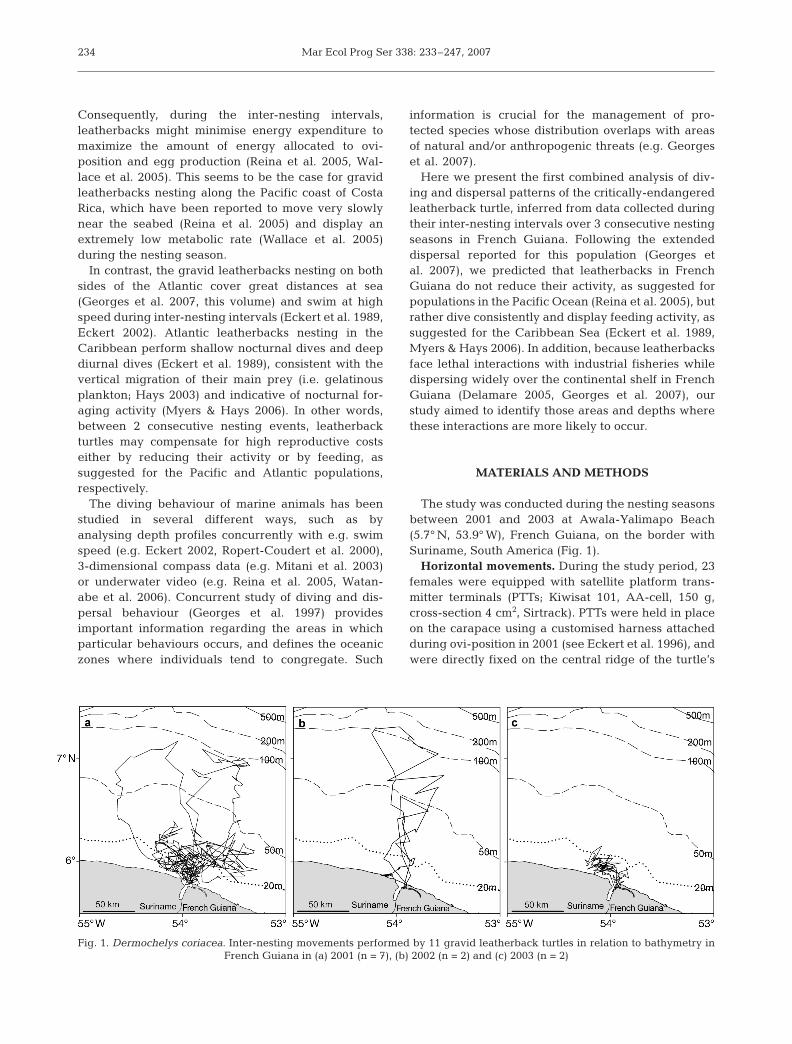
The study was conducted during the nesting seasonsbetween 2001 and 2003 at Awala-Yalimapo Beach(5.7° N, 53.9° W), French Guiana, on the border withSuriname, South America (Fig. 1).
Horizontal movements. During the study period, 23females were equipped with satellite platform trans-mitter terminals (PTTs; Kiwisat 101, AA-cell, 150 g,cross-section 4 cm2, Sirtrack). PTTs were held in placeon the carapace using a customised harness attachedduring ovi-position in 2001 (see Eckert et al. 1996), andwere directly fixed on the central ridge of the turtle’s
234
Fig. 1. Dermochelys coriacea. Inter-nesting movements performed by 11 gravid leatherback turtles in relation to bathymetry in French Guiana in (a) 2001 (n = 7), (b) 2002 (n = 2) and (c) 2003 (n = 2)
Fossette et al.: Dispersal and dive patterns in French Guianan leatherbacks
carapace in 2002 and 2003 (see Southwood et al. 1999).Harnesses were automatically released from the ani-mals after several months (during post-nesting migra-tions) due to a corrodible link in the attachment system(Eckert et al. 1996). PTTs directly fixed on the carapacewere removed as soon as turtles came back to the nest-ing beach after at least 1 inter-nesting interval.
At-sea movements were reconstructed using theArgos system (www.argosinc.com). Each Argos loca-tion was provided with a class of accuracy, with classes1, 2 and 3 having nominal standard deviations aroundthe true position of 1000, 350 and 150 m, respectively;location classes A, B and 0 have no designed accuracy.We analysed all locations of all accuracies, excludinglocations that were on land, locations separated by lessthan 1 h and locations that implied travel rates of>10 km h–1 (Eckert 2002, Gaspar et al. 2006) by filter-ing out the least accurate locations.
For individual turtles tracked during more than 1inter-nesting interval, we only considered the firsttrack to avoid pseudo-replication. For each individualtrack, we calculated the time spent at sea, the overalldistance travelled, and the distance of the furthestpoint from the beach (dispersal range). Each track wasdivided into phases according to the distance that tur-tles moved relative to the beach. Outbound/inboundphases corresponded to the period when turtles movedaway from/towards the beach, respectively. For someindividuals, an intermediate phase between outboundand inbound phases was identified, i.e. when the dis-tance to the beach remained close to its maximumvalue.
Vertical movements. Sixteen females fitted withPTTs were concurrently equipped with an electronicTime-Depth Recorder (TDR; 54 g, cross-section3.5 cm2, length 116 mm, Little Leonardo), directly fixedon the central ridge of the turtle’s carapace for a singleinter-nesting interval. Each logger included a pressuresensor that measured depth (range: 0 to 100 ± 0.05 m)every second. Following recapture, loggers wereremoved and data downloaded onto a laptop com-puter. Data were analysed using IGOR Pro software(WaveMetrics). All dives >0.5 m and <2 m (n = 48 220)occurred exclusively during the first 1.5 h and the last6 h of each individual inter-nesting interval, probablyreflecting travel from/to the nesting beach, and wereexcluded from the analysis to allow us to focus on otherdiving patterns. We recorded the start and end time ofeach dive, the maximum depth reached, the durationof descent/bottom/ascent phases, the rates of descentand ascent, and the duration of the preceding and sub-sequent post-dive surface interval. The bottom phasewas defined as the period during which depth wasgreater than 90% of the maximum depth of a givendive. For each bottom phase, we calculated the depth
amplitude and number of rapid, up-and-down undula-tions observed in the depth profile (hereafter termed‘wiggles’; see Wilson 1995, Houghton et al. 2002).
In order to classify dive profiles, a principal compo-nent analysis (PCA) was performed on all 20 607 dives>2 m, taking the above-mentioned parameters intoaccount. As the total number of dives recorded variedamong individuals (from 679 to 3539 dives), relation-ships among dive parameters were analysed using arandom sample of 600 dives per individual. Thisavoided pseudo-replication while taking inter-individ-ual variability into account (Cherel et al. 1999). Dielpatterns (in terms of number of dives, dive depth anddive duration) were investigated by using the nauticaldefinition of dawn and dusk (i.e. when the sun was12° below the horizon at Awala-Yalimapo Beach;www.usno.navy.mil). Dive effort was analysed by con-sidering hourly dive frequency and time spent divingper hour. Changes in hourly diving effort were investi-gated throughout the inter-nesting interval in 12 hincrements centred on midnight and midday, exclud-ing 12 h blocks that were incomplete (i.e. for the firstand last hours of the trip). Statistical analyses wereperformed using Minitab statistical software. Valuesare given as mean ± SD, differences being consideredas statistically significant when p < 0.05.
All turtles were measured during ovi-position usinga flexible measuring tape (±0.5 cm) following Georges& Fossette (2006). Standard curvilinear carapacelength was measured on the midline of the shell, fromthe nape notch of the carapace to the end of the caudalpeduncle. Curvilinear carapace width was measuredat the maximum width posterior to the fore-flippers(Georges & Fossette 2006).
RESULTS
Among the 23 females equipped with Argos trans-mitters, we obtained data from 11 individuals (7 in2001, 2 in 2002 and 2 in 2003) over at least 1 completeinter-nesting interval (Table 1). Among the 16 individ-uals that were fitted with TDRs, 10 were successfullyrecaptured with their tag, of which 7 (3 in 2001, 2 in2002 and 2 in 2003; Table 2) were monitored over 1complete inter-nesting interval. Four individuals wereconcurrently monitored with Argos and TDR devicesover 1 complete inter-nesting interval.
Horizontal movements
Most locations obtained from Argos were of poorquality, with locations 3, 2, 1, 0 and below contributingto 4, 8, 14, 13 and 60% of the total number of locations
235
Mar Ecol Prog Ser 338: 233–247, 2007
received, respectively. The 11 turtles spent on average10.2 ± 0.9 d (range 8.3 to 11.8 d) at sea between 2 con-secutive nesting events (Table 1). Turtles dispersedwithin a short range from the coast (90.4 ± 47.7 km,range 37.1 to 176.0 km), remaining over the shallowcontinental shelf (<200 m depth), even though theymoved over hundreds of kilometres (546.2 ± 154.1 km,range 375.7 to 846.6 km) within waters of FrenchGuiana and neighbouring Suriname (Fig. 1, Table 1).Four turtles remained within 50 km of Awala-YalimapoBeach, where they moved erratically in shallow waters(approx. 20 m depth). Four other turtles remainedwithin 100 km of the beach, reaching waters approx.50 m deep, while the last 3 individuals reached theedge of the continental shelf where depth is ~100 m.Among the 7 turtles that moved over significant dis-tances, 2 headed west into Surinamese waters, wherethey tended to move anticlockwise before swimmingalong the coast towards the nesting beach. The 5 otherturtles remained in French Guianian waters east ofAwala-Yalimapo Beach, and tended to move clockwiseuntil they crossed their initial path off the MaroniRiver. They then reached Surinamese waters, wherethey moved anticlockwise before swimming along thecoast towards the nesting beach.
There was no significant relationship between turtlebiometry (standard curvilinear carapace length andcurvilinear carapace width) and trip duration (Spear-man rank correlation, rS = –0.19, p = 0.65 and rS = 0.12,p = 0.77 for carapace length and width, respectively,n = 8 turtles; 3 of the 11 turtles were not measured),dispersal range (rS = –0.40, p = 0.32 and rS = 0.17, p =0.69 for length and width, respectively) or total dis-tance travelled (rS = –0.12, p = 0.78 and rS = 0.37, p =0.37 for length and width, respectively).
Vertical movements
General characteristics
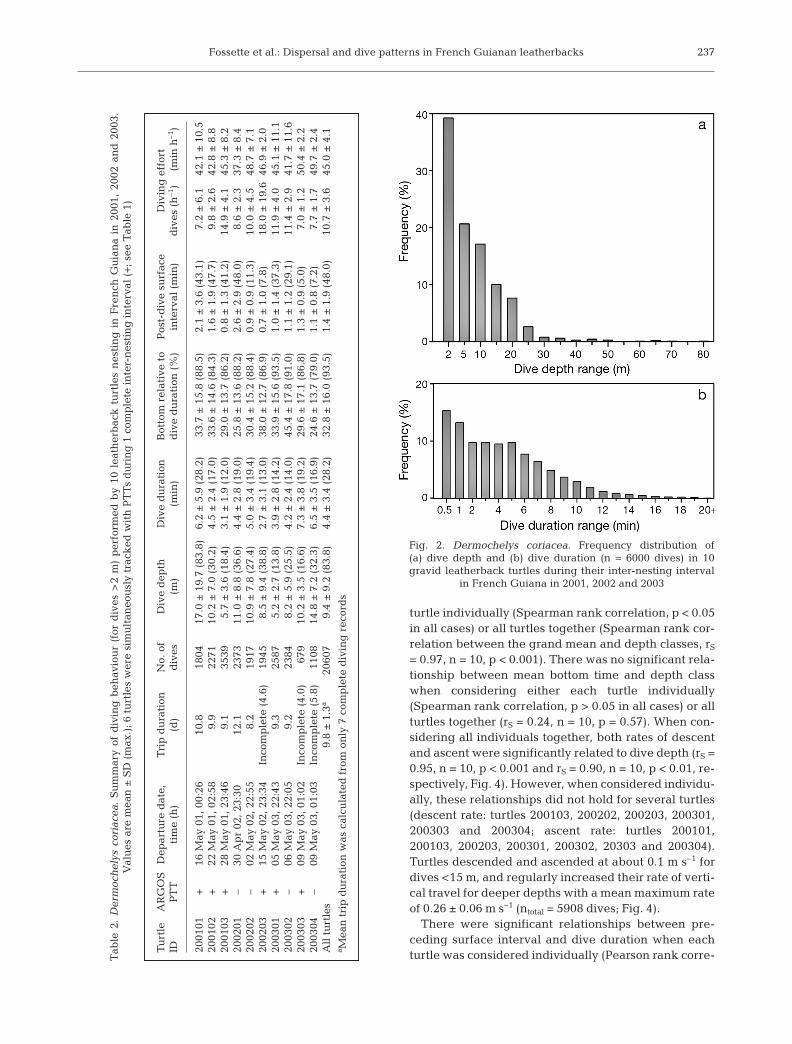
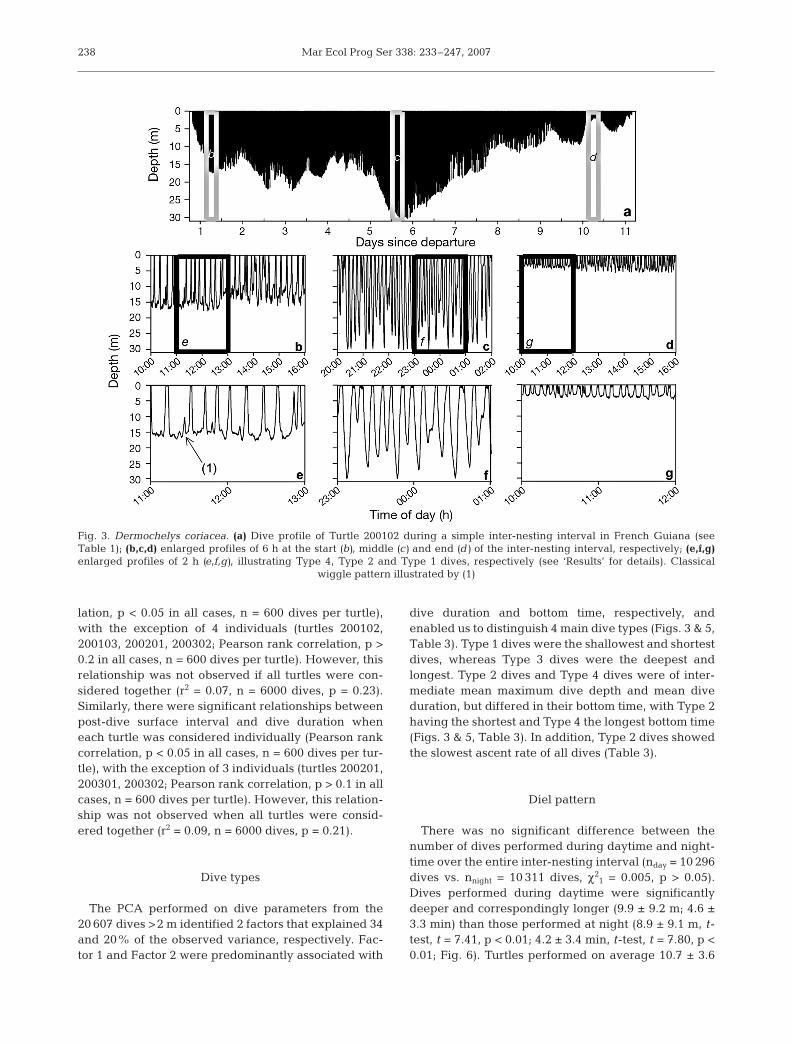
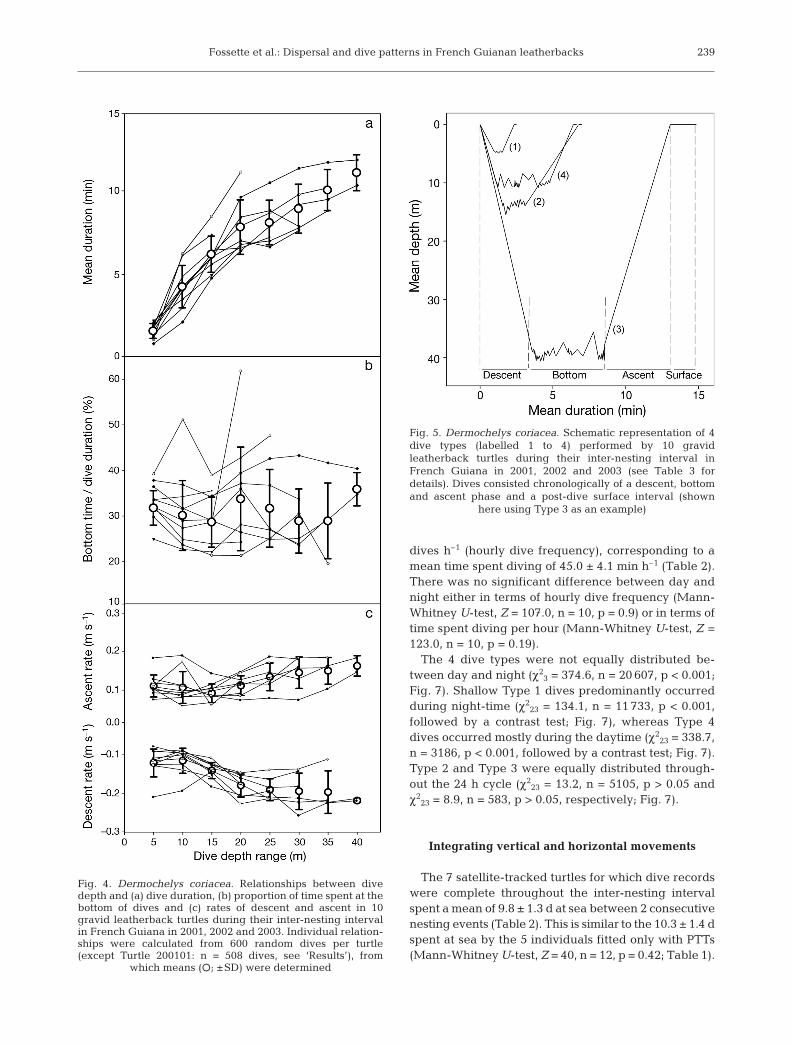
A total of 20 607 dives >2 m was recorded by the 10turtles; the longest dive was 28.2 min and attained amaximum depth of 63.9 m, while the deepest dive was83.8 m and was of 17.9 min duration (Table 2). Turtlesperformed mostly shallow (9.4 ± 9.2 m) and short (4.4 ±3.4 min) dives, with substantial variation among individ-uals (Table 2). Dives shallower than 8 and 25 m repre-sented 50 and 90% of the 6000 randomly sampled dives,respectively (Fig. 2a). Dives shorter than 4 and 10 minrepresented 50 and 90% of the 6000 randomly sampleddives, respectively (Fig. 2b). Dives deeper than 40 m (n =92) were performed by 1 single individual (Turtle200101); these dives lasted on average 15.3 ± 3.1 min anddid not significantly increase in duration with increasingdepth (from 40 to 85 m; ANOVA, F8,91 = 2.02, p = 0.06).Within a dive, the time spent in the bottom phase lasteda mean of 1.6 ± 1.8 min, corresponding to 32.8 ± 16.0%(range 1 to 90%) of total dive duration (Table 2). Wigglesoccurred in the bottom phase of most of the dives: 50 and90% of the dives showed <12 and <40 wiggles, respec-tively, with a mean of 16.3 ± 17.5 wiggles per dive(Fig. 3). Mean surface interval was 1.4 ± 1.9 min (Table 2).
Due to dive depth distribution, the relationships be-tween dive depth and other dive parameters were in-vestigated by using 5 m dive depth increments be-tween 2 and 40 m (individual relations were calculatedwith 600 random dives per turtle, except Turtle 200101[n = 508 dives, since 92 of those 600 randomly selecteddives were >40 m]; therefore, ntotal = 5908 dives; Fig. 4).Mean dive duration increased significantly with in-creasing depth class when considering either each
236
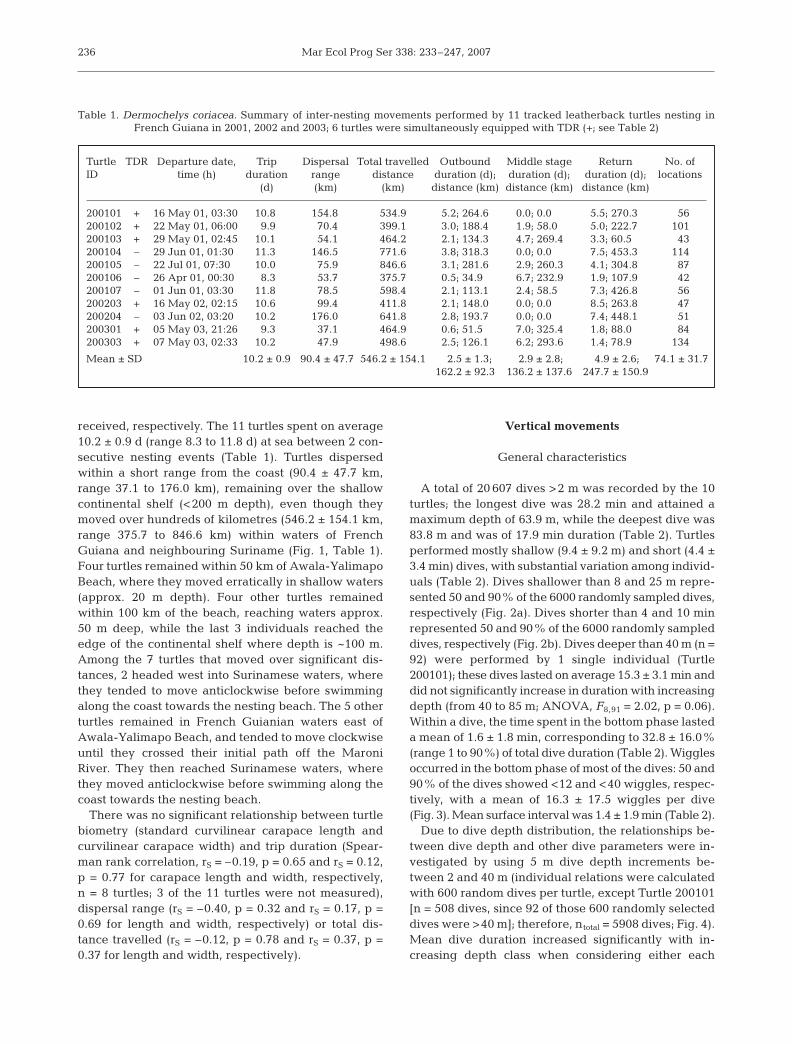
Turtle TDR Departure date, Trip Dispersal Total travelled Outbound Middle stage Return No. ofID time (h) duration range distance duration (d); duration (d); duration (d); locations
(d) (km) (km) distance (km) distance (km) distance (km)
200101 + 16 May 01, 03:30 10.8 154.8 534.9 5.2; 264.6 0.0; 0.0 5.5; 270.3 56200102 + 22 May 01, 06:00 9.9 70.4 399.1 3.0; 188.4 1.9; 58.0 5.0; 222.7 101200103 + 29 May 01, 02:45 10.1 54.1 464.2 2.1; 134.3 4.7; 269.4 3.3; 60.5 43200104 – 29 Jun 01, 01:30 11.3 146.5 771.6 3.8; 318.3 0.0; 0.0 7.5; 453.3 114200105 – 22 Jul 01, 07:30 10.0 75.9 846.6 3.1; 281.6 2.9; 260.3 4.1; 304.8 87200106 – 26 Apr 01, 00:30 8.3 53.7 375.7 0.5; 34.9 6.7; 232.9 1.9; 107.9 42200107 – 01 Jun 01, 03:30 11.8 78.5 598.4 2.1; 113.1 2.4; 58.5 7.3; 426.8 56200203 + 16 May 02, 02:15 10.6 99.4 411.8 2.1; 148.0 0.0; 0.0 8.5; 263.8 47200204 – 03 Jun 02, 03:20 10.2 176.0 641.8 2.8; 193.7 0.0; 0.0 7.4; 448.1 51200301 + 05 May 03, 21:26 9.3 37.1 464.9 0.6; 51.5 7.0; 325.4 1.8; 88.0 84200303 + 07 May 03, 02:33 10.2 47.9 498.6 2.5; 126.1 6.2; 293.6 1.4; 78.9 134
Mean ± SD 10.2 ± 0.9 90.4 ± 47.7 546.2 ± 154.1 2.5 ± 1.3; 2.9 ± 2.8; 4.9 ± 2.6; 74.1 ± 31.7162.2 ± 92.3 136.2 ± 137.6 247.7 ± 150.9
Table 1. Dermochelys coriacea. Summary of inter-nesting movements performed by 11 tracked leatherback turtles nesting in French Guiana in 2001, 2002 and 2003; 6 turtles were simultaneously equipped with TDR (+; see Table 2)
Fossette et al.: Dispersal and dive patterns in French Guianan leatherbacks
turtle individually (Spearman rank correlation, p < 0.05in all cases) or all turtles together (Spearman rank cor-relation between the grand mean and depth classes, rS
= 0.97, n = 10, p < 0.001). There was no significant rela-tionship between mean bottom time and depth classwhen considering either each turtle individually(Spearman rank correlation, p > 0.05 in all cases) or allturtles together (rS = 0.24, n = 10, p = 0.57). When con-sidering all individuals together, both rates of descentand ascent were significantly related to dive depth (rS =0.95, n = 10, p < 0.001 and rS = 0.90, n = 10, p < 0.01, re-spectively, Fig. 4). However, when considered individu-ally, these relationships did not hold for several turtles(descent rate: turtles 200103, 200202, 200203, 200301,200303 and 200304; ascent rate: turtles 200101,200103, 200203, 200301, 200302, 20303 and 200304).Turtles descended and ascended at about 0.1 m s–1 fordives <15 m, and regularly increased their rate of verti-cal travel for deeper depths with a mean maximum rateof 0.26 ± 0.06 m s–1 (ntotal = 5908 dives; Fig. 4).
There were significant relationships between pre-ceding surface interval and dive duration when eachturtle was considered individually (Pearson rank corre-
237
Fig. 2. Dermochelys coriacea. Frequency distribution of(a) dive depth and (b) dive duration (n = 6000 dives) in 10gravid leatherback turtles during their inter-nesting interval
in French Guiana in 2001, 2002 and 2003
Tu
rtle
A
RG
OS
Dep
artu
re d
ate,
Tri
p d
ura
tion
No.
of
Div
e d
epth
Div
e d
ura
tion
Bot
tom
rel
ativ
e to
Pos
t-d
ive
surf
ace
Div
ing
eff
ort
IDP
TT
tim
e (h
)(d
)d
ives
(m)
(min
)d
ive
du
rati
on (
%)
inte
rval
(m
in)
div
es (
h–
1 )(m
in h
–1 )
2001
01+
16 M
ay 0
1, 0
0:26
10.8
1804
17.0
±19
.7 (
83.8
)6.
2 ±
5.9
(28.
2)33
.7 ±
15.8
(88
.5)
2.1
±3.
6 (4
3.1)
7.2
±6.
142
.1 ±
10.5
2001
02+
22 M
ay 0
1, 0
2:58
9.9
2271
10.2
±7.
0 (3
0.2)
4.5
±2.
4 (1
7.0)
33.6
±14
.6 (
84.3
)1.
6 ±
1.9
(47.
7)9.
8 ±
2.6
42.8
±8.
820
0103
+28
May
01,
23:
469.
135
395.
7 ±
3.6
(18.
4)3.
1 ±
1.9
(12.
0)29
.0 ±
13.7
(86
.2)
0.8
±1.
3 (4
1.2)
14.9
±4.
145
.3 ±
8.2
2002
01–
30 A
pr
02, 2
3:30
12.1
2373
11.0
±8.
8 (3
6.6)
4.4
±2.
8 (1
9.0)
25.8
±13
.6 (
88.2
)2.
6 ±
2.9
(48.
0)8.
6 ±
2.3
37.3
±8.
420
0202
–02
May
02,
22:
558.
219
1710
.9 ±
7.8
(27.
4)5.
0 ±
3.4
(19.
4)30
.4 ±
15.2
(88
.4)
0.9
±0.
9 (1
1.3)
10.0
±4.
548
.7 ±
7.1
2002
03+
15 M
ay 0
2, 2
3:34
Inco
mp
lete
(4.
6)19
458.
5 ±
9.4
(38.
8)2.
7 ±
3.1
(13.
0)38
.0 ±
12.7
(86
.9)
0.7
±1.
0 (7
.8)
18.0
±19
.646
.9 ±
2.0
2003
01+
05 M
ay 0
3, 2
2:43
9.3
2587
5.2
±2.
7 (1
3.8)
3.9
±2.
8 (1
4.2)
33.9
±15
.6 (
93.5
)1.
0 ±
1.4
(37.
3)11
.9 ±
4.0
45.1
±11
.120
0302
–06
May
03,
22:
059.
223
848.
2 ±
5.9
(25.
5)4.
2 ±
2.4
(14.
0)45
.4 ±
17.8
(91
.0)
1.1
±1.
2 (2
9.1)
11.4
±2.
941
.7 ±
11.6
2003
03+
09 M
ay 0
3, 0
1:02
Inco
mp
lete
(4.
0)67
910
.2 ±
3.5
(16.
6)7.
3 ±
3.8
(19.
2)29
.6 ±
17.1
(86
.8)
1.3
±0.
9 (5
.0)
7.0
±1.
250
.4 ±
2.2
2003
04–
09 M
ay 0
3, 0
1:03
Inco
mp
lete
(5.
8)11
0814
.8 ±
7.2
(32.
3)6.
5 ±
3.5
(16.
9)24
.6 ±
13.7
(79
.0)
1.1
±0.
8 (7
.2)
7.7
±1.
749
.7 ±
2.4
All
tu
rtle
s9.
8 ±
1.3a
2060
709.
4 ±
9.2
(83.
8)4.
4 ±
3.4
(28.
2)32
.8 ±
16.0
(93
.5)
1.4
±1.
9 (4
8.0)
10.7
±3.
645
.0 ±
4.1
a Mea
n t
rip
du
rati
on w
as c
alcu
late
d f
rom
on
ly 7
com
ple
te d
ivin
g r
ecor
ds
Tab
le 2
. D
erm
och
elys
cor
iace
a. S
um
mar
y of
div
ing
beh
avio
ur
(for
div
es >
2 m
) p
erfo
rmed
by
10 l
eath
erb
ack
tu
rtle
s n
esti
ng
in
Fre
nch
Gu
ian
a in
200
1, 2
002
and
200
3.
Val
ues
are
mea
n ±
SD
(m
ax.)
; 6 t
urt
les
wer
e si
mu
ltan
eou
sly
trac
ked
wit
h P
TT
s d
uri
ng
1 c
omp
lete
in
ter-
nes
tin
g i
nte
rval
(+
; see
Tab
le 1
)
Mar Ecol Prog Ser 338: 233–247, 2007
lation, p < 0.05 in all cases, n = 600 dives per turtle),with the exception of 4 individuals (turtles 200102,200103, 200201, 200302; Pearson rank correlation, p >0.2 in all cases, n = 600 dives per turtle). However, thisrelationship was not observed if all turtles were con-sidered together (r2 = 0.07, n = 6000 dives, p = 0.23).Similarly, there were significant relationships betweenpost-dive surface interval and dive duration wheneach turtle was considered individually (Pearson rankcorrelation, p < 0.05 in all cases, n = 600 dives per tur-tle), with the exception of 3 individuals (turtles 200201,200301, 200302; Pearson rank correlation, p > 0.1 in allcases, n = 600 dives per turtle). However, this relation-ship was not observed when all turtles were consid-ered together (r2 = 0.09, n = 6000 dives, p = 0.21).
Dive types
The PCA performed on dive parameters from the20 607 dives >2 m identified 2 factors that explained 34and 20% of the observed variance, respectively. Fac-tor 1 and Factor 2 were predominantly associated with
dive duration and bottom time, respectively, andenabled us to distinguish 4 main dive types (Figs. 3 & 5,Table 3). Type 1 dives were the shallowest and shortestdives, whereas Type 3 dives were the deepest andlongest. Type 2 dives and Type 4 dives were of inter-mediate mean maximum dive depth and mean diveduration, but differed in their bottom time, with Type 2having the shortest and Type 4 the longest bottom time(Figs. 3 & 5, Table 3). In addition, Type 2 dives showedthe slowest ascent rate of all dives (Table 3).
Diel pattern
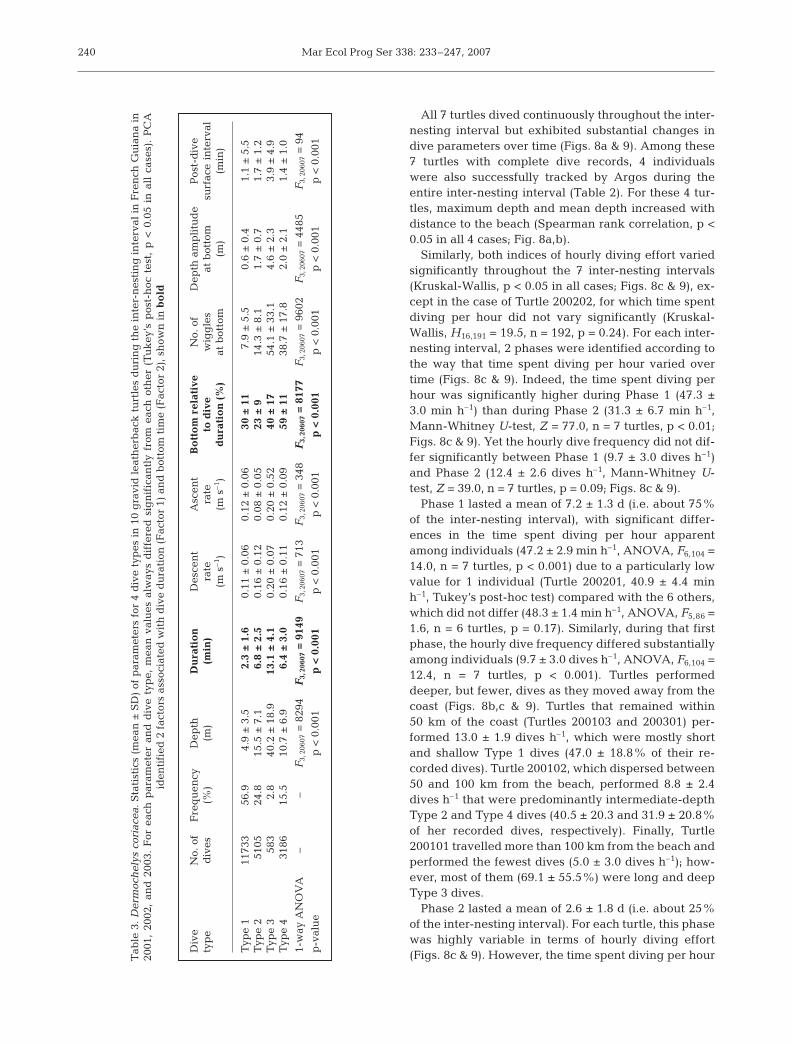
There was no significant difference between thenumber of dives performed during daytime and night-time over the entire inter-nesting interval (nday = 10 296dives vs. nnight = 10 311 dives, χ2
1 = 0.005, p > 0.05).Dives performed during daytime were significantlydeeper and correspondingly longer (9.9 ± 9.2 m; 4.6 ±3.3 min) than those performed at night (8.9 ± 9.1 m, t-test, t = 7.41, p < 0.01; 4.2 ± 3.4 min, t-test, t = 7.80, p <0.01; Fig. 6). Turtles performed on average 10.7 ± 3.6
238
Fig. 3. Dermochelys coriacea. (a) Dive profile of Turtle 200102 during a simple inter-nesting interval in French Guiana (seeTable 1); (b,c,d) enlarged profiles of 6 h at the start (b), middle (c) and end (d) of the inter-nesting interval, respectively; (e,f,g)enlarged profiles of 2 h (e,f,g), illustrating Type 4, Type 2 and Type 1 dives, respectively (see ‘Results’ for details). Classical
wiggle pattern illustrated by (1)
Fossette et al.: Dispersal and dive patterns in French Guianan leatherbacks
dives h–1 (hourly dive frequency), corresponding to amean time spent diving of 45.0 ± 4.1 min h–1 (Table 2).There was no significant difference between day andnight either in terms of hourly dive frequency (Mann-Whitney U-test, Z = 107.0, n = 10, p = 0.9) or in terms oftime spent diving per hour (Mann-Whitney U-test, Z =123.0, n = 10, p = 0.19).
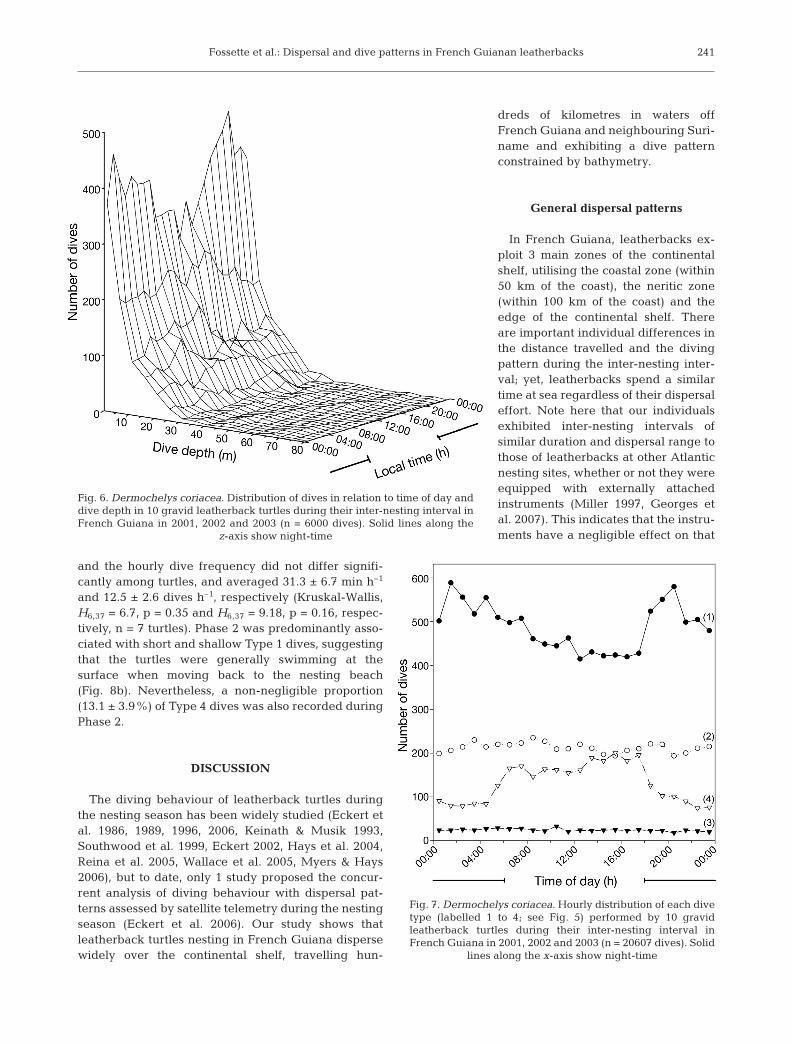
The 4 dive types were not equally distributed be-tween day and night (χ2
3 = 374.6, n = 20 607, p < 0.001;Fig. 7). Shallow Type 1 dives predominantly occurredduring night-time (χ2
23 = 134.1, n = 11 733, p < 0.001,followed by a contrast test; Fig. 7), whereas Type 4dives occurred mostly during the daytime (χ2
23 = 338.7,n = 3186, p < 0.001, followed by a contrast test; Fig. 7).Type 2 and Type 3 were equally distributed through-out the 24 h cycle (χ2
23 = 13.2, n = 5105, p > 0.05 andχ2
23 = 8.9, n = 583, p > 0.05, respectively; Fig. 7).
Integrating vertical and horizontal movements
The 7 satellite-tracked turtles for which dive recordswere complete throughout the inter-nesting intervalspent a mean of 9.8 ± 1.3 d at sea between 2 consecutivenesting events (Table 2). This is similar to the 10.3 ± 1.4 dspent at sea by the 5 individuals fitted only with PTTs(Mann-Whitney U-test, Z = 40, n = 12, p = 0.42; Table 1).
239
Fig. 4. Dermochelys coriacea. Relationships between divedepth and (a) dive duration, (b) proportion of time spent at thebottom of dives and (c) rates of descent and ascent in 10gravid leatherback turtles during their inter-nesting intervalin French Guiana in 2001, 2002 and 2003. Individual relation-ships were calculated from 600 random dives per turtle(except Turtle 200101: n = 508 dives, see ‘Results’), from
which means (s; ±SD) were determined
Fig. 5. Dermochelys coriacea. Schematic representation of 4dive types (labelled 1 to 4) performed by 10 gravidleatherback turtles during their inter-nesting interval inFrench Guiana in 2001, 2002 and 2003 (see Table 3 fordetails). Dives consisted chronologically of a descent, bottomand ascent phase and a post-dive surface interval (shown
here using Type 3 as an example)
Mar Ecol Prog Ser 338: 233–247, 2007
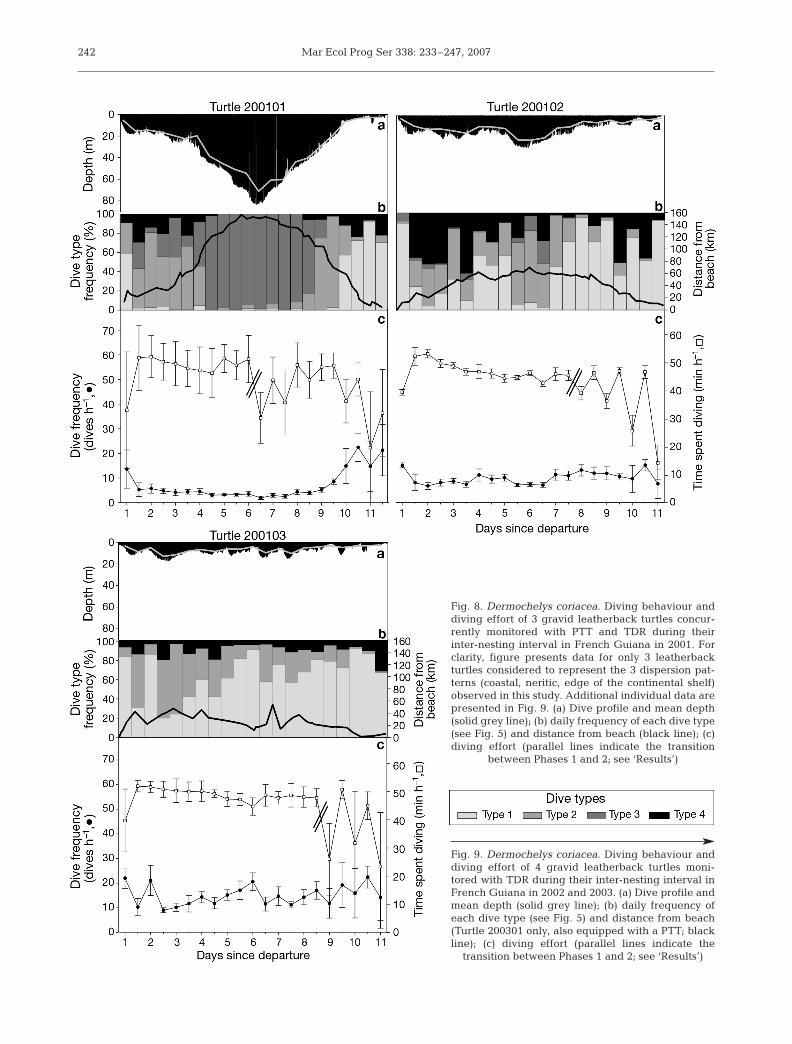
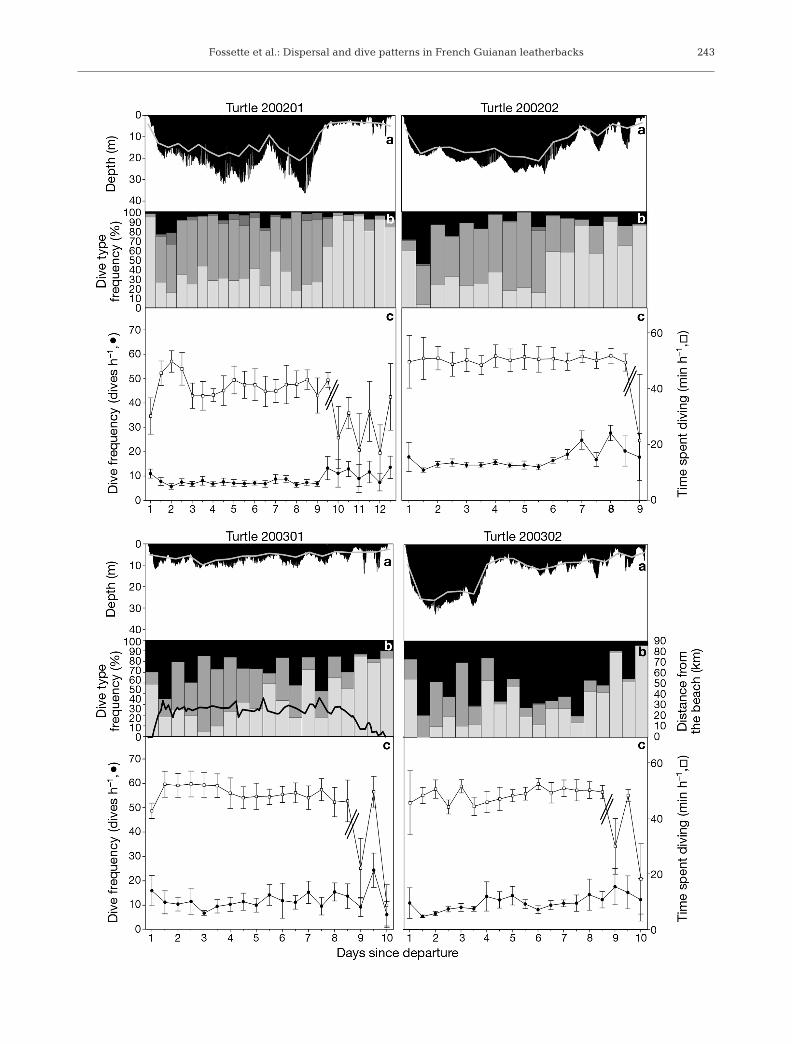
All 7 turtles dived continuously throughout the inter-nesting interval but exhibited substantial changes indive parameters over time (Figs. 8a & 9). Among these7 turtles with complete dive records, 4 individualswere also successfully tracked by Argos during theentire inter-nesting interval (Table 2). For these 4 tur-tles, maximum depth and mean depth increased withdistance to the beach (Spearman rank correlation, p <0.05 in all 4 cases; Fig. 8a,b).
Similarly, both indices of hourly diving effort variedsignificantly throughout the 7 inter-nesting intervals(Kruskal-Wallis, p < 0.05 in all cases; Figs. 8c & 9), ex-cept in the case of Turtle 200202, for which time spentdiving per hour did not vary significantly (Kruskal-Wallis, H16,191 = 19.5, n = 192, p = 0.24). For each inter-nesting interval, 2 phases were identified according tothe way that time spent diving per hour varied overtime (Figs. 8c & 9). Indeed, the time spent diving perhour was significantly higher during Phase 1 (47.3 ±3.0 min h–1) than during Phase 2 (31.3 ± 6.7 min h–1,Mann-Whitney U-test, Z = 77.0, n = 7 turtles, p < 0.01;Figs. 8c & 9). Yet the hourly dive frequency did not dif-fer significantly between Phase 1 (9.7 ± 3.0 dives h–1)and Phase 2 (12.4 ± 2.6 dives h–1, Mann-Whitney U-test, Z = 39.0, n = 7 turtles, p = 0.09; Figs. 8c & 9).
Phase 1 lasted a mean of 7.2 ± 1.3 d (i.e. about 75%of the inter-nesting interval), with significant differ-ences in the time spent diving per hour apparentamong individuals (47.2 ± 2.9 min h–1, ANOVA, F6,104 =14.0, n = 7 turtles, p < 0.001) due to a particularly lowvalue for 1 individual (Turtle 200201, 40.9 ± 4.4 minh–1, Tukey’s post-hoc test) compared with the 6 others,which did not differ (48.3 ± 1.4 min h–1, ANOVA, F5,86 =1.6, n = 6 turtles, p = 0.17). Similarly, during that firstphase, the hourly dive frequency differed substantiallyamong individuals (9.7 ± 3.0 dives h–1, ANOVA, F6,104 =12.4, n = 7 turtles, p < 0.001). Turtles performeddeeper, but fewer, dives as they moved away from thecoast (Figs. 8b,c & 9). Turtles that remained within50 km of the coast (Turtles 200103 and 200301) per-formed 13.0 ± 1.9 dives h–1, which were mostly shortand shallow Type 1 dives (47.0 ± 18.8% of their re-corded dives). Turtle 200102, which dispersed between50 and 100 km from the beach, performed 8.8 ± 2.4dives h–1 that were predominantly intermediate-depthType 2 and Type 4 dives (40.5 ± 20.3 and 31.9 ± 20.8%of her recorded dives, respectively). Finally, Turtle200101 travelled more than 100 km from the beach andperformed the fewest dives (5.0 ± 3.0 dives h–1); how-ever, most of them (69.1 ± 55.5%) were long and deepType 3 dives.
Phase 2 lasted a mean of 2.6 ± 1.8 d (i.e. about 25%of the inter-nesting interval). For each turtle, this phasewas highly variable in terms of hourly diving effort(Figs. 8c & 9). However, the time spent diving per hour
240
Div
e N
o. o
f F
req
uen
cyD
epth
D
ura
tio
nD
esce
nt
A
scen
t
Bo
tto
m r
elat
ive
No.
of
D
epth
am
pli
tud
eP
ost-
div
ety
pe
div
es(%
)(m
)(m
in)
rate
rate
to d
ive
wig
gle
sat
bot
tom
surf
ace
inte
rval
(m s
–1 )
(m s
–1 )
du
rati
on
(%
)at
bot
tom
(m)
(min
)
Typ
e 1
1173
356
.94.
9 ±
3.5
2.3
±1.
6 0.
11 ±
0.06
0.
12 ±
0.06
30
±11
7.9
±5.
5 0.
6 ±
0.4
1.1
±5.
5 T
ype
251
0524
.815
.5 ±
7.1
6.8
±2.
5 0.
16 ±
0.12
0.
08 ±
0.05
23
±9
14.3
±8.
1 1.
7 ±
0.7
1.7
±1.
2 T
ype
358
32.
840
.2 ±
18.9
13
.1 ±
4.1
0.20
±0.
07
0.20
±0.
52
40 ±
17
54.1
±33
.1
4.6
±2.
3 3.
9 ±
4.9
Typ
e 4
3186
15.5
10.7
±6.
9 6.
4 ±
3.0
0.16
±0.
11
0.12
±0.
09
59 ±
11
38.7
±17
.8
2.0
±2.
1 1.
4 ±
1.0
1-w
ay A
NO
VA
––
F3,
2060
7=
829
4F
3,20
607
= 9
149
F3,
2060
7=
713
F3,
2060
7=
348
F3,
2060
7=
817
7F
3,20
607
= 9
602
F3,
2060
7=
448
5F
3,20
607
= 9
4
p-v
alu
ep
< 0
.001
p <
0.0
01p
< 0
.001
p <
0.0
01p
< 0
.001
p <
0.0
01p
< 0
.001
p <
0.0
01
Tab
le 3
. Der
moc
hel
ys c
oria
cea.
Sta
tist
ics
(mea
n ±
SD
) of
par
amet
ers
for
4 d
ive
typ
es i
n 1
0 g
ravi
d l
eath
erb
ack
tu
rtle
s d
uri
ng
th
e in
ter-
nes
tin
g i
nte
rval
in
Fre
nch
Gu
ian
a in
2001
, 20
02,
and
200
3. F
or e
ach
par
amet
er a
nd
div
e ty
pe,
mea
n v
alu
es a
lway
s d
iffe
red
sig
nif
ican
tly
from
eac
h o
ther
(T
uk
ey’s
pos
t-h
oc t
est,
p <
0.0
5 in
all
cas
es).
PC
A
iden
tifi
ed 2
fac
tors
ass
ocia
ted
wit
h d
ive
du
rati
on (
Fac
tor
1) a
nd
bot
tom
tim
e (F
acto
r 2)
, sh
own
in
bo
ld
Fossette et al.: Dispersal and dive patterns in French Guianan leatherbacks
and the hourly dive frequency did not differ signifi-cantly among turtles, and averaged 31.3 ± 6.7 min h–1
and 12.5 ± 2.6 dives h–1, respectively (Kruskal-Wallis,H6,37 = 6.7, p = 0.35 and H6,37 = 9.18, p = 0.16, respec-tively, n = 7 turtles). Phase 2 was predominantly asso-ciated with short and shallow Type 1 dives, suggestingthat the turtles were generally swimming at thesurface when moving back to the nesting beach(Fig. 8b). Nevertheless, a non-negligible proportion(13.1 ± 3.9%) of Type 4 dives was also recorded duringPhase 2.
DISCUSSION
The diving behaviour of leatherback turtles duringthe nesting season has been widely studied (Eckert etal. 1986, 1989, 1996, 2006, Keinath & Musik 1993,Southwood et al. 1999, Eckert 2002, Hays et al. 2004,Reina et al. 2005, Wallace et al. 2005, Myers & Hays2006), but to date, only 1 study proposed the concur-rent analysis of diving behaviour with dispersal pat-terns assessed by satellite telemetry during the nestingseason (Eckert et al. 2006). Our study shows thatleatherback turtles nesting in French Guiana dispersewidely over the continental shelf, travelling hun-
dreds of kilometres in waters offFrench Guiana and neighbouring Suri-name and exhibiting a dive patternconstrained by bathymetry.
General dispersal patterns
In French Guiana, leatherbacks ex-ploit 3 main zones of the continentalshelf, utilising the coastal zone (within50 km of the coast), the neritic zone(within 100 km of the coast) and theedge of the continental shelf. Thereare important individual differences inthe distance travelled and the divingpattern during the inter-nesting inter-val; yet, leatherbacks spend a similartime at sea regardless of their dispersaleffort. Note here that our individualsexhibited inter-nesting intervals ofsimilar duration and dispersal range tothose of leatherbacks at other Atlanticnesting sites, whether or not they wereequipped with externally attachedinstruments (Miller 1997, Georges etal. 2007). This indicates that the instru-ments have a negligible effect on that
241
Fig. 6. Dermochelys coriacea. Distribution of dives in relation to time of day anddive depth in 10 gravid leatherback turtles during their inter-nesting interval inFrench Guiana in 2001, 2002 and 2003 (n = 6000 dives). Solid lines along the
z-axis show night-time
Fig. 7. Dermochelys coriacea. Hourly distribution of each divetype (labelled 1 to 4; see Fig. 5) performed by 10 gravidleatherback turtles during their inter-nesting interval inFrench Guiana in 2001, 2002 and 2003 (n = 20607 dives). Solid
lines along the x-axis show night-time
Mar Ecol Prog Ser 338: 233–247, 2007242
Fig. 8. Dermochelys coriacea. Diving behaviour anddiving effort of 3 gravid leatherback turtles concur-rently monitored with PTT and TDR during theirinter-nesting interval in French Guiana in 2001. Forclarity, figure presents data for only 3 leatherbackturtles considered to represent the 3 dispersion pat-terns (coastal, neritic, edge of the continental shelf)observed in this study. Additional individual data arepresented in Fig. 9. (a) Dive profile and mean depth(solid grey line); (b) daily frequency of each dive type(see Fig. 5) and distance from beach (black line); (c)diving effort (parallel lines indicate the transition
between Phases 1 and 2; see ‘Results’)
Fig. 9. Dermochelys coriacea. Diving behaviour anddiving effort of 4 gravid leatherback turtles moni-tored with TDR during their inter-nesting interval inFrench Guiana in 2002 and 2003. (a) Dive profile andmean depth (solid grey line); (b) daily frequency ofeach dive type (see Fig. 5) and distance from beach(Turtle 200301 only, also equipped with a PTT; blackline); (c) diving effort (parallel lines indicate the
transition between Phases 1 and 2; see ‘Results’)
Fossette et al.: Dispersal and dive patterns in French Guianan leatherbacks 243
Mar Ecol Prog Ser 338: 233–247, 2007
aspect of the turtles’ behaviour (S. Fossette et al.unpubl.). The observed individual variations areapparently not related to an individual’s size. Becausesea turtles grow continuously throughout their life-span (Chaloupka & Musick 1997), this suggests thatthe duration of the inter-nesting interval and the dis-persal pattern are not age-related. Instead, it might berelated to individual body condition or to oceano-graphic conditions (see Gaspar et al. 2006), but identi-fying the actual causes of inter-individual variabilitywas beyond the scope of this study.
General diving patterns
In French Guiana, leatherback diving behaviourappears to be restricted by the bathymetry of the con-tinental shelf, with 90% of dives being shallower than25 m and shorter than 10 min. Thus, dive durationnever exceeds the aerobic dive limit (ADL) estimatedas between 33 and 67 min (Southwood et al. 1999,Hays et al. 2004, Wallace et al. 2005). Aerobic divingbehaviour is supported by the weak or absent relation-ship between post-dive surface interval and dive dura-tion. Similarly, leatherbacks do not appear to antici-pate the duration of their dive, as suggested by theweak or absent relationship between preceding sur-face interval and dive duration. Such short and shallowdiving activity is similar to that reported for turtles ofthe Eastern Pacific (Southwood et al. 1999, Reina et al.2005, Wallace et al. 2005) and the China Sea (Eckert etal. 1996), but differs from the deep pelagic dives per-formed by leatherbacks in the Caribbean Sea (Eckertet al. 1989, Eckert 2002, Hays et al. 2004). Descent andascent rates are comparable, yet lower, in FrenchGuiana (0.13 ± 0.09 m s–1 and 0.11 ± 0.11 m s–1, respec-tively) than in the Eastern Pacific (descent rate: 0.15 ±0.06 m s–1; ascent rate: 0.20 ± 0.11 m s–1; estimated fromReina et al. 2005) and China Sea (descent rate: 0.20 ±0.05 m s–1; ascent rate: 0.20 ± 0.04 m s–1; estimated fromEckert et al. 1996), but are much lower than those esti-mated in the Caribbean Sea (descent rate: 0.41 ±0.18 m s–1; ascent rate: 0.31 ± 0.01 m s–1; estimated fromEckert 2002). As in Costa Rica (Reina et al. 2005),French Guianian leatherbacks seem to stroke continu-ously when moving vertically, as suggested by the sim-ilar vertical rates during descent and ascent. However,in Costa Rica, leatherback turtles maintain very lowenergy expenditure during the inter-nesting interval(Wallace et al. 2005) by laying motionless on theseafloor (Reina et al. 2005). In contrast, leatherbacksfrom French Guiana spend almost one-third of theirtime in the bottom phase of the dive, where they per-form numerous and substantial wiggles, suggestingthat they actively swim throughout the dive. This is
supported by direct measurements of the actual swimspeed in leatherbacks from French Guiana (H. Tanakapers. comm.). Additionally, when swimming back tothe nesting beach, leatherbacks from French Guianamove to the proximity of the shore in the last days ofthe inter-nesting interval, presumably in anticipationof egg laying. Such patterns may also allow gravid tur-tles to cope with potential early egg-laying. The obser-vation of a similar behaviour in leatherback turtlesnesting in Gabon (Georges et al. 2007), on the otherside of the Atlantic basin, is consistent with the factthat the duration of the inter-nesting interval isrestricted by the timing of egg-maturation. In short,leatherbacks appear to adopt 1 of at least 2 strategiesduring their inter-nesting intervals, depending on theirnesting site: the ‘Pacific strategy’, which consists ofreduced swimming activity in order to limit energyexpenditure between 2 consecutive ovi-positions, andthe ‘Atlantic strategy’, in which leatherbacks dive andswim almost continuously throughout the inter-nestinginterval while dispersing extensively, probably forfeeding (Eckert et al. 1989, 2006, Myers & Hays 2006,this study). These 2 strategies may be linked to localoceanographic conditions, with local food availabilityprobably shaping the behaviour at the different nest-ing sites, as also reported for green turtles Cheloniamydas (Hays et al. 2002).
Combined analysis
The bathymetry of Guiana’s continental shelf is notprecisely known because of the continual influenceof Amazon-derived mud banks on its morphology(Anthony & Dolique 2004), but depth generally in-creases gradually with distance from the coast (Fig. 1).In our study, leatherback turtles dived deeper as theymoved away from the coast, implying that they tend tofollow the topography of the seabed, as has been sug-gested for populations in the China Sea (Eckert et al.1996). This is supported by occasional, direct observa-tions of well-adhered but fresh mud on the carapace ofnesting leatherbacks in French Guiana (S. Fossette & J.Y. Georges pers. obs.), suggesting that the mud wasacquired some appreciable time before hauling out.
One striking finding of our study is that despite thehigh inter-individual variability in dispersal effort, allleatherback individuals spent the same amount of timediving (80% of their time spent at sea). Indeed, wefound that during the first 75% of the inter-nestinginterval, leatherbacks dived on average 47 min h–1
with remarkable consistency among individuals; incontrast, they exhibited a lower and more variable div-ing effort thereafter when returning to the coast. Simi-larly, Southwood et al. (1999) identified 2 phases in the
244
Fossette et al.: Dispersal and dive patterns in French Guianan leatherbacks
diving behaviour of leatherbacks in Costa Rica, with afirst phase characterised by relatively deep and longdives compared with the rest of the inter-nesting inter-val. Additionally, we found that the shapes of the diveschanged according to the 2 phases defined above andto distance from the nesting beach.
Close to the nesting beach
Immediately after leaving the beach and when swim-ming back to their nesting site, leatherbacks mainlyperform shallow (5 m depth) Type 1 dives. These diveswere the most abundant in all inter-nesting intervals.Comparable dive types have been reported for greenChelonia mydas and loggerhead Caretta caretta turtles(Minamikawa et al. 1997, Hochscheid et al. 1999, Hayset al. 2001, Houghton et al. 2002), as well as for leather-backs (Eckert et al. 1996, Southwood et al. 1999, Eckert2002, Reina et al. 2005, Wallace et al. 2005), and havebeen interpreted as travelling dives (Papi et al. 1997,Eckert 2002, Reina et al. 2005). Type 1 dives may con-tribute to optimal travelling behaviour, as animalsavoid unstable conditions at the sea surface (e.g pitch-ing and rolling due to wave action) and reduce surfacedrag so that transport costs are minimized (Mi-namikawa et al. 2000). Type 1 dives mostly appeared atnight, with peaks at the beginning of the night (19:00 to21:00 h) and later (02:00 h), suggesting that leather-backs may travel more at these times. In contrast, Eck-ert (2002) suggested that in the Caribbean Sea,leatherbacks may perform most of their horizontalmovements during the middle of the day.
In the coastal zone
Within the first 12 h of departure, the shape of diveschanges according to the dispersal mode: in addition tothe travel-like Type 1 dives, leatherbacks remaining inthe coastal zone (within 50 km of the coast) also per-formed dives of similar shape but slightly greaterdepth (15 m, Type 2 dives), suggesting that travellingalso occurs at greater depths. These Type 2 dives havea particularly slow (0.08 m s–1) and progressive ascentto the surface compared with other dives, similar to the‘S-shaped’ dives described for green and loggerheadturtles by Minamikawa et al. (1997), Hochscheid et al.(1999), Hays et al. (2001) and Houghton et al. (2002). Ingreen and loggerhead turtles, the slow and progres-sive ascent has been interpreted as a passive locomo-tion resulting from positive buoyancy. However, con-trary to green and loggerhead turtles, the small lungvolume of leatherbacks is probably not involved inbuoyancy control (Minamikawa et al. 1997). This pro-
gressive ascent may also correspond to prey searchand/or capture, as suggested for other diving predators(e.g. Ropert-Coudert et al. 2001). In the case ofleatherback turtles in French Guiana, the nesting sea-son coincides with the peak of the Amazonian influ-ence, resulting in rings of Amazonian waters crossingthe continental shelf (Froidefond et al. 2002) and en-hancing biological productivity. This includes the pro-duction of gelatinous plankton, whose relatively largeindividual size and quantity may make a potentiallysignificant contribution to the marine food web overthe continental shelf (Fromard et al. 2004), particularlyfor leatherbacks, which predominantly feed on jelly-fish (James & Herman 2001). Massive strandings of jel-lyfish of the genus Rhizostoma and occasionally Aure-lia are regularly observed on Awala-Yalimapo Beachduring the nesting season (up to several hundred indi-viduals on the 2 km long beach) (S. Fossette & J. Y.Georges pers. obs.). Both species have been reportedto be common prey for leatherbacks in the Atlantic(James & Herman 2001), supporting the hypothesisthat leatherbacks may encounter profitable food condi-tions during their inter-nesting intervals in FrenchGuiana, as reported for neighbouring Caribbean sites(Eckert et al. 1989, 2006, Myers & Hays 2006).
In the neritic zone and continental shelf edge
When moving further from the coast over the conti-nental shelf, leatherbacks maintained Type 2 divesand also performed 10 m Type 4 dives until theyreached the edge of the continental shelf, at whichtime Type 4 dives were replaced by Type 3 dives. Type3 and Type 4 dives are ‘W-shaped’ dives (Wilson 1995)characterised by a relatively long bottom phase, dur-ing which numerous wiggles of several metres ampli-tude (>2 m) occur. These wiggles are commonly inter-preted as corresponding to prospecting and foragingbehaviours (e.g. Schreer et al. 2001), supporting thehypothesis that leatherbacks may attempt to feed overthe continental shelf. Type 4 dives mostly occurredduring the day, suggesting that if they were associatedwith prospecting and foraging, leatherbacks may feedon gelatinous prey during daytime. If this was the case,the French Guianian situation would differ from that ofthe Caribbean, where leatherbacks are supposed to benocturnal feeders (Eckert et al. 1989). Such a differ-ence may explain why leatherbacks travel predomi-nantly during the night in French Guiana (this study)but during the day in the Caribbean Sea (Eckert 2002).
Inter-site differences may also result from local ba-thymetry. In the deep Caribbean Sea, jellyfish may onlybe accessible to leatherbacks at night as they migrate tothe surface, whereas the relatively shallow water
245
Mar Ecol Prog Ser 338: 233–247, 2007
depths of the continental shelf in French Guiana restrictjellyfish vertical movement both during day- and night-time. Further investigations are required to clarify thebehaviour and abundance of jellyfish in waters of theGuiana Shield, because nocturnal, shallow Type 1dives may also contribute to nocturnal foraging whenjellyfish migrate to the surface. In addition, if the gravidleatherbacks of French Guiana feed during the inter-nesting intervals, this could explain why they are onaverage heavier than their relatives from other nestingsites (Georges & Fossette 2006). Wallace et al. (2005)hypothesized that gravid leatherbacks in Costa Rica donot actively forage during the nesting season becausethey rarely approach their ADL. Leatherbacks inFrench Guiana also dive within their ADL, yet our re-sults suggest that they may feed opportunisticallyrather than optimally (Thompson & Fedak 2001).
Thus our combined analysis of dispersal and divingdata suggests that leatherbacks may compensate forhigh reproductive expenditure by extensively pros-pecting for food during the inter-nesting intervals. How-ever, direct evidence is required to confirm this. It couldbe tested using underwater video, or by measuring theenergy balance or body mass changes during the inter-nesting intervals. Further investigations are also re-quired to clarify the observed inter-individual variabilitywe found in the dispersal and diving patterns, and theirimplications in terms of individual fitness.
Conservation implications
If leatherback turtles forage or actively prospect forfood during the nesting season, they may be exposedto a high risk of interaction with fisheries, particu-larly in the Guiana Shield where international fisheriesoperate (Charuau 2002). For some sea turtle popula-tions that remain close to their nesting beach duringthe breeding season and exploit restricted foraginggrounds, focused conservation efforts can prove tre-mendously successful (e.g. Hays 2004). However, inFrench Guiana, leatherback turtles move far awayfrom their nesting beach during a single inter-nestinginterval, and cross international borders to move intoSurinamese waters. This emphasises the need forregional conservation strategies and international con-trol of fishing practices in this area, which is heavilyexploited by 2 local fisheries (Charuau 2002, Georgeset al. 2007). In addition, leatherbacks exploit the entirewater column, following the bathymetry of the conti-nental shelf. As a consequence, trawlers operating inFrench Guianian and Surinamese waters should adoptappropriate fishing gear (e.g. Lutcavage et al. 1997,Epperly 2003) to reduce accidental captures of criti-cally endangered leatherback turtles.
Acknowledgements. We are grateful to the Ministry ofEcology and Sustainable Development and the DirectionRégionale de l’Environnement-Guyane, French Guiana. Wethank all participants in sea turtle monitoring programmesdeveloped in Awala-Yalimapo Beach (Réserve Naturelle del’Amana, Kulalasi and WWF) for logistical help in the field.We also thank D. Grémillet for his comments on the first draft.S.F. was supported by a studentship from the French Ministryof Research. Funding was provided by grants to Y.L.M. fromthe European FEDER program and to H.T. from the ResearchFellowships of the Japan Society for the Promotion of Sciencefor Young Scientists, the Japan Society for the Promotion ofScience (14405027 and 15255003) and from the MEXT Grant-in-Aid for the 21st Century COE Program ‘Neo-Science ofNatural History’ Program at Hokkaido University. This studywas conducted under CNRS Institutional License B67-482 18.
LITERATURE CITED
Anthony EJ, Dolique F (2004) The influence of Amazon-derived mud banks on the morphology of sandy headland-bound beaches in Cayenne, French Guiana: a short tolong term perspective. Mar Geol 208:249–264
Chaloupka MY, Musick JA (1997) Age, growth, and pop-ulation dynamics. In: Lutz PL, Musick JA (eds) Thebiology of sea turtles. CRC Press, Boca Raton, FL, p233–276
Charuau A (2002) Le secteur de la pêche en mer. In: (ed) Atlasillustré de la Guyane. Publications Guyanaises, Limoges,p 72–77
Cherel Y, Trembley Y, Guinard E, Georges JY (1999) Divingbehaviour of female northern rockhopper penguins, Eu-dyptes chrysocome moseleyi, during the brooding periodat Amsterdam Island (Southern Indian Ocean). Mar Biol134:375–385
Delamare A (2005) Estimation des captures accidentelles detortues marines par les fileyeurs de la pêche côtière enGuyane. MSc dissertation, Agrocampus de Rennes
Eckert SA (2002) Swim speed and movement patterns ofgravid leatherback sea turtles (Dermochelys coriacea) atSt. Croix, US Virgin Islands. J Exp Biol 205:3689–3697
Eckert SA, Nellis DW, Eckert KL, Kooyman GL (1986) Divingpattern of two leatherback sea turtles (Dermochelys cori-acea) during internesting intervals at Sandy Point, St.Croix, U.S. Virgin Islands. Herpetologica 42:381–388
Eckert SA, Eckert KL, Ponganis P, Kooyman GL (1989) Divingand foraging behavior of leatherback sea turtles (Der-mochelys coriacea). Can J Zool 67:2834–2840
Eckert SA, Liew HC, Eckert KL, Chan EH (1996) Shallowwater diving by leatherback turtles in the South ChinaSea. Chelonian Conserv Biol 2:237–243
Eckert SA, Bagley D, Kubis S, Ehrhart L, Johnson C, StewartK, DeFreese D (2006) Internesting, and postnesting move-ments and foraging habitats of leatherback sea turtles(Dermochelys coriacea) nesting in Florida. ChelonianConserv Biol 5:239–248
Epperly SP (2003) Fisheries-related mortality and turtleexcluder devices (TEDs). In: Lutz PL, Musick JA,Wyneken (eds) The biology of sea turtles, Vol II. CRCPress, Boca Raton, FL, p 339–354
Froidefond JM, Gardel L, Guiral D, Parra M, Ternon JF (2002)Spectral remote sensing reflectances of coastal waters inFrench Guiana under the Amazon influence. Remote SensEnviron 80:225–232
Fromard F, Vega C, Proisy C (2004) Half a century of dynamiccoastal change affecting mangrove shorelines of French
246

Fossette et al.: Dispersal and dive patterns in French Guianan leatherbacks
Guiana. A case study based on remote sensing data analy-ses and field surveys. Mar Geol 208:265–265
Gaspar P, Georges JY, Fossette S, Lenoble A, Ferraroli S, LeMaho Y (2006) Neglecting ocean currents can lead us upthe wrong track. Proc R Soc B 273:2697–2703
Georges JY, Fossette S (2006) Estimating body mass inleatherback turtles Dermochelys coriacea. Mar Ecol ProgSer 318:255–262
Georges JY, Guinet C, Jouventin P, Weimerskirch H (1997) Satel-lite tracking of seabirds: interpretation of activity patternfrom the frequency of satellite locations. Ibis 139:403–405
Georges JY, Billes A, Ferraroli S, Fossette S and 6 others(2007) Meta-analysis of movements in Atlantic leather-back turtles during the nesting season: conservationimplications. Mar Ecol Prog Ser 338:225–232
Hays GC (2003) A review of the adaptive significance andecosystem consequences of zooplankton diel verticalmigrations. Hydrobiologia 503:163–170
Hays GC (2004) Good news for sea turtles. Trends Ecol Evol19:349–351
Hays GC, Akesson S, Broderick AC, Glen F and 5 others(2001) The diving behaviour of green turtles undertakingoceanic migration to and from Ascension Island: diveduration, dive profiles and depth distribution. J Exp Biol204:4093–4098
Hays GC, Glen F, Broderick AC, Godley BJ, Metcalfe JD (2002)Behavioural plasticity in a large marine herbivore: contrast-ing patterns of depth utilisation between two green turtle(Chelonia mydas) populations. Mar Biol 141:985–990
Hays GC, Isaacs C, King RS, Lloyd C, Lovell P (2004) Firstrecords of oceanic dive profiles for leatherback turtles, Der-mochelys coriacea, indicate behavioural plasticity associ-ated with long-distance migration. Anim Behav 67:733–743
Hochscheid S, Godley BJ, Broderick AC, Wilson RP (1999)Reptilian diving: highly variable dive patterns in the greenturtle Chelonia mydas. Mar Ecol Prog Ser 185:101–112
Houghton JDR, Broderick AC, Godley BJ, Metcalfe JD, HaysGC (2002) Diving behaviour during the internestinginterval for loggerhead turtles Caretta caretta nesting inCyprus. Mar Ecol Prog Ser 227:63–70
James MC, Herman TB (2001) Feeding of Dermochelys cori-acea on Medusae in the Northwest Atlantic. ChelonianConserv Biol 4:202–205
Keinath JA, Musick JA (1993) Movements and diving behav-ior of a leatherback turtle, Dermochelys coriacea. Copeia(1993):1010–1017
Lutcavage ME, Plotkin P, Witherington B, Lutz PL (1997)Human impacts on sea turtle survival. In: Lutz PL, MusickJA (eds) The biology of sea turtles. CRC Press, Boca Raton,FL, p 387–409
Miller JD (1997) Reproduction in sea turtles. In: Lutz PL,Musick JA (eds) The biology of sea turtles. CRC Press,Boca Raton, FL, p 51–73
Minamikawa S, Naito Y, Uchida I (1997) Buoyancy control indiving behaviour of the loggerhead turtle, Caretta caretta.J Ethol 15:109–118
Minamikawa S, Naito Y, Sato K, Matsuzawa Y, Bando T,Sakamoto W (2000) Maintenance of neutral buoyancy bydepth selection in the loggerhead turtle Caretta caretta.J Exp Biol 203:2967–2975
Mitani Y, Sato K, Ito S, Cameron MF, Siniff DB, Naito Y (2003)A method for reconstructing three-dimensional dive pro-files of marine mammals using geomagnetic intensitydata: results from two lactating Weddell seals. Polar Biol26:311–317
Myers AE, Hays GC (2006) Do leatherback turtles Der-mochelys coriacea forage during the breeding season? Acombination of data-logging devices provide new in-sights. Mar Ecol Prog Ser 322:259–267
Papi F, Luschi P Crosio E, Hughes GR (1997) Satellite trackingexperiments on the navigational ability and migratorybehaviour of the loggerhead turtle Caretta caretta. MarBiol 129:215–220
Reina RD, Abernathy KJ, Marshall GJ, Spotila JR (2005)Respiratory frequency, dive behavior and social interac-tions of leatherback turtles, Dermochelys coriacea, dur-ing the inter-nesting interval. J Exp Mar Biol Ecol 316:1–16
Rivalan P, Prévot-Julliard AC, Choquet R, Pradel R,Jacquemin B, Girondot M (2005) Trade-off between cur-rent reproductive effort and delay to next reproduction inthe leatherback sea turtle. Oecologia 145:564–574
Ropert-Coudert Y, Sato K, Kato A, Charassin JB, Bost CA, LeMaho Y, Naito Y (2000) Preliminary investigations of preypursuit and capture by king penguins at sea. Polar Biosci13:102–113
Ropert-Coudert Y, Kato A, Baudat J, Bost CA, Le Maho Y,Naito Y (2001) Feeding strategies of free-ranging Adéliepenguins Pygoscelis adeliae analysed by multiple datarecording. Polar Biol 24:460–466
Schreer JF, Kovacs KM, O’Hara Hines RJ (2001) Comparativediving patterns of pinnipeds and seabirds. Ecol Monogr71:137–162
Southwood AL, Andrews DD, Lutcavage ME, Paladino F,West NH, George RH, Jones DR (1999) Heart rates anddiving behaviour of leatherback sea turtles in the easternPacific Ocean. J Exp Biol 202:1115–1125
Thompson D, Fedak MA (2001) How long should a divelast? A simple model of foraging decisions by breath-hold divers in a patchy environment. Anim Behav 61:287–296
Wallace BP, Cassondra LW, Paladino FV, Morreale SJ, Lind-strom RT, Spotila JR (2005) Bioenergetics and diving activ-ity of internesting leatherback turtles Dermochelys cori-acea at Parque Nacional Marino Las Baulas, Costa Rica. JExp Biol 208:3873–3884
Watanabe Y, Bornemann H, Liebsch N, Plötz J, Sato K, NaitoY, Miyazaki N (2006) Seal-mounted cameras detect inver-tebrate fauna on the underside of an Antarctic ice shelf.Mar Ecol Prog Ser 309:297–300
Wilson RP (1995) Foraging ecology. In: Williams TD (ed) Thepenguins. Oxford University Press, Oxford, p 81–106
247
Editorial responsibility: Rory Wilson (Contributing Editor),Swansea, UK
Submitted: March 6, 2006; Accepted: October 19, 2006Proofs received from author(s): April 24, 2007
Copyright © 2022 FDOKUMEN


![[Human and wild mammal parasitosis in French Guiana]](https://static.fdokumen.com/doc/165x107/633660bb02a8c1a4ec022a28/human-and-wild-mammal-parasitosis-in-french-guiana.jpg)