THE EFFECT OF TAX INCENTIVES ON INVESTMENT DECISIONS
39
THE IMPACT OF TAX INCENTIVES ON THE INVESTMENT DECISIONS OF LARGE SCALE PRIVATE INDUSTRIES IN NAKAWA INDUSTRIAL AREA. A CASE STUDY OF SHUMUK INDUSTRIES LIMITED . GODFREY BIMANYWARUGABA 2015 A RESEARCH REPORT SUBMITTED TO THE DEPARTMENT OF ECONOMICS AND STATISTICS IN PARTIAL FULFILMENT OF THE REQUIREMENT FOR THE AWARD OF THE DEGREE OF BACHELOR OF ECONOMICS AND STATISTICS OF KYAMBOGO UNVERSITY. SEPTEMBER, 2013
-
Upload
independent -
Category
Documents
-
view
3 -
download
0
Transcript of THE EFFECT OF TAX INCENTIVES ON INVESTMENT DECISIONS

THE IMPACT OF TAX INCENTIVES ON THE INVESTMENT DECISIONS OF
LARGE SCALE PRIVATE INDUSTRIES IN NAKAWA INDUSTRIAL AREA.
A CASE STUDY OF SHUMUK INDUSTRIES LIMITED
.
GODFREY BIMANYWARUGABA
2015
A RESEARCH REPORT SUBMITTED TO THE DEPARTMENT OF ECONOMICS AND
STATISTICS IN PARTIAL FULFILMENT OF THE REQUIREMENT FOR THE AWARD
OF THE DEGREE OF BACHELOR OF ECONOMICS AND STATISTICS OF
KYAMBOGO UNVERSITY.
SEPTEMBER, 2013

ii
Table of contents
List of tables ....................................................................................................................................v
List of figures .................................................................................................................................vi
Abstract ........................................................................................................................................viii
CHAPTER ONE..............................................................................................................................1
INTRODUCTION...........................................................................................................................1
1.0 Background to the study ...................................................................................................... 1
1.1 Problem statement ............................................................................................................... 2
1.2 Objectives of the study ........................................................................................................ 3
1.2.1 General objective .......................................................................................................... 3
1.2.2 Specific objectives ........................................................................................................ 3
1.3 Research questions............................................................................................................... 3
1.4 Scope of the study.............................................................................................................. 4
1.5 Significance of the study ..................................................................................................... 4
1.6 Justification for the study.................................................................................................... 4
1.7 Operation definitions ........................................................................................................... 5
1.7.1 Tax incentives ............................................................................................................... 5
1.7.2 Large scale private industries........................................................................................ 5
1.7.3 Investment ..................................................................................................................... 5
CHAPTER TWO.............................................................................................................................6
LITERATURE REVIEW................................................................................................................6
2.0 Introduction.......................................................................................................................... 6
2.1 Types of tax incentives in large scale private organizations ............................................... 6
2.1.1 Tax holidays .................................................................................................................. 6
iii
2.1.2 Tax discounts ................................................................................................................ 6
2.1.3 Tax exemptions. ............................................................................................................ 7
2.2 Tax incentive contribution on human capital investment decisions.................................... 8
2.3 Tax incentive contribution on inventory capital investment decisions ............................... 8
2.4 Tax incentive contribution on gross investment levels........................................................ 9
CHAPTER THREE.......................................................................................................................10
METHODOLOGY........................................................................................................................10
3.0 Introduction........................................................................................................................ 10
3.1 Research Design ................................................................................................................ 10
3.2 Area and population of study............................................................................................. 10
3.3 Sample selection ................................................................................................................ 10
3.4 Data types and sources....................................................................................................... 11
3.5 Data collection methods .................................................................................................... 11
3.5.1 Use of interviews ........................................................................................................ 11
3.5.2 Observation ................................................................................................................. 11
3.6 Data analysis...................................................................................................................... 11
3.7 Limitations to the study. .................................................................................................... 12
CHAPTER FOUR .........................................................................................................................13
PRESENTATION AND DISCUSSION OF FINDINGS .............................................................13
4.0 Introduction........................................................................................................................ 13
4.1 Background characteristics of the respondents.................................................................. 13
4.2 Various tax incentives enjoyed by Shumuk....................................................................... 17
4.3 Impact of tax incentives on Human capital investment decision ...................................... 18
4.4 Impact of tax incentives on inventory investment decision............................................... 20
4.5 Impact of tax incentives on Gross investment decision..................................................... 21

iv
CHAPTER FIVE...........................................................................................................................24
SUMMARY OF RESULTS, CONCLUSION AND RECOMMENDATIONS...........................24
5.0 Introduction........................................................................................................................ 24
5.1 Summary of results ............................................................................................................ 24
5.1.1 Various tax incentives ................................................................................................. 24
5.1.2 Tax incentives and human capital investment decision. ............................................. 24
5.1.4 Tax incentives and inventory investment decision ..................................................... 24
5.1.5 Tax incentives and gross investment decision. ........................................................... 24
5.2 Conclusion ......................................................................................................................... 25
5.3 Recommendations.............................................................................................................. 26
REFERENCES..............................................................................................................................27
Appendix A: Questionnaire...........................................................................................................28
v
List of tables
Table 4.3.1: Recruitment rate and tax incentives ........................................................................ 18
Table 4.3.2: Rate of training workers and tax incentives ............................................................ 18
Table 4.3.3: Rate of productivity of workers and tax incentives ................................................ 19
Table 4.3.4: Current state of Welfare of workers and tax incentives .......................................... 19
Table 4.4.1: Production capacity of the industry and tax incentives........................................... 20
Table 4.4.2: Purchasing level of inputs and tax incentives. ........................................................ 20
Table 4.4.3: Inventory level and tax incentives........................................................................... 21
Table 4.5.1: Rate of finance distribution to departments and tax incentives. ............................. 21
Table 4.5.2: Salary payment rate and tax incentives. .................................................................. 22
Table 4.5.3: Rate of auditing financial books and tax incentives................................................ 22
Table 4.5.4: Ratio of output to GDP and tax incentives.............................................................. 23

vi
List of figures
Figure 4.1.1: Gender distribution of the respondents .................................................................. 13
Figure 4.1.2: Age distribution of the respondents ....................................................................... 14
Figure 4.1.3: Distribution of the respondents by marital status .................................................. 14
Figure 4.1.4: Distribution of respondents by highest education level attained ........................... 15
Figure 4.1.5: Distribution of respondents by period worked in company................................... 16
Figure 4.2.1: Tax incentives given to the industry ...................................................................... 17

vii
List of abbreviations
CIT Corporate Income Tax
EPRC Economic Policy Research Centre
FDI Foreign Direct Investment
GDP Gross Domestic Product
IMF International Monetary Fund
OECD Organisation for Economic Co-operation and Development
UNCTAD United Nations Conference on Trade and Development
URA Uganda Revenue Authority
VAT Value Added Tax

viii
Abstract
A tax incentive is a deduction, exclusion or exemption from a tax liability, offered as an
enticement to engage in a specified activity such as investment in capital goods for a certain
period. In Uganda, a number of tax incentives are given to investors both foreign and local so as
to encourage investment in an effort to create jobs and enhance economic growth. The study
was carried out to assess the impact of tax incentives on the investment decisions of large scale
private manufacturing industries in Nakawa industrial area.
The objectives of the study were to identify the various tax incentives offered to Shumuk
industries in Nakawa industrial area, to assess the tax incentive contribution on human capital
investment decisions of Shumuk industries in Nakawa industrial area, to assess the tax incentive
contribution on inventory capital investment decisions of Shumuk industries in Nakawa
industrial area and to assess the tax incentive contribution on gross investment levels of Shumuk
industries in Nakawa industrial area.
Primary data was collected using an interview guide and observation methods from a sample of
50 employees in the different departments at Shumuk selected using cluster and simple random
sampling techniques. Data analysis was done in SPSS to generate descriptive statistics
describing the variables of interest.
The findings of the study reveal that Shumuk receives tax incentives in form of withholding, tax
discounts and tax exemptions. These tax incentives have no significant impact on the
investment decisions at Shumuk industries as regards human capital investment, inventory
investment and gross investment. The other factors that influence investment decision are the
Bank lending rates, tax levels in the economy and the availability of raw materials.
According to the findings of the study, recommendations were made as follows: Government
should also advocate for reduced commercial bank lending rates to investors so as to encourage
more investments and The government of Uganda should give more tax incentives to both the
new and already existing investors through giving tax holidays, tax exemptions and tax
discounts so as to encourage investment in the country.

1
CHAPTER ONE
INTRODUCTION
This section presents the background to the study, statement of the problem, objectives of the
study, the scope of the study, justification of the study and significance of the study.
1.0 Background to the study
A tax incentive is a deduction, exclusion or exemption from a tax liability, offered as an
enticement to engage in a specified activity such as investment in capital goods for a certain
period (Feibel, 2012).
A multiplicity of tax incentives exist including; tax holidays, reduction on CIT (corporate
income tax) rate for certain sectors, exemption of CIT(corporate income tax) for export
companies, accelerated capital (investment) allowances; Buildings facilitates investment in
new equipment and machinery Could result in excessive investment (e.g. unutilized buildings);
Plant and machinery, investment tax credits, location based incentives, reduced taxes on
dividends tax-shifting and interests paid abroad, preferential treatment of long term, deductions
for qualifying; expenses transfer of technology if considered with other measures major capital
gains including; training expenses, export marketing expenses, exemptions from indirect taxes
(VAT, import tariffs), Export processing zones (OECD, 2001), (United Nations, 2000),
(Fletcher, 2002).
Every country strives for private investors. They create jobs, increase production and exports
and pay taxes. However, (Walubiri, 2012) notes that the investment climate in Uganda
currently has become very competitive in that investors not waived from or some whose tax
components have not been reduced face high competition. In line with the above, (Manson,
2011) observes that from meat packers and cement makers to banks and hotels, Uganda
exempts more than 1,200 businesses from certain taxes. The various large scale private
industries in various parts of Kampala (Nakawa inclusive) including; Picfare Industries
Limited, Quality Chemicals, Roofing's Rolling Mills, Bidco Uganda Limited, Sameer
Agriculture and Livestock, Southern Range Nyanza Ltd and Shumuk Industries limited are
beneficiaries of tax incentives (Walubiri, 2012).
There is a continuous increment in the Foreign Direct Investments (Private Investments) in
Kampala which are mostly concentrated in Nakawa division despite the relatively few
incentives offered to the private large scale investors. As (UNCTAD, 2011) further notes, the
following figures showing FDI including their years were observed; 644 US$ million in

2
2006, 792 US$ million in 2007, 729 US$ million in 2008, 816 US$ million in 2009 and 848
US$ million in 2010. This shows that tax incentives have had more less no effect on the gross
investments more so decision making pertaining investment of large private industries. The
high investments were mainly attributed to the precious market, urbanization,
industrialization and political stability to mention but a few but not tax incentives. This is
further avowed by (Walubiri, 2012) which while quoting a World Bank report asserts that
over 92% of investors in Uganda currently enjoying tax incentives can invest their capital
even without these incentives. And as a result, the report notes that Uganda lost
approximately 2% of its GDP in potential tax revenue amounting to US$ 272m in financial
year 2009/10.
With vast tax incentive arrangements that have come under the spotlight, IMF calls for
Uganda to eliminate tax exemptions in its latest report at the end of June. In Uganda’s budget
2010/2011, it was shown that tax exemptions on hoes, kerosene sugar excise duty were
granted to some of the agricultural, petroleum and sugar large scale private industries in
Kampala (Nakawa) inclusive. Despite these incentives, pump prices were still high, however,
and headline inflation stood at 15.8 percent in that year to June. “The exemptions list is too
huge: to raise tax the single most important thing they can do is to reduce exemptions,” said
Governor Mutebile Tumusime. The high inflation was a discouraging factor to the investing
ability of any private large scale investor, in other words, IMF to some extent attributed the
deteriorated economic environment of Uganda to the many existing tax incentives, that tax
incentives had done more harm than good, including the reduction of investment (Manson,
2011). The study seeks to examine the impacts of tax incentives on the investment decisions
of large scale private industries in Nakawa.
1.1 Problem statement
Tax incentives are a very effective tool of attracting private investors. (Feibel, 2012)
observes that tax exemptions and incentives are given to about 300, mostly elite and well-
funded private investors in Nakawa division. As observed by (Byensi, 2011), most of the
large scale private industries in Uganda more so in Kampala (especially Nakawa) today
have in one way or the other benefited from tax incentives. They give them enough time to
get used to the economy and later start paying taxes. To be more specific, amidst the various
private industries in Nakawa division in Kampala, it has been observed by different scholars
including; (Manson, 2011)); (Mwesigwa, 2012); (Walubiri, 2012) and (Mayende, 2012) that
tax incentives like tax holidays, exemptions and discounts granted to some of these large

3
scale private industries have reduced their gross investment, human capital investment (used
more machines than labor and increased their inventory investment. (IMF, 2012) together
with (Feibel, 2012) conclusively note that tax incentives are one of the least important
impact ants in the investment decisions of large scale private industries in Nakawa. These
two argue that tax incentives have promoted harmful tax competition among the private
industries in the division. Most private industries in Nakawa industrial area Shumuk
industries inclusive can’t ascertain the impact of most tax incentives on their investments
since they are unfair, string attached in other words, they are not transparent to the extent that
some investors would prefer to invest without tax incentives. (Nandala, 2012) observes that
various tax incentives are given to the large scale private investors whose impact to not only
the country but also to investment decisions of private investors is anonymous. Thus the
study seeks to assess the impact of tax incentives on the investment decisions of large scale
private industries in Nakawa
1.2 Objectives of the study
1.2.1 General objective
The general objective of the study is to assess the impact of tax incentives on the investment
decisions of Shumuk industries in Nakawa industrial area.
1.2.2 Specific objectives
i. To identify the various tax incentives offered to Shumuk industries in Nakawa industrial
area.
ii. To assess the tax incentive contribution on human capital investment decisions of
Shumuk industries in Nakawa industrial area.
iii. To assess the tax incentive contribution on inventory capital investment decisions of
Shumuk industries in Nakawa industrial area.
iv. To assess the tax incentive contribution on gross investment levels of Shumuk industries
in Nakawa industrial area.
1.3 Research questions.
i. What are the various tax incentives offered to Shumuk industries in Nakawa industrial
area?
ii. What is the tax incentive contribution on human capital investment decisions of Shumuk
industries in Nakawa industrial area?

4
iii. What is the tax incentive contribution on inventory capital investment decisions of
Shumuk industries in Nakawa industrial area?
iv. What is the tax incentive contribution on gross investment levels of Shumuk industries in
Nakawa industrial area?
1.4 Scope of the study
The research design was conducted with the main interest of the private large scale investors
of Shumuk Aluminium Industries. Shumuk Aluminium Industries Limited (SAIL) originated
from “SHUMUK ENTERPRISES” in 1984. It commenced its business with moderate trading
of commodities with a retail/wholesale outlet on South Street in Uganda in 1984. Shumuk
Aluminium industries limited is located on Plot 24 Mukabya Road, Nakawa industrial area in
Nakawa division.
The main focus of the research was limited to the impact of tax incentives on the investments
decisions of private large scale industries in Nakawa division, Kampala district.
1.5 Significance of the study
i. The study will provide information to the government of Uganda on some of the crucial
effects of tax incentives on investment decision making by private large scale investors
in Nakawa division and thus the study providing a base for them to easily formulate
policies that will be geared towards this either supplementing or removing these tax
incentives.
ii. To the private large scale industries, the study will flaunt the relevance of the tax
incentives in their investment decisions.
iii. The study will also contribute to a pool of knowledge and thus will provide literature
that will cover the existing gaps thus new reference material for use by academicians
and other researchers.
1.6 Justification for the study
The Ugandan government has done a lot of attempts to spur the private investments in
Kampala, more so Nakawa division including provision of tax incentives. Most of the large
scale private investors were lagging to craft investment decisions in Nakawa due to the high
taxes, so the government established tax incentives. A lot of funds of the government have
been lost through the provision of these incentives which funds would have been used
elsewhere to impact the lives of the poor. This sets a baseline for the researcher to ascertain

5
whether the tax incentives have influenced the investment decisions of large scale private
investors in Nakawa.
1.7 Operation definitions
1.7.1 Tax incentives
A tax incentive is a deduction, exclusion or exemption from a tax liability, offered as an
enticement to engage in a specified activity such as investment in capital goods for a certain
period
1.7.2 Large scale private industries
These are large organisations established by private individuals to venture in various
productive activities with the aim of mainly gaining profits.
1.7.3 Investment
Investment is the amount purchased per unit time of goods which are not consumed but are to
be used for future production (i.e. capital).

6
CHAPTER TWO
LITERATURE REVIEW
2.0 Introduction
In this, a review of the related literature and details of the research about the topic of study
has been done; more literature will be analyzed on the various impacts of tax incentives on
the investment decisions in Shumuk industries specifically analyzing tax incentive
contribution to their human, inventory capital investment decisions and gross investment
levels.
2.1 Types of tax incentives in large scale private organizations
2.1.1 Tax holidays
According to the 1998 firm survey, one third of Ugandan firms in urban sites of Nakawa
were in a tax-loss position in 1997, that is, they never a tax holiday. The 1994 firm survey
among the private large scale industries in Kampala (Nakawa) inclusive suggested that one
strong source of a sense of unfairness in taxes were tax holidays. Although the structure of
tax incentives is changing, the unevenness of tax holidays continues. For example, the 1998
survey, which collected information for three years, found that roughly 35 percent of
respondents reported receiving corporate tax holidays in 1997, while 32 percent reported
receiving them in 1995. Import tax holidays were enjoyed by 16 percent of all firms in 1997
but only by 12 percent three years earlier. This situation is expected to change in the next few
years, given that tax holidays were repealed in 1997. Consistent with the new policy, firms
reported that their tax holidays will expire on average in the year 2000. Despite their
important role as policy instrument, tax holidays do not seem to explain either the probability
that a firm invests, or the level of investment of Ugandan firms in 1996-97. However, if the
practice is that tax-holiday firms do not file their income tax returns at all and hence manage
to claim for the full tax depreciation allowance after the tax holiday ends, then their real
effective tax burden can be much lower than predicted by the standard model (Duanjie Chen,
1999); (Ritva Reinikka, 1999).
2.1.2 Tax discounts
Uganda's tax base remains low and experts warn that this won't sustain the economic growth
that the country craves. Uganda Revenue Authority (URA) had always consistently failed to

7
beat monthly tax collection targets. The tax body collected Shs 474.44bn against a target of
shs 473.08bn in February, 2012, registering a surplus of Shs 1.36bn (Mwesigwa, 2012).
However, as Mwesigwa (2012) further averred, experts warned that these collections were
still low. During a budget consultative meeting held in Kampala recently, donors, who funded
about 25% of the national budget, delivered a joint statement expressing dissatisfaction with
the persistent weaknesses shown by the low domestic revenue mobilization from private
investors in Kampala more so Nakawa. Particularly, the donors cited the practice of granting
ad hoc tax discounts, which not only eroded the revenue base, but also undermined the
efficiency of these private industries.
It was thus from a study by Mwesigwa (2012) that various private industries in Nakawa that
dealt in hand hoes, solar equipment, home utensils, aluminum steels, parts and inputs for the
assembly of refrigerators and freezers, motor vehicles imported in respect to the
transportation of tourists, building materials as well as scholastic materials ,that is, Picfare,
Spear motors, Shumuk industries, Master Industries received huge tax discounts which
fostered their decision making and thus spurred their human capital investment including not
only job training but also provision of free on-job training though this was not reflected in the
level of GDP. It was established by (Mwesigwa, 2012) that tax incentives had a moderate
impact on the level of human capital investment in Kampala (particularly Nakawa).
2.1.3 Tax exemptions.
A study that Uganda’s provision of tax incentives more so exemptions to large scale private
individuals in Kampala (Nakawa inclusive) was behind the colossal competition among the
various large scale private industries in the city. Analysis insinuated that the primary
beneficiaries of Uganda’s tax exemptions were large domestic firms and foreign
multinational companies found in the heart of Kampala city as well as Nakawa such as Spear
Motors and Shumuk industries (Mwesigwa, 2012).
From the regional study by Tax Justice Network, (2012) the tax exemptions on the side of the
large scale private investors created a larger regional market, and meant that firms located in
the neighbourhood of Nakawa division serviced this market. At the same time, however,
Government of Uganda was being tempted to increase tax incentives more so exemptions in
order to attract FDI and, they believed that this would cultivate decision making culture of
private individuals as pertains to investment and would thus increase output, spur inventories
of these private industries as well as their exports. Analysis however unveiled that the

8
provision of tax exemptions across the large scale private industries though fostered the
investment decision making culture through increased output and inventory investment , it
presented harmful tax competition, reduced exports and lead to a “race to the bottom” in the
city.
2.2 Tax incentive contribution on human capital investment decisions
Uganda's tax base remains low and experts warn that this won't sustain the economic growth
that the country craves. Uganda Revenue Authority (URA) had always consistently failed to
beat monthly tax collection targets. The tax body collected Shs 474.44bn against a target of
Shs 473.08bn in February, 2012, registering a surplus of Shs 1.36bn. However, experts warn
that these collections are still low. During a budget consultative meeting held in Kampala
recently, donors, who fund about 25% of the national budget, delivered a joint statement
expressing dissatisfaction with the persistent weaknesses shown by the low domestic revenue
mobilization from private investors in Kampala more so Nakawa. Particularly, the donors
cited the practice of granting ad hoc tax exemptions, which not only eroded the revenue base,
but also undermined the efficiency of these private organizations. From the study, on that
note, showed that various private organizations in Nakawa dealing in hand hoes, solar
equipment, parts and inputs for the assembly of refrigerators and freezers, and motor vehicles
imported in respect to the transportation of tourists, building materials as well as scholastic
materials like Picfare, spear motors, Shumuk industries, Master Industries that received tax
incentives, spurred their human capital investment including not only job training but also
provision of free on-job training though this was not reflected in the level of GDP. Further to
the above, (Alon Mweisgwa, 2012) conclusively inferred that tax incentives had a moderate
impact on the level of human capital investment in Kampala (particularly Nakawa).
2.3 Tax incentive contribution on inventory capital investment decisions
Uganda’s provision of tax incentives more so in Kampala (Nakawa inclusive) was part of the
tax competition among the various private organizations in the city. Analysis insinuated that
the primary beneficiaries of Uganda’s tax exemptions and incentives are large domestic firms
and foreign multinational companies found in the heart of Kampala city as well as Nakawa
such as Spear Motors and Shumuk industries (Mwesigwa, 2012).
From the regional study by Tax Justice Network, the tax incentives on the side of the private
investors created a larger regional market, and meant that firms located in the neighbourhood
of Nakawa division serviced this market. At the same time, however, Government of Uganda

9
was being tempted to increase tax incentives in order to attract FDI and, they believed that
this would, increase output, spur inventories of these private organizations as well as their
exports. Analysis suggested that the provision of tax incentives across the private
organizations though increased the output and inventory investment, presented harmful tax
competition, reduced exports and lead to a “race to the bottom” in the city.
2.4 Tax incentive contribution on gross investment levels
A major tax reform took place in Uganda in 1997. This reform included complete elimination
of new tax holidays in favor of a rate of 30 per cent on company income, with generous
capital allowances for all investors and unlimited loss-carry forward. A zero import duty was
also set on a wide range of capital goods. The elimination of selective incentives also greatly
simplified investment licensing. The main effects of this tax reform were (comparing
averages of three years before and after 1997): an increase of one percentage point in the ratio
of investment to GDP, 70 per cent increase in foreign investment inflows, and a one percent
of GDP increase in tax revenue (Ritva Reinikka, 1999). Every year Uganda sacrificed an
amount equal to nearly twice its entire health budget due to its use of tax incentives such as
tax holidays for foreign businesses. Worse still, research showed that these incentives were
not necessary to attract investments to Uganda since they didn’t not increase the gross
investment of the private organizations which was reflected by the GDP. Government needs
to remove excessive tax incentives, promote transparency on the tax incentives they give, and
coordinate with the East African Community to avoid harmful tax competition (Reinikka,
1999).

10
CHAPTER THREE
METHODOLOGY
3.0 Introduction
This section shows the design methods and techniques of collecting and analyzing data that
were used to achieve the stated objectives. These are; research design, design concepts,
sources of data collection, procedure of data collection, data quality control, data processing
and analysis.
3.1 Research Design
The researcher adopted a descriptive survey study design, where both qualitative and
quantitative descriptive data were used. The researcher’s study consisted of two variables of
interest, the dependent variable which is the investment decision and the independent variable
tax incentives.
3.2 Area and population of study
The study was carried out in Shumuk industries in Nakawa industrial area, Kampala district
in Central Uganda. The study targeted the executives and a few employees from different
departments of Shumuk industries. The executives were precisely those who mainly
participated in the day to day operation decisions Shumuk industries. At some instances,
views from the employees of these private industries were an added advantage as regards to
the accuracy of the data to be collected.
3.3 Sample selection
The researcher used cluster sampling technique. The researcher divided the study area that is,
Shumuk industries into clusters. Since in each cluster (department), there were study units all
having a different characteristic that is, people with different positions in the industry. So
from the sampling frame made of clusters, simple random sampling was done in each cluster
independently. The researcher therefore used cluster sampling as the probability sampling
technique together with a non-probability sampling technique (purposive technique) at some
point in the study, so as to get a sample of 50 respondents.

11
3.4 Data types and sources
The researcher collected data using primary sources.
Primary data was collected from consultations and discussions with executive personnel of
Shumuk industries in the Nakawa industrial area who mainly participated in the day to day
operation decisions of the industry. At some instances, views from the employees of Shumuk
industries were an added advantage as regards to the accuracy of the data that was collected.
This data was efficient in that it offered adequate information as it was centered on the live
events from the field through interviews and also because of the availability of respondents.
3.5 Data collection methods
The researcher employed the use of interviews and the observation method, as instruments
for data collection.
3.5.1 Use of interviews
The interviews were structured and the reliability of information gathered was of high
essence since similar questions were asked to the employers/shareholders/employees and it
gave in-depth information about particular cases of interest to the researcher. However, the
research was limited by the responses given because the respondents assumed that they are
under investigation hence being cautious.
3.5.2 Observation
Through the on field observation of the different categories of respondents, the data in
relation to the impacts of tax incentives to the investment decisions of Shumuk industries in
Nakawa was collected. Attributes such as gender, type of industries were also measured.
3.6 Data analysis
The design that was used to present data was a descriptive survey design and it is justified
because it describes an issue as it exists. The results are in digital form and they were
analyzed using a statistical package called SPSS.
In data analysis, the researcher organized and extracted meaning from the data collected. The
data from respondents were collected, recorded and discussed for the better choice of the
design specifications.
The process of data processing mainly constituted of two major processes and they included;
editing and tabulation;

12
Editing involved crosschecking for errors and omissions in the instruments in order to ensure
accuracy, uniformity and completeness. Here, the researcher ensured that each of the research
instruments is clear, logical and hence achievement of comprehensive responses.
Tabulation was the last stage of data processing where counting and adding of all answers to
particular questions was done for the whole study. It involved allocating individual answers
of individual respondents to particular questions under the guidance of appropriate codes.
Under tabulation, computer packages like EXCEL were used to handle the quantitative data
processing.
The process of data analysis entailed qualitative data analysis and quantitative data analysis.
Qualitative data analysis was applied on qualitative data which of course was not numerical.
This entailed analysis of contents of an interview so as to identify the main themes that
emerged from the responses that were given by the respondents. Codes were assigned to the
main themes and thereafter responses classified under the main themes and finally the themes
and responses were integrated in the report.
Otherwise, for quantitative data, the researcher did not use manual means since the
respondents are many, it would be straining. So the researcher analyzed using computer and
to be more specific, the researcher used SPSS.
3.7 Limitations to the study.
While carrying out the study, the researcher met the following problems.
i. Time limitation. The time allocated for conducting the research and analyzing findings
was not enough to win the deadlines. However the researcher critically did whatever was
possible so that she gave the most reliable and efficient data.
ii. Financial limitation. High research costs were incurred during the course of the research
investigations. However proper budgeting enabled proper executions and spending.
iii. Sudden power costs. Unpredicted load shedding hindered the study arrangements as per
the allocated time. However schedules of the power available were followed.
iv. Non-response errors. The researcher got some non-responses from some of the
respondents but solved this by replacing those who were not available.

13
CHAPTER FOUR
PRESENTATION AND DISCUSSION OF FINDINGS
4.0 Introduction
In this chapter, the results on background characteristics, various tax incentives, the impact of
tax incentives on human capital investment decision, the impact of tax incentives on
inventory investment decision, the impact of tax incentives on gross investment decision and
the general respondent personal views about the impact of tax incentives on investment
decision are presented.
4.1 Background characteristics of the respondents
Figure 4.1.1: Gender distribution of the respondents
Source: Primary data (2013)
According to figure 1, most of the respondents which is 62% (31) were males and 39% (19)
were females. This means that Shumuk employs male workers to a large extent because they
considered to be more energetic and hence guarantee greater productivity in terms of output.
The females are less preferred because they are thought to be less efficient and productive
because they are less energetic and have other responsibilities like looking after their
families.
14
Figure 4.1.2: Age distribution of the respondents
Source: Primary data (2013)
Findings of the study as shown in figure 4.1.2 revealed that the biggest proportion of the
respondents which is 30% (15) were aged between 41 and 50 years, 26% (13) were aged
between 31 and 40 years, 22% (11) were aged between 20 and 30 years and above 50 years
respectively. This means that majority of the employees in Shumuk (about 78%) were above
the age of 30 years implying that they are mature enough to understand the investment
decisions of the industry in relation to the tax incentives provided and their implications.
Those below the age of 30 years are few because they are usually considered not be mature
enough for the work environment and usually do not have the required experience.
Figure 4.1.3: Distribution of the respondents by marital status
Source: Primary data (2013)
15
As indicated in figure 4.1.3, the biggest proportion of the respondents were married making
54% (27), 16% (8) were widowed and single respectively and 14% (7) were divorced. This
implies that Shumuk mostly employs people who have ever been married because they are
considered to be very responsible people at work and more devoted to work since they have
family responsibilities back at home. The single employees are very few because they are
considered to be negligent and do not take work very seriously since they do not have family
responsibilities.
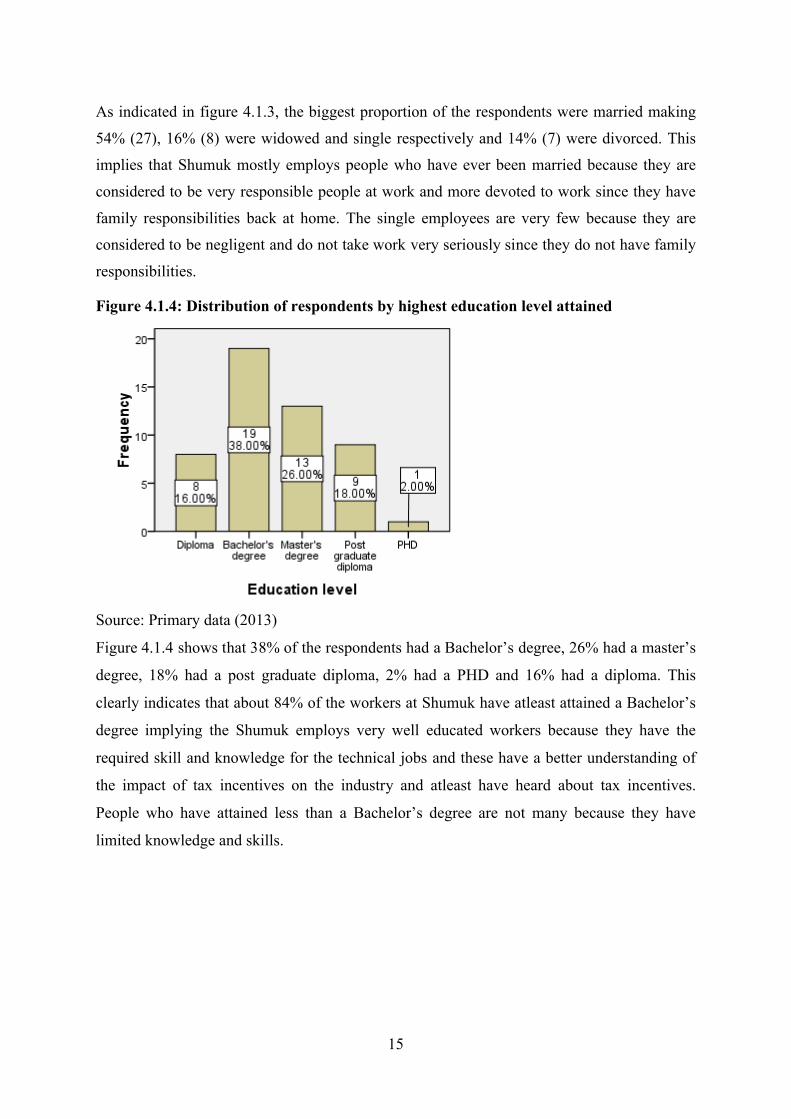
Figure 4.1.4: Distribution of respondents by highest education level attained
Source: Primary data (2013)
Figure 4.1.4 shows that 38% of the respondents had a Bachelor’s degree, 26% had a master’s
degree, 18% had a post graduate diploma, 2% had a PHD and 16% had a diploma. This
clearly indicates that about 84% of the workers at Shumuk have atleast attained a Bachelor’s
degree implying the Shumuk employs very well educated workers because they have the
required skill and knowledge for the technical jobs and these have a better understanding of
the impact of tax incentives on the industry and atleast have heard about tax incentives.
People who have attained less than a Bachelor’s degree are not many because they have
limited knowledge and skills.

16
Figure 4.1.5: Distribution of respondents by period worked in company
Source: Primary data (2013)
The findings of the study in figure 5 show that majority of the respondents which is 60% (30)
had been in the company for over five years, 26% had been in the company for 3-4 years,
10% had been in the company for 2-3 years and 2 % had been in the company for 6 months-
1year and less than 6 months respectively. This implies that majority of the respondents
(about 86%) have been in the company for over 3 years meaning that they were well
experienced and atleast had good information about the company and the effects of tax
incentives on investment decisions in the company. The remaining 14% had been in the
company for less than three years had therefore knew little about the company and the effect
of tax incentives.

17
4.2 Various tax incentives enjoyed by Shumuk
Figure 4.2.1: Tax incentives given to the industry
Source: Primary data (2013)
The findings in figure 4.2.1 show that 34% (17) of the respondents said the company is given
withholding, 30% (15) said the company received tax discounts, 18% (9) said the company
received tax exemptions, 16% (8) said the company received tax holidays and 2% (1) said the
company received tax deferments. This means that Shumuk is receiving mostly withholding
and tax discount incentives therefore pays less taxes which helps it to save and invest the
other part that would be paid in taxes. The findings are in agreement with the findings by
Mwesigwa (2012) where various industries in Nakawa including Shumuk were receiving tax
discounts. The other tax incentives given to Shumuk are tax holidays and tax exemptions
which agrees to the findings by Mwesigwa (2012). Chen (1999) also noted that tax holidays
were being given to large scale private companies in Kampala, Nakawa division inclusive.

18
4.3 Impact of tax incentives on Human capital investment decision
Table 4.3.1: Recruitment rate and tax incentives
Value
Degrees of
freedom
Asymp. Sig. (2-
sided)
Pearson Chi-Square 8.008a 12 .784
Likelihood Ratio 9.645 12 .647
Linear-by-Linear Association .400 1 .527
N of Valid Cases 17
Source: Primary data (2013)
According to table 4.3.1, at the 5% level of significance, there is no significant relationship
between the tax incentives given to the industry and the rate of recruitment of workers at
Shumuk industries at 2 (12) = 8.01, p = 0.784. This implies that the tax incentives given to
Shumuk industries are not playing a significant role in influencing the recruitment of workers
Table 4.3.2: Rate of training workers and tax incentives
Value
Degrees of
freedom
Asymp. Sig. (2-
sided)
Pearson Chi-Square 11.931a 12 .451
Likelihood Ratio 12.592 12 .399
Linear-by-Linear Association .176 1 .675
N of Valid Cases 17
Source: Primary data (2013)
The chi-square value 2 (12) = 11.93, p = 0.451 in table 4.3.2 shows that there is no
significant relationship between the tax incentives given to the industry and the rate of
training of workers at the 5% level of significance. This means that the various tax incentives
given to Shumuk industries have got no influence on the rate at which the workers are being
trained in the industry.

19
Table 4.3.3: Rate of productivity of workers and tax incentives
Value
Degrees of
freedom
Asymp. Sig. (2-
sided)
Pearson Chi-Square 16.843a 12 .156
Likelihood Ratio 19.828 12 .070
Linear-by-Linear Association 1.709 1 .191
N of Valid Cases 17
Source: Primary data (2013)
The findings in table 4.3.3 show that with a chi-square value 2 (12) = 16.84, p = 0.156, there
is no significant relationship between tax incentives given to the industry and the rate of
productivity of workers in the industry at the 5% level of significance. This shows that the tax
incentives given to Shumuk industries do not have any significant impact on the productivity
of workers.
Table 4.3.4: Current state of Welfare of workers and tax incentives
Value
Degrees of
freedom
Asymp. Sig. (2-
sided)
Pearson Chi-Square 10.327a 12 .587
Likelihood Ratio 10.267 12 .593
Linear-by-Linear Association .189 1 .664
N of Valid Cases 17
Source: Primary data (2013)
According to table 4.3.4, the value of the chi-square 2 (12) = 10.33, p = 0.587, indicates that
at the 5% level of significance, there is no significant relationship between the tax incentives
given to the industry and the state of welfare of workers in the industry. This means that the
tax incentives given to Shumuk industries do not play any role in influencing the state of
welfare of workers at the industry.
The findings are in agreement with a study by Joyce (2002) found out that tax incentives have
a statistically significant positive effects on human capital investment especially rate and
growth employment growth through affecting labour market participation decisions. However a
study by Leuven and Oosterbeek, (2004) found that a former Dutch tax incentive aimed at stimulated
training of workers over the age of 40 resulted in the postponement of training but did not increase
total training investments. Chen et al., (2002) also found out that fiscal incentives and preferential
20
tax treatment to large private companies create a large number of jobs and enhance the level
of entrepreneurship, which implies flexibility, speed, risk-taking and innovation.
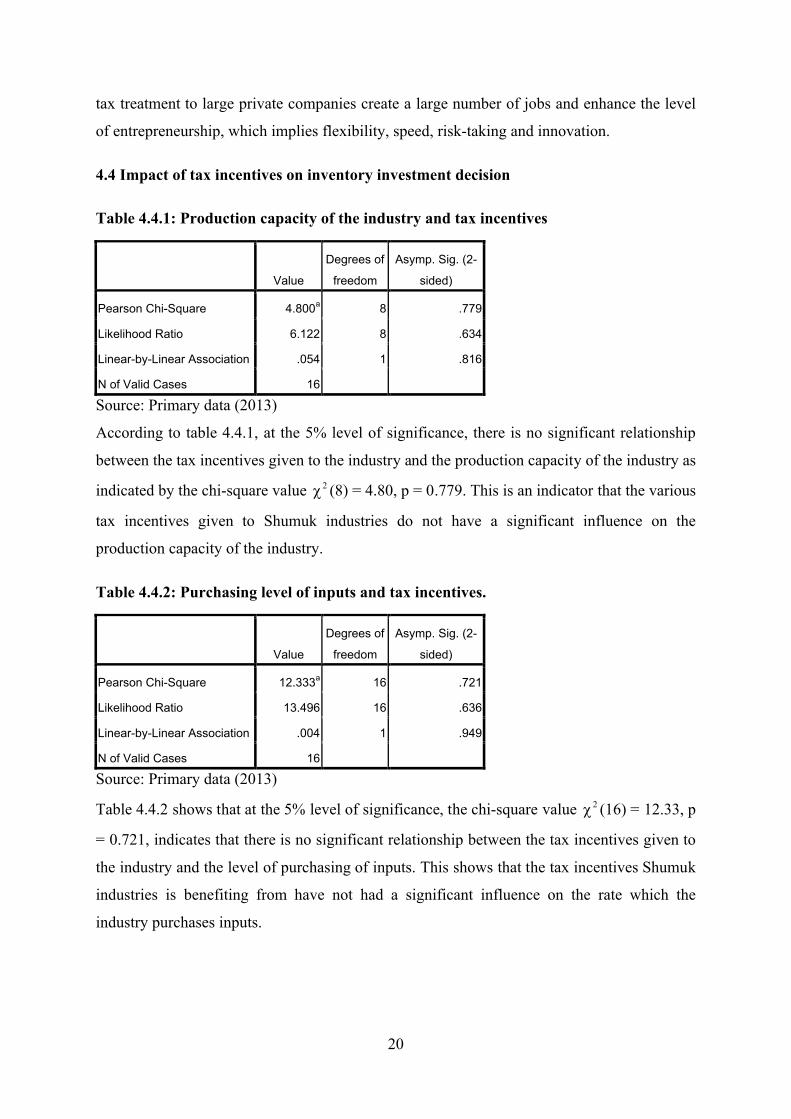
4.4 Impact of tax incentives on inventory investment decision
Table 4.4.1: Production capacity of the industry and tax incentives
Value
Degrees of
freedom
Asymp. Sig. (2-
sided)
Pearson Chi-Square 4.800a 8 .779
Likelihood Ratio 6.122 8 .634
Linear-by-Linear Association .054 1 .816
N of Valid Cases 16
Source: Primary data (2013)
According to table 4.4.1, at the 5% level of significance, there is no significant relationship
between the tax incentives given to the industry and the production capacity of the industry as
indicated by the chi-square value 2 (8) = 4.80, p = 0.779. This is an indicator that the various
tax incentives given to Shumuk industries do not have a significant influence on the
production capacity of the industry.
Table 4.4.2: Purchasing level of inputs and tax incentives.
Value
Degrees of
freedom
Asymp. Sig. (2-
sided)
Pearson Chi-Square 12.333a 16 .721
Likelihood Ratio 13.496 16 .636
Linear-by-Linear Association .004 1 .949
N of Valid Cases 16
Source: Primary data (2013)
Table 4.4.2 shows that at the 5% level of significance, the chi-square value 2 (16) = 12.33, p
= 0.721, indicates that there is no significant relationship between the tax incentives given to
the industry and the level of purchasing of inputs. This shows that the tax incentives Shumuk
industries is benefiting from have not had a significant influence on the rate which the
industry purchases inputs.

21
Table 4.4.3: Inventory level and tax incentives
Value
Degrees of
freedom
Asymp. Sig. (2-
sided)
Pearson Chi-Square 12.644 12 .395
Likelihood Ratio 14.717 12 .257
Linear-by-Linear Association .993 1 .319
N of Valid Cases 16
Source: Primary data (2013)
According to table 4.4.3, the chi-square value 2 (12) = 12.64, p = 0.395, indicates that at the
5% level of significance there is no significant relationship between the tax incentives
enjoyed by the industry and the inventory level of the industry an indicator that the tax
incentives do not have a significant impact on the level of inventory at Shumuk industries.
The findings agree with the findings by and Pirnia (2001) who noted that in Europe when
firms are given tax incentives, they save large sums of money which they use to purchase
more inputs and expand their scale of production. A similar study in India by OECD (2001)
noted that when tax incentives are given to manufacturing companies, they stock large
amounts of raw material to use over a long period of time.
4.5 Impact of tax incentives on Gross investment decision
Table 4.5.1: Rate of finance distribution to departments and tax incentives.
Value
Degrees of
freedom
Asymp. Sig. (2-
sided)
Pearson Chi-Square 7.782 12 .802
Likelihood Ratio 9.172 12 .688
Linear-by-Linear Association .231 1 .630
N of Valid Cases 17
Source: Primary data (2013)
According to table 4.5.1, the findings of the study show that there is no significant
relationship between the tax incentives given to Shumuk industries and the rate of financial
distribution to the departments at Shumuk at the 5% level of significance basing on the chi-
square value 2 (12) = 7.78, p = 0.802. This implies that the tax incentives from which

22
Shumuk industries benefits do not play any significant role in decisions involving the
distribution of finances to the different departments.
Table 4.5.2: Salary payment rate and tax incentives.
Value
Degrees of
freedom
Asymp. Sig. (2-
sided)
Pearson Chi-Square 22.029a 12 .037
Likelihood Ratio 12.991 12 .370
Linear-by-Linear Association 2.196 1 .138
N of Valid Cases 17
Source: Primary data (2013)
The chi-square value 2 (12) = 22.03, p = 0.037 in table 4.5.2 shows that there is a significant
relationship between the tax incentives given to Shumuk industries and the salary payment
rate in Shumuk industries at the 5% level of significance. This means that the benefits from
the tax incentives given to Shumuk industries are having an influence on the rate at which
workers at Shumuk are paid.
Table 4.5.3: Rate of auditing financial books and tax incentives
Value
Degrees of
freedom
Asymp. Sig. (2-
sided)
Pearson Chi-Square 11.657a 12 .474
Likelihood Ratio 10.160 12 .602
Linear-by-Linear Association .393 1 .531
N of Valid Cases 17
Source: Primary data (2013)
Table 4.5.3 shows that basing on the chi-square value 2 (12) = 11.66, p = 0.474, at the 5%
level of significance, there is no significant relationship between the tax incentives given to
Shumuk industries and the rate at which financial books are audited. This implies that the tax
incentives given to Shumuk industries have no significant impact on the rate at which
financial books are audited.

23
Table 4.5.4: Ratio of output to GDP and tax incentives.
Value
Degrees of
freedom
Asymp. Sig. (2-
sided)
Pearson Chi-Square 13.331 12 .345
Likelihood Ratio 13.049 12 .365
Linear-by-Linear Association .537 1 .464
N of Valid Cases 17
Source: Primary data (2013)
According to table 4.5.4, the chi-square value 2 (12) = 13.33, p = 0.345, shows that there is
no significant relationship between the tax incentives given to the industry and the ratio of
out of the industry to GDP at the 5% level of significance. This means that the tax incentives
enjoyed by Shumuk industries does not have any significant impact on the ratio of the output
of the industry to the GDP of the country.
In line with these findings are the findings by Nathan, (2004) who found out that tax
incentives clearly enhance returns on investment; they may be justified by positive
externalities stemming from investments; they are relatively easy to target and fine tune; they
signal openness to private investment; they are useful in a world of capital mobility; they are
necessary for responding to tax competition from other jurisdictions; and they compensate for
other deficiencies in the investment climate. Wells, (1986) also found that tax incentives
given to large companies enable these companies to expand their investments thus increasing
output. He also found that multination corporations decide to invest in foreign countries by
comparing the tax incentives across nations.
24
CHAPTER FIVE
SUMMARY OF RESULTS, CONCLUSION AND RECOMMENDATIONS
5.0 Introduction
In this chapter the summary of results as regards the various tax incentives, the effect of tax
incentives on the investment decisions of the industry and the conclusions and
recommendations made are presented.
5.1 Summary of results
5.1.1 Various tax incentives
All the respondents in the study had heard about tax incentives which included tax holidays,
tax exemptions, tax discounts and withholding tax. All respondents said the industry was a
beneficiary of tax incentives benefiting majorly from withholding tax and tax discounts.
5.1.2 Tax incentives and human capital investment decision.
The study established that tax there is no significant relationship between the tax incentives
and the recruitment rate of employees ( 2 (12) = 8.01, p = 0.784), rate of training workers
( 2 (12) = 11.93, p = 0.451), productivity of workers ( 2 (12) = 16.84, p = 0.156) and the
state of welfare of the workers ( 2 (12) = 10.33, p = 0.587).
5.1.4 Tax incentives and inventory investment decision
The findings of the study show that there is no significant relationship between tax incentives
given to the industry and the production capacity of the industry ( 2 (8) = 4.80, p = 0.779),
purchasing level of inputs ( 2 (16) = 12.33, p = 0.721) and inventory level of the industry
( 2 (12) = 12.64, p = 0.395).
5.1.5 Tax incentives and gross investment decision.
There is a significant relationship between tax incentives and the salary payment rate to
workers ( 2 (12) = 22.03, p = 0.037), and there was no significant relationship between the
tax incentives and the rate of finance distribution to departments ( 2 (12) = 7.78, p = 0.802),
25
the rate at which financial books are audited ( 2 (12) = 11.66, p = 0.474) and the ratio of
output of the industry to national output ( 2 (12) = 13.33, p = 0.345).
5.2 Conclusion
According to the study, the following conclusions were made;
Tax incentives do not significantly affect the human capital investments of large scale private
industries since there is no significant relationship between the tax incentives given to
Shumuk industries and the components of human investment decisions.
Tax incentives do not significantly affect the inventory investment decisions of large scale
private industries since there is no relationship between the tax incentives given to the
industry and the different components of the inventory investment decisions.
Tax incentives affect the gross investment decision to a small extent since there was only a
significant relationship between the salary payment rate to workers and there was no
significant relationship between the tax incentives and the rate of finance distribution to
departments, the rate at which financial books are audited and the ratio of output of the
industry to national output.
Generally, tax incentives do not significantly affect the investment decisions of large scale
private scale industries in Nakawa.

26
5.3 Recommendations.
Basing on the findings of the study, the following recommendations were made;
i. The private large scale industries should also use the benefits of tax holidays to
benefit the economy through re-investing the savings and expanding businesses and
expanding their scales of production to enhance economic growth and development.
ii. Large scale private industries should try to inform their employees of the benefits of
tax incentives through meetings and involving them in decision making so that they
are aware of the benefits because in this study most of them were undecided about
some issues implying they were not sure.
iii. Government should also advocate for reduced commercial bank lending rates to
investors so as to encourage more investments. This could be achieved throught he
central bank reducing the interbank lending rates that result in reduced lending rates
to the public.
27
REFERENCES
"http://www.taxjusticeafrica.net/sites/all/themes/simple_custom/favicon.ico"
Chen, D., F. C. Lee and J. Mintz (2002), Taxation, SMEs and Entrepreneuship, STI Working
Paper 2002/9, OECD, Paris.
Duanjie Chen & Ritva Reinikka (1999) “Business Taxation in a Low-Revenue Economy: A
Study on Uganda in Comparison With Neighbouring Countries” Africa Region Working
Paper June Series No. 3
Gujarati, (2004). Basic Econometrics, 4th edition, The McGraw−Hill Companies.
IMF (2012) “Uganda’s Macroeconomic Outlook in Global Perspective June” Budget 2012/13
Vol 1. No. 1 pp27.
Manson, 2011 “IMF criticises Uganda’s extensive tax breaks” The Financial Times Limited
press.
Mayende Stephen, (2012) “Effects of tax incentives on firms and tax efforts in Uganda” pdf
statistical abstract.
Mweisgwa Alon, (2012) “Experts warn against tax incentives”: Business- The Observer
Tuesday, 03 April 2012
Nandala Mafabi, (2012) “A race to the bottom? Tax Incentives” Kampala blog- Action aid
OECD (2001), “Corporate Tax Incentives for Foreign Direct Investment ”; OECD Tax Policy
Studies No. 4.
OECD (2007) “Tax Incentives for Investment – A Global Perspective: experiences in MENA
and non-MENA countries” Draft Version June 2007
Rajul Awasthi, (2012) “How effective is the tax incentive regime in Uganda”: Business- The
Observer- Tuesday, 03 July 2012
Tax Justice Network - Africa, (2012). “Country Tax Reports”
Tax Justice Network-Africa & Action Aid International, (2012) “Tax competition in East
Africa: A race to the bottom?” Tax incentives and Revenue losses in Uganda- Action aid
Walubiri Moses, (2012) “MPs, Kasami Clash over Tax Incentives to Investors” The New
vision, 29th August 2012.
Wells L., (1986.) “Investment Incentives: An unnecessary Debate”, CTC Reporter, autumn,

28
Appendix A: Questionnaire
Dear respondent, Iam Ainembabazi Racheal a final year student of Bachelor of Economics
and Statistics. As part of the mentioned course, Iam carrying out an academic study assessing
the impact tax incentives on investment decisions on large scale private industries in Nakawa
industrial area with a case study of SHUMUK industries limited. For the same reason, all the
information provided will be strictly academic and will not be disclosed to any third party for
whatsoever reason. Please tick or fill in where necessary.
SECTION A: BIO DATA
1. Gender of the respondent. A. Male B. Female
2. Age of the respondent (in years).
A. Below 20 B. 20-30 C. 31-40 D. 41-50 E. Above 50
3. Marital status of the respondent.
A. Single B. Married C. Widowed D. Divorced
4. Highest level of education attained.
A. Diploma B. Bachelor’s degree C. Master’s degree
D. Post graduate diploma E. PHD F. Others specify………………………
5. How long have you worked in this company?
A. Less than 6 months B. 6months-1year C. 2-3 years B. D. 3-4years E. Above 5 years
SECTION B: VARIOUS TAX INCENTIVES
6. Have you ever heard about tax incentives? A. Yes B. No
7. Which tax incentives have you heard about?
A. Tax holidays B. Tax discounts C. Tax exemptions B. D. Other (specify)………………………………………..
8. Is this industry a beneficiary of tax incentives? A. Yes B. No
9. If yes which of the incentives above are given to the industry?
A. Tax holidays B. Tax discounts C. Tax exemptions D. Other (specify)………………………………………..

29
SECTION C: TAX INCENTIVE CONTRIBUTION ON HUMAN CAPITAL, INVENTORY AND GROSS INVESTIMENT DECISION
Instructions.
From questions 10-13, write the number that best indicates your opinion on the statements using the following scale.
scale 1 2 3 4 5Strongly agree(SA)
Agree(A) Undecided(UD) Disagree(D) Strongly disagree(SD)
Human capital investment decision. (To be directed to the human resource department)
Item no.
statement Opinion no.
10. Tax incentives are responsible for the current recruitment rate of the industry.
11. Tax incentives are responsible for the current rate of training workers in the industry.
12. Tax incentives are responsible for the current rate of productivity of workers in the industry.
13. Tax incentives are responsible for the current state of welfare of the employees in the industry.
14. In your own view, do you think tax incentives play a significant role in the investment decisions of private large scale manufacturing? A. Yes B. No
15. If yes, explain the role tax incentives play.
……………………………………………………………………………………………………………………………………………………………………………………………………
16. If not, why?
……………………………………………………………………………………………………………………………………………………………………………………………………
17. Whether yes or no, conclusively in your own view, what other than tax incentives affects investment decisions of private large scale manufacturing industries?
……………………………………………………………………………………………………………………………………………………………………………………………………
THANK YOU FOR YOUR COOPERATION
30
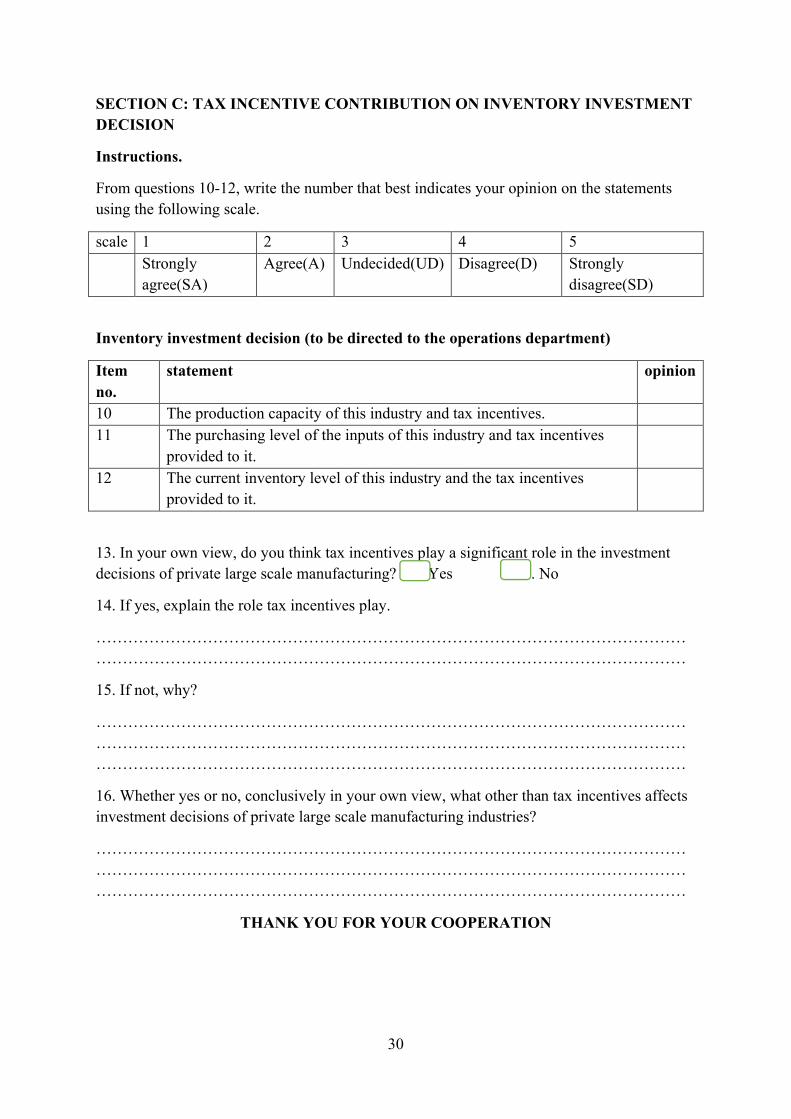
SECTION C: TAX INCENTIVE CONTRIBUTION ON INVENTORY INVESTMENT DECISION
Instructions.
From questions 10-12, write the number that best indicates your opinion on the statements using the following scale.
scale 1 2 3 4 5Strongly agree(SA)
Agree(A) Undecided(UD) Disagree(D) Strongly disagree(SD)
Inventory investment decision (to be directed to the operations department)
Item no.
statement opinion
10 The production capacity of this industry and tax incentives.11 The purchasing level of the inputs of this industry and tax incentives
provided to it.12 The current inventory level of this industry and the tax incentives
provided to it.
13. In your own view, do you think tax incentives play a significant role in the investment decisions of private large scale manufacturing? A. Yes B. No
14. If yes, explain the role tax incentives play.
……………………………………………………………………………………………………………………………………………………………………………………………………
15. If not, why?
………………………………………………………………………………………………………………………………………………………………………………………………………………………………………………………………………………………………………
16. Whether yes or no, conclusively in your own view, what other than tax incentives affects investment decisions of private large scale manufacturing industries?
………………………………………………………………………………………………………………………………………………………………………………………………………………………………………………………………………………………………………
THANK YOU FOR YOUR COOPERATION
31
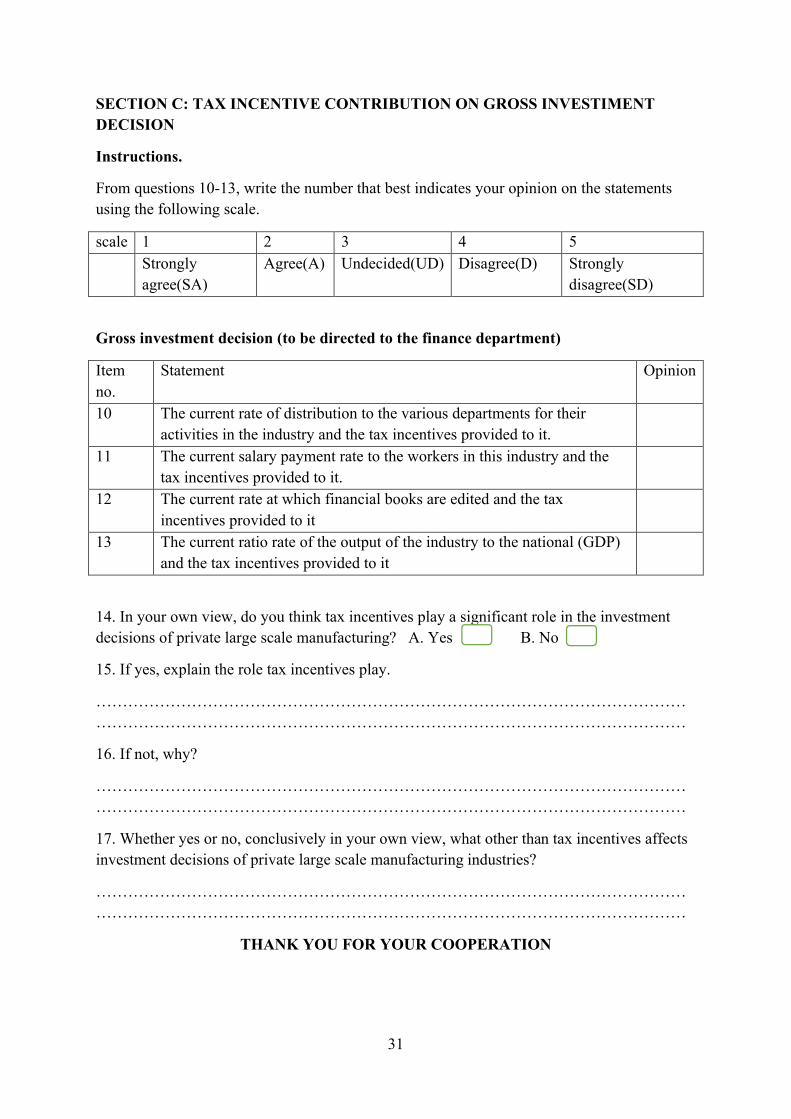
SECTION C: TAX INCENTIVE CONTRIBUTION ON GROSS INVESTIMENT DECISION
Instructions.
From questions 10-13, write the number that best indicates your opinion on the statements using the following scale.
scale 1 2 3 4 5Strongly agree(SA)
Agree(A) Undecided(UD) Disagree(D) Strongly disagree(SD)
Gross investment decision (to be directed to the finance department)
Item no.
Statement Opinion
10 The current rate of distribution to the various departments for their activities in the industry and the tax incentives provided to it.
11 The current salary payment rate to the workers in this industry and the tax incentives provided to it.
12 The current rate at which financial books are edited and the tax incentives provided to it
13 The current ratio rate of the output of the industry to the national (GDP) and the tax incentives provided to it
14. In your own view, do you think tax incentives play a significant role in the investment decisions of private large scale manufacturing? A. Yes B. No
15. If yes, explain the role tax incentives play.
……………………………………………………………………………………………………………………………………………………………………………………………………
16. If not, why?
……………………………………………………………………………………………………………………………………………………………………………………………………
17. Whether yes or no, conclusively in your own view, what other than tax incentives affects investment decisions of private large scale manufacturing industries?
……………………………………………………………………………………………………………………………………………………………………………………………………
THANK YOU FOR YOUR COOPERATION