
Tax incentives and direct support for R&D : what do firms use and why
30
TAX INCENTIVES AND DIRECT SUPPORT FOR R&D: WHAT DO FIRMS USE AND WHY? Isabel Busom (Universidad Autónoma de Barcelona) Beatriz Corchuelo (Universidad de Extremadura) Ester Martínez Ros (Universidad Carlos III de Madrid) Abstract (*) The measurement of the effects that public support to private R&D has on R&D investment and output has attracted substantial empirical research in the last decade. The focus of this research has mostly focused on testing for possible crowding out effects. There is virtually no study aiming at understanding how and why these effects may or may not be occurring. In addition, the effects of the two most common tools of public support, direct funding through grants and loans, and tax incentives, have been studied separately. We contribute to existing work by focusing on the determinants of the use by firms of these two mechanisms and their potential link to sources of market failures. We think this is an important step to assess impact estimates. Using firm-level data from the Spanish Community Innovation Survey (CIS), we find that firms that face financial constraints, as well as newly created firms, are less likely to use R&D tax credits and more likely to apply for and obtain direct public funding. We also find that large firms that care about knowledge protection are more likely to apply for and obtain direct funding, while SMEs are more likely to use tax incentives. Our results show that direct funding and tax credits, as currently designed, are not perfect substitutes because firms are heterogeneous, and suggest that from a social perspective, and provided that crowding out effects can be ruled out for both instruments, some combination of both may be preferable to relying on only one. Keywords: R&D subsidies, R&D tax credits, R&D, policy evaluation, CIS JEL Classification: H25, L60, O38, O31 (*) This work would not have ben possible without the support of several institutions: the Instituto de Estudios Fiscales (Busom and Corchuelo), Ministerio de Ciencia e Innovación (Martínez Ros, project ECO2009-08308 and Busom, project ECO2009-10003) and Junta de Extremadura (Corchuelo, project IB10013). The authors also thank COTEC, FECYT and INE for facilitating access to the data.
Transcript of Tax incentives and direct support for R&D : what do firms use and why
TAX INCENTIVES AND DIRECT SUPPORT FOR R&D: WHAT DO FIRMS
USE AND WHY?
Isabel Busom (Universidad Autónoma de Barcelona)
Beatriz Corchuelo (Universidad de Extremadura)
Ester Martínez Ros (Universidad Carlos III de Madrid)
Abstract (*)
The measurement of the effects that public support to private R&D has on R&D investment and output has attracted
substantial empirical research in the last decade. The focus of this research has mostly focused on testing for possible
crowding out effects. There is virtually no study aiming at understanding how and why these effects may or may not
be occurring. In addition, the effects of the two most common tools of public support, direct funding through grants
and loans, and tax incentives, have been studied separately.
We contribute to existing work by focusing on the determinants of the use by firms of these two mechanisms and
their potential link to sources of market failures. We think this is an important step to assess impact estimates. Using
firm-level data from the Spanish Community Innovation Survey (CIS), we find that firms that face financial
constraints, as well as newly created firms, are less likely to use R&D tax credits and more likely to apply for and
obtain direct public funding. We also find that large firms that care about knowledge protection are more likely to
apply for and obtain direct funding, while SMEs are more likely to use tax incentives. Our results show that direct
funding and tax credits, as currently designed, are not perfect substitutes because firms are heterogeneous, and
suggest that from a social perspective, and provided that crowding out effects can be ruled out for both instruments,
some combination of both may be preferable to relying on only one.
Keywords: R&D subsidies, R&D tax credits, R&D, policy evaluation, CIS
JEL Classification: H25, L60, O38, O31
(*) This work would not have ben possible without the support of several institutions: the Instituto de Estudios Fiscales (Busom and Corchuelo), Ministerio de Ciencia e Innovación (Martínez Ros, project ECO2009-08308 and Busom, project ECO2009-10003) and
Junta de Extremadura (Corchuelo, project IB10013). The authors also thank COTEC, FECYT and INE for facilitating access to the
data.
1
1. INTRODUCTION
Tax incentives and direct funding are two instruments currently used in many countries to
stimulate private R&D activity. Both belong to a broader package of measures addressed to
enhance private research and innovation activities that includes intellectual property rights,
public funding of basic research and public provision of venture capital. While direct public
funding of private R&D has a long tradition in many countries, tax incentives have spread
gradually, although with some exceptions. Canada, The Netherlands and Japan rely mostly on
tax incentives, while direct funding is still preferred Sweden, Finland or Germany. Other
countries combine both instruments France, Denmark, Spain and the United States fall in this
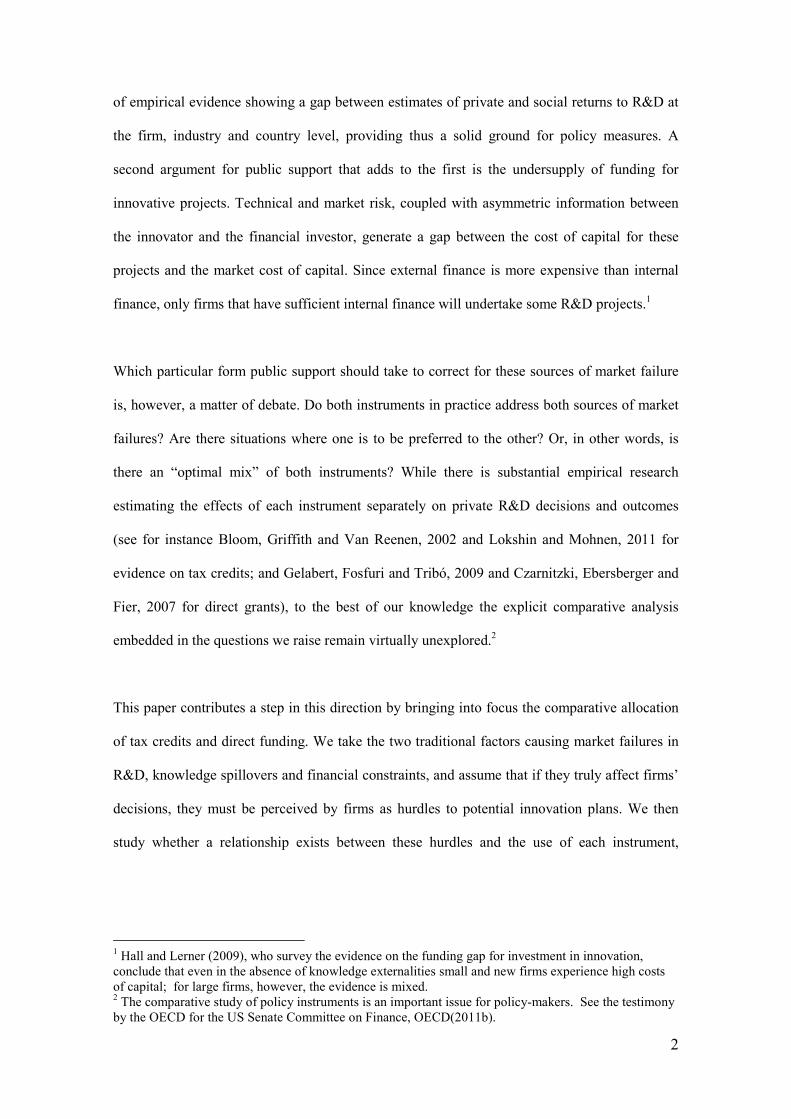
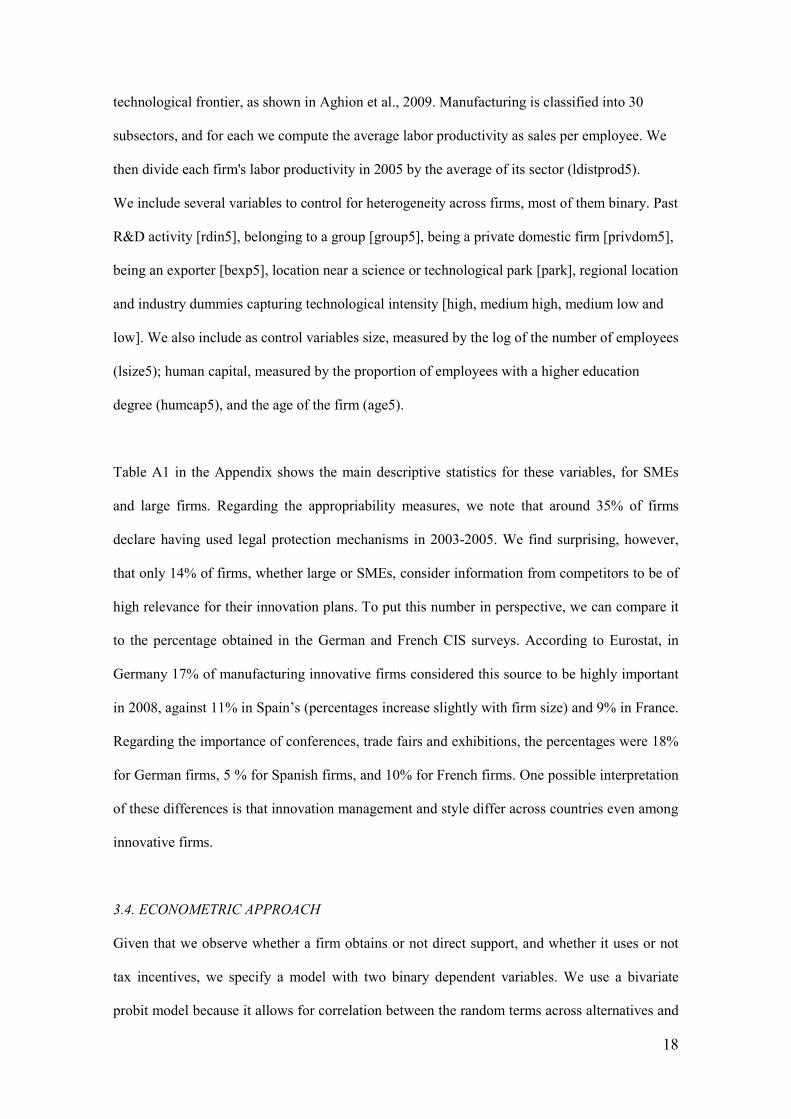
category. Figure 1, shows OECD estimates of the relative weight of each instrument as a share
of GDP in 2009 by country.
Figure 1: Direct funding and Tax Incentives for business R&D 2009 (in % of GDP)
Notes:
Direct funding includes grants, credits and public procurement. Indirect funding refers to all tax
incentives related to R&D: tax credits and allowances, social security contributions, reductions in R&D
labor taxes. Sub-national tax incentives are not included. Israel, Italy and Slovak Republic proved R&D
tax incentives but cost estimates are not available. For detailed information check the source.
Source: OCDE (2011a), OECD Science, Technology and Industry Scoreboard 2011
The common argument for the provision of public incentives to private R&D activities rests on
the positive spillovers associated to the production of knowledge. There is by now a large body
0,00
0,05
0,10
0,15
0,20
0,25
0,30
0,35
0,40 Direct government funding of BERD Indirect government support through R&D tax incentives
2
of empirical evidence showing a gap between estimates of private and social returns to R&D at
the firm, industry and country level, providing thus a solid ground for policy measures. A
second argument for public support that adds to the first is the undersupply of funding for
innovative projects. Technical and market risk, coupled with asymmetric information between
the innovator and the financial investor, generate a gap between the cost of capital for these
projects and the market cost of capital. Since external finance is more expensive than internal
finance, only firms that have sufficient internal finance will undertake some R&D projects.1
Which particular form public support should take to correct for these sources of market failure
is, however, a matter of debate. Do both instruments in practice address both sources of market
failures? Are there situations where one is to be preferred to the other? Or, in other words, is
there an “optimal mix” of both instruments? While there is substantial empirical research
estimating the effects of each instrument separately on private R&D decisions and outcomes
(see for instance Bloom, Griffith and Van Reenen, 2002 and Lokshin and Mohnen, 2011 for
evidence on tax credits; and Gelabert, Fosfuri and Tribó, 2009 and Czarnitzki, Ebersberger and
Fier, 2007 for direct grants), to the best of our knowledge the explicit comparative analysis
embedded in the questions we raise remain virtually unexplored.2
This paper contributes a step in this direction by bringing into focus the comparative allocation
of tax credits and direct funding. We take the two traditional factors causing market failures in
R&D, knowledge spillovers and financial constraints, and assume that if they truly affect firms’
decisions, they must be perceived by firms as hurdles to potential innovation plans. We then
study whether a relationship exists between these hurdles and the use of each instrument,
1 Hall and Lerner (2009), who survey the evidence on the funding gap for investment in innovation,
conclude that even in the absence of knowledge externalities small and new firms experience high costs
of capital; for large firms, however, the evidence is mixed. 2 The comparative study of policy instruments is an important issue for policy-makers. See the testimony
by the OECD for the US Senate Committee on Finance, OECD(2011b).

3
controlling for a set of factors. This step may provide insights for interpreting the range of
results that are obtained in impact evaluation studies.3
We use firm-level data from two waves of the Spanish Community Innovation Survey (CIS) to
study this question. We find that firms that face financial constraints to undertake innovation
projects, as well as newly created firms, are less likely to use R&D tax credits. SMEs that face
this type of constraint, however, are more likely to apply and obtain direct public funding.
Regarding appropriability concerns, large firms that care about protection are more likely to
apply for and obtain direct funding, while SMEs are more likely to use tax incentives. Our main
results are robust to changes in the definition of dependent variables and for most subsamples of
firms.
These results suggest that direct funding and tax credits are not perfect substitutes. Firms that
are financially constrained but have good innovation projects need support to be able to carry
them out and obtain profits before being able to claim tax credits. Firms that face small limited
appropriability difficulties may find tax incentives more appealing than direct support because
the cost of applying for direct funding may be high compared to the chances of obtaining it
when innovation is not very drastic. Provided that crowding out effects can be ruled out for both
instruments, some combination of both would be preferable from a social point of view to
relying on only one.
The paper is organized as follows: in the next section we review a selection of literature related
to our research questions. In section 3 we describe the data, variables and empirical model that
3 To illustrate this point: assume that from firm-level data we obtain that there is no additionality in
private R&D expenditure, and that the share of sales of new products is not significantly different from
non-supported firms. Should we conclude that the policy is not effective? The answer depends on whether
supported activities generate spillovers that are captured by the firms’competitors. Since spillovers are
one of the theoretical arguments for providing public support, allocation equations should capture this
concern to some extent.
4
will be used. In section 4 we show and discuss estimation results. Finally section 5 contains
concluding remarks.
2. PREVIOUS EVIDENCE AND SOME NEW PROPOSITIONS.
Many theoretically possible policy instruments to address market failures affecting R&D may
have drawbacks. Direct public funding through subsidies or grants reduces the private costs of
investing in R&D, but places high information requirements for the public agency awarding
them. Tax credits and allowances may appear to be a neutral, simple and non-interfering tool,
but the specific design is important, as they may be claimed for projects that the firm would
have been done anyway. Producing empirical evidence evaluating the impact of both on a set of
outcomes becomes very valuable for policy design and improvement. Over the last ten years, a
significant volume of empirical research to assess the impact of either direct support or of R&D
tax credits on the level of private R&D investment has been developed. The main concern of
most of this research has been testing for the presence of full crowding out effects, which would
imply a waste of public resources, but the impact on other outcomes such as patents,
productivity or sales of new products has also been analyzed.
With only a few exceptions (Haegeland and Moen, 2007, Berubé and Mohnen, 2009 and Marra,
2008), however, the effects of each tool have been studied separately.4 Tax incentives are
usually modelled as part of the user cost of capital in standard investment models, where the
estimated R&D price elasticity provides a measure of the impact of tax incentives. Bloom,
Griffith and Van Reenen (2002) used country-level data and found an elasticity of about 0.1 in
the short run and about 1 in the long run. Firm level studies have followed since, and some cast
4 Haegeland and Moen (2007) find that the additionality of tax credits is higher than the additionality of
grants awarded through the Research Council and Innovation Norway, which would be consistent with
the latter selecting projects with large externalities but low private return. Berubé and Mohnen (2009),
whose sample of Canadian firms contains firms that benefit from tax credits, a subset of which received
subsidies, find that those receiving subsidies introduced more new products and made more world-first
product innovations. These authors estimate program participation equations that do not include
indicators of financing constraints or of spillovers. Marra (2008) estimates an R&D investment equation
and finds that both instruments increase private investment.
5
a somewhat skeptical view on this type of R&D support, at least for level-based tax incentives.
In particular, Lokshin and Mohnen (2011), using a Dutch panel of firm level data, obtain
elasticities of 0.4 and 0.8 respectively. They also find that elasticities are larger (in absolute
value) for small firms (less than 200 employees) than for large firms. Using these elasticities
they estimate that 1 euro of tax receipts foregone generates 3.2 euros of R&D by small firms,
0.78 euros for large firms. For large firms therefore crowding out cannot be rejected.5 They
suggest that small firms may be more sensitive to tax incentives because they are more likely to
be credit constrained, but do not test this proposition.
The purpose of this modelling approach is to explain R&D investment as a function of its price,
and provides a framework for testing crowding out effects, which is an extremely important
issue. But it is not designed to ask which firms are more likely to use tax incentives, and in
particular whether incentives allow firms that were not doing R&D to switch to doing R&D.
Answers to these questions could offer valuable insights for interpreting estimated elasticities.
A different empirical approach provides a way to test this, although it has not been fully
exploited. Rather than using a structural approach, some researchers have used matching
methods to obtain an estimate of the impact of tax credits on some outcomes. This method
requires controlling for program participation (selection into treatment) in order to be able to
compare the outcomes of treated and untreated firms, and involves therefore the estimation of a
program participation equation. Even though this is usually done as a purely technical step,
results may contain valuable information for policy evaluation if the equation is adequately
specified. Corchuelo and Martínez Ros (2008), and Czarnitzki et al (2011) provide two
examples of this approach.6 Corchuelo and Martínez Ros, using Spanish firm-level data, find
that small, financially stable firms (those with a ratio of equity over debt higher than 0.5) are
5 They use the estimated elasticities to run some simulations to calculate the additional R&D investment
generated by the tax incentive and the foregone tax income, finding that the government revenue loss is
much larger than the increase in private R&D. From this the authors conclude that potential spillovers
would have to be very large in order to compensate for the deadweight loss. 6 See Cappelen et al (2008) for work with Norwegian data, and Duguet (2010) with French firms.

6
more likely to use tax credits.7 These results suggest that this type of support is more appealing
to small unconstrained firms rather than to constrained firms. Czarnitzki et al use a sample of
Canadian firms and include the price-cost margin as an indicator of the firm's internal funding
capacity in a probit model of the probability that a firm will use R&D tax credits. They find a
positive relationship, although it is not evident how to interpret this result in terms of financial
constraints, partly because in their sample there were firms that had also received R&D grants
and they all claimed tax credits. Appropriability indicators as a potential determinant of the use
of public support are not considered in all this work.
Research on the impact of direct funding (grants and loans) is extensive and shall not be
thoroughly reviewed here. The main point of interest for our purposes is that regardless of the
modelling approach (whether structural or non-structural methods), some program participation
equation is estimated. As before, this is usually taken as a purely technical step to proceed to
matching treated and non treated firms. Generally, firm size, industry dummies, and other firm
characteristics are typically included in the equation, but no link is made to indicators of market
failures. In some cases, an indicator of the firm’s financial situation is included among the
control variables. Hussinger (2008), for example, uses a credit rating index, and finds that firms
with better rating are more likely to obtain direct public funding in Germany. Czarnitzki et al
(2007) use an indicator of appropriability, but do not include indicators for funding constraints.
Possibly the work closest to ours in the interest for linking impact evaluation to the presumed
market failures is Gelabert, Fosfuri and Tribó (2009), who find evidence that the degree of
appropriability matters in explaining the magnitude of the effect that direct public support has
on privately financed internal R&D. Although their focus is on the estimation of the additional
private R&D investment generated by public support, they estimate a program participation
equation where indicators of appropriability and financial constraints are included. Only the
7 Corchuelo and Martínez Ros also include the lagged B-index in the separate equations for small and
large firms, finding that it affects the use of tax credits by large firms, but not by SMEs.

7
latter is found to be significant, although with a negative sign: contrary to expected, firms with
more financial constraints are less likely to obtain direct support. The authors, however, do not
explicitly address the link between indicators of market failures and the comparative use of the
two forms of support, direct subsidies and tax incentives.8
Our work, therefore, adds to the existing body of research by explicitly seeking to test whether
there is a correlation between the two potential sources of underinvestment in R&D and the
actual use of direct support and tax incentives. The different nature of both tools in some
relevant dimensions, and the different degree of public involvement associated to each, set the
stage for anticipating heterogeneous effects both across tools and across firms.
A focus on the allocation and use of two types of R&D support.
Some differences in the design of direct funding and tax incentives may have an impact on who
benefits from each as well as on some outcomes. Direct public funding is obtained by a firm
only if the firm presents an application to the public agency and the public agency decides
favourably after screening the proposals. The requirements explicitly and publicly set by the
public agency are usually related to the innovative content of the proposal, the technical ability
of the firm to carry it out, and the potential market.9 The agency may have additional
preferences for some industries or type of innovation project: it may consider, for instance the
expected spillovers generated by the project, or the extent of financing constraints faced by the
firm, but these do not seem to be made explicit in national-level programs. The firm runs the
project once funding has been approved. Funded projects will reflect both firm and agency
preferences: firms will be interested in projects that are profitable after taking into account
public support, but by determining the size of this support the agency may select projects that
have social value but low private value. There are two drawbacks: 1) applying for direct support
has a cost for the firms since preparing a proposal takes time and resources that have an
8 Gonzalez, Jaumandreu and Pazo (2005) provide an excellent analysis of subsidy effectiveness, but do
not study the role of appropriability and financing constraints. 9 See Huergo and Trenado (2008).
8
opportunity cost which may not be small for SMEs, and 2) screening for appropriate projects
has a cost for the public agency as well.
Tax credits, on the other hand, do not require the presentation and approval of a specific project.
A firm may claim a tax credit on any expense that qualifies as a research and development
expenditure according to the tax code. The only requirement usually is for the firm to follow
proper accounting rules for this type of expenses. A firm will obviously tend to select R&D
projects that have a high private profitability. Claiming the credit is relatively easy if the firm
fulfills these conditions, because it does so when filing for the corporate tax in period t+1. To be
able to benefit from a tax credit, however, the firm must have positive taxable income. Although
possibly less costly for firms, this mechanism involves some monitoring costs for the tax
authorities. In addition, nothing guarantees that the size of the tax credit will be related to the
equivalent optimal subsidy if spillovers are an important issue.
A potentially important difference between both tools is that, in the case of tax credits, the firm
must be able to privately fund the project ex-ante, and expect to have taxable income during the
same period or within a reasonable horizon. New and small firms may hence be at a
disadvantage to benefit from this instrument. An additional difference is that tax credits may be
pro-cyclical, in contrast to direct support.
There is virtually no theoretical model of firms’ and agency behaviour regading R&D subsidies.
Two exceptions are Takalo and Tanayama (2010) and Takalo, Tanayama and Toivanen (2011),
who focus on direct support. The first is a theoretical paper linking firms facing constraints to
finance their R&D projects, some of which are high quality and others are low quality, and
subsidy allocation. The model predicts that firms with high quality projects will always apply
for funding, and that subsidies will increase private effort through two effects: 1) by reducing
the amount of market based capital, they reduce its cost, and 2) the subsidy becomes a signal of

9
quality for private external funds, which again then reduces their cost.10 In the corporate
taxation literature, Keuschnigg and Ribi (2010) discuss how business taxation may affect
financially constrained innovative firms, and find that R&D tax credits encourage innovation
but also relax finance constraints and help innovative firms to exploit investment opportunities
to a larger extent.
The description of these differences between R&D tax credits and direct support and the
theoretical analysis of Takalo and Tanayama and of Keuschnigg and Ribi suggest some intuitive
propositions regarding the observed use of each mechanism. The core propositions we want to
test are the following:
1. Tax incentives can be considered to be a prize after the investment; they will therefore
be more attractive for firms without severe internal or external financing constraints.
2. Direct public funding will be preferred by firms that face financial constraints because
this tool provides ex-ante co-financing of projects and, in addition, may allow the firm
to rise more private funding after being awarded a grant or loan.
3. Firms with projects facing substantial appropriability problems will prefer direct
funding rather than tax incentives. When projects produce quickly imitable innovations,
the firm may not expect they will produce a significant stream of profits, nor,
consequently, a significant tax credit.
4. Firms engaging in projects with small appropriability problems will prefer tax
incentives to direct funding, especially if the cost of applying for direct funding is
relatively high relative to the expected grant, and the expected probability of being
awarded a grant is small.
10 Takalo et al (2011) model the subsidy allocation process as a game of incomplete information; their
main purpose is to estimate the expected return on subsidies for the agency.
10
5. New or young firms that intend to innovate are more likely to apply for and obtain
direct support than use tax incentives, because they usually are more affected by
financial constraints or have little taxable income.
There are obviously other factors that may affect a firm’s decision to apply for or use public
support for R&D. These include all those shaping the incentives to innovate and/ or perform
R&D, such as market structure. In particular, in industries with an established dominant firm the
incentives for rival’s R&D may be reduced (Cabral and Polak, 2007). Competitive pressure,
vertical integration, sunk entry costs and market size may also affect the profitability of
engaging in product or process innovations (Aghion et al., 2005 and 2009; Artés, 2009). Some
of these factors may be partially taken into account in our empirical analysis. We now turn to
the description of the most relevant features of our data.
3. EMPIRICAL DESIGN: DATA, VARIABLES AND ECONOMETRIC APPROACH
3.1. The DATA
The PITEC is a firm-level panel data set developed by the Spanish Statistical Office (INE)
based on the Community Innovation Survey, which in Spain is conducted annually. This data
base collects information related to innovation activities by firms with more than 10 employees
from all manufacturing and service industries. Spanish firms have a legal obligation to respond
to questionnaires submitted by INE, and the response rate is high (around 90%).The sample is
highly representative of large firms (those with 200 or more employees). It also contains a large
number of firms with less than 200 employees, but in this case the sample is biased towards
innovators. 11
11 This is so because all firms that have received any form of public support for R&D or those that have
reported R&D expenses in the current or past years are surveyed every year. The remaining surveyed
firms come from a random sample stratified by size and sector among non-R&D performing firms
11
We use data from the surveys conducted yearly from 2005 to 2008. It is important to note that
some questions refer to a three year period (2003-2005; 2004-2006; and so on) and some to the
year previous to the survey. Examples of the first type of information are geographical market
of the firm, introduction of new products and/or processes, information sources, cooperation to
innovate, barriers to innovation, use of public support to innovate and use of intellectual
property. Examples of the second type are the number of employees, sales volume, exports,
innovation expenditures by category (in-house R&D and others), and sources of funding for in-
house R&D. A distinctive characteristic of this survey is the availability of qualitative
information on barriers to innovation as perceived by the firm, as well as on the importance of
several sources of information for the firm's innovation process.12.
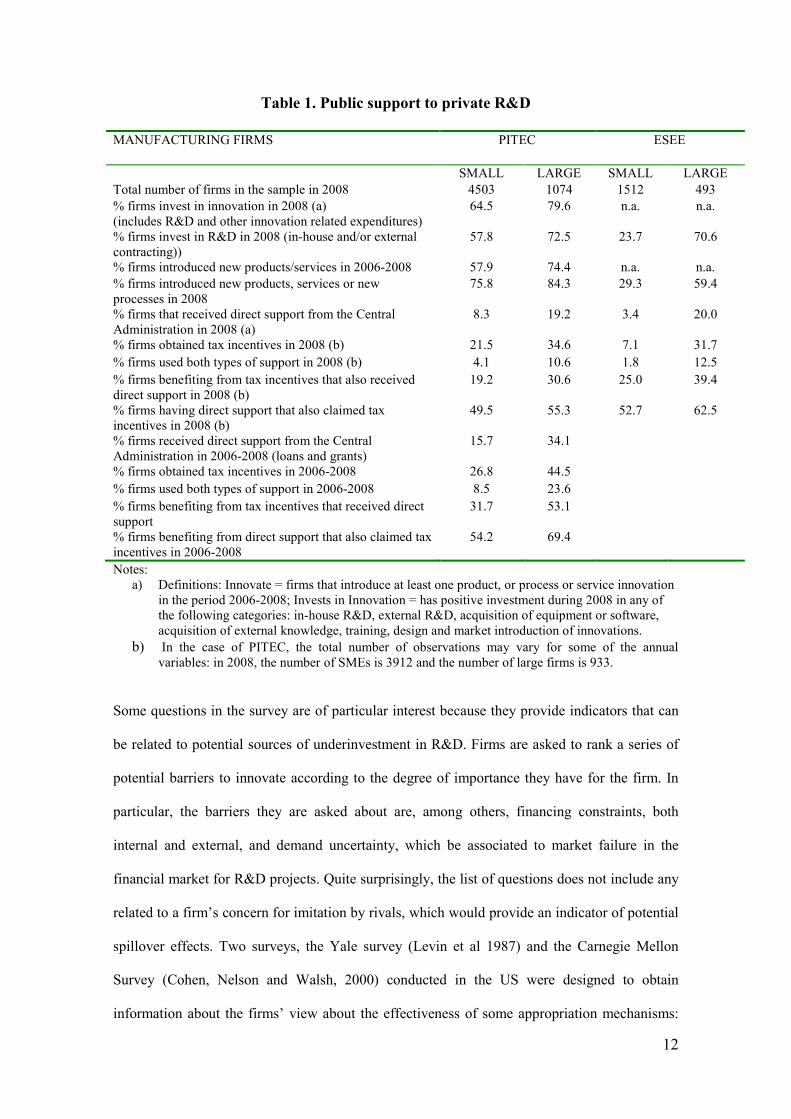
Tables 1 and 2 describe some features of the sample related to public support for business R&D.
Because of the different population representativity, we distinguish along the whole empirical
analysis between SMEs and large firms. The last two columns in Table 1 provide information
on the extent of the bias towards innovative firms in our sample relative to a representative
data source for manufacturing firms frequently used in empirical work, the ESEE. The table
shows that for large firms both data sources are very similar in terms of the share of firms that
invest in R&D or use R&D support. In the case of SMEs, about 50% of firms in the PITEC
sample invest in R&D against 24% in the ESEE sample. SMEs using public support are also
overrepresented in PITEC. However, an important advantage of PITEC relative to ESEE is the
larger sample size, a feature which becomes important for estimation purposes.13 Table 1 also
shows that, according to both data sources, the use of tax credits is more widespread than direct
support, particularly in the sample of SMEs, and that overall large firms benefit proportionally
more from both tools.
12 The Community Innovation Survey has been widely used in many policy evaluation studies.
13 Note for example that according to the information in Table 1 in 2008 only 12% of large firms in the
ESEE sample used both tax credits and direct support, that is, 61 observations maximum, while in the
PITEC sample there are about 110 observations.
12
Table 1. Public support to private R&D
MANUFACTURING FIRMS PITEC ESEE
SMALL LARGE SMALL LARGE
Total number of firms in the sample in 2008 4503 1074 1512 493
% firms invest in innovation in 2008 (a)
(includes R&D and other innovation related expenditures)
64.5 79.6 n.a. n.a.
% firms invest in R&D in 2008 (in-house and/or external
contracting))
57.8 72.5
23.7 70.6
% firms introduced new products/services in 2006-2008 57.9 74.4 n.a. n.a.
% firms introduced new products, services or new
processes in 2008
75.8 84.3 29.3 59.4
% firms that received direct support from the Central
Administration in 2008 (a)
8.3 19.2 3.4 20.0
% firms obtained tax incentives in 2008 (b) 21.5 34.6 7.1 31.7
% firms used both types of support in 2008 (b) 4.1 10.6 1.8 12.5
% firms benefiting from tax incentives that also received
direct support in 2008 (b)
19.2 30.6 25.0 39.4
% firms having direct support that also claimed tax
incentives in 2008 (b)
49.5 55.3 52.7 62.5
% firms received direct support from the Central
Administration in 2006-2008 (loans and grants)
15.7 34.1
% firms obtained tax incentives in 2006-2008 26.8 44.5
% firms used both types of support in 2006-2008 8.5 23.6
% firms benefiting from tax incentives that received direct
support
31.7 53.1
% firms benefiting from direct support that also claimed tax
incentives in 2006-2008
54.2 69.4
Notes:
a) Definitions: Innovate = firms that introduce at least one product, or process or service innovation
in the period 2006-2008; Invests in Innovation = has positive investment during 2008 in any of
the following categories: in-house R&D, external R&D, acquisition of equipment or software,
acquisition of external knowledge, training, design and market introduction of innovations.
b) In the case of PITEC, the total number of observations may vary for some of the annual
variables: in 2008, the number of SMEs is 3912 and the number of large firms is 933.
Some questions in the survey are of particular interest because they provide indicators that can
be related to potential sources of underinvestment in R&D. Firms are asked to rank a series of
potential barriers to innovate according to the degree of importance they have for the firm. In
particular, the barriers they are asked about are, among others, financing constraints, both
internal and external, and demand uncertainty, which be associated to market failure in the
financial market for R&D projects. Quite surprisingly, the list of questions does not include any
related to a firm’s concern for imitation by rivals, which would provide an indicator of potential
spillover effects. Two surveys, the Yale survey (Levin et al 1987) and the Carnegie Mellon
Survey (Cohen, Nelson and Walsh, 2000) conducted in the US were designed to obtain
information about the firms’ view about the effectiveness of some appropriation mechanisms:

13
legal (patents, trademarks, design or copyright), secrecy, and others (lead time, complementary
manufacturing or services), and in some early editions the CIS survey contained similar
questions.14 The current version of the Spanish CIS, however, includes only questions about the
actual use of legal protection mechanisms. Finally, the item "market dominated by established
enterprises" points to one feature of market structure that may affect potentially a firm's
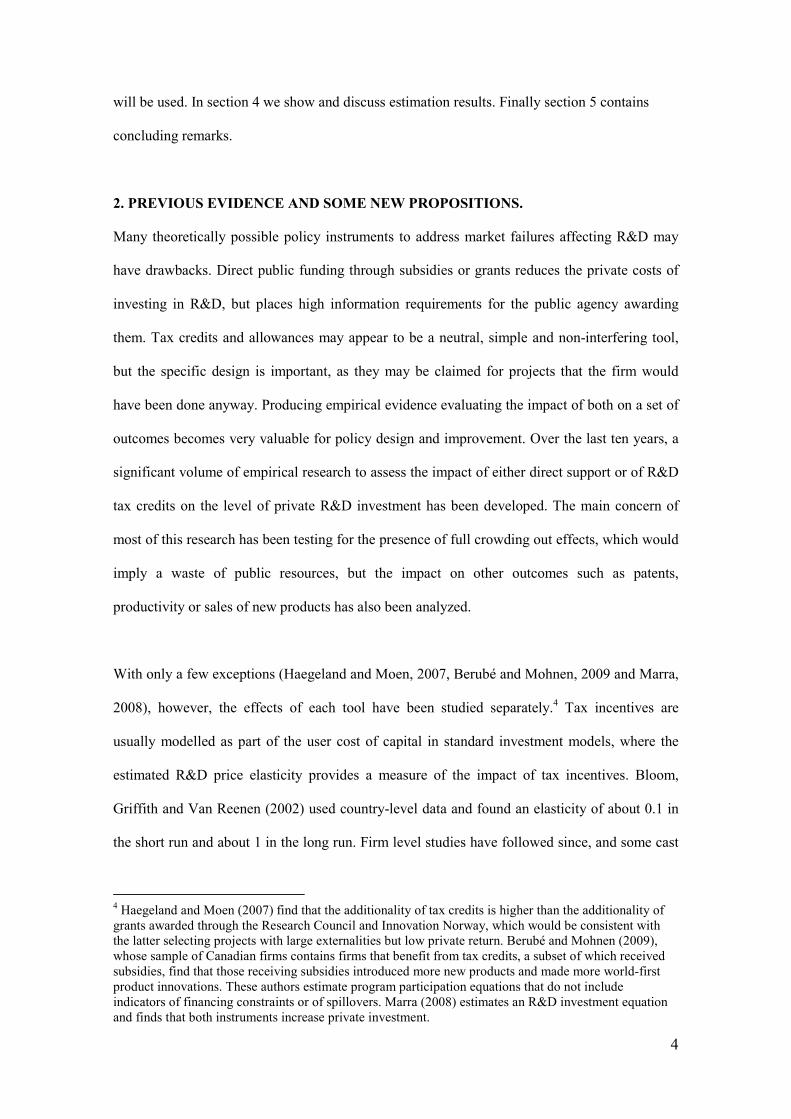
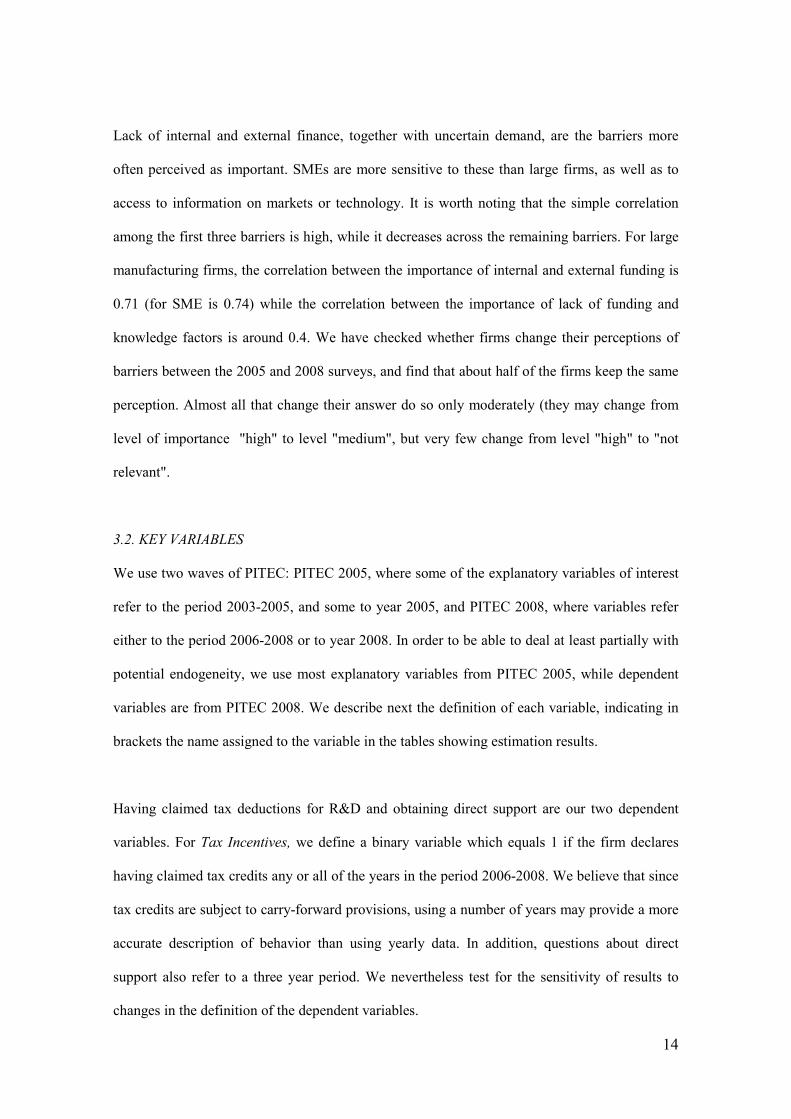
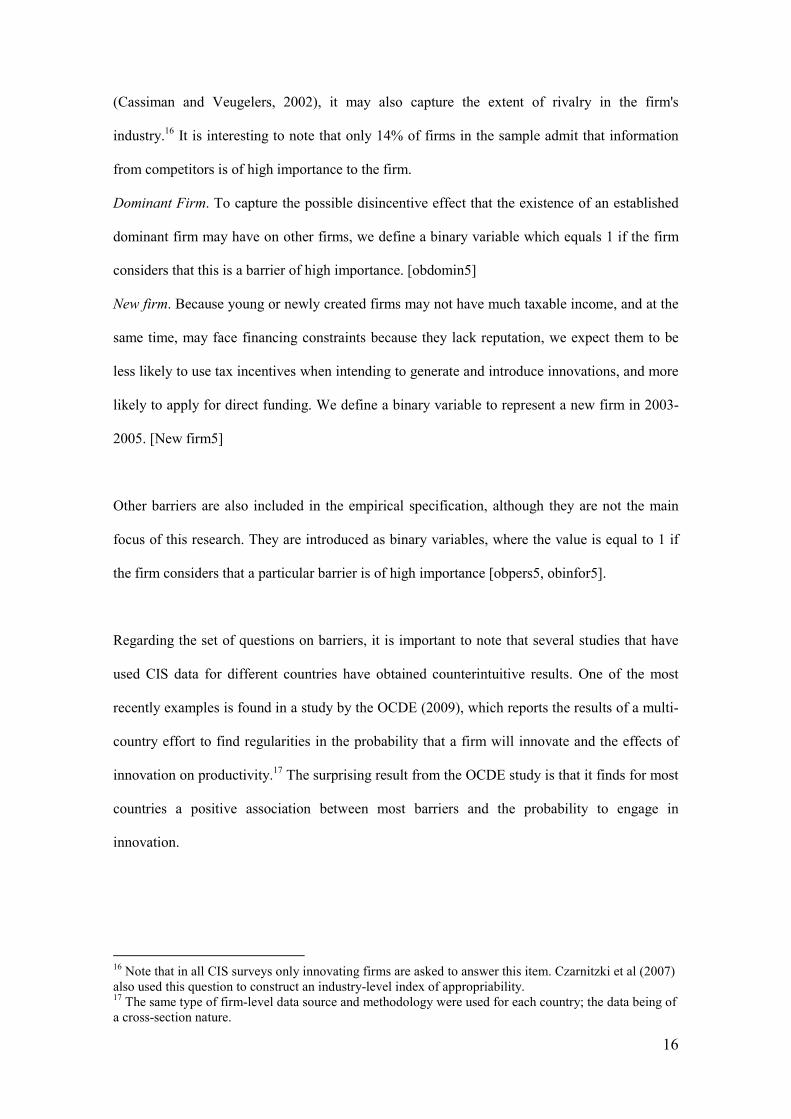
decisions, as predicted by some theoretical models (Cabral and Polak, 2007). Table 2 describes
manufacturing firms' perceptions about barriers to innovation.
Table 2 Perceived constraints to innovation in the period 2006-2008
A. Manufacturing Firms
SMEs
4,7
6,8
9,6
10,0
13,5
13,7
22,2
26,5
35,2
38,0
39,6
15,3
15,6
33,0
30,3
34,4
22,1
31,6
34,6
30,3
30,7
31,6
28,7
28,7
35,9
37,6
30,3
27,0
24,2
21,0
16,7
16,6
14,0
51,3
48,9
21,4
22,1
21,9
37,2
22,0
17,9
17,8
14,8
14,9
0% 20% 40% 60% 80% 100%
No need due to prior innovations
Lack of demand for innovation
Lack of information on technology
Lack of information on markets
Lack of qualified personnel
Difficulties in finding partners
Market dominated by established businesses
Uncertain demand for innovative goods or services
Lack of external finance
Lack of internal finance
High innovation cost
High Medium Low Not relevant
Large Firms
4,
6,2
5,0
4,9
5,9
6,5
15,2
17,2
19,9
20,9
23,7
11,1
11,9
25,0
24,0
27,8
22,1
26,1
34,3
30,5
34,1
32,5
28,8
27,8
44,1
43,0
40,0
34,5
31,6
25,8
24,5
24,8
23,8
55,9
54,1
25,8
28,0
26,3
37,0
27,2
22,7
25,0
20,2
19,9
0% 20% 40% 60% 80% 100%
No need due to prior innovations
Lack of demand for innovation
Lack of information on technology
Lack of information on markets
Lack of qualified personnel
Difficulties in finding partners
Market dominated by established businesses
Uncertain demand for innovative goods or services
Lack of external finance
Lack of internal finance
High innovation cost
High Medium Low Not relevant
14 These data have been used for example by Cockburn and Griliches (1988) to study the stock market’s
valuation of R&D and patents, and more recently by Dushnitsky and Lenox (2005) Ceccagnoli (2009).
14
Lack of internal and external finance, together with uncertain demand, are the barriers more
often perceived as important. SMEs are more sensitive to these than large firms, as well as to
access to information on markets or technology. It is worth noting that the simple correlation
among the first three barriers is high, while it decreases across the remaining barriers. For large
manufacturing firms, the correlation between the importance of internal and external funding is
0.71 (for SME is 0.74) while the correlation between the importance of lack of funding and
knowledge factors is around 0.4. We have checked whether firms change their perceptions of
barriers between the 2005 and 2008 surveys, and find that about half of the firms keep the same
perception. Almost all that change their answer do so only moderately (they may change from
level of importance "high" to level "medium", but very few change from level "high" to "not
relevant".
3.2. KEY VARIABLES
We use two waves of PITEC: PITEC 2005, where some of the explanatory variables of interest
refer to the period 2003-2005, and some to year 2005, and PITEC 2008, where variables refer
either to the period 2006-2008 or to year 2008. In order to be able to deal at least partially with
potential endogeneity, we use most explanatory variables from PITEC 2005, while dependent
variables are from PITEC 2008. We describe next the definition of each variable, indicating in
brackets the name assigned to the variable in the tables showing estimation results.
Having claimed tax deductions for R&D and obtaining direct support are our two dependent
variables. For Tax Incentives, we define a binary variable which equals 1 if the firm declares
having claimed tax credits any or all of the years in the period 2006-2008. We believe that since
tax credits are subject to carry-forward provisions, using a number of years may provide a more
accurate description of behavior than using yearly data. In addition, questions about direct
support also refer to a three year period. We nevertheless test for the sensitivity of results to
changes in the definition of the dependent variables.

15
Direct support. We define a binary variable which equals 1 if the firm has applied for and
obtained direct funding from the Central Administration in the period 2006-2008. Although
firms may obtain direct support from local, central or European administrations, we consider
that, since tax incentives are defined at the country level, the appropriate funding source they
should be compared to is Central government support.15 Note that the survey does not provide
information on whether a firm applied for but did not obtain direct support. The observed
outcome will therefore capture not only the firm's decision but also the public agency's
preferences.
Financial constraints. As shown above, firms report the degree of importance of lack of access
to internal and to external financing as a barrier to innovation. Because of the observed high
correlation between both barriers, we define a single binary variable which equals 1 if the firm
considers that either of them has high importance as a barrier in the period 2003-2005. [obfin5]
Appropriability. It is difficult to measure the degree of ex-ante appropriability of R&D
investments, in order to test the extent to which it may deter innovation. We know
appropriability matters because we observe that firms use the patent system and that there is
patent litigation activity. In much existing work, the standard indicator of appropriability has
been the use of protection mechanisms. We also take this approach and define a binary variable
which takes the value of 1 if the firm has used any of the legal protection mechanisms
(copyrights, trademarks, design or patent) in the period 2003-2005 [protect5]. Although this
variable might capture past innovation experience, we also will include, as a control, past in-
house R&D [idin5], so that we expect that the use of protection methods in the past captures the
concern the firm has for potential imitation.
We will also use answers to a question about the importance that the firm gives to information
from competitors as a source of ideas for innovation in the period 2003-2005 [Infocomp5] to
construct a second indicator of spillovers. Although meant to capture incoming spillovers
15 There are in Spain 17 regional governments that also provide support for innovation. Although none
uses tax incentives, they may provide direct support. Eligibility criteria may differ across regional
agencies. See Blanes and Busom (2004).
16
(Cassiman and Veugelers, 2002), it may also capture the extent of rivalry in the firm's
industry.16 It is interesting to note that only 14% of firms in the sample admit that information
from competitors is of high importance to the firm.
Dominant Firm. To capture the possible disincentive effect that the existence of an established
dominant firm may have on other firms, we define a binary variable which equals 1 if the firm
considers that this is a barrier of high importance. [obdomin5]
New firm. Because young or newly created firms may not have much taxable income, and at the
same time, may face financing constraints because they lack reputation, we expect them to be
less likely to use tax incentives when intending to generate and introduce innovations, and more
likely to apply for direct funding. We define a binary variable to represent a new firm in 2003-
2005. [New firm5]
Other barriers are also included in the empirical specification, although they are not the main
focus of this research. They are introduced as binary variables, where the value is equal to 1 if
the firm considers that a particular barrier is of high importance [obpers5, obinfor5].
Regarding the set of questions on barriers, it is important to note that several studies that have
used CIS data for different countries have obtained counterintuitive results. One of the most
recently examples is found in a study by the OCDE (2009), which reports the results of a multi-
country effort to find regularities in the probability that a firm will innovate and the effects of
innovation on productivity.17 The surprising result from the OCDE study is that it finds for most
countries a positive association between most barriers and the probability to engage in
innovation.
16 Note that in all CIS surveys only innovating firms are asked to answer this item. Czarnitzki et al (2007)
also used this question to construct an industry-level index of appropriability. 17 The same type of firm-level data source and methodology were used for each country; the data being of
a cross-section nature.

17
A possible explanation that has been offered is that innovative firms become more aware of the
difficulties associated to innovating than non-innovating firms. This interpretation suggests that
self-assessment of barriers may be endogenous to innovative behavior, particularly because in
these studies barriers and innovative behavior refer to the same period. An additional problem is
that there may be individual-specific heterogeneity in subjective evaluations: some mangers
may tend to be optimistic, while others pessimistic. Subjective self-evaluations and subjective
expectations, however, are increasingly used in empirical research in other fields.18 We address
these concerns by i) using lagged indicators of barriers and ii) including an additional control
variable that aims at capturing the firm's overall perception of difficulties, which is computed as
follows: we add the rankings given by the firm to all barriers, and rescale so that it takes values
in a 0 to 1 scale [obstAll5]. Larger values indicate that a firm perceives a high overall level of
barriers.19 We expect that this variable will capture the awareness effect, so the importance of
individual barriers may be isolated from the firm’s overall individual-specific perception.
3.3. CONTROL VARIABLES
The survey included in 2008 a new question related to tax incentives. Each firm was asked
whether it took into account existing tax incentives when planning its potential R&D
investment. We believe that the answer captures the managers' view on the strategic importance
of R&D for their firm. Lacking other indicators of managerial characteristics that might be
relevant for innovation decisions, we include this binary indicator as a control variable
(plantax).20
We include a measure of technological distance of the firm relative to the mean of it sector of
activity. The idea is that incentives to innovate are affected by the firm's position relative to the
18 See for instance Zafar (2011)
19 We later check for the robustness of estimates to alternative ways to control for these potential biases.
20 Note that taking into account tax credit incentives does not predetermine claiming them. Although most
firms that do not take them into account do not claim tax credits, 56% of SMEs and 60% of large firms
that do take them into account do not claim them. The Pearson correlation between the two variables is
.28 for SMEs and .30 for large firms.
18
technological frontier, as shown in Aghion et al., 2009. Manufacturing is classified into 30
subsectors, and for each we compute the average labor productivity as sales per employee. We
then divide each firm's labor productivity in 2005 by the average of its sector (ldistprod5).
We include several variables to control for heterogeneity across firms, most of them binary. Past
R&D activity [rdin5], belonging to a group [group5], being a private domestic firm [privdom5],
being an exporter [bexp5], location near a science or technological park [park], regional location
and industry dummies capturing technological intensity [high, medium high, medium low and
low]. We also include as control variables size, measured by the log of the number of employees
(lsize5); human capital, measured by the proportion of employees with a higher education
degree (humcap5), and the age of the firm (age5).
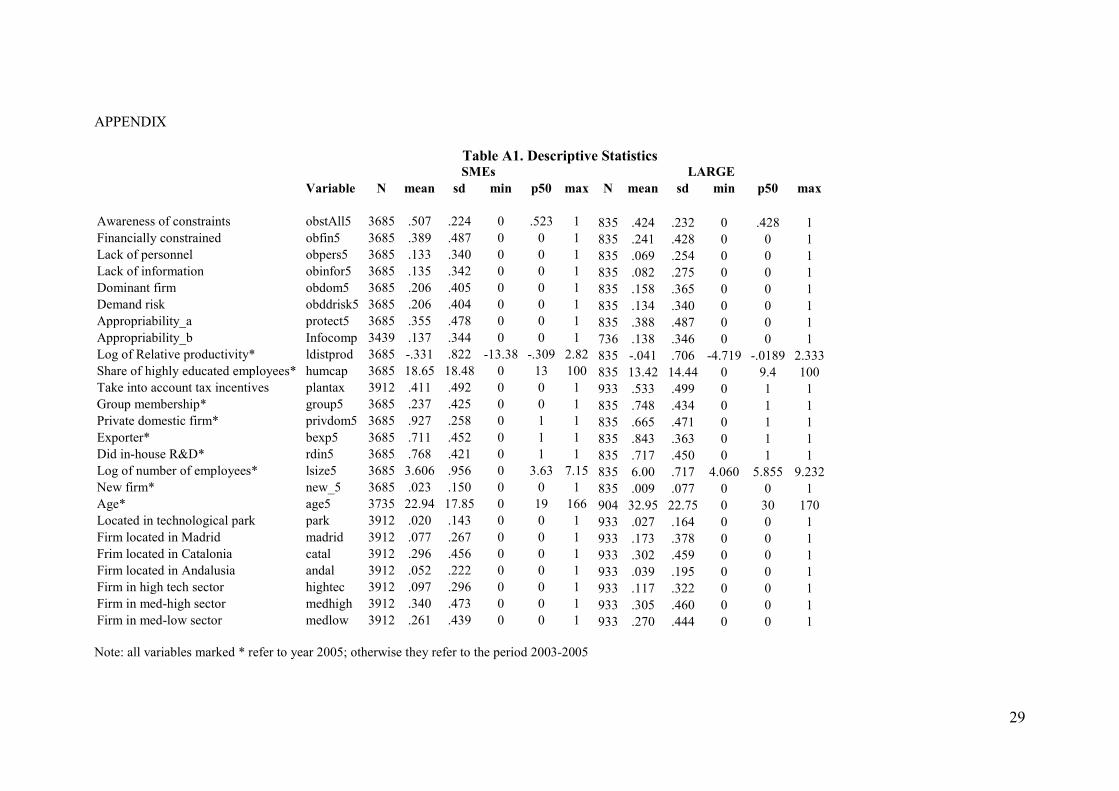
Table A1 in the Appendix shows the main descriptive statistics for these variables, for SMEs
and large firms. Regarding the appropriability measures, we note that around 35% of firms
declare having used legal protection mechanisms in 2003-2005. We find surprising, however,
that only 14% of firms, whether large or SMEs, consider information from competitors to be of
high relevance for their innovation plans. To put this number in perspective, we can compare it
to the percentage obtained in the German and French CIS surveys. According to Eurostat, in
Germany 17% of manufacturing innovative firms considered this source to be highly important
in 2008, against 11% in Spain’s (percentages increase slightly with firm size) and 9% in France.
Regarding the importance of conferences, trade fairs and exhibitions, the percentages were 18%
for German firms, 5 % for Spanish firms, and 10% for French firms. One possible interpretation
of these differences is that innovation management and style differ across countries even among
innovative firms.
3.4. ECONOMETRIC APPROACH
Given that we observe whether a firm obtains or not direct support, and whether it uses or not
tax incentives, we specify a model with two binary dependent variables. We use a bivariate
probit model because it allows for correlation between the random terms across alternatives and

19
is less restrictive than a multinomial model. In addition, a bivariate probit model possibly
captures more accurately the decision process by the firm. Tax filing periods may not be the
same as grant application and granting periods; in addition, firms may not be able to anticipate
their tax position when applying for direct funding. Hence we believe that a multinomial logit
approach would not be appropriate in this case.
There will be four possible situations a firm can be in: no support (0,0), no grant but claims a
tax credit (0,1), gets a grant but does not claim a tax credit (1,0) and both gets a grant and claims
a tax credit ( 1,1), and therefore four sets of corresponding predicted probabilities, as well as
four sets of marginal effects.
The model is the following:
S = 1 if S*= bsX+es > c,
S = 0 otherwise (1)
F = 1 if F*= bfX + ef > h
F = 0 otherwise (2)
Several types of marginal effects may be computed: the marginal effect computed at the mean
value of explanatory variables, the marginal effect computed at a representative value of the
explanatory variables, and the average marginal effect, which is the average of the marginal
effect at each x. For policy analysis, usually the latter is recommended (Cameron and Trivedi,
2009), so these will be our reported results.
We drop from the sample those firms that declare not having an interest in innovating as the
main reason for not innovating, because we want to focus on the role of barriers for firms that
do have a potential interest for innovating, thus distinguishing between behavior resulting from
preferences from behavior resulting from perceived restrictions.

20
4. RESULTS
4.1 Baseline estimation
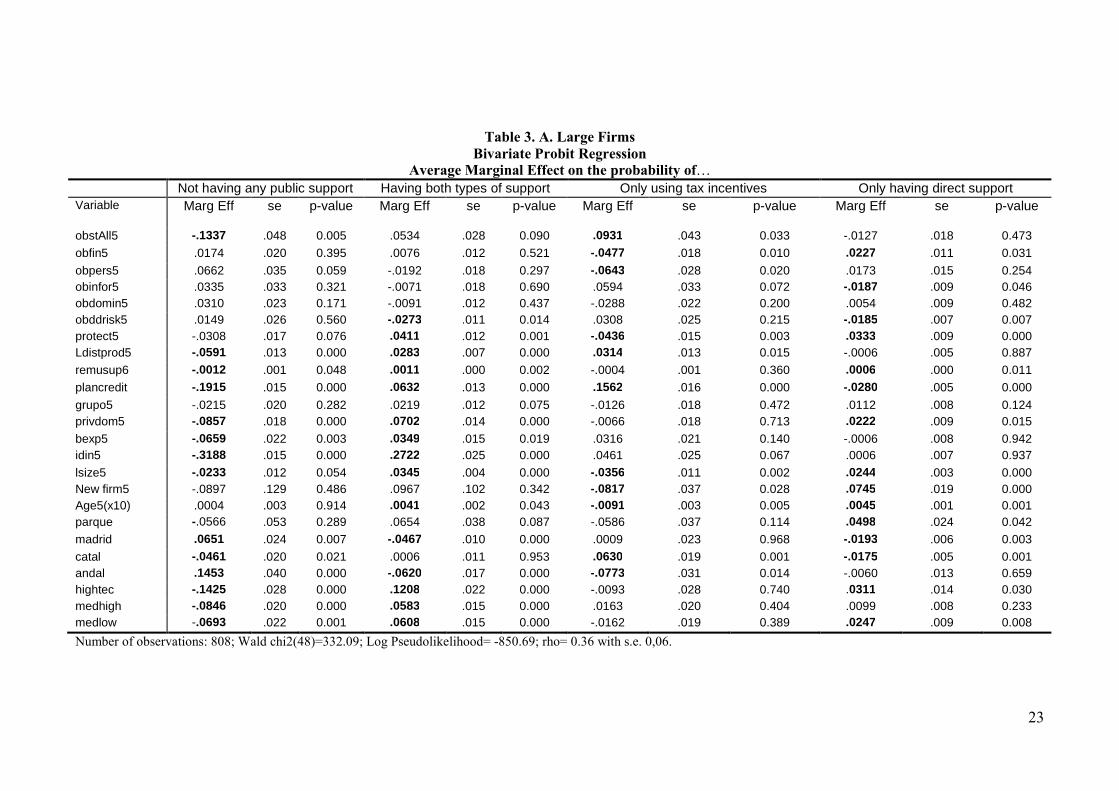
We report in Table 3.A and Table 3.B below the estimated average marginal effect of a change
in the explanatory variable on each of the four possible situations a firm may be in. We test for
equality of coefficients for equations (1) and (2), and the null is rejected (chi-square test not
reported in the tables). As specification test, we perform a test for normality of residuals, and do
not reject the null.21
Because we want to see whether the advantages of these two policy tools differ from the firms'
perspective, we first discuss the estimated average marginal effects we have obtained for the
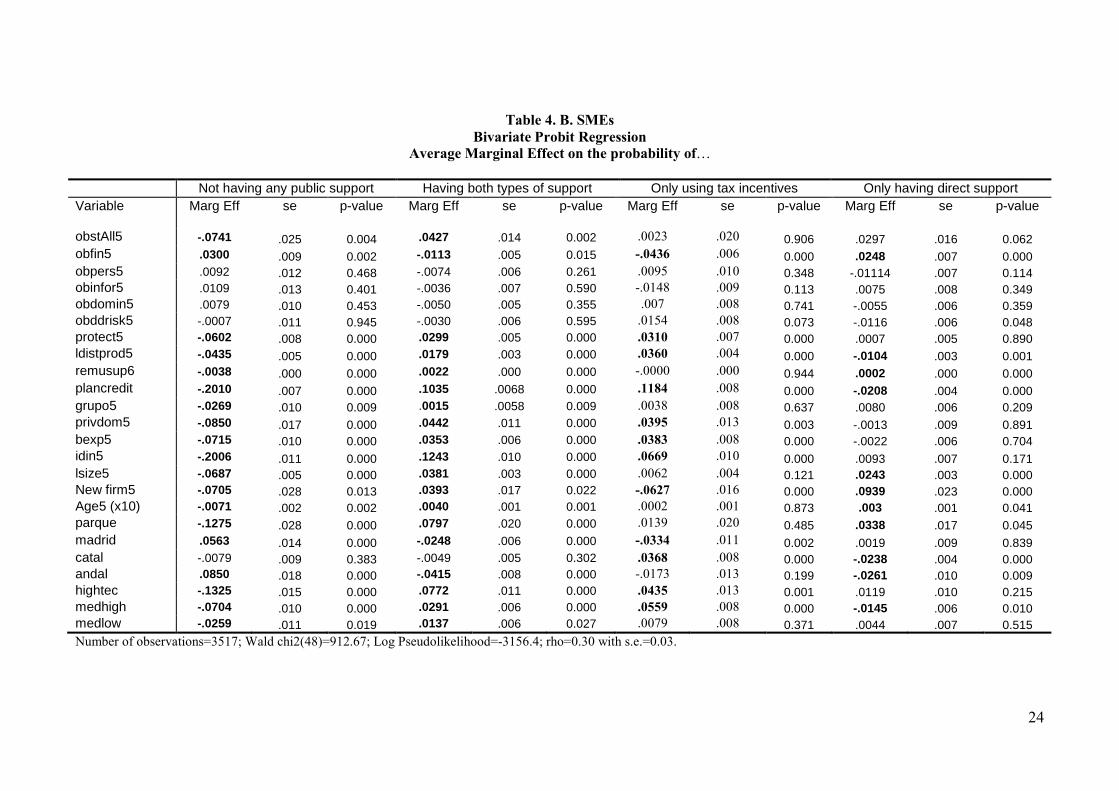
probability of using only tax credits and of using only direct support. We find that both for large
firms and SMEs, being financially constrained reduces the probability of using only tax credits
by about 4 percentage points, while it increases the probability of obtaining direct support by
about 2.5 percentage points. These results are consistent with the first two propositions
formulated in section 2.
Regarding the appropriability issue, as captured by the use of legal protection mechanisms, we
find that for large firms this variable has a significant and negative average marginal effect on
the probability of using only tax incentives, but a positive effect on the probability of using only
direct support. Since we control for past R&D investment, we believe that this result suggests
that firms whose projects have more innovative content and are more concerned about imitation
prefer direct support to tax incentives. For SMEs we find a different pattern: those with
appropriability concerns are more likely to use either tax incentives alone or both instruments.
It is possible that SMEs' innovation projects are on average of an incremental nature and that the
cost of applying for direct funding be high relative to the expected probability of obtaining it.
21 See Chiburis (2010).

21
Finally, we find that for both SMEs and large firms, being a new firm increases the probability
of having only direct support, and reduces the probability of using only tax credits.
We find other interesting differences on the average marginal effect of other variables on these
probabilities. Human capital increases the likelihood of using only direct support, but has no
effect on the use of tax incentives. A firm's relative productivity has a positive effect on the
probability of using tax incentives only, and on the probability of using both types of support.
As expected, the variable that captures the overall level of barriers perceived by the firm has a
positive effect on the use of any support, and a negative effect on the use of none. Finally, we
find different patterns across industries. While industry type does not affect the use of tax
incentives, large firms in high-tech industries and in medium-low technological intensity are
more likely to use direct support. Among SMEs, firms in high-tech and medium high-tech
industries are those more likely to use tax incentives.
We now look at the other two groups of firms: those that do not use any support, and those that
use both tax credits and direct support. We find that having previous experience in R&D is the
most important determinant of (not) using both kinds of support, both for large firms and for
SMEs. For large firms financial constraints do not seem to have a significant effect, while for
SMEs they reduce the likelihood of using both tools, and increase the likelihood of using none.
We believe that the significance of past R&D in explaining the use of tax credits (alone or in
combination with direct support), but not the use of direct support, points to a characteristic of
R&D-related behavior that previous research has identified: persistence.22 In our sample, 89%
of large firms and 73% of SMEs that were investing in R&D in 2005 also invested in 2008.
About one fifth of firms switched from not doing R&D in 2005 to doing in 2008 (18% of SMEs
22 See Mañez-Castillejo, J. A., Rochina-Barrachina, M. E., Sanchis-Llopis, A. and Sanchis-Llopis, J.
(2009). Sunk costs or increasing dynamic returns to R&D (through learning effects) might explain
persistence.

22
and 22% of large firms). Many of these "switchers" used some form of public support in the
period 2006-2008 (45% of SMEs and 66% of large firms).
Overall, our results suggest that direct support may be more effective to encourage firms that
face financial constraints to invest, or invest more, in R&D, while tax incentives may encourage
increasing R&D by firms that are not financially constrained and already invest in R&D.
Results show clearly that direct support and tax incentives are not substitutes in the sense that
they are not driven by the same factors in the same direction.
When we estimate the model including as a proxy for appropriability the importance of
information from competitors, which involves using the subsample of innovating firms only, we
find differences in the effects for large firms and for SMEs. In the case of large firms, those that
give a high importance to this source of information are more likely to use tax incentives only,
and less likely to not using any tool. The sign of the effect on using tax incentives only is the
opposite of the use of protection, suggesting that both variables capture different things: it is
possible that information from competitors is relevant when the intensity of rivalry is high,
creating a situation of neck and neck competition, in which case the firm has an incentive to
innovate, and therefore claim tax credits. In the case of SMEs, firms that think that information
from competitors is important for innovation are more likely to not use any form of R&D
support. It is not obvious whether large firms and SMEs interpret the survey question in the
same sense, however. The results concerning the role of financing constraints are the same as in
the baseline discussed above.
23
Table 3. A. Large Firms
Bivariate Probit Regression Average Marginal Effect on the probability of…
Not having any public support Having both types of support Only using tax incentives Only having direct support Variable Marg Eff
se p-value Marg Eff
se p-value Marg Eff
se p-value Marg Eff
se p-value
obstAll5 -.1337 .048 0.005 .0534 .028 0.090 .0931 .043 0.033 -.0127 .018 0.473
obfin5 .0174 .020 0.395 .0076 .012 0.521 -.0477 .018 0.010 .0227 .011 0.031
obpers5 .0662 .035 0.059 -.0192 .018 0.297 -.0643 .028 0.020 .0173 .015 0.254 obinfor5 .0335 .033 0.321 -.0071 .018 0.690 .0594 .033 0.072 -.0187 .009 0.046 obdomin5 .0310 .023 0.171 -.0091 .012 0.437 -.0288 .022 0.200 .0054 .009 0.482 obddrisk5 .0149 .026 0.560 -.0273 .011 0.014 .0308 .025 0.215 -.0185 .007 0.007 protect5 -.0308 .017 0.076 .0411 .012 0.001 -.0436 .015 0.003 .0333 .009 0.000 Ldistprod5 -.0591 .013 0.000 .0283 .007 0.000 .0314 .013 0.015 -.0006 .005 0.887
remusup6 -.0012 .001 0.048 .0011 .000 0.002 -.0004 .001 0.360 .0006 .000 0.011
plancredit -.1915 .015 0.000 .0632 .013 0.000 .1562 .016 0.000 -.0280 .005 0.000
grupo5 -.0215 .020 0.282 .0219 .012 0.075 -.0126 .018 0.472 .0112 .008 0.124 privdom5 -.0857 .018 0.000 .0702 .014 0.000 -.0066 .018 0.713 .0222 .009 0.015
bexp5 -.0659 .022 0.003 .0349 .015 0.019 .0316 .021 0.140 -.0006 .008 0.942 idin5 -.3188 .015 0.000 .2722 .025 0.000 .0461 .025 0.067 .0006 .007 0.937
lsize5 -.0233 .012 0.054 .0345 .004 0.000 -.0356 .011 0.002 .0244 .003 0.000 New firm5 -.0897 .129 0.486 .0967 .102 0.342 -.0817 .037 0.028 .0745 .019 0.000 Age5(x10) .0004 .003 0.914 .0041 .002 0.043 -.0091 .003 0.005 .0045 .001 0.001 parque -.0566 .053 0.289 .0654 .038 0.087 -.0586 .037 0.114 .0498 .024 0.042
madrid .0651 .024 0.007 -.0467 .010 0.000 .0009 .023 0.968 -.0193 .006 0.003
catal -.0461 .020 0.021 .0006 .011 0.953 .0630 .019 0.001 -.0175 .005 0.001 andal .1453 .040 0.000 -.0620 .017 0.000 -.0773 .031 0.014 -.0060 .013 0.659 hightec -.1425 .028 0.000 .1208 .022 0.000 -.0093 .028 0.740 .0311 .014 0.030 medhigh -.0846 .020 0.000 .0583 .015 0.000 .0163 .020 0.404 .0099 .008 0.233 medlow -.0693 .022 0.001 .0608 .015 0.000 -.0162 .019 0.389 .0247 .009 0.008
Number of observations: 808; Wald chi2(48)=332.09; Log Pseudolikelihood= -850.69; rho= 0.36 with s.e. 0,06.
24
Table 4. B. SMEs
Bivariate Probit Regression Average Marginal Effect on the probability of…
Not having any public support Having both types of support Only using tax incentives Only having direct support Variable Marg Eff
se p-value Marg Eff
se p-value Marg Eff
se p-value Marg Eff
se p-value
obstAll5 -.0741 .025 0.004 .0427 .014 0.002 .0023 .020 0.906 .0297 .016 0.062 obfin5 .0300 .009 0.002 -.0113 .005 0.015 -.0436 .006 0.000 .0248 .007 0.000 obpers5 .0092 .012 0.468 -.0074 .006 0.261 .0095 .010 0.348 -.01114 .007 0.114 obinfor5 .0109 .013 0.401 -.0036 .007 0.590 -.0148 .009 0.113 .0075 .008 0.349 obdomin5 .0079 .010 0.453 -.0050 .005 0.355 .007 .008 0.741 -.0055 .006 0.359 obddrisk5 -.0007 .011 0.945 -.0030 .006 0.595 .0154 .008 0.073 -.0116 .006 0.048 protect5 -.0602 .008 0.000 .0299 .005 0.000 .0310 .007 0.000 .0007 .005 0.890 ldistprod5 -.0435 .005 0.000 .0179 .003 0.000 .0360 .004 0.000 -.0104 .003 0.001 remusup6 -.0038 .000 0.000 .0022 .000 0.000 -.0000 .000 0.944 .0002 .000 0.000 plancredit -.2010 .007 0.000 .1035 .0068 0.000 .1184 .008 0.000 -.0208 .004 0.000 grupo5 -.0269 .010 0.009 .0015 .0058 0.009 .0038 .008 0.637 .0080 .006 0.209 privdom5 -.0850 .017 0.000 .0442 .011 0.000 .0395 .013 0.003 -.0013 .009 0.891 bexp5 -.0715 .010 0.000 .0353 .006 0.000 .0383 .008 0.000 -.0022 .006 0.704 idin5 -.2006 .011 0.000 .1243 .010 0.000 .0669 .010 0.000 .0093 .007 0.171 lsize5 -.0687 .005 0.000 .0381 .003 0.000 .0062 .004 0.121 .0243 .003 0.000 New firm5 -.0705 .028 0.013 .0393 .017 0.022 -.0627 .016 0.000 .0939 .023 0.000 Age5 (x10) -.0071 .002 0.002 .0040 .001 0.001 .0002 .001 0.873 .003 .001 0.041 parque -.1275 .028 0.000 .0797 .020 0.000 .0139 .020 0.485 .0338 .017 0.045 madrid .0563 .014 0.000 -.0248 .006 0.000 -.0334 .011 0.002 .0019 .009 0.839 catal -.0079 .009 0.383 -.0049 .005 0.302 .0368 .008 0.000 -.0238 .004 0.000 andal .0850 .018 0.000 -.0415 .008 0.000 -.0173 .013 0.199 -.0261 .010 0.009 hightec -.1325 .015 0.000 .0772 .011 0.000 .0435 .013 0.001 .0119 .010 0.215 medhigh -.0704 .010 0.000 .0291 .006 0.000 .0559 .008 0.000 -.0145 .006 0.010 medlow -.0259 .011 0.019 .0137 .006 0.027 .0079 .008 0.371 .0044 .007 0.515 Number of observations=3517; Wald chi2(48)=912.67; Log Pseudolikelihood=-3156.4; rho=0.30 with s.e.=0.03.
25
4.2 ROBUSTNESS ANALYSIS
We have performed alternative estimations to check for the robustness of our results to a series
of changes. These are the following. First, we have reestimated the model adding a binary
variable for low financing constraints and using different subsamples of firms: a subset of firms
that introduced products new to the market in 2005 or before, because this particular subset may
be more sensitive to appropriability issues; a subset of firms that did R&D in 2005, and subset
of firms in high tech and medium tech manufacturing sectors. Results remain basically
unchanged across subsamples for SMEs, and for the first subsample in the case of large firms.
For the subsample of large firms that did R&D in 2005, and for the subsample of firms in the
high tech and medium high tech industries, financial constraints are not associated to the
likelihood of using any of these policy tools. This constraint remains significant for SMEs.
Second, we re-estimate the model dropping some outliers for one of the continuous control
variables, relative productivity, and find that results remain basically unaffected.
Third, we change the definition of dependent variables, tax credits and direct support. Instead of
using binary variables referring to the 2006-8 period, we use binary variables referring to year
2008 only. In addition, regarding direct support the question asked is not identical. For the three
year period, firms are asked whether they received any direct support for innovation activities,
including loans and grants. The question referring to year 2008 includes only grants for in-house
R&D. We find that the main estimates of interest remain stable.
Finally, we change the way we calculate constraints, partly because we fear that correlation
among the set of barriers to innovation may affect standard errors. We define for each barrier
26
the ratio between the ranking for that barrier and the average value for all barriers, as perceived
by the firm. We find that the main results are not affected. 23
5. CONCLUSION
Our analysis has addressed the preferences of Spanish firms regarding the use of two tools of
public support to private R&D activities, linking them to potential barriers to innovation, with
special focus on the role of financial constraints and appropriability indicators. Using data from
PITEC for the periods 2003-2005 and 2006-2008, we have estimated the determinants of the
likelihood of using these tools jointly, in isolation or none.
Results support the main hypothesis that tax incentives and direct funding are not perfect
substitutes, because financing constraints affect differently the likelihood of using each
instrument. In particular, our findings show that the probability to use tax incentives falls when
firms face financial constraints, while the likelihood of using direct funding increases. There are
differences as well regarding the effect of appropriability, as measured by the use of legal forms
of protection. The direction of this effect is not the same for large firms and for SMEs. While
large firms that have used protection methods are less likely to use tax incentives, and more
likely to use direct support, SMEs that protect their ideas are more likely to use tax incentives.
These results do suggest there is a link between the nature and extent of market failures related
to R&D and the use of these two tools of public support to private R&D, a point not previously
made in the literature. However, while the survey questions related to financial constraints are
unambiguous, the issue of appropriability remains very difficult to evaluate with the questions
currently used in the survey. Some innovation project level information could be helpful in that
regard, as well as introducing questions similar to those used in the Yale and Carnegie Mellon
surveys regarding the importance of secrecy and lead time.
23 All robustness results are available on request.
27
REFERENCES
Aghion, P., Bloom, N., Blundell, R., Griffith, R. and Howitt, P., (2005), “Competition and
innovation: an inverted-U relationship”, Quarterly Journal of Economics, 701-728.
Aghion, P. Richard Blundell, Rachel Griffith, Peter Howitt, and Susanne Prantl (2009), “The
effects of entry on incumbent innovation and productivity”, The Review of Economics and
Statistics, 91(1), 20-32.
Artés, J., (2009), “Long run versus short run decisions: R&D and market structure in Spanish
firms”, Research Policy, 38, 120-232.
Berube, Ch. and P. Mohnen (2009), “Are firms that received R&D subsidies more
innovative?”, Canadian Journal of Economics, 42(1), 206-225. Bloom, N., Griffith, R., Van Reenen, J. (2002). Do R&D credits work? Evidence from an
international panel of countries 1979-1997. Journal of Public Economics, 85, 1-31.
Cabral, L. and B. Polak (2007), Does Microsoft Stifle Innovation? Dominant Firms, imitation
and R&D Incentives", NYU Working Paper EC -07-06.
Cappelen, A., A. Raknerud and M. Rybalka (2008), “The effects of R&D tax credits on
patenting and innovations”, Discussion Papers 565, Statistics Norway.
Cameron, and Trivedi (2009)
Chiburis, R.(2010), "Score tests of normality in Bivariate Probit Models: Comment", U. Texas
at Austin, mimeo.
Corchuelo, B. and E. Martínez-Ros (2008), "Application of R&D fiscal incentives in Spanish
manufacturing firms", Hacienda Pública Española, IEF, Vol 187(4).
Corchuelo, B. and E. Martínez Ros (2010), “Who benefits from R&D policy?", CEDE 45, 145-
170.
Commission of the European Communities (2006), "Communication from the Commision to
the Council, the European Parliament and the European Economic and Social Committee:
Towards a more effective use of tax incentives in favour of R&D", SEC(2006)1515.
Czarnitzki, D., B. Ebersberger and A. Fier (2007), “The relationship between R&D
collaboration, subsidies and R&D performance: Empirical evidence from Finland and
Germany”, Journal of Applied Econometrics 22:1347-1366.
Czarnitzki, D., P. Hanel and J.M. Rosa (2011), “Evaluating the impact of R&D tax credits on
innovation: A microeconometric study on Canadian firms”, Research Policy 40: 217-229.
Dushnitsky, G. And M.J. Lenox (2005), “When do firms undertake R&D by investing in new
ventures?”, Strategic Management Journal 26: 947-965.
Gelabert, L., A. Fosfuri y J.A. Tribó (2009), "Does the effect of public support depend on the
degree of appropriability?", The Journal of Industrial Economics Vol LVII (4), pp. 736-
767.
González, J., J. Jaumandreu and C. Pazó (2005), "Barriers to innovation and subsidy
effectiveness", Rand Journal of Economics (36 (4), pp. 930-950.
Griffith, R., R. Harrison y H. Simpson. (2010), " Product Market Reform and Innovation in the
EU". Scandinavian Journal of Economics 112:2, 389-415).
Haegeland, T. And J. Moen (2007), “The relationship between the Norwegian R&D tax credit
scheme and other innovation policy instruments”, Reports 2007/45, Statsitics Norway.
Hall, B. and J. Lerner (2009), “The Financing of R&D and Innovation”, chapter 14 in B. Hall
and N. Rosenberg (ed) Handbook of the Economics of Innovation, North Holland.
Huergo, E. y M. Trenado (2008), Determinantes de la solicitud y concesión de créditos blandos.
La empresa española y el apoyo del CDTI a la I+D+i", Documentos de Trabajo 06, Centro
para el Desarrollo Tecnológico Industrial
Hussinger, K. (2008), “R&D and subsidies at the firm level: An application of parametric and
semiparametric two-step selection models”, Journal of Applied Econometrics 23:729-747.
Keuschnigg, Christian & Ribi, Evelyn, 2010. "Profit Taxation, Innovation and the Financing of
Heterogeneous Firms" University of St. Gallen Department of Economics working paper
28
series 2010 2010-01, Department of Economics, University of St. Gallen.and CEPR
Discussion Papers 7626, C.E.P.R.
Lokshin, B. and P. Mohnen (2011), “How effective are level-based R&D tax credits? Evidence
from the Netherlands”, Applied Economics, forthcoming (also as UNU-MERIT Working
Paper 2010-040,
Mañez-Castillejo, J. A., Rochina-Barrachina, M. E., Sanchis-Llopis, A. and Sanchis-Llopis, J.
(2009): “The role of sunk costs in the decision to invest in R&D”, Journal of Industrial
Economics, 57(4).
Marra, M.A. (2008), “Efecto de los incentivos fiscales y subvenciones públicas a la inversión en
I+D+i de las empresas manufactureras españolas”, Hacienda Pública Española/Revista de
Economía Pública 184, 35-66.
OECD (2009), "Innovation in Firms", OECD 2009
OCDE (2011a), “OECD Science, Technology and Industry Scoreboard 2011”, OECD © 2011
OECD (2011b), Testimony by the OECD, US Senate Committee on Finance, September 2011.
Takalo, T., T. Tanayama and O. Toivanen (2011), "Estimating the benefits of targeted R&D
subsidies”, forthcoming in Review of Economics and Statistics,
Takalo, T. and T. Tanayama (2010), “Adverse selection and financing of innovation: is there a
need for R&D subsidies?”, Journal of Technology Transfer 35, 16-41.
Zafar, B. (2011), "Can subjective expectations data be used in choice models? Evidence on
cognitive biases", Journal of Applied Econometrics 26: 520-544.
29
APPENDIX
Table A1. Descriptive Statistics SMEs LARGE
Variable N mean sd min p50 max N mean sd min p50 max
Awareness of constraints obstAll5 3685 .507 .224 0 .523 1 835 .424 .232 0 .428 1
Financially constrained obfin5 3685 .389 .487 0 0 1 835 .241 .428 0 0 1
Lack of personnel obpers5 3685 .133 .340 0 0 1 835 .069 .254 0 0 1
Lack of information obinfor5 3685 .135 .342 0 0 1 835 .082 .275 0 0 1
Dominant firm obdom5 3685 .206 .405 0 0 1 835 .158 .365 0 0 1
Demand risk obddrisk5 3685 .206 .404 0 0 1 835 .134 .340 0 0 1
Appropriability_a protect5 3685 .355 .478 0 0 1 835 .388 .487 0 0 1
Appropriability_b Infocomp 3439 .137 .344 0 0 1 736 .138 .346 0 0 1
Log of Relative productivity* ldistprod 3685 -.331 .822 -13.38 -.309 2.82 835 -.041 .706 -4.719 -.0189 2.333
Share of highly educated employees* humcap 3685 18.65 18.48 0 13 100 835 13.42 14.44 0 9.4 100
Take into account tax incentives plantax 3912 .411 .492 0 0 1 933 .533 .499 0 1 1
Group membership* group5 3685 .237 .425 0 0 1 835 .748 .434 0 1 1
Private domestic firm* privdom5 3685 .927 .258 0 1 1 835 .665 .471 0 1 1
Exporter* bexp5 3685 .711 .452 0 1 1 835 .843 .363 0 1 1
Did in-house R&D* rdin5 3685 .768 .421 0 1 1 835 .717 .450 0 1 1
Log of number of employees* lsize5 3685 3.606 .956 0 3.63 7.15 835 6.00 .717 4.060 5.855 9.232
New firm* new_5 3685 .023 .150 0 0 1 835 .009 .077 0 0 1
Age* age5 3735 22.94 17.85 0 19 166 904 32.95 22.75 0 30 170
Located in technological park park 3912 .020 .143 0 0 1 933 .027 .164 0 0 1
Firm located in Madrid madrid 3912 .077 .267 0 0 1 933 .173 .378 0 0 1
Frim located in Catalonia catal 3912 .296 .456 0 0 1 933 .302 .459 0 0 1
Firm located in Andalusia andal 3912 .052 .222 0 0 1 933 .039 .195 0 0 1
Firm in high tech sector hightec 3912 .097 .296 0 0 1 933 .117 .322 0 0 1
Firm in med-high sector medhigh 3912 .340 .473 0 0 1 933 .305 .460 0 0 1
Firm in med-low sector medlow 3912 .261 .439 0 0 1 933 .270 .444 0 0 1
Note: all variables marked * refer to year 2005; otherwise they refer to the period 2003-2005