The effect of PEG on protein extraction efficiency of FFPE tissues
153
Optimisation of proteomics techniques for archival tumour blocks of a South African cohort of colorectal cancer Sophia Catherine Rossouw A thesis submitted in fulfilment of the requirements for the degree of Doctor Philosophiae in Bioinformatics at the South African National Bioinformatics Institute, University of the Western Cape. 2020 Supervisor: Prof Alan Christoffels Co-supervisor: Dr Jonathan Rigby http://etd.uwc.ac.za/
-
Upload
khangminh22 -
Category
Documents
-
view
6 -
download
0
Transcript of The effect of PEG on protein extraction efficiency of FFPE tissues
Optimisation of proteomics techniques for archival
tumour blocks of a South African cohort of
colorectal cancer
Sophia Catherine Rossouw
A thesis submitted in fulfilment of the requirements for the degree of Doctor
Philosophiae in Bioinformatics at the South African National Bioinformatics
Institute, University of the Western Cape.
2020
Supervisor: Prof Alan Christoffels
Co-supervisor: Dr Jonathan Rigby
http://etd.uwc.ac.za/

Keywords
ii
Optimisation of proteomics techniques for archival tumour blocks of a South
African cohort of colorectal cancer.
by S.C. Rossouw
Keywords
Formalin-fixed paraffin-embedded (FFPE) proteomics
Colorectal cancer (CRC)
FFPE archival tissue
Protein extraction protocol
Protein purification methods
Acetone precipitation and formic acid resolubilisation (APFAR)
Detergent removal plates (DRP)
In-solution digestion
SP3/HILIC-on-bead-digestion
Bottom-up/shotgun mass spectrometry
http://etd.uwc.ac.za/
Abstract
iii
Abstract
Optimisation of proteomics techniques for archival tumour blocks of a South
African cohort of colorectal cancer.
by S.C. Rossouw (PhD Thesis, South African National Bioinformatics Institute,
University of the Western Cape).
Introduction: Tumour-specific protein markers are usually present at elevated
concentrations in patient biopsy tissue; therefore tumour tissue is an ideal biological
material for studying cancer proteomics and biomarker discovery studies. To
understand and elucidate cancer pathogenesis and its mechanisms at the molecular
level, the collection and characterisation of a large number of individual patient tissue
cohorts are required. Since most pathology institutes routinely preserve biopsy tissues
by standardised methods of formalin fixation and paraffin embedment, these
archived, FFPE tissues are important collections of pathology material, often
accompanied by important metadata, such as patient medical history and treatments.
FFPE tissue blocks are conveniently stored under ambient conditions for decades,
while retaining cellular morphology due to the modifications induced by formalin.
However, the effect of long-term storage, at resource-limited institutions in
developing countries, on extractable protein quantity and quality is not yet clear. In
addition, the optimal sample preparation techniques required for accurate,
reproducible results from label-free LC-MS/MS analysis across block ages remains
unclear.
Methods: FFPE human colorectal carcinoma resection samples were used to
determine the optimal protein extraction parameters (tissue/starting material volumes
as well as protein extraction buffer composition and volume) required for accurate
label-free, unfractionated, LC-MS/MS analysis. In addition, three different protein
purification workflows were compared, namely detergent removal columns (DRC) or
plates (DRP), the acetone precipitation and formic acid resolubilisation (APFAR)
method, as well as Single-Pot Solid-Phase-enhanced Sample Preparation (SP3) using
hydrophilic interaction liquid chromatography (HILIC) and magnetic resin. The
effect of archival time (after approximately 1, 5 and 10 years of storage) was also
assessed, as well as the performance of the different sample preparation methods
http://etd.uwc.ac.za/
Abstract
iv
across different sample ages. Data were evaluated in terms of amount of protein
extracted, peptide/protein identifications, method reproducibility and efficiency, and
peptide/protein distribution according to biological processes, cellular components,
and physicochemical properties.
Results: The addition of 0.5% (w/v) PEG 20,000 to the protein extraction buffer
resulted in overall lower peptide and protein identifications (6828 ± 560 for validated
peptides and 1927 ± 125 for validated proteins), compared to buffer without the
addition of PEG (7068 ± 624 for validated peptides and 1952 ± 183 for validated
proteins identified). Furthermore, the total protein yield is significantly (p < 0.0001)
dependent on block age, with older blocks (5 and 10-year-old) yielding less protein
(at 2.46 ± 0.03 mg/ml and 1.65 ± 0.04 mg/ml, respectively) than approximately 1-
year-old blocks (3.82 ± 0.03 mg/ml) (with experiment power = 0.7 and α = 0.05 for n
= 17 per group). Block age differences were also observed in tissue proteome
composition, with greater proteome composition correlation detected between the 5
and 10-year-old blocks processed via the APFAR and DRP methods (r2 values of
0.823 and 0.835, respectively), whereas the HILIC method yielded comparable
relative protein abundances for all block ages. Moreover, the different protein
purification methods generated different results regarding the number of peptides and
proteins identified (with the DRP method having the highest overall peptide and
protein identifications, and the APFAR method having the lowest), and the different
methods also introduces an observable bias with regard to proteome composition (this
bias is also more pronounced for 1-year-old blocks, compared to older blocks).
Differences in PCA variance were also shown, with the DRP method having the
lowest variance (10.73%) between block ages, followed by the HILIC method
(13.68%), and the APFAR method, which has the highest variance at 14.57%. The
APFAR method had the highest overall digestion efficiency (with ≥85% of all
peptides having no missed cleavages), and the HILIC method had the lowest overall
digestion efficiency, with ≥80% of all peptides having no missed cleavages.
Regarding the optimal protein purification technique required for archived tissues, the
DRP and SP3/HILIC methods performed the best, with the SP3/HILIC method
performing consistently across all block ages and requiring less protein (and therefore
less starting material) than the other methods, therefore making it the most sensitive
and efficient protein purification method.
http://etd.uwc.ac.za/
Abstract
v
Conclusions: The results confirm findings of previous studies, in which higher
protein yields (>10 µg) (of FFPE animal tissues and human cells) where found to
compromise the function of PEG 20,000. Therefore, it is demonstrated here that this
effect is also observed in FFPE human colon tissue. Overall, the results indicate that
long-term storage of FFPE tissues (at a resource-limited hospital) does not
significantly interfere with retrospective proteomic analysis. In addition, variations in
pre-analytical factors (spanning a decade), such as tissue harvesting, handling, the
fixation protocol used as well as storage conditions, does not affect protein extraction
and shotgun proteomic analysis to a significant extent.
April 2020
http://etd.uwc.ac.za/

Declaration
vi
Declaration
I declare that Optimisation of proteomics techniques for archival tumour blocks of a
South African cohort of colorectal cancer is my own work (except where
acknowledgements indicate otherwise), that it has not been submitted for any degree
or examination in any other university, and that all the sources I have used or quoted
have been indicated and acknowledged by complete references.
Full name: Sophia Catherine Rossouw April 2020
Signed: ...... .....................
http://etd.uwc.ac.za/
Acknowledgements
vii
Acknowledgements
I would like to particularly thank my mom and Dan for their overall support and help,
and especially thank Dan for his additional help with my project, programming
tutorials and advice. Also, a special thank you to Prof Alan Christoffels for his
support and guidance during this project. I am also very grateful to Dr Hocine
Bendou for his help and input in the data analysis components, Prof Renette Blignaut
for her help with the statistics, and Dr Jonathan Rigby for his co-supervision role and
support. I would also like to thank Mr Charles Gelderbloem, Mr Yunus Kippie, Ms
Audrey Ramplin and the Pharmacy department for technical assistance and support
during the project, as well as Prof Gerhard Walzl and Mrs Andrea Gutschmidt of the
Immunology department at Stellenbosch University for their help and kindness in
offering the use of their lab. Thank you to everyone at SANBI for your help and input
over the years. I am grateful for all the kindness, support and help.
This research project was supervised by Prof Alan Christoffels of the South African
National Bioinformatics Institute (SANBI) at the University of the Western Cape, and
co-supervised by Dr Jonathan Rigby of the Department of Anatomical Pathology in
Tygerberg Hospital at the University of Stellenbosch. This work was financially
supported by the South African Research Chairs Initiative of the Department of
Science and Technology and National Research Foundation of South Africa.
http://etd.uwc.ac.za/
List of abbreviations
viii
List of abbreviations
% (v/v) Percentage volume solute per 100 ml
% (w/v) Percentage gram(s) solute per 100 ml
% (w/w) Percentage gram(s) solute per 100 grams
g Microgram
l Microlitre
m Micron
°C Degrees Celsius
ACN Acetonitrile
AmBic Ammonium bicarbonate
ANOVA Analysis of variance
APFAR Acetone precipitation and formic acid resolubilisation
BCA Bicinchoninic acid
CRC Colorectal cancer
D Kolmogorov-Smirnov test statistic
Da Dalton
DRC Detergent removal columns
DRP Detergent removal plates
ERLIC Electrostatic repulsion hydrophilic interaction chromatography
ESI electrospray ionisation
F F-ratio (test statistic used in ANOVA)
FA Formic Acid
FDR False discovery rate
FFPE Formalin-fixed paraffin-embedded
Fig(s). Figure(s)
http://etd.uwc.ac.za/
List of abbreviations
ix
FNR(s) False negative rate(s)
g Gravity
GO Gene ontology
H Kruskal–Wallis test statistic
H2O water
H&E Haematoxylin and Eosin
HIAR Heat-induced antigen retrieval
HILIC Hydrophilic interaction liquid chromatography
hr(s) hour(s)
HUPO Human Proteome Organisation
IHC Immunohistochemistry
pI Isoelectric point
kDa kilo Dalton
L Litre
LC Liquid chromatography
LC-MS/MS Liquid chromatography coupled to tandem mass spectrometry
LFQ Label-free quantitative/quantitation
MIAPE Minimal information about a proteomics experiment
mg milligram
ml millilitre
mm millimetre
mm2 square millimetre
mm3 cubic millimetre
mM milli-Molar
min(s) minute(s)
MMTS Methyl methanethiosulphonate
MS Mass spectrometry
MS-grade H2O Mass spectrometry-grade water
http://etd.uwc.ac.za/

List of abbreviations
x
MW Molecular weight
NSAF Normalised Spectrum Abundance Factor
PCA Principal component analysis
PCC Pearson’s correlation coefficient
PEG 20,000 Polyethylene glycol 20,000
pH Hydrogen ion concentration
PSI Proteomics Standards Initiative
PSM(s) Peptide spectrum match(es)
PTM(s) Post-translational modification(s)
r2 Pearson correlation coefficient
RPM Revolutions per minute
s Second(s)
SDS Sodium dodecyl sulphate
SP3 Single-Pot Solid-Phase-enhanced Sample Preparation
TCEP Tris(2-carboxyethyl)phosphine
TEAB Triethylammonium bicarbonate
TFA Trifluoroacetic acid
UniProtKB Universal Protein Resource Knowledge Database
W Shapiro–Wilk test statistic
WCPL(s) Whole cell protein lysate(s)
http://etd.uwc.ac.za/
List of figures
xi
List of figures
Figure 1. Schematic representation of the most probable formaldehyde-induced
protein modifications in FFPE tissues.
Figure 2. The effect of formaldehyde fixation on protein structure and
physicochemical properties.
Fig. 3. The detergent removal procedure using ThermoScientific Pierce® Detergent
Removal Resin in spin columns and plates.
Fig. 4. The acetone precipitation and formic acid resolubilisation (APFAR) method.
Fig. 5. The SP3 method workflow.
Fig. 6. A simplified schematic representation of a LC-MS/MS analysis setup.
Fig. 7. The ESI process.
Fig. 8. A generalised product ion series produced by a peptide sequence after
fragmentation via the CID method.
Fig. 9. The three main LC-MS/MS-based proteomics approaches.
Fig. 10. A typical bottom-up (shotgun) tandem mass spectrometry workflow.
Fig. 11. Peptide spectrum matching (PSM) via protein sequence database search.
Fig. 12 The stages of adenomatous polyps in the colon/colorectal region.
Fig. 13. The stages of CRC development.
Figure 14. Colonic adenocarcinoma resection tissue samples.
http://etd.uwc.ac.za/

List of figures
xii
Figure 15. Experimental design and workflow used to evaluate the sample processing
methods.
Figure 16. BCA total protein quantitation assay results.
Figure 17. Total amount of extractable protein.
Figure 18. Comparison of the overall number of peptides and proteins identified for
each sample preparation method (APFAR, DRC, or HILIC) for WCPLs (-PEG) only.
Figure 19. Comparison of the number of peptides and proteins identified using
protein extraction buffer with or without addition of PEG, including the number of
residual proteins remaining in the sample pellets.
Figure 20. The physicochemical properties of peptides extracted under the different
experimental conditions.
Figure 21. Gene Ontology annotation profiles for proteins identified from all
samples/conditions.
Figure 22. The number of missed cleavages for all samples.
Figure 23. Colonic adenocarcinoma resection tissue samples.
Figure 24. Experimental design and workflow used to evaluate the effects of block
age and different sample processing methods.
Figure 25. BCA total protein quantitation assay results for the different block ages.
Figure 26. Comparison of the number of peptides and proteins identified for the
different sample preparation methods for each block age.
http://etd.uwc.ac.za/
List of figures
xiii
Figure 27. Comparison of the qualitative reproducibility of the experimental
conditions in terms of peptide identification overlap for block ages and sample
preparation methods.
Figure 28. Physicochemical properties of identified peptides for all experimental
conditions.
Figure 29. Correlation of protein abundance between all block ages for each patient
sample.
Figure 30. Correlation of protein abundance between all sample preparation methods
for each patient sample.
Figure 31. PCA plots for all block ages and sample preparation methods.
Figure 32. Gene Ontology annotation profiles for proteins identified from all block
ages and sample preparation methods.
Figure 33. The numbers of missed cleavages for all block ages and sample
preparation methods.
Figure 34. Percentages of peptides containing oxidised methionine for all block ages
and sample preparation methods.
Supplementary Figure S1. Comparison of the qualitative reproducibility of the
experimental conditions in terms of peptide identification overlap.
Supplementary Figure S2. Correlation of protein abundance between all conditions
for each patient.
http://etd.uwc.ac.za/
List of tables
xiv
List of tables
Table 1: Information of three FFPE specimens selected for analysis.
Table 2: Peptide separation gradient setup.
Table 3: Data acquisition parameters.
Table 4: Search engine performance evaluation.
Table 5: Protein sequence database evaluation.
Table 6: PTM selection parameters.
Table 7: PTM selection evaluation.
Table 8: Information of the FFPE specimens selected for analysis.
Table 9: Known proteins deregulated in colon cancer
Supplementary table 1. Physicochemical properties of identified peptides for all
conditions for each patient.
Supplementary table 2. Statistical tests for Chapter 3 and 4 data.
http://etd.uwc.ac.za/
Table of contents
xv
Table of contents
Title page………………………………………………………………………………i
Keywords……………………………………………………………………………...ii
Abstract…………………………………………………………………….…………iii
Declaration……………………………………………………………………………vi
Acknowledgements………………………………………………………………….vii
List of abbreviations…………………………………………...……………………viii
List of figures…………………………………………………………………………xi
List of tables………………………………………………………...………………xiv
Chapter 1: Introduction to thesis and research statement…..……………………......18
1.1 Brief summary of the literature………………………………………......18
1.2 Research statement – research rationale………..……………………......19
1.3 Aims and objectives of thesis research project…..……………..……......20
1.4 Thesis overview……………………………….………………..……......21
Chapter 2: Literature review…………………..……………………………………..22
2.1 Formalin-fixed, paraffin-embedded (FFPE) tissue proteomics………….22
2.2 MS analysis in clinical proteomics…………………..…………………..34
2.3 Colorectal cancer (CRC) …………………..………………………..…...47
2.4 Conclusions…………………..…………………………………………..51
Chapter 3: The effect of polyethylene glycol 20,000 on protein extraction
efficiency of formalin-fixed, paraffin-embedded tissues…....……………….52
Abstract…………………..…………………………………………………..52
3.1 Introduction…………………..…………………………………………..53
3.2 Materials and Methods………………….………………………………..56
3.3 Results and discussion……………...……..……………………………..74
3.4 Conclusions…………………...………………………………………….88
Chapter 4: Evaluation of protein purification techniques and effects of storage
duration on LC-MS/MS analysis of archived FFPE human CRC tissues......89
Abstract…………………..…………………………………………………..89
4.1 Introduction…………………..…………………………………………..90
http://etd.uwc.ac.za/
Table of contents
xvi
4.2 Materials and Methods………………….………………………………..92
4.3 Results and discussion……………...……..……………………………100
4.4 Conclusions…………………...………………………………………...122
Chapter 5: Conclusions and recommendations……..……………………………....124
5.1 Key findings and future recommendations……..………………………124
5.2 Concluding remarks……..…………………………...………………....126
References…………………………………………………………………….….....127
Appendix A: Search algorithms specific settings..……………………………........138
Appendix B: Supplementary figures………………………………………..............140
Appendix C: Supplementary table 1………………………………………..............143
Appendix D: Supplementary table 2………………………………………………..144
http://etd.uwc.ac.za/
xvii
Publications from this thesis:
1. Rossouw, S.C., Bendou, H., Blignaut, R.J., Bell, L., Rigby, J., Christoffels, A.G.
(2021). Evaluation of protein purification techniques and effects of storage duration
on LC-MS/MS analysis of archived FFPE human CRC tissues. Pathol. Oncol. Res.
Accepted for publication in 2021.
2. Rossouw, S.C., Bendou, H., Blignaut, R.J., Bell, L., Rigby, J., Christoffels, A.G.
(Approved for peer review). The effect of polyethylene glycol 20,000 on protein
extraction efficiency of FFPE tissues. AJLM. Approved for peer review – awaiting
feedback.
http://etd.uwc.ac.za/
Chapter 1
18
Chapter 1: Introduction to thesis and research statement
1.1 Brief summary of the literature
Formalin-fixed, paraffin-embedded (FFPE) patient biopsy tissue archives are
important collections of pathology material and ideal subject material for proteomic
studies that investigate the molecular features of diseases (Craven et al., 2013; Avaritt
et al., 2014; Bronsert et al., 2014; Gustafsson et al., 2015). This is due to the fact that
these archives are accompanied by patient records and metadata that contain patients’
medical history, disease progression and treatment response, often over decades.
FFPE tissue archives also contain all the disease subtypes and variations among
demographic groups and often contain sufficiently large patient sample cohorts for
statistical significant biomarker studies. For these reasons they are a precious and
important resource for clinical and translational research, retrospective proteomic
studies and biomarker discovery. Over the past two decades, the field of FFPE tissue
proteomics has grown and developed immensely due to the existence and availability
of these vast, untapped archives of FFPE tissue blocks. This has allowed for extensive
development and standardisation in the mass spectrometry-based proteomic field
regarding methods for the analysis of FFPE tissue (Avaritt et al., 2014; Bronsert et
al., 2014; Wiśniewski et al., 2013; Gustafsson et al., 2015). There are, however, pre-
analytical challenges to overcome with FFPE tissue analyses, including the pre-
analysis treatment of the tissue after the biopsy is taken (keeping the tissue “fresh”
before fixation so that necrosis does not occur), variations in fixation time (causing
incomplete/partial fixation or over-fixation of the tissue), and inaccessibility or
degradation of proteins due to inappropriate preservation and/or long-term storage
(Sprung et al., 2009; Wolff et al., 2011; Tanca et al., 2011; Craven et al., 2013;
Gustafsson et al., 2015). The analytical challenges mainly include optimal conditions
for protein extraction as well as optimal analysis conditions during mass spectrometry
(MS) analysis (Magdeldin & Yamamoto, 2012; Avaritt et al., 2014; Wiśniewski et
al., 2013). The optimal conditions and procedures for efficient and reproducible
protein processing from FFPE tissues have not yet been standardised and new
sensitive techniques are continually being developed and improved upon. It is
therefore of great interest to establish an efficient protein processing method, across
http://etd.uwc.ac.za/

Chapter 1
19
various block ages, and also to determine the impact of block age on FFPE blocks
stored at a low-resource government hospital in a developing country (such as South
Africa) with regard to obtainable protein yield and proteomic-level features.
1.2 Research statement – research rationale
Proteins are the products of active genes and influence the molecular pathways in
cells directly, whereas all genes are not active or translated into functional proteins
(Mishra & Verma, 2010). Proteins therefore provide better information about disease
pathology, and proteomics allows for the study and profiling of protein signatures in
tissues, which assists in the process of biomarker discovery. Tumour-specific protein
markers are usually present at elevated concentrations in patient biopsy tissue
(Gustafsson et al., 2015). Therefore, tumour tissue is a desirable biological material
for cancer proteomics investigations, as well as the discovery phases of biomarker
studies. For this purpose, large numbers of individual patient tissue cohorts are
required. Such large volumes of fresh, cryopreserved tissue are often not feasible with
regard to ethics, costs, logistics, and standardised sample collection and
cryopreservation methods. However, most pathology institutes have vast archives of
FFPE tissue samples that are stored at room temperature, thereby removing much of
the cost and difficulty of obtaining fresh cryopreserved tissue.
MS analysis allows for the elucidation and generation of peptide/protein profile
signatures from FFPE patient biopsy tissues as well as protein expression changes
between healthy and disease tissue, and identification of unique protein markers
associated with a disease (Findeisen & Neumaier, 2009; Wiśniewski et al., 2013;
Gustafsson et al., 2015; Wiśniewski et al., 2015). It also offers greater advantages
over traditional antibody–based clinical assays. These advantages include the ability
to identify thousands of peptides from heterogeneous tissues, greater assay
specificity, cost–effectiveness, and time–effectiveness (Findeisen & Neumaier, 2009).
Therefore it has become increasingly necessary to develop and standardise protocols
for the proteomic analysis of FFPE tissues. However, the effect of long-term storage,
at resource-limited institutions in developing countries, on extractable protein
quantity/quality has not yet been investigated. In addition, the optimal sample
preparation techniques required for accurate, reproducible results from label-free LC-
http://etd.uwc.ac.za/
Chapter 1
20
MS/MS analysis across block ages remains unclear. This study aims to improve FFPE
sample preparation methods for label-free, LC-MS/MS analysis and possible future
identification of biomarkers for CRC in South African populations.
1.3 Aims and objectives of thesis research project
The aims of the project were to determine:
(1) The optimal protein extraction protocol (including the optimal protein extraction
buffer – either with or without addition of PEG 20,000) and purification method(s)
across all block ages, as well as
(2) The proteomic-level effects of long-term storage on patient FFPE colorectal
carcinoma resection tissues using label-free mass spectrometry analysis. The project
adopted a phased approach:
1. In the first part of the study, a pilot experiment was performed using 3 patient
cases. The objectives of this pilot study were to establish:
1.1 The volume of tissue and protein extraction buffer required to generate an
adequate protein yield for subsequent unfractionated, label-free LC-MS/MS analysis
1.2 An efficient protein extraction protocol for FFPE tissues – by comparing the
protein extraction efficiency of buffer either with or without the addition of PEG
20,000
1.3 The optimal search engine settings and protein sequence database (for peptide
spectrum matching via a database search) required for data analysis
2. In the second part of the study, 17 patient cases were selected (per experimental
condition) to give a sample size with 70% confidence level (α = 0.05) based on the
previous study’s results. The objectives were to determine:
2.1 The most efficient and reproducible sample preparation/protein purification
method required at different block ages, for 1, 5 and 10-year-old FFPE tissue samples
2.2 The proteomic-level effects of long-term storage of FFPE tissue blocks at a
resource-limited pathology archive
http://etd.uwc.ac.za/
Chapter 1
21
1.4 Thesis overview
Chapter 2: Literature review.
A literature review of FFPE tissue fixation dynamics, challenges and advantages with
regards to proteomic analysis.
Chapter 3: The effect of polyethylene glycol 20,000 on protein extraction
efficiency of formalin-fixed, paraffin-embedded tissues.
This study established the optimal tissue and protein extraction buffer volumes
required for accurate label-free LC-MS/MS analysis and demonstrated that the
absence of PEG 20,000 increases the number of peptides and proteins identified by
unfractionated LC-MS/MS analysis.
Chapter 4: Evaluation of protein purification techniques and effects of storage
duration on LC-MS/MS analysis of archived FFPE human CRC tissues.
This study evaluated the protein extraction efficiency of 1, 5 and 10-year old human
colorectal carcinoma resection tissues and assessed three different gel-free sample
preparation/protein purification methods for label-free LC-MS/MS analysis. The
results found that the protein yield (mg/ml) is significantly dependent on block age,
with older blocks yielding less protein than newer blocks. Block age also impacted on
tissue proteome composition. Additionally, the different protein purification methods
generated different results regarding the number of peptides and proteins identified,
sample proteome composition, differences in reproducibility in terms of peptide
identification overlap, PCA variance, as well as protocol digestion efficiency.
Overall, it was found that the DRP and HILIC methods performed the best.
Chapter 5: Conclusions and future prospects.
http://etd.uwc.ac.za/
Chapter 2
22
Chapter 2: Literature review
This study had access to human colorectal carcinoma resection samples, and since
tumour-specific protein markers are present at elevated concentrations in patient
tissues, this makes it a desirable biological material for cancer proteomics studies.
Since FFPE tissue samples can be stored at room temperature, it removes most of the
cost and difficulty of obtaining fresh cryopreserved tissue. However, formalin-
fixation poses some challenges with regard to tissue proteome analysis. The
advantages and challenges of FFPE tissue proteomics are discussed, as well as FFPE
sample preparation methods for label-free, LC-MS/MS analysis, with a brief
introduction to MS data analysis and colorectal cancer (CRC).
2.1 Formalin-fixed, paraffin-embedded (FFPE) tissue proteomics
2.1.1 The formalin-fixation process
Tissues from biopsies, resections and/or surgery are routinely taken from patients as a
treatment option and/or to facilitate more accurate diagnosis. The current universal
tissue preservation method of choice is formalin-fixation and paraffin-embedment, to
avoid tissue auto-proteolysis and putrefaction, and to allow tissue specimens to be
analysed and examined at a later stage (Stanta, 2011; Avaritt et al., 2014; Bronsert et
al., 2014; Gustafsson et al., 2015). Formalin-fixation is also considered to be a
superior preservative, since formaldehyde quickly and easily penetrates and fixes
tissues because of its small molecular size, it causes minimal tissue shrinkage and
distortion, and produces exceptional staining results in histopathology (Klockenbusch
et al., 2012; Magdeldin & Yamamoto, 2012; Gustafsson et al., 2015). The FFPE
method of tissue preservation also allows for the indefinite room temperature storage
of FFPE blocks, thereby removing much of the cost and difficulty associated with
fresh-cryopreserved tissue storage. The technique involves the immersion and
incubation of tissues in formaldehyde solution, which is then replaced with alcohol
(ethanol) in a dehydration step. Dehydration of the sample is achieved by removing
all the water from the sample via ethanol incubation and subsequent alcohol clearing
with xylene incubation. The xylene is then replaced by molten paraffin, which
http://etd.uwc.ac.za/
Chapter 2
23
infiltrates the sample. The final step involves paraffin-embedding and hardening of
the sample, which involves embedment of the specimen into liquid embedding
material such as wax. Samples are then stored and archived for future use (Daniele et
al., 2011; Bronsert et al., 2014; Gustafsson et al., 2015).
During the formalin-fixation process, the formaldehyde solution penetrates the tissue
and reacts by cross-linking cellular molecules such as nucleic acids, polysaccharides,
and amino acids including lysine, arginine, histidine and cysteine. Several aspects of
the formaldehyde-protein interactions have still not been resolved (Klockenbusch et
al., 2012; Magdeldin & Yamamoto, 2012; Maes et al., 2013; Gustafsson et al., 2015).
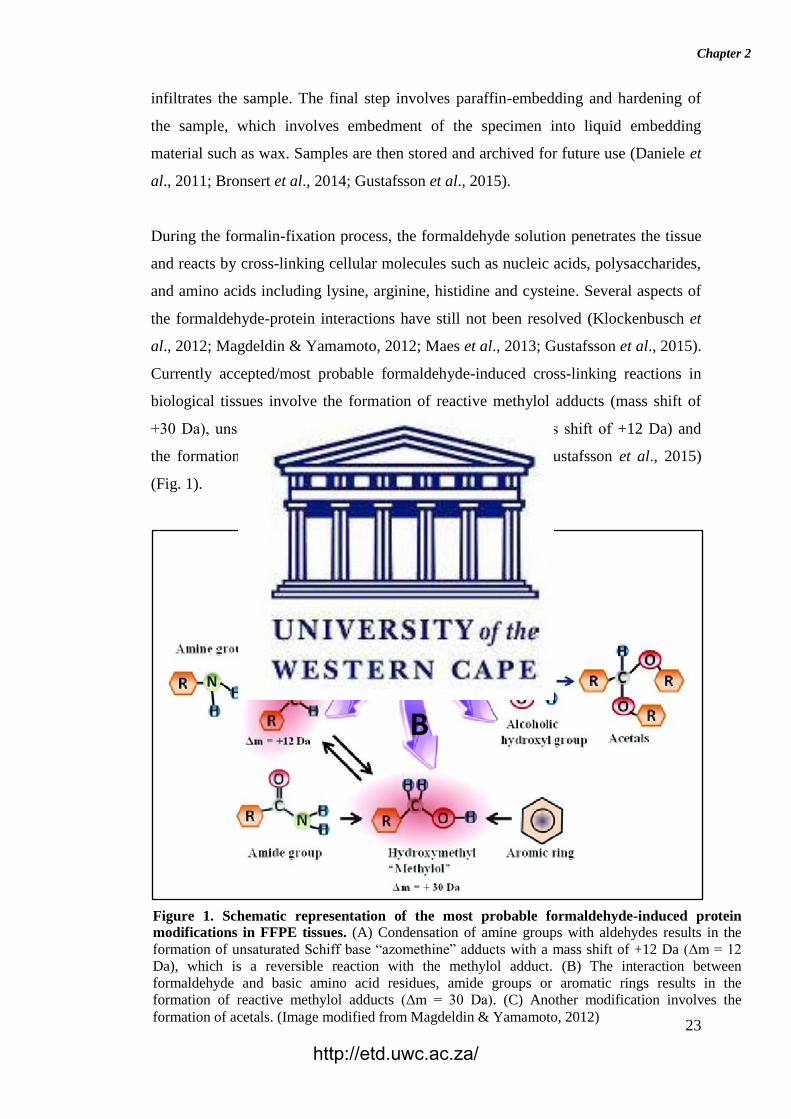
Currently accepted/most probable formaldehyde-induced cross-linking reactions in
biological tissues involve the formation of reactive methylol adducts (mass shift of
+30 Da), unsaturated Schiff base “azomethine” adducts (mass shift of +12 Da) and
the formation of acetals (Magdeldin & Yamamoto, 2012; Gustafsson et al., 2015)
(Fig. 1).
Figure 1. Schematic representation of the most probable formaldehyde-induced protein
modifications in FFPE tissues. (A) Condensation of amine groups with aldehydes results in the
formation of unsaturated Schiff base “azomethine” adducts with a mass shift of +12 Da (Δm = 12
Da), which is a reversible reaction with the methylol adduct. (B) The interaction between
formaldehyde and basic amino acid residues, amide groups or aromatic rings results in the
formation of reactive methylol adducts (Δm = 30 Da). (C) Another modification involves the
formation of acetals. (Image modified from Magdeldin & Yamamoto, 2012)
http://etd.uwc.ac.za/
Chapter 2
24
Formaldehyde cross-linking of proteins may be initiated through the creation of a
hydroxymethyl-methylol adduct when the aldehyde group in formaldehyde reacts
with primary amines (nucleophilic groups) in proteins, followed by water elimination
to form a Schiff base (Fig. 1). A subsequent nucleophilic substitution reaction,
between the methylene carbon of the Schiff base and a nucleophile in the amino acid
residue, forms a methylene bridge. The resulting methylene bridge links two peptide
sequences and therefore also adds to the total molecular weight of the modified
protein (Klockenbusch et al., 2012; Magdeldin & Yamamoto, 2012; Maes et al.,
2013; Gustafsson et al., 2015). In addition to these reactions, primary amines can
react with hydroxyl groups to create acetals or alternatively with aromatic rings,
creating hydroxymethyl groups, which are further involved in cross-linking reactions.
The same or different peptides can also react through an amide moiety to form stable
methylene diamide bridges in a secondary consolidation process. However, even
though studies involved in elucidating formalin-fixation reactions with proteins have
made significant progress, the detailed chemical modifications that occur in FFPE
tissue still requires extensive experimental research. And since FFPE tissue blocks
are molecularly more complex than the chemical models studied so far, additional
work is required to explain the extent of formaldehyde cross-linking in these blocks
(Magdeldin & Yamamoto, 2012; Fowler et al., 2013; Avaritt et al., 2014; Gustafsson
et al., 2015).
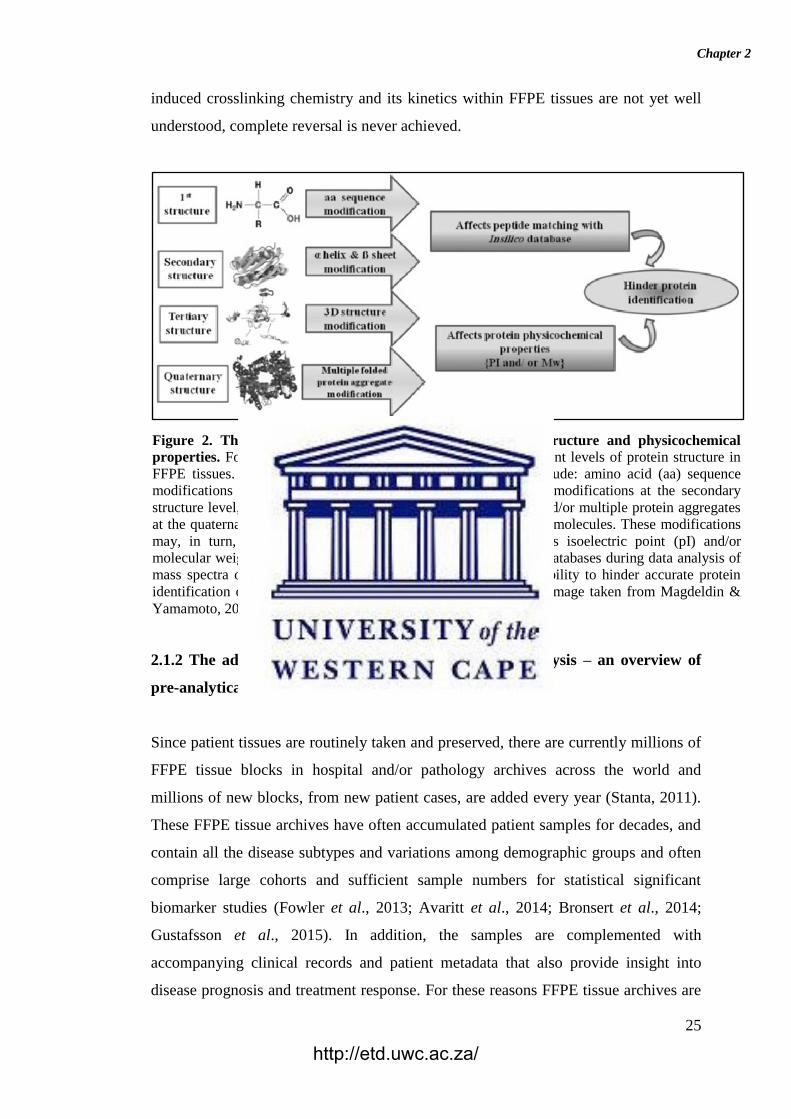
Studies have found that formaldehyde also induces protein modifications on different
levels in FFPE tissues (Magdeldin & Yamamoto, 2012; Fowler et al., 2013; Avaritt et
al., 2014). These modifications occur at the primary, secondary, tertiary as well as
quaternary protein structure (Fig. 2). Therefore, in addition to changing protein
molecular weight (MW), formaldehyde-induced modifications may also affect protein
physicochemical properties such as the isoelectric point (pI) and/or hydropathicity.
However, more research is required to explain the extent of formaldehyde cross-
linking and its effects on FFPE tissue blocks. Successful proteomic analyses of FFPE
tissues is highly dependent upon the efficient cleavage of the formaldehyde-induced
cross-links and complete reversal of these formaldehyde-induced protein
modifications (Klockenbusch et al., 2012; Magdeldin & Yamamoto, 2012; Maes et
al., 2013; Gustafsson et al., 2015). However, since the full extent of formaldehyde-
http://etd.uwc.ac.za/
Chapter 2
25
induced crosslinking chemistry and its kinetics within FFPE tissues are not yet well
understood, complete reversal is never achieved.
2.1.2 The advantages and challenges of FFPE tissue analysis – an overview of
pre-analytical and analytical factors
Since patient tissues are routinely taken and preserved, there are currently millions of
FFPE tissue blocks in hospital and/or pathology archives across the world and
millions of new blocks, from new patient cases, are added every year (Stanta, 2011).
These FFPE tissue archives have often accumulated patient samples for decades, and
contain all the disease subtypes and variations among demographic groups and often
comprise large cohorts and sufficient sample numbers for statistical significant
biomarker studies (Fowler et al., 2013; Avaritt et al., 2014; Bronsert et al., 2014;
Gustafsson et al., 2015). In addition, the samples are complemented with
accompanying clinical records and patient metadata that also provide insight into
disease prognosis and treatment response. For these reasons FFPE tissue archives are
Figure 2. The effect of formaldehyde fixation on protein structure and physicochemical
properties. Formaldehyde induces protein modifications on different levels of protein structure in
FFPE tissues. These probable changes that proteins undergo include: amino acid (aa) sequence
modifications at the primary structure level, α-helix and β-sheet modifications at the secondary
structure level, 3-D structural modifications at the tertiary level, and/or multiple protein aggregates
at the quaternary level due to formaldehyde cross-linking between molecules. These modifications
may, in turn, affect protein physicochemical properties, such as isoelectric point (pI) and/or
molecular weight (MW), as well as peptide matching to in sillico databases during data analysis of
mass spectra obtained. Formaldehyde fixation therefore has the ability to hinder accurate protein
identification of FFPE samples analysed via mass spectrometry. (Image taken from Magdeldin &
Yamamoto, 2012)
http://etd.uwc.ac.za/
Chapter 2
26
a precious and important resource for clinical and translational research, retrospective
proteomic studies and biomarker discovery.
Tumour tissue represents the ideal biological material for cancer proteomics studies
and biomarker discovery, since tumour-specific protein markers are typically present
at elevated concentrations in patient biopsy tissue (Maes et al., 2013; Gustafsson et
al., 2015). However, freshly-frozen cryopreserved tissue poses challenges with regard
to required resources, standardised sample collection, cryopreservation and logistical
constraints that significantly increase research costs. In contrast, FFPE samples are
easily stored and obtainable, therefore requiring fewer resources to maintain FFPE
sample archives.
Moreover, Fu et al. (2013) found that formalin-fixation was a better long-term
storage option for tissue compared to cryopreservation. They investigated the effects
of applying different heating and pressure settings on the quality of proteins
extracted, using dounce homogenisation of tissues in 100 mM Tris–HCl (pH 8.0) and
100 mM DTT buffer with subsequent addition of SDS (to a final SDS concentration
of 4%). They found that the quality of proteins extracted from cryopreserved tissue
(snap frozen and stored at -80 ºC, either for 3 months or 2 years) were inferior to that
of FFPE blocks (stored for either 3 months or 15 years) with regards to protein
recovery and protein identifications. Therefore, combined with the problems
associated with fresh/cryopreserved tissue storage and handling, FFPE tissue is
considered a good alternative to fresh/cryopreserved tissue. For these reasons,
techniques (such as mass spectrometry (MS)-based proteomics) required to access
proteomic information from FFPE tissues and determine changes (or similarities) in
the proteome composition of tumour vs. healthy tissues have been extensively
developed and standardised in the last decade (Fowler et al., 2013; Avaritt et al.,
2014; Bronsert et al., 2014; Wiśniewski et al., 2013; Gustafsson et al., 2015). Even
with all the advantages that FFPE tissues possess, FFPE tissue analyses presents
many challenges, including pre-analytical as well as analytical factors that influence
downstream results (Maes et al., 2013; Thompson et al., 2013; Piehowski et al.,
2018).
http://etd.uwc.ac.za/
Chapter 2
27
2.1.2.1 The impact of pre-analytical factors on FFPE tissue proteomics results
The pre-analysis handling and treatment of the tissue, includes minimising ischaemic
time and keeping the tissue “fresh” after surgery/biopsy and before fixation, so that
necrosis/putrefaction does not occur. Other pre-analytical factors include proper
fixation and storage of the tissue (minimising significant temperature fluctuations and
light exposure during storage) as well as storage duration (Daniele et al., 2011;
Thompson et al., 2013; Maes et al., 2013; Bass et al., 2014). Proper fixation of the
tissue, such as ensuring that the tissue specimen size is right (not too large for proper
formalin penetration) and keeping the fixation time optimal, significantly impacts on
downstream protein analysis. Variations in fixation time may cause incomplete or
partial fixation of the tissue (leading to degradation of proteins during storage) and
extended periods of fixation leads to over-fixation, which increases the extent of
formalin-induced molecule cross-linking and protein modification, making it
increasingly difficult to access proteins in their original biological form (Sprung et
al., 2009; Tanca et al., 2011; Wolff et al., 2011). The impact of storage time on the
number of proteins identified via label-free LC-MS/MS from FFPE colon adenoma
tissue samples was evaluated by Sprung et al. (2009) and they found no significant
difference even from tissues that had been stored for up to 10 years. Similarly,
Craven et al. (2011) found no significant difference in protein identifications from
FFPE kidney tissue (normal and tumour) samples that were stored up to 10 years.
During the completion of this thesis, Piehowski et al. (2018) published their work in
which they used tandem mass tag labelling and high pH fractionation to evaluate the
impact of storage time on FFPE ovarian adenocarcinoma specimens (as old as 32
years) and found an overall decline in identifiable peptides and phosphopeptides due
to the formalin fixation process but no further decline/degradation due to storage
duration. Even though the aforementioned studies focused on storage duration/block
age, to our knowledge there is no evidence to demonstrate the outcome of different
protein purification techniques on older samples. There remains a need to provide
empirical evidence for the impact of storage duration and conditions within the
context of a resource-limited environment, such as the Anatomical Pathology
department at Tygerberg Hospital (Western Cape, South Africa).
http://etd.uwc.ac.za/
Chapter 2
28
2.1.2.2 The impact of analytical factors on FFPE tissue proteomics results
The main analytical factors that determine the successful outcome of a FFPE tissue
shotgun MS proteomics experiment can be divided into factors that are required for
robust and efficient protein extraction and factors required for effective protein
purification, protein digestion and sample clean-up for LC-MS/MS analysis.
Requirements for efficient protein extraction from FFPE tissues
One of the major analytical challenges in FFPE tissue proteomics is the efficient
extraction of proteins from these samples (Magdeldin & Yamamoto, 2012; Fowler et
al., 2013; Avaritt et al., 2014; Wiśniewski et al., 2013). Strategies that have been
employed to facilitate efficient protein extraction include the use of strong detergents,
hydrophilic synthetic polymers (such as PEG 20,000 – discussed in more detail in
chapter 3) as well as heat-induced antigen retrieval (HIAR).
Shi et al. (1991) developed HIAR, which is a superior IHC staining technique, and
involves the incubation of FFPE tissue sections in a suitable buffer (the constituents
of which depends on the experimental aims to be achieved, in their case an IHC
study) (after deparaffinisation and rehydration steps) at a high temperature (90 –
120°C) for up to several hours. The high temperature incubation denatures the
proteins in the FFPE tissue, causing them to unfold and lose their conformations and,
in so doing, also breaks the formaldehyde-induced cross-links. The HIAR process is
stabilised by selecting an appropriate buffer and pH, which is optimal for most
biological reactions (pH 6 to 8), water-soluble and able to stabilise proteins (by
keeping the pH of the buffer solution within 1.0 pH unit of the proteins’ isoelectric
point). HIAR is usually followed by additional sample preparation methods to allow
for efficient tryptic digestion to generate peptides that are analysed via MS. The
HIAR technique has been successfully and extensively employed in FFPE tissue
proteomics, with many research groups also aiming to improve upon it or adapting
variations of it (Magdeldin & Yamamoto, 2012; Fowler et al., 2013; Avaritt et al.,
2014; Gustafsson et al., 2015).
http://etd.uwc.ac.za/
Chapter 2
29
The detergent of choice for total tissue solubilisation and protein extraction is sodium
dodecyl sulphate (SDS) (Wiśniewski et al., 2009; Botelho et al., 2010; Pellerin et al.,
2015). Shi et al. (2006) found that 2% SDS is a critical chemical component for the
successful extraction of protein from FFPE tissue sections, as well as heating or
boiling (HIAR method) the samples in extraction buffer (at not more than 100˚C).
Other studies found similar results; with Speers & Wu (2007) recommending the use
of a buffer with greater than 1% SDS, while Wiśniewski et al. (2009) recommends a
concentration of 4% SDS for maximal protein extraction (Kachuk et al., 2015). SDS
is a powerful anionic detergent that disrupts cell membranes, disaggregates protein
complexes, and denatures and solubilises proteins. It does this by binding to amino
acids via hydrophobic and ionic interactions, thereby altering the protein’s spatial
conformational structure. This inhibits proteases from accessing protein cleavage
sites (which have become distorted through SDS binding) and also inhibits protease
activity by changing enzyme conformational structure (through SDS binding)
(Wiśniewski et al., 2009; Botelho et al., 2010; Pellerin et al., 2015). Unfortunately,
SDS usage has many analytical disadvantages that have to be addressed while
preparing a sample for MS analysis. Due to its interactions with proteins, SDS
strongly inhibits trypsin (enzyme) activity, even at very low concentrations, thereby
limiting protein identification. In addition, SDS alters the chromatographic separation
of peptides and also interferes with electrospray ionisation (ESI) mass spectrometry
by dominating mass spectra and significantly suppressing analyte ion signals (due to
SDS being readily ionisabile and being present in greater abundances than individual
peptide ions). For these reasons, SDS must be completely depleted from a sample
before enzymatic digestion and LC-ESI MS/MS analysis (Wiśniewski et al., 2009;
Botelho et al., 2010; Kachuk et al., 2015; Pellerin et al., 2015).
Protein purification, digestion and sample preparation for LC-MS/MS analysis
Shotgun MS analysis requires a relatively simplified, purified and homogenous
peptide sample for generation of spectra (Aguilar, 2004). Therefore, the upstream
sample processing of biological samples requires a combination of techniques to
ensure that a purified homogenous peptide sample is produced (Aguilar, 2004). For
this purpose, various sample preparation methods are used to remove detergents and
contaminants that are not compatible with protein digestion and MS analysis.
http://etd.uwc.ac.za/
Chapter 2
30
FFPE samples taken from patients for diagnosis are usually very small, and therefore
there is a limited amount of starting material available for analysis. SDS removal with
minimal sample loss is a challenging task and several gel-free approaches have been
proposed over the years. Of interest to this current study are sample purification
approaches that include the use of detergent removal resin (ThermoFisher Scientific,
2017), or protein precipitation with organic solvents, such as the acetone precipitation
and formic acid resolubilisation (APFAR) method (Botelho et al., 2010; Doucette et
al., 2014; Kachuk et al., 2015), and/or methods using hydrophilic interaction liquid
chromatography (HILIC) and magnetic resin (such as the Single-Pot Solid-Phase-
enhanced Sample Preparation (SP3) method) (Hughes et al., 2014; Hughes et al.,
2019) in the sample processing workflow prior to LC-MS/MS.
The detergent removal columns/plates contain a proprietary detergent removal resin,
which facilitates the removal of commonly used detergents, such as SDS, from a
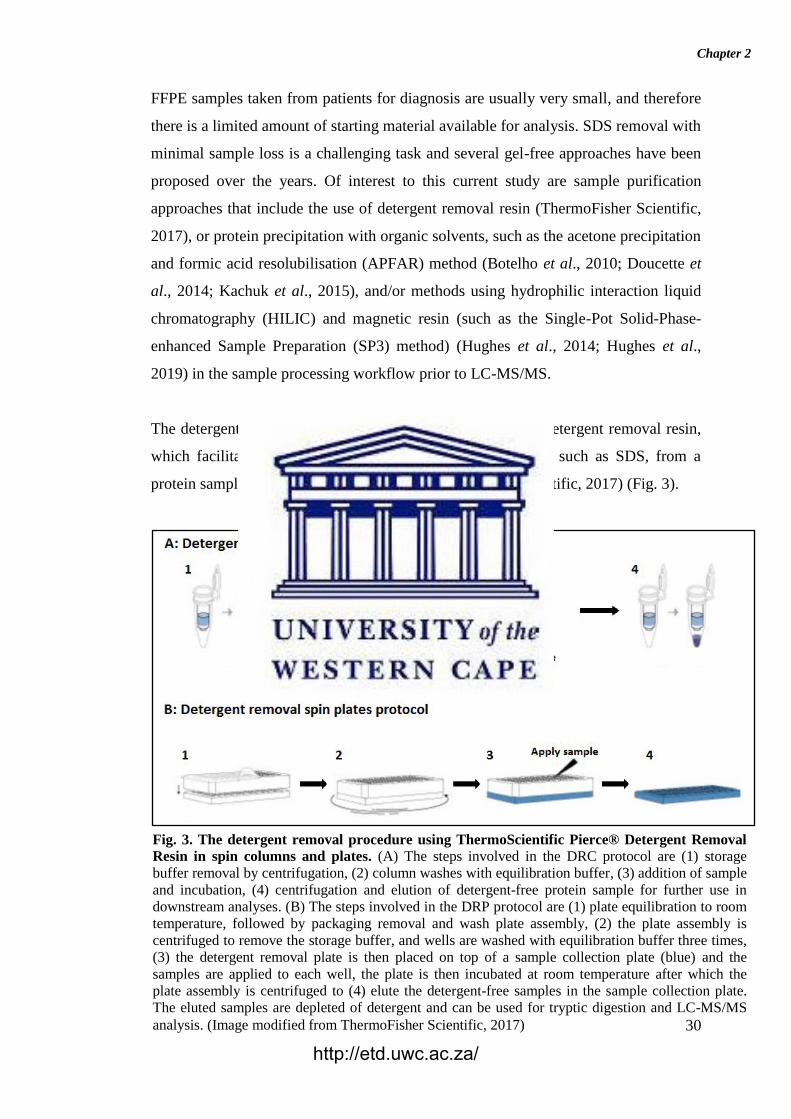
protein sample with minimal sample loss (ThermoFisher Scientific, 2017) (Fig. 3).
Fig. 3. The detergent removal procedure using ThermoScientific Pierce® Detergent Removal
Resin in spin columns and plates. (A) The steps involved in the DRC protocol are (1) storage
buffer removal by centrifugation, (2) column washes with equilibration buffer, (3) addition of sample
and incubation, (4) centrifugation and elution of detergent-free protein sample for further use in
downstream analyses. (B) The steps involved in the DRP protocol are (1) plate equilibration to room
temperature, followed by packaging removal and wash plate assembly, (2) the plate assembly is
centrifuged to remove the storage buffer, and wells are washed with equilibration buffer three times,
(3) the detergent removal plate is then placed on top of a sample collection plate (blue) and the
samples are applied to each well, the plate is then incubated at room temperature after which the
plate assembly is centrifuged to (4) elute the detergent-free samples in the sample collection plate.
The eluted samples are depleted of detergent and can be used for tryptic digestion and LC-MS/MS
analysis. (Image modified from ThermoFisher Scientific, 2017)
http://etd.uwc.ac.za/
Chapter 2
31
Figure 3 shows the different steps involved in removing commonly used detergents
and surfactants from a sample, using either detergent removal columns (DRC) or 96-
well detergent removal filter plates (DRP). The DRC protocol (Fig. 3 A) involves
centrifugation of the column to remove the storage buffer, which is then discarded.
This is followed by column washes with equilibration buffer. The sample containing
the detergent to be removed is then added to the column and incubated, after which
the column is centrifuged to elute the detergent-free protein sample. The sample is
now ready for further use in downstream sample processing for LC-MS/MS. The
ThermoScientific Pierce® Detergent Removal Spin Plate (DRP) protocol allows for
multiple samples to be processed, using the same high-performance resin of the DRC
protocol. The DRP protocol (Fig. 3 B) involves equilibration of the spin plate to room
temperature, followed by removal of the sealing material from the bottom of the
plate. The plate is then placed on top of a wash plate and the sealing material from the
top of the detergent removal plate is removed. The plate assembly is then centrifuged
to remove the storage buffer, and the flow-through discarded. This is followed by
washing the plate’s wells with equilibration buffer three times. The detergent removal
plate is then placed on top of a sample collection plate (blue) by aligning the
alphanumeric indices on the plate. The samples (25-100μL per well) are added to the
centre of the resin beds in each well, and the plate is incubated at room temperature.
The plate assembly is then centrifuged and the detergent-free samples are collected in
the sample collection plate. After detergent removal, the eluted samples are depleted
of detergent and can be used for tryptic digestion and LC-MS/MS analysis
(ThermoFisher Scientific, 2017). For both protocols, the high-performance column
resin can remove detergents that are at concentrations between 1-5%, with greater
than 95% efficiency. In addition, the detergent removal columns and plates provide
high protein/peptide recovery for samples.
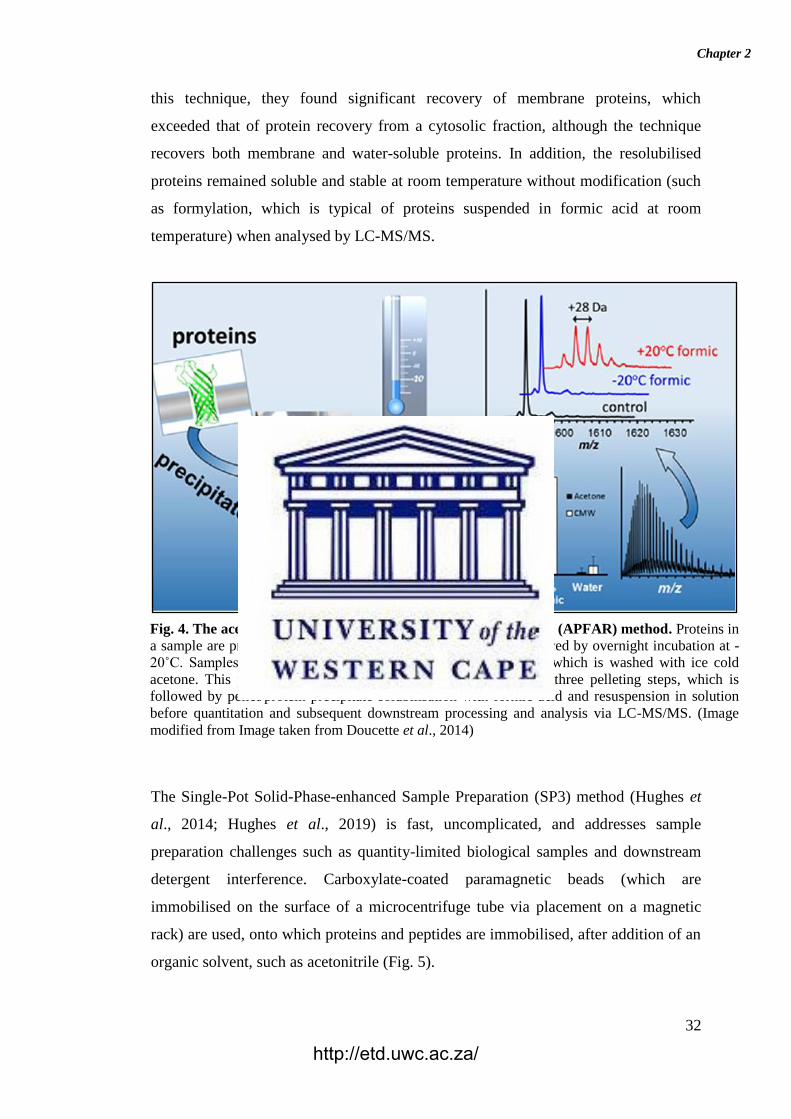
Another effective strategy to deplete SDS in a protein sample (prior to tryptic
digestion and/or LC-MS/MS analysis) is the precipitation of proteins in the sample by
addition of an organic solvent (Botelho et al., 2010; Doucette et al., 2014; Kachuk et
al., 2015). The latest advancement in this technique, made by Doucette et al. (2014),
involves protein precipitation in acetone followed by resolubilisation of the
precipitated proteins with ice cold (-20°C) formic acid and dilution in water for
storage (-20°C) before further processing and LC-MS/MS analysis (Fig. 4). By using
http://etd.uwc.ac.za/
Chapter 2
32
this technique, they found significant recovery of membrane proteins, which
exceeded that of protein recovery from a cytosolic fraction, although the technique
recovers both membrane and water-soluble proteins. In addition, the resolubilised
proteins remained soluble and stable at room temperature without modification (such
as formylation, which is typical of proteins suspended in formic acid at room
temperature) when analysed by LC-MS/MS.
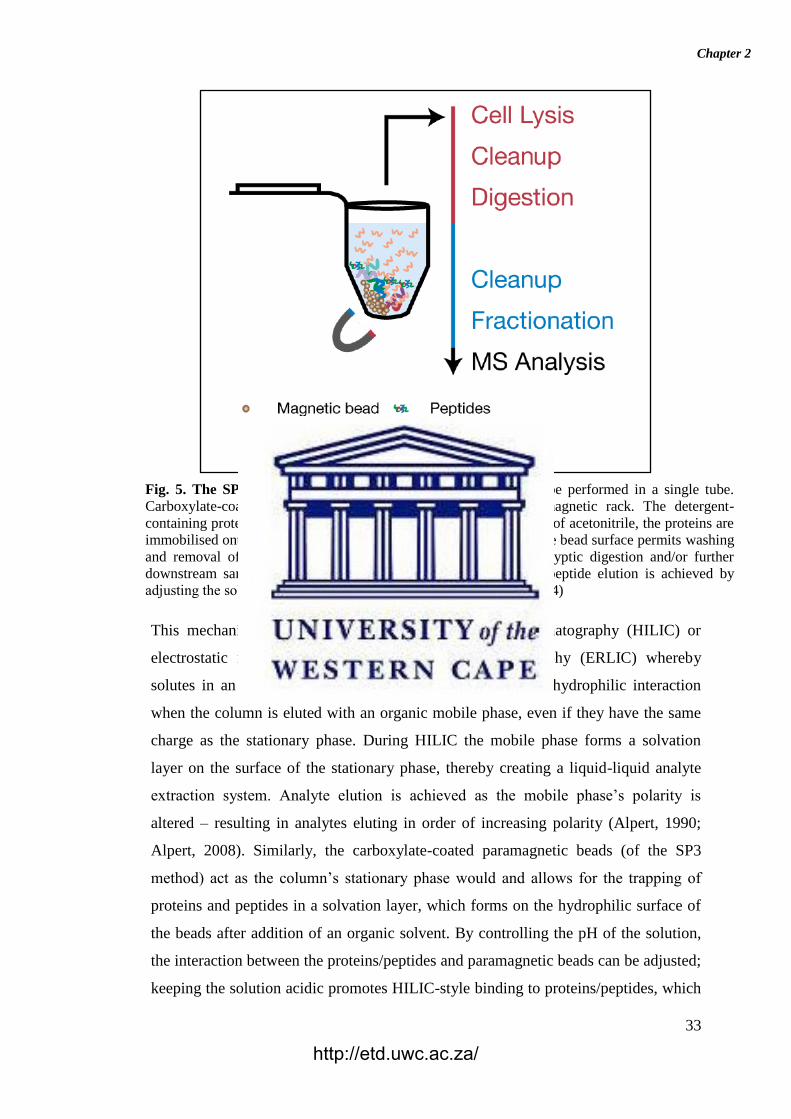
The Single-Pot Solid-Phase-enhanced Sample Preparation (SP3) method (Hughes et
al., 2014; Hughes et al., 2019) is fast, uncomplicated, and addresses sample
preparation challenges such as quantity-limited biological samples and downstream
detergent interference. Carboxylate-coated paramagnetic beads (which are
immobilised on the surface of a microcentrifuge tube via placement on a magnetic
rack) are used, onto which proteins and peptides are immobilised, after addition of an
organic solvent, such as acetonitrile (Fig. 5).
Fig. 4. The acetone precipitation and formic acid resolubilisation (APFAR) method. Proteins in
a sample are precipitated by the addition of ice cold acetone, followed by overnight incubation at -
20˚C. Samples are centrifuged to collect the precipitated protein, which is washed with ice cold
acetone. This precipitation process is repeated for approximately three pelleting steps, which is
followed by pellet/protein precipitate solubilisation with formic acid and resuspension in solution
before quantitation and subsequent downstream processing and analysis via LC-MS/MS. (Image
modified from Image taken from Doucette et al., 2014)
http://etd.uwc.ac.za/
Chapter 2
33
This mechanism is similar to hydrophilic interaction chromatography (HILIC) or
electrostatic repulsion hydrophilic interaction chromatography (ERLIC) whereby
solutes in an ion-exchange column can be retained through hydrophilic interaction
when the column is eluted with an organic mobile phase, even if they have the same
charge as the stationary phase. During HILIC the mobile phase forms a solvation
layer on the surface of the stationary phase, thereby creating a liquid-liquid analyte
extraction system. Analyte elution is achieved as the mobile phase’s polarity is
altered – resulting in analytes eluting in order of increasing polarity (Alpert, 1990;
Alpert, 2008). Similarly, the carboxylate-coated paramagnetic beads (of the SP3
method) act as the column’s stationary phase would and allows for the trapping of
proteins and peptides in a solvation layer, which forms on the hydrophilic surface of
the beads after addition of an organic solvent. By controlling the pH of the solution,
the interaction between the proteins/peptides and paramagnetic beads can be adjusted;
keeping the solution acidic promotes HILIC-style binding to proteins/peptides, which
Fig. 5. The SP3 method workflow. The entire SP3 method can be performed in a single tube.
Carboxylate-coated paramagnetic beads are immobilised on a magnetic rack. The detergent-
containing protein extract is added to the tube and upon the addition of acetonitrile, the proteins are
immobilised onto the paramagnetic beads. This immobilization on the bead surface permits washing
and removal of detergents and contaminating substances before tryptic digestion and/or further
downstream sample processing and LC-MS/MS analysis. Protein/peptide elution is achieved by
adjusting the solution’s pH. (Image modified from Hughes et al., 2014)
http://etd.uwc.ac.za/
Chapter 2
34
allows for detergent removal, whereas increasing the pH of the solution makes it
basic and causes ERLIC-style repulsion between the proteins/peptides and the
negatively charged carboxylate groups on the beads’ surface resulting in elution of
the proteins/peptides from the beads. Therefore, the entire SP3 process can be
performed in a single tube (as shown in figure 5), providing a rapid and efficient
means of proteomic sample preparation (Hughes et al., 2014; Hughes et al., 2019).
2.2 MS analysis in clinical proteomics
Since the proteome is the cellular workforce of an organism, its complete
characterisation is important to understand the underlying biological phenomena and
processes within an organism (Aebersold & Mann, 2003; Nahnsen et al., 2013; Zhang
et al., 2013; Kumar et al., 2017). MS analysis has developed over the last two
decades into the analytical method of choice for most proteomics studies. MS
analysis allows for the elucidation and generation of peptide/protein profile signatures
from FFPE patient biopsy tissues as well as protein expression changes between
healthy and disease tissue. It also enables identification of unique protein markers
associated with a disease (Findeisen & Neumaier, 2009; Wiśniewski et al., 2013;
Gustafsson et al., 2015; Wiśniewski et al., 2015).
The clinical proteomics approach can be defined as the use of proteomics techniques,
together with bioinformatics tools, to investigate disease-associated changes in
peptide and protein profile patterns for diagnostic purposes (Findeisen & Neumaier,
2009). Since the vast improvements made in MS instrumentation over the last few
decades, the proteomics field has also significantly progressed together with the
development of biomarker discovery approaches using MS-based techniques. These
advances can be grouped into three main approaches, namely protein or peptide
profiling methods, non-gel-based methods, and gel-based or two-dimensional gel
electrophoresis methods. However, only protein or peptide profiling and non-gel-
based methods are applicable for clinical proteomics approaches, since these methods
offer the greatest reproducibility and high-throughput capabilities (Findeisen &
Neumaier, 2009). This study will focus on non-gel-based LC-MS/MS approaches for
peptide/protein identification, characterisation, and quantification.
http://etd.uwc.ac.za/
Chapter 2
35
2.2.1 Liquid chromatography coupled to tandem MS (LC-MS/MS)–based
analysis
Liquid chromatography coupled to tandem mass spectrometry (LC-MS/MS) is a
powerful analytical chemistry technique, which combines the capability of liquid
chromatography to separate complex analyte mixtures with the highly sensitive and
selective mass analysis capabilities of mass spectrometry (Shen & Noon, 2004;
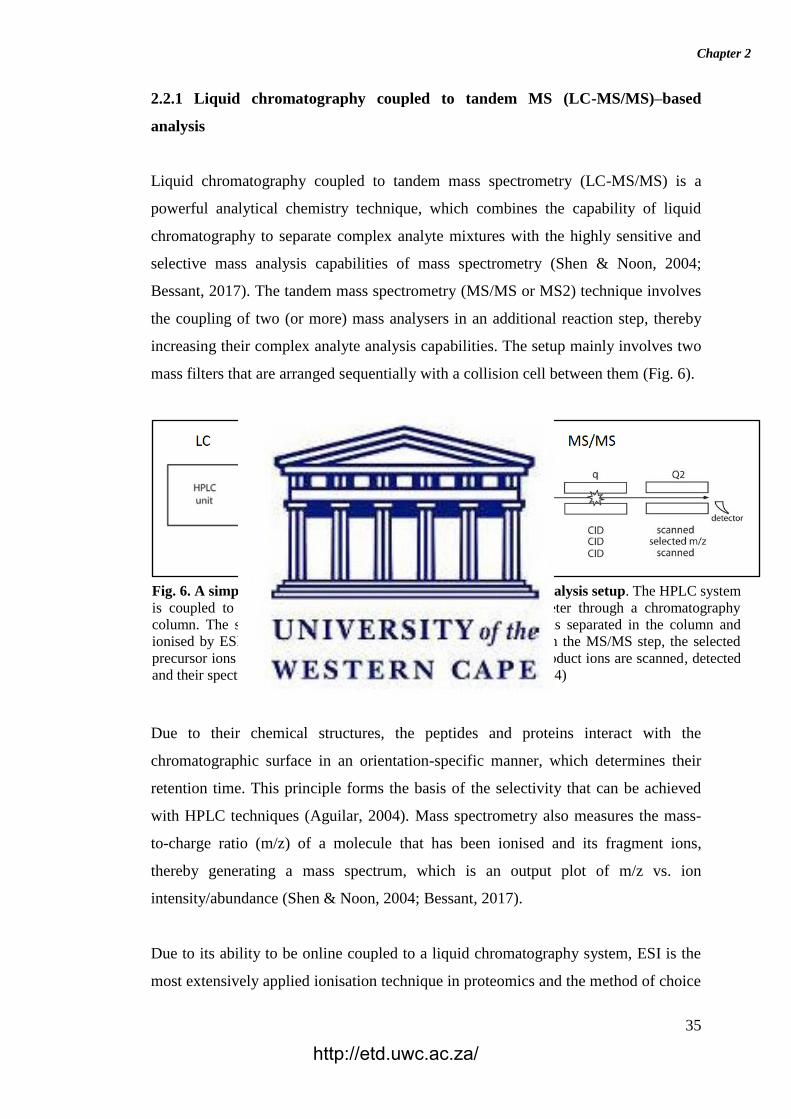
Bessant, 2017). The tandem mass spectrometry (MS/MS or MS2) technique involves
the coupling of two (or more) mass analysers in an additional reaction step, thereby
increasing their complex analyte analysis capabilities. The setup mainly involves two
mass filters that are arranged sequentially with a collision cell between them (Fig. 6).
Due to their chemical structures, the peptides and proteins interact with the
chromatographic surface in an orientation-specific manner, which determines their
retention time. This principle forms the basis of the selectivity that can be achieved
with HPLC techniques (Aguilar, 2004). Mass spectrometry also measures the mass-
to-charge ratio (m/z) of a molecule that has been ionised and its fragment ions,
thereby generating a mass spectrum, which is an output plot of m/z vs. ion
intensity/abundance (Shen & Noon, 2004; Bessant, 2017).
Due to its ability to be online coupled to a liquid chromatography system, ESI is the
most extensively applied ionisation technique in proteomics and the method of choice
Fig. 6. A simplified schematic representation of a LC-MS/MS analysis setup. The HPLC system
is coupled to the ionisation (ESI) source of the mass spectrometer through a chromatography
column. The sample to be analysed flows from the HPLC unit, is separated in the column and
ionised by ESI before being analysed by the mass spectrometer. In the MS/MS step, the selected
precursor ions are isolated and fragmented by CID and resultant product ions are scanned, detected
and their spectra recorded. (Image modified from Shen & Noon, 2004)
http://etd.uwc.ac.za/
Chapter 2
36
when analysing large biomolecules and highly complex samples (Lai, 2013; Villar &
Cho, 2013). ESI is also a favoured ionisation method because it ionises (addition of a
charge) peptide analytes without fragmenting them, therefore making it a “soft
ionisation” method (Bessant, 2017). During the ESI process, peptide analytes are
encapsulated in solvent droplets and then ionised by applying an ultra-high-voltage to
the aqueous sample. This produces a fine spray of droplets, from which solvent
continually evaporates to create analyte ions (Lai, 2013; Bessant, 2017; Netzela &
Dasari, 2017) (Fig. 7).
During a nano-ESI MS-MS run, analyte ions are produced at the ESI source and
captured and focussed for effective ion transmission (Michalski et al., 2011). The
ions travel through the mass analyser for analysis of molecular mass and
measurement of ion intensity and arrive at different parts of the detector according to
their mass-to-charge (m/z) ratio (Karas et al., 2000). Uncharged, neutral ion species
Fig. 7. The ESI process. The analyte solution (containing peptides) is forced through the
chromatographic system’s capillary column, which has been supplied with a high voltage. This
creates a Taylor cone at the tip of the spray needle. As these charged droplets of analyte ions and
solvent travel from the Taylor cone toward the mass spectrometer, the solvent continually
evaporates creating analyte ions. These analyte ions (charged peptides) move into the mass
spectrometer where they are analysed. (Image taken from Villar & Cho, 2013)
http://etd.uwc.ac.za/
Chapter 2
37
are filtered-out and only ions of interest are selected for analysis; ionised species that
undergo tandem mass spectrometry (MS/MS) analysis are submitted to two stages of
mass analysis scans, which are separated by a stage of selection and a stage of
fragmentation in a collision cell (Christin et al., 2011; Blein-Nicolas & Zivy, 2016).
Ions sent into the collision cells undergo collision-induced fragmentation into
fragment ions or product ions. In nano-ESI LC–MS/MS experiments, structural data
are efficiently generated by peptide fragmentation in the mass spectrometer via
electron transfer dissociation (ETD), collision-induced dissociation (CID) and/or
higher energy collisional dissociation (HCD) (Shen & Noon, 2004; Pejchinovski et
al., 2015). Primarily of interest to this study is the CID method, in which peptide
fragmentation occurs mainly at amide bonds along the backbone, thereby generating
b- and y-type fragment ions, which is used for structural determination (Fig. 8).
During the CID process, fragment ions are produced by the collision of isolated
precursor ions with noble gases (e.g argon, helium), leading to their kinetic energy
being converted into vibrational internal energy. This increase in vibrational internal
energy causes peptide bond breakage and generation of fragment ions. Since the
fragments generated with CID all originate from the precursor, supplementary
information relating to the primary sequence as well as peptide/protein PTMs is
Fig. 8. A generalised product ion series produced by a peptide sequence after
fragmentation via the CID method. The chemical structure of a generic four amino acid
peptide is shown, with vertical dotted lines indicating typical CID fragmentation points. The
corresponding calculations of b- and y-ion masses are shown in the table below. (Image taken
from Bessant, 2017)
http://etd.uwc.ac.za/
Chapter 2
38
obtained (Fig. 8). However, each fragmentation method has advantages and
disadvantages and it remains unclear which one is the most suitable for peptide
identification (Shen & Noon, 2004; Pejchinovski et al., 2015). After CID, the
fragment ions are collected into “packets” and stabilised before being transferred to
the detector (orbitrap) (Michalski et al., 2011). The ions’ m/z ratios and intensities are
recorded as a tandem mass spectrum (Netzela & Dasari, 2017). Each tandem mass
spectrum contains all the information that is needed to successfully identify the
peptide. While this process ends for one set of analytes, another set of analytes (ions)
are selected for fragmentation in the collision cell and detection in the orbitrap. This
process is repeated for all ions that are to be fragmented and analysed (Michalski et
al., 2011).
LC-MS/MS is currently one of the fundamental analytical approaches used in
proteomics (Christin et al., 2011; Lai et al., 2013; Blein-Nicolas & Zivy, 2016). A
typical LC-MS/MS setup allows for protein identification, characterisation and
quantitation from complex, heterogeneous biological samples, such as cancer
biopsies. LC-MS/MS-based proteomics consists of three main approaches, namely
bottom-up, middle-down, or the top-down approach (Zhang et al., 2013; Blein-
Nicolas & Zivy, 2016) (Fig. 9).
As shown in figure 9, the top-down approach analyses intact proteins, whereas the
bottom-up and middle-down approaches involves the characterisation and analysis of
proteins through proteolysis (of a protein mixture from a whole cell or tissue extract)
and subsequent peptide generation and analysis (Zhang et al., 2013). Of interest to
this study is the bottom-up proteomics approach (also referred to as shotgun MS),
since it is difficult to obtain and maintain intact proteins during the sample processing
stages for the top-down MS technique. In addition, top-down MS has decreased
throughput ability due to the limitations and challenges faced with intact protein
detection by MS (Duncan et al., 2010; Doerr, 2013; Vehus et al., 2016). Furthermore,
for FFPE tissue proteomics, top-down approaches lead to variability in the protein
extraction and fractionation results since the tissue solubilisation and HIAR technique
(described in section 2.1.2.2.1) for intact, full-length proteins still requires
standardisation (Gustafsson et al., 2015). The extraction of full-length proteins from
older FFPE blocks is also more difficult due to the extent of formalin-induced
http://etd.uwc.ac.za/
Chapter 2
39
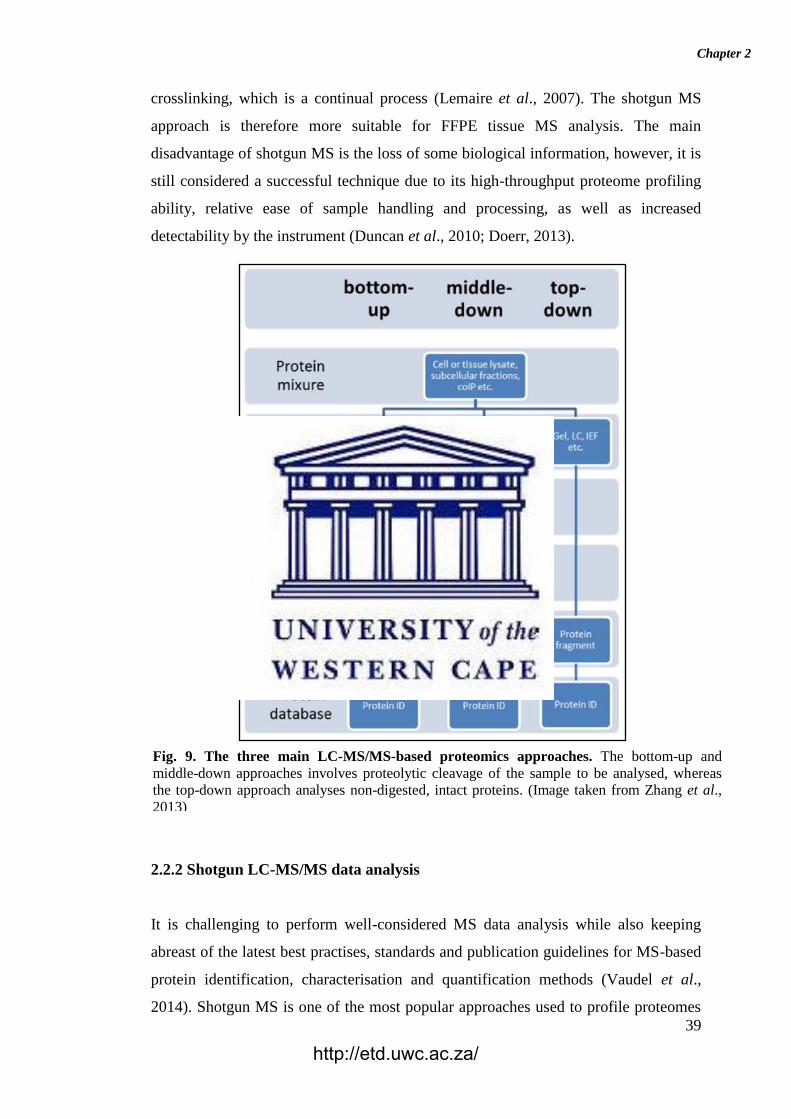
crosslinking, which is a continual process (Lemaire et al., 2007). The shotgun MS
approach is therefore more suitable for FFPE tissue MS analysis. The main
disadvantage of shotgun MS is the loss of some biological information, however, it is
still considered a successful technique due to its high-throughput proteome profiling
ability, relative ease of sample handling and processing, as well as increased
detectability by the instrument (Duncan et al., 2010; Doerr, 2013).
2.2.2 Shotgun LC-MS/MS data analysis
It is challenging to perform well-considered MS data analysis while also keeping
abreast of the latest best practises, standards and publication guidelines for MS-based
protein identification, characterisation and quantification methods (Vaudel et al.,
2014). Shotgun MS is one of the most popular approaches used to profile proteomes
Fig. 9. The three main LC-MS/MS-based proteomics approaches. The bottom-up and
middle-down approaches involves proteolytic cleavage of the sample to be analysed, whereas
the top-down approach analyses non-digested, intact proteins. (Image taken from Zhang et al.,
2013)
http://etd.uwc.ac.za/
Chapter 2
40
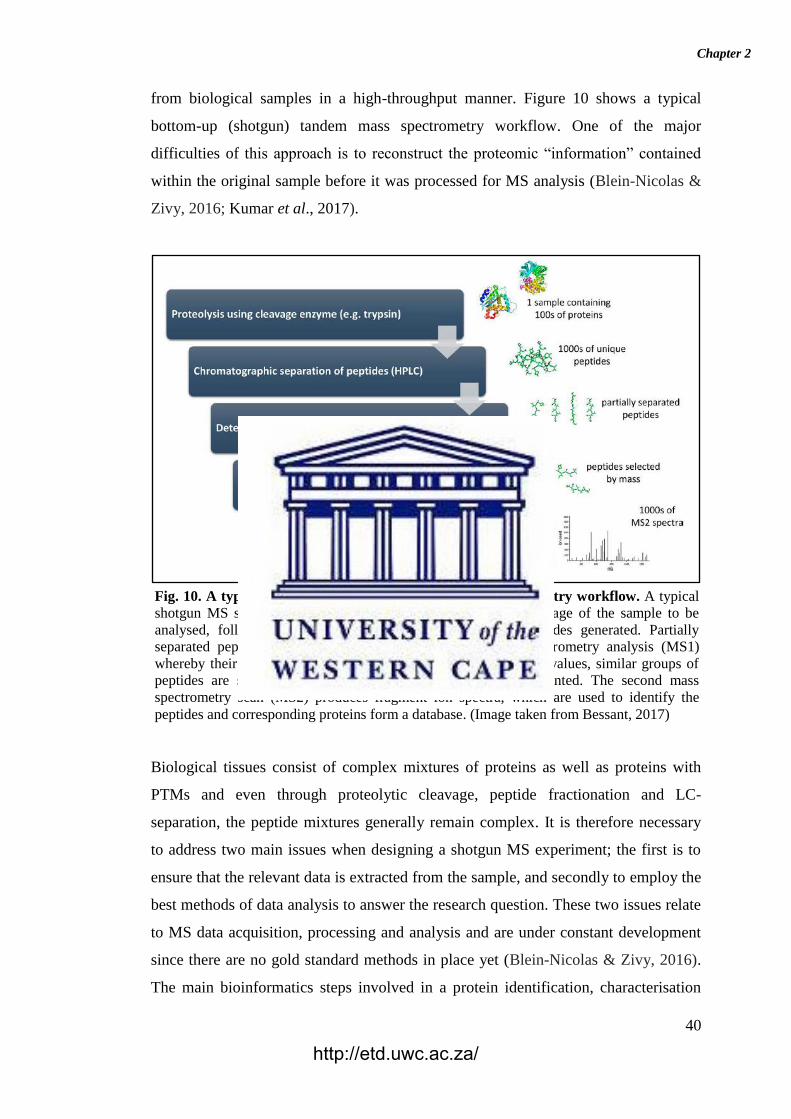
from biological samples in a high-throughput manner. Figure 10 shows a typical
bottom-up (shotgun) tandem mass spectrometry workflow. One of the major
difficulties of this approach is to reconstruct the proteomic “information” contained
within the original sample before it was processed for MS analysis (Blein-Nicolas &
Zivy, 2016; Kumar et al., 2017).
Biological tissues consist of complex mixtures of proteins as well as proteins with
PTMs and even through proteolytic cleavage, peptide fractionation and LC-
separation, the peptide mixtures generally remain complex. It is therefore necessary
to address two main issues when designing a shotgun MS experiment; the first is to
ensure that the relevant data is extracted from the sample, and secondly to employ the
best methods of data analysis to answer the research question. These two issues relate
to MS data acquisition, processing and analysis and are under constant development
since there are no gold standard methods in place yet (Blein-Nicolas & Zivy, 2016).
The main bioinformatics steps involved in a protein identification, characterisation
Fig. 10. A typical bottom-up (shotgun) tandem mass spectrometry workflow. A typical
shotgun MS sample analysis workflow involves proteolytic cleavage of the sample to be
analysed, followed by chromatographic separation of the peptides generated. Partially
separated peptides are subjected to a first round of mass spectrometry analysis (MS1)
whereby their m/z values are determined, and according to these values, similar groups of
peptides are selected (in a data-dependent manner) and fragmented. The second mass
spectrometry scan (MS2) produces fragment ion spectra, which are used to identify the
peptides and corresponding proteins form a database. (Image taken from Bessant, 2017)
http://etd.uwc.ac.za/
Chapter 2
41
and quantification workflow are: (1) raw MS file conversion to community standard
formats, (2) peptide spectrum matching (PSM) via database search using multiple
search engines, (3) peptide and protein identification and validation using the target-
decoy approach, (4) functional and gene ontology (GO) enrichment analysis and/or
identification of PTMs, and (5) data storage, sharing and re-use.
2.2.2.1 Raw MS file conversion
The data from a MS experiment consists of raw mass spectra, which are processed
and used to identify and characterise peptides and proteins, and quantify the protein
abundance of the sample analysed (Martens et al., 2011). A mass spectrometer
produces raw data files in a binary output file format, which is
proprietary/trademarked and varies depending on the instrument’s manufacturer
(Kessner et al., 2008; Deutsch, 2012; Keerthikumar & Mathivanan, 2017). In
addition, mass spectrometer instruments require the use of commercial software for
FDA approval, therefore most instruments operate on a Microsoft Windows®
operating system. This has hindered data analysis and sharing as well as the ability to
develop transparent, open source software for downstream analysis. It is therefore
necessary to first convert the raw binary files to a community standard format for data
analysis. This format conversion step is platform dependent because it requires
vendor libraries. Therefore the format conversion step usually takes place on a
Windows operating system, using a compatible format converter, such as msConvert,
which forms part of the ProteoWizard software package. The community standard
format for mass spectra files is mzML, however, data repositories such as PRIDE also
accept mzIdentML, mgf (peak list files), and mzXML (Kessner et al., 2008; Deutsch,
2012; Martens et al., 2011; Keerthikumar & Mathivanan, 2017) format. msConvert
reduces the amount of data to interpret by applying a peak-picker, which is a software
program that transforms the bell-shaped profile mode peaks into single data points,
called a peak list (Deutsch, 2012; Chambers et al., 2012; French et al., 2015;
Keerthikumar & Mathivanan, 2017). The overall mzML file structure contains all the
unprocessed spectra, of both MS1 and MS2 scans, including additional spectrum and
instrument annotation and associated metadata (such as experimental protocol,
instrumentation, and operational parameters, etc.). The mzML format is encoded in
XML and is a rich, schema-linked controlled vocabulary, which allows for accurate
http://etd.uwc.ac.za/

Chapter 2
42
and unambiguous annotation of metadata. In addition, mzML comes with a set of
semantic validation rules (Kessner et al., 2008; Deutsch, 2012; Martens et al., 2011;
Keerthikumar & Mathivanan, 2017). In the past, some researchers have used
Windows emulators to circumvent the use of a Windows operating system, although
these may not function in all scenarios as intended. It is therefore advisable to only
use a Windows operating system to convert the raw data files to mzML (or any other
functional) format and to perform all downstream processing using other operating
systems (Vizcaíno et al., 2017).
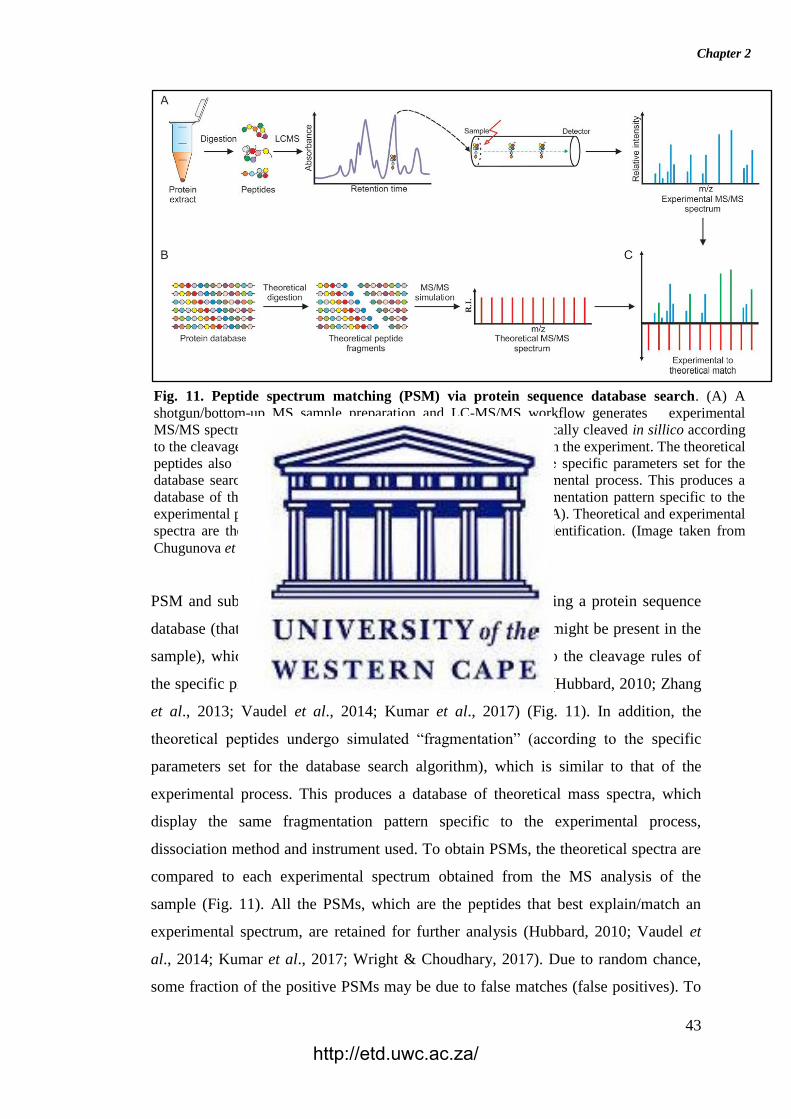
2.2.2.2 Peptide spectrum matching (PSM) via protein sequence database search
One tandem MS run generally produces thousands of spectra, which may be
interpreted using either a de novo or protein database search method (Kumar et al.,
2017). De novo approaches suffers from low resolution, low sensitivity, and partial
coverage in peptide detection and therefore these methods are not viable for high-
throughput proteomics. Therefore the preferred method of peptide and protein
identification (and relative quantification) from the spectra is protein sequence
database searching (Kumar et al., 2017) (Fig. 11).
The protein sequence database has a major impact on the final list of identified
proteins and is one of the major influencing factors in identifying proteins present in
the sample, and therefore also in deriving the experiment’s biological conclusions
(Kumar et al., 2017). A shotgun proteomics workflows will only retrieve and identify
proteins contained within the database, therefore it is crucial to choose the correct and
most appropriate database for the identification procedure. The database should
therefore contain all possible protein sequences. On the other hand, if the database is
too large, there is more chance for the search engines to introduce false positive
identifications. In addition, when different search parameters are applied, it changes
the effective search space, thereby making the choice of database an important
consideration. It is therefore important to determine which database would be optimal
for best protein discovery without increasing false positives (Kumar et al., 2017). For
these reasons it is best to use a curated protein database that is continuously updated
and reviewed, such as UniProt (Apweiler et al., 2004).
http://etd.uwc.ac.za/
Chapter 2
43
PSM and subsequent peptide identification is achieved by using a protein sequence
database (that represents all biological protein sequences that might be present in the
sample), which is theoretically digested in silico according to the cleavage rules of
the specific protease (such as trypsin) used in the experiment (Hubbard, 2010; Zhang
et al., 2013; Vaudel et al., 2014; Kumar et al., 2017) (Fig. 11). In addition, the
theoretical peptides undergo simulated “fragmentation” (according to the specific
parameters set for the database search algorithm), which is similar to that of the
experimental process. This produces a database of theoretical mass spectra, which
display the same fragmentation pattern specific to the experimental process,
dissociation method and instrument used. To obtain PSMs, the theoretical spectra are
compared to each experimental spectrum obtained from the MS analysis of the
sample (Fig. 11). All the PSMs, which are the peptides that best explain/match an
experimental spectrum, are retained for further analysis (Hubbard, 2010; Vaudel et
al., 2014; Kumar et al., 2017; Wright & Choudhary, 2017). Due to random chance,
some fraction of the positive PSMs may be due to false matches (false positives). To
Fig. 11. Peptide spectrum matching (PSM) via protein sequence database search. (A) A
shotgun/bottom-up MS sample preparation and LC-MS/MS workflow generates experimental
MS/MS spectra. (B) Protein sequences from a database are theoretically cleaved in sillico according
to the cleavage rules of the specific protease (such as trypsin) used in the experiment. The theoretical
peptides also undergo simulated “fragmentation” (according to the specific parameters set for the
database search algorithm), which is similar to that of the experimental process. This produces a
database of theoretical mass spectra, which display the same fragmentation pattern specific to the
experimental process, dissociation method and instrument used in (A). Theoretical and experimental
spectra are then compared (C) and match to allow for peptide identification. (Image taken from
Chugunova et al., 2018)
http://etd.uwc.ac.za/
Chapter 2
44
estimate the percentage of possible false matches, multiple hypothesis testing is
applied to the whole list of PSMs. The method of target-decoy-database searching,
which produces the false discovery rate (FDR) estimation, is now considered best
practise (Elias & Gygi, 2010). This method involves searching and comparing
experimental spectra against the target database, which contain true representative
biological protein sequences, as well as a decoy database that contains decoy or false
proteins, which may just be the reversed versions of the true/target sequences. The
decoy database can be constructed using tools such as DBToolkit or SearchGUI,
which offers an option to automatically add decoy sequences to your target protein
sequence database file. The positive hits from the decoy database then allows for
construction of PSM scores, which allows for the estimation of the percentage of
false positive PSMs assigned from the target database. The FDR corrected list of
PSMs is then used to identify the list of peptides and proteins expressed in the
sample. Accurate protein identification is crucial for determining and comparing
qualitative/quantitative changes between different biological samples and/or
biological states (disease vs. healthy). And since MS-based protein quantification is
dependent on peptide detection, it is also influenced by factors that affect peptide
discovery (Karpievitch et al., 2012; Vaudel et al., 2014; Kumar et al., 2017; Wright
& Choudhary, 2017).
For the purpose of PSM processing, multiple search engines have been developed,
each with its own advantages and drawbacks (Hubbard, 2010; Vaudel et al., 2014;
Kumar et al., 2017). While it is considered best practise to use only one and the same
version of protein sequence database for protein/peptide identification throughout a
MS proteomics project, it is advised to combine multiple search engines and their
results (Martin et al., 2013; Vaudel et al., 2014). Of interest to this study are search
engines such as X! Tandem, MyriMatch, MS Amanda, MS-GF+, and OMSSA, which
can all be simultaneously utilised through SearchGUI (Vaudel et al., 2011).
SearchGUI is an open-source graphical user interface tool, which allows for the
simultaneous running of multiple search engines and storage of their results (upon
search completion) in separate files in a previously selected output folder/directory.
SearchGUI can be used together with freely available open-source tools such as
PeptideShaker (Vaudel et al., 2015), which enables visualisation, comparison and
further analysis (such as peptide and protein identification) of all the search engines’
http://etd.uwc.ac.za/

Chapter 2
45
results. SearchGUI may be used as a stand-alone tool or it can be added to a data
analysis workflow pipeline (Vaudel et al., 2011).
2.2.2.3 Peptide and protein identification and validation using the target-decoy
approach
PeptideShaker is a freely available, open-source proteomics informatics tool that is
used for the analysis and interpretation of primary data, data sharing and
dissemination, as well as the re-analysis of publicly available MS-based data (Vaudel
et al., 2015). PeptideShaker uses the target-decoy search strategy to identify peptides
and proteins and it also unifies and collates the PSM lists of different search
algorithms, to allow for the use of multiple search engines. It also provides statistical
confidence estimates for each peptide and protein by taking into account the protein
inference issues; it provides FDRs at the PSM, peptide and protein levels. In addition,
it calculates reliable false negative rates (FNRs) to enable filtering of results
according to a FDR-versus-FNR cost-benefit rationale, which shows the specificity
and sensitivity of the results. PeptideShaker can also be used to provide confident
PTM modification site inference using the latest PTM localisation methods (Vaudel
et al., 2015). In addition, PeptideShaker uses spectrum counting based protein
quantification, which relies on the reasoning that highly abundant peptides will have a
higher intensity, and are therefore more likely to generate acquisition of MS/MS
spectra (Vaudel et al., 2011; Vaudel, 2017). Consequently, peptides from abundant
proteins are more likely to be identified and possess more spectra. The NSAF method
followed involves counting the number of spectra attributed to a protein (Powell et
al., 2004). This count is then normalised for the length of the protein, the presence of
shared peptides, as well as redundant peptides (Vaudel et al., 2011; Vaudel, 2017).
PeptideShaker also allows for inspection of the GO of a dataset, by conducting a GO
enrichment analysis of all validated proteins. This is presented as a list of all GO
terms together with their prevalence (percentage frequency of occurrence) within the
dataset, and the significance level is calculated using hypergeometric testing. The
GOSlim UniProtKB-GOA is used to keep the number of GO terms at a manageable
level (www.ebi.ac.uk/GOA).
http://etd.uwc.ac.za/
Chapter 2
46
2.2.2.4 Data storage, sharing, re-use and current MS-based proteomics best
practises (MIAPE and HUPO PSI)
To avoid the serious shortcomings of MS-based proteomics experiments, the
experimental design should be standardised with respect to pre-analytical, analytical
and post-analytical variabilities, thereby allowing comparison of results between
different experiments (Findeisen & Neumaier, 2009). The Human Proteome
Organisation (HUPO) is a Proteomics Standards Initiative (PSI) that has released
recommendations about the Minimal Information About a Proteomics Experiment
(MIAPE) as a guideline to researchers to increase independent reproducibility of
published data (Taylor et al., 2007).
HUPO PSI working groups have highlighted the importance of appropriate education
and MS-based proteomics training for proper application of such a complex
technology (Bell et al., 2009). The HUPO PSI has developed several guidelines for
performing proteomics experiments. These include identification and monitoring of
any lab-derived contaminations (such as keratins) that may negatively impact on the
data obtained. In addition, the use of target-decoy search strategies have been made
mandatory, and FDRs should be reported. To address the issue of redundant
identifications, which are sequence variants of the same protein, unique peptides and
tandem mass spectra need to be monitored to ensure that the minimum list of protein
identifications is reported. Furthermore, to eliminate aliases, a gene-centric database
could ensure that only a single descriptive name is assigned to each protein sequence.
Also, to aid data sharing and the ease of data submission to repositories, tools for
transforming data into standardised formats are required (Bell et al., 2009). Most
journals that report on proteomics and proteomics informatics have adopted the
HUPO PSI and MIAPE guidelines as requirements for publication.
Due to the variety of data types and experimental workflows as well as the inherent
complexity of MS-based data, its public deposition and storage are still less
developed compared to other data-intensive disciplines such as genomics (Martin et
al., 2013; Vaudel et al., 2014; Perez-Riverol et al., 2015). Over the years several
public repositories for MS-based proteomics experiments have been established,
including the Global Proteome Machine Database (GPMDB), PeptideAtlas, and the
http://etd.uwc.ac.za/
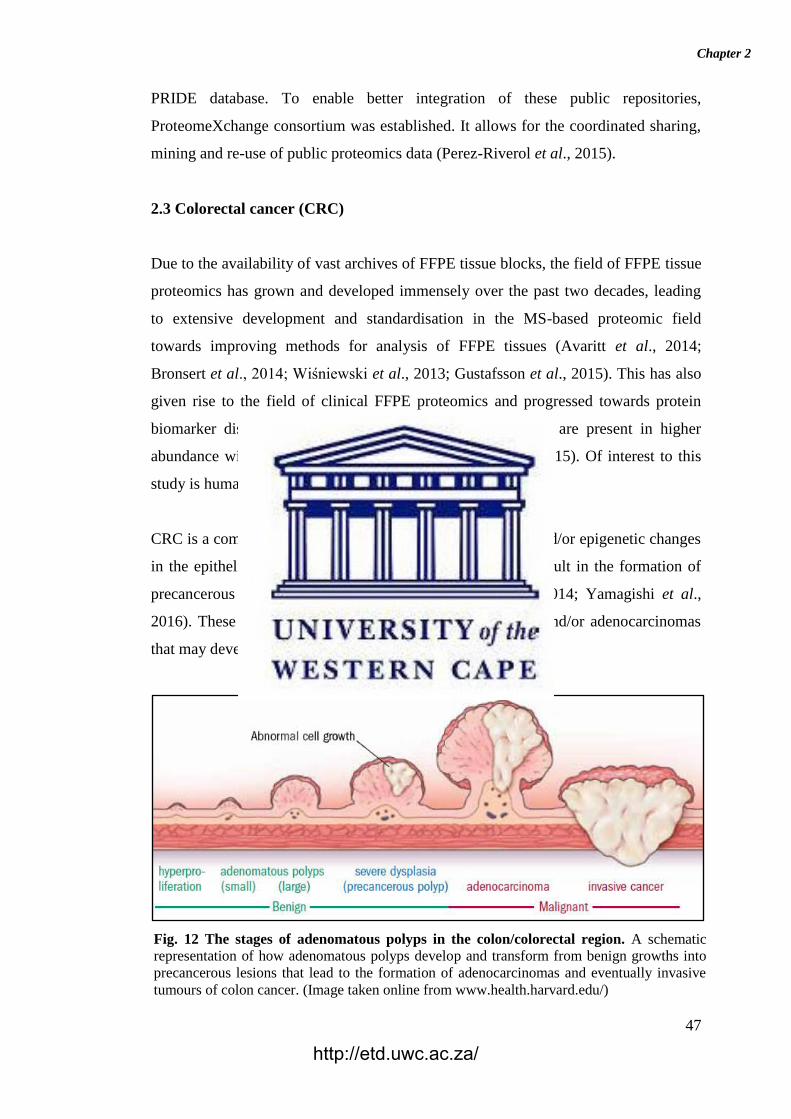
Chapter 2
47
PRIDE database. To enable better integration of these public repositories,
ProteomeXchange consortium was established. It allows for the coordinated sharing,
mining and re-use of public proteomics data (Perez-Riverol et al., 2015).
2.3 Colorectal cancer (CRC)
Due to the availability of vast archives of FFPE tissue blocks, the field of FFPE tissue
proteomics has grown and developed immensely over the past two decades, leading
to extensive development and standardisation in the MS-based proteomic field
towards improving methods for analysis of FFPE tissues (Avaritt et al., 2014;
Bronsert et al., 2014; Wiśniewski et al., 2013; Gustafsson et al., 2015). This has also
given rise to the field of clinical FFPE proteomics and progressed towards protein
biomarker discovery, since tumour-specific protein markers are present in higher
abundance within patient tumour tissue (Gustafsson et al., 2015). Of interest to this
study is human CRC.
CRC is a complex, heterogenous disease caused by genetic and/or epigenetic changes
in the epithelial cells of the large intestine that eventually result in the formation of
precancerous lesions (Adeola et al., 2014; Balboa et al., 2014; Yamagishi et al.,
2016). These lesions may give rise to adenomatous polyps and/or adenocarcinomas
that may develop into cancer (Fig. 12).
Fig. 12 The stages of adenomatous polyps in the colon/colorectal region. A schematic
representation of how adenomatous polyps develop and transform from benign growths into
precancerous lesions that lead to the formation of adenocarcinomas and eventually invasive
tumours of colon cancer. (Image taken online from www.health.harvard.edu/)
http://etd.uwc.ac.za/
Chapter 2
48
There are two main types of CRC, namely sporadic (nonhereditary) and hereditary
(Coetzee & Thomson, 2013; Balboa et al., 2014). Of interest to this study is sporadic
CRC, which occurs in individuals without a genetic predisposition or family history
of CRC (Yamagishi et al., 2016). The exact factors that predispose an individual to
develop sporadic CRC are still unclear, however, it is widely believed to be attributed
to accumulation of genetic alterations (due to environmental carcinogens, age-related
factors, lifestyle and diet) as well as chronic infection and inflammatory diseases such
as long-standing ulcerative colitis, diverticulosis or colonic Crohn’s disease
(Ballinger & Patchett, 2003; Balboa et al., 2014).
Most sporadic CRC tumours occur on the left side of the large intestine, namely
beyond the descending colon region and into the sigmoid colon and rectum areas
(Ballinger & Patchett, 2003). Sporadic CRC pathogenesis usually follows the
“adenoma-carcinoma” sequence whereby an initial benign adenoma develops into a
carcinoma (Ballinger & Patchett, 2003; Adeola et al., 2014) (Fig. 12). CRC stages
progress from the tumour being confined to the bowel wall, then extending through
the bowel wall, followed by further stage of regional lymph node involvement and
eventually distant metastases (Fig. 13). CRC treatment often involves surgery with
tumour resection and, if possible, end-to-end anastomosis of the remaining “healthy”
colon to restore colonic continuity (Ballinger & Patchett, 2003).
Classification and diagnosis of CRC uses all available information to define the
disease subtype, including disease location, cellular morphology, immunophenotype,
immunohistochemistry (IHC), as well as genetic and clinical features (Ballinger &
Patchett, 2003; Jass, 2007). A screening colonoscopy is generally advised for high
risk individuals that have a family history of hereditary CRC or a first-degree relative
that developed CRC before 50 years of age (Ballinger & Patchett, 2003). Healthy
individuals over the age of 50 years are encouraged to be screened for CRC, since it
has been shown to significantly reduce CRC mortality. However, due to the cost and
invasive procedures, this strategy has not yet been widely adopted by healthy
individuals (Ballinger & Patchett, 2003; Quesada-Calvo et al., 2017). There is
currently still a great need for non-invasive, sensitive, specific, and cost-effective
diagnostic screening and biomarkers to determine the presence of pre-neoplastic
http://etd.uwc.ac.za/
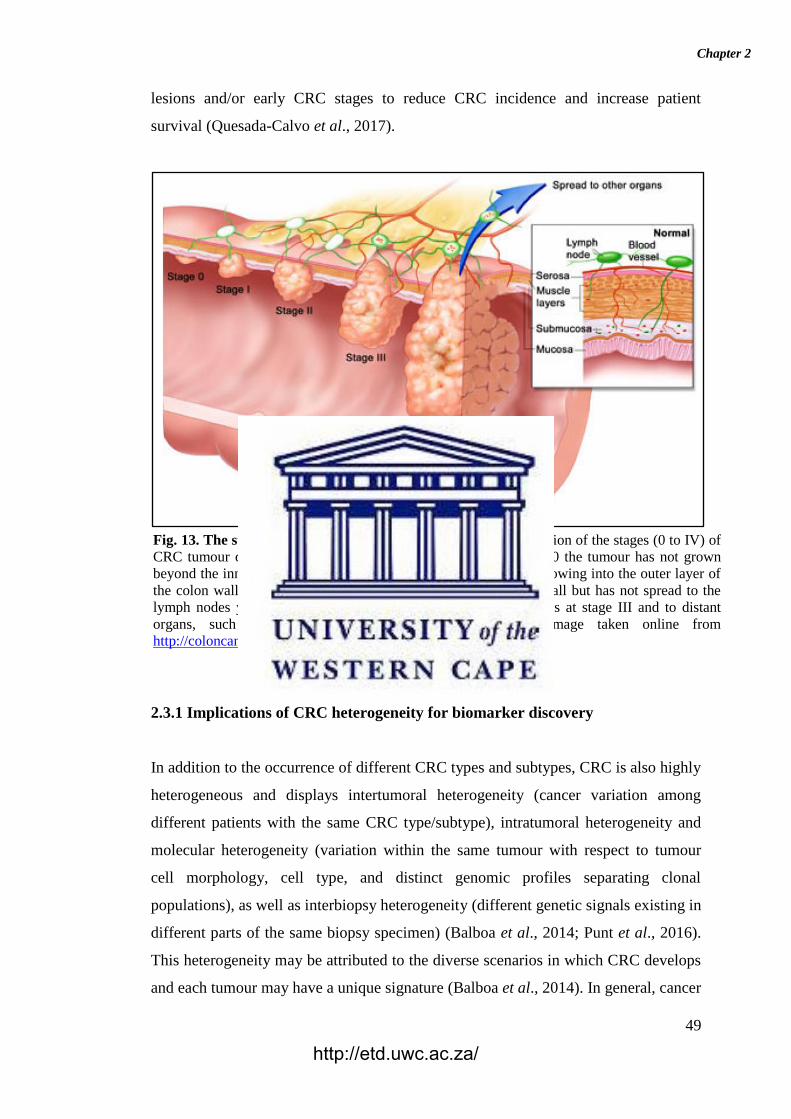
Chapter 2
49
lesions and/or early CRC stages to reduce CRC incidence and increase patient
survival (Quesada-Calvo et al., 2017).
2.3.1 Implications of CRC heterogeneity for biomarker discovery
In addition to the occurrence of different CRC types and subtypes, CRC is also highly
heterogeneous and displays intertumoral heterogeneity (cancer variation among
different patients with the same CRC type/subtype), intratumoral heterogeneity and
molecular heterogeneity (variation within the same tumour with respect to tumour
cell morphology, cell type, and distinct genomic profiles separating clonal
populations), as well as interbiopsy heterogeneity (different genetic signals existing in
different parts of the same biopsy specimen) (Balboa et al., 2014; Punt et al., 2016).
This heterogeneity may be attributed to the diverse scenarios in which CRC develops
and each tumour may have a unique signature (Balboa et al., 2014). In general, cancer
Fig. 13. The stages of CRC development. A schematic representation of the stages (0 to IV) of
CRC tumour development and growth within the colon. At stage 0 the tumour has not grown
beyond the inner layer of the colon wall. Stage I has the tumour growing into the outer layer of
the colon wall. At stage II the tumour is protruding through the wall but has not spread to the
lymph nodes yet. Tumour cells start spreading to the lymph nodes at stage III and to distant
organs, such as the liver and/or lungs in stage IV. (Image taken online from
http://coloncancerpreventionproject.org)
http://etd.uwc.ac.za/
Chapter 2
50
heterogeneity may be attributed to three main theories, namely due to natural
selection, clonal evolution and/or cancer stem cell theory (Adeola et al., 2014). The
mutational rates in tumours have been found to be, on average, 200 times greater than
in normal cells (Bielas et al., 2006). This, together with the different genomic and
epigenomic conditions that exist within a tumour, contributes to the development of
intertumoral heterogeneity (Balboa et al., 2014). A tumour’s heterogeneous features
are unique, for the most part, and improbable to be identical in another organism. The
intertumoral heterogeneity that develops during CRC pathogenesis brings about a
different mutational spectrum between patients with the same type of CRC.
Intertumoral heterogeneity will affect patient prognosis and treatment and explains
why different individuals respond differently to treatment. It is therefore becoming
progressively important to establish the genetic and protein profiles of patients so as
to determine tumourigenesis and tumour progression (Balboa et al., 2014).
Protein profiles or a panel of several proteins (biomarker signature) may be more
effective than single protein biomarker(s) for development of screening tests, due to
the heterogeneous nature of CRC (Quesada-Calvo et al., 2017). These “cancer”
protein profiles, which may be associated with precancerous or cancer progression,
are regulated and expressed by dysplastic and neoplastic tissues. Colon tissue
therefore presents a direct source to study these protein changes. In addition, the
availability of vast amounts and different patient cases of archived FFPE tissues
increases the probability of identifying significant and specific potential CRC
biomarker panels (Quesada-Calvo et al., 2017).
2.3.2 MS-based proteomics to classify and diagnose CRC
Recent advances in MS-based proteomics have enabled researchers to apply these
techniques in the fields of biology, pathology and drug discovery (Chen & Yates,
2007; Nibbe & Chance, 2009; Adeola et al., 2014). MS is currently one of the most
powerful proteomic tools and is able to produce data with excellent sensitivities and
specificities on cancers. MS-based proteomics techniques are able to differentiate
protein expression levels between disease states, identify and quantitate expressed
proteins as well as generate protein expression profiles for cancer characterisation and
subtype classification (Chen & Yates, 2007; Adeola et al., 2014). These techniques
http://etd.uwc.ac.za/
Chapter 2
51
also allow for the study and profiling of molecular signatures in tissues as well as
monitoring changes in protein post-translational modifications (PTMs), which assist
in the process of biomarker discovery. Peptide/protein profiles may be used to
generate subtype-specific protein expression signatures as well as indicate tumour
grade (Diamandis, 2004; Chen & Yates, 2007; Nibbe & Chance, 2009).
2.4 Conclusions
Over the past two decades, the field of FFPE tissue proteomics has grown and
developed immensely due to the existence and availability of vast, untapped archives
of FFPE tissue blocks (Avaritt et al., 2014; Bronsert et al., 2014; Wiśniewski et al.,
2013; Gustafsson et al., 2015). This has also allowed for extensive development and
standardisation in the MS-based proteomic field, as well as genomics and
immunohistochemical studies that have focussed on improving methods for analysis
of FFPE tissue. There are, however, pre-analytical and analytical challenges to
overcome to ensure that the true representation of the proteome in FFPE tissues is
analysed (Magdeldin & Yamamoto, 2012; Craven et al., 2013; Avaritt et al., 2014;
Wiśniewski et al., 2013). In this study we could not control or correct for the pre-
analytical factors impacting on the FFPE tissues analysed. Therefore, the main focus
was to establish optimal analytical conditions for effective protein extraction,
digestion and sample purification for LC-MS/MS analysis, and to evaluate the impact
of storage time on extractable protein yield and quality. To our knowledge, there is no
general agreement as to the choice of detergent or buffer system required for efficient
and reproducible protein extraction from human FFPE tissues. In addition, sample
preparation methods may vary considerably and there are no standard protocols in
place yet.
http://etd.uwc.ac.za/
Chapter 3
52
Chapter 3: The effect of polyethylene glycol 20,000 on protein
extraction efficiency of formalin-fixed, paraffin-embedded tissues
Abstract
Introduction: The optimal conditions and procedures for efficient and reproducible
protein extraction of FFPE tissues have not yet been standardised and new sensitive
techniques are continually being developed and improved upon. To our knowledge,
there is no general agreement as to the choice of detergent or buffer system (and/or
addition of PEG 20,000) required for efficient and reproducible protein extraction
from human FFPE tissues. Moreover, the effect of PEG 20,000 on protein extraction
efficiency has not been evaluated using human FFPE colorectal cancer tissues, only
by using human cell lines and rat tissues. This study therefore aims to assess the
impact of PEG 20,000 on the protein extraction efficiency, reproducibility, and
protein selection bias of the protein extraction buffer used for FFPE colonic resection
tissue in label-free LC-MS/MS analysis. The sample pellets were also tested for
residual protein, not extracted in the initial extraction.
Method: FFPE human colorectal carcinoma resection samples were used to
determine the optimal protein extraction parameters (tissue/starting material volumes
as well as protein extraction buffer composition and volume) required for accurate
label-free LC-MS/MS analysis. In addition, three different protein purification
workflows were compared, namely detergent removal columns (DRC), the acetone
precipitation and formic acid resolubilisation (APFAR) method, as well as the Single-
Pot Solid-Phase-enhanced Sample Preparation (SP3) method (using hydrophilic
interaction liquid chromatography (HILIC) and magnetic resin). Data were evaluated
in terms of protein concentration extracted, peptide/protein identifications, method
reproducibility and efficiency, and protein/peptide distribution according to biological
processes, cellular components, and physicochemical properties. Data are available
via ProteomeXchange with identifier PXD014419.
Results: The results show that the absence of PEG 20,000 increases the number of
peptides and proteins identified by unfractionated LC-MS/MS analysis, and the
method is more reproducible. However, no significant differences were observed with
regard to protein selection bias. In addition, by building on from previous studies,
http://etd.uwc.ac.za/
Chapter 3
53
which found that higher protein concentrations (>10 µg) (of FFPE animal tissues and
human cells) compromise the function of PEG, that this effect is also observed in
FFPE human colon tissue.
Conclusion: We propose that studies generating high protein yields would benefit
from the absence of PEG 20,000 in the protein extraction buffer.
3.1 Introduction
Archival FFPE tissue repositories are valuable resources for clinical proteomic
studies, which may include retrospective as well as protein biomarker discovery and
validation studies (Tanca et al., 2014; Gustafsson et al., 2015; Shen et al., 2015).
These repositories contain numerous varieties of patient tissue specimens, including
rare malignancies together with metadata such as patient medical records, which
contain information about diagnosis, survival, and response to therapy. Due to this
and the fact that FFPE samples are easily stored and obtainable, many recent
proteomics, genomics and immunohistochemical studies have focussed on improving
methods for analysis of FFPE tissue (Tanca et al., 2014; Gustafsson et al., 2015; Shen
et al., 2015).
It is of great interest in clinical and translational research to develop and standardise
FFPE sample MS-based proteomic methods to determine changes (or similarities) in
the proteome composition of tumour vs. healthy tissues (Bronsert et al., 2014;
Scheerlinck et al., 2015). Part of this process involves using an optimal and efficient
protein extraction buffer, which generates reproducible results. Studies have found
that experimental factors, such as protein extraction buffer, pH, detergents,
denaturants, and temperature, play important roles in the final attainable protein yield
from FFPE tissues (Shi et al., 2006; Shen et al., 2015). Other factors to consider
include limited availability of precious clinical specimens and therefore a limited
amount of starting material (tissue) available for optimising the protein extraction
procedure. Therefore, proteomics workflows (including protein extraction, protein
sample enrichment, fractionation and digestion) need to be optimised to generate
quality peptide/protein samples of suitable quality for high sensitivity tandem LC-MS
analysis, using limited starting-sample volumes (Gustafsson et al., 2015; Ruderman,
2017).
http://etd.uwc.ac.za/
Chapter 3
54
A great challenge faced with regard to sample processing and protein extraction of
FFPE tissues, is the effect of the formaldehyde fixation chemistry on the tissues.
Formaldehyde causes chemical modifications to cells and molecules such as proteins,
DNA and RNA; of interest to this study is protein fixation due to formation of
methylene bridges between amino groups. Therefore, to ensure accurate and efficient
protein extraction from FFPE tissues for proteomic analysis, it is very important to
overcome the issue of the formaldehyde cross-linking between molecules, since the
cleavage of these methylene bridges is required for proper trypsin digestion
(Magdeldin & Yamamoto, 2012; Fowler et al., 2013; Avaritt et al., 2014; Gustafsson
et al., 2015). For this reason multiple strategies have been employed, including the
use of denaturants, detergents, and antigen retrieval. However, several aspects of the
formaldehyde-protein interactions have still not been resolved. Recently, Paine et al.
(2018) were able to identify small (low molecular weight) proteins and
neuropeptides, without antigen retrieval and enzymatic digestion steps, via mass
spectrometry imaging. They hypothesise that not all proteins, especially small
proteins (with short amino acid sequences and low lysine content), react with
formaldehyde to the same extent. However, larger proteins (with longer amino acid
sequences and greater lysine content) were more challenging to detect via mass
spectrometry, and therefore have a greater probability of being more extensively
crosslinked by formaldehyde.
Shi et al. (1991) developed a superior immunohistochemistry staining technique,
which involves heat-induced antigen retrieval (HIAR) of FFPE tissue sections
through incubation in a suitable buffer (after deparaffinisation and rehydration steps)
at a high temperature (90 – 120°C) for up to several hours (however, the
buffers/solutions used for antigen retrieval by Shi et al. (1991) did not contain PEG
20,000 or SDS, since it was an IHC study). The HIAR technique has been
successfully and extensively employed and modified in FFPE tissue proteomics, with
many research groups also aiming to improve upon it or adapting variations of it
(Magdeldin & Yamamoto, 2012; Fowler et al., 2013; Avaritt et al., 2014; Gustafsson
et al., 2015). To further increase protein extraction efficiency from FFPE tissues,
strong detergents such as SDS (for total tissue solubilisation), as well as
nondenaturing, hydrophilic synthetic polymers, such as PEG 20,000, have been used
to solubilise or precipitate and stabilise proteins for separation, purification, and
http://etd.uwc.ac.za/
Chapter 3
55
storage (Busby & Ingham, 1980; Ogorzalek Loo et al., 1994; Speers & Wu, 2007;
Zhao & O’Connor, 2007). However, complete SDS removal before enzymatic
digestion and LC-MS/MS analysis is crucial, since it inhibits enzyme activity and
causes ion signal suppression and interference, even at very low concentrations
(Ogorzalek Loo et al., 1994; Speers & Wu, 2007; Wiśniewski et al., 2009; Botelho et
al., 2010; Kachuk et al., 2015). Since SDS removal, with minimal sample loss, is a
challenging task, several gel-free approaches have been proposed over the years.
These approaches include incorporating the use of detergent removal columns (DRC)
(ThermoFisher Scientific, 2017), protein precipitation with organic solvents, such as
the Acetone precipitation and formic acid resolubilisation (APFAR) method (Botelho
et al., 2010; Doucette et al., 2014; Kachuk et al., 2015), and/or methods using
hydrophilic interaction liquid chromatography (HILIC) and magnetic resin (such as
the Single-Pot Solid-Phase-enhanced Sample Preparation (SP3) method) (Hughes et
al., 2014; Hughes et al., 2019) in the sample processing workflow prior to LC-
MS/MS.
Other challenges faced in FFPE proteomic studies, which cannot be remedied after
the fact, are pre-analytical factors that affect protein extraction efficiency and often
produce variable protein yields, including tissue ischemic time, the composition of
the fixative, fixation time (duration/range of formalin-fixation times used), as well as
block age and storage conditions (Thompson et al., 2013; Bronsert et al., 2014;
Gustafsson et al., 2015). These pre-analytical factors could potentially have an
adverse effect on any study conducted, since the various pre-analytical processing
methods and/or conditions could have an adverse effect on any downstream analysis
performed on the tissue.
Of interest to this study are the effects of polyethylene glycol (PEG) on protein
extraction efficiency of human FFPE tissues, using LC-MS/MS analysis, as there is
no current consensus with regard to PEG usage and advantages for human FFPE
tissues. PEG is a high molecular weight carrier substance, which reduces non-specific
adsorption of proteins to surfaces, such as experimental plastic-ware (micropipette
tips and microcentrifuge tubes), and prevents subsequent protein loss (Wiśniewski et
al., 2011; Shen et al., 2015). PEG can vary in polymer size, and for this study PEG
20,000 was chosen because it is the most extensively used form in FFPE tissue
http://etd.uwc.ac.za/
Chapter 3
56
proteomics, subsequently all references to PEG in this study are to the 20,000 form.
PEG can, however, cause interference and ion signal suppression in downstream LC-
MS/MS analysis, if it is not completely removed from the sample analysed
(Wiśniewski et al., 2011; Scheerlinck et al., 2015). Removal of high concentrations
of PEGs is challenging and PEG carry-over into sample fractions and LC columns are
a huge problem (Busby & Ingham, 1980; Zhao & O’Connor, 2007). In addition,
sample purification steps often lead to sample loss and low throughput. PEGs also
precipitate proteins through a steric exclusion mechanism, whereby they occupy most
of the space in solution, thus concentrating the proteins until they exceed solubility
and precipitate (Juckes, 1971; Foster et al., 1973; Busby & Ingham, 1980; Feist &
Hummon, 2015). Therefore subsequent centrifugation may pellet the precipitated
proteins (Feist & Hummon, 2015). Any precipitated proteins in the sample pellets
will therefore be lost after clarifying the protein lysates and removal of the
supernatants for analysis. However, due to its advantages and available sample
preparation methods to remove PEG before LC-MS/MS analysis, it is often used for
protein extraction of FFPE tissues (Wiśniewski et al., 2011; Shen et al., 2015).
However, to our knowledge, PEG efficacy with regard to protein extraction of human
FFPE tissues has not been fully evaluated yet.
The aim of this study is to evaluate the effects of PEG within the protein extraction
buffer using label-free LC-MS/MS analysis of manually micro-dissected FFPE
human colorectal carcinoma resection samples. The sample pellets were also tested
for residual protein, which was not extracted in the whole cell protein lysates
(WCPLs).
3.2 Materials and Methods
3.2.1 FFPE human CRC resection samples
FFPE tissue blocks, which consisted of human colorectal carcinoma resection
samples, were obtained from the Anatomical Pathology department at Tygerberg
Hospital (Western Cape, South Africa) after obtaining ethics clearance from the
Biomedical Science Research Ethics Committee (BMREC) of the University of the
Western Cape (ethics reference number: BM17/7/15), as well as the Health Research
http://etd.uwc.ac.za/

Chapter 3
57
Ethics Committee (HREC) of Stellenbosch University (ethics reference number:
S17/10/203). The FFPE blocks were anonymised prior to processing and archived
since 2016/2017 (when the tissue was resected). Tissue processing and fixation
times/conditions and storage conditions are unknown, since specimens were
retrospectively collected. Three patient cases were reviewed and selected (Table 1).
Patient 1 Patient 2 Patient 3
Block year 2017 2016 2016
Patient age (years) 60 47 60
Gender Female Male Male
Diagnosis Adenocarcinoma Adenocarcinoma Adenocarcinoma
Grade low-grade high-grade low-grade
Stage IIIB IIIB IIA
Location Right colon Right colon Right colon
Patient samples diagnosed with low-grade or high-grade colorectal adenocarcinoma,
after Haematoxylin and Eosin (H&E) staining, were reviewed by a pathologist(s) to
ensure tissue quality and comparability (Fig. 14). The selected slides had carcinomas
with more than 90% viable tumour nuclei.
3.2.2 Protein extraction and quantification
The optimal protein extraction buffer (with or without PEG), as well as the optimal
tissue size (measured area = length x breadth) and tissue thickness (µm) that would
Figure 14. Colonic adenocarcinoma resection tissue samples. Representative H&E stained
sections of patient cases analysed in this study; patient 1 (A), patient 2 (B), and patient 3 (C) at 100x
magnification.
Table 1. Information of three FFPE specimens selected for analysis.
http://etd.uwc.ac.za/
Chapter 3
58
produce a sufficient quantity of protein (1.25mg/ml in approximately 400 µl sample
volume) for accurate mass spectrometry analysis was determined first.
Sample tumour areas were marked on H&E sections by the pathologist and the
dimensions (length x breadth) of these tumour areas (mm2) were calculated. This
information was subsequently used to calculate the (approximate) total volume (mm3)
of tumour tissue per μm of sliced FFPE tissue sections. The volume of protein
extraction buffer required per mm3
of tissue to extract approximately 1.25mg/ml in
400 µl sample volume was determined, and the mass (μg) of extractable
protein/protein yield per mm3 tumour volume was calculated.
For protein extraction, the sample tissue sections were matched to the tumour areas
marked on the H&E sections (by the pathologist) and manually micro-dissected, to
include tumour tissue only. From each selected patient case, a number of 25μm
sections (that were equivalent to 23 mm3 of manually micro-dissected FFPE tumour
tissue per sample) were cut and mounted onto generic glass microscopy slides. The
sections were completely air dried and processed for protein extraction with or
without the addition of 0.5% (w/v) PEG 20,000 in the protein extraction buffer (50
mM Ammonium bicarbonate (AmBic) (pH 8.0), 2% (w/v) Sodium dodecyl sulphate
(SDS). In total, 12 samples were analysed (biological replicates only), including the
whole cell protein lysates (WCPLs) as well as the sample pellets (Fig. 15).
The method used for sample processing and protein extraction was modified from the
protocols used by Scicchitano et al. (2009), and Wiśniewski (2013). Briefly, tissue
sections (mounted on glass slides) were heated on a heating block (65°C for 5 min),
to melt the paraffin wax, followed by tissue deparaffinisation consisting of two
consecutive incubations in xylene (Sigma-Aldrich, USA) for 2.5 min and 1.5 min
each respectively, at room temperature. Tissue sections were then rehydrated by
successive incubations in absolute ethanol (Merck, Germany), 70% (v/v) ethanol, and
twice with distilled water, for 1 min each at room temperature. Slides were placed on
tissue paper to absorb excess moisture and the tissues were collected in protein
LoBind microcentrifuge tubes (Eppendorf, Germany) by scraping the tissue off the
glass slides using a clean sterile scalpel blade. Protein extraction buffer (50 mM
AmBic (pH 8.0) (Sigma-Aldrich, USA), 2% (w/v) SDS (Sigma-Aldrich, USA), either
with or without addition of 0.5% (w/v) PEG 20,000 (Sigma-Aldrich, USA)) was
http://etd.uwc.ac.za/

Chapter 3
59
added to the samples at a volume of approximately 20 μl protein extraction buffer per
mm3 of tissue (approximately 23 mm
3 tissue per sample). Samples were mixed by
vortexing and incubated at 99°C in a heating block with agitation set at 600 RPM for
1 hr, after which the samples were cooled/placed on ice before centrifugation at
16,000 x g and 18°C for 20 min to pellet the cell debris. The supernatant/WCPLs of
each sample were transferred to new protein LoBind microcentrifuge tubes
(Eppendorf, Germany) and an aliquot taken for protein yield determination. All
samples (WCPLs and pellets) were stored at -80°C until further processing. For
protein yield determination, the total protein extracted (WCPLs) from the FFPE
tissues were quantified using the Pierce™ BCA Protein Assay Kit (Pierce
Biotechnology, Thermo Fisher Scientific, USA) according to manufacturer’s
instructions.
Before sample processing for LC-MS/MS analysis, protein pellets were solubilised by
resuspension in protein extraction buffer (50mM Triethylammonium bicarbonate
(TEAB) (Sigma-Aldrich, USA), 4% (w/v) SDS (Sigma-Aldrich, USA), and either
with or without addition of 0.5% (w/v) PEG 20,000) and incubation at 95˚C for 5
min. Thereafter samples were clarified by centrifugation at 10,000 x g for 5 min. The
resultant supernatant was transferred to protein Lobind microcentrifuge tubes
(Eppendorf, Germany). Total protein quantification was performed using the
QuantiPro BCA assay kit (Sigma-Aldrich, USA) according to manufacturer’s
instructions. WCPLs were subsequently processed by the DRC (ThermoFisher
Scientific, 2017), APFAR (Botelho et al., 2010; Doucette et al., 2014; Kachuk et al.,
2015) and/or SP3/HILIC magnetic bead digestion method (Hughes et al., 2019), prior
to LC-MS/MS analysis. Prior to LC-MS/MS analysis, sample pellets were processed
by the APFAR and/or SP3/HILIC methods only, since 4% SDS is not compatible for
DRC use (Fig. 15).
http://etd.uwc.ac.za/
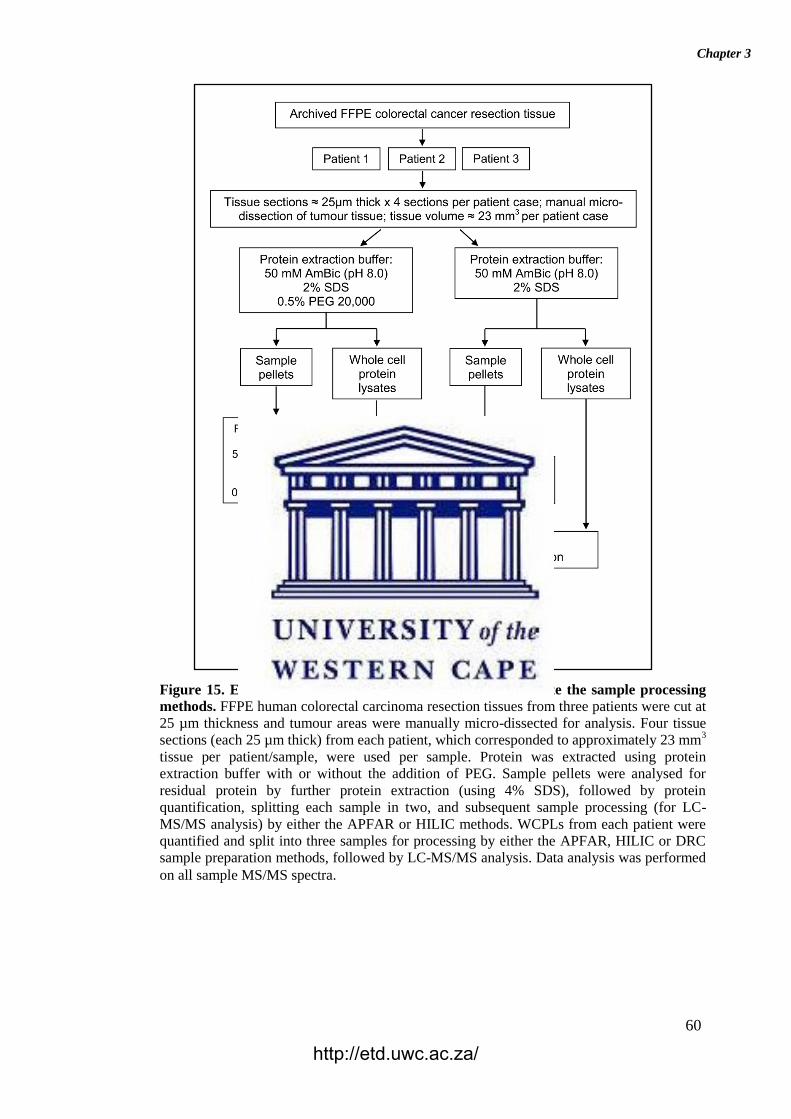
Chapter 3
60
Figure 15. Experimental design and workflow used to evaluate the sample processing
methods. FFPE human colorectal carcinoma resection tissues from three patients were cut at
25 µm thickness and tumour areas were manually micro-dissected for analysis. Four tissue
sections (each 25 µm thick) from each patient, which corresponded to approximately 23 mm3
tissue per patient/sample, were used per sample. Protein was extracted using protein
extraction buffer with or without the addition of PEG. Sample pellets were analysed for
residual protein by further protein extraction (using 4% SDS), followed by protein
quantification, splitting each sample in two, and subsequent sample processing (for LC-
MS/MS analysis) by either the APFAR or HILIC methods. WCPLs from each patient were
quantified and split into three samples for processing by either the APFAR, HILIC or DRC
sample preparation methods, followed by LC-MS/MS analysis. Data analysis was performed
on all sample MS/MS spectra.
http://etd.uwc.ac.za/
Chapter 3
61
3.2.3 Sample preparation methods
3.2.3.1 Detergent removal columns (DRC)
Detergent removal was carried out using ThermoScientific Pierce® Detergent
Removal Spin Columns (ThermoFisher Scientific, USA), according to
manufacturer’s instructions. Briefly, detergent removal columns were placed in 1.5
ml microcentrifuge tubes and the shipping solution removed by centrifugation at
1,500 x g for 1 min. The resin bed was equilibrated with two consecutive washes with
400 μl of 50 mM TEAB and subsequent removal by centrifugation at 1,500 x g for 1
min each. Thereafter, 100 μg of extracted protein was loaded onto the columns and
incubated at room temperature for 2 min. This was followed by centrifugation at
1,500 x g for 2 min to elute the detergent-free protein into protein Lobind
microcentrifuge tubes (Eppendorf, Germany). Samples were then dried down by
vacuum centrifugation and resuspended in 30 μl of 50 mM TEAB.
3.2.3.2 Acetone precipitation and formic acid resolubilisation (APFAR) method
A total of 100 μg protein was transferred to each protein Lobind microcentrifuge tube
and precipitated by addition of four volumes of ice cold acetone (Sigma-Aldrich,
USA) followed by overnight incubation at -20˚C. Samples were then centrifuged at
21,000 x g for 15 min at 4˚C. The supernatant was discarded and the pellet washed
with ice cold acetone. This process was repeated for a total of three pelleting steps.
Thereafter, the pellets were air-dried and subsequently solubilised by re-suspension in
50mM TEAB.
3.2.3.3 In-solution digestion
In-solution digestion was carried out on samples processed by the APFAR (section
3.2.3.2) and DRC (section 3.2.3.1) methods. The protein was reduced by the addition
of 0.1 volumes of 100 mM tris(2-carboxyethyl)phosphine (TCEP) (Sigma-Aldrich,
USA) to each sample followed by incubation at 60˚C for 1 hour. Alkylation was
accomplished by addition of 0.1 volumes of 100 mM methyl methanethiosulphonate
(MMTS) (Sigma-Aldrich, USA), which was prepared in isopropanol (Sigma-Aldrich,
http://etd.uwc.ac.za/
Chapter 3
62
USA), to each sample and subsequent incubation at room temperature for 15 min.
Protein digestion was accomplished by addition of 1:50 (trypsin: final protein ratio)
trypsin (Promega, USA) in a solution with 50mM TEAB, and overnight incubation at
37˚C. Samples were dried down and resuspended in 0.1% trifluoroacetic acid (TFA)
(Sigma-Aldrich, USA) prior to clean-up via Zip-Tip (Sigma-Aldrich, USA), after
which the samples were again dried down and resuspended in a final volume of 12 μl
liquid chromatography (LC) loading buffer (0.1% Formic Acid (FA) (Sigma-Aldrich,
USA), 2% Acetonitrile (ACN) (Burdick & Jackson, USA).
3.2.3.4 SP3/HILIC method with on-bead digestion
In preparation for the HILIC magnetic bead workflow, MagReSyn® HILIC beads
(ReSyn Biosciences, South Africa) were aliquoted into a new tube and the shipping
solution removed. Beads were then washed with 250μl wash buffer (15% ACN,
100mM Ammonium acetate (Sigma-Aldrich, USA) pH 4.5) for 1 min then
resuspended in loading buffer (30% ACN, 200mM Ammonium acetate, pH 4.5). The
rest of the process, described hereafter, was performed using a Hamilton MassSTAR
robotics liquid handler (Hamilton, Switzerland). A total of 50μg of protein from each
sample was transferred to a protein LoBind plate (Merck, Germany). Protein was
reduced with 10mM TCEP (Sigma-Aldrich, USA) and incubated at 60˚C for 1 hour.
Samples were cooled to room temperature and alkylated with 10mM MMTS (Sigma-
Aldrich, USA) at room temperature for 15 min. HILIC magnetic beads were added at
an equal volume to that of the sample and a ratio of 5:1 total protein. The plate was
incubated at room temperature on a shaker at 900 RPM for 30 min for binding of
protein to beads. After binding, the beads were washed four times with 500μl of 95%
ACN for 1 min each. For digestion, trypsin (Promega, USA) made up in 50mM
TEAB was added at a ratio of 1:10 total protein, and the plate was incubated at 37˚C
on the shaker for 4 hours. After digestion, the supernatant containing the peptides was
removed and dried down. The samples were then resuspended in LC loading buffer
(0.1% FA (Sigma-Aldrich, USA), 2% ACN (Burdick & Jackson, USA)).
http://etd.uwc.ac.za/

Chapter 3
63
3.2.4 Label–free LC–MS/MS analysis
LC-MS/MS analysis was conducted with a Q-Exactive quadrupole-Orbitrap mass
spectrometer (Thermo Fisher Scientific, USA) coupled with a Dionex Ultimate 3000
nano-UPLC system. Peptides were dissolved in a solution of 0.1% FA and 2% ACN
and loaded on a C18 trap column (PepMap100, 300μm × 5mm × 5μm). Samples were
trapped onto the column and washed for 3 min before the valve was switched and
peptides eluted onto the analytical column as described hereafter. A gradient of
increasing organic proportion was used for peptide separation - chromatographic
separation was performed with a Waters nanoEase (Zenfit) M/Z Peptide CSH C18
column (75μm × 25cm × 1.7μm) and the solvent system employed was solvent A
(0.1% FA in LC water (Burdick & Jackson, USA)) and solvent B (0.1% FA in ACN).
The multi-step gradient for peptide separation was generated at 300 nL/min as
follows: time change 5 min, gradient change: 2 – 5% solvent B, time change 40 min,
gradient change 5 – 18% solvent B, time change 10 min, gradient change 18 – 30%
solvent B, time change 2 min, gradient change 30 – 80% solvent B. The gradient was
then held at 80% solvent B for 10 min before returning it to 2% solvent B and
conditioning the column for 15 min, as shown in Table 2.
Table 2. Peptide separation gradient setup.
Time (min): Flow rate (µl/min): Solvent A (%): Solvent B (%):
0 0.3 98 2
3 0.3 98 2
8 0.3 95 5
48 0.3 82 18
58 0.3 70 30
60 0.3 20 80
70 0.3 20 80
70.1 0.3 98 2
80 0.3 98 2
All data acquisition was obtained using Proxeon stainless steel emitters (Thermo
Fisher, USA). The mass spectrometer was operated in positive ion mode with a
capillary temperature of 320°C. The applied electrospray voltage was 1.95 kV. The
http://etd.uwc.ac.za/
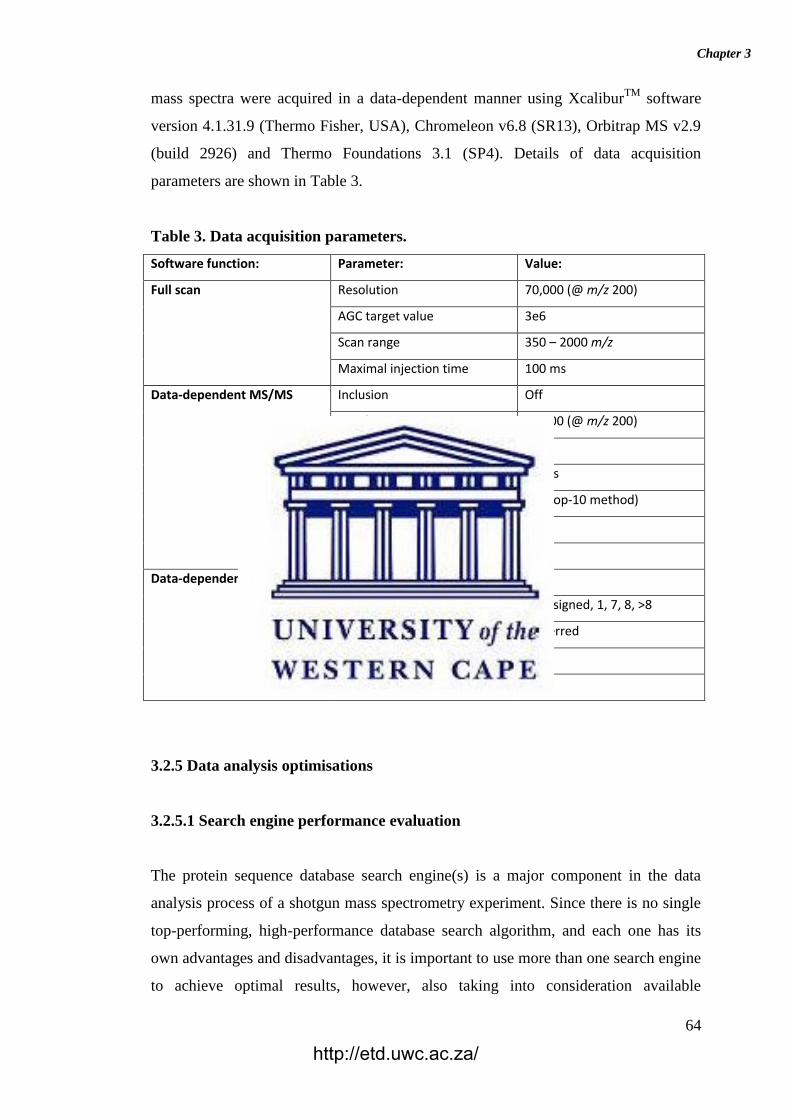
Chapter 3
64
mass spectra were acquired in a data-dependent manner using XcaliburTM
software
version 4.1.31.9 (Thermo Fisher, USA), Chromeleon v6.8 (SR13), Orbitrap MS v2.9
(build 2926) and Thermo Foundations 3.1 (SP4). Details of data acquisition
parameters are shown in Table 3.
Table 3. Data acquisition parameters.
Software function: Parameter: Value:
Full scan Resolution 70,000 (@ m/z 200)
AGC target value 3e6
Scan range 350 – 2000 m/z
Maximal injection time 100 ms
Data-dependent MS/MS Inclusion Off
Resolution 17,500 (@ m/z 200)
AGC target value 1e5
Maximal injection time 50 ms
Loop count 10 (Top-10 method)
Isolation window width 3 Da
NCE 27%
Data-dependent settings Underfill ratio 1%
Charge exclusion Unassigned, 1, 7, 8, >8
Peptide match Preferred
Exclusion isotopes On
Dynamic exclusion 60 s
3.2.5 Data analysis optimisations
3.2.5.1 Search engine performance evaluation
The protein sequence database search engine(s) is a major component in the data
analysis process of a shotgun mass spectrometry experiment. Since there is no single
top-performing, high-performance database search algorithm, and each one has its
own advantages and disadvantages, it is important to use more than one search engine
to achieve optimal results, however, also taking into consideration available
http://etd.uwc.ac.za/
Chapter 3
65
computational power and time limits (Vaudel et al., 2011; Shteynberg et al., 2013).
Studies have found that by combining multiple search engines, it outperforms
individual algorithm usage by increasing overall PSMs with high confidence levels
(Martin et al., 2013; Shteynberg et al., 2013). The process of simultaneously running
multiple search engines is, however, complicated due to each algorithm’s distinct
input parameters requirements and their individual communication interfaces.
Therefore, for this purpose, SearchGUI was developed (Vaudel et al., 2011).
SearchGUI (also available as SearchCLI) allows the user to save, as well as input the
search parameters only once so as to configure and simultaneously start any number
or combination of the search engines available on the platform (Vaudel et al., 2011).
To determine which of the most popular freely available, Linux-compatible search
engines performed the best, five search engines (supported by SearchGUI version
3.3.3), namely OMSSA (version 2.1.9) (Geer et al., 2004), X!Tandem (version
X!Tandem Vengeance 2015.12.15.2) (Craig & Beavis, 2004), MS Amanda (version
2.0.0.9706) (Dorfer et al., 2014), MS-GF+ (version v2018.04.09) (Kim & Pevzner,
2014), and MyriMatch (version 2.2.10165) (Tabb et al., 2007) were compared using
SearchGUI (version 3.3.3) (Vaudel et al., 2011) and PeptideShaker version 1.16.31
(Vaudel et al., 2015) (results shown in Table 4 in section 3.2.5.1.4). Firstly, raw data
(containing centroid MS/MS spectra), obtained from six WCPL raw files, were
converted into mgf (Matrix Science, UK) files using msConvert from the Proteo-
Wizard software suite (Kessner et al., 2008). Peak lists obtained from MS/MS spectra
were identified using OMSSA (version 2.1.9) (Geer et al., 2004), X!Tandem (version
X!Tandem Vengeance 2015.12.15.2) (Craig & Beavis, 2004), MS Amanda (version
2.0.0.9706) (Dorfer et al., 2014), MS-GF+ (version v2018.04.09) (Kim & Pevzner,
2014), and MyriMatch (version 2.2.10165) (Tabb et al., 2007). The search was
conducted using SearchGUI (version 3.3.3) (Vaudel et al., 2011). Protein
identification was conducted against a concatenated target/decoy set of sequences
(Elias & Gygi, 2010) as described in section 3.2.5.1.1 and search engine results were
collated using PeptideShaker as described in section 3.2.5.1.3.
http://etd.uwc.ac.za/
Chapter 3
66
3.2.5.1.1 Generating a target/decoy database from UniProtKB human reviewed
Swiss-Prot proteome
The protein sequences database was generated by combining the 20,341 Homo
sapiens sequences (obtained from UniProtKB human reviewed Swiss-Prot proteome)
and one trypsin Sus scrofa sequence obtained from UniProtKB (Apweiler et al.,
2004), downloaded on 21/05/2018. The decoy sequences were created by reversing
the target sequences in SearchGUI. The identification settings were as follows:
Trypsin, Specific, with a maximum of 2 missed cleavages; 10.0 ppm as MS1 and 0.02
Da as MS2 tolerances; fixed modifications: Methylthio of C (+45.987721 Da),
variable modifications: Oxidation of M (+15.994915 Da), Deamidation of N and Q
(+0.984016 Da); fixed modifications during refinement procedure: Methylthio of C
(+45.987721 Da), variable modifications during refinement procedure: Acetylation of
protein N-term (+42.010565 Da), Pyrolidone from E (--18.010565 Da), Pyrolidone
from Q (--17.026549 Da), Pyrolidone from carbamidomethylated C (--17.026549
Da).
3.2.5.1.2 Generating a target/decoy database from UniProtKB human reference
proteome database
Protein identification was conducted against a concatenated target/decoy (Elias &
Gygi, 2010) version of the Homo sapiens (73,101, >99.9%), Sus scrofa (1, <0.1%)
complement of the UniProtKB (Apweiler et al., 2004) human reference proteome
(UP000005640; 9606-Homo sapiens) version downloaded on 29/10/2018, with
73,102 target sequences. The decoy sequences were created by reversing the target
sequences in SearchGUI. The identification settings were as follows: Trypsin,
Specific, with a maximum of 2 missed cleavages; 10.0 ppm as MS1 and 0.02 Da as
MS2 tolerances; fixed modifications: Methylthio of C (+45.987721 Da), variable
modifications: Oxidation of M (+15.994915 Da), Deamidation of N and Q
(+0.984016 Da); fixed modifications during refinement procedure: Methylthio of C
(+45.987721 Da), variable modifications during refinement procedure: Acetylation of
protein N-term (+42.010565 Da), Pyrolidone from E (--18.010565 Da), Pyrolidone
from Q (--17.026549 Da), Pyrolidone from carbamidomethylated C (--17.026549
Da).
http://etd.uwc.ac.za/
Chapter 3
67
3.2.5.1.3 Identification of peptides and proteins using PeptideShaker
Peptides and proteins were inferred from the spectrum identification results using
PeptideShaker version 1.16.31 (Vaudel et al., 2015). Peptide Spectrum Matches
(PSMs), peptides and proteins were validated at a 1% False Discovery Rate (FDR)
estimated using the decoy hit distribution. Post-translational modification
localizations were scored using the D-score (Vaudel et al., 2013) and the phosphoRS
score (Taus et al., 2011) with a threshold of 95.0 as implemented in the compomics-
utilities package (Barsnes et al., 2011).
3.2.5.1.4 Search engine performance evaluation results
Search engine performance was evaluated based on the number of PSMs, unique
PSMs, unassigned PSMs and percentage identification rate (Table 4) using the same
dataset (six WCPL raw files) described in section 3.2.5.1.
Table 4. Search engine performance evaluation.
Parameter tested:
OMSSA: X!Tandem: MS Amanda: MS-GF+: MyriMatch:
Number of PSM
5861
(±1134) 7343 (±1400) 7091 (±1399)
6987 (±1409)
6380 (±1238)
Unique PSMs
44 (±19) 258 (±62) 12 (±5) 56 (±22) 11 (±5)
Unassigned PSMs
17482 (±1250)
16000 (±1275)
16253 (±1278) 16356
(±1303) 16964
(±1277)
% Identification rate
25.0 (±3.5) 31.3 (±4.4) 30.3 (±4.4) 29.8 (±4.5) 27.2 (±3.9)
Based on these parameters, the overall top three performing search engines were
found to be X!Tandem, MS Amanda, and MS-GF+. These three search engines will
be used for all subsequent data analysis. Next, the protein sequence databases
(sections 3.2.5.1.1 and 3.2.5.1.2) were evaluated to determine the best suited database
for this study.
http://etd.uwc.ac.za/
Chapter 3
68
3.2.5.2 Protein sequence database evaluation
The protein sequence database is another crucial component of the data analysis
process of a shotgun mass spectrometry experiment. The contents of the protein
sequence database determine which proteins are discovered/identified in the sample
analysed, as well as the subsequent biological conclusions derived from the
experiment. A peptide cannot be identified if it is not present in the search database
used, even when it is present within the sample analysed. It is therefore of utmost
importance to select the appropriate database that is suitable for the specific
experiment analysed (Kumar et al., 2017; Netzel & Dasari, 2017). Since the
completeness of the repository-style databases as well as the accuracy of curated
databases are required for the initial exploration of a sample’s proteome, the
UniProtKB sequence databases provide the best choice for a large number of
organisms. UniProtKB contains the corresponding curated SwissProt entries as well
as the translated TrEMBL entries (Netzel & Dasari, 2017). Other factors that need to
be considered include database size (the number of protein sequences it contains) and
search parameters selection (such as precursor tolerance, missed cleavages and PTM
selection) affect an experiment’s time complexity, as well as the number of peptides
identified from the database search (Kumar et al., 2017; Netzel & Dasari, 2017).
Time complexity and computational resource requirements increase with increased
database size. The various search parameters also affect the search space and can
magnify database size many folds. In addition, larger databases also result in more
false-positive peptide identifications, and by increasing database size beyond
expected proteome size tends to decrease overall numbers of identifications (Kumar
et al., 2017; Netzel & Dasari, 2017). The best strategy is to select a well annotated,
organism-specific, representative genome-wide protein sequence database (with
highly robust mapping/linkage schemes, to ensure data linkage and integrity) and use
it throughout a project, in all aspects of the project (Martin et al., 2013). Trying to
translate across multiple different databases is not only a waste of time but also
results in data loss and corruption, no matter how robust the implemented scheme is
(Martin et al., 2013).
In order to make an informed choice on the optimal protein sequence database to use,
two UniProt search databases, the UniProtKB human reviewed Swiss-Prot protein
http://etd.uwc.ac.za/
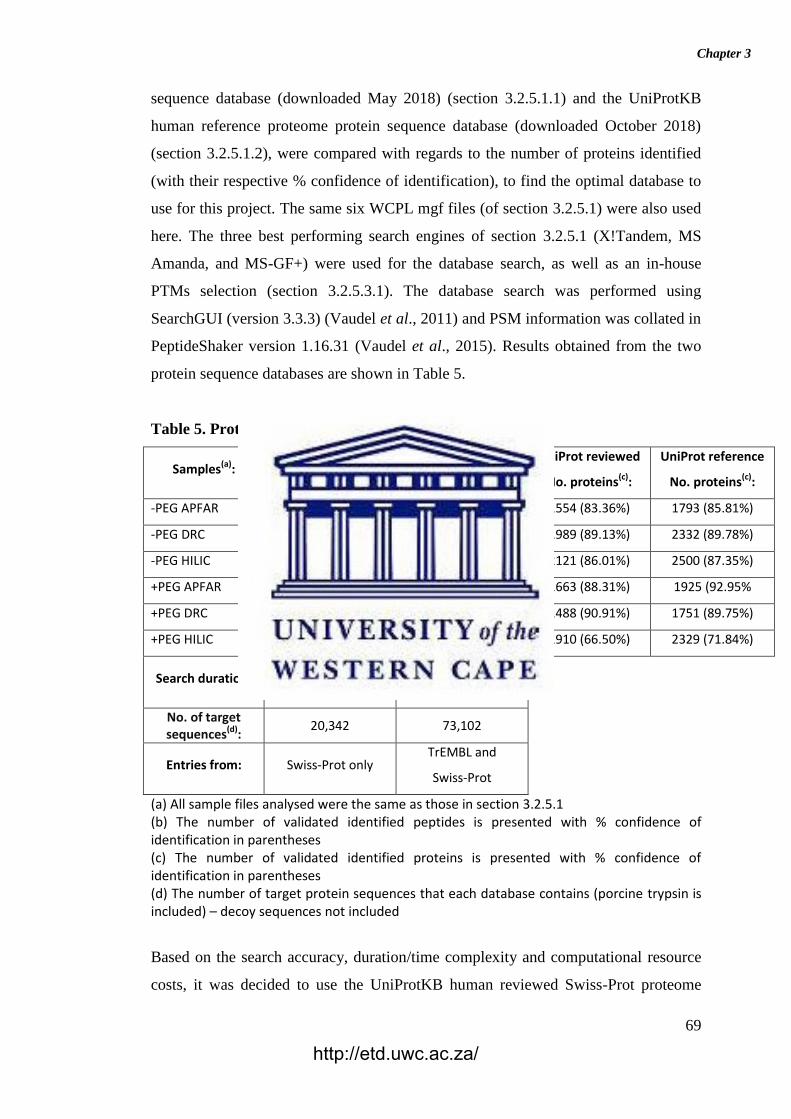
Chapter 3
69
sequence database (downloaded May 2018) (section 3.2.5.1.1) and the UniProtKB
human reference proteome protein sequence database (downloaded October 2018)
(section 3.2.5.1.2), were compared with regards to the number of proteins identified
(with their respective % confidence of identification), to find the optimal database to
use for this project. The same six WCPL mgf files (of section 3.2.5.1) were also used
here. The three best performing search engines of section 3.2.5.1 (X!Tandem, MS
Amanda, and MS-GF+) were used for the database search, as well as an in-house
PTMs selection (section 3.2.5.3.1). The database search was performed using
SearchGUI (version 3.3.3) (Vaudel et al., 2011) and PSM information was collated in
PeptideShaker version 1.16.31 (Vaudel et al., 2015). Results obtained from the two
protein sequence databases are shown in Table 5.
Table 5. Protein sequence database evaluation.
Samples(a): UniProt reviewed
No. peptides(b):
UniProt reference
No. peptides(b):
UniProt reviewed
No. proteins(c):
UniProt reference
No. proteins(c):
-PEG APFAR 5021 (88.19%) 5055 (86.02%) 1554 (83.36%) 1793 (85.81%)
-PEG DRC 7203 (81.92%) 7223 (80.33%) 1989 (89.13%) 2332 (89.78%)
-PEG HILIC 7717 (74.93%) 7736 (75.60%) 2121 (86.01%) 2500 (87.35%)
+PEG APFAR 5173 (81.22%) 5171 (78.47%) 1663 (88.31%) 1925 (92.95%
+PEG DRC 5173 (87.60%) 5228 (83.90%) 1488 (90.91%) 1751 (89.75%)
+PEG HILIC 6668 (77.67%) 6688 (77.85%) 1910 (66.50%) 2329 (71.84%)
Search duration: 3 hours 21 minutes
11.0 seconds
6 hours 40 minutes
52.0 seconds
No. of target sequences(d):
20,342 73,102
Entries from: Swiss-Prot only TrEMBL and
Swiss-Prot
(a) All sample files analysed were the same as those in section 3.2.5.1 (b) The number of validated identified peptides is presented with % confidence of identification in parentheses (c) The number of validated identified proteins is presented with % confidence of identification in parentheses (d) The number of target protein sequences that each database contains (porcine trypsin is included) – decoy sequences not included
Based on the search accuracy, duration/time complexity and computational resource
costs, it was decided to use the UniProtKB human reviewed Swiss-Prot proteome
http://etd.uwc.ac.za/
Chapter 3
70
protein sequence database (with 20,342 target sequences). Moreover, since 159
samples/files will be analysed for the block age and sample preparation methods
comparison study of chapter 4, the duration/time complexity and computational
resource costs will be too high when using a larger protein sequence database. In
addition, the human reviewed Swiss-Prot database contains manually curated protein
sequences without any isoforms or redundant sequences, unlike the human reference
proteome database, which may result in more false-positive peptide and protein
identifications (Kumar et al., 2017; Netzel & Dasari, 2017). Therefore, the
UniProtKB human reviewed Swiss-Prot proteome protein sequence database will be
used for all subsequent data analysis within this study. The next component evaluated
is the search parameter post-translational modification (PTM) preselection, to
determine which combination of PTMs gave optimal results.
3.2.5.3 Evaluation of formalin-induced protein post-translational modification
(PTM) preselection during database search
To determine which PTM selection would be best suited for optimal PSM
assignment, an in-house PTM selection was compared to a combination of PTMs
selected from the literature (Guo et al., 2007; Zhang et al., 2015; Holfeld et al.,
2018). The aim was to determine which PTM selection resulted in the highest number
of identified peptides and proteins with sufficiently adequate confidence levels in the
PSMs generated, as well as taking computing resources and time into consideration.
The same six WCPL mgf files used in sections 3.2.5.1 and 3.2.5.2 were also used
here, together with the three best performing search engines of section 3.2.5.1
(X!Tandem, MS Amanda, and MS-GF+) and the UniProtKB human reviewed Swiss-
Prot protein sequence database (downloaded May 2018) for the database search. Two
different sets of PTMs were selected as described in sections 3.2.5.3.1 and 3.2.5.3.2.
The database search was performed using SearchGUI (version 3.3.3) (Vaudel et al.,
2011) and PSM information was collated in PeptideShaker version 1.16.31 (Vaudel et
al., 2015) as described in section 3.2.5.1.3. The results are shown in Tables 6 and 7 of
section 3.2.5.3.3.
http://etd.uwc.ac.za/
Chapter 3
71
3.2.5.3.1 In-house PTM selection
Identification parameters were set as follows: Trypsin, Specific, with a maximum of 2
missed cleavages; 10.0 ppm as MS1 and 0.02 Da as MS2 tolerances; fixed
modifications: Methylthio of C (+45.987721 Da), variable modifications: Oxidation
of M (+15.994915 Da), Deamidation of N and Q (+0.984016 Da); fixed modifications
during refinement procedure: Methylthio of C (+45.987721 Da), variable
modifications during refinement procedure: Acetylation of protein N-term
(+42.010565 Da), Pyrolidone from E (--18.010565 Da), Pyrolidone from Q (--
17.026549 Da), Pyrolidone from carbamidomethylated C (--17.026549 Da.
3.2.5.3.2 All PTM selections
Formalin-induced PTM preselection combinations from the literature (Guo et al.,
2007; Zhang et al., 2015; Holfeld et al., 2018) were chosen for the identification
settings, as follows: Trypsin, Specific, with a maximum of 2 missed cleavages; 10.0
ppm as MS1 and 0.02 Da as MS2 tolerances; fixed modifications: Methylthio of C
(+45.987721 Da), variable modifications: Oxidation of M (+15.994915 Da),
Acetylation of protein N-term (+42.010565 Da), Carbamilation of K (+43.005814
Da), Deamidation of N and Q (+0.984016 Da), Methylation of K (+14.01565 Da);
fixed modifications during refinement procedure: Methylthio of C (+45.987721 Da),
variable modifications during refinement procedure: Pyrolidone from E (--18.010565
Da), Pyrolidone from Q (--17.026549 Da), Pyrolidone from carbamidomethylated C
(--17.026549 Da).
3.2.5.3.3 Formalin-induced protein PTMs pre-selection evaluation results
Table 6 shows that with increased number of PTM selected, the search time also
increases (>8 hours), which is not ideal since 159 samples/files will be analysed for
the block age and sample preparation methods comparison study of chapter 4, thereby
unfavourably increasing the computational resource costs.
http://etd.uwc.ac.za/
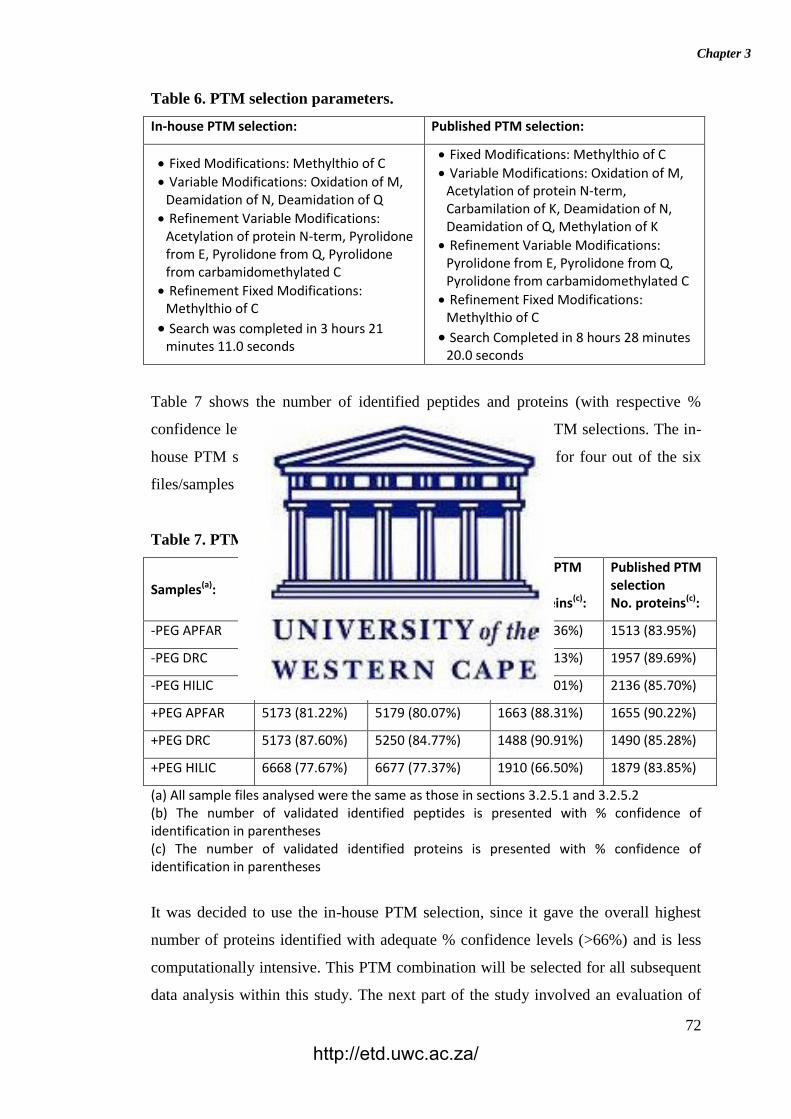
Chapter 3
72
Table 6. PTM selection parameters.
In-house PTM selection: Published PTM selection:
Fixed Modifications: Methylthio of C
Variable Modifications: Oxidation of M, Deamidation of N, Deamidation of Q
Refinement Variable Modifications: Acetylation of protein N-term, Pyrolidone from E, Pyrolidone from Q, Pyrolidone from carbamidomethylated C
Refinement Fixed Modifications: Methylthio of C
Search was completed in 3 hours 21 minutes 11.0 seconds
Fixed Modifications: Methylthio of C
Variable Modifications: Oxidation of M, Acetylation of protein N-term, Carbamilation of K, Deamidation of N, Deamidation of Q, Methylation of K
Refinement Variable Modifications: Pyrolidone from E, Pyrolidone from Q, Pyrolidone from carbamidomethylated C
Refinement Fixed Modifications: Methylthio of C
Search Completed in 8 hours 28 minutes 20.0 seconds
Table 7 shows the number of identified peptides and proteins (with respective %
confidence levels of assignment) between the two groups of PTM selections. The in-
house PTM selection resulted in more protein identifications for four out of the six
files/samples analysed.
Table 7. PTM selection evaluation.
Samples(a): In-house PTM selection No. peptides(b):
Published PTM selection No. peptides(b):
In-house PTM selection No. proteins(c):
Published PTM selection No. proteins(c):
-PEG APFAR 5021 (88.19%) 5169 (86.01%) 1554 (83.36%) 1513 (83.95%)
-PEG DRC 7203 (81.92%) 7225 (81.88%) 1989 (89.13%) 1957 (89.69%)
-PEG HILIC 7717 (74.93%) 7764 (72.11%) 2121 (86.01%) 2136 (85.70%)
+PEG APFAR 5173 (81.22%) 5179 (80.07%) 1663 (88.31%) 1655 (90.22%)
+PEG DRC 5173 (87.60%) 5250 (84.77%) 1488 (90.91%) 1490 (85.28%)
+PEG HILIC 6668 (77.67%) 6677 (77.37%) 1910 (66.50%) 1879 (83.85%)
(a) All sample files analysed were the same as those in sections 3.2.5.1 and 3.2.5.2 (b) The number of validated identified peptides is presented with % confidence of identification in parentheses (c) The number of validated identified proteins is presented with % confidence of identification in parentheses
It was decided to use the in-house PTM selection, since it gave the overall highest
number of proteins identified with adequate % confidence levels (>66%) and is less
computationally intensive. This PTM combination will be selected for all subsequent
data analysis within this study. The next part of the study involved an evaluation of
http://etd.uwc.ac.za/
Chapter 3
73
the effect of PEG on the protein extraction efficiency and reproducibility of the
protein extraction buffer used. In addition, a pilot study of the three different sample
processing methods, to give an estimate of expected results and statistically
significant sample size required for the larger block age and sample preparation
methods comparison study (chapter 4), was performed.
3.2.6 Data and statistical analyses – evaluating the effect of PEG on protein
extraction efficiency
Raw data containing centroid MS/MS spectra were converted into mgf (Matrix
Science, UK) files using msconvert from the Proteo-Wizard software suite (Kessner
et al., 2008). Peak lists obtained from MS/MS spectra were identified using
X!Tandem (version X!Tandem Vengeance 2015.12.15.2) (Craig & Beavis, 2004),
MS Amanda (version 2.0.0.9706) (Dorfer et al., 2014) and MS-GF+ (version
2018.04.09) (Kim & Pevzner, 2014) with parameter settings as described in section
3.2.5.3.1. The search was conducted using SearchGUI (version 3.3.3) (Vaudel et al.,
2011) and spectrum identification was conducted against a concatenated target/decoy
protein sequence database as described in sections 3.2.5.1.1 and 3.2.5.3.1. Peptides
and proteins were inferred from the spectrum identification results as described in
section 3.2.5.1.3, using PeptideShaker version 1.16.40 (Vaudel et al., 2015). (Refer to
Appendix A for search algorithms specific settings).
Qualitative and quantitative data were exported from PeptideShaker and parsed using
in-house scripts and graphs generated in Jupyter lab (using Pandas, NumPy, and
Matplotlib Python packages), as well as Microsoft® Excel. Graphs and figures were
annotated and/or resolution quality increased using Inkscape (version 0.92.4).
Venny version 2.1.0 (Oliveros, 2007) was used to generate Venn diagrams to
visualise the consistency of peptide and/or protein identifications between samples.
Spectrum counting abundance indexes were estimated using the Normalised
Spectrum Abundance Factor (NSAF) (Powell et al., 2004) adapted for better handling
of protein inference issues and peptide detectability. The NSAF method followed
here involves counting the number of spectra attributed to each protein in the result
set, which is subsequently normalised to a relative abundance (Vaudel et al., 2011;
http://etd.uwc.ac.za/
Chapter 3
74
Vaudel, 2017). In the PeptideShaker implementation, this count is then normalised
for the length of the protein, the presence of shared peptides, as well as redundant
peptides. The spectrum counting indexes were exported from PeptideShaker and
parsed using in-house scripts. The NSAF values (of common/shared proteins only)
were multiplied by the lowest factor calculated for each pair of conditions compared,
in order to deal with integers and facilitate comparisons. These NSAF values were
then used to estimate the extent of differential protein abundance (of common/shared
proteins only) by calculating the Pearson’s correlation coefficient (PCC), for each
pair of conditions compared, to assess the relationship/level of correlation between
samples. PCC graphs (Appendix B – Supplementary figure S2) were generated in
Jupyter lab, using Pandas, NumPy, and Matplotlib Python packages.
The physicochemical properties of the identified peptides, including the
hydropathicity (Kyte-Doolittle scale), molecular weight, and isoelectric point were
calculated for each sample using the Protein Property Analysis Software (ProPAS)
version 1.1 (Wu & Zhu, 2012).
Protein annotations regarding subcellular localisation were retrieved from Ensembl
(www.ensembl.org) using GOSlim UniProtKB-GOA (www.ebi.ac.uk/GOA) to
minimise the number of terms retrieved. Hypergeometric testing was used to
calculate the significance of gene ontology terms.
3.2.7 Data sharing information
The mass spectrometry data along with the identification results have been deposited
to the PRIDE (Perez-Riverol et al., 2019) archive
(http://www.ebi.ac.uk/pride/archive/) via the PRIDE partner repository with the data
set identifier PXD014419 and DOI: 10.6019/PXD014419.
Username: [email protected] Password: NXFglOM7
3.3 Results and discussion
The objectives of this pilot study is to determine whether the presence or absence of
PEG during protein extraction generated better results in a label-free quantitative
http://etd.uwc.ac.za/
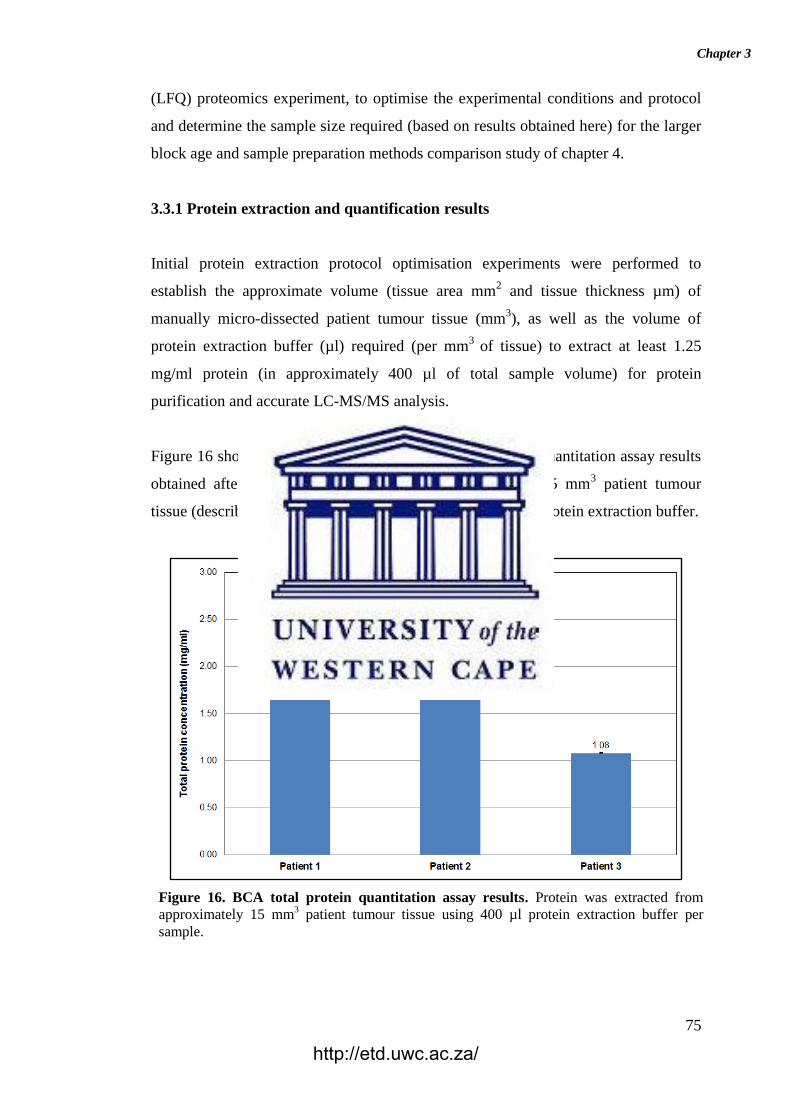
Chapter 3
75
(LFQ) proteomics experiment, to optimise the experimental conditions and protocol
and determine the sample size required (based on results obtained here) for the larger
block age and sample preparation methods comparison study of chapter 4.
3.3.1 Protein extraction and quantification results
Initial protein extraction protocol optimisation experiments were performed to
establish the approximate volume (tissue area mm2 and tissue thickness µm) of
manually micro-dissected patient tumour tissue (mm3), as well as the volume of
protein extraction buffer (µl) required (per mm3
of tissue) to extract at least 1.25
mg/ml protein (in approximately 400 µl of total sample volume) for protein
purification and accurate LC-MS/MS analysis.
Figure 16 shows the bicinchoninic acid (BCA) total protein quantitation assay results
obtained after protein was extracted from approximately 15 mm3 patient tumour
tissue (described in sections 3.2.1 and 3.2.2) using 400 µl of protein extraction buffer.
Figure 16. BCA total protein quantitation assay results. Protein was extracted from
approximately 15 mm3 patient tumour tissue using 400 µl protein extraction buffer per
sample.
http://etd.uwc.ac.za/
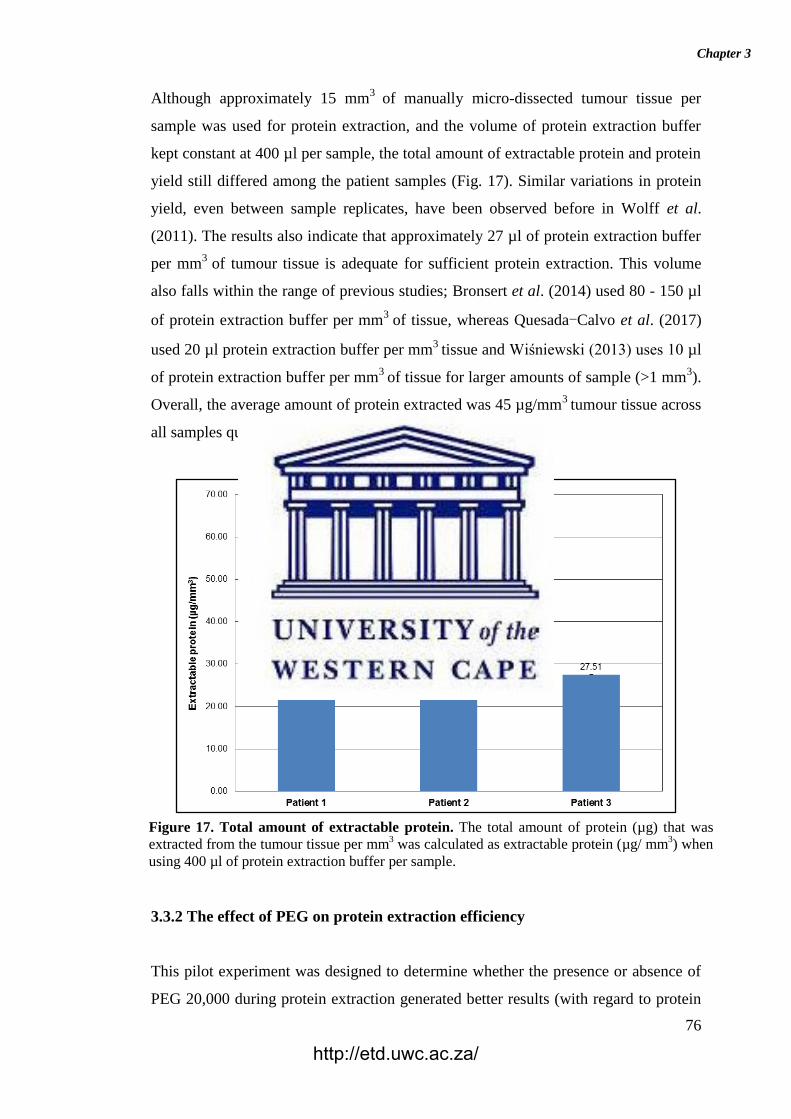
Chapter 3
76
Although approximately 15 mm3
of manually micro-dissected tumour tissue per
sample was used for protein extraction, and the volume of protein extraction buffer
kept constant at 400 µl per sample, the total amount of extractable protein and protein
yield still differed among the patient samples (Fig. 17). Similar variations in protein
yield, even between sample replicates, have been observed before in Wolff et al.
(2011). The results also indicate that approximately 27 µl of protein extraction buffer
per mm3
of tumour tissue is adequate for sufficient protein extraction. This volume
also falls within the range of previous studies; Bronsert et al. (2014) used 80 - 150 µl
of protein extraction buffer per mm3
of tissue, whereas Quesada-Calvo et al. (2017)
used 20 µl protein extraction buffer per mm3
tissue and Wiśniewski (2013) uses 10 µl
of protein extraction buffer per mm3
of tissue for larger amounts of sample (>1 mm3).
Overall, the average amount of protein extracted was 45 µg/mm3
tumour tissue across
all samples quantified (Fig. 17).
3.3.2 The effect of PEG on protein extraction efficiency
This pilot experiment was designed to determine whether the presence or absence of
PEG 20,000 during protein extraction generated better results (with regard to protein
Figure 17. Total amount of extractable protein. The total amount of protein (µg) that was
extracted from the tumour tissue per mm3 was calculated as extractable protein (µg/ mm
3) when
using 400 µl of protein extraction buffer per sample.
http://etd.uwc.ac.za/
Chapter 3
77
extraction efficiency, protein yield, and method reproducibility) with label-free LC-
MS/MS analysis. In addition, the results will also give an idea of the statistically
significant sample size required for the larger block age and sample preparation
methods comparison study of chapter 4, to minimise the influence of biological
variance between patient samples on the proteomic data.
Here FFPE colonic resection tumour tissues of three patients (diagnosed as indicated
in Table 1) were processed using protein extraction buffer with or without the
addition of PEG. To further determine protein extraction buffer efficiency, the sample
pellets were also assessed for residual proteins that were not extracted in the initial
extraction, which used 2% SDS. Extracted protein was purified by three different
methods (APFAR, DRC, or HILIC) and, for preliminary analysis, the best method’s
data was used to evaluate proteome coverage, proportion of missed cleavages, and
enrichment/selection bias based on protein extraction buffer components used.
3.3.2.1 Preliminary evaluation of the protein purification methods
Initially, to determine which sample preparation method performed the best, only the
data from WCPL samples extracted without PEG were analysed, to evaluate the
efficiency and reproducibility for each method (APFAR, DRC, or HILIC), at both
protein and peptide level, with regards to proteome coverage and overlap (Fig. 18).
Overall, the HILIC sample preparation method showed adequate reproducibility and
resulted in the highest numbers of identifications; 7068 ± 624 for validated peptides
and 1952 ± 183 for validated proteins identified (Fig. 18 A and C). On the other hand,
the APFAR method showed higher reproducibility at both peptide and protein level,
but by comparison it had the lowest numbers of identifications; 5270 ± 348 for
validated peptides and 1607 ± 104 for validated proteins identified. The DRC method
performed intermediately between the other two methods with 6462 ± 667 validated
peptides and 1879 ± 100 validated proteins identified.
http://etd.uwc.ac.za/
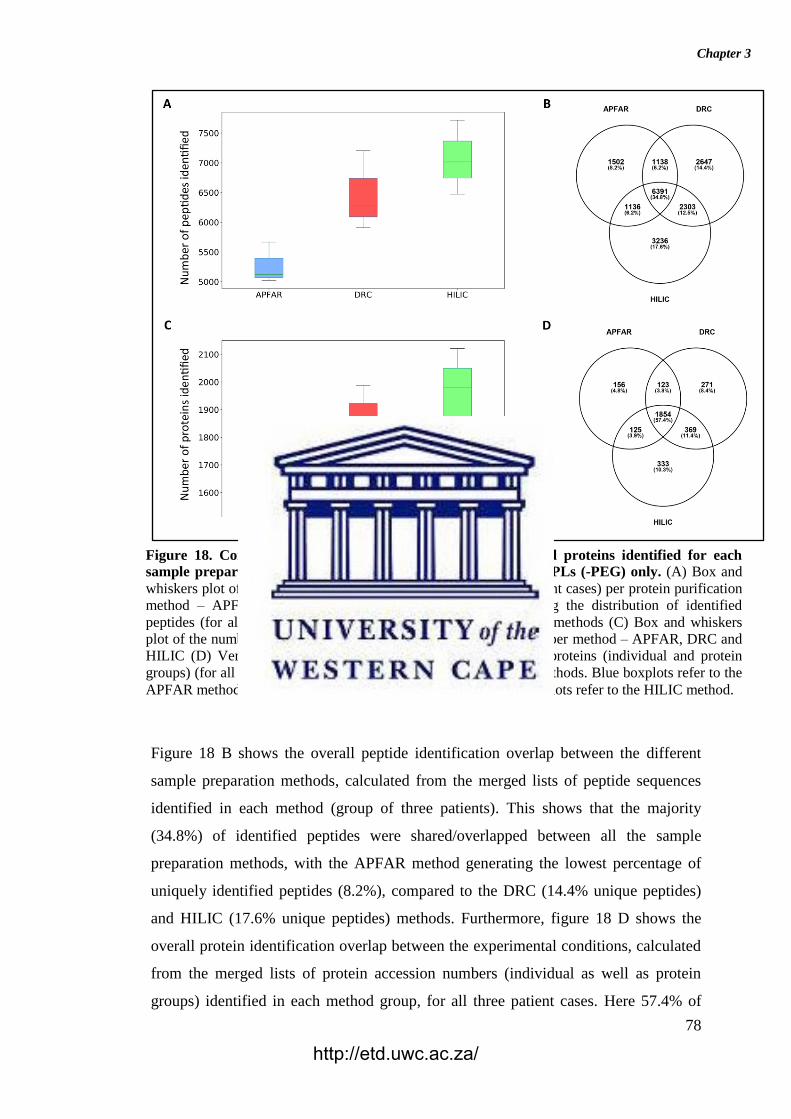
Chapter 3
78
Figure 18 B shows the overall peptide identification overlap between the different
sample preparation methods, calculated from the merged lists of peptide sequences
identified in each method (group of three patients). This shows that the majority
(34.8%) of identified peptides were shared/overlapped between all the sample
preparation methods, with the APFAR method generating the lowest percentage of
uniquely identified peptides (8.2%), compared to the DRC (14.4% unique peptides)
and HILIC (17.6% unique peptides) methods. Furthermore, figure 18 D shows the
overall protein identification overlap between the experimental conditions, calculated
from the merged lists of protein accession numbers (individual as well as protein
groups) identified in each method group, for all three patient cases. Here 57.4% of
Figure 18. Comparison of the overall number of peptides and proteins identified for each
sample preparation method (APFAR, DRC, or HILIC) for WCPLs (-PEG) only. (A) Box and
whiskers plot of the number of peptides identified (for all three patient cases) per protein purification
method – APFAR, DRC and HILIC (B) Venn diagram depicting the distribution of identified
peptides (for all three patient cases) among all sample preparation methods (C) Box and whiskers
plot of the number of proteins identified (for all three patient cases) per method – APFAR, DRC and
HILIC (D) Venn diagram depicting the distribution of identified proteins (individual and protein
groups) (for all three patient cases) among all sample preparation methods. Blue boxplots refer to the
APFAR method; Red boxplots refer to the DRC method; Green boxplots refer to the HILIC method.
http://etd.uwc.ac.za/
Chapter 3
79
identified proteins were shared/overlapped between all the experimental conditions,
also with lower percentages of unique proteins identified for the APFAR method
(4.8%), followed by DRC method (8.4%). The HILIC method has the highest
percentage of unique proteins at 10.3%.
Since the HILIC protein purification method performed the best in this pilot study,
the effect of PEG on the protein extraction buffer efficiency and reproducibility was
assessed using only the HILIC-processed samples’ data (WCPLs and pellets).
3.3.2.2 The effect of PEG on peptide and protein identifications
The efficiency and reproducibility for each experimental condition (WCPLs extracted
with 2% SDS and either with or without PEG, pellets extracted with 4% SDS and
either with or without PEG), at both protein and peptide level was assessed with
regards to proteome coverage (number of peptides and proteins identified) (Fig. 19A
and C) and percentage of overlap of identified peptides and proteins (Fig.19B and D).
Average results (with standard deviation) for all three patients (from non-fractionated
LC–MS/MS analysis) show that overall, the WCPLs extracted with 2% SDS and PEG
showed lower numbers of identifications (p > 0.05), at both peptide and protein
levels; 6828 ± 560 for validated peptides and 1927 ± 125 for validated proteins
identified (Fig. 19 A and C). On the other hand, the WCPLs extracted without PEG
showed higher numbers of identifications (p > 0.05); 7068 ± 624 for validated
peptides and 1952 ± 183 for validated proteins with adequate reproducibility. A
summary of the statistical analysis is shown in Supplementary table 2. The pellet
samples (extracted with 4% SDS) showed higher overall variability, at both peptide
and protein levels, however the number of peptide and protein identifications were
high at 6018 ± 2111 for validated peptides and 1601 ± 408 for validated proteins
identified for pellets extracted without PEG and 4777 ± 1751 for validated peptides
and 1332 ± 375 for validated proteins identified for pellets extracted with PEG (Fig.
19 A and C). Using HeLa cells, Wiśniewski et al. (2011) found that the addition of
PEG to the protein extraction buffer improves protein extraction efficiency of
samples that contained sub-microgram to microgram amounts of protein; however
PEG’s ability to improve protein extraction efficiency was compromised when
http://etd.uwc.ac.za/
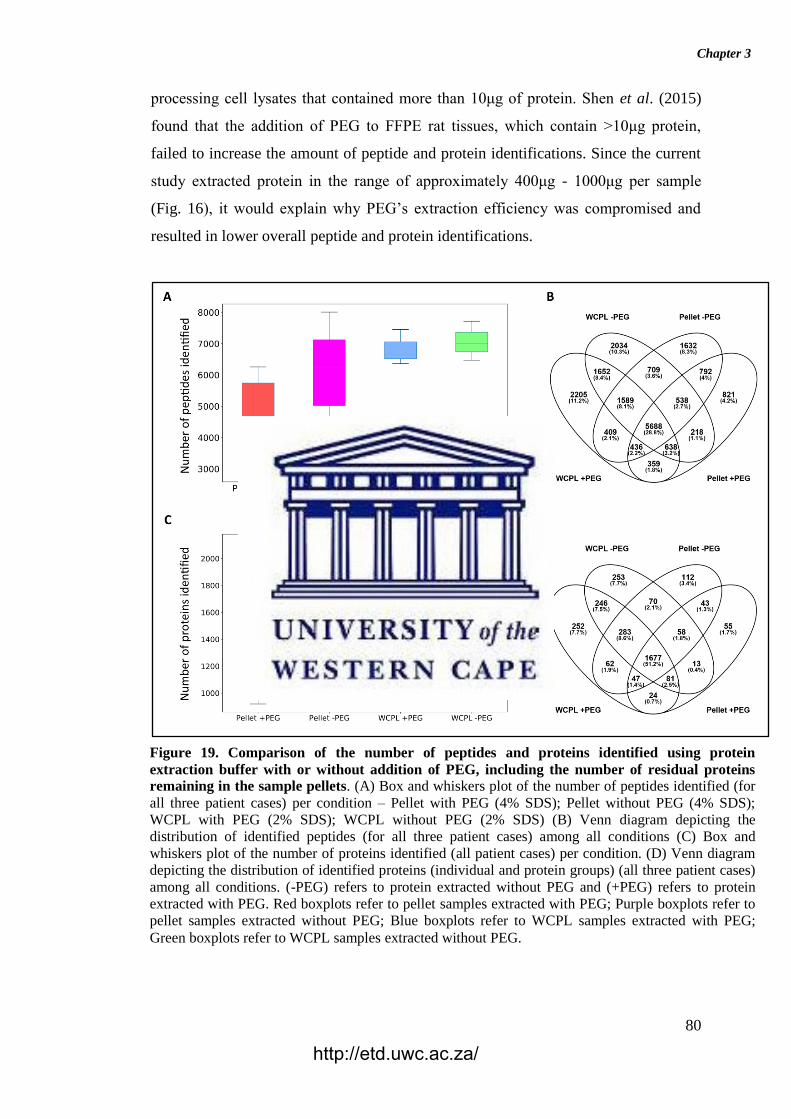
Chapter 3
80
processing cell lysates that contained more than 10μg of protein. Shen et al. (2015)
found that the addition of PEG to FFPE rat tissues, which contain >10μg protein,
failed to increase the amount of peptide and protein identifications. Since the current
study extracted protein in the range of approximately 400μg - 1000μg per sample
(Fig. 16), it would explain why PEG’s extraction efficiency was compromised and
resulted in lower overall peptide and protein identifications.
Figure 19. Comparison of the number of peptides and proteins identified using protein
extraction buffer with or without addition of PEG, including the number of residual proteins
remaining in the sample pellets. (A) Box and whiskers plot of the number of peptides identified (for
all three patient cases) per condition – Pellet with PEG (4% SDS); Pellet without PEG (4% SDS);
WCPL with PEG (2% SDS); WCPL without PEG (2% SDS) (B) Venn diagram depicting the
distribution of identified peptides (for all three patient cases) among all conditions (C) Box and
whiskers plot of the number of proteins identified (all patient cases) per condition. (D) Venn diagram
depicting the distribution of identified proteins (individual and protein groups) (all three patient cases)
among all conditions. (-PEG) refers to protein extracted without PEG and (+PEG) refers to protein
extracted with PEG. Red boxplots refer to pellet samples extracted with PEG; Purple boxplots refer to
pellet samples extracted without PEG; Blue boxplots refer to WCPL samples extracted with PEG;
Green boxplots refer to WCPL samples extracted without PEG.
http://etd.uwc.ac.za/
Chapter 3
81
Figure 19 B shows the overall peptide identification overlap between the
experimental conditions, calculated from the merged lists of peptide sequences
identified in each sample group. This shows that 28.8% of identified peptides were
shared/overlapped between all the experimental conditions, with lower percentages of
unique peptides identified for the pellets (8.3% without PEG and 4.2% with PEG),
compared to the WCPLs (10.3% without PEG and 11.2% with PEG).
Furthermore, figure 19 D shows the overall protein identification overlap between the
experimental conditions, calculated from the merged lists of protein accession
numbers (individual as well as protein groups) identified in each sample group, for all
three patient cases. Here 51.2% of identified proteins were shared/overlapped
between all the experimental conditions, also with lower percentages of unique
proteins identified for the pellets (3.4% without PEG and 1.7% with PEG), compared
to the WCPLs (7.7% with and without PEG). This indicates that the majority of
proteins were extracted in the initial WCPLs using 2% SDS. Therefore, the extraction
buffer containing 2% SDS, as well as the extraction protocol used was sufficiently
efficient to extract the majority of proteins from the patient samples (WCPLs), and
the main differences occurred due to the addition of PEG to the extraction buffer. Shi
et al. (2006) found that 2% SDS is a critical chemical component for the successful
extraction of protein from human FFPE tissue sections, which is also supported by
other studies (Ikeda et al., 1998; Guo et al., 2007; Maes et al., 2013; Tanca et al.,
2014). However, some studies recommend a concentration of 4% SDS for optimal
protein extraction (Wiśniewski et al., 2009; Craven et al., 2013; Fu et al., 2013;
Bronsert et al., 2014).
Shared/common peptides and proteins between the pellet samples and WCPLs are
due to soluble fraction/liquid (containing protein) remaining trapped within the
sample pellets, after protein extraction and homogenate clarification (by
centrifugation) (Scopes, 1994). This is due to the fact that human tissues contain large
amounts of insoluble cellular materials that greatly bind to water. As a result, the total
loss of liquid (soluble fraction/sample protein) depends on the amount of insoluble
cellular materials/debris present. When more protein extraction buffer is added, a
larger proportion of the liquid/soluble fraction will be extracted, however, the extract
will be more dilute, which is an unfavourable outcome for this current study.
http://etd.uwc.ac.za/
Chapter 3
82
Furthermore, the unique peptides of the pellet samples may also, in part, be attributed
by the higher SDS concentration (4% SDS) used for extraction, since other studies
have found greater protein extraction efficiency by using higher SDS concentrations
(Wiśniewski et al., 2009; Craven et al., 2013; Fu et al., 2013; Bronsert et al., 2014).
The qualitative reproducibility for each sample and experimental condition was also
measured in terms of peptide identification overlap (Appendix B – Supplementary
figure S1), calculated from the peptide sequences identified in each sample and
experimental condition, irrespective of peptide abundance. From these results, the
average physicochemical properties of the peptides (unique as well as shared) for all
conditions were assessed for each patient (Appendix C – Supplementary table 1) and
there were no substantial differences observed. The quantitative reproducibility
between experimental conditions were expressed as PCC dot plots (Appendix B –
Supplementary figure S2), which were calculated based on the NSAF abundance
values for identified proteins in each sample and experimental condition. All
samples/experimental conditions yielded comparable relative protein abundances,
indicating that protein extraction with and without PEG did not introduce a
significant observable bias with regard to proteome composition.
3.3.2.3 Evaluation of protein physicochemical properties and GO analysis of
identified proteins
The effect of PEG on protein extraction buffer selection and/or enrichment bias with
regards to protein physicochemical properties were assessed in the box and whisker
plots of figure 20, which provides a statistical comparison between the samples and
illustrates the peptide distribution according to hydropathicity, molecular weight and
isoelectric point (pI). In addition, the protein extraction buffers’ (with or without
addition of PEG) protein selection bias, as well as residual proteins of the sample
pellets, was assessed with regards to subcellular localisation, using Gene Ontology
(GO) annotation whereby the distribution of the percentages of proteins belonging to
each GO term was plotted (Fig. 21).
http://etd.uwc.ac.za/
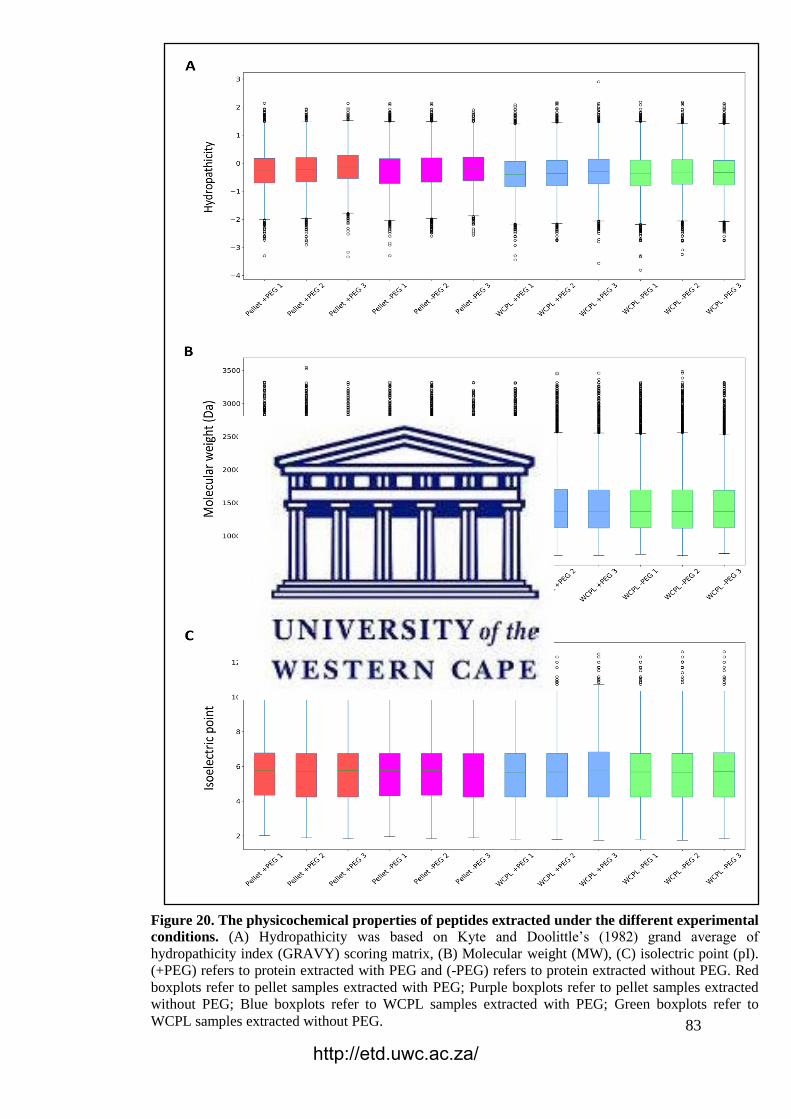
Chapter 3
83
Figure 20. The physicochemical properties of peptides extracted under the different experimental
conditions. (A) Hydropathicity was based on Kyte and Doolittle’s (1982) grand average of
hydropathicity index (GRAVY) scoring matrix, (B) Molecular weight (MW), (C) isolectric point (pI).
(+PEG) refers to protein extracted with PEG and (-PEG) refers to protein extracted without PEG. Red
boxplots refer to pellet samples extracted with PEG; Purple boxplots refer to pellet samples extracted
without PEG; Blue boxplots refer to WCPL samples extracted with PEG; Green boxplots refer to
WCPL samples extracted without PEG.
http://etd.uwc.ac.za/
Chapter 3
84
Overall, a comparison of the majority (upper and lower quartiles) of all peptides of all
the experimental conditions shows that they share similar hydropathicity scales (Fig.
20 A). The average relative hydropathicity of all the samples are negative, which
indicates that the majority of peptides extracted (with and/or without PEG) and
processed via the HILIC sample preparation method are hydrophilic (Kyte &
Doolittle, 1982; Farias et al., 2010). Some differences can be observed between pellet
samples and WCPLs (extracted with and/or without PEG); the pellet samples seem
slightly more hydrophobic or neutral (closer to 0) in nature compared to the WCPLs.
However, neither the addition nor omission of PEG from the protein extraction buffer
affects or shows a substantial hydropathicity preference/selection bias with regard to
extracted peptides. In addition, the HILIC sample preparation method does not show
a preference/selection bias with regard to protein hydropathicity either, which was
also demonstrated in Hughes et al. (2014) and Moggridge et al. (2018).
Figure 20 B indicates that the molecular weight ranges of identified peptides are
relatively constant across all samples and experimental conditions, with the majority
>1000 Da and <2000 Da. Trypsin digestion efficiency influences the molecular
weight of peptides (Hustoft et al., 2012), however all samples were subjected to the
same digestion protocol, therefore the results show that the addition or omission of
PEG to the protein extraction buffer does not significantly affect end-result molecular
weight distributions, nor is there any significant differences in molecular weight
distributions of residual proteins from the pellets. In addition, the pI ranges of
identified peptides are relatively constant across all samples and experimental
conditions, with the majority above pI 4 and below pI 7 (Fig. 20 C). Figure 20
therefore indicates that neither the addition nor omission of PEG to the protein
extraction buffer had any significant selection bias with regard to extracted proteins’
physicochemical properties. Similar results were observed by Hughes et al. (2014)
and Moggridge et al. (2018); after processing protein extracts using the SP3/HILIC
method, they found no obvious bias with regard to the molecular mass, isoelectric
point, and/or average relative hydropathicity of resultant isolated peptides.
Overall, similar GO annotation profiles were obtained for all samples, therefore only
GO terms that occurred at >15% frequency for all samples and experimental
conditions were plotted (Fig. 21 A and B). The majority of proteins that were
http://etd.uwc.ac.za/
Chapter 3
85
preferentially extracted are involved in transport (>40%), signal transduction and
stress response (>30%), as well as biosynthesis (>40%) (Fig. 21 A). The majority of
proteins were preferentially extracted from the cytoplasm (>80%), organelles (>90%),
intracellular region (>90%), and extracellular region (>50%) (Fig. 21 B).
Approximately 30% of extracted proteins were membrane proteins and 50% were
proteins associated with the nucleus. Wiśniewski et al. (2011) analysed FFPE colon
cancer samples via LC-MS/MS, using the filter-aided sample preparation (FASP)
method and protein extraction with PEG, and found the majority of extracted proteins
to be membrane proteins (36 - 40%) (especially plasma membrane proteins (16 -
18%)) and proteins associated with the nucleus (36%). Overall, the current in-depth
analysis demonstrates that without or without PEG, the SP3/HILIC sample
preparation method is less biased with regard to extracted protein types.
http://etd.uwc.ac.za/

Chapter 3
86
Figure 21. Gene Ontology annotation profiles for proteins identified from all samples/conditions.
(A) GO profiles according to biological processes, (B) GO profiles according to cellular components.
The average proportions for all three patients per condition are shown with error bars indicating the
standard deviation. (-PEG) refers to protein extracted without PEG and (+PEG) refers to protein
extracted with PEG. Red bar graphs refer to pellet samples extracted with PEG; Purple bar graphs refer
to pellet samples extracted without PEG; Blue bar graphs refer to WCPL samples extracted with PEG;
Green bar graphs refer to WCPL samples extracted without PEG.
http://etd.uwc.ac.za/
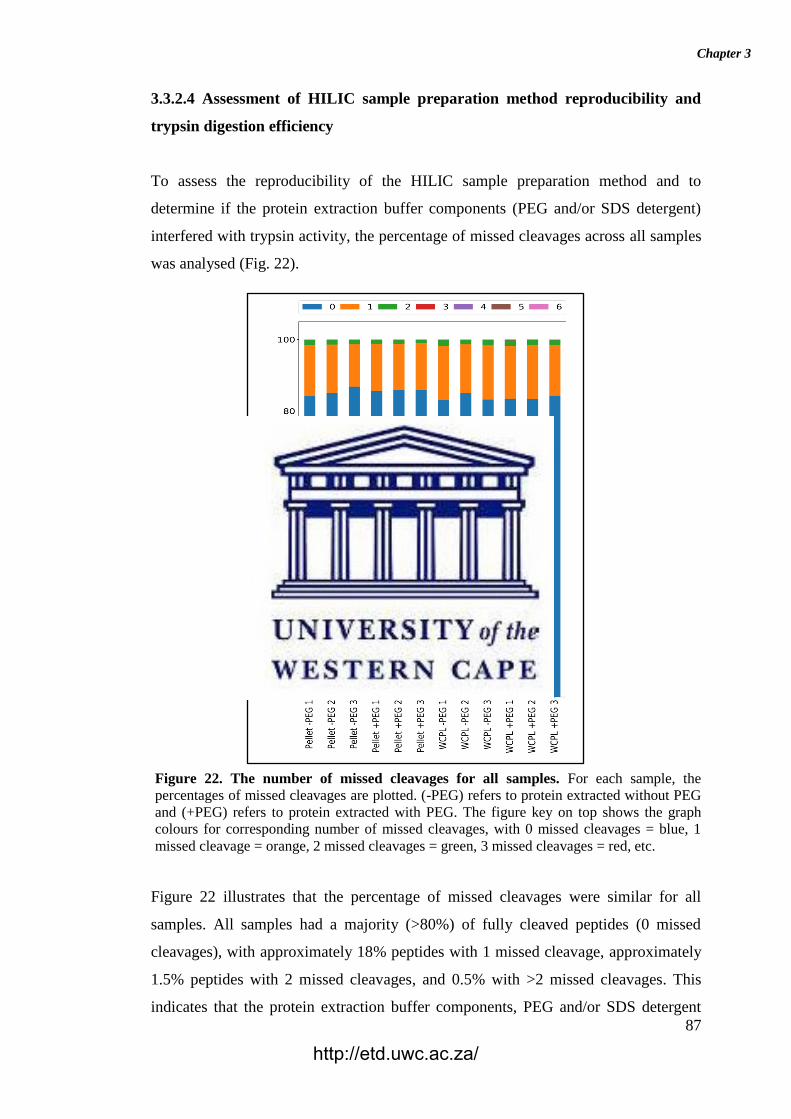
Chapter 3
87
3.3.2.4 Assessment of HILIC sample preparation method reproducibility and
trypsin digestion efficiency
To assess the reproducibility of the HILIC sample preparation method and to
determine if the protein extraction buffer components (PEG and/or SDS detergent)
interfered with trypsin activity, the percentage of missed cleavages across all samples
was analysed (Fig. 22).
Figure 22 illustrates that the percentage of missed cleavages were similar for all
samples. All samples had a majority (>80%) of fully cleaved peptides (0 missed
cleavages), with approximately 18% peptides with 1 missed cleavage, approximately
1.5% peptides with 2 missed cleavages, and 0.5% with >2 missed cleavages. This
indicates that the protein extraction buffer components, PEG and/or SDS detergent
Figure 22. The number of missed cleavages for all samples. For each sample, the
percentages of missed cleavages are plotted. (-PEG) refers to protein extracted without PEG
and (+PEG) refers to protein extracted with PEG. The figure key on top shows the graph
colours for corresponding number of missed cleavages, with 0 missed cleavages = blue, 1
missed cleavage = orange, 2 missed cleavages = green, 3 missed cleavages = red, etc.
http://etd.uwc.ac.za/
Chapter 3
88
did not interfere with trypsin activity. In addition, the HILIC sample preparation
method shows a similar range of missed cleavages in all samples and experimental
conditions analysed. Therefore, the HILIC protocol/workflow was sufficiently
reproducible across all samples and efficient at removing SDS, which interferes with
trypsin activity (Pellerin et al., 2015). Batth et al., (2018), Hughes et al., (2018), and
Moggridge et al. (2018) have also demonstrated the sensitivity, reproducibility, and
efficiency of the SP3/HILIC sample preparation method in removing sample
contaminants for optimal recovery of peptides for LC-MS/MS analysis.
3.4 Conclusions
Due to the importance of archival FFPE tissue repositories as a source for clinical
proteomic studies and its convenient methods of storage and accessibility, it has
become increasingly necessary to develop and standardise protocols for the proteomic
analysis of FFPE tissues. We have demonstrated (using FFPE human colorectal
cancer resection tissue) that the addition of 0.5% (w/v) PEG to protein extraction
buffer resulted in overall lower peptide and protein identifications, compared to
buffer without the addition of PEG. In addition, protein samples extracted without
PEG showed higher reproducibility, however, addition of PEG to the protein
extraction buffer generated lower percentages of unique peptides remaining in the
sample pellets. We show here, by building on from previous studies, which found that
higher protein concentrations (>10 µg) (of FFPE animal tissues and human cells)
compromise the function of PEG, that this effect is also observed in FFPE human
colon tissue.
http://etd.uwc.ac.za/
Chapter 4
89
Chapter 4: Evaluation of protein purification techniques and effects
of storage duration on LC-MS/MS analysis of archived FFPE human
CRC tissues
Abstract
Introduction: To elucidate cancer pathogenesis and its mechanisms at the molecular
level, the collection and characterisation of large individual patient tissue cohorts are
required. Since most pathology institutes routinely preserve biopsy tissues by
standardised methods of formalin fixation and paraffin embedment, these archived
FFPE tissues are important collections of pathology material that include patient’s
metadata (medical history/treatments). FFPE blocks can be stored under ambient
conditions for decades, while retaining cellular morphology, due to modifications
induced by formalin. However, the effect of long-term storage, at resource-limited
institutions in developing countries, on extractable protein quantity/quality has not yet
been investigated. In addition, the optimal sample preparation techniques required for
accurate, reproducible results from label-free LC-MS/MS analysis across block ages
remains unclear.
Methods: The impact of archival time, after approximately 1, 5 and 10 years of
storage, on protein extraction efficiency from human colorectal carcinoma resection
tissue samples was investigated. The performances of three different gel-free protein
purification methods for label-free LC-MS/MS analysis, namely detergent removal
plates (DRP), the APFAR method, and the SP3/HILIC method, across different
sample/block ages were also assessed and compared. A sample size of n = 17 patients
per experimental group (with experiment power = 0.7 and α = 0.05, resulting in 70%
confidence level) was selected based on results obtained in the pilot study of Chapter
3. Data were evaluated in terms of protein yield, peptide/protein identifications,
method reproducibility and efficiency, sample proteome integrity (due to storage
time), as well as protein/peptide distribution according to biological processes,
cellular components, and physicochemical properties. Data are available via
ProteomeXchange with identifier PXD017198.
Results: Total protein yield is significantly (p < 0.0001) dependent on block age,
with older blocks (5 and 10-year-old) yielding less protein (at 2.46 ± 0.03 mg/ml and
http://etd.uwc.ac.za/
Chapter 4
90
1.65 ± 0.04 mg/ml, respectively) than approximately 1-year-old blocks (3.82 ± 0.03
mg/ml). Block age differences were also observed in tissue proteome composition,
with greater proteome composition correlation detected between the 5 and 10-year-
old blocks processed via the APFAR and DRP methods (r2 values of 0.823 and 0.835,
respectively), whereas the HILIC method yielded comparable relative protein
abundances for all block ages. The DRP method resulted in the highest overall
peptide and protein identifications, and the APFAR method resulted in the lowest.
The different methods also introduced an observable bias with regard to proteome
composition, which is also more pronounced for 1-year-old blocks, compared to older
blocks. Differences in PCA variance were also shown, with the DRP method having
the lowest variance (10.73%) between block ages, followed by the HILIC method
(13.68%), and the APFAR method, which has the highest variance at 14.57%. The
APFAR method had the highest overall digestion efficiency (with ≥85% of all
peptides having no missed cleavages), and the HILIC method had the lowest overall
digestion efficiency, with ≥80% of all peptides having no missed cleavages.
However, no significant difference in methionine oxidation levels was found between
1, 5 and 10-year-old blocks for each sample preparation method.
Conclusions: Overall, the results indicate that long-term storage of FFPE tissues (at a
resource-limited institution in a developing country) does not considerably interfere
with retrospective proteomic analysis. In addition, variations in pre-analytical factors
(spanning a decade) do not affect shotgun proteomic analysis to a significant extent.
Sample/block age mainly affects initial protein extraction efficiency, with older
blocks generating lower protein yields. Regarding the optimal protein purification
technique required for archived tissues, the DRP and SP3/HILIC methods performed
the best, with the SP3/HILIC method performing consistently across all block ages
and requiring less protein (and therefore less starting material) than the other
methods, therefore making it the most sensitive and efficient protein purification
method evaluated here.
4.1 Introduction
The protein profiling of FFPE tissues has immense potential for biomarker discovery
and validation. Pathology institutes routinely process and store patient biopsy and/or
http://etd.uwc.ac.za/
Chapter 4
91
surgery tissue samples via formalin fixation and paraffin embedment. Since FFPE
blocks can be stored under ambient conditions for decades, most pathology archives
consist of thousands of FFPE blocks, which often comprise recent as well as decades-
old blocks. However, the effect of long-term storage, at resource-limited institutions
in developing countries, on extractable protein quantity/quality has not yet been
investigated. In addition, the optimal sample preparation techniques required for
accurate, reproducible results from label-free LC-MS/MS analysis across block ages
remains unclear.
Some top-down proteomic studies have found no significant difference in protein
yield between younger and older FFPE blocks (Fowler et al., 2013), whereas others
have found a significant decrease in protein yield as block age increases (Kroll et al.,
2008; Wolff et al., 2011). The top-down proteomic approach analyses intact proteins,
whereas the bottom-up and middle-down approaches involves the characterisation
and analysis of proteins through proteolysis (of a protein mixture from a whole cell or
tissue extract) and subsequent peptide generation and analysis (Zhang et al., 2013).
Bottom-up proteomic studies found minimal or no impact of block age on protein
yield and identifications (Gustafsson et al., 2015). The main detrimental pre-
analytical factor appears to be tissue fixation time, with longer periods (>24 hours)
leading to significant decreases in protein yield and number of proteins identified via
LC-MS/MS (Sprung et al., 2009; Wolff et al., 2011; Tanca et al., 2011). Of interest
to this study is the bottom-up proteomics approach (also referred to as shotgun MS),
since it is difficult to obtain and maintain intact proteins during the sample processing
stages for the top-down MS technique.
Due to formalin-induced protein cross-linking, strong detergents such as sodium
dodecyl sulphate (SDS) are required for total tissue solubilisation and protein
extraction from FFPE tissues (Wiśniewski et al., 2009; Botelho et al., 2010; Pellerin
et al., 2015). However, SDS binds to amino acids and thereby changes the proteins’
spatial conformational structures. This, in turn, inhibits proteases, such as trypsin,
from accessing the proteins’ cleavage sites (which have become distorted through
SDS binding) and also inhibits protease activity by changing the enzymes’
conformational structure (through SDS binding). In addition, SDS alters the
chromatographic separation of peptides and also interferes with ESI mass
http://etd.uwc.ac.za/
Chapter 4
92
spectrometry by dominating mass spectra and significantly suppressing analyte ion
signals since it is readily ionisabile and present in greater abundances than individual
peptide ions. For these reasons, SDS must be completely depleted from a sample
before enzymatic digestion and LC-ESI MS/MS analysis (Wiśniewski et al., 2009;
Botelho et al., 2010; Kachuk et al., 2015; Pellerin et al., 2015). However, SDS
removal with minimal sample loss is a challenging task and several gel-free
approaches have been proposed over the years. These approaches include
incorporating the use of detergent removal plates (DRP), protein precipitation with
organic solvents, such as the APFAR method (Botelho et al., 2010; Doucette et al.,
2014; Kachuk et al., 2015), and/or methods using hydrophilic interaction liquid
chromatography (HILIC) and magnetic resin (Hughes et al., 2014) in the sample
processing workflow prior to LC-MS/MS.
The aim of this study was to methodically characterise the effects of storage time
(over 1, 5 and 10 years) on the quality of data produced via label-free LC-MS/MS
analysis of FFPE tissue blocks from a resource-limited pathology archive. In addition,
three different gel-free protein purification methods for label-free LC-MS/MS
analysis was also assessed across all block ages. The best suited method for analysing
archived colorectal carcinoma FFPE tissue was determined with regards to peptide
and protein identifications, reproducibility, digestion efficiency, and any method-
based protein selection bias.
4.2 Materials and Methods
4.2.1 Formalin-fixed paraffin-embedded (FFPE) human colorectal carcinoma
(CRC) resection samples
FFPE tissue blocks, which consist of human colorectal carcinoma resection samples,
were obtained from the Anatomical Pathology department at Tygerberg Hospital
(Western Cape, South Africa) after obtaining ethics clearance from the Biomedical
Science Research Ethics Committee (BMREC) of the University of the Western Cape
(ethics reference number: BM17/7/15), as well as the Health Research Ethics
Committee (HREC) of Stellenbosch University (ethics reference number:
S17/10/203). The FFPE blocks were anonymised prior to processing. The 1-year-old
http://etd.uwc.ac.za/
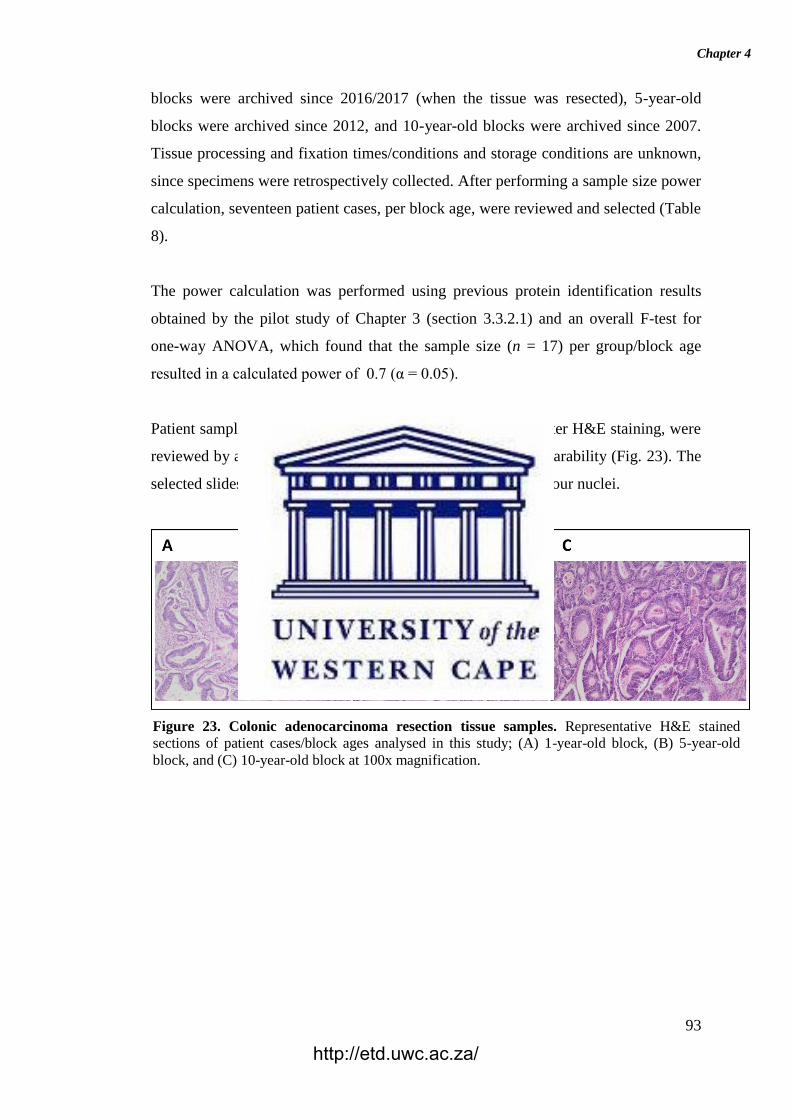
Chapter 4
93
blocks were archived since 2016/2017 (when the tissue was resected), 5-year-old
blocks were archived since 2012, and 10-year-old blocks were archived since 2007.
Tissue processing and fixation times/conditions and storage conditions are unknown,
since specimens were retrospectively collected. After performing a sample size power
calculation, seventeen patient cases, per block age, were reviewed and selected (Table
8).
The power calculation was performed using previous protein identification results
obtained by the pilot study of Chapter 3 (section 3.3.2.1) and an overall F-test for
one-way ANOVA, which found that the sample size (n = 17) per group/block age
resulted in a calculated power of 0.7 (α = 0.05).
Patient samples diagnosed with colorectal adenocarcinoma, after H&E staining, were
reviewed by a pathologist(s) to ensure tissue quality and comparability (Fig. 23). The
selected slides had carcinomas with more than 90% viable tumour nuclei.
Figure 23. Colonic adenocarcinoma resection tissue samples. Representative H&E stained
sections of patient cases/block ages analysed in this study; (A) 1-year-old block, (B) 5-year-old
block, and (C) 10-year-old block at 100x magnification.
http://etd.uwc.ac.za/
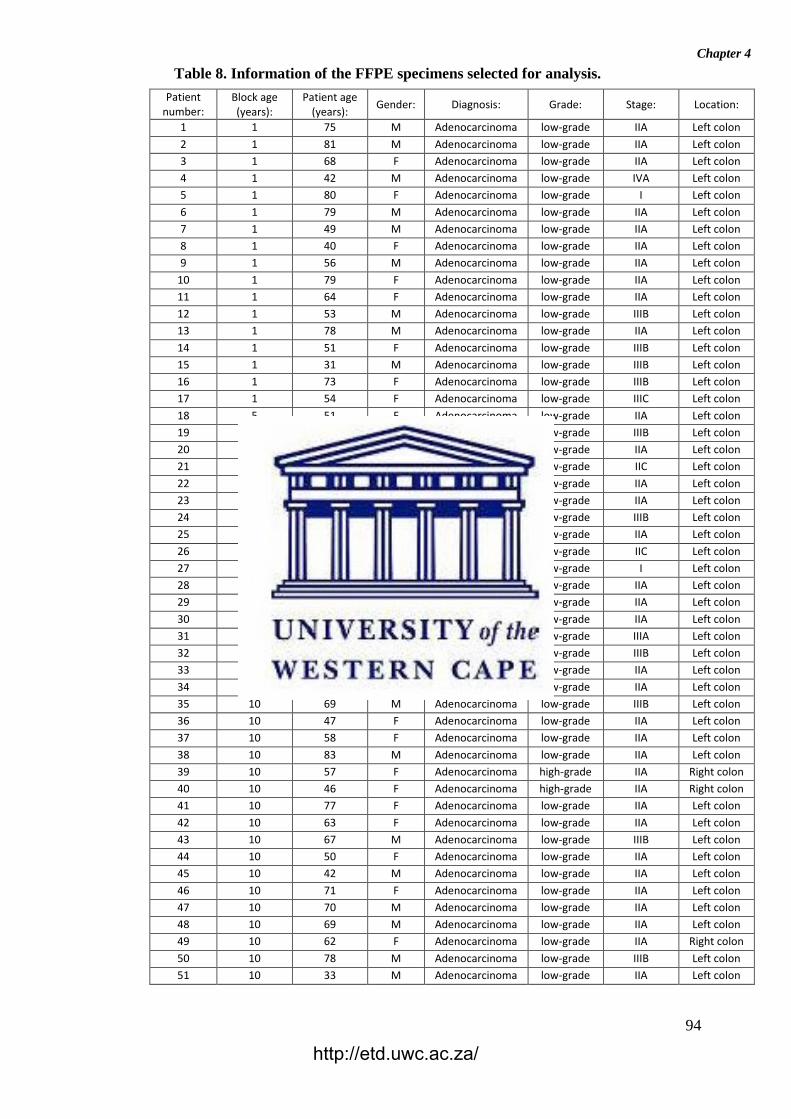
Chapter 4
94
Patient number:
Block age (years):
Patient age (years):
Gender: Diagnosis: Grade: Stage: Location:
1 1
75 M Adenocarcinoma low-grade IIA Left colon
2 1
81 M Adenocarcinoma low-grade IIA Left colon
3 1 68 F Adenocarcinoma low-grade IIA Left colon
4 1 42 M Adenocarcinoma low-grade IVA Left colon
5 1 80 F Adenocarcinoma low-grade I Left colon
6 1 79 M Adenocarcinoma low-grade IIA Left colon
7 1 49 M Adenocarcinoma low-grade IIA Left colon
8 1 40 F Adenocarcinoma low-grade IIA Left colon
9 1 56 M Adenocarcinoma low-grade IIA Left colon
10 1 79 F Adenocarcinoma low-grade IIA Left colon
11 1 64 F Adenocarcinoma low-grade IIA Left colon
12 1 53 M Adenocarcinoma low-grade IIIB Left colon
13 1 78 M Adenocarcinoma low-grade IIA Left colon
14 1 51 F Adenocarcinoma low-grade IIIB Left colon
15 1 31 M Adenocarcinoma low-grade IIIB Left colon
16 1 73 F Adenocarcinoma low-grade IIIB Left colon
17 1 54 F Adenocarcinoma low-grade IIIC Left colon
18 5 51 F Adenocarcinoma low-grade IIA Left colon
19 5 56 F Adenocarcinoma low-grade IIIB Left colon
20 5 86 M Adenocarcinoma low-grade IIA Left colon
21 5 59 M Adenocarcinoma low-grade IIC Left colon
22 5 67 M Adenocarcinoma low-grade IIA Left colon
23 5 82 M Adenocarcinoma low-grade IIA Left colon
24 5 49 F Adenocarcinoma low-grade IIIB Left colon
25 5 54 M Adenocarcinoma low-grade IIA Left colon
26 5 58 M Adenocarcinoma low-grade IIC Left colon
27 5 44 F Adenocarcinoma low-grade I Left colon
28 5 50 M Adenocarcinoma low-grade IIA Left colon
29 5 74 F Adenocarcinoma low-grade IIA Left colon
30 5 54 M Adenocarcinoma low-grade IIA Left colon
31 5 47 F Adenocarcinoma low-grade IIIA Left colon
32 5 55 M Adenocarcinoma low-grade IIIB Left colon
33 5 83 M Adenocarcinoma low-grade IIA Left colon
34 5 60 M Adenocarcinoma low-grade IIA Left colon
35 10 69 M Adenocarcinoma low-grade IIIB Left colon
36 10 47 F Adenocarcinoma low-grade IIA Left colon
37 10 58 F Adenocarcinoma low-grade IIA Left colon
38 10 83 M Adenocarcinoma low-grade IIA Left colon
39 10 57 F Adenocarcinoma high-grade IIA Right colon
40 10 46 F Adenocarcinoma high-grade IIA Right colon
41 10 77 F Adenocarcinoma low-grade IIA Left colon
42 10 63 F Adenocarcinoma low-grade IIA Left colon
43 10 67 M Adenocarcinoma low-grade IIIB Left colon
44 10 50 F Adenocarcinoma low-grade IIA Left colon
45 10 42 M Adenocarcinoma low-grade IIA Left colon
46 10 71 F Adenocarcinoma low-grade IIA Left colon
47 10 70 M Adenocarcinoma low-grade IIA Left colon
48 10 69 M Adenocarcinoma low-grade IIA Left colon
49 10 62 F Adenocarcinoma low-grade IIA Right colon
50 10 78 M Adenocarcinoma low-grade IIIB Left colon
51 10 33 M Adenocarcinoma low-grade IIA Left colon
Table 8. Information of the FFPE specimens selected for analysis.
http://etd.uwc.ac.za/
Chapter 4
95
4.2.2 Protein extraction and quantification
The total volume (mm3) of manually microdissected tumour tissue required to extract
approx. 1.25mg/ml in approx. 500 µl sample volume was determined as described in
section 3.2.2. Approximately 25 mm3 of manually microdissected tumour tissue was
used per patient sample (with 17 individual patient samples per group/block age) and
protein extracted in 500 µl of 50 mM AmBic (pH 8.0) and 2% (w/v) SDS. The
method used for sample processing and protein extraction is described in section
3.2.2. The protein lysates of each sample were transferred to new protein LoBind
microcentrifuge tubes (Eppendorf, Germany) and the protein yield determined using
the Pierce™ BCA Protein Assay Kit (Pierce Biotechnology, Thermo Fisher
Scientific, USA) according to manufacturer’s instructions.
The samples were subsequently processed by the DRC (ThermoFisher Scientific,
2017), APFAR (Botelho et al., 2010; Doucette et al., 2014; Kachuk et al., 2015)
and/or HILIC (SP3) magnetic bead digestion method (Hughes et al., 2019), prior to
LC-MS/MS analysis (Fig. 24).
http://etd.uwc.ac.za/
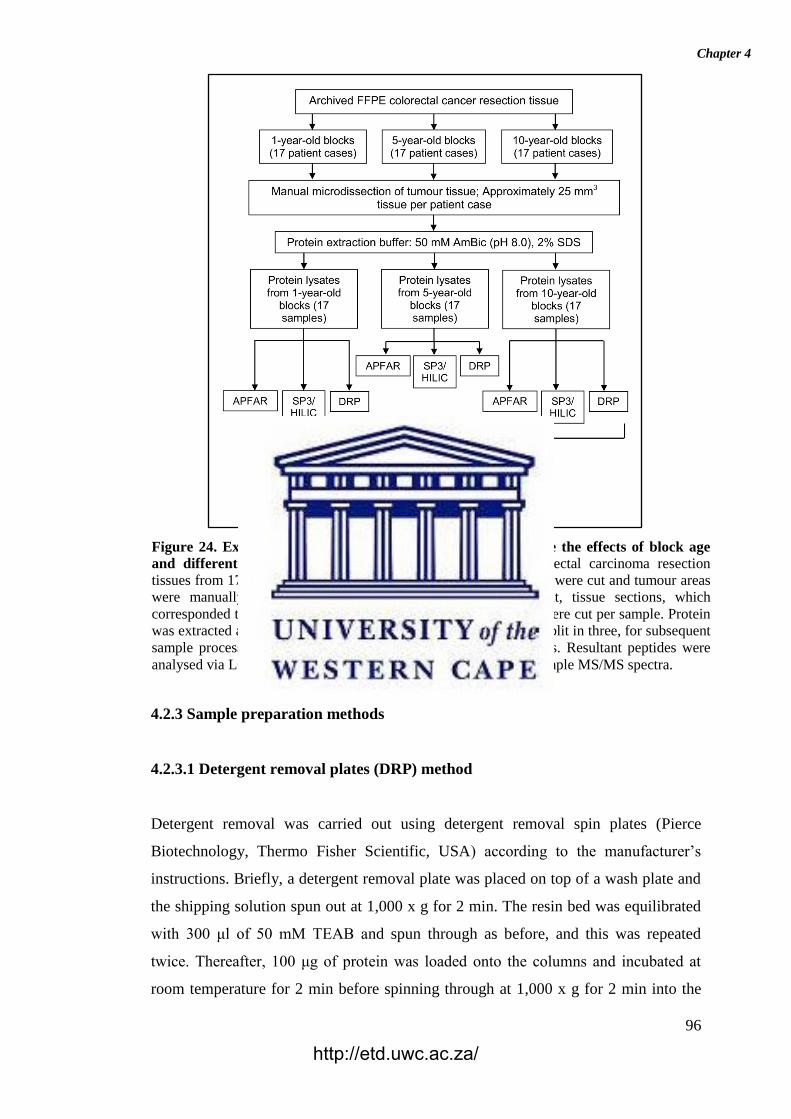
Chapter 4
96
Figure 24. Experimental design and workflow used to evaluate the effects of block age
and different sample processing methods. FFPE human colorectal carcinoma resection
tissues from 17 patients per block age (1, 5 and 10-year old blocks) were cut and tumour areas
were manually micro-dissected for analysis. From each patient, tissue sections, which
corresponded to approximately 25 mm3 tissue per patient/sample, were cut per sample. Protein
was extracted and quantified, after which each patient sample was split in three, for subsequent
sample processing by either the APFAR, DRP, or HILIC methods. Resultant peptides were
analysed via LC-MS/MS and data analysis was performed on all sample MS/MS spectra.
4.2.3 Sample preparation methods
4.2.3.1 Detergent removal plates (DRP) method
Detergent removal was carried out using detergent removal spin plates (Pierce
Biotechnology, Thermo Fisher Scientific, USA) according to the manufacturer’s
instructions. Briefly, a detergent removal plate was placed on top of a wash plate and
the shipping solution spun out at 1,000 x g for 2 min. The resin bed was equilibrated
with 300 μl of 50 mM TEAB and spun through as before, and this was repeated
twice. Thereafter, 100 μg of protein was loaded onto the columns and incubated at
room temperature for 2 min before spinning through at 1,000 x g for 2 min into the
http://etd.uwc.ac.za/
Chapter 4
97
sample collection plate. Samples were then transferred to protein Lobind tubes and
dried down by vacuum centrifugation. Once dried, samples were resuspended in 30 μl
of 50mM TEAB.
4.2.3.2 Acetone precipitation and formic acid resolubilisation (APFAR) method
Samples were processed via the APFAR method as described in section 3.2.3.2 (of
Chapter 3).
4.2.3.3 In-solution digestion
In-solution digestion was carried out on samples processed by the APFAR (section
4.2.3.2) and DRC (section 4.2.3.1) methods as described in section 3.2.3.3 (of
Chapter 3).
4.2.3.3 SP3/HILIC method with on-bead digestion
Samples were processed via the HILIC/SP3 method as described in section 3.2.3.4 (of
Chapter 3).
4.2.4 Label–free LC–MS/MS analysis
LC-MS/MS analysis was conducted as described in section 3.2.4 of Chapter 3.
4.2.5 Peptide and protein identification
Raw data containing centroid MS/MS spectra were converted into mgf (Matrix
Science, UK) files using msconvert from the Proteo-Wizard software suite (Kessner
et al., 2008). Peak lists obtained from MS/MS spectra were identified using
X!Tandem (version X!Tandem Vengeance 2015.12.15.2) (Craig & Beavis, 2004),
MS Amanda (version 2.0.0.9706) (Dorfer et al., 2014) and MS-GF+ (version
2018.04.09) (Kim & Pevzner, 2014). The search was conducted using SearchGUI
(version 3.3.3) (Vaudel et al., 2011) and protein identification was conducted against
a concatenated target/decoy protein sequence database as described in sections
http://etd.uwc.ac.za/
Chapter 4
98
3.2.5.1.1 and 3.2.6 of Chapter 3 (refer to Appendix A for search algorithms specific
settings). The decoy sequences were created by reversing the target sequences in
SearchGUI. Peptides and proteins were inferred from the spectrum identification
results as described in section 3.2.6 (of Chapter 3) using PeptideShake version
1.16.40.
4.2.6 Data and statistical analyses
Qualitative and quantitative data were exported from PeptideShaker and parsed using
in-house scripts and graphs generated in Jupyter lab (using Pandas, NumPy, and
Matplotlib Python packages), as well as Microsoft® Excel. Additional statistical
analyses were performed using SAS® university edition and SAS
® Studio version 3.8
(results of the statistical tests that were performed are listed in Appendix D
Supplementary table 2). To determine if sample distributions were normal, a
Kolmogorov–Smirnov or Shapiro–Wilk test was performed, with D denoting the test
statistic for the Kolmogorov–Smirnov test and W denoting the test statistic for the
Shapiro–Wilk test. For normal distributions, comparison of means across 3 (or more)
groups was performed using the parametric ANOVA procedure, with F (F-ratio)
denoting the test statistic. The Kruskal–Wallis nonparametric analysis of variance
was used when data were from a non-normal distribution, and H denotes the test
statistic. For all statistical reporting, the test statistic value is given along with the
degrees of freedom (in brackets after the test statistic symbol) and p-value. Post hoc
statistical analyses were performed on significant results using Bonferroni or Dunn’s
test (Field & Miles, 2010; Elliott & Hynan, 2011).
PeptideShaker uses spectrum counting based quantification, which relies on the
reasoning that highly abundant peptides will have a higher intensity, and are therefore
more likely to generate acquisition of MS/MS spectra (Vaudel et al., 2011; Vaudel,
2017). Consequently, peptides from abundant proteins are more likely to be identified
and possess more spectra. The NSAF method followed here involves counting the
number of spectra attributed to a protein (Powell et al., 2004). This count is then
normalised for the length of the protein, the presence of shared peptides, as well as
redundant peptides (Vaudel et al., 2011; Vaudel, 2017). The spectrum counting
indexes were exported from PeptideShaker and parsed using in-house scripts. The
http://etd.uwc.ac.za/
Chapter 4
99
NSAF values (of common/shared proteins only) were multiplied by the lowest factor
calculated for each pair of conditions compared, in order to deal with integers and
facilitate comparisons. These NSAF values were then used to estimate the extent of
differential protein abundance (of common/shared proteins only) by calculating the
Pearson’s correlation coefficient (PCC), for each pair of conditions compared, to
assess the relationship/level of correlation between samples. PCC graphs were
generated in Jupyter lab, using Pandas, NumPy, and Matplotlib Python packages.
Principal component analysis (PCA) was performed for each patient case/sample’s
list of identified proteins and corresponding NSAF values, with Jupyter lab, using
Pandas, NumPy, Scikit-learn, Seaborn and Matplotlib Python packages.
The physicochemical properties of the identified peptides, including the
hydropathicity (Kyte-Doolittle scale), molecular weight, and isoelectric point were
calculated for each sample using the Protein property analysis software (ProPAS)
version 1.1 (Wu & Zhu, 2012).
Venny version 2.1.0 (Oliveros, 2007) was used to generate Venn diagrams to
visualise the consistency of peptide identifications between samples.
Protein annotations regarding subcellular localisation were retrieved from Ensembl
(www.ensembl.org) using GOSlim UniProtKB-GOA (www.ebi.ac.uk/GOA) to
minimise the number of terms retrieved. Hypergeometric testing was used to
calculate the significance of gene ontology terms.
4.2.7 Data sharing information
The mass spectrometry proteomics data have been deposited to the ProteomeXchange
Consortium (Deutsch et al., 2017) via the PRIDE (Perez-Riverol et al., 2019) partner
repository with the dataset identifier PXD017198 and DOI: 10.6019/PXD017198.
Username: [email protected] Password: R8Ep4gdw
http://etd.uwc.ac.za/
Chapter 4
100
4.3 Results and discussion
The objectives of this study were to evaluate three different sample processing
methods (the APFAR or DRC methods followed by in-solution digestion, or the
SP3/HILIC method with magnetic bead-based digestion) as well as the effect of
storage time/FFPE tissue block age on protein extraction efficiency and
reproducibility. Subsequent proteomic analysis by label-free LC-MS/MS evaluated
the proteome coverage, proportion of missed cleavages, and enrichment/selection bias
based on sample processing method used.
4.3.1 Protein extraction and quantification
The BCA total protein quantitation assay results of all samples (after protein was
extracted from approximately 25 mm3 patient tumour tissue using 500 µl of protein
extraction buffer) are shown in figure 25.
A Kruskal–Wallis test was conducted to examine the differences in protein yield
between block ages (Appendix D Supplementary table 2). Protein yield was
significantly affected by block age (H(2) = 23.92, p < 0.0001), also seen in figure 25.
Based on Dunn’s post hoc testing results, there is evidence that the distribution of
protein yields are significantly different for 1-year-old blocks vs 10-year-old blocks
and for 1-year-old blocks vs 5-year-old blocks, but not for 5-year-old blocks vs 10-
year-old blocks (results and conclusions are shown in Appendix D Supplementary
table 2).
The 10-year-old FFPE tissues generated overall lower protein yields (an average of
1.65 ± 0.04 mg/ml) compared to the 5-year-old FFPE tissues, which generated an
average of 2.46 ± 0.03 mg/ml protein, and the 1-year-old FFPE tissues, which
generated an average of 3.82 ± 0.03 mg/ml protein. This corresponds to
approximately 825 µg, 1230 µg, and 1910 µg protein extracted from the 10, 5 and 1-
year-old FFPE tissues, respectively, by using approximately 25 mm3 tissue.
http://etd.uwc.ac.za/
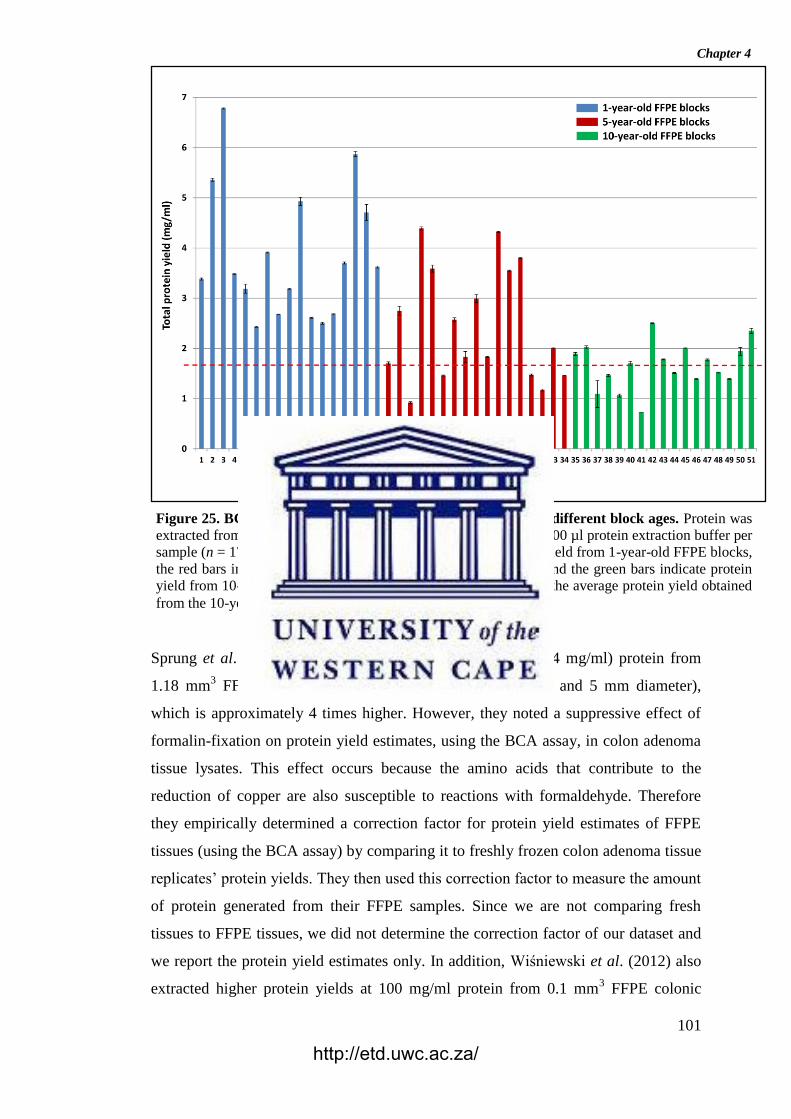
Chapter 4
101
Sprung et al. (2009) were able to extract 300 – 400 µg (0.14 mg/ml) protein from
1.18 mm3 FFPE colon adenoma tissue (of 60 µm thickness and 5 mm diameter),
which is approximately 4 times higher. However, they noted a suppressive effect of
formalin-fixation on protein yield estimates, using the BCA assay, in colon adenoma
tissue lysates. This effect occurs because the amino acids that contribute to the
reduction of copper are also susceptible to reactions with formaldehyde. Therefore
they empirically determined a correction factor for protein yield estimates of FFPE
tissues (using the BCA assay) by comparing it to freshly frozen colon adenoma tissue
replicates’ protein yields. They then used this correction factor to measure the amount
of protein generated from their FFPE samples. Since we are not comparing fresh
tissues to FFPE tissues, we did not determine the correction factor of our dataset and
we report the protein yield estimates only. In addition, Wiśniewski et al. (2012) also
extracted higher protein yields at 100 mg/ml protein from 0.1 mm3 FFPE colonic
Figure 25. BCA total protein quantitation assay results for the different block ages. Protein was
extracted from approximately 25 mm3 patient tumour tissue using 500 µl protein extraction buffer per
sample (n = 17 patients per group). The blue bars indicate protein yield from 1-year-old FFPE blocks,
the red bars indicate protein yield from 5-year-old FFPE blocks, and the green bars indicate protein
yield from 10-year-old FFPE blocks. The red dotted line indicates the average protein yield obtained
from the 10-year-old FFPE blocks, which is 1.65 mg/ml protein.
http://etd.uwc.ac.za/

Chapter 4
102
adenoma tissue and Wolff et al. (2011) extracted 2.76 mg/ml protein from
approximately 1-year-old and 1.48 mg/ml protein from approximately 21-year-old
(1.5 mm3) FFPE colon carcinoma tissue. On the other hand, Rodríguez-Rigueiro et al.
(2011) extracted less protein than reported here, with 250 µg protein from
approximately 18 mm3 FFPE colon carcinoma tissues that were stored for less than 5
years. Therefore, the amount of protein extracted here falls within the published
ranges for FFPE colon tissue.
Although approximately 25 mm3
of manually microdissected tumour tissue per
sample was used for protein extraction, and the volume of protein extraction buffer
kept constant at 500 µl per sample, the total amount of extractable protein and protein
yield still differed among the patient samples within the same block ages (Fig. 25).
Similar variations in protein yields were also observed in section 3.3.1 (Fig. 16), as
well as Wolff et al. (2011). This observation is also noted in FFPE protein extraction
protocols elsewhere, with the Agilent Technologies (2009) manual explaining that
protein yields obtained from FFPE protein lysates may vary between samples due to
variance in pre-analytical factors, such as tissue handling and
inconsistencies/differences in the formalin-fixation and paraffin-embedment protocol,
which affects how well proteins will be preserved. They recommend increasing the
amount of starting material/tissue if the quality of protein preservation in the FFPE
sample is questionable (Agilent Technologies, 2009).
4.3.2 The effect of block age and sample preparation methods on peptide and
protein identification
The efficiency and reproducibility for each sample preparation method, as well as the
effect of storage time/block age, at both peptide and protein level was assessed with
regards to proteome coverage (number of peptides and proteins identified) (Fig. 26 A
and B) and known protein biomarkers (proteins deregulated in colon cancer) from the
literature, which were also identified in the data (Table 9).
http://etd.uwc.ac.za/
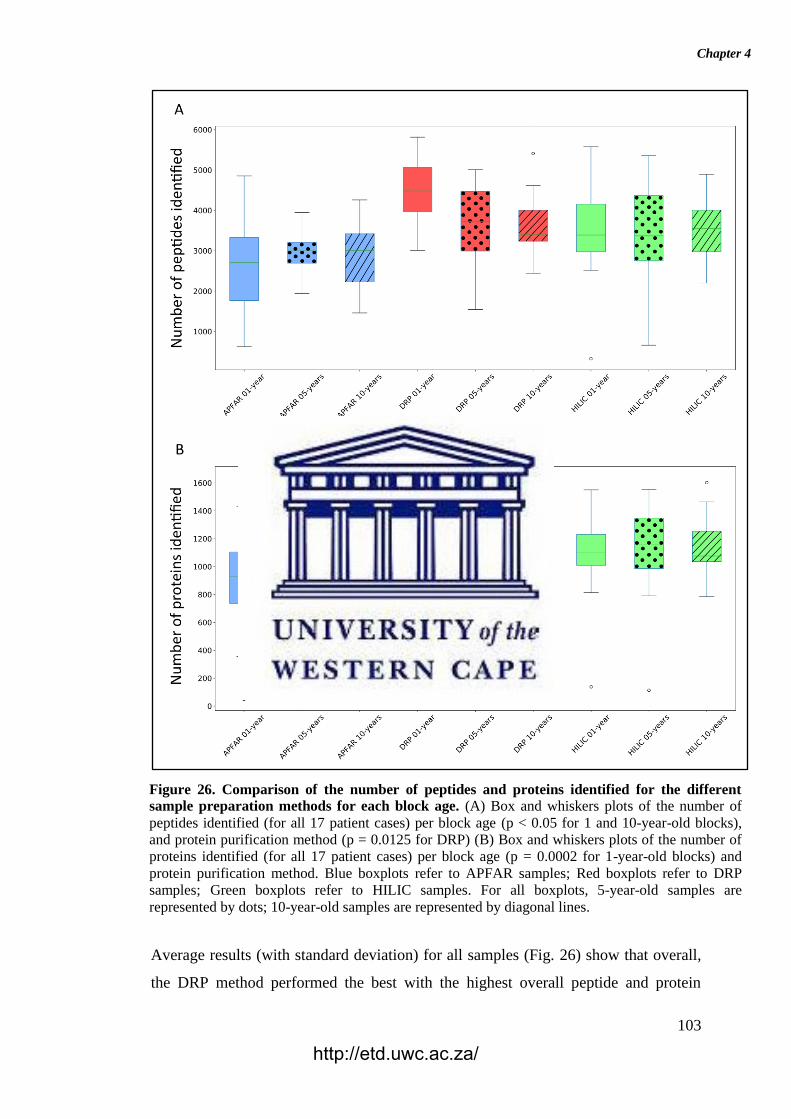
Chapter 4
103
Average results (with standard deviation) for all samples (Fig. 26) show that overall,
the DRP method performed the best with the highest overall peptide and protein
Figure 26. Comparison of the number of peptides and proteins identified for the different
sample preparation methods for each block age. (A) Box and whiskers plots of the number of
peptides identified (for all 17 patient cases) per block age (p < 0.05 for 1 and 10-year-old blocks),
and protein purification method (p = 0.0125 for DRP) (B) Box and whiskers plots of the number of
proteins identified (for all 17 patient cases) per block age (p = 0.0002 for 1-year-old blocks) and
protein purification method. Blue boxplots refer to APFAR samples; Red boxplots refer to DRP
samples; Green boxplots refer to HILIC samples. For all boxplots, 5-year-old samples are
represented by dots; 10-year-old samples are represented by diagonal lines.
http://etd.uwc.ac.za/
Chapter 4
104
identifications; at 4436 ± 823 and 1319 ± 180 for validated peptides and proteins,
respectively, for 1-year-old blocks; 3607 ± 1072 and 1155 ± 252 for validated
peptides and proteins, respectively, for 5-year-old blocks; 3602 ± 786 and 1206 ± 214
for validated peptides and proteins, respectively, for 10-year-old blocks. This is
followed by the SP3/HILIC method with 3446 ± 1151 and 1089 ± 313 for validated
peptides and proteins, respectively, for 1-year-old blocks; 3386 ± 1182 and 1091 ±
335 for validated peptides and proteins, respectively, for 5-year-old blocks; 3472 ±
803 and 1150 ± 213 for validated peptides and proteins, respectively, for 10-year-old
blocks. The APFAR method generated the lowest numbers of peptide and protein
identifications; at 2627 ± 1128 and 883 ± 343 for validated peptides and proteins,
respectively, for 1-year-old blocks; 3025 ± 608 and 1026 ± 173 for validated peptides
and proteins, respectively, for 5-year-old blocks; 2882 ± 849 and 1039 ± 242 for
validated peptides and proteins, respectively, for 10-year-old blocks.
One-way ANOVA or Kruskal–Wallis tests were conducted (as described in section
4.2.6 and results and conclusions are listed in Appendix D Supplementary table 2) to
determine if the number of identified peptides and proteins were significantly
different between block ages, as well as for each sample preparation method.
Statistical analyses comparing sample preparation method performance per block age
indicated the following: For the 1-year-old blocks, based on post hoc Bonferroni
(Dunn) t tests, the DRP method differs significantly (F(2) = 12.78, p <0.0001, α =
0.05) with regards to validated peptide identifications, however there was no
significant difference between the numbers of validated peptides identified for the
APFAR and SP3/HILIC methods. Based on Dunn’s post hoc testing results, there is
also evidence that the distribution of validated protein identifications (for 1-year old
blocks) are significantly different (p = 0.0002) for DRP vs APFAR processing, but
not for DRP vs HILIC and APFAR vs HILIC sample preparation methods. With
regards to validated peptide and protein identifications, there is no significant
difference (p > 0.05) between protein purification/sample preparation methods for 5-
year old blocks. For the 10-year old blocks, based on post hoc Bonferroni (Dunn) t
tests, the DRP and APFAR methods differ significantly (F(2) = 3.78, p = 0.0299, α =
0.05) with regards to validated peptide identifications, however there is no significant
difference between the APFAR and SP3/HILIC and the DRP and SP3/HILIC
methods.
http://etd.uwc.ac.za/
Chapter 4
105
Statistical analyses comparing the differences between block ages (effect of block age
on the number of peptide/protein identifications) within each sample preparation
method indicated the following: Both the APFAR and SP3/HILIC methods
performed most consistently across block ages, with no significant difference
between 1, 5 and 10-year-old blocks (APFAR method: F(2,48) = 0.88, p = 0.42 for
peptides identified and H(2) = 2.28, p = 0.32 for proteins identified; SP3/HILIC
method: F(2,48) = 0.03, p = 0.97 for peptides identified and H(2) = 0.101, p = 0.95
for proteins identified). Only the DRP method showed a significant difference
between the block ages with regard to numbers of peptides identified (F(2) = 4.81, p
= 0.0125, α = 0.05), with a significant difference between 1 and 5-year-old blocks, as
well as 1 and 10-year-old blocks, but no significant difference between 5 and 10-year-
old blocks. In addition, no significant difference was detected for the number of
proteins identified (F(2,48) = 2.53, p = 0.09).
The sample preparation methods that did not show any significant differences
between block ages, are in accordance with the findings of other studies (Sprung et
al., 2009; Craven et al., 2013). Sprung et al. (2009) also assessed the effect of storage
time/block age on FFPE colon adenoma tissue samples (stored for 1, 3, 5, or 10
years), using isoelectric focusing to fractionate peptides before LC-MS/MS analysis.
They found no significant difference between the numbers of proteins identified for
each block age and concluded that long-term storage of FFPE colon adenoma tissues
did not compromise the samples. In general, the proteome coverage reported here (for
all the block ages and sample preparation methods) falls within the range of several
other studies of proteomic analysis of FFPE tissue (Sprung et al., 2009; Fu et al.,
2013; Gámez-Pozo et al., 2013; Bronsert et al., 2014), with higher identification
numbers reported by other studies (Craven et al., 2013; Wiśniewski et al., 2011;
Wiśniewski et al., 2012; Wiśniewski et al., 2013). Table 9 shows known proteins that
are deregulated in colon cancer that were also identified in the data. The %
occurrence of these proteins within each group of 17 patients per experimental
condition was calculated and shows that there are no observable differences due to
block age. However, the DRP method shows overall higher % occurrence of these
protein biomarkers, compared to the other sample preparation methods.
http://etd.uwc.ac.za/
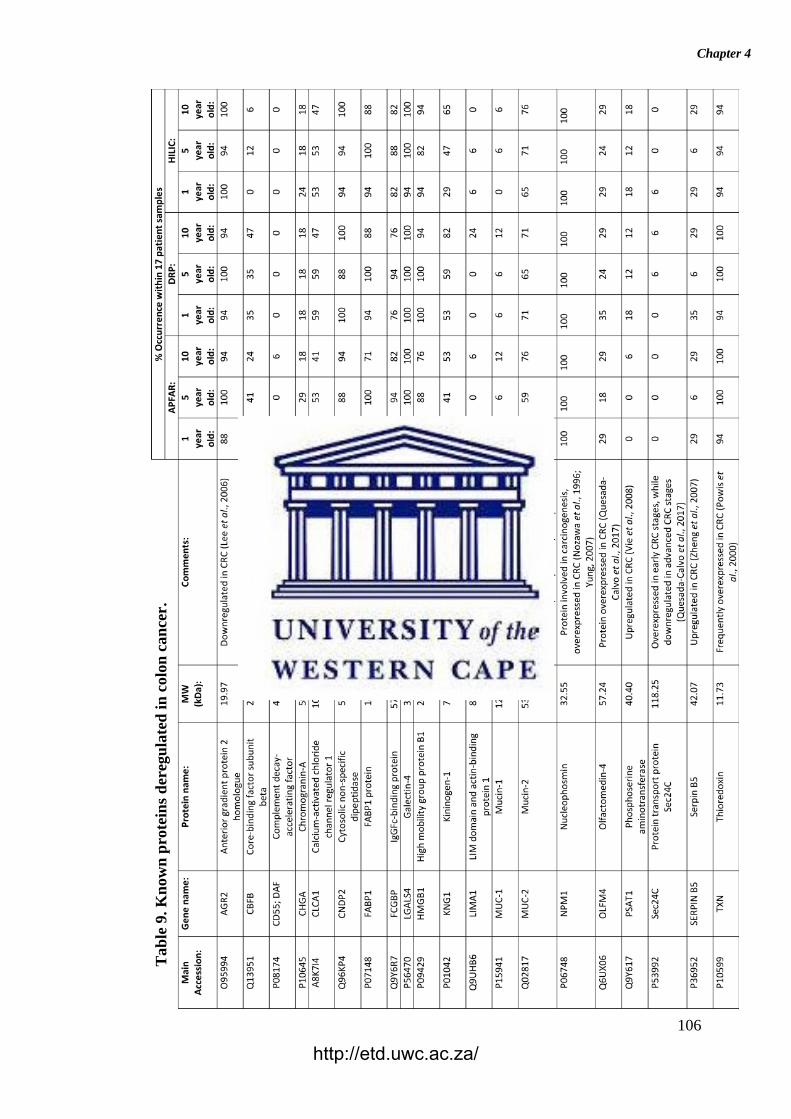
Chapter 4
106
Tab
le 9
. K
now
n p
rote
ins
der
egu
late
d i
n c
olo
n c
an
cer.
http://etd.uwc.ac.za/
Chapter 4
107
4.3.3 The effect of block age and sample preparation methods on peptide-level
reproducibility
The qualitative reproducibility for each sample and experimental condition was also
measured in terms of peptide identification overlap (Fig. 27), calculated from the
peptide sequences identified in each sample and experimental condition, irrespective
of peptide abundance.
Figure 27 A illustrates that the APFAR method showed the highest peptide
overlap/common peptides (46.5%) between samples of different block ages. This was
followed by the HILIC method, with 45.4% peptide overlap, and the lowest peptide
overlap was seen for the DRP method at 43%. Overall, there was no significant
difference between uniquely identified peptides of the different block ages (ranging
from 11.3% to 13.2%) for the APFAR and HILIC methods. However, the 1-year-old
blocks processed with the DRP method had the highest percentage of uniquely
identified peptides at 20.4%.
http://etd.uwc.ac.za/
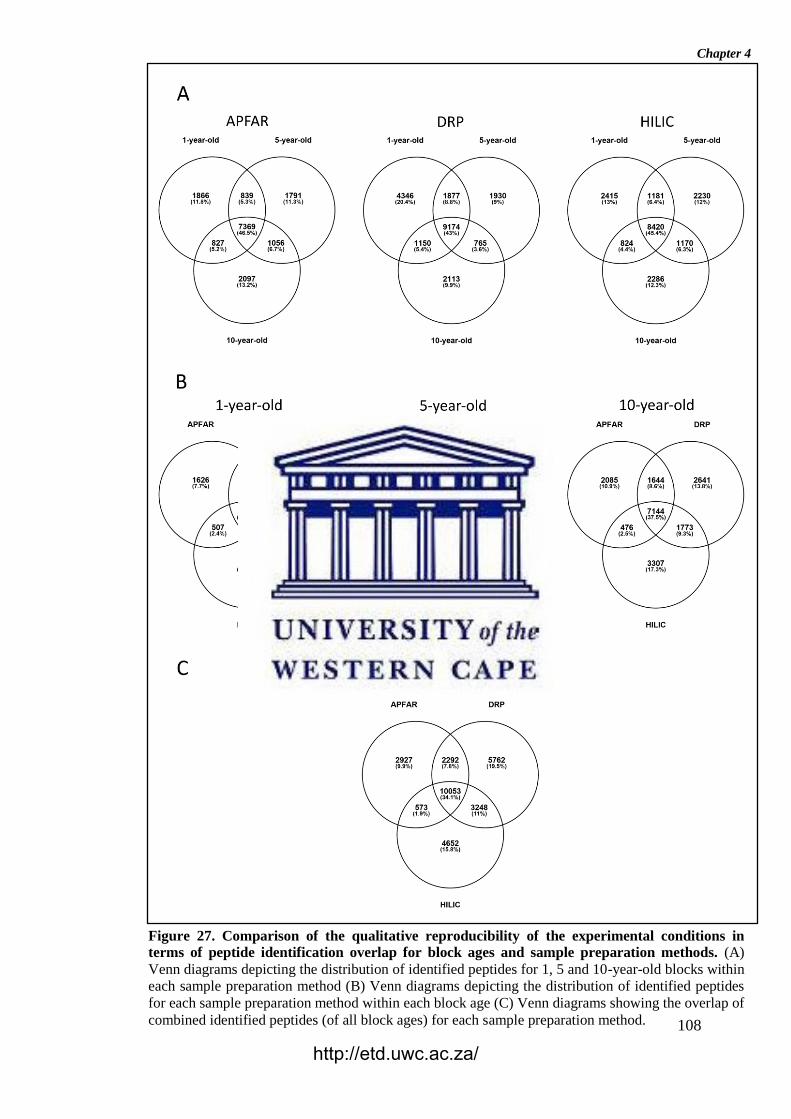
Chapter 4
108
Figure 27. Comparison of the qualitative reproducibility of the experimental conditions in
terms of peptide identification overlap for block ages and sample preparation methods. (A)
Venn diagrams depicting the distribution of identified peptides for 1, 5 and 10-year-old blocks within
each sample preparation method (B) Venn diagrams depicting the distribution of identified peptides
for each sample preparation method within each block age (C) Venn diagrams showing the overlap of
combined identified peptides (of all block ages) for each sample preparation method.
http://etd.uwc.ac.za/
Chapter 4
109
The shared peptides for each sample preparation method within a specific block age
are shown in Figure 27 B. The 10-year-old blocks showed the highest peptide
overlap/common peptides (37.5%) between the different sample preparation methods.
This was followed by the 5-year-old blocks, with 36.7% peptide overlap, and the
lowest peptide overlap was seen for the 1-year-old blocks at 33.3%. This could be
due, in part, to similar proteins extracted from the older blocks (since formaldehyde-
induced cross-linking continues with time), compared to more diverse sets of proteins
extracted from the more recently preserved 1-year-old blocks (Lemaire et al., 2007).
Due to the continuation and extent of formaldehyde-induced protein cross-linking
with time, the extraction of full-length proteins from older FFPE blocks is also more
difficult. In addition, Paine et al. (2018) were able to identify small proteins, without
antigen retrieval and enzymatic digestion steps, via mass spectrometry imaging. They
hypothesise that not all proteins, especially small proteins (with short amino acid
sequences and low lysine content), react with formaldehyde to the same extent.
However, larger proteins (with longer amino acid sequences and greater lysine
content) were more challenging to detect via mass spectrometry, and therefore have a
greater probability of being more extensively crosslinked by formaldehyde. On
average, for all block ages and sample preparation methods, the identified proteins
were in the range of 40 – 60 kDa (data not shown). This therefore indicates that
mostly low and medium molecular weight proteins were extracted from the FFPE
tissues at all block ages.
Figure 27 C shows that, when all the identified peptides for each block age is
combined within a sample preparation method, there is 34.1% overlapping peptides
shared between the different methods. The DRP method had the highest percentage of
uniquely identified peptides at 19.5%, followed by the HILIC method, with 15.8%
unique peptides, and the lowest uniquely identified peptides was seen for the APFAR
method at 9.9%.
4.3.4 Physicochemical properties of extracted and processed peptides for all
block ages
The effect of archival time/block age as well as sample preparation method protein
selection/enrichment bias was assessed with regards to peptide sequence
http://etd.uwc.ac.za/
Chapter 4
110
physicochemical properties in figure 28, which illustrates the peptide distribution
according to hydropathicity, molecular weight and isoelectric point (pI). Kruskal–
Wallis tests were conducted to determine if there were significant differences
between experimental conditions (Appendix D Supplementary table 2).
Overall, a comparison of the majority (upper and lower quartiles) of all peptides of all
experimental conditions shows that they share similar hydropathicity scales (Fig. 28
A). There is a significant difference (p < 0.0001) between the hydropathicity of
peptides generated in all experimental conditions, however, the average relative
hydropathicity of all the samples are negative (below zero), which indicates that the
majority of peptides that were extracted and processed, by all three sample
preparation methods and across all block ages are hydrophilic (Kyte & Doolittle,
1982; Farias et al., 2010).
Figure 28 B indicates that the molecular weight ranges of identified peptides are
relatively constant across all samples and experimental conditions, with the majority
>1000 Da and <2000 Da. There is a significant difference (p < 0.0001) between the
molecular weights of peptides generated via the different sample preparation methods
for 1, 5 and 10-year old blocks. With regards to block age differences, there is no
significant difference (p = 0.26) between the molecular weights of peptides generated
via the DRP method, however there is a significant difference (p < 0.05) between the
molecular weights of peptides generated using the APFAR and/or HILIC methods.
There is a significant difference (p < 0.0001) between the pI ranges of peptides
generated in all experimental conditions, however, the pI range values are relatively
similar across all samples and experimental conditions, with the majority above pI 4
and below pI 7 (Fig. 28 C). These results are in accordance with previous studies that
used the APFAR and HILIC methods (Doucette et al., 2014; Hughes et al., 2014;
Kachuk et al., 2015; Moggridge et al., 2018).
http://etd.uwc.ac.za/
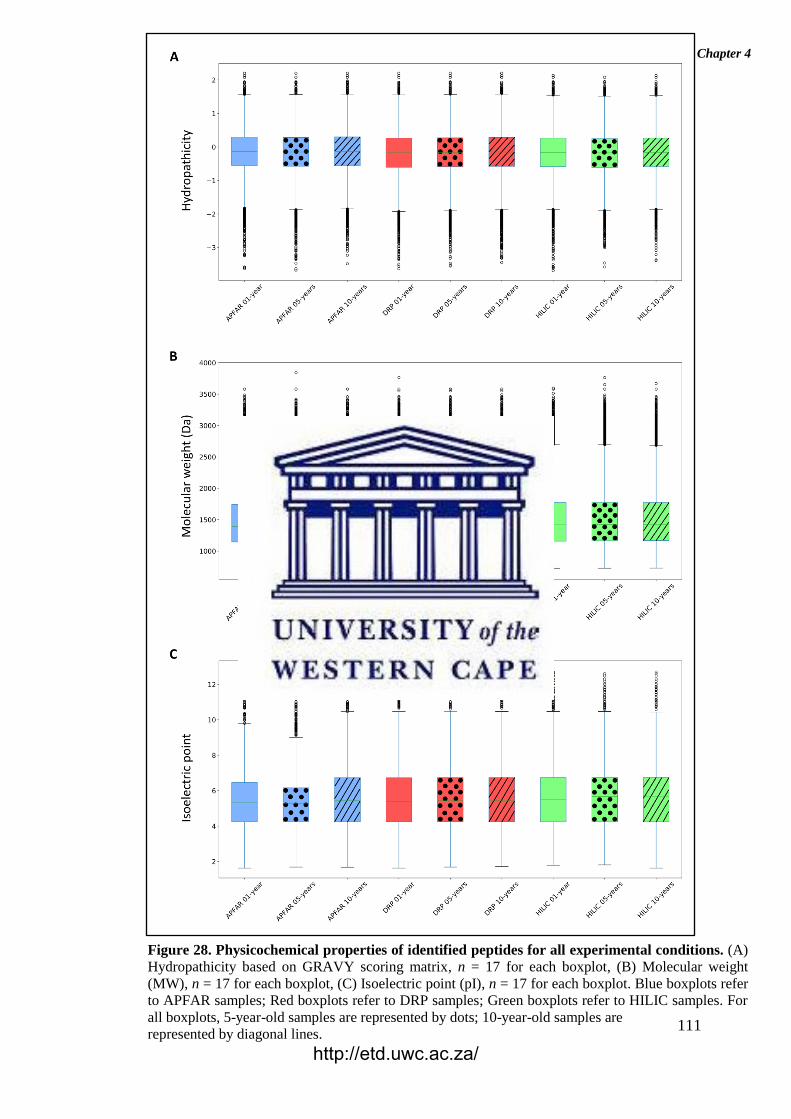
Chapter 4
111
Figure 28. Physicochemical properties of identified peptides for all experimental conditions. (A)
Hydropathicity based on GRAVY scoring matrix, n = 17 for each boxplot, (B) Molecular weight
(MW), n = 17 for each boxplot, (C) Isoelectric point (pI), n = 17 for each boxplot. Blue boxplots refer
to APFAR samples; Red boxplots refer to DRP samples; Green boxplots refer to HILIC samples. For
all boxplots, 5-year-old samples are represented by dots; 10-year-old samples are
represented by diagonal lines.
http://etd.uwc.ac.za/
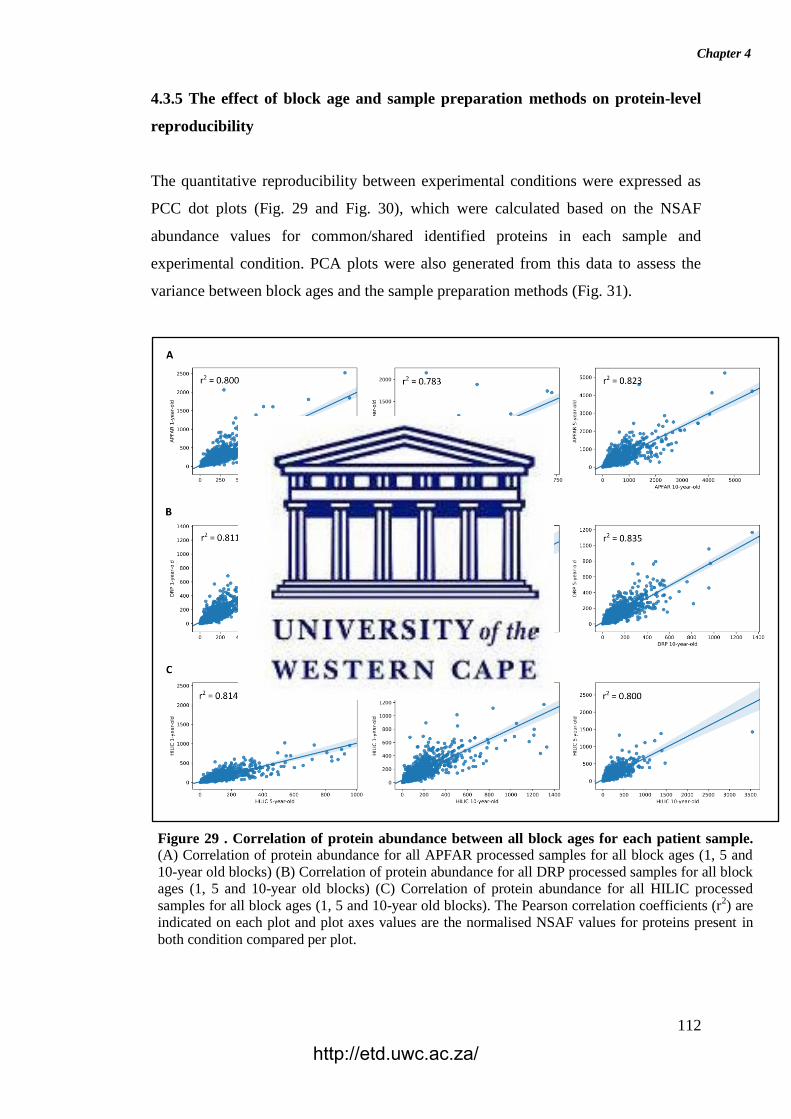
Chapter 4
112
4.3.5 The effect of block age and sample preparation methods on protein-level
reproducibility
The quantitative reproducibility between experimental conditions were expressed as
PCC dot plots (Fig. 29 and Fig. 30), which were calculated based on the NSAF
abundance values for common/shared identified proteins in each sample and
experimental condition. PCA plots were also generated from this data to assess the
variance between block ages and the sample preparation methods (Fig. 31).
Figure 29 . Correlation of protein abundance between all block ages for each patient sample. (A) Correlation of protein abundance for all APFAR processed samples for all block ages (1, 5 and
10-year old blocks) (B) Correlation of protein abundance for all DRP processed samples for all block
ages (1, 5 and 10-year old blocks) (C) Correlation of protein abundance for all HILIC processed
samples for all block ages (1, 5 and 10-year old blocks). The Pearson correlation coefficients (r2) are
indicated on each plot and plot axes values are the normalised NSAF values for proteins present in
both condition compared per plot.
http://etd.uwc.ac.za/
Chapter 4
113
Fig. 29 shows the correlation of protein abundance for all block ages for each sample
preparation method. This demonstrates that, for the APFAR and DRP methods, there
were greater proteome composition correlation between the 5 and 10-year-old blocks
(PCC values of 0.823 and 0.835, respectively), compared to the correlation between
their other block age samples (PCC values ranging between 0.783 and 0.811), as well
as the 5 and 10-year-old blocks processed via the HILIC method (PCC value of
0.800). The HILIC method yielded comparable relative protein abundances for all
block ages, with PCC values of 0.814 for 1 and 5-year-old blocks, 0.805 for 1 and 10-
year-old blocks, and 0.800 for 5 and 10-year-old blocks. For the APFAR and DRP
methods, proteome composition correlation was lowest between 1 and 10-year-old
blocks (PCC values of 0.783 and 0.789, respectively), compared to 1 and 5-year-old
blocks (PCC values of 0.800 and 0.811, respectively) and 5 and 10-year-old blocks
(PCC values of 0.823 and 0.835, respectively).
These results indicate that block age may introduce an observable bias with regard to
proteome composition, depending on the sample processing method used for LC-
MS/MS analysis. This bias is also more pronounced for older blocks processed via
the APFAR and DRP methods. Craven et al. (2013) found overall higher proteome
composition correlation between approximately 1-year-old and 10-year-old normal
FFPE kidney tissue (PCC value of 0.954) and FFPE renal cell carcinoma tissue (PCC
values of 0.885).
Fig. 30 shows the correlation of protein abundance for all sample preparation
methods for each block age. This illustrates that, for 1-year-old blocks, the DRP and
HILIC methods yielded comparable relative protein abundances (PCC value of
0.863), whereas proteome composition correlation was lower for the AFFAR and
DRP (PCC value of 0.755) as well as APFAR and HILIC (PCC value of 0.789)
methods. Overall, the 5 and 10-year-old blocks show similar proteome composition
correlation between the sample preparation methods.
For 5-year-old blocks, the PCC values for the APFAR and HILIC, as well as DRP
and HILIC methods are approximately equal, 0.838 and 0.839, respectively. The
APFAR and DRP method has a higher PCC value of 0.859, indicating slightly higher
correlation in proteome composition between these two sample preparation methods.
http://etd.uwc.ac.za/
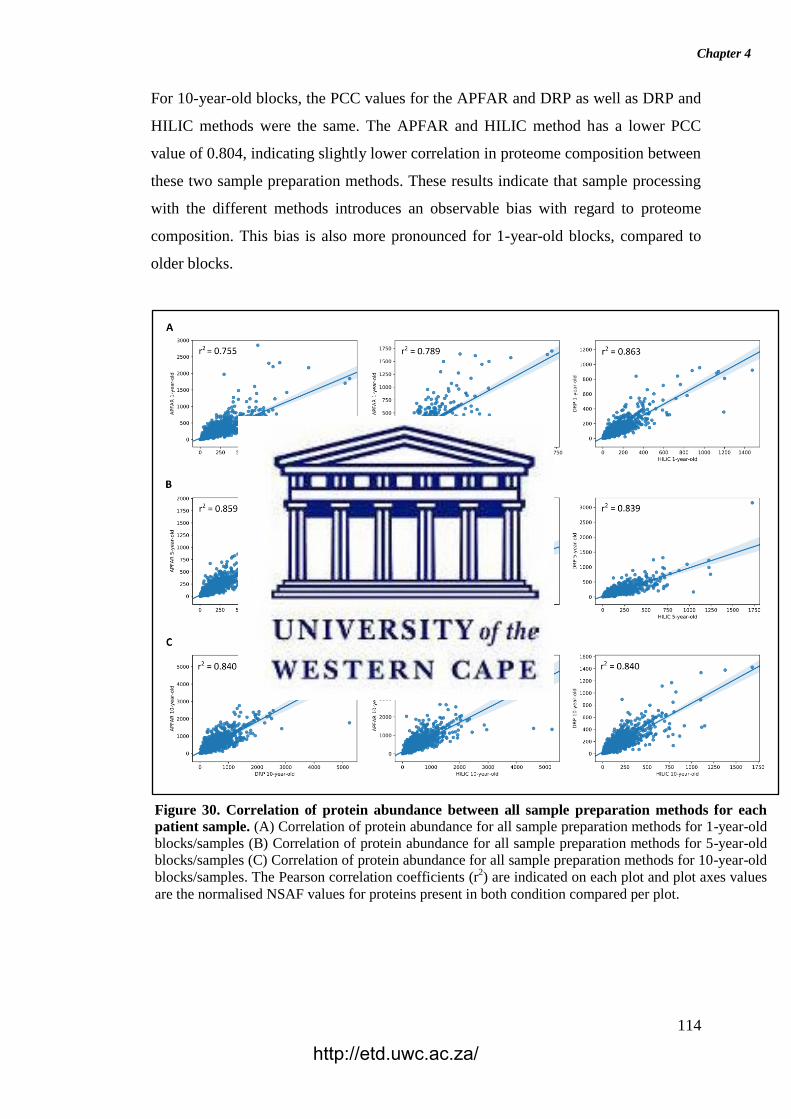
Chapter 4
114
For 10-year-old blocks, the PCC values for the APFAR and DRP as well as DRP and
HILIC methods were the same. The APFAR and HILIC method has a lower PCC
value of 0.804, indicating slightly lower correlation in proteome composition between
these two sample preparation methods. These results indicate that sample processing
with the different methods introduces an observable bias with regard to proteome
composition. This bias is also more pronounced for 1-year-old blocks, compared to
older blocks.
Figure 30. Correlation of protein abundance between all sample preparation methods for each
patient sample. (A) Correlation of protein abundance for all sample preparation methods for 1-year-old
blocks/samples (B) Correlation of protein abundance for all sample preparation methods for 5-year-old
blocks/samples (C) Correlation of protein abundance for all sample preparation methods for 10-year-old
blocks/samples. The Pearson correlation coefficients (r2) are indicated on each plot and plot axes values
are the normalised NSAF values for proteins present in both condition compared per plot.
http://etd.uwc.ac.za/

Chapter 4
115
PCA plots showing clusters of samples, based on their similarities, were generated for
all block ages and sample preparation methods (Fig. 31). The samples that have
similar expression profiles are clustered together. Figures 31 A – B show the
clustering of different block ages (1, 5 and 10 years) for each sample preparation
method, with the DRP method having the lowest variance (10.73%) between block
ages, followed by the HILIC method (13.68%), and the APFAR method, which has
the highest variance at 14.57%.
Figure 31. PCA plots for all block ages and sample preparation methods. The NSAF values for
proteins identified from each patient case were normalised and dimensionality reduced by principal
component analysis of the datasets. (A) PCA plot of all block age (1-year-old = red; 5-year-old =
green; 10-year-old = blue) samples processed via the APFAR method, (B) PCA plot of all block age
(1-year-old = red; 5-year-old = green; 10-year-old = blue) samples processed via the DRP method,
(C) PCA plot of all block age (1-year-old = red; 5-year-old = green; 10-year-old = blue) samples
processed via the HILIC method, (D) PCA plot of 1-year-old samples for all sample preparation
methods (APFAR = red; DRP = green; HILIC = blue), (E) PCA plot of 5-year-old samples for all
sample preparation methods (APFAR = red; DRP = green; HILIC = blue), (F) PCA plot of 10-year-
old samples for all sample preparation methods (APFAR = red; DRP = green; HILIC = blue).
http://etd.uwc.ac.za/

Chapter 4
116
For the sample preparation methods (Figures 31 D – F), the 10-year-old
blocks/samples shows the lowest variance between the different methods (11.4%),
followed by the 5-year-old blocks/samples. This could be due, in part, to similar
proteins extracted from the older blocks because the formaldehyde-induced protein
cross-linking process is continual and becomes more extensive with time (as
discussed in section 4.3.3). The 1-year-old blocks/samples (Fig. 31 D) shows the
highest variance (15.86%) between the different methods.
4.3.6 GO analysis of identified proteins
The effect of storage time/block age as well as the sample preparation methods’
protein selection biases were assessed with regards to the main biological processes
and cellular components present within the identified proteins, using Gene Ontology
(GO) annotation. The distribution of the percentages of proteins belonging to each
GO term was plotted for GO terms that occurred at >15% frequency for all samples
and experimental conditions (Fig. 32).
Overall, similar GO profiles were obtained for all samples, therefore only the GO
terms that showed some observable difference between experimental conditions were
plotted. Figure 32 A shows the percentage frequency at which the identified proteins
(of all experimental conditions) occurs for each of the plotted GO terms for biological
processes, and Fig. 32 B shows GO terms for cellular components. The lack of
observable differences in GO term frequency between the different block ages and
sample preparation methods indicate that neither had an observable protein-selection
bias. Therefore all block ages and sample preparation methods used in this study
demonstrate more or less equivalent usability for proteomic analysis.
http://etd.uwc.ac.za/
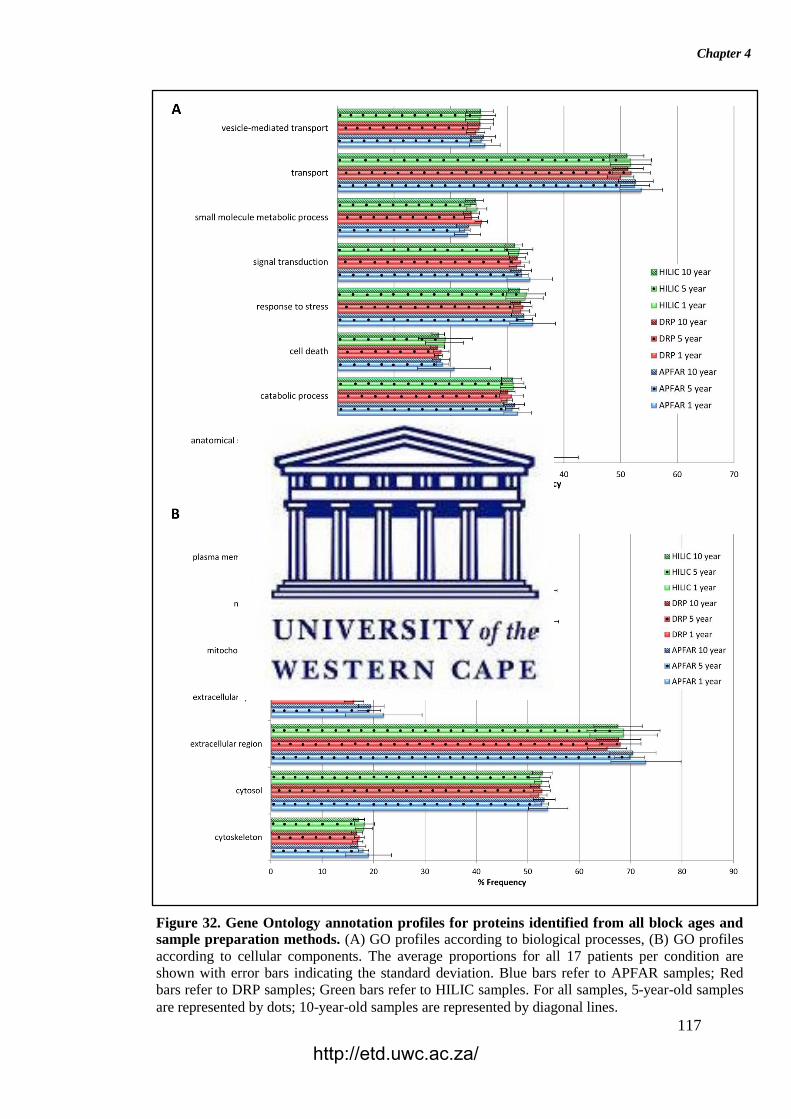
Chapter 4
117
Figure 32. Gene Ontology annotation profiles for proteins identified from all block ages and
sample preparation methods. (A) GO profiles according to biological processes, (B) GO profiles
according to cellular components. The average proportions for all 17 patients per condition are
shown with error bars indicating the standard deviation. Blue bars refer to APFAR samples; Red
bars refer to DRP samples; Green bars refer to HILIC samples. For all samples, 5-year-old samples
are represented by dots; 10-year-old samples are represented by diagonal lines.
http://etd.uwc.ac.za/
Chapter 4
118
4.3.7 Assessment of the digestion efficiency of the sample preparation methods
for all block ages
To assess the reproducibility and digestion efficiency of the different sample
preparation methods, the percentages of missed cleavages across all samples were
analysed (Fig. 33). To successfully analyse FFPE tissues requires overcoming the
issue of the formaldehyde cross-linking between molecules (Magdeldin &
Yamamoto, 2012; Fowler et al., 2013; Avaritt et al., 2014; Gustafsson et al., 2015).
The most important aspect to take into consideration for accurate protein extraction
from FFPE tissues is the cleavage of these methylene bridges to allow for proper
trypsin digestion. The methylene bridges prevent trypsin from reaching its cleavage
sites. If the methylene bridges are not adequately cleaved, it will result in improperly
digested, cross-linked peptides that will not produce correct MS results. Therefore,
the effect of storage time/block age on trypsin digestion efficiency was also
determined by comparing the percentage of missed cleavages across all block ages.
Fig. 33 shows that overall, all sample preparation methods and all block ages
generated low numbers of missed cleavages. The APFAR method (Fig. 33 A)
generated the lowest percentages of missed cleavages with ≥85% of all peptides for
1-year-old samples having no missed cleavages, and ≥90% of all peptides for 5 and
10-year-old samples having no missed cleavages. This was followed by the DRP
method (Fig. 33 B), with ≥85% of all peptides (except for sample number DRP-9) for
1-year-old samples having no missed cleavages, and ≥85% of all peptides for 5 and
10-year-old samples having no missed cleavages (except for sample number DRP-34
of the 5-year-old cohort). The HILIC method (Fig. 33 C) had overall lower digestion
efficiency with ≥80% of all peptides for 1 and 5-year-old samples having no missed
cleavages, and ≥80% of all peptides for 10-year-old samples having no missed
cleavages (except for samples HILIC-37 and HILIC-41).
http://etd.uwc.ac.za/

Chapter 4
119
Figure 33. The numbers of missed cleavages for all block ages and sample preparation methods.
For each sample preparation method and block age, the percentages of missed cleavages are plotted.
(A) APFAR 1, 5 and 10-year-old blocks (B) DRP 1, 5 and 10-year-old blocks (C) HILIC 1, 5 and 10-
year-old blocks. The figure key in the bottom right corner shows the graph colours for corresponding
number of missed cleavages, with 0 missed cleavages = blue, 1 missed cleavage = orange, 2 missed
cleavages = green, etc.
http://etd.uwc.ac.za/
Chapter 4
120
The sample preparation methods’ digestion efficiency therefore does not appear to be
only affected by the age of the sample, since older and newer blocks gave varying
results depending on the processing method used. Sprung et al. (2009) found that
after deparaffinisation and rehydration, cross-linked proteins are efficiently digested
with trypsin, without the need for additional specialised reagents, even under mild
conditions typically used for fresh tissues. This is also observed here, since all block
ages and sample preparation methods used demonstrate sufficient trypsin
activity/cleavage efficiency, with all samples showing low levels of missed
cleavages. Generally, the percentage of missed cleavages of the present study was in
the range of several other recent reports (Batth et al., 2018; Hughes et al., 2018;
Moggridge et al., 2018), with lower percentage of missed cleavages reported in
Kachuk et al. (2015).
4.3.8 Effects of block age and sample preparation methods on sample proteome
integrity
The oxidation of methionine is a major protein modification, which converts
methionine to methionine sulfoxide, and targets the affected protein for degradation,
both in vivo and in vitro (Liu et al., 2013). Methionine oxidation is linked to
processes relating to aging and pathology (in vivo) as well as in vitro conditions
caused by protein purification, storage, light exposure, and exposure to free radicals
generated in the presence of metals during LC-MS/MS analysis (Liu et al., 2013). To
determine the impact of long-term storage, the percentage of peptides containing
methionine oxidation (out of the total number of peptides identified) was calculated
for all block ages and sample preparation methods (Fig. 34).
Kruskal–Wallis tests were conducted to determine if the percentage of peptides
containing methionine oxidation were significantly different between block ages for
each sample preparation method (Appendix D Supplementary table 2). No significant
differences were found between 1, 5 and 10-year old blocks/samples processed via
the APFAR (H(2) = 1.23, p = 0.54), DRP (H(2) = 0.86, p = 0.65), or HILIC (H(2) =
3.38, p = 0.18) methods. Fig. 34 shows that for the 10-year-old blocks/samples the
percentage of peptides with methionine oxidation are 8.77 ± 3.41%, 7.77 ± 2.41%,
and 5.47 ± 2.13%, for APFAR, DRP and HILIC respectively. Similar percentages of
http://etd.uwc.ac.za/
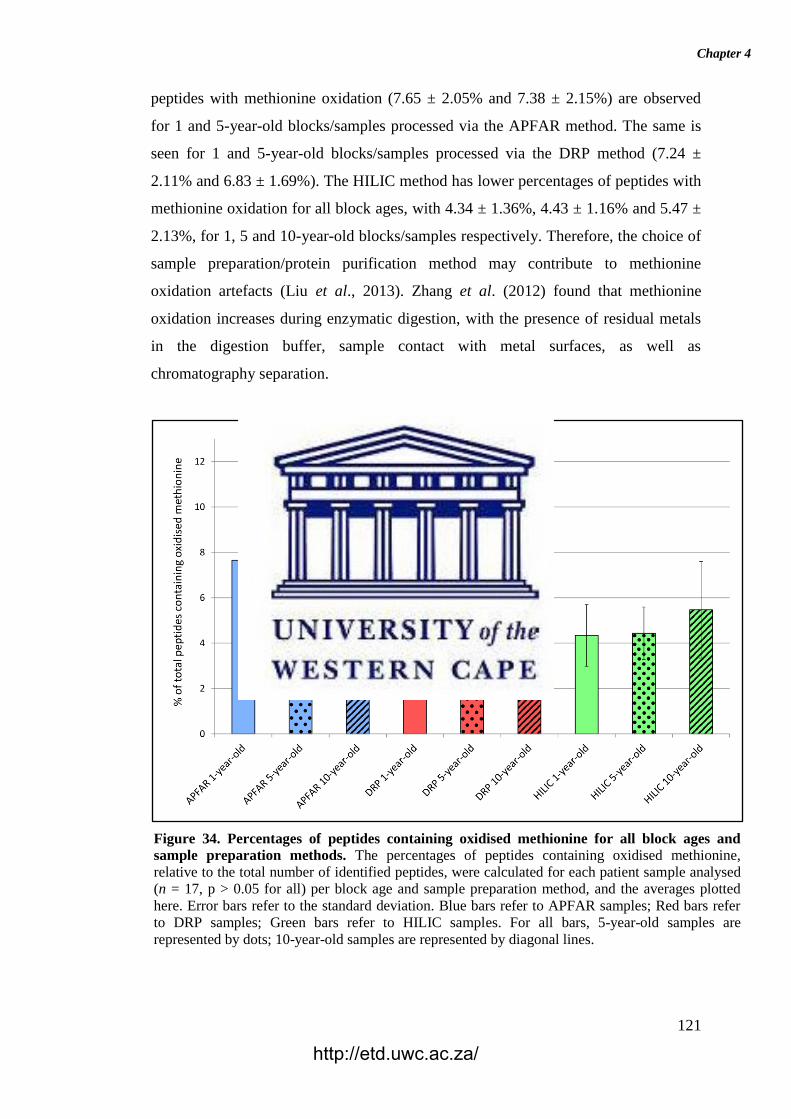
Chapter 4
121
peptides with methionine oxidation (7.65 ± 2.05% and 7.38 ± 2.15%) are observed
for 1 and 5-year-old blocks/samples processed via the APFAR method. The same is
seen for 1 and 5-year-old blocks/samples processed via the DRP method (7.24 ±
2.11% and 6.83 ± 1.69%). The HILIC method has lower percentages of peptides with
methionine oxidation for all block ages, with 4.34 ± 1.36%, 4.43 ± 1.16% and 5.47 ±
2.13%, for 1, 5 and 10-year-old blocks/samples respectively. Therefore, the choice of
sample preparation/protein purification method may contribute to methionine
oxidation artefacts (Liu et al., 2013). Zhang et al. (2012) found that methionine
oxidation increases during enzymatic digestion, with the presence of residual metals
in the digestion buffer, sample contact with metal surfaces, as well as
chromatography separation.
Figure 34. Percentages of peptides containing oxidised methionine for all block ages and
sample preparation methods. The percentages of peptides containing oxidised methionine,
relative to the total number of identified peptides, were calculated for each patient sample analysed
(n = 17, p > 0.05 for all) per block age and sample preparation method, and the averages plotted
here. Error bars refer to the standard deviation. Blue bars refer to APFAR samples; Red bars refer
to DRP samples; Green bars refer to HILIC samples. For all bars, 5-year-old samples are
represented by dots; 10-year-old samples are represented by diagonal lines.
http://etd.uwc.ac.za/
Chapter 4
122
The SP3/HILIC method’s results are in agreement with results reported by Bronsert
et al. (2014) for newly preserved (<1-year-old) FFPE samples (processed using
acetone precipitation and sodium hydroxide resolubilisation for protein purification),
which had methionine oxidation ratios of 3.9 – 4.5% for all identified peptides. In
contrast, Sprung et al. (2009) reported higher methionine oxidation levels and found
that archived colon adenoma tissues displayed an increase in methionine oxidation
with block age - from 16.8% after one year of storage, 18.2% for 5-year-old samples
up to 25.2% after 10 years of storage.
4.4 Conclusions
Archived FFPE tissue repositories are precious sources of clinical material, often
stored for decades, for clinical proteomic studies. Since these preserved blocks may
be conveniently stored at ambient temperatures, it makes them easily accessible and
cost effective. However, standardised protocols for the proteomic analysis of FFPE
tissues have not been determined yet. In addition, the effect of block age and storage
at resource-limited institutions, on protein quality remains unclear. We have
demonstrated (using FFPE human colorectal cancer resection tissue) that, overall,
block age mainly affects protein yields during the protein extraction phase. Therefore
greater amounts of starting material are required for older blocks prior to LC-MS/MS
analysis. Analysed samples’ peptide and protein identifications mainly differed
according to the protein purification method used and not block age, which mainly
impacted on tissue proteome composition.
This study is also of particular relevance, since it assessed the performance of
different protein purification techniques on tissues derived from samples stored over a
long period of time (1 to 10 years). The different methods show differences in the
number of peptides and proteins identified and sample proteome composition,
differences in reproducibility in terms of peptide identification overlap, PCA
variance, as well as protocol digestion efficiency. Overall, the DRP and SP3/HILIC
methods performed the best, with the SP3/HILIC method requiring less protein than
the other methods, therefore making it the most sensitive and efficient protein
purification method tested here.
http://etd.uwc.ac.za/
Chapter 4
123
These results are encouraging since they indicate that long-term storage of FFPE
tissues does not significantly interfere with retrospective proteomic analysis. In
addition, variations in pre-analytical factors (spanning a decade), such as tissue
harvesting, handling, the fixation protocol used as well as storage conditions, does not
affect protein extraction and shotgun proteomic analysis to a significant extent.
http://etd.uwc.ac.za/
Chapter 5
124
Chapter 5: Conclusions and recommendations
5.1 Key findings and future recommendations
FFPE tissue archives are valuable sources of clinical material for clinical proteomic
studies (Fowler et al., 2013; Avaritt et al., 2014; Bronsert et al., 2014; Gustafsson et
al., 2015). These preserved blocks may be conveniently stored for decades, at
ambient temperatures, and are easily accessible and cost effective. In addition, they
are accompanied by patient records and metadata, which may facilitate and enhance
clinical studies (Fowler et al., 2013; Avaritt et al., 2014; Bronsert et al., 2014;
Gustafsson et al., 2015). However, standardised analytical protocols, such as protein
extraction, digestion and sample purification for proteomic analysis of FFPE tissues
have not been determined yet. In addition, the impact of block age and storage at
resource-limited institutions, on protein quantity/quality remains unclear.
Protein yields from this study were within the ranges of previously reported values
for FFPE tissue (Sprung et al., 2009; Rodríguez-Rigueiro et al., 2011; Wolff et al.,
2011). Here it was demonstrated that the addition of 0.5% (w/v) PEG 20,000 to
protein extraction buffer (for protein extraction from FFPE human colorectal
carcinoma resection tissue) impacted on MS analysis and resulted in overall lower
peptide and protein identifications, compared to buffer without the addition of PEG.
In addition, protein samples extracted without PEG showed higher reproducibility.
The analysis of the sample pellets also showed that the protein extraction buffer was
efficient enough to extract the majority of proteins. Therefore, by building on from
previous studies, which found that higher protein concentrations (>10 µg) (of FFPE
animal tissues and human cells) compromise the function of PEG (Wiśniewski et al.,
2011; Shen et al., 2015), it was also demonstrated here that this effect is also
observed in FFPE human colon tissue.
Using FFPE human colorectal carcinoma resection tissue, stored for approximately 1,
5 and 10 years, it was found that block age mainly affects protein yields during the
protein extraction phase. Therefore, it is advised to use greater amounts of starting
material/tissue during the protein extraction phase for older blocks. In addition,
http://etd.uwc.ac.za/
Chapter 5
125
changes in tissue proteome composition were also found between newer and older
blocks, therefore this should also be considered when performing MS-based
proteomic analysis on FFPE samples.
This study is also of particular relevance, since it assessed the performance of
different sample preparation techniques for shotgun MS analysis of FFPE tissues
stored for up to a decade. The different methods demonstrated differences in the
number of peptides and proteins identified and tissue proteome composition,
differences in reproducibility in terms of peptide identification overlap, PCA
variance, as well as protocol digestion efficiency. The DRP and HILIC sample
preparation methods performed the best overall and indicates that long-term storage
of FFPE tissues do not significantly interfere with retrospective MS-based proteomic
analysis. This is also encouraging since it shows that variations in pre-analytical
factors, spanning a decade, (including tissue harvesting, handling, fixation protocol
used as well as storage time and conditions) does not significantly affect shotgun MS-
based proteomic analysis of older FFPE samples, and known proteins that are
deregulated in colon cancer are still detected in older samples.
This study forms part of a larger project of studies towards improvement of FFPE
sample preparation methods for MS analysis, as well as identification of possible
biomarkers for CRC in South African populations. The project lays the initial
groundwork required towards CRC biomarker discovery.
The main limitation of the study was the inability to control or account for the impact
of pre-analytical factors on the downstream proteomic analysis of the samples
analysed. These factors may affect the number of identifiable peptides and especially
peptides with labile PTMs, such as phosphopeptides (Thompson et al., 2013;
Piehowski et al., 2018). In addition, the impact of biological variance was also a
confounding factor (Thompson et al., 2013; Piehowski et al., 2018). This was
somewhat compensated for in the subsequent block age analysis by choosing a 70%
statistically significant sample size (n = 17 patients per experimental condition) based
on previous protein identifications, to ensure that results reflect analytical differences
and not biological variance.
http://etd.uwc.ac.za/
Chapter 5
126
5.2 Concluding remarks
Even with the great advances made in molecular medicine, genomics, proteomics and
translational research in the past decades, the most common cancer mortality rates
have not been significantly reduced (Diamandis, 2004). Successful cancer treatment
still includes primary prevention, earlier diagnosis and improved therapeutic
treatments. Primary prevention strategies still lag behind since cancer pathogenesis
and tumour progression mechanisms still remain largely unknown. New, non-
invasive cancer biomarkers and diagnostic techniques that will further enhance our
ability to diagnose, prognose and predict therapeutic response are still required for
many types of cancer, including CRC (Diamandis, 2004).
Genomic and proteomic studies are able to generate a broad perspective into the
molecular events in a transformed cell; however, many factors need to be taken into
consideration for experiments to be accurate and reproducible. Therefore,
experimental validation remains one of the challenges that need to be overcome for
future biomarker discovery (Baak et al., 2005). Future prospects for CRC diagnostic
techniques include developing and defining biomarkers that are robust and
reproducible and unaffected by slight changes in sample handling and experimental
methodology. To retrieve as much information from patient biopsies as possible,
genomic and proteomic techniques may be used in conjunction in future. Of current
importance is the necessity to develop high-throughput experimental systems to
validate these methods (Punt et al., 2016).
http://etd.uwc.ac.za/
References
127
References
Adeola, H., Goosen, R.W., Goldberg, P., Blackburn, J. (2014). Prospects of ‘Omics based molecular approaches in colorectal cancer diagnosis and treatment in the developing world: A case study in Cape Town, South Africa. In Khan, J.S. (ed.), Colorectal cancer – Surgery, diagnostics and treatment (Chapter 15). Rijeka: InTech. http://dx.doi.org/10.5772/57485
Aebersold, R., Mann, M. (2003). Mass spectrometry-based proteomics. Nature, 422,
198–207. Agilent Technologies. (2009). FFPE protein extraction solution protocol. Retrieved
from https://www.chem-agilent.com/pdf/strata/400925.pdf Aguilar, M. (2004). HPLC of peptides and proteins: Basic theory and methodology.
In Aguilar, M. (ed.), Methods in Molecular Biology (Vol. 251) - HPLC of Peptides and Proteins: Methods and Protocols (pp. 3 – 8). New Jersey: Humana Press Inc.
Alpert, A.J. (1990). Hydrophillic-interaction chromatography for the separation of
peptides, nucleic acids and other polar compounds. J. Chromatogr., 499, 177-196.
Alpert, A.J. (2008). Electrostatic repulsion hydrophilic interaction chromatography
for isocratic separation of charged solutes and selective isolation of phosphopeptides. Anal. Chem., 80, 62-76.
Andersen, C.L., Christensen, L.L., Thorsen, K., Schepeler, T., Sorensen, F.B.,
Verspaget, H.W., Simon, R., Kruhoffer, M., Aaltonen, L.A., Laurberg, S., Orntoft, T.F. (2009). Dysregulation of the transcription factors SOX4, CBFB and SMARCC1 correlates with outcome of colorectal cancer. Br. J. Cancer, 100(3), 511–23.
Apweiler, R., Bairoch, A., Wu, C.H., Barker, W.C., Boeckmann, B., Ferro, S.,
Gasteiger, E., Huang, H., Lopez, R., Magrane, M., Martin, M.J., Natale, D.A., O'Donovan, C., Redaschi, N., Yeh, L.L. (2004). UniProt: the Universal Protein knowledgebase. Nucleic Acids Research, 32, D115 - D119. DOI: 10.1093/nar/gkh131
Avaritt, N.L,, Shalin, S., Tackett, A.J. (2014) Decoding the proteome in formalin-
fixed paraffin-embedded (FFPE) tissues. J Proteomics Bioinform, 7: e25. DOI:10.4172/jpb.10000e25.
Baak, J.P.A., Janssen, E.A.M, Soreide, K., Heikkilæ, R. (2005). Genomics and
proteomics - the way forward. Annals of Oncology, 16(Supplement 2), ii30–ii44. DOI:10.1093/annonc/mdi728.
Balboa, E., Carracedo, A., Barros, F. (2014). The complexity of colorectal cancer
biology — putting bricks on the path to personalized medicine. In Khan, J.S. (ed.), Colorectal cancer – Surgery, diagnostics and treatment (Chapter 17). Rijeka: InTech. http://dx.doi.org/10.5772/57485
Ballinger, A., Patchett, S. (2003). Clinical Medicine (3
rd edition). In Kumar, P. &
Clark, M. (eds.), Saunders’ Pocket Essentials series (pp. 93 – 97).
Philadelphia: Elsevier Limited.
http://etd.uwc.ac.za/
References
128
Barsnes, H., Vaudel, M., Colaert, N., Helsens, K., Sickmann, A., Berven, F.S.,
Martens, L. (2011). Compomics-utilities: an open-source Java library for
computational proteomics. BMC Bioinf., 12, 70. Bass, B.P., Engel, K.B., Greytak, S.R., Moore, H.M. (2014). A review of
preanalytical factors affecting molecular, protein, and morphological analysis of formalinfixed, paraffin-embedded (FFPE) tissue: how well do you know your FFPE specimen? Arch Pathol Lab Med., 138(11), 1520–30.
Batth, T.S., Tollenaere, M.A.X., Rüther, P.L., et al. (2018). Protein aggregation
capture on microparticles enables multi-purpose proteomics sample preparation. Mol Cell Proteomics., Preprint at https://www.biorxiv.org/content/early/2018/10/25/447904.
Bell, A.W., Deutsch, E.W., Au, C.E., et al. (2009). A HUPO test sample study
reveals common problems in mass spectrometry–based proteomics. Nature Methods, 6(6), 423–546.
Bessant, C. (2017). Introduction to proteome informatics. In Bessant, C. (ed.), New
developments in mass spectrometry no. 5: Proteome informatics (pp. 1 – 12). Cambridge: The Royal Society of Chemistry.
Bielas, J.H., Loeb, K.R., Rubin, B.P., True, L.D., Loeb, L.A. (2006). Human cancers
express a mutator phenotype. National Academy of Sciences of the United
States of America, 103(48), 18238 - 18242. Blein-Nicolas, M., Zivy, M. (2016). Thousand and one ways to quantify and compare
protein abundances in label-free bottom-up proteomics. BBA - Proteins and Proteomics, DOI:10.1016/j.bbapap.2016.02.019.
Botelho, D., Wall, M.J., Vieira, D.B., Fitzsimmons, S., Liu, F., Doucette, A. (2010).
Top-down and bottom-up proteomics of SDS-containing solutions following mass-based separation. J Proteome Res., 9, 2863−2870.
Bronsert, P., Weiber, J., Biniossek, M.L., Kuehs, M., Mayer, B., Drendel, V., Timme,
S., Shahinian, H., Küsters, S., Wellner, U.F., Lassmann, S., Werner, M., Schilling, O. (2014). Impact of routinely employed procedures for tissue processing on the proteomic analysis of formalin-fixed paraffin-embedded tissue. Proteomics Clin. Appl., 8, 796–804. DOI: 10.1002/prca.201300082
Busby, T.F., Ingham, K.C. (1980). Removal of polyethylene glycol from proteins by
salt-induced phase separation. Vox Sang., 39, 93-100. Bustin, S.A., Li, S.R., Dorudi, S. (2001). Expression of the Ca
2+-activated chloride
channel genes CLCA1 and CLCA2 is downregulated in human colorectal cancer. DNA Cell Biol., 20(6), 331–8.
Chambers, M.C., Maclean, B., Burke, R., et al., (2012). A cross-platform toolkit for
mass spectrometry and proteomics. Nature Biotechnology, 30(10), 918–920. Chen, E.I., Yates, J.R. (2007). Cancer proteomics by quantitative shotgun proteomics.
Mol Oncol., 1(2), 144–159. Christin, C., Bischoff, R., Horvatovich, P. (2011). Data processing pipelines for
comprehensive profiling of proteomics samples by label-free LC–MS for biomarker discovery. Talanta, 83, 1209–1224. DOI:10.1016/j.talanta.2010.10.029.
http://etd.uwc.ac.za/
References
129
Chugunova, A., Navalayeu, T., Dontsova, O., Sergiev, P. (2018). Mining for Small
Translated ORFs. J. Proteome Res., 17, 1−11. Coetzee, E.D.T., Thomson, S.R. (2013). Inherited colorectal cancer: a plea for a
national registry. S Afr J Surg, 51(2), 42-43. DOI:10.7196/SAJS.1742. Craig, R., Beavis, R.C. (2004). TANDEM : matching proteins with tandem mass
spectra, Bioinformatics, 20(9), 1466–1467. Craven, R.A., Cairns, D.A., Zougman, A., Harnden, P., Selby, P.J., Banks, R.E.
(2013). Proteomic analysis of formalin-fixed paraffin-embedded renal tissue samples by label-free MS: Assessment of overall technical variability and the impact of block age. Proteomics Clin. Appl., 7(3-4), 273–282.
Daniele, L., D’Armento, G., Bussolati, G. (2011). Preanalytical time interval (PATI)
and fixation. In Stanta, G. (ed.), Guidelines for molecular analysis in archive tissues. (pp. 5 – 11). Berlin: Springer-Verlag.
Deutsch, E.W. (2012). File formats commonly used in mass spectrometry proteomics.
Molecular & Cellular Proteomics, 11.12, 1612–1621. DOI:10.1074/mcp.R112.019695.
Deutsch, E.W., Csordas, A., Sun, Z., et al., (2017). The ProteomeXchange
Consortium in 2017: supporting the cultural change in proteomics public data deposition. Nucleic Acids Res, 54(D1), D1100-D1106.
Diamandis, E.P. (2004). Mass spectrometry as a diagnostic and a cancer biomarker
discovery tool – opportunities and potential limitations. Molecular & Cellular Proteomics, 3, 367–378.
Doerr, A. (2013). Mass spectrometry of intact protein complexes. Nature Methods,
10(1), 38. Dorfer, V., Pichler, P., Stranzl, T., Stadlmann, J., Taus, T., Winkler, S., Mechtler, K.,
(2014). MS Amanda, a universal identification algorithm optimized for high accuracy tandem mass spectra, J. Proteome Res., 13, 3679–3684.
Doucette, A.A, Vieira, D.B., Orton, D.J., Wall, M.J. (2014). Resolubilization of
precipitated intact membrane proteins with cold formic acid for analysis by mass spectrometry. J. Proteome Res., 13(12), 6001–6012.
Duncan, M.W., Aebersold, R., Caprioli, R.M. (2010). The pros and cons of peptide-
centric proteomics. Nature Biotechnology, 28(7), 659–664. Elias, J.E., Gygi, S.P. (2010). Target-Decoy search strategy for mass spectrometry-
based proteomics. Methods Mol Biol., 604, 55–71. DOI:10.1007/978-1-60761-444-9_5.
Elliott, A.C., Hynan, L.S. (2011). A SAS® macro implementation of a multiple
comparison post hoc test for a Kruskal–Wallis analysis. Computer methods and programs in biomedicine, 102, 75-80.
Farias, S.S., Kline, K.G., Klepacki, J., Wu, C.C. (2010). Quantitative improvements
in peptide recovery at elevated chromatographic temperatures from μLC/MS analyses of brain using SRM mass spectrometry. Anal. Chem., 82(9), 3435–3440. DOI:10.1021/ac100359p.
http://etd.uwc.ac.za/
References
130
Field, A., Miles, J. (2010). Discovering statistics using SAS, London: SAGE
Publications Ltd. Feist, P., Hummon, A.B. (2015). Proteomic challenges: sample preparation
techniques for microgram-quantity protein analysis from biological samples. Int. J. Mol. Sci, 16, 3537-3563.
Findeisen, P., Neumaier, M. (2009). Mass spectrometry-based clinical proteomics
profiling: Current status and future directions. Expert Rev. Proteomics, 6(5), 457–459.
Foster, P.R., Dunnill, P., Lilly, M.D. (1973). The precipitation of enzymes from cell
extracts of Saccharomyces Cerevisiae by polyethyleneglycol. Biochim. Biophys. Acta, 317, 505-516.
Fowler, C.B., O’Leary, T.J., Mason, J.T. (2013). Toward improving the proteomic
analysis of formalin-fixed paraffin-embedded tissue. Expert Rev Proteomics, 10(4), 389-400.
French, W.R., Zimmerman, L.J., Schilling, B., et al. (2015). Wavelet-based peak
detection and a new charge inference procedure for MS/MS implemented in ProteoWizard’s msConvert. J. Proteome Res., 14, 1299−1307.
Fu, Z., Yan, K., Rosenberg, A., Jin, Z. et al. (2013). Improved protein extraction and
protein identification from archival formalin-fixed paraffin-embedded human aortas. Proteomics Clin. Appl., 7, 217–224.
Gámez-Pozo, A., Ferrer, N. I., Ciruelos, E., Lopez-Vacas, R. et al. (2013). Shotgun
proteomics of archival triple-negative breast cancer samples. Proteomics Clin. Appl., 7, 283–291.
Geer, L.Y., Markey, S.P, Kowalak, J.A., Wagner, L., Xu, M., Maynard, D.M., …
Bryant, S.H. (2004). Open mass spectrometry search algorithm, J. Proteome Res., 3(5), 958–964.
Gustafsson, O.J.R., Arentz, G., Hoffmann, P. (2015). Proteomic developments in the
analysis of formalin-fixed tissue. Biochimica et Biophysica Acta, 1854, 559–580.
Guo, T., Wang, W., Rudnick, P.A., Song, T., Li, J., Zhuang, Z., Weil, R.J., DeVoe,
D.L., Lee, C.S., Balgley, B.M. (2007). Proteome analysis of microdissected formalin-fixed and paraffin-embedded tissue specimens. J. Histochem. Cytochem., 55(7), 763–772.
Helman, L.J., Gazdar, A.F., Park, J.G., Cohen, P.S., Cotelingam, J.D., Israel, M.A.
(1988). Chromogranin A expression in normal and malignant human tissues. J. Clin. Invest., 82(2), 686–90.
Holfeld, A., Valdés, A., Malmström, P., Segersten, U., Bergström Lind, S., (2018). A
parallel proteomic workflow for mass spectrometric analysis of tissue samples
preserved by different methods. Anal. Chem., 90(9), 5841-5849.
Hubbard, S.J. (2010). Computational approaches to peptide identification via tandem
MS. In Hubbard, S.J. & Jones, A.R. (eds.), Proteome Bioinformatics, Methods
http://etd.uwc.ac.za/
References
131
in Molecular Biology, Vol. 604 (pp. 23 – 42). New York: Humana Press
(Springer Science+Business Media). DOI: 10.1007/978-1-60761-444-9_3 Hughes, C.S., Foehr, S., Garfield, D.A., Furlong, E.E., Steinmetz, L.M., Krijgsveld, J.
(2014). Ultrasensitive proteome analysis using paramagnetic bead technology. Mol. Syst. Biol., 10(10), 1–10.
Hughes, C.S., Moggridge, S., Müller, T., Sorensen, P.H., Morin, G.B., Krijgsveld, J.
(2018). Single-pot, solid-phase-enhanced sample preparation for proteomics experiments. Nature protocols, 14(1), 1 – 18.
Hughes, C.S., Sorensen, P.H., Morin, G.B. (2019). A standardized and reproducible
proteomics protocol for bottom-up quantitative analysis of protein samples using SP3 and mass spectrometry. In Brun, V. & Coute´, Y. (eds.), Proteomics for Biomarker Discovery: Methods and Protocols, Methods in Molecular Biology, Vol. 1959 (pp. 65 – 87). New York: Springer Nature.
Hustoft, H.K., Malerod, H., Wilson, S.R., Reubsaet, L., Lundanes, E., Greibrokk, T.
(2012). A critical review of trypsin digestion for LC-MS based proteomics. In Leung, H-C. (ed.), Integrative proteomics (pp. 73 – 92). Croatia: InTech.
Ikeda, K., Monden, T., Kanoh, T., et al. (1998). Extraction and analysis of
diagnostically useful proteins from formalin-fixed, paraffin-embedded tissue sections. J Histochem Cytochem., 46(3), 397-403.
Juckes, I.R.M. (1971). Fractionation of proteins and viruses with polyethylene glycol.
Biochim. Biophys. Acta, 229, 535-546. Kachuk, C., Stephen, K., Doucette, A. (2015). Comparison of sodium dodecyl sulfate
depletion techniques for proteome analysis by mass spectrometry. Journal of
Chromatography A, 1418, 158-166.
Karpievitch, Y.V., Dabney, A.R., Smith, R.D. (2012). Normalization and missing
value imputation for label-free LC-MS analysis. BMC Bioinformatics,
13(Suppl 16):S5. DOI: 10.1186/1471-2105-13-S16-S5.
Keerthikumar, S., Mathivanan, S. (2017). Proteomic data storage and sharing. In
Keerthikumar, S. & Mathivanan, S. (eds.), Proteome Bioinformatics, Methods in Molecular Biology, Vol. 1549 (pp. 5 – 16). New York: Springer Nature.
Kessner, D., Chambers, M., Burke, R., Agus, D., Mallick, P. (2008). ProteoWizard:
open source software for rapid proteomics tools development. Bioinformatics, 24, 2534–2536.
Kim, S., Pevzner, P.A. (2014). MS-GF+ makes progress towards a universal database
search tool for proteomics, Nat. Commun., 5, 5277. Klockenbusch, C., O’Hara, J.E., Kast, J. (2012). Advancing formaldehyde cross-
linking toward quantitative proteomic applications. Anal Bioanal Chem, 404, 1057–1067. DOI 10.1007/s00216-012-6065-9.
Kumar, D., Yadav, A.K., Dash, D. (2017). Choosing an optimal database for protein
identification from tandem mass spectrometry data. In Keerthikumar, S. & Mathivanan, S. (eds.), Proteome Bioinformatics, Methods in Molecular Biology, Vol. 1549 (pp. 17 – 29). New York: Springer Nature.
http://etd.uwc.ac.za/
References
132
Kyte, J., Doolittle, R.F. (1982). A simple method for displaying the hydropathic character of a protein. J. Mol. Biol., 157, 105–132.
Lai, X., Wang, L., Witzmann, F.A. (2013). Issues and applications in label-free
quantitative mass spectrometry. International Journal of Proteomics, 2013, 1-3. http://dx.doi.org/10.1155/2013/756039
Lee, S., Bang, S., Song, K., Lee, I. (2006). Differential expression in normal-
adenoma-carcinoma sequence suggests complex molecular carcinogenesis in colon. Oncol. Rep., 16(4), 747–54.
Lemaire, R., Desmons, A., Tabet, J.C., Day, R., Salzet, M., Fournier, I. (2007). Direct
analysis and MALDI imaging of formalin-fixed, paraffin-embedded tissue sections. Journal of Proteome Research, 6, 1295-1305.
Li, A., Goto, M., Horinouchi, M., Tanaka, S., Imai, K., Kim, Y. S., Sato, E.,
Yonezawa, S. (2001). Expression of MUC1 and MUC2 mucins and relationship with cell proliferative activity in human colorectal neoplasia. Pathol. Int., 51(11), 853–60.
Liu, H., Ponniah, G., Neill, A., Patel, R., Andrien, B. (2013). Accurate determination
of protein methionine oxidation by stable isotope labeling and LC-MS analysis. Anal. Chem., 85, 11705−11709.
Maes, E., Valkenborg, D., Mertens, I., et al. (2013). Proteomic analysis of formalin-
fixed paraffin embedded colorectal cancer tissue using tandem mass tag protein labelling. Mol Biosyst., 9, 2686–2695.
Magdeldin, S., Yamamoto, T. (2012). Toward deciphering proteomes of formalin-
fixed paraffin-embedded (FFPE) tissues. Proteomics, 12, 1045-1058. Martens, M., Chambers, M., Sturm, M., et al., (2011). mzML - a community standard
for mass spectrometry data. Molecular & Cellular Proteomics, 10.1, 1–7. DOI:10.1074/mcp.R110.000133
Martin, S.F., Falkenberg, H., Dyrlund, T.F., Khoudoli, G.A., Mageean, C.J., Linding,
R. (2013). PROTEINCHALLENGE: Crowd sourcing in proteomics analysis and software development. J. Proteomics, 88, 41–46.
Michalski, A., Damoc, E., Hauschild, J., Lange, O., Wieghaus, A., Makarov, A.,
Nagaraj, N., Cox, J., Mann, M., Horning, S. (2011). Mass spectrometry-based
proteomics using Q Exactive, a high-performance benchtop quadrupole
Orbitrap mass spectrometer. Molecular & Cellular Proteomics, 10.9
(10.1074/mcp.M111.011015), 1–11. Mikesch, J. H., Buerger, H., Simon, R., Brandt, B. (2006). Decayaccelerating factor
(CD55): a versatile acting molecule in human malignancies. Biochim. Biophys. Acta, 1766(1), 42–52.
Mishra, A., Verma, M. (2010). Cancer biomarkers: Are we ready for the prime time?
Cancers, 2, 190-208. DOI:10.3390/cancers2010190 Moggridge, S., Sorensen, P.H., Morin, G.B., Hughes, C.S. (2018). Extending the
compatibility of the SP3 paramagnetic bead processing approach for proteomics. J Proteome Res, 17(4), 1730–1740.
http://etd.uwc.ac.za/
References
133
Nahnsen, S., Bielow, C., Reinert, K., Kohlbacher, O. (2013). Tools for label-free peptide quantification. Molecular & Cellular Proteomics, 12, 549–556. DOI:10.1074/mcp.R112.025163.
Netzel, B., Dasari, S. (2017). Peptide spectrum matching via database search and
spectral library search. In Bessant, C. (ed.), New developments in mass spectrometry no. 5: Proteome informatics (pp. 39 – 68). Cambridge: The Royal Society of Chemistry.
Nibbe, R.K., Chance, M.R. (2009). Approaches to biomarkers in human colorectal
cancer: looking back, to go forward. Biomark Med., 3(4), 385–396. DOI:10.2217/BMM.09.33.
Nozawa, Y., Van Belzen, N., Van der Made, A.C., Dinjens, W.N., Bosman, F.T.
(1996). Expression of nucleophosmin/B23 in normal and neoplastic colorectal mucosa. J. Pathol., 178(1), 48–52.
Ogata, S., Uehara, H., Chen, A., Itzkowitz, S.H. (1992). Mucin gene expression in
colonic tissues and cell lines. Cancer Res., 52(21), 5971–8. Oliveros, J.C. (2007-2015) Venny. An interactive tool for comparing lists with
Venn’s diagrams. http://bioinfogp.cnb.csic.es/tools/venny/index.html Ogorzalek Loo, R.R., Dales, N., Andrews, P.C. (1994). Surfactant effects on protein
structure examined by electrospray ionization mass spectrometry. Protein Sci, 3, 1975-1983.
Paine, M.R.L., Ellis, S.R., Maloney, D., Heeren, R.M.A., Verhaert, P.D.E.M. (2018).
Digestion-free analysis of peptides from 30-year-old formalin-fixed, paraffin-embedded tissue by mass spectrometry imaging. Anal. Chem., 90, 9272-9280.
Pellerin, D., Gagnon, H., Dubé, J., Corbin, F. (2015). Amicon-adapted enhanced
FASP: an in-solution digestion-based alternative sample preparation method to FASP. F1000Research, 4, 1-18. DOI:10.12688/f1000research.6529.1.
Perez-Riverol, Y., Alpi, E., Wang, R., Hermjakob, H., Vizcaíno, J.A. (2015). Making
proteomics data accessible and reusable: Current state of proteomics databases and repositories. Proteomics, 15, 930–949.
Perez-Riverol, Y., Csordas, A., Bai, J., et al., (2019). The PRIDE database and related
tools and resources in 2019: improving support for quantification data. Nucleic Acids Res, 47(D1), D442-D450.
Piehowski, P.D., Petyuk, V.A., Sontag, R.L., et al. (2018). Residual tissue
repositories as a resource for population‑based cancer proteomic studies. Clin Proteom, 15:26. https://doi.org/10.1186/s12014-018-9202-4
Powell, D.W., Weaver, C.M., Jennings, J.L., McAfee, K.J., He, Y., Weil, P.A., Link,
A.J. (2004). Cluster analysis of mass spectrometry data reveals a novel component of SAGA. Molecular and cellular biology, 24, 7249-7259.
Powis, G., Mustacich, D., Coon, A. (2000). The role of the redox protein thioredoxin
in cell growth and cancer. Free Radic. Biol. Med., 29(3–4), 312–22. Punt, C.J.A., Koopman, M., Vermeulen, L. (2016). From tumour heterogeneity to
advances in precision treatment of colorectal cancer. Nature Reviews Clinical
Oncology, Advance online publication. DOI:10.1038/nrclinonc.2016.171.
http://etd.uwc.ac.za/
References
134
Quesada-Calvo, F., Massot, C., Bertrand, V., Longuespée, R., Blétard, N., Somja, J., Mazzucchelli, G., Smargiasso, N., … Louis, E. (2017). OLFM4, KNG1 and Sec24C identified by proteomics and immunohistochemistry as potential markers of early colorectal cancer stages. Clin Proteom, 14(9). DOI:10.1186/s12014-017-9143-3.
Rodríguez-Rigueiro, T., Valladares-Ayerbes, M., Haz-Conde, M., Blanco, M.,
Aparicio, G., Fernandez-Puente, P., Blanco, F.J., Lorenzo, M.J., Aparicio, L.A., Figueroa, A. (2011). A novel procedure for protein extraction from formalin-fixed paraffin-embedded tissues. Proteomics, 11, 2555–2559.
Ruderman, D. (2017). Designing successful proteomics experiments. In Comai, L.,
Katz, J.E., Mallick, P. (eds.), Proteomics: Methods and Protocols (pp. 271 – 288). New York: Humana Press (Springer Science+Business Media). DOI: 10.1007/978-1-4939-6747-6_19
Scheerlinck, E., Dhaenens, M., Van Soom, A., Peelman, L., De Sutter, P., Van
Steendam, K., Deforce, D. (2015). Minimizing technical variation during sample preparation prior to label-free quantitative mass spectrometry. Analytical Biochemistry, 490, 14-19.
Scicchitano, M.S., Dalmas, D.A., Boyce, R.W., Thomas, H.C., Frazier, K.S. (2009).
Protein extraction of formalin-fixed, paraffin-embedded tissue enables robust proteomic profiles by mass spectrometry. Journal of Histochemistry & Cytochemistry, 57(9), 849–860.
Scopes, R.K. (1994). Making an extract. In Cantor, C.R. (ed.), Protein purification:
Principles and practice, 3rd
edition, (pp. 22 – 43). New York: Springer. Shen, T., Noon, K.R. (2004). Liquid chromatography–and tandem mass spectrometry
of peptides and proteins. In Aguilar, M. (ed.), Methods in molecular biology
Vol. 251: HPLC of Peptides and Proteins – Methods and Protocols (pp. 111 -
139). New Jersey: Humana Press Inc. Shen, K., Sun, J., Cao, X., Zhou, D., Li, J. (2015). Comparison of different buffers for
protein extraction from formalin-fixed and paraffin-embedded tissue specimens. PLoS ONE, 10(11): e0142650. DOI:10.1371/journal.pone.0142650.
Shi, S.R., Key, M.E., Kalra, K.L. (1991). Antigen retrieval in formalin-fixed,
paraffin-embedded tissues: an enhancement method for immunohistochemical staining based on microwave oven heating of tissue sections. J Histochem Cytochem, 39(6), 741-748. DOI: 10.1177/39.6.1709656.
Shi, S., Liu, C., Balgley, B.M., Lee, C., Taylor, C.R. (2006). Protein extraction from
formalin-fixed, paraffin-embedded tissue sections: quality evaluation by mass spectrometry. J Histochem Cytochem, 54, 739 – 743.
Shteynberg, D., Nesvizhskii, A.I., Moritz, R.L., Deutsch, E.W. (2013). Combining
results of multiple search engines in proteomics. Molecular & Cellular Proteomics, 12, 2383–2393.
Speers, A.E., Wu, C.C. (2007). Proteomics of integral membrane proteins – theory
and application, Chem. Rev., 107, 3687–3714. Sprung, R. W., Brock, J. W. C., Tanksley, J. P., Li, M. et al. (2009). Equivalence of
protein inventories obtained from formalin-fixed paraffin-embedded and
http://etd.uwc.ac.za/
References
135
frozen tissue in multidimensional liquid chromatography-tandem mass spectrometry shotgun proteomic analysis. Mol. Cell. Proteomics, 8, 1988–1998.
Tabb, D.L., Fernando, C.G., Chambers, M.C. (2007). MyriMatch: highly accurate
tandem mass spectral peptide identification by multivariate hypergeometric analysis, J. Proteome Res., 6(2), 654–661.
Tanca A, Pagnozzi D, Falchi G, Biosa G, Rocca S, Foddai G, Uzzau S, Addis MF.
(2011). Impact of fixation time on GeLC-MS/MS proteomic profiling of formalinfixed, paraffin-embedded tissues. J Proteomics 2011, 74:1015–1021.
Tanca, A., Abbondio, M., Pisanu, S., Pagnozzi, D., Uzzau, S., Addis, M.F. (2014).
Critical comparison of sample preparation strategies for shotgun proteomic analysis of formalin-fixed, paraffin-embedded samples: insights from liver tissue. Clinical Proteomics, 11(28), 1–11.
Taus, T., Kocher, T., Pichler, P., Paschke, C., Schmidt, A., Henrich, C., Mechtler, K.
(2011). Universal and confident phosphorylation site localization using phosphoRS. J. Proteome Res., 10(12), 5354–5362.
Taylor, C.F., Paton, N.W., Lilley, K.S., Binz, P-A., Julian, R.K., Jones, A.R. …
Hermjakob, H. (2007). The minimum information about a proteomics
experiment (MIAPE). Nature Biotechnology, 25(8), 887 – 893.
ThermoFisher Scientific Detergent removal columns, retrieved on 25 April 2017:
https://www.thermofisher.com/order/catalog/product/87777 Thompson, S.M., Craven, R.A., Nirmalan, N.J., Harnden, P., Selby, P.J., Banks, R.E.
(2013). Impact of pre-analytical factors on the proteomic analysis of formalin-fixed paraffin-embedded tissue. Proteomics Clin. Appl, 7, 241–251.
Toiyama, Y., Inoue, Y., Yasuda, H., Saigusa, S., Yokoe, T., Okugawa, Y., Tanaka,
K., Miki, C., Kusunoki, M. (2011). DPEP1, expressed in the early stages of colon carcinogenesis, affects cancer cell invasiveness. J. Gastroenterol., 46, 153–63.
Vaudel, M., Barsnes, H., Berven, F.S., Sickmann, A., Martens, L. (2011). SearchGUI:
An open-source graphical user interface for simultaneous OMSSA and X!Tandem searches, Proteomics, 11, 996–999.
Vaudel, M., Breiter, D., Beck, F., Rahnenfuhrer, J. et al., (2013). Dscore: a search
engine independent MD-score. Proteomics, 13(6), 1036–1041. Vaudel, M., Venne, A.S., Berven, F.S., Zahedi, R.P., Martens, L., Barsnes, H. (2014).
Shedding light on black boxes in protein identification. Proteomics, 14, 1001–1005. DOI: 10.1002/pmic.201300488
Vaudel, M., Burkhart, J.M., Zahedi, R.P., Oveland, E., Berven, F.S., Sickmann, A.,
Martens, L., Barsnes, H. (2015). PeptideShaker enables reanalysis of MS-derived proteomics data sets. Nature Biotechnology, 33(1), 22 - 24.
Vaudel, M. (2017). MS2-based quantitation. In Bessant, C. (ed.), New developments
in mass spectrometry no. 5: Proteome informatics (pp. 155 – 177). Cambridge: The Royal Society of Chemistry.
http://etd.uwc.ac.za/
References
136
Vehus, T., Roberg-Larsen, H., Waaler, J., Aslaksen, S., Krauss, S., Wilson, S.R., Lundanes, E. (2016).Versatile, sensitive liquid chromatography mass spectrometry – Implementation of 10 μm OT columns suitable for small molecules, peptides and proteins. Nature Scientific Reports, 6, 37507, DOI: 10.1038/srep37507.
Vie, N., Copois, V., Bascoul-Mollevi, C., Denis, V., Bec, N., Robert, B., Fraslon, C.,
Conseiller, E., Molina, F., Larroque, C., Martineau, P., Del Rio, M., Gongora,
C. (2008). Overexpression of phosphoserine aminotransferase PSAT1
stimulates cell growth and increases chemoresistance of colon cancer cells.
Mol. Cancer, 7, 14.
Villar, E.L., Cho, W.C. (2013). Proteomics and cancer research. In Wang, X. (ed.),
Translational Bioinformatics, Vol. 3: Bioinformatics of human proteomics
(pp. 75 - 100). Dordrecht: Springer Science+Business Media. DOI:
10.1007/978-94-007-5811-7_4 Vizcaíno, J.A., Perkins, S., Jones, A.R., Deutsch, E.W. (2017). Data formats of the
Proteomics Standards Initiative. In Bessant, C. (ed.), New developments in mass spectrometry no. 5: Proteome informatics (pp. 231 – 258). Cambridge: The Royal Society of Chemistry.
Wiśniewski, J.R., Zougman, A., Nagaraj, N., Mann, M. (2009). Universal sample
preparation method for proteome analysis. Nature Methods, 6(5), 359–362. Wiśniewski, J.R., Ostasiewicz, P., Mann, M. (2011). High recovery FASP applied to
the proteomic analysis of microdissected formalin fixed paraffin embedded cancer tissues retrieves known colon cancer markers. J. Proteome Res., 10, 3040–3049. DOI:10.1021/pr200019m
Wiśniewski, J.R., Duś, K., Mann, M. (2012). Proteomic workflow for analysis of
archival formalin-fixed and paraffin-embedded clinical samples to a depth of 10 000 proteins. Proteomics Clin. Appl., 7, 1–9. DOI:10.1002/prca.201200046
Wiśniewski, J.R. (2013). Proteomic sample preparation from formalin fixed and
paraffin embedded tissue. J Vis Exp, 79, e50589, 1–6. Wiśniewski, J.R., Duś, K., Mann, M. (2013). Proteomic workflow for analysis of
archival formalin-fixed and paraffin-embedded clinical samples to a depth of 10 000 proteins. Proteomics Clin Appl, 7, 225–233.
Wiśniewski, J.R., Duś-Szachniewicz, K., Ostasiewicz, P., Ziόłkowski, P., Rakus, D.,
Mann, M. (2015). Absolute proteome analysis of colorectal mucosa, adenoma, and cancer reveals drastic changes in fatty acid metabolism and plasma membrane transporters. J. Proteome Res., 14, 4005−4018. DOI: 10.1021/acs.jproteome.5b00523
Wolff, C., Schott, C., Porschewski, P., Reischauer, B., Becker, K-F. (2011)
Successful protein extraction from over-fixed and long-term stored formalin-
fixed tissues. PLoS ONE, 6(1), e16353. DOI:10.1371/journal.pone.0016353
Wright, J.C., & Choudhary, J.S (2017). PSM scoring and validation . In Bessant, C.
(ed.), New developments in mass spectrometry no. 5: Proteome informatics
(pp. 69 – 92). Cambridge: The Royal Society of Chemistry.
http://etd.uwc.ac.za/
References
137
Wu, S., Zhu, Y. (2012). ProPAS: standalone software to analyze protein properties. Bioinformation, 8(3), 167–169.
Yamagishi, H., Kuroda, H., Imai, Y., Hiraishi, H. (2016). Molecular pathogenesis of
sporadic colorectal cancers. Chin J Cancer, 35(4), 1-8. DOI: 10.1186/s40880-015-0066-y.
Yao, X., Zhao, G., Yang, H., Hong, X., Bie, L., Liu, G. (2010). Overexpression of
high-mobility group box 1 correlates with tumor progression and poor prognosis in human colorectal carcinoma. J. Cancer Res. Clin. Oncol., 136(5), 677–84.
Yung, B.Y. (2007). Oncogenic role of nucleophosmin/B23. Chang Gung Med. J.,
30(4), 285–93. Zhang, L., Carlage, T., Murphy, D., Frenkel, R., Bryngelson, P., Madsen, M.,
Lyubarskaya, Y. (2012). Residual metals cause variability in methionine oxidation measurements in protein pharmaceuticals using LC-UV/MS peptide mapping. J. Chromatogr. B, 895−896, 71−76.
Zhang, Y., Fonslow, B.R., Shan, B., Baek, M-C, Yates, J.R. (2013). Protein analysis
by shotgun/bottom-up proteomics. Chem. Rev., 113(4), 2343–2394. DOI:10.1021/cr3003533.
Zhang, Y., Muller, M., Xu, B., Yoshida, Y., Horlacher, O., Nikitin, F., Garessus, S.,
Magdeldin, S., Kinoshita, N., Fujinaka, H., Yaoita, E., Hasegawa, M., Lisacek, F., Yamamoto, T. (2015). Unrestricted modification search reveals lysine methylation as major modification induced by tissue formalin fixation and paraffin embedding. Proteomics, 15, 2568–2579.
Zhao, C., O’Connor, P.B. (2007). Removal of polyethylene glycols from protein
samples using titanium dioxide. Anal Biochem, 365(2), 283–285. Zheng, H., Tsuneyama, K., Cheng, C., Takahashi, H., Cui, Z., Murai, Y., Nomoto, K.,
Takano, Y. (2007). Maspin expression was involved in colorectal adenoma-adenocarcinoma sequence and liver metastasis of tumors. Anticancer Res., 27(1A), 259–65.
http://etd.uwc.ac.za/
Appendix A: Search algorithms specific settings
138
Appendix A: Search algorithms specific settings
Project Details
1: PeptideShaker Version: 1.16.40
2: Date:
3: Experiment:
4: Sample:
5: Replicate Number: 1
6: Identification Algorithms: X!Tandem, MS Amanda and MS-GF+
Database Search Parameters
1: Precursor Tolerance Unit: ppm
2: Precursor Ion m/z Tolerance: 10.0
3: Fragment Ion Tolerance Unit: Da
4: Fragment Ion m/z Tolerance: 0.02
5: Cleavage: Enzyme
6: Enzyme: Trypsin
7: Missed Cleavages: 2
8: Specificity: Specific
9: Database: uniprot-human-reviewed-trypsin-may-
2018_concatenated_target_decoy.fasta
10: Forward Ion: b
11: Rewind Ion: y
12: Fixed Modifications: Methylthio of C
13: Variable Modifications: Oxidation of M, Deamidation of N, Deamidation of Q
14: Refinement Variable Modifications: Acetylation of protein N-term, Pyrolidone
from E, Pyrolidone from Q, Pyrolidone from carbamidomethylated C
15: Refinement Fixed Modifications: Methylthio of C
Input Filters
1: Minimal Peptide Length: 8
2: Maximal Peptide Length: 30
3: Precursor m/z Tolerance: 10.0
4: Precursor m/z Tolerance Unit: Yes
5: Unrecognized Modifications Discarded: Yes
PTM Scoring Settings
1: Probabilistic Score: PhosphoRS
2: Accounting for Neutral Losses: No
3: Threshold: 95.0
Spectrum Counting Parameters
1: Method: NSAF
http://etd.uwc.ac.za/
Appendix A: Search algorithms specific settings
139
2: Validated Matches Only: No
Annotation Settings
1: Intensity Limit: 0.75
2: Automatic Annotation: Yes
3: Selected Ions: y, b
4: Neutral Losses: H2O, NH3, CH4OS
5: Neutral Losses Sequence Dependence: Yes
6: Fragment Ion m/z Tolerance: 0.02
http://etd.uwc.ac.za/
Appendix B: Supplementary figures
140
Appendix B: Supplementary figures
Table of contents
Page S-Figure Title/Description
2 S1 Comparison of the qualitative reproducibility of the experimental
conditions in terms of peptide identification overlap
3 S2 Correlation of protein abundance between all conditions for each
patient
http://etd.uwc.ac.za/
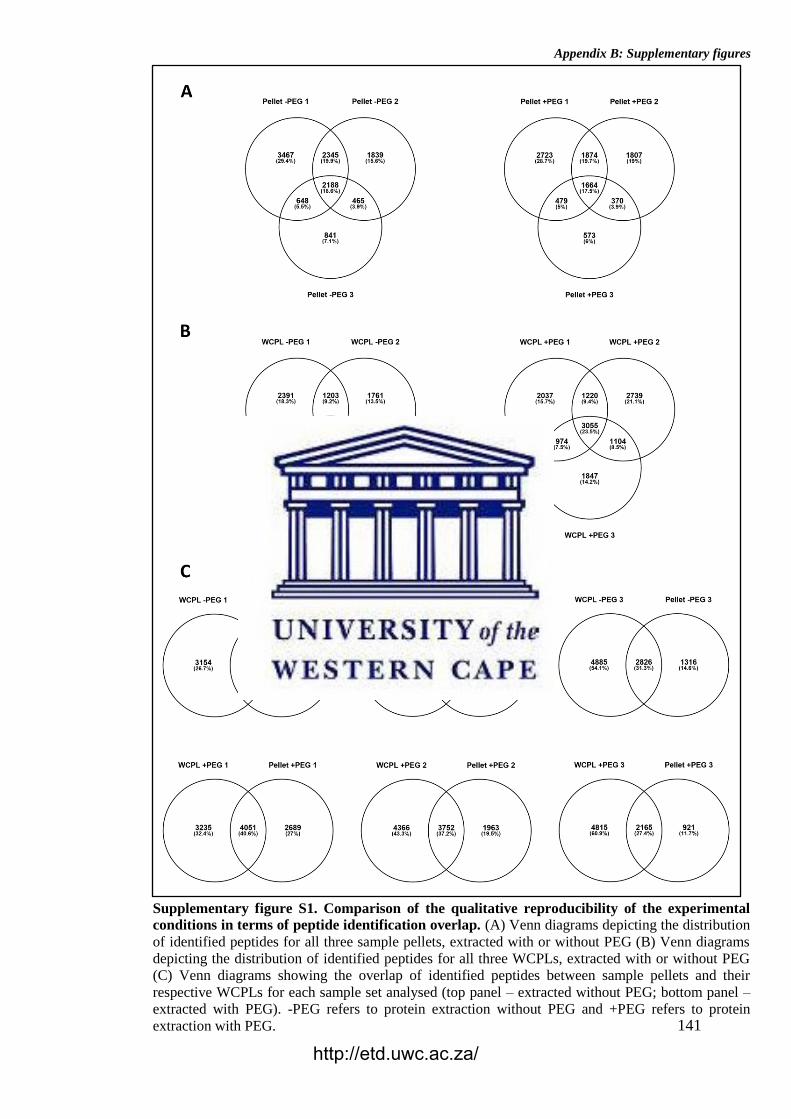
Appendix B: Supplementary figures
141
Supplementary figure S1. Comparison of the qualitative reproducibility of the experimental
conditions in terms of peptide identification overlap. (A) Venn diagrams depicting the distribution
of identified peptides for all three sample pellets, extracted with or without PEG (B) Venn diagrams
depicting the distribution of identified peptides for all three WCPLs, extracted with or without PEG
(C) Venn diagrams showing the overlap of identified peptides between sample pellets and their
respective WCPLs for each sample set analysed (top panel – extracted without PEG; bottom panel –
extracted with PEG). -PEG refers to protein extraction without PEG and +PEG refers to protein
extraction with PEG.
http://etd.uwc.ac.za/
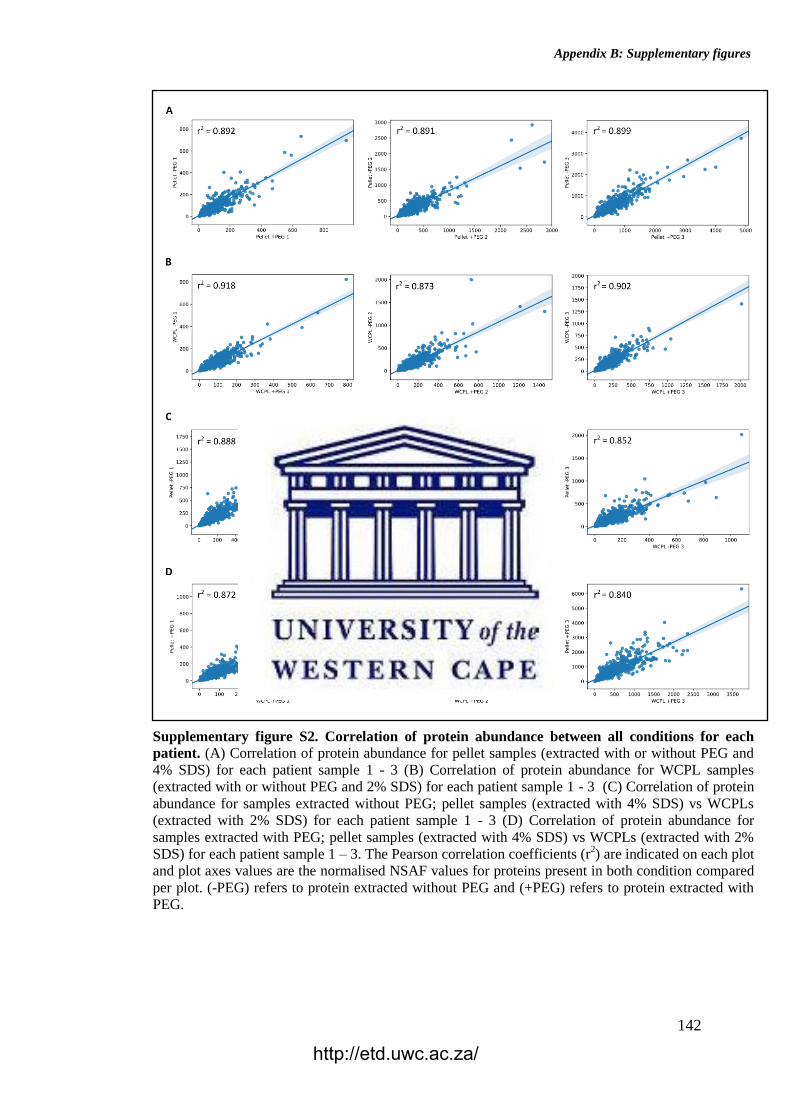
Appendix B: Supplementary figures
142
Supplementary figure S2. Correlation of protein abundance between all conditions for each
patient. (A) Correlation of protein abundance for pellet samples (extracted with or without PEG and
4% SDS) for each patient sample 1 - 3 (B) Correlation of protein abundance for WCPL samples
(extracted with or without PEG and 2% SDS) for each patient sample 1 - 3 (C) Correlation of protein
abundance for samples extracted without PEG; pellet samples (extracted with 4% SDS) vs WCPLs
(extracted with 2% SDS) for each patient sample 1 - 3 (D) Correlation of protein abundance for
samples extracted with PEG; pellet samples (extracted with 4% SDS) vs WCPLs (extracted with 2%
SDS) for each patient sample 1 – 3. The Pearson correlation coefficients (r2) are indicated on each plot
and plot axes values are the normalised NSAF values for proteins present in both condition compared
per plot. (-PEG) refers to protein extracted without PEG and (+PEG) refers to protein extracted with
PEG.
http://etd.uwc.ac.za/
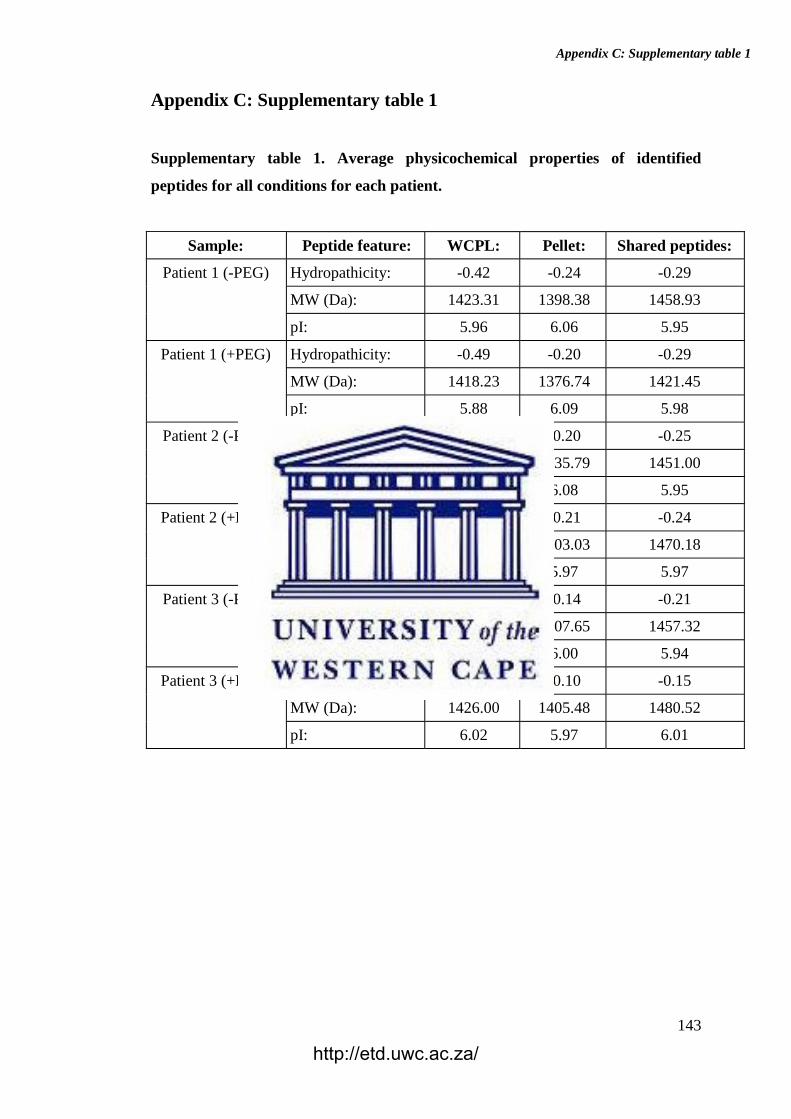
Appendix C: Supplementary table 1
143
Appendix C: Supplementary table 1
Supplementary table 1. Average physicochemical properties of identified
peptides for all conditions for each patient.
Sample: Peptide feature: WCPL: Pellet: Shared peptides:
Patient 1 (-PEG) Hydropathicity: -0.42 -0.24 -0.29
MW (Da): 1423.31 1398.38 1458.93
pI: 5.96 6.06 5.95
Patient 1 (+PEG) Hydropathicity: -0.49 -0.20 -0.29
MW (Da): 1418.23 1376.74 1421.45
pI: 5.88 6.09 5.98
Patient 2 (-PEG) Hydropathicity: -0.40 -0.20 -0.25
MW (Da): 1440.36 1435.79 1451.00
pI: 5.81 6.08 5.95
Patient 2 (+PEG) Hydropathicity: -0.38 -0.21 -0.24
MW (Da): 1437.87 1403.03 1470.18
pI: 5.97 5.97 5.97
Patient 3 (-PEG) Hydropathicity: -0.38 -0.14 -0.21
MW (Da): 1427.47 1407.65 1457.32
pI: 6.02 6.00 5.94
Patient 3 (+PEG) Hydropathicity: -0.35 -0.10 -0.15
MW (Da): 1426.00 1405.48 1480.52
pI: 6.02 5.97 6.01
http://etd.uwc.ac.za/
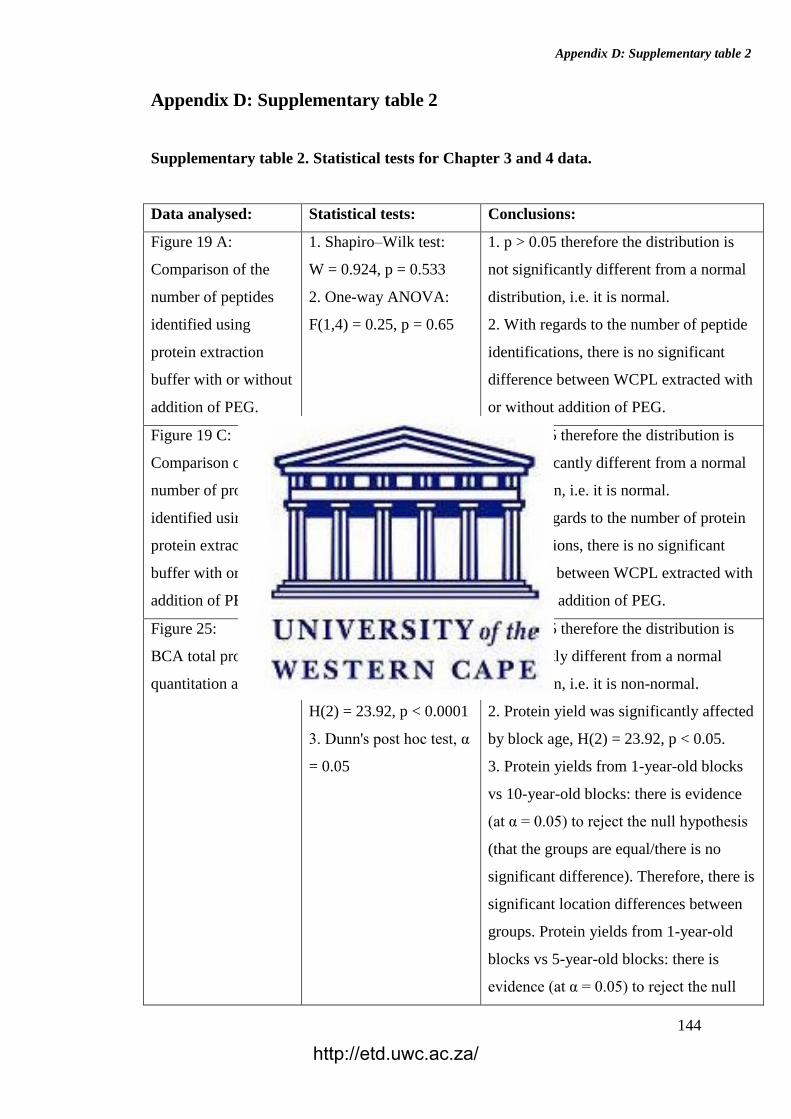
Appendix D: Supplementary table 2
144
Appendix D: Supplementary table 2
Supplementary table 2. Statistical tests for Chapter 3 and 4 data.
Data analysed: Statistical tests: Conclusions:
Figure 19 A:
Comparison of the
number of peptides
identified using
protein extraction
buffer with or without
addition of PEG.
1. Shapiro–Wilk test:
W = 0.924, p = 0.533
2. One-way ANOVA:
F(1,4) = 0.25, p = 0.65
1. p > 0.05 therefore the distribution is
not significantly different from a normal
distribution, i.e. it is normal.
2. With regards to the number of peptide
identifications, there is no significant
difference between WCPL extracted with
or without addition of PEG.
Figure 19 C:
Comparison of the
number of proteins
identified using
protein extraction
buffer with or without
addition of PEG.
1. Shapiro–Wilk test:
W = 0.965, p = 0.854
2. One-way ANOVA:
F(1,4) = 0.04, p = 0.851
1. p > 0.05 therefore the distribution is
not significantly different from a normal
distribution, i.e. it is normal.
2. With regards to the number of protein
identifications, there is no significant
difference between WCPL extracted with
or without addition of PEG.
Figure 25:
BCA total protein
quantitation assay
1. Shapiro–Wilk test:
W = 0.921, p = 0.002
2. Kruskal–Wallis test:
H(2) = 23.92, p < 0.0001
3. Dunn's post hoc test, α
= 0.05
1. p < 0.05 therefore the distribution is
significantly different from a normal
distribution, i.e. it is non-normal.
2. Protein yield was significantly affected
by block age, H(2) = 23.92, p < 0.05.
3. Protein yields from 1-year-old blocks
vs 10-year-old blocks: there is evidence
(at α = 0.05) to reject the null hypothesis
(that the groups are equal/there is no
significant difference). Therefore, there is
significant location differences between
groups. Protein yields from 1-year-old
blocks vs 5-year-old blocks: there is
evidence (at α = 0.05) to reject the null
http://etd.uwc.ac.za/
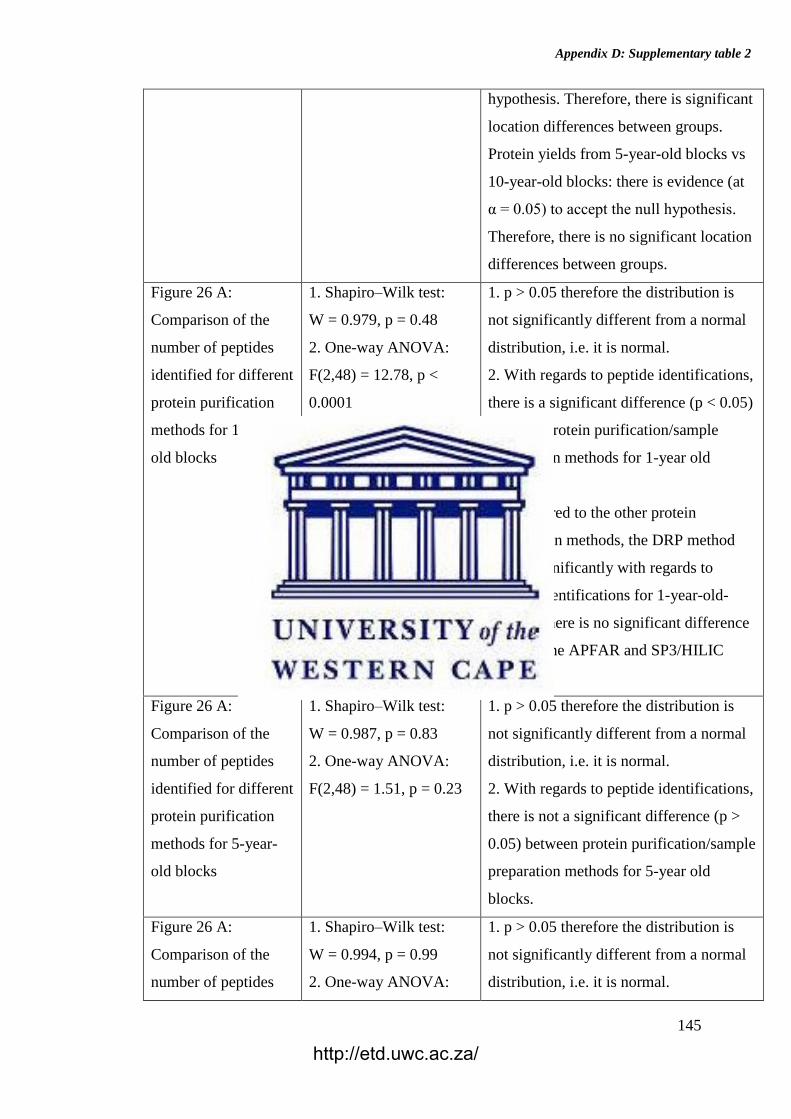
Appendix D: Supplementary table 2
145
hypothesis. Therefore, there is significant
location differences between groups.
Protein yields from 5-year-old blocks vs
10-year-old blocks: there is evidence (at
α = 0.05) to accept the null hypothesis.
Therefore, there is no significant location
differences between groups.
Figure 26 A:
Comparison of the
number of peptides
identified for different
protein purification
methods for 1-year-
old blocks
1. Shapiro–Wilk test:
W = 0.979, p = 0.48
2. One-way ANOVA:
F(2,48) = 12.78, p <
0.0001
3. Bonferroni (Dunn) t
Tests for validated
peptides identified: F(2)
= 12.78, p <0.0001 (α =
0.05)
1. p > 0.05 therefore the distribution is
not significantly different from a normal
distribution, i.e. it is normal.
2. With regards to peptide identifications,
there is a significant difference (p < 0.05)
between protein purification/sample
preparation methods for 1-year old
blocks.
3. Compared to the other protein
purification methods, the DRP method
differs significantly with regards to
peptide identifications for 1-year-old-
blocks. There is no significant difference
between the APFAR and SP3/HILIC
methods.
Figure 26 A:
Comparison of the
number of peptides
identified for different
protein purification
methods for 5-year-
old blocks
1. Shapiro–Wilk test:
W = 0.987, p = 0.83
2. One-way ANOVA:
F(2,48) = 1.51, p = 0.23
1. p > 0.05 therefore the distribution is
not significantly different from a normal
distribution, i.e. it is normal.
2. With regards to peptide identifications,
there is not a significant difference (p >
0.05) between protein purification/sample
preparation methods for 5-year old
blocks.
Figure 26 A:
Comparison of the
number of peptides
1. Shapiro–Wilk test:
W = 0.994, p = 0.99
2. One-way ANOVA:
1. p > 0.05 therefore the distribution is
not significantly different from a normal
distribution, i.e. it is normal.
http://etd.uwc.ac.za/
Appendix D: Supplementary table 2
146
identified for different
protein purification
methods for 10-year-
old blocks
F(2,48) = 3.78, p = 0.03
3. Bonferroni (Dunn) t
Tests for validated
peptides identified: F(2)
= 3.78, p = 0.0299 (α =
0.05)
2. With regards to peptide identifications,
there is a significant difference (p < 0.05)
between protein purification/sample
preparation methods for 10-year old
blocks.
3. The DRP and APFAR methods differ
significantly with regards to peptide
identifications for 10-year-old-blocks.
There is no significant difference
between the APFAR and SP3/HILIC and
the DRP and SP3/HILIC methods.
Figure 26 A:
Comparison of the
number of peptides
identified for different
block ages for the
APFAR method
1. Shapiro–Wilk test:
W = 0.982, p = 0.65
2. One-way ANOVA:
F(2,48) = 0.88, p = 0.42
1. p > 0.05 therefore the distribution is
not significantly different from a normal
distribution, i.e. it is normal.
2. With regards to peptide identifications,
there is not a significant difference (p >
0.05) between block ages when processed
with the APFAR method.
Figure 26 A:
Comparison of the
number of peptides
identified for different
block ages for the
DRP method
1. Shapiro–Wilk test:
W = 0.988, p = 0.90
2. One-way ANOVA:
F(2,48) = 4.81, p = 0.01
3. Bonferroni (Dunn) t
Tests for validated
peptides identified: F(2)
= 4.81, p = 0.0125 (α =
0.05)
1. p > 0.05 therefore the distribution is
not significantly different from a normal
distribution, i.e. it is normal.
2. With regards to peptide identifications,
there is a significant difference (p < 0.05)
between block ages when processed with
the DRP method.
3. With regards to peptide identifications,
there is a significant difference (p < 0.05)
between 1-year-old blocks and 5-year-old
blocks, as well as 1-year-old blocks and
10-year-old blocks processed via the
DRP method. There is no significant
difference between 5 and 10-year-old
blocks.
http://etd.uwc.ac.za/
Appendix D: Supplementary table 2
147
Figure 26 A:
Comparison of the
number of peptides
identified for different
block ages for the
HILIC method
1. Shapiro–Wilk test:
W = 0.970, p = 0.22
2. One-way ANOVA:
F(2,48) = 0.03, p = 0.97
1. p > 0.05 therefore the distribution is
not significantly different from a normal
distribution, i.e. it is normal.
2. With regards to peptide identifications,
there is not a significant difference (p >
0.05) between block ages when processed
with the HILIC method.
Figure 26 B:
Comparison of the
number of proteins
identified for different
protein purification
methods for 1-year-
old blocks
1. Shapiro–Wilk test:
W = 0.924, p = 0.003
2. Kruskal–Wallis test:
H(2) = 16.70, p = 0.0002
3. Dunn's post hoc test, α
= 0.05
1. p < 0.05 therefore the distribution is
significantly different from a normal
distribution, i.e. it is non-normal.
2. With regards to protein identifications,
there is a significant difference (p < 0.05)
between protein purification/sample
preparation methods for 1-year old
blocks.
3. For 1-year old blocks, protein
identifications from DRP vs APFAR
processing: there is evidence (at α = 0.05)
to reject the null hypothesis (that the
groups are equal/there is no significant
difference). Therefore, there is significant
location differences between these
groups. For DRP vs HILIC and APFAR
vs HILIC: there is evidence (at α = 0.05)
to accept the null hypothesis. Therefore,
there is no significant location differences
between these groups.
Figure 26 B:
Comparison of the
number of proteins
identified for different
protein purification
methods for 5-year-
1. Shapiro–Wilk test:
W = 0.950, p = 0.03
2. Kruskal–Wallis test:
H(2) = 3.58, p = 0.17
1. p < 0.05 therefore the distribution is
significantly different from a normal
distribution, i.e. it is non-normal.
2. With regards to protein identifications,
there is not a significant difference (p >
0.05) between protein purification/sample
http://etd.uwc.ac.za/
Appendix D: Supplementary table 2
148
old blocks preparation methods for 5-year old
blocks.
Figure 26 B:
Comparison of the
number of proteins
identified for different
protein purification
methods for 10-year-
old blocks
1. Shapiro–Wilk test:
W = 0.991, p = 0.97
2. One-way ANOVA:
F(2,48) = 2.44, p = 0.098
1. p > 0.05 therefore the distribution is
not significantly different from a normal
distribution, i.e. it is normal.
2. With regards to protein identifications,
there is not a significant difference (p >
0.05) between protein purification/sample
preparation methods for 10-year old
blocks.
Figure 26 B:
Comparison of the
number of proteins
identified for different
block ages for the
APFAR method
1. Shapiro–Wilk test:
W = 0.951, p = 0.03
2. Kruskal–Wallis test:
H(2) = 2.28, p = 0.32
1. p < 0.05 therefore the distribution is
significantly different from a normal
distribution, i.e. it is non-normal.
2. With regards to protein identifications,
there is not a significant difference (p >
0.05) between block ages when processed
with the APFAR method.
Figure 26 B:
Comparison of the
number of proteins
identified for different
block ages for the
DRP method
1. Shapiro–Wilk test:
W = 0.983, p = 0.69
2. One-way ANOVA:
F(2,48) = 2.53, p = 0.09
1. p > 0.05 therefore the distribution is
not significantly different from a normal
distribution, i.e. it is normal.
2. With regards to protein identifications,
there is no significant difference (p >
0.05) between block ages when processed
with the DRP method.
Figure 26 B:
Comparison of the
number of proteins
identified for different
block ages for the
HILIC method
1. Shapiro–Wilk test:
W = 0.894, p = 0.0003
2. Kruskal–Wallis test:
H(2) = 0.101, p = 0.95
1. p < 0.05 therefore the distribution is
significantly different from a normal
distribution, i.e. it is non-normal.
2. With regards to protein identifications,
there is not a significant difference (p >
0.05) between block ages when processed
with the HILIC method.
Figure 28 A:
Comparison of the
1. Kolmogorov-Smirnov
test: D = 0.013, p < 0.01
1. p < 0.05 therefore the distribution is
significantly different from a normal
http://etd.uwc.ac.za/
Appendix D: Supplementary table 2
149
hydropathicity of
identified peptides for
different protein
purification methods
for 1-year-old blocks
2. Kruskal–Wallis test:
H(2) = 124.67, p <
0.0001
distribution, i.e. it is non-normal.
2. There is a significant difference (p <
0.05) between the hydropathicity of
peptides generated via the different
protein purification/sample preparation
methods for 1-year old blocks.
Figure 28 A:
Comparison of the
hydropathicity of
identified peptides for
different protein
purification methods
for 5-year-old blocks
1. Kolmogorov-Smirnov
test: D = 0.012, p < 0.01
2. Kruskal–Wallis test:
H(2) = 78.92, p < 0.0001
1. p < 0.05 therefore the distribution is
significantly different from a normal
distribution, i.e. it is non-normal.
2. There is a significant difference (p <
0.05) between the hydropathicity of
peptides generated via the different
protein purification/sample preparation
methods for 5-year old blocks.
Figure 28 A:
Comparison of the
hydropathicity of
identified peptides for
different protein
purification methods
for 10-year-old blocks
1. Kolmogorov-Smirnov
test: D = 0.012, p < 0.01
2. Kruskal–Wallis test:
H(2) = 67.39, p < 0.0001
1. p < 0.05 therefore the distribution is
significantly different from a normal
distribution, i.e. it is non-normal.
2. There is a significant difference (p <
0.05) between the hydropathicity of
peptides generated via the different
protein purification/sample preparation
methods for 10-year old blocks.
Figure 28 A:
Comparison of the
hydropathicity of
identified peptides for
different block ages
for the APFAR
method
1. Kolmogorov-Smirnov
test: D = 0.013, p < 0.01
2. Kruskal–Wallis test:
H(2) = 30.61, p < 0.0001
1. p < 0.05 therefore the distribution is
significantly different from a normal
distribution, i.e. it is non-normal.
2. There is a significant difference (p <
0.05) between the hydropathicity of
peptides generated from 1, 5 and 10-year
old blocks when using the APFAR
method.
Figure 28 A:
Comparison of the
hydropathicity of
1. Kolmogorov-Smirnov
test: D = 0.013, p < 0.01
2. Kruskal–Wallis test:
1. p < 0.05 therefore the distribution is
significantly different from a normal
distribution, i.e. it is non-normal.
http://etd.uwc.ac.za/
Appendix D: Supplementary table 2
150
identified peptides for
different block ages
for the DRP method
H(2) = 55.79, p < 0.0001 2. There is a significant difference (p <
0.05) between the hydropathicity of
peptides generated from 1, 5 and 10-year
old blocks when using the DRP method.
Figure 28 A:
Comparison of the
hydropathicity of
identified peptides for
different block ages
for the HILIC method
1. Kolmogorov-Smirnov
test: D = 0.013, p < 0.01
2. Kruskal–Wallis test:
H(2) = 39.49, p < 0.0001
1. p < 0.05 therefore the distribution is
significantly different from a normal
distribution, i.e. it is non-normal.
2. There is a significant difference (p <
0.05) between the hydropathicity of
peptides generated from 1, 5 and 10-year
old blocks when using the HILIC
method.
Figure 28 B:
Comparison of the
molecular weights of
identified peptides for
different protein
purification methods
for 1-year-old blocks
1. Kolmogorov-Smirnov
test: D = 0.085, p < 0.01
2. Kruskal–Wallis test:
H(2) = 94.28, p < 0.0001
1. p < 0.05 therefore the distribution is
significantly different from a normal
distribution, i.e. it is non-normal.
2. There is a significant difference (p <
0.05) between the molecular weights of
peptides generated via the different
protein purification/sample preparation
methods for 1-year old blocks.
Figure 28 B:
Comparison of the
molecular weights of
identified peptides for
different protein
purification methods
for 5-year-old blocks
1. Kolmogorov-Smirnov
test: D = 0.085, p < 0.01
2. Kruskal–Wallis test:
H(2) = 138.67, p <
0.0001
1. p < 0.05 therefore the distribution is
significantly different from a normal
distribution, i.e. it is non-normal.
2. There is a significant difference (p <
0.05) between the molecular weights of
peptides generated via the different
protein purification/sample preparation
methods for 5-year old blocks.
Figure 28 B:
Comparison of the
molecular weights of
identified peptides for
different protein
1. Kolmogorov-Smirnov
test: D = 0.086, p < 0.01
2. Kruskal–Wallis test:
H(2) = 488.53, p <
0.0001
1. p < 0.05 therefore the distribution is
significantly different from a normal
distribution, i.e. it is non-normal.
2. There is a significant difference (p <
0.05) between the molecular weights of
http://etd.uwc.ac.za/
Appendix D: Supplementary table 2
151
purification methods
for 10-year-old blocks
peptides generated via the different
protein purification/sample preparation
methods for 10-year old blocks.
Figure 28 B:
Comparison of the
molecular weights of
identified peptides for
different block ages
for the APFAR
method
1. Kolmogorov-Smirnov
test: D = 0.089, p < 0.01
2. Kruskal–Wallis test:
H(2) = 208.75, p <
0.0001
1. p < 0.05 therefore the distribution is
significantly different from a normal
distribution, i.e. it is non-normal.
2. There is a significant difference (p <
0.05) between the molecular weights of
peptides generated from 1, 5 and 10-year
old blocks when using the APFAR
method.
Figure 28 B:
Comparison of the
molecular weights of
identified peptides for
different block ages
for the DRP method
1. Kolmogorov-Smirnov
test: D = 0.084, p < 0.01
2. Kruskal–Wallis test:
H(2) = 2.71, p = 0.26
1. p < 0.05 therefore the distribution is
significantly different from a normal
distribution, i.e. it is non-normal.
2. There is no significant difference (p <
0.05) between the molecular weights of
peptides generated from 1, 5 and 10-year
old blocks when using the DRP method.
Figure 28 B:
Comparison of the
molecular weights of
identified peptides for
different block ages
for the HILIC method
1. Kolmogorov-Smirnov
test: D = 0.085, p < 0.01
2. Kruskal–Wallis test:
H(2) = 9.57, p = 0.0084
1. p < 0.05 therefore the distribution is
significantly different from a normal
distribution, i.e. it is non-normal.
2. There is a significant difference (p <
0.05) between the molecular weights of
peptides generated from 1, 5 and 10-year
old blocks when using the HILIC
method.
Figure 28 C:
Comparison of the
isoelectric points of
identified peptides for
different protein
purification methods
for 1-year-old blocks
1. Kolmogorov-Smirnov
test: D = 0.17, p < 0.01
2. Kruskal–Wallis test:
H(2) = 338.16, p <
0.0001
1. p < 0.05 therefore the distribution is
significantly different from a normal
distribution, i.e. it is non-normal.
2. There is a significant difference (p <
0.05) between the isoelectric points of
peptides generated via the different
protein purification/sample preparation
http://etd.uwc.ac.za/
Appendix D: Supplementary table 2
152
methods for 1-year old blocks.
Figure 28 C:
Comparison of the
isoelectric points of
identified peptides for
different protein
purification methods
for 5-year-old blocks
1. Kolmogorov-Smirnov
test: D = 0.17, p < 0.01
2. Kruskal–Wallis test:
H(2) = 774.40, p <
0.0001
1. p < 0.05 therefore the distribution is
significantly different from a normal
distribution, i.e. it is non-normal.
2. There is a significant difference (p <
0.05) between the isoelectric points of
peptides generated via the different
protein purification/sample preparation
methods for 5-year old blocks.
Figure 28 C:
Comparison of the
isoelectric points of
identified peptides for
different protein
purification methods
for 10-year-old blocks
1. Kolmogorov-Smirnov
test: D = 0.17, p < 0.01
2. Kruskal–Wallis test:
H(2) = 374.56, p <
0.0001
1. p < 0.05 therefore the distribution is
significantly different from a normal
distribution, i.e. it is non-normal.
2. There is a significant difference (p <
0.05) between the isoelectric points of
peptides generated via the different
protein purification/sample preparation
methods for 10-year old blocks.
Figure 28 C:
Comparison of the
isoelectric points of
identified peptides for
different block ages
for the APFAR
method
1. Kolmogorov-Smirnov
test: D = 0.17, p < 0.01
2. Kruskal–Wallis test:
H(2) = 81.01, p < 0.0001
1. p < 0.05 therefore the distribution is
significantly different from a normal
distribution, i.e. it is non-normal.
2. There is a significant difference (p <
0.05) between the isoelectric points of
peptides generated from 1, 5 and 10-year
old blocks when using the APFAR
method.
Figure 28 C:
Comparison of the
isoelectric points of
identified peptides for
different block ages
for the DRP method
1. Kolmogorov-Smirnov
test: D = 0.17, p < 0.01
2. Kruskal–Wallis test:
H(2) = 19.10, p < 0.0001
1. p < 0.05 therefore the distribution is
significantly different from a normal
distribution, i.e. it is non-normal.
2. There is a significant difference (p <
0.05) between the isoelectric points of
peptides generated from 1, 5 and 10-year
old blocks when using the DRP method.
Figure 28 C: 1. Kolmogorov-Smirnov 1. p < 0.05 therefore the distribution is
http://etd.uwc.ac.za/
Appendix D: Supplementary table 2
153
Comparison of the
isoelectric points of
identified peptides for
different block ages
for the HILIC method
test: D = 0.17, p < 0.01
2. Kruskal–Wallis test:
H(2) = 40.55, p < 0.0001
significantly different from a normal
distribution, i.e. it is non-normal.
2. There is a significant difference (p <
0.05) between the isoelectric points of
peptides generated from 1, 5 and 10-year
old blocks when using the HILIC
method.
Figure 34 Percentage
of peptides containing
oxidised methionine
for APFAR processed
samples
1. Shapiro–Wilk test:
W = 0.920, p = 0.002
2. Kruskal–Wallis test:
H(2) = 1.23, p = 0.54
1. p < 0.05 therefore the distribution is
significantly different from a normal
distribution, i.e. it is non-normal.
2. There are no significant differences (p
> 0.05) in levels of oxidised peptides
between the different block ages
processed via the APFAR method.
Figure 34 Percentage
of peptides containing
oxidised methionine
for DRP processed
samples
1. Shapiro–Wilk test:
W = 0.944, p = 0.019
2. Kruskal–Wallis test:
H(2) = 0.86, p = 0.65
1. p < 0.05 therefore the distribution is
significantly different from a normal
distribution, i.e. it is non-normal.
2. There are no significant differences (p
> 0.05) in levels of oxidised peptides
between the different block ages
processed via the DRP method.
Figure 34 Percentage
of peptides containing
oxidised methionine
for HILIC processed
samples
1. Shapiro–Wilk test:
W = 0.860, p = < 0.0001
2. Kruskal–Wallis test:
H(2) = 3.38, p = 0.18
1. p < 0.05 therefore the distribution is
significantly different from a normal
distribution, i.e. it is non-normal.
2. There are no significant differences (p
> 0.05) in levels of oxidised peptides
between the different block ages
processed via the HILIC method.
http://etd.uwc.ac.za/