Phosphorylation potential and chemical fluxes govern ... - arXiv

Journal of Molecular and Cellular Cardiology 41 (2006) 330–339www.elsevier.com/locate/yjmcc
Original article
The effect of myosin regulatory light chain phosphorylation on thefrequency-dependent regulation of cardiac function
Fernando A.L. Dias a,d, Lori A. Walker a,b, Grace M. Arteaga b,c, John S. Walker b,Kalpana Vijayan a, James R. Peña a, Yunbo Ke b, Rosalvo T.H. Fogaca d,
Atsushi Sanbe e, Jeffrey Robbins e, Beata M. Wolska a,b,⁎
a Center for Cardiovascular Research, Department of Medicine, Section of Cardiology, University of Illinois at Chicago, Chicago, IL, USAb Department of Physiology and Biophysics, University of Illinois at Chicago, Chicago, IL, USA
c Department of Pediatrics, University of Illinois at Chicago, Chicago, IL, USAd Department of Physiology and Department of Cell Biology, Federal University of Paraná, Curitiba, Brazil
e Department of Pediatrics, Division of Molecular Cardiovascular Biology, Cincinnati Children's Hospital, Cincinnati, OH, USA
Received 30 November 2005; received in revised form 11 May 2006; accepted 16 May 2006
Abstract
Although it has been suggested that in cardiac muscle the phosphorylation level of myosin regulatory light chain (RLC) correlates withfrequency of stimulation, its significance in the modulation of the force–frequency and pressure–frequency relationships remains unclear. Weexamined the role of RLC phosphorylation on the force–frequency relation (papillary muscles), the pressure–frequency relation (Langendorffperfused hearts) and shortening–frequency relation (isolated cardiac myocytes) in nontransgenic (NTG) and transgenic mouse hearts expressing anonphosphorylatable RLC protein (RLC(P−)). At 22 °C, NTG and RLC(P−) muscles showed a negative force–frequency relation. At 32 °C, atfrequencies above 1 Hz, both groups showed a flat force–frequency relation. There was a small increase in RLC phosphorylation in NTG muscleswhen the frequency of stimulation was increased from 0.2 Hz to 4.0 Hz. However, the level of RLC phosphorylation in these isolated muscles wassignificantly lower compared to samples taken from NTG intact hearts. In perfused hearts, there was no difference in the slope of pressure–frequency relationship between groups, but the RLC(P−) group consistently developed a reduced systolic pressure and demonstrated a decreasedcontractility. There was no difference in the level of RLC phosphorylation in hearts paced at 300 and 600 bpm. In RLC(P−) hearts, the level of TnIphosphorylation was reduced compared to NTG. There was no change in the expression of PLB between groups, but expression of SERCA2 wasincreased in hearts from RLC(P−) compared to NTG. In isolated cardiac myocytes, there was no change in shortening–frequency relationshipbetween groups. Moreover, there was no change in Ca2+ transient parameters in cells from NTG and RLC(P−) hearts. Our data demonstrate that incardiac muscle RLC phosphorylation is not an essential determinant of force– and pressure–frequency relations but the absence of RLCphosphorylation decreases contractility in force/pressure developing preparations.© 2006 Elsevier Inc. All rights reserved.
Keywords: Regulatory light chain; Force–frequency relation; Mouse heart; Transgenic mice; Phosphorylation
1. Introduction
In cardiac muscle, the force and dynamics of bothcontraction and relaxation depend on the frequency at whichthe heart beats. Regulation of frequency therefore plays an
⁎ Corresponding author. University of Illinois at Chicago, Department ofMedicine, Section of Cardiology (M/C 715), 840 S. Wood St., Chicago, IL60612, USA. Tel.: +1 312 413 0240; fax: +1 312 996 5062.
E-mail address: [email protected] (B.M. Wolska).
0022-2828/$ - see front matter © 2006 Elsevier Inc. All rights reserved.doi:10.1016/j.yjmcc.2006.05.012
important role in modulating heart function. Most species suchas rabbit, guinea pig or human show a positive force–frequencyrelationship (staircase) [1–3]. Some species, such as rat ormouse, can show either a positive or negative force–frequencyrelationship [1,4–6]. The negative force–frequency relationshipis also observed in human heart failure [7].
There is general agreement that the staircase characterdepends on the amount of Ca2+ available for contraction. Athigher frequencies, a larger Ca2+ transient produces a morepositive force–frequency relation due to an increase in
331F.A.L. Dias et al. / Journal of Molecular and Cellular Cardiology 41 (2006) 330–339
sarcoplasmic reticulum (SR) Ca2+ content (for review, see [8]).In addition, a positive staircase is attributed to a frequency-dependent facilitation of Ca2+ current and recovery of ryanodinereceptors from inactivation [9].
Interestingly, in preparations with both positive and negativestaircases, an increase in the frequency of stimulation correlateswith an increase in the rate of relaxation. This frequency-dependent acceleration of relaxation (FDAR) is abolished inpreparations in which the SR Ca2+ pump is blocked [10].Experiments using isolated cardiac myocytes and papillarymuscles showed that FDAR is dependent on Ca2+-calmodulinkinase II (CaMKII), which enhanced SR Ca2+ uptake [6,10] andfacilitated Ca2+ current [11].
In addition to influencing Ca2+ fluxes, CaMKII also mayregulate the state of activation of myosin light chain kinase(MLCK), the kinase that phosphorylates the myosin regulatorylight chain (RLC). The role of RLC phosphorylation in theregulation of smooth muscle contraction is well established (forreview, see [12]), but its role in regulating striated cardiacmuscle contraction is poorly understood. Although it has beenshown that, in isolated rabbit hearts [13] phosphorylation levelof RLC correlates with frequency of stimulation, the signifi-cance of phosphorylation of RLC in the modulation of theforce– and pressure–frequency relationships in other speciesremains unclear. In this study, we examined the role of RLCphosphorylation on the force–frequency relation and FDAR inpapillary muscles and the pressure–frequency relation inisolated perfused hearts from nontransgenic (NTG) andtransgenic (TG) mouse hearts expressing a nonphosphoryla-table RLC protein (RLC(P−)) [14]. Our data indicate that inmouse cardiac muscle the RLC phosphorylation is not anessential determinant of force–frequency relation, pressure–frequency relation and FDAR.
2. Methods
2.1. Experimental animals
The investigations were performed in conformity with theGuide for the Care and Use of Laboratory Animals published bythe US National Institute of Health (NIH Publication No. 85-23,revised 1996) and were approved by the Institutional AnimalCare committee of the University of Illinois at Chicago.
Transgenic (TG) mice that express mutated ventricular RLC(RLC(P−)) in the whole heart were generated as previouslydescribed [14]. In mutated RLC, Ser-14, Ser-15 and Ser-19 werereplaced by Ala. Four month-old TG mice (line 21) and theirNTG littermates were used. This line shows complete replace-ment of RLC by the mutated unphosphorylatable RLC(P−) by 3to 4 months [14].
2.2. Tension measurement in mouse isolated papillary muscles
Right ventricular papillary muscles were isolated aspreviously described [15]. After mounting the muscle on thesystem, Ca2+ concentration was increased to 1.0 mM and thepreparation was stimulated via platinum electrodes at the initial
frequency of 0.2 Hz. After the initial equilibration (40–45 min),the length–tension relationship was determined and the musclewas stretched to generate 90% of maximum developed force.Thereafter, the muscle was stimulated at different frequencies(0.2, 0.5, 1.0 and 2.0 Hz at 22 °C and 0.2, 0.5, 1.0, 2.0 and4.0 Hz at 32 °C). The force was recorded using LabVIEWsoftware and the following contractile and relaxation para-meters calculated: developed tension, time to peak ofcontraction (TP) and 50% of the relaxation time (RT50). Thedeveloped force at different frequencies was normalized takingthe developed force at 1.0 Hz as 100%.
2.3. Langendorff heart preparation
Left ventricular function was measured in isolated Langen-dorff perfused hearts as previously described [16]. The heartswere electrically stimulated with increasing frequencies: 300,360, 420, 480, 540 and 600 bpm with voltage set at 50% abovethe threshold level and 1.2 ms of pulse duration. From the leftventricular systolic pressure (LVSP), the left ventriculardeveloped pressure (LVDP), the heart rate and positive andnegative derivatives of pressure were calculated using the Chartfor Windows 5.01 software (AD Instruments, Australia).
2.4. Isolated cardiac myocytes
Cells were isolated using the modified methods as describedby Balasubramaniam et al. [17]. Measurements of cellshortening and Ca2+ transients were performed as we previouslydescribed [18] with the following modifications: 1) cells wereloaded with 7.5 μM fura2/AM for 10 min at room temperature;2) all the recordings were performed at 30 °C with 1.5 mM Ca2+
in the perfusion solution; and 3) the cells were electricallystimulated with increasing frequencies: 0.5, 1.0, 1.5, 2.0, 2.5and 3 Hz.
2.5. Determination of the level of RLC phosphorylation inpapillary muscles and freshly isolated hearts
The level of RLC phosphorylation was determined usinga modified glycerol-PAGE method previously described byFewell et al. [19]. Ventricular tissue and papillary musclesamples were immersed in 10% TCA in TE buffer (10 mM Tris,1 mM EDTA, pH 7.0) and frozen in liquid N2. To determine thelevel of RLC phosphorylation in papillary muscles from NTGmouse hearts, the muscles were dissected and underwent theprotocol (at 32 °C) as previously described. One group ofmuscles was frozen when they were stimulated at 0.2 Hz and asecond group at 4.0 Hz. The samples were thawed in TCA/TEbuffer. DTT (10 mM) was added to this solution and sampleswere homogenized. After homogenization, samples werecentrifuged at 12,000 rpm for 4 min and the supernatantdiscarded. The pellet was washed in ether 4 times and was thenresuspended in sample buffer containing 10 mM DTT, 20 mMTris base (pH 6.8), 9 M urea and 20 mM EDTA and loaded in agel with 12% bis-acrylamide (1:19), 40% glycerol, 20 mM Trisbase (pH 8.6) and 23 mM glycine (pH 8.6). The stacking gel
332 F.A.L. Dias et al. / Journal of Molecular and Cellular Cardiology 41 (2006) 330–339
contained 5% bis-acrylamide (1:19), 16% glycerol, 20 mM Trisbase (pH 6.8) and 3.15 M urea. Gels were run for 2 h at 440 Vafter the samples entered the separating gel. Proteins weretransferred to a 0.22 μm nitrocellulose membrane and themembrane was blocked in 5% nonfat milk in Tris buffered saline(TBS), washed and incubated overnight in a polyclonal antibodyagainst RLC (1:500, Santa Cruz, Sigma Corp.). After washing,the membrane was incubated in a horseradish peroxidase-coupled anti-goat antibody (1:3000) for 40min followed by ECLdetection. Two bands were detected, an upper band representingthe unphosphorylated RLC and a lower band representing thephosphorylated (P-RLC). The amount of P-RLC in the sampleswas determined by densitometry (Personal densitometer,Amershan Biosciences) using the DataQuant software and wasexpressed as a percentage of the total RLC in the sample.
2.6. Determination of the level of RLC phosphorylation inLangendorff perfused hearts and isolated ventricular myocytes
In isolated perfused hearts and isolated ventricular myocytes,phosphorylation of RLCwas determined using two-dimensionalgel electrophoresis. The apexes of hearts, subjected to theprotocol described above or a suspension of isolated cardiacmyocytes, were rapidly fixed in 10% TCA in acetone (−80 °C)and stored for a minimum of 16 h at −80 °C. Thereafter, sampleswere slowly warmed to room temperature (1 h at −20 °C, 1 h at4 °C and 1 h at room temperature), washed 3 times in freshacetone and allowed to dry. Samples were homogenized in 100volumes of homogenization buffer containing: 8 M urea, 2.5 Mthiourea, 4% CHAPS, 0.5% 3–10 ampholytes, 2 mM EDTA,250 mM DTT and a protease inhibitor cocktail. Afterhomogenization, 200 μg of protein was loaded to a tube gelcontaining: 9.2 M urea, 4% acrylamide, 2% Triton X-100, 1.6%4–6.5 ampholytes and 0.4% 3–10 ampholytes. After running thefirst dimension (300 V, overnight), the tube gels were allowed toequilibrate in sample buffer containing 4% SDS and 10% β-mercaptoethanol and loaded on a 13.5% bis/acrylamide seconddimension gel. Gels were then fixed in 50% methanol and 10%TCA overnight, washed with dH2O and incubated for 90 min inPro-Q Diamond Phosphoprotein Gel Stain (Molecular Probes).After destaining for 3 h in 20% acetonitrile, 50 mM sodiumacetate, pH 4.0, the gels were imaged at 488 nM wavelengthusing the Molecular Imager FX system (BioRad). The same gelswere then transferred to Sypro Ruby protein gel stain (MolecularProbes) and incubated overnight for staining of total protein.Gels were destained using 10% methanol, 7% acetic acid. Forprotein quantification, gels were transilluminated with a UVlight in a Gel Doc 1000 system (BioRad). Images werequantified using the ImageJ 1.32j software (NIH). The amountof P-RLC is expressed as a percentage of the total RLC present inthe sample.
2.7. Determination of TnI expression and levels of TnIphosphorylation in Langendorff perfused hearts
Total TnI expression was quantified by Western blotting.Samples were homogenized in RIPA buffer with protease and
phosphatase inhibitors (Upstate), separated on 12% bis-acryl-amide gels, transferred to nitrocellulose membranes andincubated in anti-TnI antibody (1:2000; Research Diagnostics,clone C5). Proteins were visualized with ECL. Recombinantslow skeletal TnI (ssTnI) and samples from transgenic heartsexpressing ssTnI [20] were used as positive control forexpression of that isoform in samples from RLC(P−) hearts.Following TnI visualization, membranes were stripped (Pierce)and reprobed with anti α-actin antibody (1:10,000; Sigma) forcorrections in loading.
Troponin I phosphorylation was analyzed by nonequilibrium 1-dimensional isoelectric focusing as described previously [20,21].The samples were frozen, stored and homogenized in the samewayas described in Section 2.6. Samples were separated on a 4.5%acrylamide slab gel with a nonlinear pH gradient made with a 1:4ratio of pH 3–10 and 7–9 ampholytes. The cathode and anodebuffers were reversed to the lower and upper chambers respectivelyand the polarity of the electrodes was reversed to facilitatemigration and separation of the basic proteins. Proteins wereseparated at 100 V for 20 min, 200 V for 40 min and 500 V for10 min and transferred to nitrocellulose membranes at 30 Vovernight at 4 °C. Membranes were blocked in 2% bovine serumalbumin in phosphate-buffered saline containing 0.1% Tween-20(PBS-T) for 1 h at room temperature, washed in PBS-T andincubated with monoclonal antibody anti-TnI (1:5000, ResearchDiagnostics) for 3 h at room temperature. After washing,membranes were incubated with an anti-mouse antibody conju-gated to horseradish peroxidase (1:10,000) for 1 h at roomtemperature. Finally, membranes were washed and the proteinsvisualized with ECL. Percentage phosphorylation was expressedas [TnI (phosphorylated) / (TnI (dephosphorylated) +TnI(phosphorylated))]×100%.
2.8. Determination of phospholamban (PLB) and SERCA2expression
Hearts were frozen in liquid nitrogen and stored at −80 °C.Samples were homogenized in modified RIPA buffer withprotease and phosphates inhibitors (Upstate). SDS-PAGE wasperformed using 8% (SERCA2) and 15% (PLB) bis-acrylamide(1:29) gels. Proteins were transferred to nitrocellulose mem-branes andmembranes were blockedwith 5% nonfat milk beforeincubating with anti-PLB (1:2000; Upstate) or anti-SERCA2(1:2000; ABR) antibodies. Following incubation with primaryantibody, membranes were incubated in horseradish peroxidase-coupled secondary antibodies (1:10,000; Amersham) followedby ECL detection (Pierce). Membranes were stripped (Pierce)and reprobed using anti α-actin antibody (1:10,000; Sigma) tocorrect for the loading condition. To assess the levels ofexpression of PLB and SERCA2, densitometric analysis(Personal densitometer, Amershan Biosciences) was performedusing the DataQuaNT software.
2.9. Data computation and statistical analysis
All results are presented as mean±SE. Except for dataobtained from Langendorff perfused hearts, the significance of
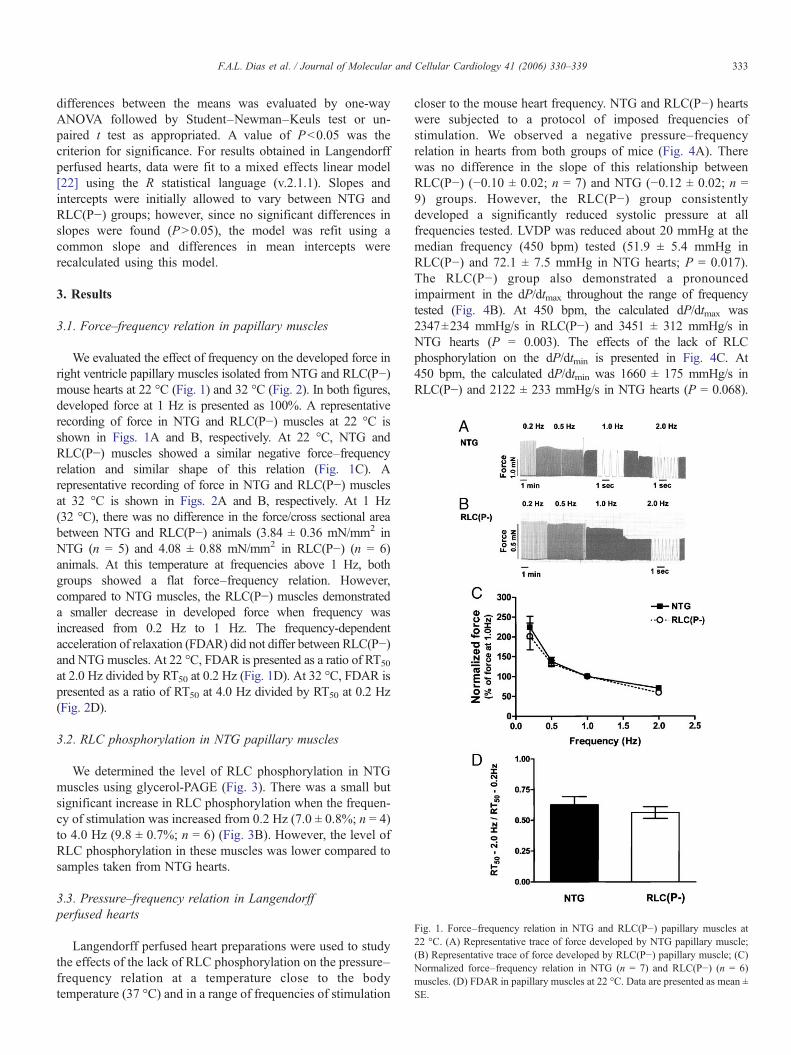
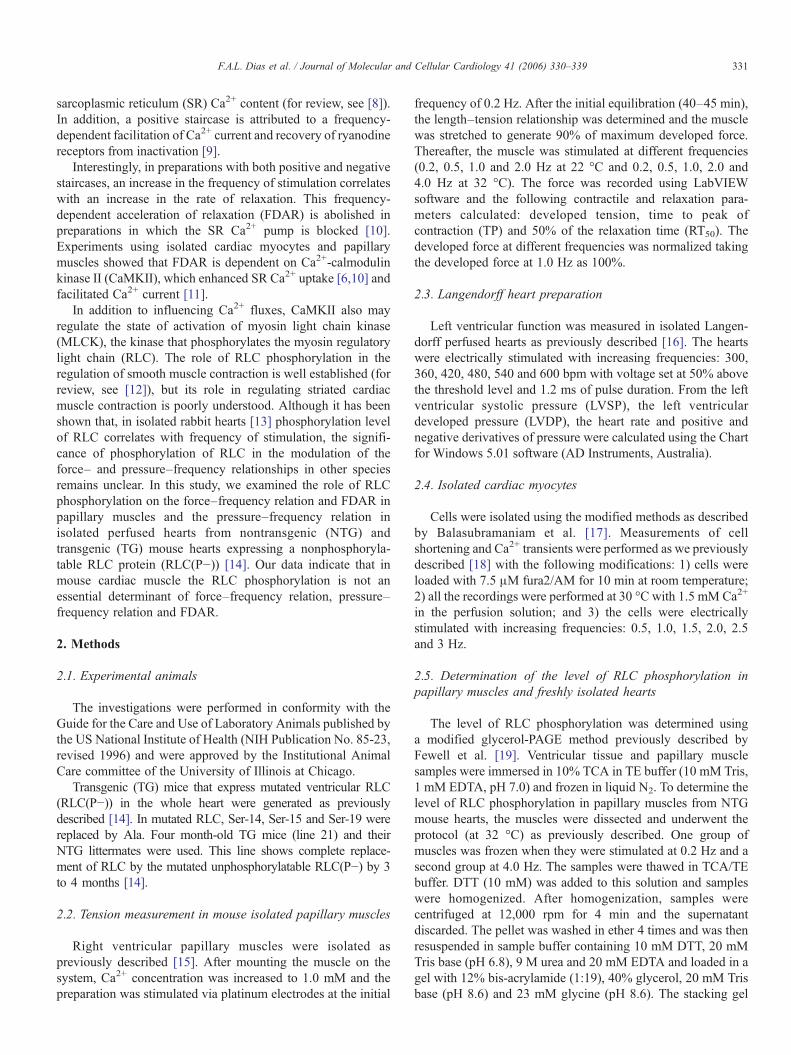
Fig. 1. Force–frequency relation in NTG and RLC(P−) papillary muscles at22 °C. (A) Representative trace of force developed by NTG papillary muscle;(B) Representative trace of force developed by RLC(P−) papillary muscle; (C)Normalized force–frequency relation in NTG (n = 7) and RLC(P−) (n = 6)muscles. (D) FDAR in papillary muscles at 22 °C. Data are presented as mean ±SE.
333F.A.L. Dias et al. / Journal of Molecular and Cellular Cardiology 41 (2006) 330–339
differences between the means was evaluated by one-wayANOVA followed by Student–Newman–Keuls test or un-paired t test as appropriated. A value of P<0.05 was thecriterion for significance. For results obtained in Langendorffperfused hearts, data were fit to a mixed effects linear model[22] using the R statistical language (v.2.1.1). Slopes andintercepts were initially allowed to vary between NTG andRLC(P−) groups; however, since no significant differences inslopes were found (P>0.05), the model was refit using acommon slope and differences in mean intercepts wererecalculated using this model.
3. Results
3.1. Force–frequency relation in papillary muscles
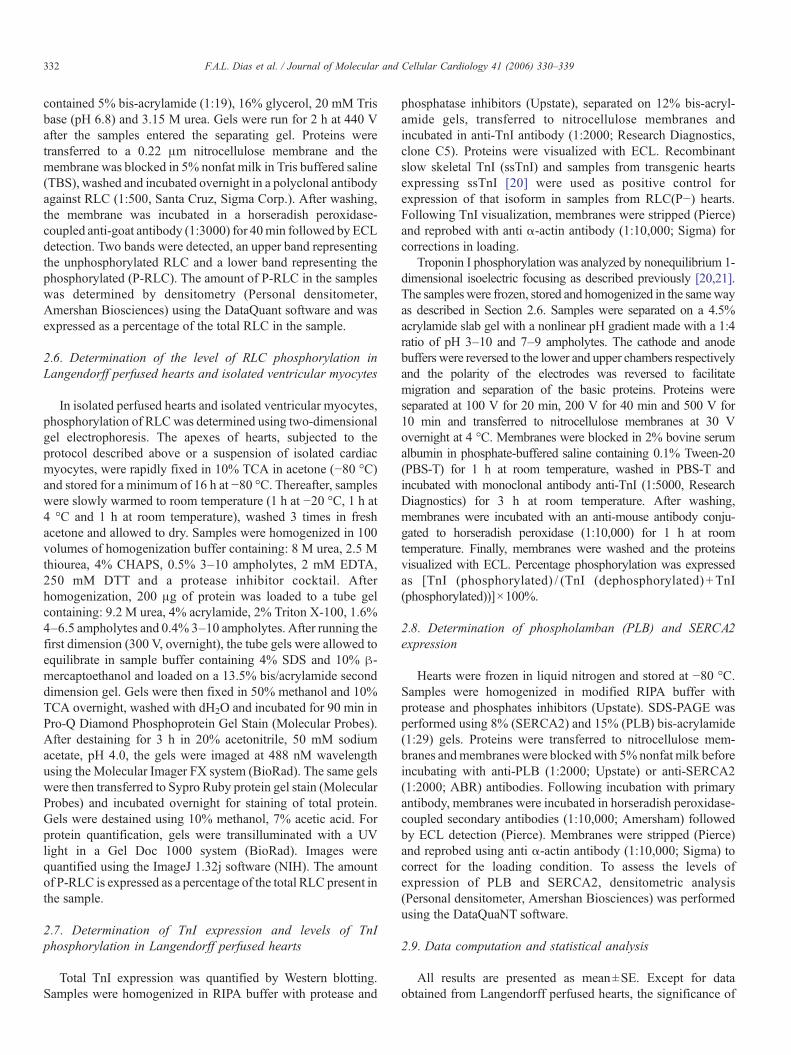
We evaluated the effect of frequency on the developed force inright ventricle papillary muscles isolated from NTG and RLC(P−)mouse hearts at 22 °C (Fig. 1) and 32 °C (Fig. 2). In both figures,developed force at 1 Hz is presented as 100%. A representativerecording of force in NTG and RLC(P−) muscles at 22 °C isshown in Figs. 1A and B, respectively. At 22 °C, NTG andRLC(P−) muscles showed a similar negative force–frequencyrelation and similar shape of this relation (Fig. 1C). Arepresentative recording of force in NTG and RLC(P−) musclesat 32 °C is shown in Figs. 2A and B, respectively. At 1 Hz(32 °C), there was no difference in the force/cross sectional areabetween NTG and RLC(P−) animals (3.84 ± 0.36 mN/mm2 inNTG (n = 5) and 4.08 ± 0.88 mN/mm2 in RLC(P−) (n = 6)animals. At this temperature at frequencies above 1 Hz, bothgroups showed a flat force–frequency relation. However,compared to NTG muscles, the RLC(P−) muscles demonstrateda smaller decrease in developed force when frequency wasincreased from 0.2 Hz to 1 Hz. The frequency-dependentacceleration of relaxation (FDAR) did not differ between RLC(P−)and NTGmuscles. At 22 °C, FDAR is presented as a ratio of RT50
at 2.0 Hz divided by RT50 at 0.2 Hz (Fig. 1D). At 32 °C, FDAR ispresented as a ratio of RT50 at 4.0 Hz divided by RT50 at 0.2 Hz(Fig. 2D).
3.2. RLC phosphorylation in NTG papillary muscles
We determined the level of RLC phosphorylation in NTGmuscles using glycerol-PAGE (Fig. 3). There was a small butsignificant increase in RLC phosphorylation when the frequen-cy of stimulation was increased from 0.2 Hz (7.0 ± 0.8%; n = 4)to 4.0 Hz (9.8 ± 0.7%; n = 6) (Fig. 3B). However, the level ofRLC phosphorylation in these muscles was lower compared tosamples taken from NTG hearts.
3.3. Pressure–frequency relation in Langendorffperfused hearts
Langendorff perfused heart preparations were used to studythe effects of the lack of RLC phosphorylation on the pressure–frequency relation at a temperature close to the bodytemperature (37 °C) and in a range of frequencies of stimulation
closer to the mouse heart frequency. NTG and RLC(P−) heartswere subjected to a protocol of imposed frequencies ofstimulation. We observed a negative pressure–frequencyrelation in hearts from both groups of mice (Fig. 4A). Therewas no difference in the slope of this relationship betweenRLC(P−) (−0.10 ± 0.02; n = 7) and NTG (−0.12 ± 0.02; n =9) groups. However, the RLC(P−) group consistentlydeveloped a significantly reduced systolic pressure at allfrequencies tested. LVDP was reduced about 20 mmHg at themedian frequency (450 bpm) tested (51.9 ± 5.4 mmHg inRLC(P−) and 72.1 ± 7.5 mmHg in NTG hearts; P = 0.017).The RLC(P−) group also demonstrated a pronouncedimpairment in the dP/dtmax throughout the range of frequencytested (Fig. 4B). At 450 bpm, the calculated dP/dtmax was2347±234 mmHg/s in RLC(P−) and 3451 ± 312 mmHg/s inNTG hearts (P = 0.003). The effects of the lack of RLCphosphorylation on the dP/dtmin is presented in Fig. 4C. At450 bpm, the calculated dP/dtmin was 1660 ± 175 mmHg/s inRLC(P−) and 2122 ± 233 mmHg/s in NTG hearts (P = 0.068).
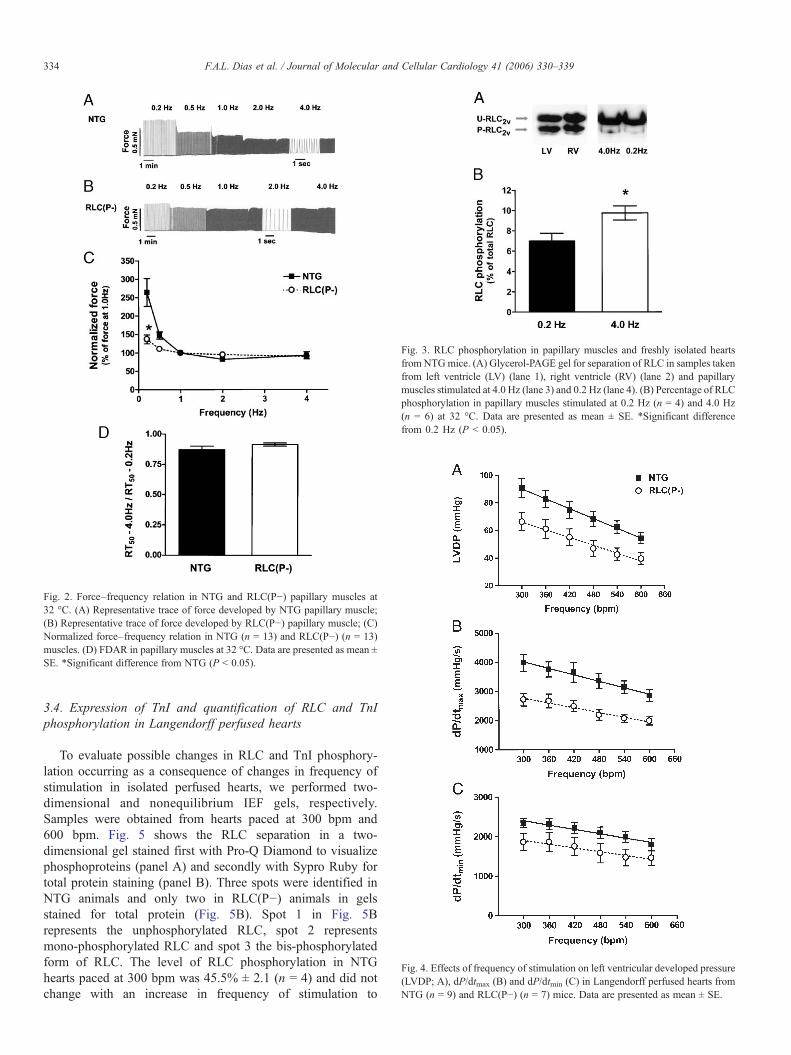
Fig. 2. Force–frequency relation in NTG and RLC(P−) papillary muscles at32 °C. (A) Representative trace of force developed by NTG papillary muscle;(B) Representative trace of force developed by RLC(P−) papillary muscle; (C)Normalized force–frequency relation in NTG (n = 13) and RLC(P−) (n = 13)muscles. (D) FDAR in papillary muscles at 32 °C. Data are presented as mean ±SE. *Significant difference from NTG (P < 0.05).
Fig. 3. RLC phosphorylation in papillary muscles and freshly isolated heartsfrom NTGmice. (A) Glycerol-PAGE gel for separation of RLC in samples takenfrom left ventricle (LV) (lane 1), right ventricle (RV) (lane 2) and papillarymuscles stimulated at 4.0 Hz (lane 3) and 0.2 Hz (lane 4). (B) Percentage of RLCphosphorylation in papillary muscles stimulated at 0.2 Hz (n = 4) and 4.0 Hz(n = 6) at 32 °C. Data are presented as mean ± SE. *Significant differencefrom 0.2 Hz (P < 0.05).
Fig. 4. Effects of frequency of stimulation on left ventricular developed pressure(LVDP; A), dP/dtmax (B) and dP/dtmin (C) in Langendorff perfused hearts fromNTG (n = 9) and RLC(P−) (n = 7) mice. Data are presented as mean ± SE.
334 F.A.L. Dias et al. / Journal of Molecular and Cellular Cardiology 41 (2006) 330–339
3.4. Expression of TnI and quantification of RLC and TnIphosphorylation in Langendorff perfused hearts
To evaluate possible changes in RLC and TnI phosphory-lation occurring as a consequence of changes in frequency ofstimulation in isolated perfused hearts, we performed two-dimensional and nonequilibrium IEF gels, respectively.Samples were obtained from hearts paced at 300 bpm and600 bpm. Fig. 5 shows the RLC separation in a two-dimensional gel stained first with Pro-Q Diamond to visualizephosphoproteins (panel A) and secondly with Sypro Ruby fortotal protein staining (panel B). Three spots were identified inNTG animals and only two in RLC(P−) animals in gelsstained for total protein (Fig. 5B). Spot 1 in Fig. 5Brepresents the unphosphorylated RLC, spot 2 representsmono-phosphorylated RLC and spot 3 the bis-phosphorylatedform of RLC. The level of RLC phosphorylation in NTGhearts paced at 300 bpm was 45.5% ± 2.1 (n = 4) and did notchange with an increase in frequency of stimulation to
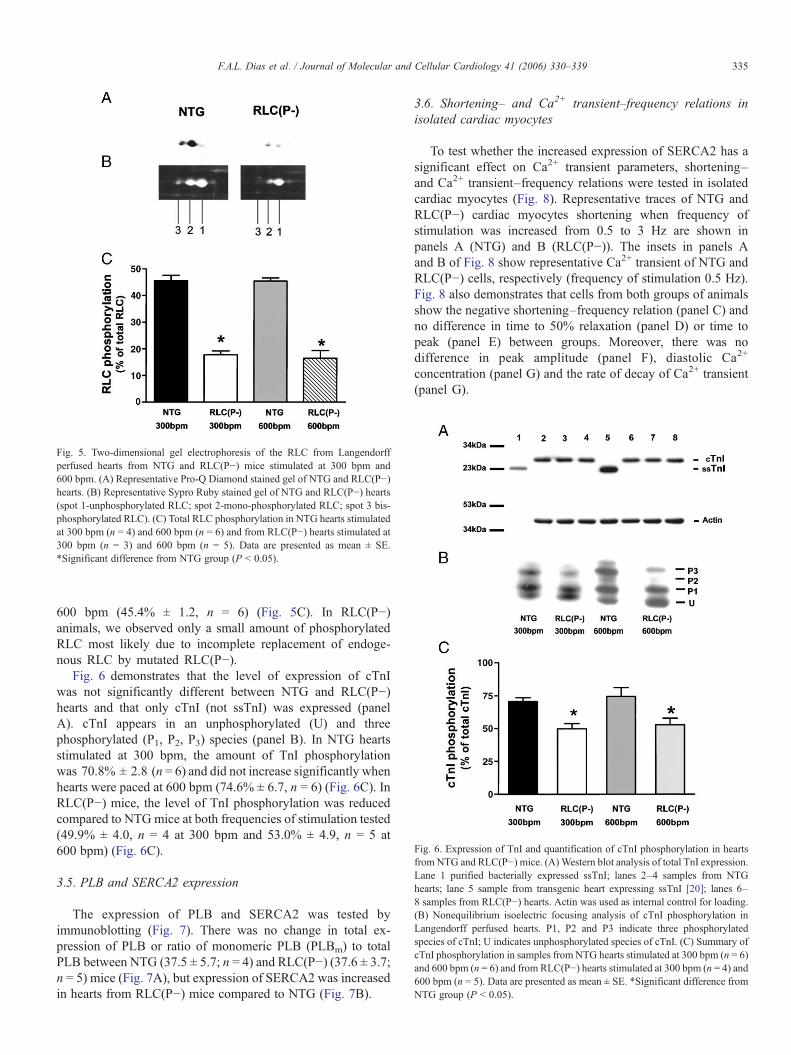
Fig. 5. Two-dimensional gel electrophoresis of the RLC from Langendorffperfused hearts from NTG and RLC(P−) mice stimulated at 300 bpm and600 bpm. (A) Representative Pro-Q Diamond stained gel of NTG and RLC(P−)hearts. (B) Representative Sypro Ruby stained gel of NTG and RLC(P−) hearts(spot 1-unphosphorylated RLC; spot 2-mono-phosphorylated RLC; spot 3 bis-phosphorylated RLC). (C) Total RLC phosphorylation in NTG hearts stimulatedat 300 bpm (n = 4) and 600 bpm (n = 6) and from RLC(P−) hearts stimulated at300 bpm (n = 3) and 600 bpm (n = 5). Data are presented as mean ± SE.*Significant difference from NTG group (P < 0.05).
Fig. 6. Expression of TnI and quantification of cTnI phosphorylation in heartsfrom NTG and RLC(P−) mice. (A) Western blot analysis of total TnI expression.Lane 1 purified bacterially expressed ssTnI; lanes 2–4 samples from NTGhearts; lane 5 sample from transgenic heart expressing ssTnI [20]; lanes 6–8 samples from RLC(P−) hearts. Actin was used as internal control for loading.(B) Nonequilibrium isoelectric focusing analysis of cTnI phosphorylation inLangendorff perfused hearts. P1, P2 and P3 indicate three phosphorylatedspecies of cTnI; U indicates unphosphorylated species of cTnI. (C) Summary ofcTnI phosphorylation in samples from NTG hearts stimulated at 300 bpm (n = 6)and 600 bpm (n = 6) and from RLC(P−) hearts stimulated at 300 bpm (n = 4) and600 bpm (n = 5). Data are presented as mean ± SE. *Significant difference fromNTG group (P < 0.05).
335F.A.L. Dias et al. / Journal of Molecular and Cellular Cardiology 41 (2006) 330–339
600 bpm (45.4% ± 1.2, n = 6) (Fig. 5C). In RLC(P−)animals, we observed only a small amount of phosphorylatedRLC most likely due to incomplete replacement of endoge-nous RLC by mutated RLC(P−).
Fig. 6 demonstrates that the level of expression of cTnIwas not significantly different between NTG and RLC(P−)hearts and that only cTnI (not ssTnI) was expressed (panelA). cTnI appears in an unphosphorylated (U) and threephosphorylated (P1, P2, P3) species (panel B). In NTG heartsstimulated at 300 bpm, the amount of TnI phosphorylationwas 70.8% ± 2.8 (n = 6) and did not increase significantly whenhearts were paced at 600 bpm (74.6% ± 6.7, n = 6) (Fig. 6C). InRLC(P−) mice, the level of TnI phosphorylation was reducedcompared to NTG mice at both frequencies of stimulation tested(49.9% ± 4.0, n = 4 at 300 bpm and 53.0% ± 4.9, n = 5 at600 bpm) (Fig. 6C).
3.5. PLB and SERCA2 expression
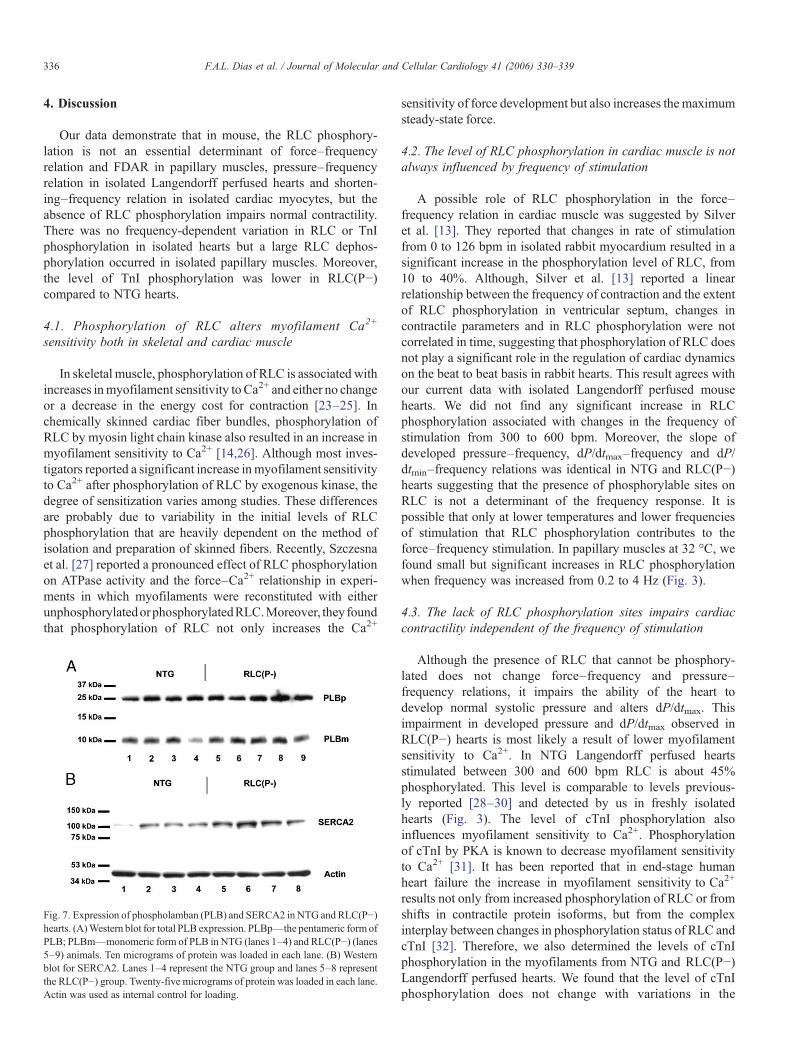
The expression of PLB and SERCA2 was tested byimmunoblotting (Fig. 7). There was no change in total ex-pression of PLB or ratio of monomeric PLB (PLBm) to totalPLB between NTG (37.5 ± 5.7; n = 4) and RLC(P−) (37.6 ± 3.7;n = 5) mice (Fig. 7A), but expression of SERCA2 was increasedin hearts from RLC(P−) mice compared to NTG (Fig. 7B).
3.6. Shortening– and Ca2+ transient–frequency relations inisolated cardiac myocytes
To test whether the increased expression of SERCA2 has asignificant effect on Ca2+ transient parameters, shortening–and Ca2+ transient–frequency relations were tested in isolatedcardiac myocytes (Fig. 8). Representative traces of NTG andRLC(P−) cardiac myocytes shortening when frequency ofstimulation was increased from 0.5 to 3 Hz are shown inpanels A (NTG) and B (RLC(P−)). The insets in panels Aand B of Fig. 8 show representative Ca2+ transient of NTG andRLC(P−) cells, respectively (frequency of stimulation 0.5 Hz).Fig. 8 also demonstrates that cells from both groups of animalsshow the negative shortening–frequency relation (panel C) andno difference in time to 50% relaxation (panel D) or time topeak (panel E) between groups. Moreover, there was nodifference in peak amplitude (panel F), diastolic Ca2+
concentration (panel G) and the rate of decay of Ca2+ transient(panel G).
336 F.A.L. Dias et al. / Journal of Molecular and Cellular Cardiology 41 (2006) 330–339
4. Discussion
Our data demonstrate that in mouse, the RLC phosphory-lation is not an essential determinant of force–frequencyrelation and FDAR in papillary muscles, pressure–frequencyrelation in isolated Langendorff perfused hearts and shorten-ing–frequency relation in isolated cardiac myocytes, but theabsence of RLC phosphorylation impairs normal contractility.There was no frequency-dependent variation in RLC or TnIphosphorylation in isolated hearts but a large RLC dephos-phorylation occurred in isolated papillary muscles. Moreover,the level of TnI phosphorylation was lower in RLC(P−)compared to NTG hearts.
4.1. Phosphorylation of RLC alters myofilament Ca2+
sensitivity both in skeletal and cardiac muscle
In skeletal muscle, phosphorylation of RLC is associated withincreases inmyofilament sensitivity to Ca2+ and either no changeor a decrease in the energy cost for contraction [23–25]. Inchemically skinned cardiac fiber bundles, phosphorylation ofRLC by myosin light chain kinase also resulted in an increase inmyofilament sensitivity to Ca2+ [14,26]. Although most inves-tigators reported a significant increase inmyofilament sensitivityto Ca2+ after phosphorylation of RLC by exogenous kinase, thedegree of sensitization varies among studies. These differencesare probably due to variability in the initial levels of RLCphosphorylation that are heavily dependent on the method ofisolation and preparation of skinned fibers. Recently, Szczesnaet al. [27] reported a pronounced effect of RLC phosphorylationon ATPase activity and the force–Ca2+ relationship in experi-ments in which myofilaments were reconstituted with eitherunphosphorylatedorphosphorylatedRLC.Moreover, they foundthat phosphorylation of RLC not only increases the Ca2+
Fig. 7. Expression of phospholamban (PLB) and SERCA2 in NTG and RLC(P−)hearts. (A)Western blot for total PLB expression. PLBp—the pentameric form ofPLB; PLBm—monomeric form of PLB in NTG (lanes 1–4) and RLC(P−) (lanes5–9) animals. Ten micrograms of protein was loaded in each lane. (B) Westernblot for SERCA2. Lanes 1–4 represent the NTG group and lanes 5–8 representthe RLC(P−) group. Twenty-five micrograms of protein was loaded in each lane.Actin was used as internal control for loading.
sensitivity of force development but also increases the maximumsteady-state force.
4.2. The level of RLC phosphorylation in cardiac muscle is notalways influenced by frequency of stimulation
A possible role of RLC phosphorylation in the force–frequency relation in cardiac muscle was suggested by Silveret al. [13]. They reported that changes in rate of stimulationfrom 0 to 126 bpm in isolated rabbit myocardium resulted in asignificant increase in the phosphorylation level of RLC, from10 to 40%. Although, Silver et al. [13] reported a linearrelationship between the frequency of contraction and the extentof RLC phosphorylation in ventricular septum, changes incontractile parameters and in RLC phosphorylation were notcorrelated in time, suggesting that phosphorylation of RLC doesnot play a significant role in the regulation of cardiac dynamicson the beat to beat basis in rabbit hearts. This result agrees withour current data with isolated Langendorff perfused mousehearts. We did not find any significant increase in RLCphosphorylation associated with changes in the frequency ofstimulation from 300 to 600 bpm. Moreover, the slope ofdeveloped pressure–frequency, dP/dtmax–frequency and dP/dtmin–frequency relations was identical in NTG and RLC(P−)hearts suggesting that the presence of phosphorylable sites onRLC is not a determinant of the frequency response. It ispossible that only at lower temperatures and lower frequenciesof stimulation that RLC phosphorylation contributes to theforce–frequency stimulation. In papillary muscles at 32 °C, wefound small but significant increases in RLC phosphorylationwhen frequency was increased from 0.2 to 4 Hz (Fig. 3).
4.3. The lack of RLC phosphorylation sites impairs cardiaccontractility independent of the frequency of stimulation
Although the presence of RLC that cannot be phosphory-lated does not change force–frequency and pressure–frequency relations, it impairs the ability of the heart todevelop normal systolic pressure and alters dP/dtmax. Thisimpairment in developed pressure and dP/dtmax observed inRLC(P−) hearts is most likely a result of lower myofilamentsensitivity to Ca2+. In NTG Langendorff perfused heartsstimulated between 300 and 600 bpm RLC is about 45%phosphorylated. This level is comparable to levels previous-ly reported [28–30] and detected by us in freshly isolatedhearts (Fig. 3). The level of cTnI phosphorylation alsoinfluences myofilament sensitivity to Ca2+. Phosphorylationof cTnI by PKA is known to decrease myofilament sensitivityto Ca2+ [31]. It has been reported that in end-stage humanheart failure the increase in myofilament sensitivity to Ca2+
results not only from increased phosphorylation of RLC or fromshifts in contractile protein isoforms, but from the complexinterplay between changes in phosphorylation status of RLC andcTnI [32]. Therefore, we also determined the levels of cTnIphosphorylation in the myofilaments from NTG and RLC(P−)Langendorff perfused hearts. We found that the level of cTnIphosphorylation does not change with variations in the
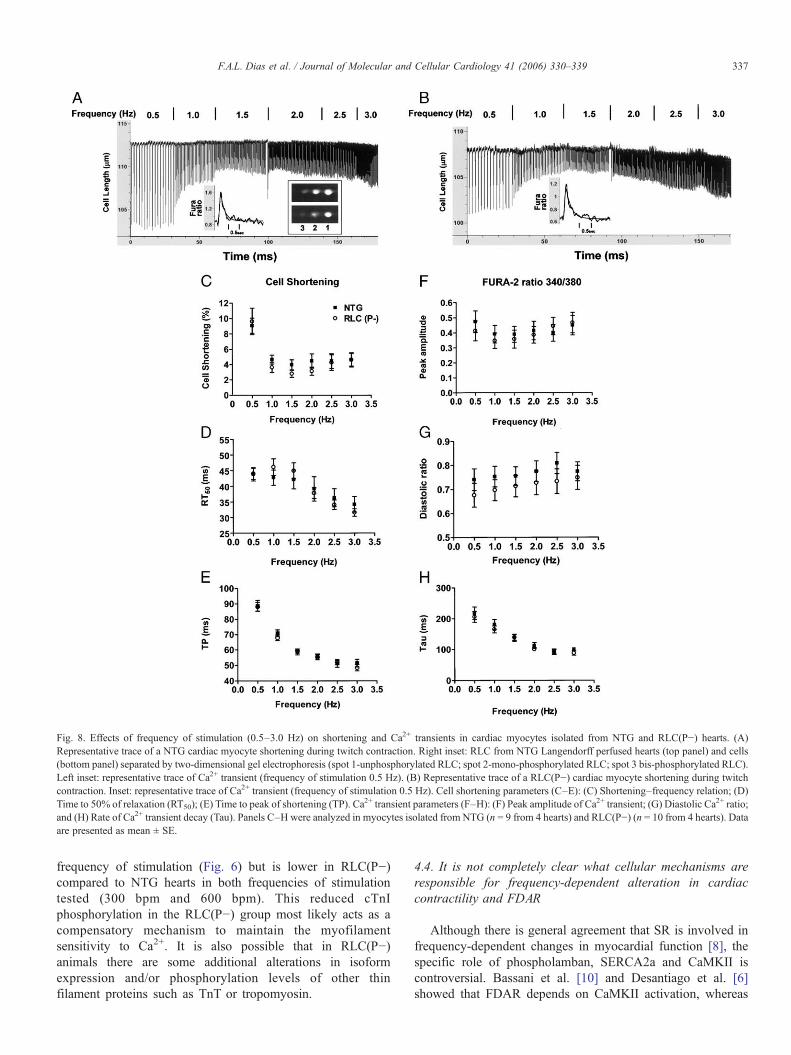
Fig. 8. Effects of frequency of stimulation (0.5–3.0 Hz) on shortening and Ca2+ transients in cardiac myocytes isolated from NTG and RLC(P−) hearts. (A)Representative trace of a NTG cardiac myocyte shortening during twitch contraction. Right inset: RLC from NTG Langendorff perfused hearts (top panel) and cells(bottom panel) separated by two-dimensional gel electrophoresis (spot 1-unphosphorylated RLC; spot 2-mono-phosphorylated RLC; spot 3 bis-phosphorylated RLC).Left inset: representative trace of Ca2+ transient (frequency of stimulation 0.5 Hz). (B) Representative trace of a RLC(P−) cardiac myocyte shortening during twitchcontraction. Inset: representative trace of Ca2+ transient (frequency of stimulation 0.5 Hz). Cell shortening parameters (C–E): (C) Shortening–frequency relation; (D)Time to 50% of relaxation (RT50); (E) Time to peak of shortening (TP). Ca2+ transient parameters (F–H): (F) Peak amplitude of Ca2+ transient; (G) Diastolic Ca2+ ratio;and (H) Rate of Ca2+ transient decay (Tau). Panels C–Hwere analyzed in myocytes isolated from NTG (n = 9 from 4 hearts) and RLC(P−) (n = 10 from 4 hearts). Dataare presented as mean ± SE.
337F.A.L. Dias et al. / Journal of Molecular and Cellular Cardiology 41 (2006) 330–339
frequency of stimulation (Fig. 6) but is lower in RLC(P−)compared to NTG hearts in both frequencies of stimulationtested (300 bpm and 600 bpm). This reduced cTnIphosphorylation in the RLC(P−) group most likely acts as acompensatory mechanism to maintain the myofilamentsensitivity to Ca2+. It is also possible that in RLC(P−)animals there are some additional alterations in isoformexpression and/or phosphorylation levels of other thinfilament proteins such as TnT or tropomyosin.
4.4. It is not completely clear what cellular mechanisms areresponsible for frequency-dependent alteration in cardiaccontractility and FDAR
Although there is general agreement that SR is involved infrequency-dependent changes in myocardial function [8], thespecific role of phospholamban, SERCA2a and CaMKII iscontroversial. Bassani et al. [10] and Desantiago et al. [6]showed that FDAR depends on CaMKII activation, whereas
338 F.A.L. Dias et al. / Journal of Molecular and Cellular Cardiology 41 (2006) 330–339
Hussain et al. [33], Layland and Kentish [34] and Kassiri et al.[35] did not find involvement of CaMKII in FDAR. The role ofPLB is also controversial. For example, Hagemann et al. [36]reported that, in the absence of β-adrenergic stimulation inisolated rat myocytes, the level of PLB-Thr17 phosphorylationincreases in a frequency-dependent manner without anychanges in phosphorylation of Ser-16. However, Hussain etal. [33] found no changes in Ser-16 or Thr-17 phosphorylationwith changes in stimulation rate. Recently, Valverde et al. [37]showed that FDAR does not depend on PLB or SERCA2aphosphorylation, and is CaMKII-independent. Similarly, it isnot clear whether the level of expression of PLB or PLB/SERCA2a ratio is important in controlling the force–frequencyrelation. Results from PLB-knockout mice suggest that FDARdoes not depend on PLB expression [6,38], but experimentsusing adenoviral over-expression of PLB and SERCA2a showthat PLB/SERCA2a ratio controls the force–frequency rela-tionship in isolated rabbit cardiac myocytes [39]. In ourexperimental model, there was no difference in PLB expressionbetween NTG and RLC(P−) hearts, but we found that theexpression of SERCA2 was markedly higher in RLC(P−)compared to NTG hearts (Fig. 7) suggesting an alteration in thePLB/SERCA2a ratio. However, experiments with isolatedcardiac myocytes showed that there was no change in Ca2+
transient between NTG and RLC(P−) groups. Moreover, thealtered expression of SERCA2a and the PLB/SERCA2a ratiodid not have any significant effect on the slope of the pressure–frequency relation or FDAR. It is likely that the increasedexpression of SERCA2a and the decreased level of cTnIphosphorylation are compensatory mechanisms that help tomaintain the contractile function in RLC(P−) hearts. Insummary, our data provide direct evidence that underphysiological conditions phosphorylation of RLC or cTnI isnot responsible for the force (pressure)–frequency relationshipin cardiac muscle and that other mechanisms are responsible fordetermination of this relation.
Acknowledgments
This research was supported by NIH research grants RO164209 and RO1 79032 (B.M.W.), NHLBI Training Grant T32-HL07692 (Y.K.). B.M.W. is an Established Investigator of theAmerican Heart Association.
References
[1] Maier LS, Bers DM, Pieske B. Differences in Ca2+-handling andsarcoplasmic reticulum Ca2+-content in isolated rat and rabbit myocar-dium. J Mol Cell Cardiol 2000;32:2249–58.
[2] Kurihara S, Sakai T. Effects of rapid cooling on mechanical and electricalresponses in ventricular muscle of guinea-pig. J Physiol 1985;361:361–78.
[3] Gwathmey JK, Slawsky MT, Hajjar RJ, Briggs GM, Morgan JP. Role ofintracellular calcium handling in force–interval relationships of humanventricular myocardium. J Clin Invest 1990;85:1599–613.
[4] Wolska BM, Solaro RJ. Method for isolation of adult mouse cardiacmyocytes for studies of contraction and microfluorimetry. Am J Physiol1996;271:H1250–5.
[5] Antoons G, Mubagwa K, Nevelsteen I, Sipido KR. Mechanisms
underlying the frequency dependence of contraction and [Ca2+]i transientsin mouse ventricular myocytes. J Physiol 2002;543:889–98.
[6] Desantiago J, Maier LS, Bers DM. Frequency-dependent acceleration ofrelaxation in the heart depends on CaMKII, but not phospholamban. J MolCell Cardiol 2002;34:975–84.
[7] Pieske B, Maier LS, Bers DM, Hasenfuss G. Ca2+ handling andsarcoplasmic reticulum Ca2+ content in isolated failing and nonfailinghuman myocardium. Circ Res 1999;85:38–46.
[8] Bers DM. Excitation–Contraction coupling and cardiac contractile force.Dordrecht, The Netherlands: Kluwer Academic Publishers; 2001.
[9] Zygmunt AC, Maylie J. Stimulation-dependent facilitation of the highthreshold calcium current in guinea-pig ventricular myocytes. J Physiol1990;428:653–71.
[10] Bassani RA, Mattiazzi A, Bers DM. CaMKII is responsible for activity-dependent acceleration of relaxation in rat ventricular myocytes. Am JPhysiol 1995;37:H703–12.
[11] Yuan W, Bers DM. Ca2+-dependent facilitation of cardiac Ca2+ current isdue to Ca2+-calmodulin-dependent protein kinase. Am J Physiol 1994;267:H982–93.
[12] Somlyo AP, Somlyo AV. Ca2+ sensitivity of smooth muscle and nonmusclemyosin II: modulated by G proteins, kinases, and myosin phosphatase.Physiol Rev 2003;83:1325–58.
[13] Silver PJ, Buja LM, Stull JT. Frequency-dependent myosin light chainphosphorylation in isolated myocardium. J Mol Cell Cardiol 1986;18:31–7.
[14] Sanbe A, Fewell JG, Gulick J, Osinska H, Lorenz J, Hall DG, et al.Abnormal cardiac structure and function in mice expressing nonphos-phorylatable cardiac regulatory myosin light chain 2. J Biol Chem1999;274:21085–94.
[15] Wolska BM, Vijayan K, Arteaga GM, Konhilas JP, Phillips RM, KimR, et al. Expression of slow skeletal troponin I in adult transgenic mouseheart muscle reduces the force decline observed during acidic conditions.J Physiol 2001;536:863–70.
[16] Arteaga GM, Warren CM, Milutinovic S, Martin AF, Solaro RJ. Specificenhancement of sarcomeric response to Ca2+ protects murine myocardiumagainst ischemia–reperfusion dysfunction. Am J Physiol 2005;289:H2183–92.
[17] Balasubramaniam R, Chawla S, Grace AA, Huang CL. Caffeine-inducedarrhythmias in murine hearts parallel changes in cellular Ca2+ homeostasis.Am J Physiol 2005;289:H1584–93.
[18] Wolska BM, Arteaga GM, Pena JR, Nowak G, Phillips RM, Sahai S, et al.Expression of slow skeletal troponin I in hearts of phospholambanknockout mice alters the relaxant effect of β-adrenergic stimulation. CircRes 2002;90:882–8.
[19] Fewell JG, Osinska H, Klevitsky R, Ng W, Sfyris G, Bahrehmand F, et al.A treadmill exercise regimen for identifying cardiovascular phenotypes intransgenic mice. Am J Physiol 1997;273:H1595–605.
[20] Urboniene D, Dias FA, Pena JR, Walker LA, Solaro RJ, Wolska BM.Expression of slow skeletal troponin I in adult mouse heart helps tomaintain the left ventricular systolic function during respiratory hyper-capnia. Circ Res 2005;97:70–7.
[21] Kobayashi T, Yang X, Walker LA, Van Breemen RB, Solaro RJ. A non-equilibrium isoelectric focusing method to determine states of phosphory-lation of cardiac troponin I: identification of Ser-23 and Ser-24 assignificant sites of phosphorylation by protein kinase C. J Mol Cell Cardiol2005;38:213–8.
[22] Pinheiro JC, Bates DM. Mixed effects models in S and S-plus. New York:Springer; 2000.
[23] Metzger JM, Greaser ML, Moss RL. Variations in cross-bridge attachmentrate and tension with phosphorylation of myosin in mammalian skinnedskeletal muscle fibers. Implications for twitch potentiation in intact muscle.J Gen Physiol 1989;93:855–83.
[24] Crow MT, Kushmerick MJ. Phosphorylation of myosin light chains inmouse fast-twitch muscle associated with reduced actomyosin turnoverrate. Science 1982;217:835–7.
[25] Persechini A, Stull JT. Phosphorylation kinetics of skeletal muscle myosinand the effect of phosphorylation on actomyosin adenosinetriphosphataseactivity. Biochemistry 1984;23:4144–50.
339F.A.L. Dias et al. / Journal of Molecular and Cellular Cardiology 41 (2006) 330–339
[26] Morano I, Hofmann F, ZimmerM, Ruegg JC. The influence of P-light chainphosphorylation by myosin light chain kinase on the calcium sensitivity ofchemically skinned heart fibres. FEBS Lett 1985;189: 221–224.
[27] Szczesna D, Zhao J, Jones M, Zhi G, Stull J, Potter JD. Phosphorylation ofthe regulatory light chains of myosin affects Ca2+ sensitivity of skeletalmuscle contraction. J Appl Physiol 2002;92:1661–70.
[28] Fitzsimons DP, Bodell PW, Baldwin KM. Myocardial functional correlatesof cardiac myosin light chain 2 phosphorylation. J Appl Physiol 1990;68:2426–33.
[29] Fitzsimons DP, Bodell PW, Baldwin KM. Phosphorylation of rodentcardiac myosin light chain 2: effects of exercise. J Appl Physiol 1989;67:2447–53.
[30] Akiyama K, Akopian G, Jinadasa P, Gluckman TL, Terhakopian A,Massey B, et al. Myocardial infarction and regulatory myosin light chain.J Mol Cell Cardiol 1997;29:2641–52.
[31] Konhilas JP, Irving TC, Wolska BM, Jweied EE, Martin AF, SolaroRJ, et al. Troponin I in the murine myocardium: influence on length-dependent activation and interfilament spacing. J Physiol 2003;547:951–961.
[32] van der Velden J, Papp Z, Zaremba R, Boontje NM, de Jong JW, Owen VJ,et al. Increased Ca2+-sensitivity of the contractile apparatus in end-stagehuman heart failure results from altered phosphorylation of contractileproteins. Cardiovasc Res 2003;57:37–47.
[33] Hussain M, Drago GA, Colyer J, Orchard CH. Rate-dependentabbreviation of Ca2+ transient in rat heart is independent of phospho-lamban phosphorylation. Am J Physiol 1997;273:H695–706.
[34] Layland J, Kentish JC. Positive force– and [Ca2+]i–frequency relation-ships in rat ventricular trabeculae at physiological frequencies. Am JPhysiol 1999;276:H9–H18.
[35] Kassiri Z, Myers R, Kaprielian R, Banijamali HS, Backx PH. Rate-dependent changes of twitch force duration in rat cardiac trabeculae: aproperty of the contractile system. J Physiol 2000;524:221–31.
[36] Hagemann D, Kuschel M, Kuramochi T, Zhu W, Cheng H, Xiao RP.Frequency-encoding Thr17 phospholamban phosphorylation is indepen-dent of Ser16 phosphorylation in cardiac myocytes. J Biol Chem 2000;275:22532–6.
[37] Valverde CA, Mundina-Weilenmann C, Said M, Ferrero P, Vittone L, SalasM, et al. Frequency-dependent acceleration of relaxation in mammalianheart: a property not relying on phospholamban and SERCA2aphosphorylation. J Physiol 2005;562:801–13.
[38] Li L, Chu G, Kranias EG, Bers DM. Cardiac myocyte calcium transport inphospholamban knockout mouse: relaxation and endogenous CaMKIIeffects. Am J Physiol 1998;274:H1335–47.
[39] Meyer M, Bluhm WF, He H, Post SR, Giordano FJ, Lew WY, et al.Phospholamban-to-SERCA2 ratio controls the force–frequency relation-ship. Am J Physiol 1999;276:H779–85.
Copyright © 2022 FDOKUMEN