
Bats distress vocalizations carry fast amplitude modulations ...
GTP-06-1037, Shamim, 1
The Effect of Engine Exhaust Temperature Modulations on the
Performance of Automotive Catalytic Converters
Tariq Shamim
Department of Mechanical Engineering
The University of Michigan - Dearborn
Dearborn, MI 48128-1491
Abstract
This paper presents a computational investigation of the effect of exhaust temperature
modulations on an automotive catalytic converter. The objective is to develop a better
fundamental understanding of the converter’s performance under transient driving
conditions. Such an understanding will be beneficial in devising improved emission control
methodologies. The study employs a single-channel based, one-dimensional, non-adiabatic
model. The transient conditions are imposed by varying the exhaust gas temperature
sinusoidally. The results show that temperature modulations cause a significant departure in
the catalyst behavior from its steady behavior, and modulations have both favorable and
harmful effects on pollutant conversion. The operating conditions and the modulating gas
composition and flow rates (space velocity) have substantial influence on catalyst behavior.
Key Words
engine emissions, engine exhaust after-treatment, dynamic behavior, numerical simulations.
GTP-06-1037, Shamim, 2
Nomenclature
Cgj gas phase concentration of species j, mol/m3
Csj surface concentration of species j, mol/m3
Cpg specific heat of gas, J/(kg·K)
Cps specific heat of substrate, J/(kg·K)
Ga geometric surface area, m2/m3
∆Hk heat of reaction of species k, J/mol
hg heat transfer coefficient between flow and substrate, J/(m2·s·K)
h∞ heat transfer coefficient between substrate and atmosphere, J/(m2·s·K)
kmj mass transfer coefficient for species j, m/s
Rk reaction rate of kth reaction, mol/(m2·s)
Sext external surface to volume area ratio, m2/m3
t time, s
T∞ ambient temperature, K
Tg gas temperature, K
Ts substrate temperature, K
vg gas flow velocity, m/s
z coordinate along catalyst axis, m
Greek symbols
ε void volume fraction
λs thermal conductivity of substrate, J/(m·s·K)
ρg gas density, kg/m3
GTP-06-1037, Shamim, 3
ρs substrate density, kg/m3
Introduction
Automotive catalytic converters, which are employed to reduce engine exhaust
emissions, are subjected to highly transient conditions during a typical driving cycle. These
transient conditions arise from changes in driving mode (acceleration and deceleration), and
the hysteresis and flow lags of the feedback control system. The transients result in
fluctuations of gas flow rates, compositions and temperatures. These transients make the
catalyst behavior differ significantly from that under steady state conditions [1-5]. Due to its
practical significance, the investigation of the catalyst dynamic behavior has been a subject
of active research for more than two decades. Most prior studies have been focused on the
effects of air-fuel ratio (A/F) and composition modulations. These studies determined that
modulations have both beneficial and harmful effects on pollutant conversion depending
upon the catalyst type, driving mode, exhaust conditions, and pollutants to be removed [4].
In addition to A/F and composition, temperature also has a large influence on the
reaction behavior. Van Neer et al. investigated the effects of a fast periodic change of the
reaction temperature, which may positively affect certain heterogeneously catalyzed
reactions [6]. In this theoretical study, the influence of fast periodic modulations of the
temperature to the preferential oxidation of CO in a hydrogen-rich gas mixture was studied.
The effect postulated to arise by fast periodic changes of the temperature was the generation
of a residual behavior of adsorbed reactant molecules within temperature ranges where they
normally are not adsorbed on the catalyst surface. Therefore, the frequency of the
temperature modulations has to be high enough to prevent desorption of the reactants, but
GTP-06-1037, Shamim, 4
low enough to allow adsorption and to avoid quasi-steady state by switching the temperature
very rapidly.
The potential benefits of temperature modulations are reported to be higher catalyst
yield owing to the improvement of catalyst coverage and higher selectivity of the catalyst [7].
The imposed modulation frequencies are found to play an important role in determining the
benefits of temperature modulations [7]. However, little attention has been paid to the
investigation of temperature modulation. One potential reason for the limited work in this
area is the difficulty associated with the temperature modulation in conventional reactors.
This is owing to the large thermal masses and the poor surface-to-volume ratio, which restrict
the heat exchange between conventional reactor systems and heating/cooling systems [7,8].
The present study is motivated by realizing the scarcity of extensive investigation of
the effects of temperature modulation on catalysts especially on automotive catalysts. It
investigates the effects of exhaust gas temperature modulations on a three-way automotive
catalyst. The objective is to clearly understand the effect of temperature modulation on the
catalyst performance under engine exhaust conditions.
Mathematical Formulation
The governing equations were developed by considering the conservation of mass,
energy and chemical species. Using the assumptions and notations listed elsewhere [9], the
governing conservation equations for a typical single channel may be written as follows:
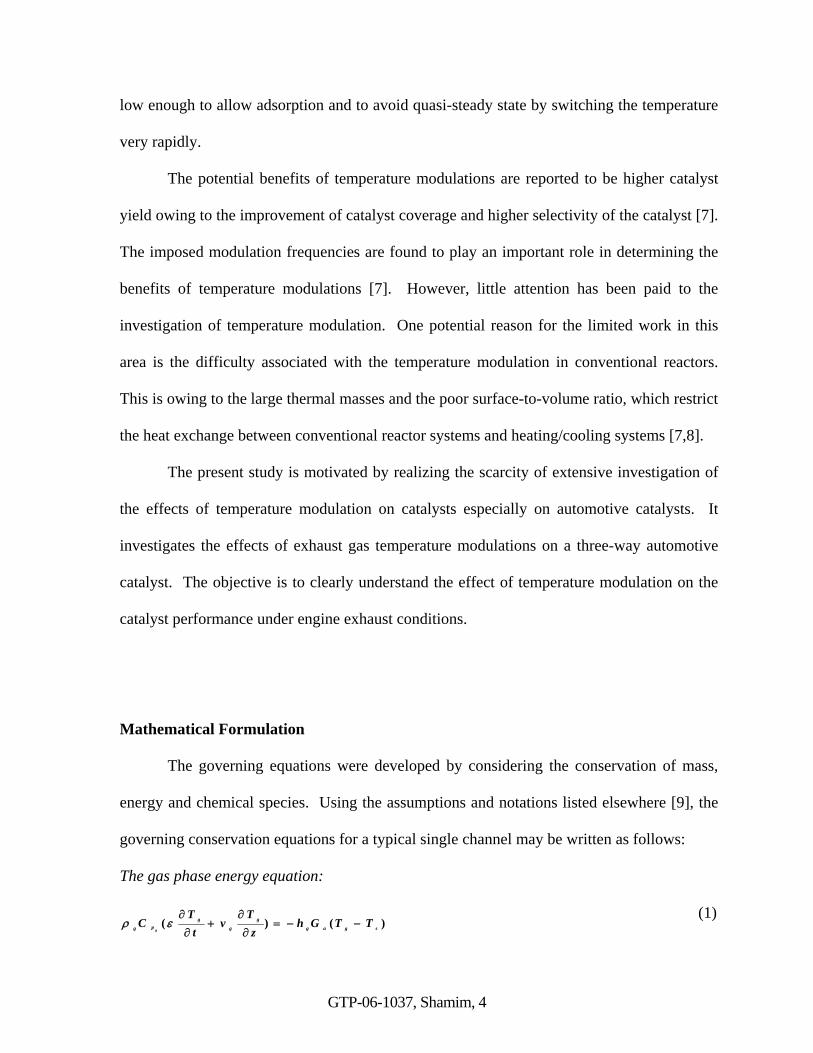
The gas phase energy equation:
)()( sgag
g
g
g
Pg TTGhz
Tv
tT
Cg
−−=∂∂
+∂∂
ερ (1)

GTP-06-1037, Shamim, 5
The gas phase species equations (for 7 species):
)()( js
jga
j
jg
g
jg CCGkm
zC
vt
C−−=
∂∂
+∂
∂ε
(2)
The surface energy equation:
knss
n
ks
ka
sextsgags
ss
Pss
HCCTRG
TTShTTGhzT
tT
C
speciesreaction
∆⋅⋅⋅⋅⋅⋅⋅+
−−−+∂∂
−=∂∂
−
∑=
∞∞
),,,(
)()()1()1(
1
1
2
2
λερε (3)
The surface species equations (for 7 species):
),,,()()1( 1 speciesNsss
ja
js
jga
jj
s CCTRGCCGkmt
C⋅⋅⋅⋅⋅⋅−−=
∂∂
−ε (4)
The superscript j in species equations varies from 1 to 7, representing the following
species: CO, NO, NH3, O2, C3H6, H2 and C3H8. In addition to these species, the kinetic
expressions also include CO2, H2O and N2. The conservation equation for the surface
oxygen storage mechanism is represented by Eq. (4) excluding the convective mass transport
term. The heat and mass transfer coefficients in the above equations are calculated from the
conventional correlations of Nusselt and Sherwood numbers [10]. The chemical reactions
and the corresponding kinetic data used in the present study were similar to those used in
Ref. [9]. The governing equations were discretized by using a non-uniform grid and
employing the control volume approach with the central implicit difference scheme in the
spatial direction. A standard tridiagonal matrix algorithm with an iterative successive line
under relaxation method was used to solve the finite difference equations. The spatial node
size ranging from 0.1693 mm to 19.32 mm and the time step of 0.001 second were employed.
The grid insensitivity of results was ensured by performing a sensitivity study. Details of the
solution procedure are described elsewhere [9].

GTP-06-1037, Shamim, 6
Results and Discussion
The numerical model’s performance under actual transient driving conditions was
assessed by using experimental measurements across the front catalyst brick from a 4.6L 2V
Lincoln Town car as it was driven during the Federal Test Procedure (FTP-72). The model
results were compared with experimental measurements elsewhere [9]. The model
predictions for the cumulative conversion efficiencies during the FTP cycle were found to be
within 5% of the experimental measurements. The model’s transient performance was
validated by comparing the model’s predictions of instantaneous conversion with the
experimental measurements taken at 1 Hz resolutions. The comparison showed that the
average difference between the model results and measurements was around 30%, which is
within the experimental uncertainties. These validation results showed the suitability of the
model in simulating the transient performance of catalyst.
The catalyst used for the present study was palladium-based and had a length of 3 cm,
cross-sectional area of 86.0254 cm2, cell density of 62 cells/cm2, and wall thickness of
0.1905 mm. The catalyst aging conditions were similar to those of Ref. [10]. The gas mass
flow rate was 1.417x10⁻² kg/s with 4.7184x10⁻⁵ kg/s CO, 8.0727x10⁻⁶ kg/s total HC, and
2.0363x10⁻⁶ kg/s NO, and the stoichiometric value of A/F was 14.51. The mean feed gas
temperature was 327oC (600 K). The influence of exhaust gas temperature modulation on
the catalyst dynamic behavior was investigated by considering a steady operating catalyst
suddenly subjected to transient effects. The transient effects were simulated by sinusoidal
modulations of the exhaust gas temperature entering the catalyst. During these oscillations,
other inlet conditions remained unchanged.

GTP-06-1037, Shamim, 7
Figure 1 shows the results of the imposed modulation near stoichiometric conditions
at 14.7. During the simulations, the exhaust gas temperature, initially set at 600 K, is varied
sinusoidally with a frequency of 0.01 Hz and amplitude of 10%. The low value of
modulation frequency is selected in order to emphasize the effect of imposed modulation
even though it is lower than that of the typical realistic modulations. The effect of other
frequencies, which include more realistic values (such as 0.1 – 5 Hz), is presented in the
following section. With the exhaust gas temperature ranging between 540 K and 660 K, the
selected value of amplitude represents a modest level of modulation. The effect of higher
modulation amplitudes are also considered in the next section. The imposed temperature
modulations cause the catalyst to respond with a time delay.
The results show that CO and HC conversion efficiencies respond sinusoidally to the
imposed sinusoidal temperature modulations. The conversion efficiencies increases
corresponding to an increase in the exhaust gas temperature at the catalyst inlet. After
reaching peak values, the conversion efficiencies decrease corresponding to a decrease in the
exhaust gas temperature. The catalyst periodic response continues as long as the modulating
temperature field is maintained. For the conditions studied, the catalyst NO conversion is
very high (~ 100%) and is not much influenced by the imposed temperature modulations.
The imposed temperature modulation has a negative effect on the CO conversion.
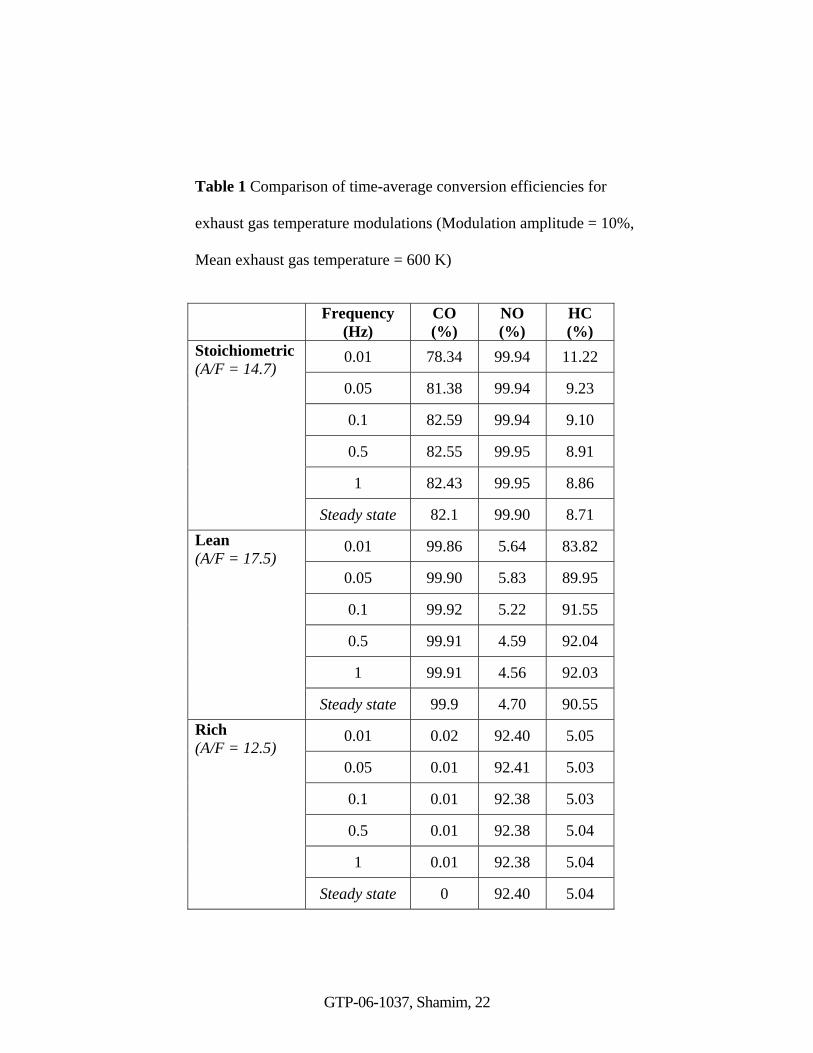
The time-average conversion efficiency, which is obtained by considering the cumulative
pollutant species in and out of the catalyst during the first four hundred seconds, exhibits a
decrease of 3.8% from its steady state value of 82.1% (see Table 1). For these operating
conditions and the CO/HC ratio, HC conversion is low. It is, however, improved by the
imposed modulation. Result listed in Table 1 shows that the HC time-average conversion
GTP-06-1037, Shamim, 8
efficiency exhibits an increase of 2.5% from its steady state value of 8.71%. The catalyst’s
response is asymmetric with respect to its initial steady state value. With a response
amplitude, which is defined as the difference of peak and trough values of conversion
efficiency, of 44.5%, the modulations have greater influence on CO emission conversion.
The effect on HC emission conversion is relatively low (response amplitude is 19.8%) and
the effect on NO conversion is insignificant (response amplitude is 0.1%).
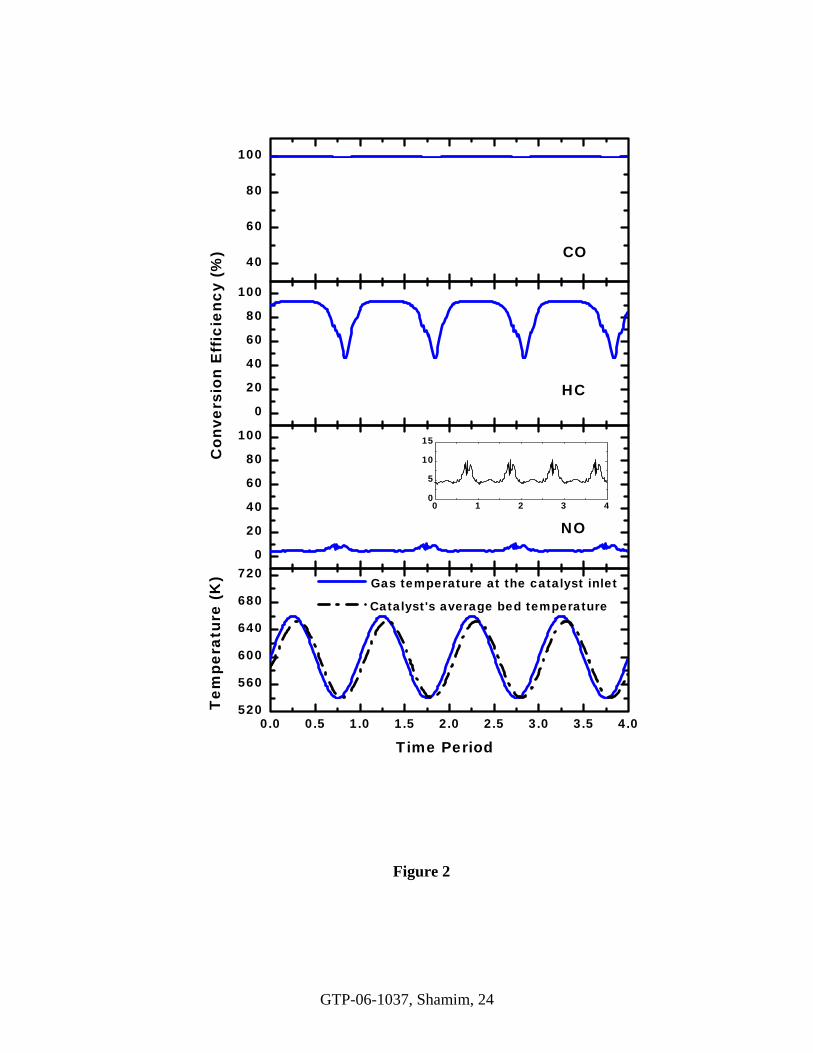
The effects of temperature modulation in rich and lean regimes are presented next.
The lean regime results, as shown in Figure 2, were obtained by setting the A/F at 17.5. The
catalyst is subjected to sinusoidal modulations in the exhaust temperature with a 0.01 Hz
frequency and 10% amplitude. Under these conditions, CO conversion is high (~100%) and
is not influenced by the imposed modulations. The HC conversion is also high (~90%), but it
is sensitive to the exhaust gas temperature and responds to the imposed modulations with a
large amplitude. The response is periodic, non-sinusoidal, and asymmetric with respect to its
initial steady state value. The modulations result in a decrease in HC conversion
performance as the time-average conversion efficiency is decreased by 6.7% from its steady
state value of 90.55%. The imposed modulations bring about a relatively small response
from NO conversion, which is initially quite low owing to lean conditions. The response is
periodic and non-smooth especially near the peak values. Overall, the effect of modulations
on NO conversion is positive since the time-average conversion efficiency (5.6%) is higher
than the initial steady state value (4.7%).
The rich regime results, as shown in Figure 3, were obtained by setting the A/F at
12.5. The catalyst is subjected to sinusoidal modulations in the exhaust temperature with a
0.01 Hz frequency and 10% amplitude. Under rich conditions, the catalyst is less sensitive to
GTP-06-1037, Shamim, 9
the imposed temperature modulations. The conversion performance responds to the
modulations with very small amplitudes. Overall, there is no appreciable influence on the
catalyst conversion performance.
Effect of Modulation Amplitude
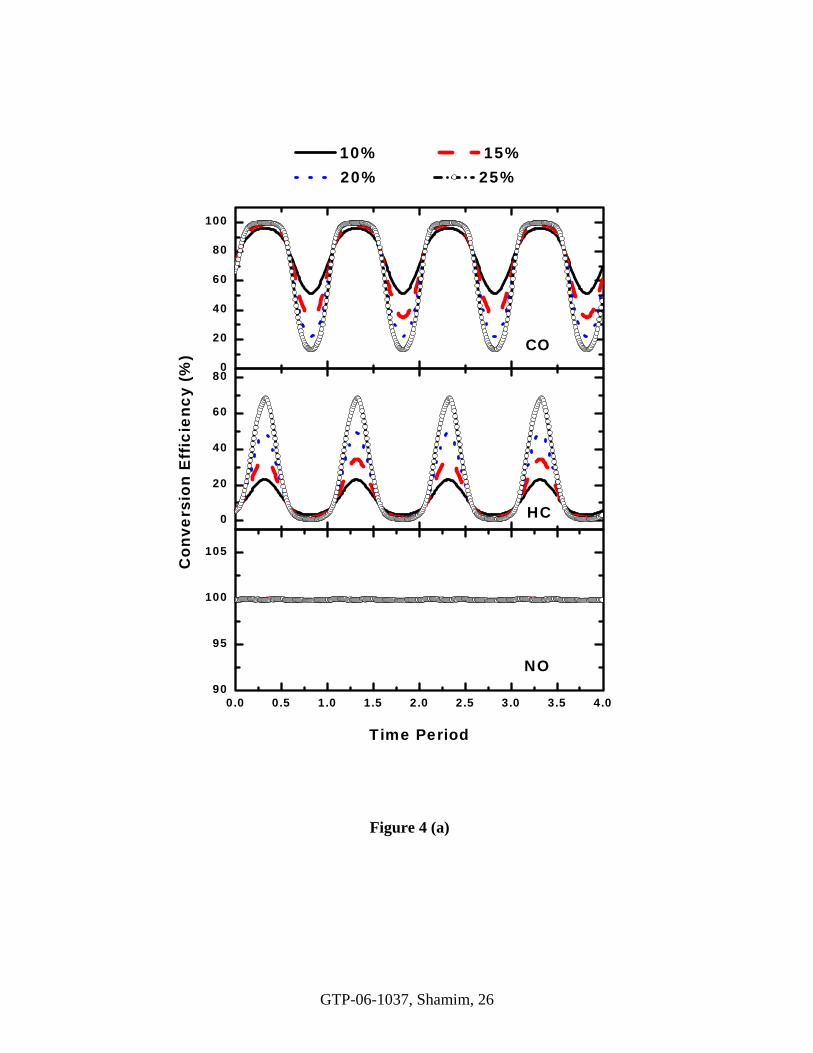
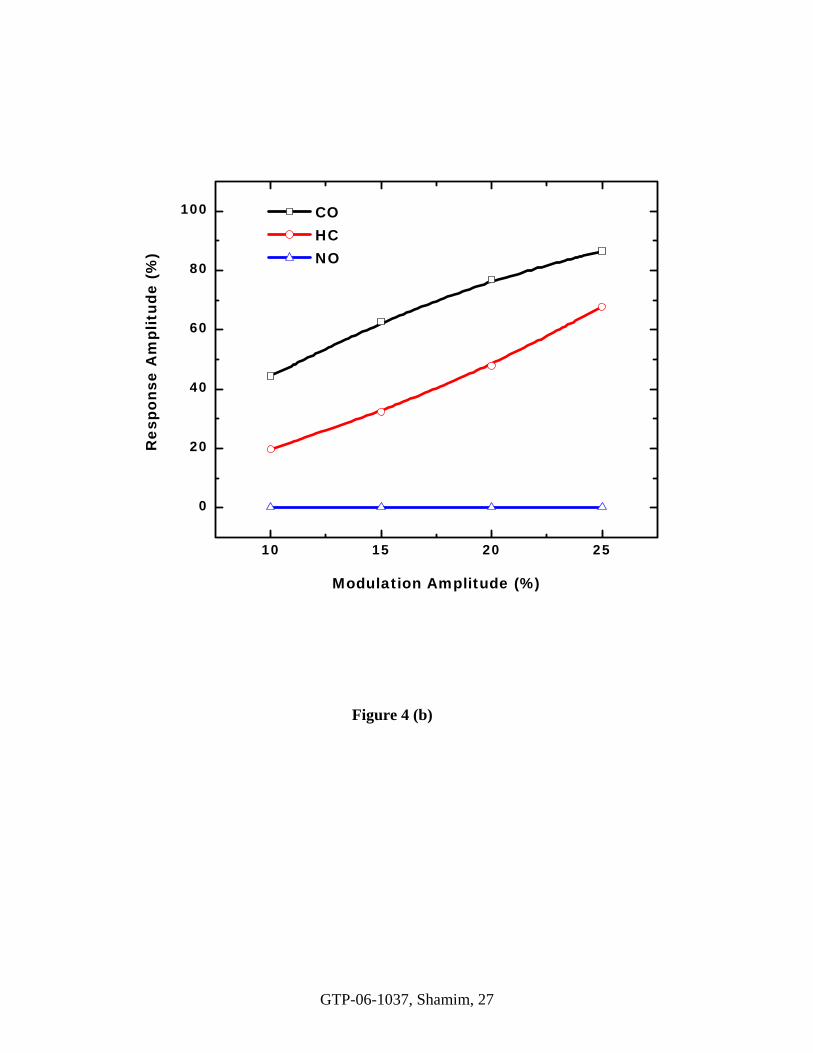
Figures 4(a) and 4(b) show the effect of imposed modulation amplitude on the
catalyst’s pollutant conversion performance. These figures depict the catalyst conversion
efficiencies as a function of oscillation time period for different amplitudes of exhaust gas
temperature modulations and the response amplitude as a function of the imposed modulation
amplitude. The results are for catalysts, which are operating at A/F of 14.7 and are subjected
to sinusoidal fluctuations in exhaust temperature of 0.01 Hz frequency. The results show that
the increase of oscillation amplitude increases the catalyst’s CO and HC conversion
responses. The NO conversion is not affected by any imposed modulation amplitude, and
remains high at 100%. For all imposed modulation amplitudes, the response amplitude of
CO conversion is the largest. However, the HC conversion is relatively more sensitive to the
changes in the imposed modulation amplitude, as indicated by a steeper slope of the HC
response amplitude curve in Figure 4(b). For all amplitudes, the catalyst response exhibits
steady periodic behavior. For the conditions studied, other than the response amplitude, the
fluctuation amplitude has insignificant influence on any other aspect of the catalyst response.
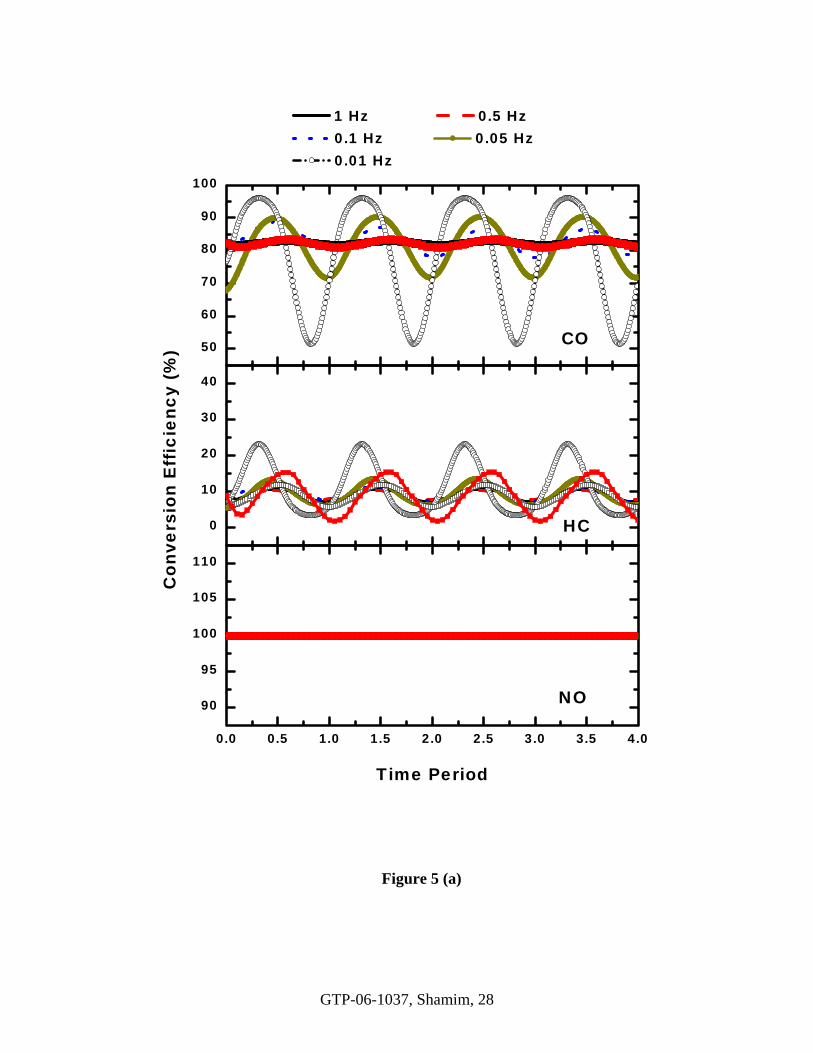
Effect of Modulation Frequency
Figure 5(a) presents the CO, HC, and NO conversion efficiencies as a function of
imposed modulation time period for different frequencies. All these results are for catalysts,
GTP-06-1037, Shamim, 10
initially operating at exhaust gas temperature of 600 K, and subjected to sinusoidal
modulation in exhaust gas temperature of 10% amplitude. The figure depicts, as expected,
that the catalyst response to imposed oscillation is large at low frequencies and its amplitude
decreases with an increase of the imposed frequency.
The decrease in catalyst response at high frequencies is attributed to progressively
greater neutralization of high frequency fluctuations by diffusion processes over the time
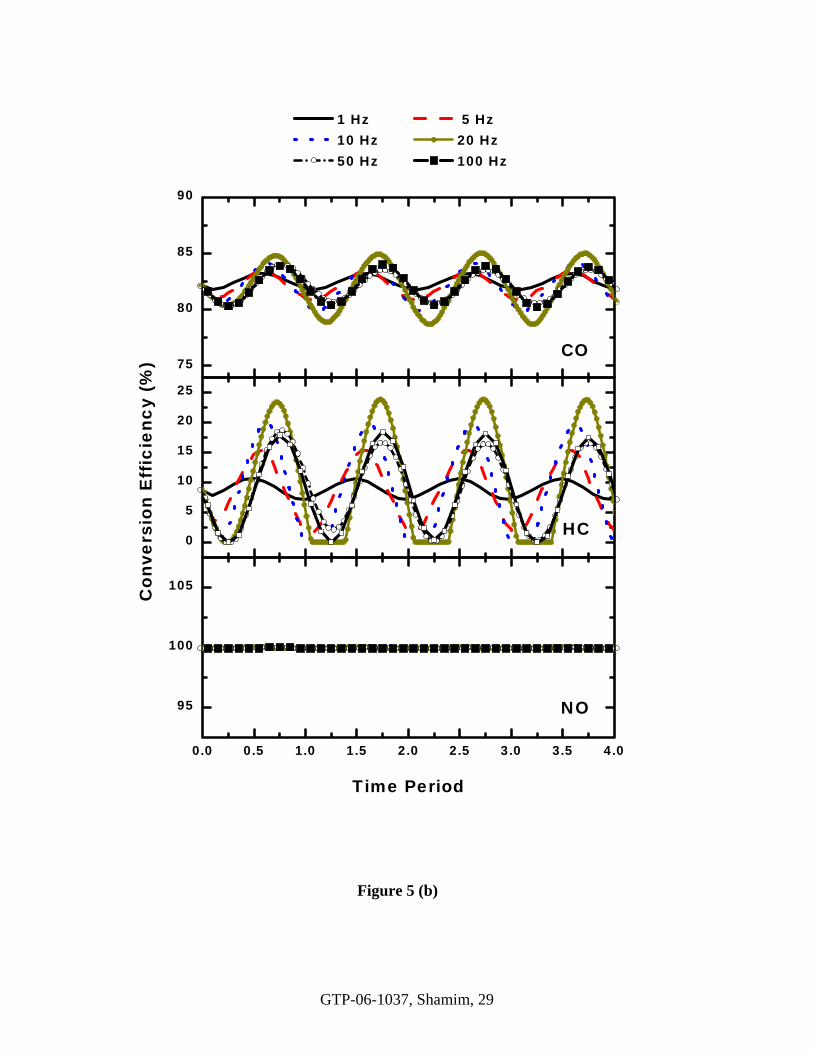
period required to convect them to the reaction sites. After reaching a minimum value, the
influence of frequency on the catalyst response is reversed and the catalyst response to the
imposed modulation starts increasing with an increase of frequency, as shown in Figure 5(b).
The figure shows that the trend of increasing catalyst response with increasing frequency
continues till 20 Hz. Beyond this value, the trend is again reversed and the response starts
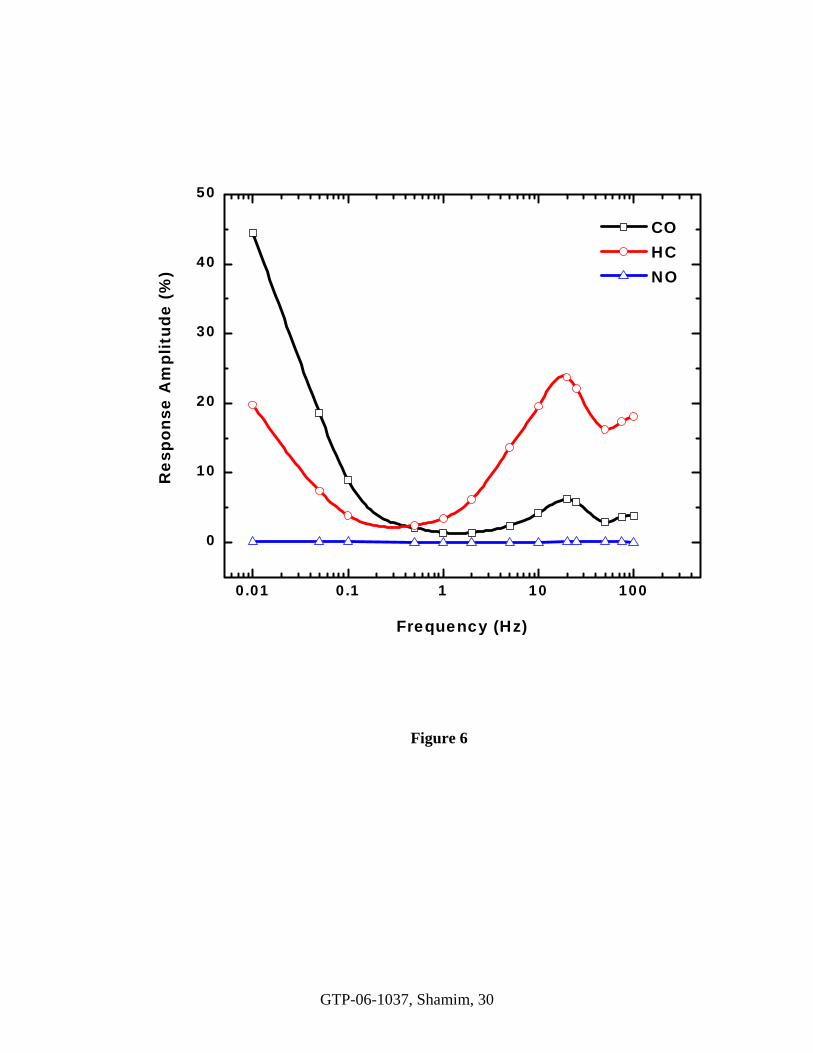
decreasing with increasing frequency till 50 Hz, followed by another reversal of trend.
The effect of frequency on the catalyst response can be better understood by plotting
the response amplitude as a function of the imposed frequency, as in Figure 6. The figure
clearly shows that the catalyst response to the imposed temperature modulations is
multimodal. This behavior is different from that caused by the imposed A/F and composition
modulations. In such cases, the response has been reported to be unimodal [11, 12]. This
may be explained by considering that the catalyst’s response to imposed modulations is
mainly determined by diffusion and kinetic processes. Each of these processes has a
different resonant frequency and is dominant in different frequency regimes. The diffusion
processes are generally dominant in the low frequency regime. With the increase of imposed
modulation frequency (the decrease of modulation time scale), the effect of diffusion
processes becomes smaller. At higher frequencies, the response is mainly determined by the
GTP-06-1037, Shamim, 11
kinetic effects. Compared to A/F and composition modulations, the temperature modulations
have stronger influence on kinetic effects and can invoke several response modes at high
frequency regimes resulting in a multimodal response.
Effect of Space Velocity
This section presents the effect of space velocity, which is defined as a ratio of the
gaseous volumetric flow rate at standard temperature and pressure and the volume of the
catalyst, on the catalyst’s response to exhaust gas temperature modulation. In this study, the
space velocity is varied by changing the inlet total gaseous mass flow rate while keeping the
mass flow rates of three major pollutants constant. The study investigates a range of space
velocities from 25,000 hr-1 to 150,000 hr-1, which corresponds to a total gaseous mass flow
rate range of 2.145x10⁻³ kg/s to 1.289x10⁻² kg/s. Since the mass flow rates of major pollutant
species (CO, HC and NO) are fixed, the variations in the space velocity and in the
corresponding total gaseous mass flow rate affect the molar concentrations of pollutant
species, which are different for different space velocity cases. For example, inlet molar
concentrations of pollutant species at 150,000 hr-1 are six times higher than those at 25,000
hr-1. Thus, there are two effects of an increase in space velocity on the pollutant conversion
performance: (i) a reduction in conversion performance owing to reduction is residence time;
and (ii) a variation in conversion performance owing to an increase in pollutant inlet molar
concentrations. The second effect depends on the catalyst operating condition and generally
increases the conversion performance [13]. Hence, the net effect of the variations in space
velocity is the result of these opposing effects.
GTP-06-1037, Shamim, 12
Figure 7 shows the results of the imposed modulation near stoichiometric conditions.
During the simulations, the A/F is set at 14.7 and the exhaust temperature (initially set at 600
K) is varied sinusoidally with a frequency of 0.01 Hz and amplitude of 10%. The
temperature ranges between 540 K and 660 K during each modulation time period. The
catalyst responds to temperature modulation with different amplitudes at different space
velocities.
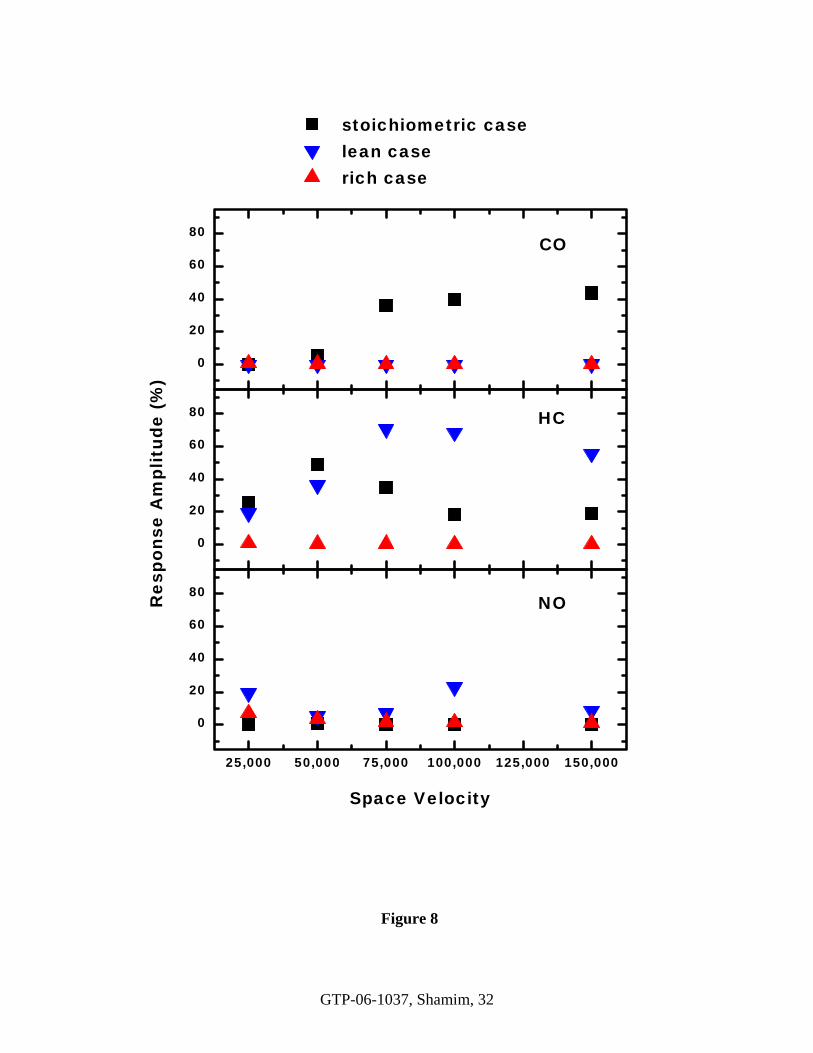
The results show that the temperature modulation has a strong effect on the catalyst
CO conversion at high space velocities, where the response amplitude is high and the
conversion efficiency fluctuates within a wide range. The response is generally smooth and
periodic. The response amplitude decreases with a decrease in space velocity (see Figure 8).
For 25,000 hr-1–50,000 hr-1, the response is negligible and the catalyst becomes insensitive to
the imposed modulation due to higher residence time.
The results show a significant effect of space velocity on the catalyst HC conversion
response to the imposed temperature modulation. The response amplitude increases with an
increase of space velocity up to 50,000 hr-1(see Figure 8). After reaching a maximum value,
the response amplitude decreases with increasing space velocity. The response is generally
periodic and smooth except at 50,000 hr-1 and 75,000 hr-1, where the response exhibits
somewhat unsmooth behavior, which is owing to numerical convergence problem. NO
conversion remains insensitive to the imposed temperature modulation for all values of space
velocities.
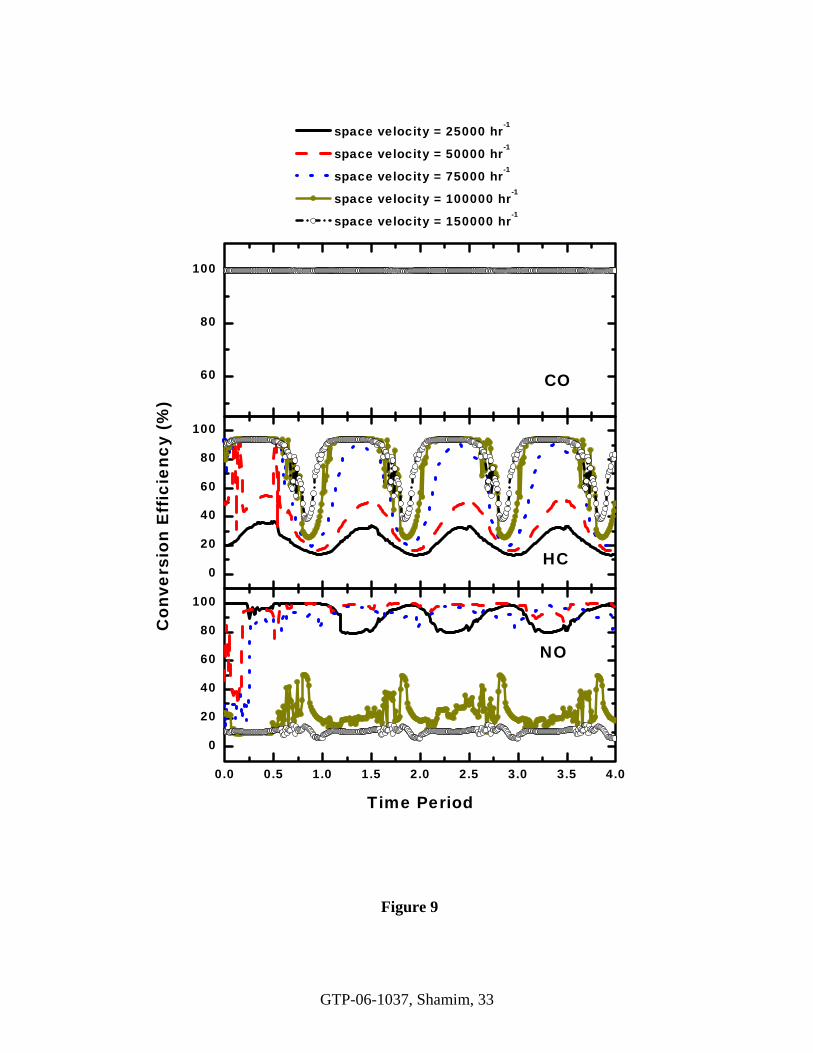
The effects of space velocity on the catalyst’s response to temperature modulation in
lean and rich regimes are presented next. The lean regime results, as shown in Figure 9, were
obtained by setting the A/F at 17.5. The catalyst is subjected to sinusoidal modulations in the
GTP-06-1037, Shamim, 13
temperature with a 0.01 Hz frequency and 10% amplitude. Under these conditions, the CO
conversion is very high (~ 100%) for all space velocities. The conversion is not affected by
temperature modulation at any value in the range of space velocities investigated. The HC
conversion is high at large space velocities. It decreases with a decrease in the space
velocity, which is owing to a corresponding decrease in the inlet molar concentration of HC.
The response amplitude increases with an increase of space velocity from 25,000 hr-1 to
75,000 hr-1 (see Figure 9). Beyond this range, the response amplitude decreases slightly with
an increase of the space velocity. The response is generally smooth and periodic.
Figure 9 shows that the space velocity also affects the NO conversion response to
imposed modulation under lean conditions. As expected, the NO conversion is low at high
space velocities and increases with a decrease of space velocity. The response amplitude is
also affected by the space velocity, but there is no continuous increasing or decreasing trend.
For the space velocity range investigated, the catalyst is most sensitive to the imposed
modulation at 100,000 hr-1. The response is generally unsmooth and non-periodic at several
space velocities.
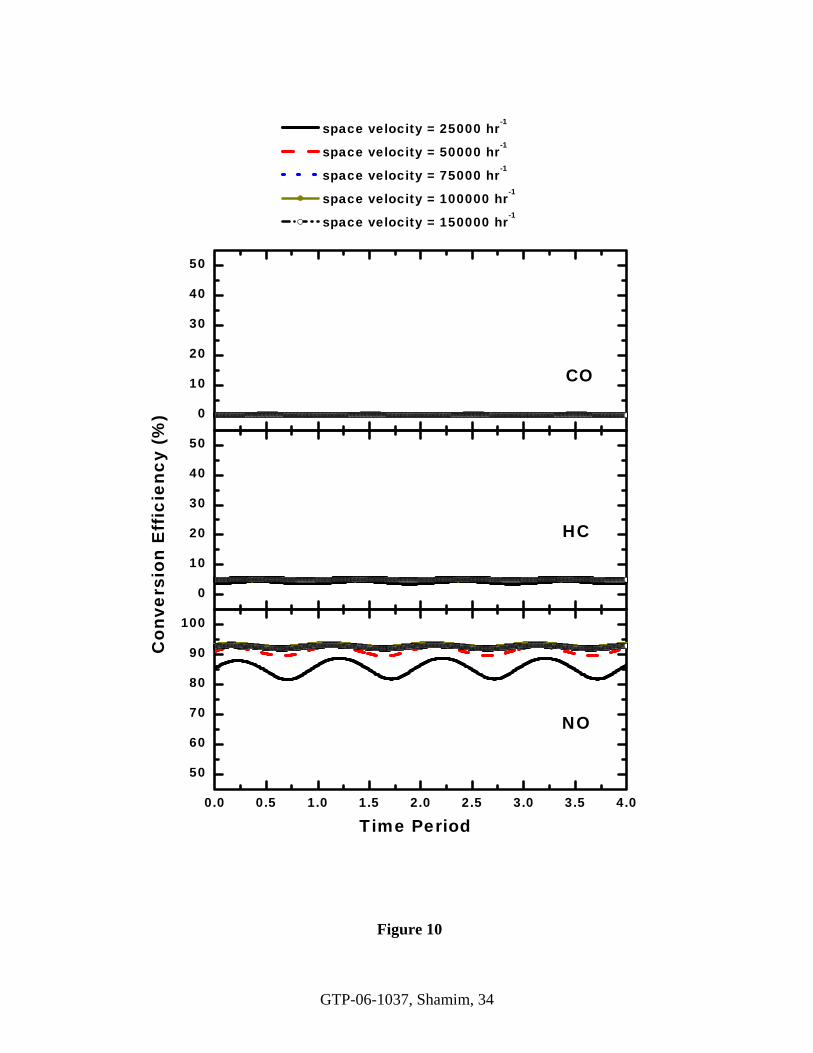
The rich regime results, as shown in Figure 10, were obtained by setting the A/F at
12.5. The catalyst is subjected to sinusoidal modulations in the temperature with a 0.01 Hz
frequency and 10% amplitude. Under rich conditions, the catalyst conversion performance is
relatively less sensitive to the imposed temperature modulation. Particularly, the CO and HC
conversions are insensitive and remain at their respective steady state values for all space
velocities. Under rich conditions, the NO conversion is high for all space velocities. The
small increase of NO conversion with an increase of space velocity is owing to the

GTP-06-1037, Shamim, 14
corresponding increase of the inlet molar concentration of NO. The NO conversion response
is low and decreases further with an increase of space velocity.
Comparison of Steady State and Transient Results
Figures 11–13 show comparisons of the influence of the space velocity on the catalyst
conversion performance under transient and steady state conditions. For the transient case,
the conversion efficiency shown represents the time-average conversion efficiency, which is
obtained by considering the cumulative pollutant species in and out of the catalyst during the
first 4 cycles.
Figure 11 shows the results near stoichiometric condition. The figure depicts that CO
and HC conversion efficiencies decrease with an increase of space velocity for both steady
state and transient cases. The NO conversion remains mostly unchanged at all space
velocities. The difference in conversion efficiencies of steady state and transient cases is
negligible at most of the space velocities. The modulations have a slightly negative effect on
the CO conversion and a slightly positive effect on the HC conversion.
The results of lean condition are plotted in Figure 12. For these conditions, the space
velocity does not have much influence on CO conversion, which remains high for both
steady state and transient cases. The effect of temperature modulation on the CO conversion
is also negligible for all space velocities. The HC conversion is high at higher space
velocities and decreases with a decrease in the space velocity for both steady state and
transient cases. This decrease is due to the corresponding decrease in the inlet molar
concentration of HC, which has a more dominant negative effect on HC conversion than the
opposing positive effect by an increase in the residence time. The lower HC conversion due
GTP-06-1037, Shamim, 15
to the corresponding increased availability of HC reductants improves the NO conversion at
low space velocities. For 50,000 hr-1 – 75,000 hr-1, the temperature modulation has a strong
positive effect on the NO conversion, which becomes negligibly small at higher space
velocities.
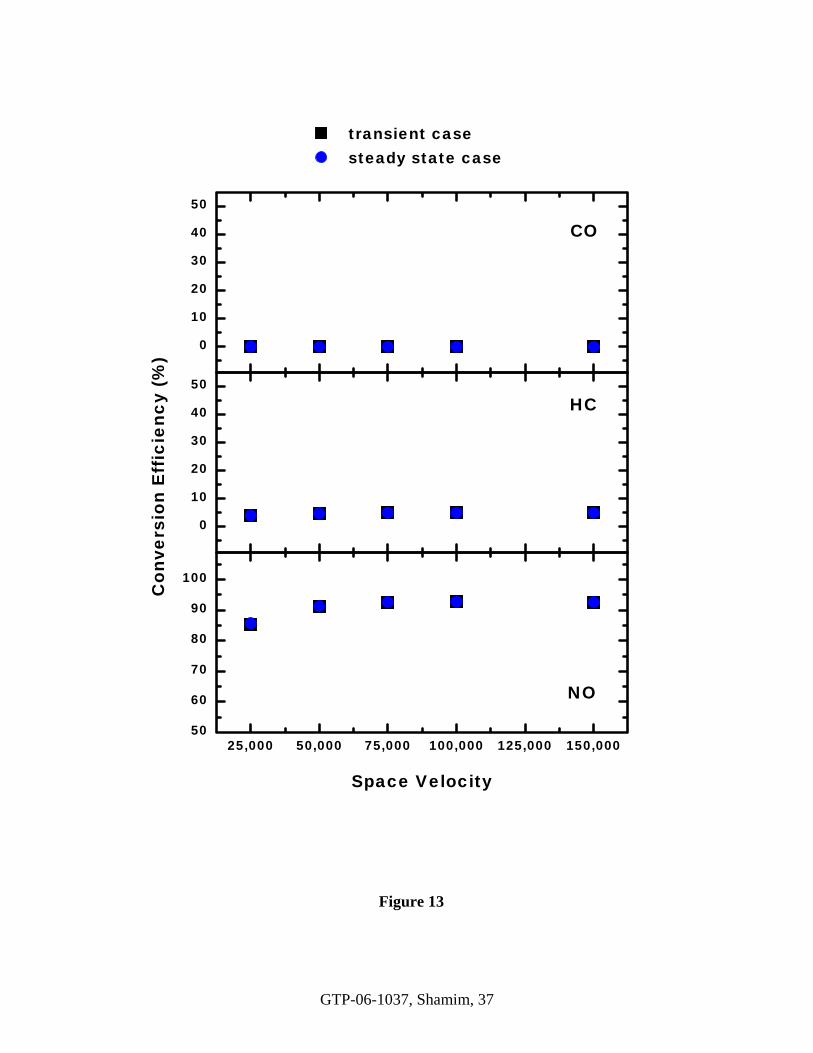
Figure 13 shows the comparison of the catalyst performance under rich conditions.
The results show that the temperature modulation has no appreciable influence on the
catalyst conversion performance for the investigated range of space velocities. At low space
velocities, NO conversion shows a slight increase with an increase of the space velocity,
which is due to corresponding increase of the inlet molar concentration of NO.
Conclusions
In this work, the influence of exhaust gas temperature on the catalyst dynamic
behavior was examined. The transient conditions were simulated by considering the catalyst
subjected to temporal modulation in exhaust gas temperature. The results led to the
following conclusions:
• Under exhaust gas temperature modulations, a three-way catalytic converter exhibits
a significant departure from its steady behavior. The departure is relatively
significant near stoichiometric conditions and for catalyst CO and HC conversion
performance. Near stoichiometric conditions, exhaust gas temperature modulations
result in a decrease of CO conversion and improve HC conversion. The effect on NO
conversion is insignificant.
• Under lean operating conditions, the temperature modulations result in a decrease of
HC conversion and have no significant effect on CO and NO conversions. The
GTP-06-1037, Shamim, 16
modulations also do not have any appreciable effect on conversion performance
under rich operating conditions.
• The effect of imposed modulation frequency on the catalyst’s behavior is multimodal.
At low frequencies, the catalyst’s response is large and its amplitude decreases with
an increase of the imposed frequency. After reaching a minimum value, the response
starts increasing with an increase of frequency. The trend reverses again after
reaching a maximum value. This behavior is different from that caused by the
imposed air-fuel ratio and composition modulations, which depict unimodal response.
• The space velocity significantly influences the catalyst response to the imposed
temperature modulation. The influence is greater at stoichiometric conditions and is
different for different pollutant species.
Acknowledgments
The financial support from the Ford Scientific Research Laboratory, Oak Ridge
National Laboratory and the Center for Engineering Education and Practice (CEEP) of the
University of Michigan-Dearborn is greatly appreciated.
References
[1] Silveston, P. L., 1995, “Automotive exhaust catalysis under periodic operation,”
Catalysis Today, 25, pp.175-195.
[2] Herz, R. K., 1987, “Dynamic behavior of automotive three-way emission control
system,” Catalysis and Automotive Pollution Control, Elsevier, Amsterdam, pp. 427-
444.

GTP-06-1037, Shamim, 17
[3] Herz, R. K., 1981 “Dynamic behavior of automotive catalysts: 1. Catalyst oxidation
and reduction,” Industrial and Engineering Chemistry Product Research and
Development, 20, pp. 451-457.
[4] Silveston, P. L., 1996 “Automotive exhaust catalysis: Is periodic operation
beneficial?,” Chemical Engineering Science, 51, pp. 2419-2426.
[5] Koltsakis, G. C. and Stamatelos, A. M., 1999, “Dynamic behavior issues in three-way
catalyst modeling,” AIChE Journal, 45, pp. 603-614.
[6] Van Neer, F. J. R., Kodde, A. J., Den Uil, H., and Bliek, A., 1996, “Understanding of
resonance phenomena on a catalyst under forced concentration and temperature
oscillations,” Canadian Journal of Chemical Engineering, 74, pp. 664–673.
[7] Brandner, J. J., Emig, G., Liauw, M. A., and Schubert, K., 2004, “Fast temperature
cycling in microstructure devices,” Chemical Engineering Journal, 101, pp. 217–224.
[8] Silveston, P. L., and Hudgins, R. R., 2004, “Periodic temperature forcing of catalytic
reactions,” Chemical Engineering Science, 59, pp. 4043–4053.
[9] Shamim, T., Shen, H., Sengupta, S., Son, S. and Adamczyk, A. A., 2002, “A
comprehensive model to predict three-way catalytic converter performance,” ASME
Journal of Engineering for Gas Turbines and Power, 124, pp. 421-428.
[10] Montreuil, C. N., Williams, S. C. and Adamczyk, A. A., 1992, “Modeling current
generation catalytic converters: Laboratory experiments and kinetic parameter
optimization – steady state kinetics”, SAE Paper No. 920096.
[11] Shamim, T. and Medisetty, V. C., 2003 “Dynamic response of automotive catalytic
converters to variations in air-fuel ratio,” ASME Journal of Engineering for Gas
Turbines and Power, 125, pp. 547-554.
GTP-06-1037, Shamim, 18
[12] Shamim, T., 2005, “Dynamic behavior of automotive catalytic converters subjected to
variations in engine exhaust compositions,” International Journal of Engine Research,
6, pp. 557-568.
[13] Shamim, T., 2005, “The effect of space velocity on the dynamic characteristics of an
automotive catalytic converter,” SAE Transactions – Journal of Fuels and Lubricants,
114(4), pp. 974-982.
GTP-06-1037, Shamim, 19
Figure Captions
Figure 1. Catalyst response to sinusoidal modulations in exhaust gas temperature near
stoichiometric operating conditions (A/F = 14.7, Mean exhaust temperature = 600
K, Frequency = 0.01 Hz, Amplitude = 10%)
Figure 2. Catalyst response to sinusoidal modulations in exhaust gas temperature under lean
operating conditions (A/F = 17.5, Mean exhaust temperature = 600 K, Frequency
= 0.01 Hz, Amplitude = 10%)
Figure 3. Catalyst response to sinusoidal modulations in exhaust gas temperature under rich
operating conditions (A/F = 12.5, Mean exhaust temperature = 600 K, Frequency
= 0.01 Hz, Amplitude = 10%)
Figure 4. Catalyst response to sinusoidal modulations in exhaust gas temperature: Effect of
modulation amplitudes on conversion efficiencies. (a) Conversion efficiencies as
a function of oscillation time period; (b) Catalyst response amplitude as a function
of the imposed modulation amplitude (A/F = 14.7, Mean exhaust temperature =
600 K, Frequency = 0.01 Hz)
Figure 5. Catalyst response to sinusoidal modulations in exhaust gas temperature: Effect of
modulation frequencies on conversion efficiencies. (a) Frequency range = 0.01 Hz
– 1 Hz; (b) Frequency range = 1 Hz – 100 Hz (A/F = 14.7, Mean exhaust
temperature = 600 K, Amplitude = 10%)
Figure 6. Catalyst response to sinusoidal modulations in exhaust gas temperature: Effect of
modulation frequencies on conversion response amplitudes (A/F = 14.7, Mean
exhaust temperature = 600 K, Amplitude = 10%)

GTP-06-1037, Shamim, 20
Figure 7. Catalyst response to sinusoidal modulations in exhaust gas temperature near
stoichiometric operating conditions for different space velocities (A/F = 14.7,
Mean exhaust temperature = 600 K, Frequency = 0.01Hz, Amplitude = 10%)
Figure 8. Catalyst response to sinusoidal modulations in exhaust gas temperature for
different space velocities (Mean exhaust temperature = 600 K, Frequency =
0.01Hz, Amplitude = 10%)
Figure 9. Catalyst response to sinusoidal modulations in exhaust gas temperature under lean
operating conditions for different space velocities (A/F = 17.5, Mean exhaust
temperature = 600 K, Frequency = 0.01Hz, Amplitude = 10%)
Figure 10. Catalyst response to sinusoidal modulations in exhaust gas temperature under rich
operating conditions for different space velocities (A/F = 12.5, Mean exhaust
temperature = 600 K, Frequency = 0.01Hz, Amplitude = 10%)
Figure 11. Catalyst conversion efficiency for different space velocities in steady state and
transient (exhaust gas temperature modulation) conditions: near stoichiometric
operating conditions (A/F = 14.7, Mean exhaust temperature = 600 K, Frequency
= 0.01 Hz, Amplitude = 10%)
Figure 12. Catalyst conversion efficiency for different space velocities in steady state and
transient (exhaust gas temperature modulation) conditions: under lean operating
conditions (A/F = 17.5, Mean exhaust temperature = 600 K, Frequency = 0.01 Hz,
Amplitude = 10%)
Figure 13. Catalyst conversion efficiency for different space velocities in steady state and
transient (exhaust gas temperature modulation) conditions: under rich operating

GTP-06-1037, Shamim, 21
conditions (A/F = 12.5, Mean exhaust temperature = 600 K, Frequency = 0.01 Hz,
Amplitude = 10%)
GTP-06-1037, Shamim, 22
Table 1 Comparison of time-average conversion efficiencies for
exhaust gas temperature modulations (Modulation amplitude = 10%,
Mean exhaust gas temperature = 600 K)
Frequency (Hz)
CO (%)
NO (%)
HC (%)
0.01 78.34 99.94 11.22
0.05 81.38 99.94 9.23
0.1 82.59 99.94 9.10
0.5 82.55 99.95 8.91
1 82.43 99.95 8.86
Stoichiometric (A/F = 14.7)
Steady state 82.1 99.90 8.71
0.01 99.86 5.64 83.82
0.05 99.90 5.83 89.95
0.1 99.92 5.22 91.55
0.5 99.91 4.59 92.04
1 99.91 4.56 92.03
Lean (A/F = 17.5)
Steady state 99.9 4.70 90.55
0.01 0.02 92.40 5.05
0.05 0.01 92.41 5.03
0.1 0.01 92.38 5.03
0.5 0.01 92.38 5.04
1 0.01 92.38 5.04
Rich (A/F = 12.5)
Steady state 0 92.40 5.04

GTP-06-1037, Shamim, 23
0
20
40
60
80
100
0
20
40
60
80
100
40
60
80
100
0.0 0.5 1.0 1.5 2.0 2.5 3.0 3.5 4.0520
560
600
640
680
720
CO
HC
Con
vers
ion
Eff
icie
ncy
(%)
NO
Gas temperature at the catalyst inlet
Catalyst's average bed temperature
Tem
pera
ture
(K
)
Time Period
Figure 1
GTP-06-1037, Shamim, 24
40
60
80
100
0
20
40
60
80
100
0
20
40
60
80
100
0.0 0.5 1.0 1.5 2.0 2.5 3.0 3.5 4.0520
560
600
640
680
720
0 1 2 3 40
5
10
15
CO
HC
Con
vers
ion
Eff
icie
ncy
(%)
NO
Gas temperature at the catalyst inlet
Catalyst's average bed temperature
Tem
pera
ture
(K
)
Time Period
Figure 2

GTP-06-1037, Shamim, 25
0
20
40
60
80
100
0
20
40
60
80
100
0
20
40
60
80
100
0.0 0.5 1.0 1.5 2.0 2.5 3.0 3.5 4.0520
560
600
640
680
720
0 1 2 3 490
92
94
CO
HC
Con
vers
ion
Eff
icie
ncy
(%)
NO
Gas temperature at the catalyst inlet
Catalyst's average bed temperature
Tem
pera
ture
(K
)
Time Period
Figure 3
GTP-06-1037, Shamim, 26
0
20
40
60
80
100
0
20
40
60
80
0.0 0.5 1.0 1.5 2.0 2.5 3.0 3.5 4.090
95
100
105
CO
10% 15% 20% 25%
HC
Con
vers
ion
Eff
icie
ncy
(%)
NO
Time Period
Figure 4 (a)
GTP-06-1037, Shamim, 27
10 15 20 25
0
20
40
60
80
100
Res
pons
e A
mpl
itud
e (%
)
Modulation Amplitude (%)
CO HC NO
Figure 4 (b)
GTP-06-1037, Shamim, 28
50
60
70
80
90
100
0
10
20
30
40
0.0 0.5 1.0 1.5 2.0 2.5 3.0 3.5 4.0
90
95
100
105
110
CO
1 Hz 0.5 Hz 0.1 Hz 0.05 Hz 0.01 Hz
HC
Con
vers
ion
Eff
icie
ncy
(%)
NO
Time Period
Figure 5 (a)
GTP-06-1037, Shamim, 29
75
80
85
90
0
5
10
15
20
25
0.0 0.5 1.0 1.5 2.0 2.5 3.0 3.5 4.0
95
100
105
CO
1 Hz 5 Hz 10 Hz 20 Hz 50 Hz 100 Hz
HC
Con
vers
ion
Eff
icie
ncy
(%)
NO
Time Period
Figure 5 (b)
GTP-06-1037, Shamim, 30
0.01 0.1 1 10 100
0
10
20
30
40
50
Res
pons
e A
mpl
itud
e (%
)
Frequency (Hz)
CO HC NO
Figure 6

GTP-06-1037, Shamim, 31
0
20
40
60
80
100
0
20
40
60
80
100
0.0 0.5 1.0 1.5 2.0 2.5 3.0 3.5 4.0
60
80
100
CO
space velocity = 25000 hr-1
space velocity = 50000 hr-1
space velocity = 75000 hr-1
space velocity = 100000 hr-1
space velocity = 150000 hr-1
HC
Con
vers
ion
Eff
icie
ncy
(%)
NO
Time Period
Figure 7
GTP-06-1037, Shamim, 32
0
20
40
60
80
0
20
40
60
80
25,000 50,000 75,000 100,000 125,000 150,000
0
20
40
60
80
CO
stoichiometric case lean case rich case
HC
Res
pons
e A
mpl
itud
e (%
)
NO
Space Velocity
Figure 8
GTP-06-1037, Shamim, 33
60
80
100
0
20
40
60
80
100
0.0 0.5 1.0 1.5 2.0 2.5 3.0 3.5 4.0
0
20
40
60
80
100
CO
space velocity = 25000 hr-1
space velocity = 50000 hr-1
space velocity = 75000 hr-1
space velocity = 100000 hr-1
space velocity = 150000 hr-1
HC
Con
vers
ion
Eff
icie
ncy
(%)
NO
Time Period
Figure 9
GTP-06-1037, Shamim, 34
0
10
20
30
40
50
0
10
20
30
40
50
0.0 0.5 1.0 1.5 2.0 2.5 3.0 3.5 4.0
50
60
70
80
90
100
CO
space velocity = 25000 hr-1
space velocity = 50000 hr-1
space velocity = 75000 hr-1
space velocity = 100000 hr-1
space velocity = 150000 hr-1
HC
Con
vers
ion
Eff
icie
ncy
(%)
NO
Time Period
Figure 10

GTP-06-1037, Shamim, 35
50
60
70
80
90
100
0
10
20
30
40
50
25,000 50,000 75,000 100,000 125,000 150,000
50
60
70
80
90
100
CO
transient case steady state case
HC
Con
vers
ion
Eff
icie
ncy
(%)
NO
Space Velocity
Figure 11

GTP-06-1037, Shamim, 36
50
60
70
80
90
100
0
20
40
60
80
100
25,000 50,000 75,000 100,000 125,000 150,0000
20
40
60
80
100
CO
transient case steady state case
HC
Con
vers
ion
Eff
icie
ncy
(%)
NO
Space Velocity
Figure 12
GTP-06-1037, Shamim, 37
0
10
20
30
40
50
0
10
20
30
40
50
25,000 50,000 75,000 100,000 125,000 150,00050
60
70
80
90
100
CO
transient case steady state case
HC
Con
vers
ion
Eff
icie
ncy
(%)
NO
Space Velocity
Figure 13
Copyright © 2022 FDOKUMEN