The effect of discrete calcium phosphate nanocrystals on bone-bonding to titanium surfaces
8
Biomaterials 28 (2007) 4748–4755 The effect of discrete calcium phosphate nanocrystals on bone-bonding to titanium surfaces Vanessa C. Mendes a,b , Rahim Moineddin c , John E. Davies a,b, a Institute of Biomaterials and Biomedical Engineering, University of Toronto, 164 College Street, Toronto, Ontario, Canada M5S 3G9 b Faculty of Dentistry, University of Toronto, 124 Edward Street, Toronto, Ontario, Canada M5G 1G6 c Department of Family and Community Medicine, Faculty of Medicine, University of Toronto, 263 McCaul Street, Toronto, Ontario, Canada M5T 1W7 Received 11 May 2007; accepted 2 July 2007 Available online 13 August 2007 Abstract We sought to address the question: Can metallic surfaces be rendered bone-bonding? We employed dual acid-etched (DAE) commercially pure titanium (cpTi) and titanium alloy (Ti6Al4V) custom-made rectangular coupons (1.3 mm 2.5 mm 4 mm) with, or without, further modification by the discrete crystalline deposition (DCD) of calcium phosphate (CAP) nanocrystals. A total of 48 implants comprising four groups were placed bilaterally in the distal femur of male Wistar rats for 9 days. After harvesting, the bone immediately proximal and distal to the implant was removed, resulting in a test sample comprising the implant with two attached cortical arches. The latter were distracted at 30 mm/min, in an Instron TM machine, and the disruption force was recorded. Results showed that alloy samples exhibited greater disruption forces than cpTi, and that DCD samples had statistically significantly greater average disruption forces than non-DCD samples. The bone-bonding phenomenon was visually evident by fracture of the cortical arches and an intact bone/implant interface. Field emission scanning electron microscopy showed the bone/implant interface was occupied by a bony cement line matrix that was interlocked with the surface topographical features of the implant. We conclude that titanium implant surfaces can be rendered bone-bonding by an increase in the complexity of the surface topography. r 2007 Published by Elsevier Ltd. Keywords: Bone-bonding; Titanium; Titanium alloy; Calcium phosphate; Mechanical test 1. Introduction Bone-bonding has been variously described in the literature [1–4] but only during the Second European Society of Biomaterials Conference in 1991 was it defined as ‘‘the establishment, by physico-chemical processes, of continuity between an implant and bone matrix’’ [5]. This phenomenon is usually associated with the so-called ‘‘bioactive’’ materials such as calcium phosphates (CAPs) and bioactive glasses [6], and is characterized by an interfacial bond, which exceeds the cohesive strength of either bone tissue or implant [3]. Thus, bone-bonding is visually demonstrated by the failure of the implant and/or bone tissue and the presence of an intact bone–implant interface after mechanical disruption forces (torque, shear or tensile) are applied [4,7]. The concept of a chemical interaction to explain the bone-bonding phenomenon has been widely accepted [1–3,8,9]. Indeed, Takatsuka et al. [9] defined chemical bonding as an atomic continuity, which can transmit all types of forces. Nevertheless, there is little experimental evidence to support this chemical theory of bone-bonding. Tracy and Doremus [10] and Bonfield and Luklinska [11] have used high-resolution transmission electron microscopy (HRTEM) to investigate lattice fringes at the interface of bone with hydroxyapatite (HA) surfaces. They showed a continuum 8.17 A ˚ spacing of lattice fringe patterns from CAP implant materials to a second surface CAP phase, but failed to definitively identify the latter as bone. Experimental evidence has also emerged to indicate that the mechanism of bone-bonding is one of micro-mechanical ARTICLE IN PRESS www.elsevier.com/locate/biomaterials 0142-9612/$ - see front matter r 2007 Published by Elsevier Ltd. doi:10.1016/j.biomaterials.2007.07.020 Corresponding author. Institute of Biomaterials and Biomedical Engineering, University of Toronto, 164 College Street, Toronto, Ontario, Canada M5S 3G9. Tel.: +1 416 978 1471; fax: +1 416 946 5639. E-mail address: [email protected] (J.E. Davies).
-
Upload
independent -
Category
Documents
-
view
2 -
download
0
Transcript of The effect of discrete calcium phosphate nanocrystals on bone-bonding to titanium surfaces

ARTICLE IN PRESS
0142-9612/$ - se
doi:10.1016/j.bi
�CorrespondEngineering, U
Canada M5S 3
E-mail addr
Biomaterials 28 (2007) 4748–4755
www.elsevier.com/locate/biomaterials
The effect of discrete calcium phosphate nanocrystalson bone-bonding to titanium surfaces
Vanessa C. Mendesa,b, Rahim Moineddinc, John E. Daviesa,b,�
aInstitute of Biomaterials and Biomedical Engineering, University of Toronto, 164 College Street, Toronto, Ontario, Canada M5S 3G9bFaculty of Dentistry, University of Toronto, 124 Edward Street, Toronto, Ontario, Canada M5G 1G6
cDepartment of Family and Community Medicine, Faculty of Medicine, University of Toronto, 263 McCaul Street, Toronto, Ontario, Canada M5T 1W7
Received 11 May 2007; accepted 2 July 2007
Available online 13 August 2007
Abstract
We sought to address the question: Can metallic surfaces be rendered bone-bonding? We employed dual acid-etched (DAE)
commercially pure titanium (cpTi) and titanium alloy (Ti6Al4V) custom-made rectangular coupons (1.3mm� 2.5mm� 4mm) with, or
without, further modification by the discrete crystalline deposition (DCD) of calcium phosphate (CAP) nanocrystals. A total of 48
implants comprising four groups were placed bilaterally in the distal femur of male Wistar rats for 9 days. After harvesting, the bone
immediately proximal and distal to the implant was removed, resulting in a test sample comprising the implant with two attached cortical
arches. The latter were distracted at 30mm/min, in an InstronTM machine, and the disruption force was recorded. Results showed that
alloy samples exhibited greater disruption forces than cpTi, and that DCD samples had statistically significantly greater average
disruption forces than non-DCD samples. The bone-bonding phenomenon was visually evident by fracture of the cortical arches and an
intact bone/implant interface. Field emission scanning electron microscopy showed the bone/implant interface was occupied by a bony
cement line matrix that was interlocked with the surface topographical features of the implant. We conclude that titanium implant
surfaces can be rendered bone-bonding by an increase in the complexity of the surface topography.
r 2007 Published by Elsevier Ltd.
Keywords: Bone-bonding; Titanium; Titanium alloy; Calcium phosphate; Mechanical test
1. Introduction
Bone-bonding has been variously described in theliterature [1–4] but only during the Second EuropeanSociety of Biomaterials Conference in 1991 was it definedas ‘‘the establishment, by physico-chemical processes, ofcontinuity between an implant and bone matrix’’ [5]. Thisphenomenon is usually associated with the so-called‘‘bioactive’’ materials such as calcium phosphates (CAPs)and bioactive glasses [6], and is characterized by aninterfacial bond, which exceeds the cohesive strength ofeither bone tissue or implant [3]. Thus, bone-bonding isvisually demonstrated by the failure of the implant and/or
e front matter r 2007 Published by Elsevier Ltd.
omaterials.2007.07.020
ing author. Institute of Biomaterials and Biomedical
niversity of Toronto, 164 College Street, Toronto, Ontario,
G9. Tel.: +1416 978 1471; fax: +1 416 946 5639.
ess: [email protected] (J.E. Davies).
bone tissue and the presence of an intact bone–implantinterface after mechanical disruption forces (torque, shearor tensile) are applied [4,7].The concept of a chemical interaction to explain the
bone-bonding phenomenon has been widely accepted[1–3,8,9]. Indeed, Takatsuka et al. [9] defined chemicalbonding as an atomic continuity, which can transmit alltypes of forces. Nevertheless, there is little experimentalevidence to support this chemical theory of bone-bonding.Tracy and Doremus [10] and Bonfield and Luklinska [11]have used high-resolution transmission electron microscopy(HRTEM) to investigate lattice fringes at the interface ofbone with hydroxyapatite (HA) surfaces. They showed acontinuum 8.17 A spacing of lattice fringe patterns fromCAP implant materials to a second surface CAP phase, butfailed to definitively identify the latter as bone.Experimental evidence has also emerged to indicate that
the mechanism of bone-bonding is one of micro-mechanical
ARTICLE IN PRESSV.C. Mendes et al. / Biomaterials 28 (2007) 4748–4755 4749
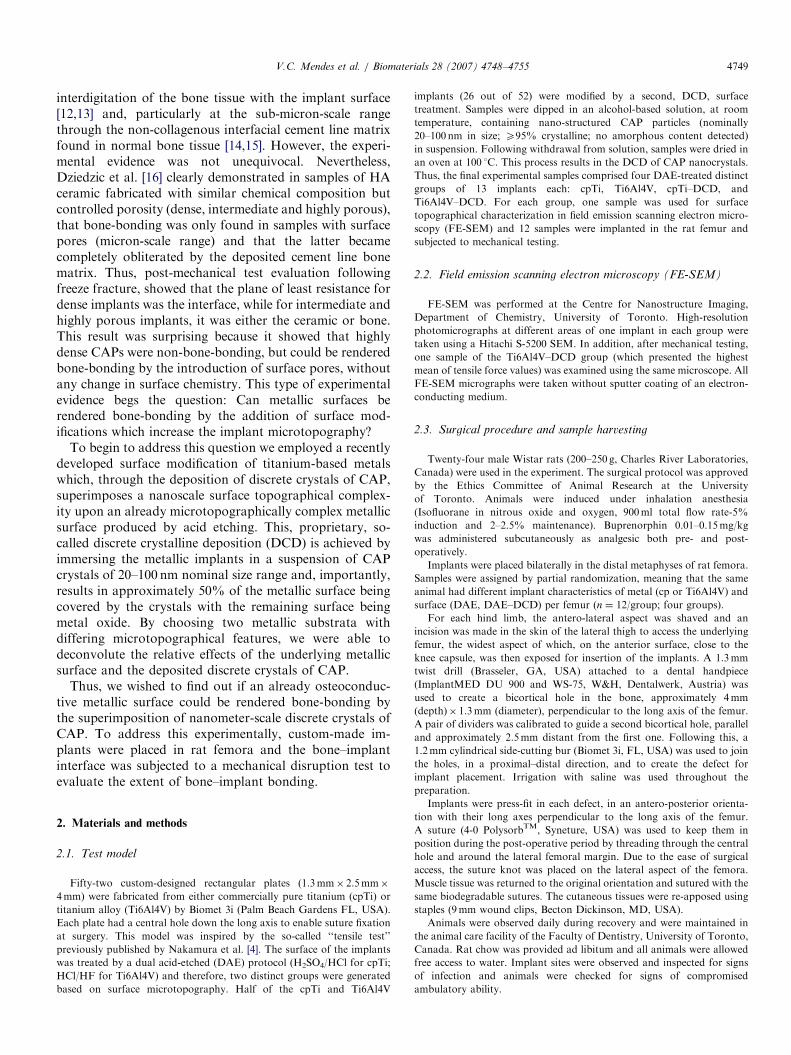
interdigitation of the bone tissue with the implant surface[12,13] and, particularly at the sub-micron-scale rangethrough the non-collagenous interfacial cement line matrixfound in normal bone tissue [14,15]. However, the experi-mental evidence was not unequivocal. Nevertheless,Dziedzic et al. [16] clearly demonstrated in samples of HAceramic fabricated with similar chemical composition butcontrolled porosity (dense, intermediate and highly porous),that bone-bonding was only found in samples with surfacepores (micron-scale range) and that the latter becamecompletely obliterated by the deposited cement line bonematrix. Thus, post-mechanical test evaluation followingfreeze fracture, showed that the plane of least resistance fordense implants was the interface, while for intermediate andhighly porous implants, it was either the ceramic or bone.This result was surprising because it showed that highlydense CAPs were non-bone-bonding, but could be renderedbone-bonding by the introduction of surface pores, withoutany change in surface chemistry. This type of experimentalevidence begs the question: Can metallic surfaces berendered bone-bonding by the addition of surface mod-ifications which increase the implant microtopography?
To begin to address this question we employed a recentlydeveloped surface modification of titanium-based metalswhich, through the deposition of discrete crystals of CAP,superimposes a nanoscale surface topographical complex-ity upon an already microtopographically complex metallicsurface produced by acid etching. This, proprietary, so-called discrete crystalline deposition (DCD) is achieved byimmersing the metallic implants in a suspension of CAPcrystals of 20–100 nm nominal size range and, importantly,results in approximately 50% of the metallic surface beingcovered by the crystals with the remaining surface beingmetal oxide. By choosing two metallic substrata withdiffering microtopographical features, we were able todeconvolute the relative effects of the underlying metallicsurface and the deposited discrete crystals of CAP.
Thus, we wished to find out if an already osteoconduc-tive metallic surface could be rendered bone-bonding bythe superimposition of nanometer-scale discrete crystals ofCAP. To address this experimentally, custom-made im-plants were placed in rat femora and the bone–implantinterface was subjected to a mechanical disruption test toevaluate the extent of bone–implant bonding.
2. Materials and methods
2.1. Test model
Fifty-two custom-designed rectangular plates (1.3mm� 2.5mm�
4mm) were fabricated from either commercially pure titanium (cpTi) or
titanium alloy (Ti6Al4V) by Biomet 3i (Palm Beach Gardens FL, USA).
Each plate had a central hole down the long axis to enable suture fixation
at surgery. This model was inspired by the so-called ‘‘tensile test’’
previously published by Nakamura et al. [4]. The surface of the implants
was treated by a dual acid-etched (DAE) protocol (H2SO4/HCl for cpTi;
HCl/HF for Ti6Al4V) and therefore, two distinct groups were generated
based on surface microtopography. Half of the cpTi and Ti6Al4V
implants (26 out of 52) were modified by a second, DCD, surface
treatment. Samples were dipped in an alcohol-based solution, at room
temperature, containing nano-structured CAP particles (nominally
20–100 nm in size; X95% crystalline; no amorphous content detected)
in suspension. Following withdrawal from solution, samples were dried in
an oven at 100 1C. This process results in the DCD of CAP nanocrystals.
Thus, the final experimental samples comprised four DAE-treated distinct
groups of 13 implants each: cpTi, Ti6Al4V, cpTi–DCD, and
Ti6Al4V–DCD. For each group, one sample was used for surface
topographical characterization in field emission scanning electron micro-
scopy (FE-SEM) and 12 samples were implanted in the rat femur and
subjected to mechanical testing.
2.2. Field emission scanning electron microscopy (FE-SEM)
FE-SEM was performed at the Centre for Nanostructure Imaging,
Department of Chemistry, University of Toronto. High-resolution
photomicrographs at different areas of one implant in each group were
taken using a Hitachi S-5200 SEM. In addition, after mechanical testing,
one sample of the Ti6Al4V–DCD group (which presented the highest
mean of tensile force values) was examined using the same microscope. All
FE-SEM micrographs were taken without sputter coating of an electron-
conducting medium.
2.3. Surgical procedure and sample harvesting
Twenty-four male Wistar rats (200–250 g, Charles River Laboratories,
Canada) were used in the experiment. The surgical protocol was approved
by the Ethics Committee of Animal Research at the University
of Toronto. Animals were induced under inhalation anesthesia
(Isofluorane in nitrous oxide and oxygen, 900ml total flow rate-5%
induction and 2–2.5% maintenance). Buprenorphin 0.01–0.15mg/kg
was administered subcutaneously as analgesic both pre- and post-
operatively.
Implants were placed bilaterally in the distal metaphyses of rat femora.
Samples were assigned by partial randomization, meaning that the same
animal had different implant characteristics of metal (cp or Ti6Al4V) and
surface (DAE, DAE–DCD) per femur (n ¼ 12/group; four groups).
For each hind limb, the antero-lateral aspect was shaved and an
incision was made in the skin of the lateral thigh to access the underlying
femur, the widest aspect of which, on the anterior surface, close to the
knee capsule, was then exposed for insertion of the implants. A 1.3mm
twist drill (Brasseler, GA, USA) attached to a dental handpiece
(ImplantMED DU 900 and WS-75, W&H, Dentalwerk, Austria) was
used to create a bicortical hole in the bone, approximately 4mm
(depth)� 1.3mm (diameter), perpendicular to the long axis of the femur.
A pair of dividers was calibrated to guide a second bicortical hole, parallel
and approximately 2.5mm distant from the first one. Following this, a
1.2mm cylindrical side-cutting bur (Biomet 3i, FL, USA) was used to join
the holes, in a proximal–distal direction, and to create the defect for
implant placement. Irrigation with saline was used throughout the
preparation.
Implants were press-fit in each defect, in an antero-posterior orienta-
tion with their long axes perpendicular to the long axis of the femur.
A suture (4-0 PolysorbTM, Syneture, USA) was used to keep them in
position during the post-operative period by threading through the central
hole and around the lateral femoral margin. Due to the ease of surgical
access, the suture knot was placed on the lateral aspect of the femora.
Muscle tissue was returned to the original orientation and sutured with the
same biodegradable sutures. The cutaneous tissues were re-apposed using
staples (9mm wound clips, Becton Dickinson, MD, USA).
Animals were observed daily during recovery and were maintained in
the animal care facility of the Faculty of Dentistry, University of Toronto,
Canada. Rat chow was provided ad libitum and all animals were allowed
free access to water. Implant sites were observed and inspected for signs
of infection and animals were checked for signs of compromised
ambulatory ability.

ARTICLE IN PRESSV.C. Mendes et al. / Biomaterials 28 (2007) 4748–47554750
2.4. Euthanasia, sample harvesting and preparation
Euthanasia was achieved at 9 days post-operatively by cervical
dislocation after CO2 exposure. Femora were harvested and stored in a
15% sucrose buffer solution for about 3h, during preparation for the
mechanical testing. The bone was trimmed to the width of the implants using
a cylindrical diamond bur (Brasseler, GA, USA) connected to a highspeed
system (Handpiece: KaVo Dental Corporation, IL, USA; Handpiece
control: DCI International, OR, USA). Care was taken to remove all bone
attached to the sides of the implant. Samples prepared for mechanical test
consisted of two arches of bone attached to each side of the implants.
2.5. Mechanical testing
Forty-eight samples (96 arches), comprising 24 arches of bone of each
group were assigned for mechanical test. The mechanical test consisted of a
tensile test performed in an InstronTM testing machine (model 8501) at the
Mechanical Testing Laboratory, Institute of Biomaterials and Biomedical
Engineering, University of Toronto, Canada. Immediately before the test,
nylon lines (Red Wolf fishing line, 4.5 kg (10 lb) IA, USA) were passed
through the marrow space of each arch of bone. The implant was secured in
a vice attached to the InstronTM machine, and each end of each nylon line
was attached, in turn, to a frame in the InstronTM machine. The tensile force
to rupture the sample was recorded at a crosshead speed of 30mm/min. For
each implant, force/displacement results were generated. Both the lateral and
medial sides of the femur were subjected to the test. Samples were then
stored in Karnovsky’s fixative at 4 1C.
After fixation, samples were immersed in a solution of 3% sodium
hypochlorite for 20min, washed in tap water, dehydrated in serial
concentrations of ethanol (50, 70, 95, 100, 100% v/v) for 2 days and
finally, critical point dried in preparation for FE-SEM (as above).
2.6. Statistical analysis
For statistical analysis, each disruption force value was categorized as
‘0N’, ‘1–5N’ and ‘45N’ and their frequencies were plotted for each
control and DCD group. Thus, these frequencies showed the probability
of observing each category of tensile force for each group.
Multinomial logistic regression analysis was used for comparison of the
distributions of tensile force categories among non-DCD groups and
repeated measurement analysis of variance was employed to compare the
means of the tensile force between DCD groups. The generalized estimation
equations (GEEs) method was used to analyze correlated measurements and
for group comparison. A box plot of tensile force values for all groups was
presented for visual assessment and comparison of distributions. Data was
analyzed by the statistical software SAS 9.1 (SAS Institute Inc., NC, USA)
and p-values less than 0.05 were considered significant.
3. Results
The post-operative period was uneventful for mostanimals except one that had a fractured femur, and thissample was excluded from the study. Six animals held uptheir legs during the first 2 or 3 post-operative days due toedema, which soon resolved and was not considered aserious problem, and were thus not excluded from thestudy. No other deviations from normal were observedduring the post-operative period.
3.1. The implant surfaces
Fig. 1 shows FE-SEM photomicrographs of samples ofcpTi and Ti6Al4V. While the differences in surface
topography were evident at low magnifications (Figs. 1Aand G), the DCD treatment of the respective surfaces wasonly visualized at relatively high magnifications due to the20–100nm scale range of these features (Figs. 1E, F and K, L).The topography of the non-DCD implant surfaces withinthe craters, formed through the acid etching, hadalmost no features at a sub-micron-scale range at theresolution limit of the microscope (Figs. 1C and I). Ofparticular importance were the undercuts evident in the2-phase alloy (a+b phase) surface structure, which wereaccentuated by electron charging (or ‘‘snowing’’) since thesamples were examined without the sputtering of anelectron conduction medium (Figs. 1G and H). Thus,while the cpTi surface showed features of larger size in thevertical dimension i.e. peak to valley height, the alloysurface with its smaller peak to valley dimensions was morecomplex due to the presence of these undercuts. At highermagnifications, the sub-micron sized CAP crystals could beclearly visualized although, due to both the scant coverageand the difference in scale between the CAP crystals andthe underlying metal topography, the original acid-etchedsurface features were readily distinguishable from thenanoscale topography created by the presence of thecrystals (Figs. 1F and L). What is also obvious fromFigs. 1F and L is that the CAP was not present as acontinuous coating on the underlying metal surface, butrather as a distinct particulate which increased thetopographic complexity at the sub-micron scale whencompared to the untreated surfaces.
3.2. Mechanical test and statistical analysis
Two samples broke while being attached to theInstronTM machine and were excluded of the study. Froma total of 96 arches, 64 were tested and 32 (16 cpTi, 2cpTi–DCD, 12 Ti6Al4V, 2 Ti6Al4V–DCD) fell off theimplant during preparation and therefore their test datawere recorded as zero. During mechanical testing, non-DCD samples were easily detached from the implantsurface without any, or minimum, damage to the bonestructure. Also, the detachment force related to thosesamples was recorded as a much lower value compared toDCD samples. On the contrary, when DCD samples weretested, resistance to detachment resulted in fracture of thebone tissue as opposed to failure at the interface. Somearches fractured in multiple pieces and, for the majority ofDCD samples, bone tissue was always observed attached tothe surface of the implant (Figs. 2B and D).The distribution of tensile forces as categorical measures
for all groups is shown in Fig. 3. Clearly, DCD groups hadsignificantly more tensile force values greater than 5N incomparison to non-DCD groups; while the percentage ofzero force values for non-DCD groups was larger. Tensileforce values for group cpTi were zero for more than 70%of samples, whereas for group Ti6Al4V, the percentage ofzero tensile force values was 48%. Multinomial logisticregression analysis was used for comparison of the

ARTICLE IN PRESS
Fig. 1. Field emission SEM micrographs of the implant surfaces at different magnifications. (A–C and D–F): cpTi samples and (G–I and J–L): Ti6Al4V
samples. The low magnification images (A) and (G) are of non-DCD-treated samples to show the general microtopography of the metallic surfaces. Note
that the vertical (z-axis) features of the cpTi (A) are greater in size than those of the Ti6Al4V (G). These samples were not coated with an electron-
conducting medium prior to SEM examination; thus more ‘‘snowing’’ is occurring in (G and H) due to the undercuts in this surface. At this magnification
it would not be possible to visualize the DCD crystals (not shown) on DCD-treated samples (D and J). (E) and (K) are DCD-treated surfaces at higher
magnification where the DCD treatment is immediately obvious on both the cpTi and Ti6Al4V surface, adding to the microtopographic complexity of the
surfaces. The discrete single crystals of the DCD treatments are seen even more clearly in (F) and (L), at different magnifications, on the cpTi and Ti6Al4V
surfaces, respectively. Field Widths (A, D, G, J) ¼ 14mm; (B, E, H, K) ¼ 2.5 mm; (C, F, I, L) ¼ 800 nm.
V.C. Mendes et al. / Biomaterials 28 (2007) 4748–4755 4751
distributions of tensile force categories among non-DCDgroups. There were no significant differences within non-DCD groups (p ¼ 0.5517), legs (left and right, p ¼ 0.2829),and arches (lateral and medial, p ¼ 0.5671). However,while we note that it is not appropriate, statistically, tocompare the means of tensile force values for non-DCDgroups, because of the non-normality in the distributionand the very large proportion of zero values in each group,
the trends towards higher values in the alloy with respect tothe cpTi samples is of interest and reflects the differences intopography noted above.The statistical analysis of DCD groups showed the
distribution of tensile force values was not severely skewed.A Shapiro–Wilk test for normality demonstrated that thedistribution of values for group Ti6Al4V–DCD wasnormal (p ¼ 0.3414) and deviation of normality for group

ARTICLE IN PRESS
Fig. 2. Samples before (A) and after (B–D) the tensile test. (A) Sample following dissection from the rat femur with two arches of femoral cortex still
attached (and being held with forceps). A nylon line has been passed through the medullary cavity of the upper cortical arch in preparation for mechanical
testing. (C) Following the mechanical test both cortical arches remain on the implant, but have been fractured. In bone-bonded samples, the position of
fracture was highly variable (compare (C) and (D)), but obviously different from those samples where bonding did not occur, as seen in (B) which is a
Ti6Al4V implant. (D) Ti6Al4V–DCD implant after mechanical test showing bone bonded to the implant surface. In (B, D) the sample was positioned for
photography using a metal pin seen passing through the central hole in the implants in these images (left to right). The extent of bone coverage in (D) is
extensive with varying thicknesses of, essentially, trabecular bone remaining bonded to the underlying implant surface. Field widths (A) ¼ 9.6mm;
(C) ¼ 6.4mm; (B, D) ¼ 4.7mm.
V.C. Mendes et al. / Biomaterials 28 (2007) 4748–47554752
cpTi–DCD was not severe (p ¼ 0.0115). Repeated mea-surement analysis of variance was used to compare themeans of tensile force values between DCD groups. Therewere no significant differences between left and right legs(p ¼ 0.5682) and between lateral and medial arches(p ¼ 0.2631). However, the groups were not statisticallythe same. The average of tensile force values forTi6Al4V–DCD was 11.3N and for cpTi–DCD was 7.2N.The mean of tensile force values for Ti6Al4V–DCD wassignificantly higher than for cpTi–DCD (p ¼ 0.0068).
3.3. Examination of the interface
FE-SEM micrographs showing the ultrastructure of thebone–implant interface following mechanical testing of aTi6Al4V–DCD detached sample are presented in Fig. 4.Collagenous bone matrix, which remained on the surfaceof the implant after the mechanical disruption test is seen inFig. 4A (left). However, it was only by examining theinterface at higher magnifications that the biological matrixoccupying the interface could be visualized (Figs. 4B andC). This comprised a mass of needle-shaped crystallite-likebodies in seemingly random orientations with respect to
the underlying implant surface. We have previouslyidentified such crystallites as marking the initial inorganicphase of the bony cement line found in both normal boneremodeling sites and at implant surfaces exhibiting contactosteogenesis. Figs. 4B and C show that these crystallites areeasily distinguished, by both their smaller size andorientation, from the underlying DCD crystals of theimplant surface. But, importantly, these images alsodemonstrate that the DCD CAP crystals were indistin-guishable in size, shape and distribution from those seen inthe ‘‘as-received’’ images in Fig. 1, and thus had remainedunchanged during the 9-day experimental period. Withinthe boundary of the cement line crystallites, a few DCDCAP crystals could still be observed (Fig. 4C), but as thestructure of the former becomes thicker and denser, theDCD crystals were completely embedded beneath thisbiological matrix.
4. Discussion
Our results show that non-DCD surfaces exhibited littleevidence of bone-bonding, as would be expected, althoughthe Ti6Al4V samples had non-statistically significantly

ARTICLE IN PRESS
Distribution of tensile forces as categorical measurements
0
10
20
30
40
50
60
70
80
90
100
0 N 1-5 N >5 N 0 N 1-5 N >5 N 0 N 1-5 N >5 N 0 N 1-5 N >5 N
cpTi cpTi–DCD Ti6Al4V–DCDTi6Al4V
Perc
ent
Tensile Force Box Plots
25
20
15
10
5
0
cpTi cpTi–DCD Ti6Al4V–DCDTi6Al4V
Tensile
Forc
e N
Fig. 3. Top: Distribution of tensile force values as categorical measures for all groups. Non-DCD groups (cpTi and Ti6Al4V) presented a higher
percentage of zero detachment force values, while the DCD groups (cpTi–DCD and Ti6Al4V–DCD) presented a higher percentage of 45N force values.
This difference in behavior is reflected in the slope of the broken lines drawn (arbitrarily) between the mid-points of the lowest and highest values for each
group, respectively. Note also the decrease in zero values and increase in non-zero values for the non-treated alloy group compared to the non-treated cpTi
group illustrating the increasing trend towards bonding associated with the alloy surface due to the undercuts as discussed in Fig. 1. Bottom: Box plot of
tensile force values for all groups (1: cpTi; 2: Ti6Al4V; 3: cpTi–DCD; 4: Ti6Al4V–DCD). Tensile force values for DCD groups were statistically significant
higher than for non-DCD groups. Within non-DCD groups, there was no difference between cpTi and Ti6Al4V, although this is a trend to higher values in
the alloy group. In the DCD groups, Ti6Al4V–DCD had significantly higher values of detachment forces than cpTi–DCD. A box plot provides useful
summary of important aspects of a distribution of a continuous measurement. The box stretches from 25th percentile to 75th percentile. The median is
shown as a line across the box and the average is shown as a symbol inside the box. If the median is not equidistant from the hinges then the data is
skewed. The ends of the vertical lines show the minimum and maximum values.
V.C. Mendes et al. / Biomaterials 28 (2007) 4748–4755 4753
higher disruption test force values than cpTi. Thesedifferences could only be attributed to the undercutspresent in the etched alloy surface, which were not seenin the cpTi samples, since it would be unreasonable toexpect the small differences in metallic oxide surfacecomposition between alloy and cpTi to be creating thesedifferences. This topographic distinction became moreimportant in the DCD-treated groups since the differencesbetween alloy and cpTi were now found to be statisticallysignificant. Since the DCD treatment was the same on bothsurface types and as the DCD treatment caused asignificant change in the disruption force values whencompared to the non-treated groups, the increaseddifferences seen between the alloy and cpTi–DCD groups
could not have been due to the DCD per se, but rather thesuperimposition of the effect of the DCD on the differencescaused by the underlying metallic substrate topography.Taken together, these results indicate that it was the surfacetopography of the samples, rather than the CAP surfacechemistry which was the primary driver for the bondingmechanism. Indeed, we have recently been able to employfinite element modeling to demonstrate that such bonding,by interlocking of the bony cement line matrix with theunderlying implant surface, can occur in the absence ofinterfacial chemical bonding [17]. Although we haveundertaken considerable surface chemical characterizationof our materials, including X-ray photoelectron spectro-scopy, time-of-flight mass spectrometry, electron energy

ARTICLE IN PRESSV.C. Mendes et al. / Biomaterials 28 (2007) 4748–47554754
loss spectroscopy and scanning transmission X-ray micro-scopy, the data gained from such techniques have providedno additional insight into the mechanisms of bonding sincewe show, herein, that the main driving force is one ofmechanical interlocking. In a similar way, techniqueswhich we have employed to provide quantitative data onthe nanotopography of our surfaces, particularly atomic
force microscopy, are incapable of providing data con-cerning the undercuts which are responsible for theinterlocking of the bone matrix which interdigitates withthe CAP crystal-modified surfaces. Thus, we have chosennot to include such extraneous data herein, but this will bethe subject of a forthcoming manuscript. Nevertheless, ourfindings do indicate that the traditional ‘‘bioactive’’lithomorphic materials such as CAPs and bioactive glassesare not obligatory to promulgate bone-bonding, but ratherthat a surface should have a sub-micron surface complexityinto which the bony cement line matrix can be deposited,and with which it can interlock. The cement line matrix isthe first formed extracellular matrix elaborated by differ-entiating osteogenic cells and has been fully reviewedelsewhere [18–20], but it is important to note that it is thismatrix which will form on the implant surface duringcontact osteogenesis and that, as it matures, becomes adense mineralized matrix [21]. While Fig. 4C shows theinitial cement line crystallites, these, as in all biologicalmineralization systems, become the predominant matrixcomponent, concomitant with crystal growth, whichprovides a mechanism by which the cement line matrixcan both interdigitate with the surface microtopographicalfeatures of the implant, and also become intimatelyinterlocked with the latter to result in the observedinterfacial bonding. In fact, this has been shown in thecreation of highly reticular sub-micron-scale sodiumtitanate surfaces reported by Kim et al. [22] with whichwe have previously shown the cement line to interlock insamples retrieved from in vivo experiments similar to thosewe report herein [19]. Thus, our experiments have
Fig. 4. Field emission SEM photomicrographs of a Ti6Al4V–DCD
implant surface retrieved following tensile testing. (A) Bone, as identified
by the densely woven collagen fibres (left) is still attached to the implant
surface which is seen on the right of the image. Note: the ‘‘snowing’’ due to
the complex microtopography of this alloy surface is clearly seen and can
be compared with the ‘as-received’ surface in Fig. 1J. (B) At higher
magnification of the interface between the bone and implant surface, the
discrete crystals of the DCD surface are clearly seen but also (arrows)
smaller features of a different appearance to both the overlying collagen
and the implant surface itself. Note: In both (A) and (B), areas of each
image are out of focus due to depth of field limitations, lack of conductive
coating medium and angulation of the sample necessary to image the
convergence of the bone tissue and implant surface. Thus, in (A) the
collagen (left) and implant (right) are in focus but the junction between the
two is slightly out of focus (asterisk), while in (B) the focal plane is
centered on the implant surface in the center of the field of view and the
bone (asterisk) is out of focus but included to provide a reference to the
image in (A). (C) Shows the detail of the biological matrix most intimately
associated with the implant surface and which is structurally quite
different to, and of smaller features than, the DCD surface. This matrix,
from our previous work (reviewed in Davies [18]), can be identified as the
first formed matrix of the bony cement line. As the biological mineralized
matrix matures, these crystals grow to occupy more space and will
completely envelop the underlying DCD crystals which are clearly still
present on the surface of the implant after 9 days in vivo. Field widths
(A) ¼ 12.6mm; (B) ¼ 4.2mm; (C) ¼ 1.3mm. Note: The ‘‘snowing’’ seen in
these images is due to the lack of such a conductive sputter coating.
Employing conductive coating was avoided as it introduced sputter-
coating artifacts in the images.
ARTICLE IN PRESSV.C. Mendes et al. / Biomaterials 28 (2007) 4748–4755 4755
demonstrated that surface topography plays a determinantrole in the bone-bonding phenomenon.
Mechanical tests such as torque, shear (push out or pullout) or tensile strength measurements have been used toassess the bone-bonding phenomenon with differentmaterials. Although we agree with the notion that the‘‘tensile test’’ model is more appropriate than torque orshear models [7,9], such tests also clearly demonstrate thatthe true interfacial strength cannot be calculated. Thus, inour experiment, after mechanical testing of DCD samples,bone was still attached to the interface, and the measuredforce values reflect that necessary to fracture the overlyingarch of cortical bone, rather than the tensile strength of thebone/implant interface. The visual observation of such anintact bone–implant interface following a mechanicaldisruption test therefore represents important evidence ofbone-bonding.
5. Conclusions
The treatment of titanium and titanium alloy implantsurfaces with discrete crystalline deposits renders thembone-bonding, and it is the increase in complexity of theresultant surface which is the driving force for the bondingmechanism, rather than the CAP chemistry.
Acknowledgments
The authors would like to acknowledge the researchfunding from Canadian Institutes for Health Research(CIHR), the Ontario Research and Development Chal-lenge Fund (ORDCF), and Biomet 3i. The assistance ofJason Chau, Jian Wang, Susan Carter, Professor MaryChipman and Vartouhi Jazmaji is also greatly appreciated.
References
[1] Hench LL, Paschall HA. Histochemical responses at a biomaterials’s
interface. J Biomed Mater Res Symp 1974;5(Pt 1):49–64.
[2] Jarcho M, Kay JF, Gumaer KI, Doremus RH, Drobeck HP. Tissue,
cellular and subcellular events at a bone–ceramic hydroxylapatite
interface. J Bioeng 1977;1:79–92.
[3] Hench LL, Wilson J. Surface-active biomaterials. Science 1984;
226(4675):630–6.
[4] Nakamura T, Yamamuro T, Higashi S, Kokubo T, Itoo S. A new
glass-ceramic for bone replacement: evaluation of its bonding to bone
tissue. J Biomed Mater Res 1985;19:685–98.
[5] Williams DF. The Williams dictionary of biomaterials. Liverpool:
Liverpool University Press; 1999. p. 48.
[6] Davies JE, Baldan N. Scanning electron microscopy of the bone–
bioactive implant interface. J Biomed Mater Res 1997;36:429–40.
[7] Hong L, Xu H, Zhang X, de Groot K. Tensile tests of interface
between bone and plasma-sprayed HA coating – titanium implant.
J Biomed Mater Res (Appl Biomater) 1998;42:113–22.
[8] Takatsuka K, Yamamuro T, Kitsugi T, Nakamura T, Shibuya T,
Goto T. A new bioactive glass-ceramic as a coating material on
titanium alloy. J Appl Biomater 1993;4:317–29.
[9] Takatsuka K, Yamamuro T, Nakamura T, Kokubo T. Bone-bonding
behavior of titanium alloy evaluated mechanically with detaching
failure load. J Biomed Mater Res 1995;29:157–63.
[10] Tracy BM, Doremus RH. Direct electron microscopy studies of the
bone–hydroxylapatite interface. J Biomed Mater Res 1984;18:719–26.
[11] Bonfield W, Luklinska ZB. High resolution electron microscopy of a
bone implant interface. In: Davies JE, editor. The bone–biomaterial
interface. Toronto: University of Toronto Press; 1991. p. 89–94.
[12] Edwards JT, Brunski JB, Higuchi HW. Mechanical and morphologic
investigation of the tensile strength of a bone–hydroxyapatite
interface. J Biomed Mater Res 1997;36:454–68.
[13] Liang B, Fujibayashi S, Neo M, Tamura J, Kim H-M, Uchida M, et
al. Histological and mechanical investigation of the bone-bonding
ability of anodically oxidized titanium in rabbits. Biomaterials 2003;
24:4959–66.
[14] Davies JE, Chernecky R, Lowenberg B, Shiga A. Deposition and
resorption of calcified matrix in vitro by rat marrow cells. Cells Mater
1991;1:3–15.
[15] de Bruijn JD, van Blitterswijk CA, Davies JE. Initial bone formation
at the hydroxyapatite interface in vivo. J Biomed Mater Res 1995;29:
89–99.
[16] Dziedzic DM, Savva IH, Wilkinson DS, Davies JE. Osteoconduction
on, and bonding to, calcium phosphate ceramic implants. Mat Res
Soc Symp Proc 1996;414:147–56.
[17] Pan C, Chau J, Mendes VC, Simmons CA, Davies JE. Finite element
modeling of the shear strength at the CAP-modified titanium
implant/bone interface. Submitted for publication.
[18] Davies JE. In vitro modeling of the bone/implant interface. Anat Rec
1996;245:426–45.
[19] Davies JE. Mechanisms of endosseous integration. Int J Prosthodont
1998;11:391–401.
[20] Davies JE. Understanding peri-implant endosseous healing. J Dent
Educ 2003;67:932–49.
[21] Skedros JG, Holmes JL, Vajda EG, Bloebaum RD. Cement lines of
secondary osteons in human bone are not mineral deficient: new data
in a historical perspective. Anat Rec 2005;286A:781–803.
[22] Kim HM, Miyaji F, Kokubo T, Nakamura T. Effect of heat
treatment on apatite-forming ability of Ti metal induced by alkali
treatment. J Mater Sci Mater Med 1997;8:341–7.