The effect of depth and activity type on dugong (dugong ...
241
University of Calgary PRISM: University of Calgary's Digital Repository Graduate Studies Legacy Theses 2001 The effect of depth and activity type on dugong (dugong dugon) diving behaviour in Shark Bay, Western Austrailia Churchward, Carol Anne Churchward, C. A. (2001). The effect of depth and activity type on dugong (dugong dugon) diving behaviour in Shark Bay, Western Austrailia (Unpublished master's thesis). University of Calgary, Calgary, AB. doi:10.11575/PRISM/16057 http://hdl.handle.net/1880/40791 master thesis University of Calgary graduate students retain copyright ownership and moral rights for their thesis. You may use this material in any way that is permitted by the Copyright Act or through licensing that has been assigned to the document. For uses that are not allowable under copyright legislation or licensing, you are required to seek permission. Downloaded from PRISM: https://prism.ucalgary.ca
-
Upload
khangminh22 -
Category
Documents
-
view
1 -
download
0
Transcript of The effect of depth and activity type on dugong (dugong ...

University of Calgary
PRISM: University of Calgary's Digital Repository
Graduate Studies Legacy Theses
2001
The effect of depth and activity type on dugong
(dugong dugon) diving behaviour in Shark Bay,
Western Austrailia
Churchward, Carol Anne
Churchward, C. A. (2001). The effect of depth and activity type on dugong (dugong dugon) diving
behaviour in Shark Bay, Western Austrailia (Unpublished master's thesis). University of Calgary,
Calgary, AB. doi:10.11575/PRISM/16057
http://hdl.handle.net/1880/40791
master thesis
University of Calgary graduate students retain copyright ownership and moral rights for their
thesis. You may use this material in any way that is permitted by the Copyright Act or through
licensing that has been assigned to the document. For uses that are not allowable under
copyright legislation or licensing, you are required to seek permission.
Downloaded from PRISM: https://prism.ucalgary.ca

THE UNIVERSITY OF CALGARY
The Effect of Depth and Activity Type
on Dugong (Dugong dugon) Diving Behaviour
in Shark Bay, Western Australia
Carol Anne Churchward
A THESIS
SUBMITTED TO THE FACULTY OF GRADUATE STUDIES
IN PARTIAL FULFILLMENT OF THE REQUIREMENTS FOR THE
DEGREE OF MASTER OF SCIENCE
DEPARTMENT OF BIOLOGICAL SCIENCES
CALGARY, ALBERTA
JANUARY, 2001
O Carol Anne Churchward 2001

National Library 1*1 ofCanada Biblioth&que nationale du Canada
Acquisitions and Acquisitions et Bibliographic Services services bibliographiques
395 WeSlngton Street 395. rue Weilington OrrawaON KlAON4 -ON K l A W Canada Canada
The author has granted a non- L'auteur a accorde une licence non exclusive licence allowing the exclusive pennettant a la National L%rary of Canada to Bibiiotheque nationale du Canada de reproduce, loan, distribute or sell reproduire, priter, distri'buer ou copies of this thesis in microform, vendre des copies de cette these sous paper or electronic formats. la forme de microfiche/^ de
reproduction sur papier ou sur format electronique .
The author retains ownership of the L'auteur conserve la propriete du copyright in this thesis. Neither the droit d'auteur qui protege cette these. thesis nor substantial extracts from it Ni la these ni des extraits substantiels may be printed or otherwise de celle-ci ne doivent Stre imprimes reproduced without the author's ou autrement reproduits sans son permission. antorisation.

ABSTRACT
The diving behaviour of dugongs in Shark Bay, Western Australia, was
analyzed for the effects of depth and activity type on dive cycle variables.
Observations collected in the spring of 1997 were combined with, and compared
to. observations from 1987-89. Activity was found to affect dive cycle duration,
with resting dives longer than travelling dives, and foraging dives longer than
resting and travelling dives at depths greater than three metres, but shorter or
comparable at depths less than three metres. Of the three activity types, only
foraging dives were affected by depth. Depth affected each stage of the foraging
dive cycle. Foraging dive behaviour differed significantly between 1997 and
1987-89. Submerged time, surface time, foraging time, and the number of
breaths increased with depth in both data sets, while the proportions of time
spent at the surface increased and time spent foraging decreased with depth in
1997, but were not affected by depth in 1987-89. The allocation of time within the
foraging dive cycle in 1997- qualitative!^ fit the predictions of dive models by
Houston and Carbone (1992), Carbone and Houston (1996), and Walton et a(.
(1 998). No behavioural evidence of anaerobic respiration was observed.

ACKNOWLEDGEMENTS
I'd like to thank the following people for their support during the production of this thesis, many of whom fulfilled the role of honorary fellow "grad studentsn in the absence of a proper lab:
My parents, Reg and Jo Churchward, for monetary support in the form of temporary room and board during the writing-up phase.
My sister and brother-in-law, Sandy and Clay Derrett, for the use of their home as my office and long-term storage facility during the many months of writing-up.
Leah de Forest, long-time friend and ally, for hei editing skills and her invaluable moral support from beginning to end, not to mention her life-saving field correspondence.
Holly Cleator, friend and colleague, for spending many an hour listening to my struggles and for offering much-needed advice and words of wisdom, not to mention the loan of all those text books and technical manuals.
Blair Dunn, friend and colleague, for helping with the computer graphics.
Dr. Larry Linton, committee member, for statistical advice and for lending a sympathetic ear on many an occasion.
Dr. Paul K. Anderson, my supervisor, for allowing me the use of raw data from his past dugong studies and for contributing to the field portion of this study from his own pocket.
Cedric Gerrard, fellow dugong grad student, for his keen eyesight and help collecting data in Shark Bay.
Craig and Jessie Shankland, owners/operators of the James Scheerer, for their generosity in providing a three day data-collecting cruise in western Shark Bay in November of 1997, and for their outstanding hospitality and friendship while I was aboard.
Harvey Raven, and the crew of the Shotover, for the opportunity to tag along on numerous "dugong tours" during the 1997 field season.
The Monkey Mia Dolphin Research Group, for the use of Nortrek for three months in 1997 and for providing an occasional social break from said vessel.
The Western Australia conservation and Land Management Department (CALM), for their financial support of my study, and for the opportunity to participate in feeding the Monkey Mia beach dolphins one morning.

TABLE OF CONTENTS
TITLE PAGE I
APPROVAL PAGE
ABSTRACT iii
ACKNOWLEDGEMENTS iv
TABLE OF CONTENTS v
LlST OF TABLES viii
LlST OF FIGURES ix
CHAPTER 1 : INTRODUCTION 1 1.1 Introduction to Topic 1 1.2 Background Literature 2
1.2.1 The Dugong 2 1.2.1.1 General information 2 1.2.1.2 Morphology and physiology 3 1.2.1.3 Dugong diving behaviour 5 1.2.1.4 Dugong submerged times: empirical data 7 1.2.1.5 Dugong surface times: empirical data 11 1.2.1.6 Study site 12
1.2.2 General Oiving Behaviour and Physiotcgy 14 1.2.2.1 From the classic dive response to a new understanding: a brief history of the field of
diving behaviour 14 1.2.2.2 Influences on the allocation of time within the dive cycle 16
1.2.2.2.1 Physiolog~cal influences 17 i) Aerobic respiration and the aerobic dive limit (ADL) 17 ii) Anaerobic resp~ration 21
1.2.2.2.2 Behavioural and environmental inff uences 23 1.2.3 Optimal Divirlg Theory 25
1.2.3.1 Optimality theory 25 1.2.3.2 Optimal foraging and optimal diving 26 1.2.3.4 Optimality models 30 1.2.3.5 The models 31
1.3 Research Questions and Hypotheses 32
CHAPTER 2: METHODS
2.1 Study Period and Study Site 2.2 Research Vessels 2.3 Approach of Animals 2.4 Selection and Classification of Study Animals 2.5 Data Collection
2.5.1 Activlty Categories

2.5.2 Dive Variable Definitions 2.5.2.1 Diving and surfacing modes 2.5.2.2 Surface time 2.5.2.3 Submerged time, foraging time, and travel time 2.5.2.4 Dive cycle duration
2.5.3 Rate of Travel 2.6 Additional Observations 2.7 Data Sheets 2.8 Data Management 2.9 Data Analysis
2.9.1 Rules for Dropping Terms 2.9.2 Exclusion Criteria
2.10 Models 2.10.1 Assumptions 2.10.2 Currencies
CHAPTER 3: RESULTS
3.1 lntroduction 3.2 Sample Description
3.2.1 Combined Data Set 3.2.2 1997 Data Set 3.2.3 1987- 89 Data Set
3.3 Effect of Activity and Depth on Dive Cycle Duration 3.5 Effect of Depth on Dive Mode 3.6 Allocation of flme during Foraging Dives - A Test of Optimality Models
3.6.1 Effect of Depth on Foraging Dive Cycle Variables 3.6.1.1 Dive cycle duration 3.6.1.2 Submerged time 3.6.1.3 Travel time 3.6.1.4 Foraging time 3.6.1.5 Surface time
3.6.1.5.1 Surface time by submerged time 3.6.1.6 Number of breaths
3.6.1.6.1 Breathing rate during surface period 3.6.2 Effect of Depth on Ule Proportions of the Foraging Dive Cycle
3.6.2.1 Proportion of dive cycle spent submerged 3.6.2.1.1 Proportion of submerged time spent travelling 3.6.2.1.2 Proportion of submerged time spent foraging
3.6.2.2 Proportion of dive cycle spent travelling 3.6.2.3 Proportion of dive cycle spent foraging 3.6.2.4 Proportion of dive cycle spent at the surface
3.6.2.4.1 Dive-pause ratio 3.6.2.4.2 Dive-pause ratio by submerged time
CHAPTER 4: DISCUSSION
4.1 Introduction 4.2 General Results 4.3 Review of Methods
4.3.1 Direct Observations 4.3.2 Surface Time Definition 4.3.3 Travel Time 4.3.4 Suitability of Models
4.4 Effect of Activity Type and Depth on Dive Cycle Duration 4.4.1 Effect of Activity Type

4.4.2 Effect of Depth by Activity Type 4.5 Allocation of Time during Foraging Diver: A Test of Optimality Models
4.5.1 Effect of Depth on foraging Dive Cycle Variables 4.5.1.1 Foraging time 4.5.1.2 Proportion of the dive cycle spent foraging 4.5.1.3 Proportion of submerged time spent foraging 4.5.1.4 Submerged time 4.5.1.5 Surface time
4.5.1 .5.1 Surface time by depth 4.5.1.5.2 Surface time by submerged time
4.5.1.6 Dive-pause ratio 4.5.1.6.1 Dive-pause ratio by depth 4.5.1.6.2 Dive-pause ratio by submerged time
4.5.1.7 Similarity between diving patterns of dugongs and seabirds 4.5.1.8 Number of breaths and breathing rate 4.5.1.9 Proportions of the dive cycle spent at the surface and submerged 4.5.1.1 0 Evidence af anaerobic respiration? 4.5.1.11 Conclusions regarding depth e f k b on foraging dive cycle variables
4.5.2 Comparison of the Data Sets 4.5.2.1 Introduction 4.5.2.2 Sources of variability
4.5.2.2.1 Observer bias 4.5.2.2.2 Seasonal variability in Shark Bay
i) Foraging conditions ii) Environmental conditions - water temperature
4.5.2.3 Dive cycle proportions 4.5.2.4 Conclusions of Comparison
4.5.3 What Currency Where Dugongs Maximzing? 4.5.3.1 Conclusions as to currency
4.6 Management Implications 4.6.1 Introduction 4.6.2 Implications of Depth Effects
4.6.2.1 Habitat 4.6.2.2 Aerial surveys
4.6.3 Implications of Possible Seasonal Effects 4.6.3.1 Seasonal effects on aerial surveys
4.6.4 Implications of Direct Observations for TDR Studies 4.6.5 Conclusions regarding management imptications
APPENDIX 1 Calculated aerobic dive limit (CADI.) for the dugong
APPENDIX 2 Encounter site sheet
APPENDIX 3 Dive data sheet
APPENDIX 4 Back-tansformation of regression equations through algebraic manipulations
APPENDIX 5 Statistical output from Chapter 3: Rerub
APPENDIX 6 Theoretical bases for diiennces in foraging dive pattems

LIST OF TABLES
Table 3.1 Table 3.2 Table 3.3 Table 3.4 Table 3.5 Table 3.6 Table 3.7 Table 3.8 Table 3.9 Table 3.10 Table 3.1 1 Table 3.12a-c Table 3.13 Table 3.14a-d Table 3.15a-b Table 3.16a-d Table 3.17a-e Table 3.183-e Table 3.1 9a-b Table 3.20a-d Table 3.21ad Table 3.22a-d Table A1 .1
Composition of combined data set by activity type Site information for 1997 data set Site information for 198789 data set ANCOVA of activity by depth for all three activity types ANCOVA of activity by depth for testing and travelling dives ANCOVA of dive cycle duration by depth for resting and travelling dives ANOVA of travel rate by depth and direction of travel Regression analysis of dive cycle duration by depth Regression analysis of submerged time by depth Regression analysis of travel time by depth Regression analysis of foraging time by depth Regression analysis of surface time by depth Regression analysis of surface time by submerged time Regression analysis of number of breaths by depth Regression analysis of number of breaths by surface time Regression analysis of proportion of dive cycle spent submerged Regression analysis of proportion of submerged time spent travelling Regression analysis of proportion of submerged time spent foraging Regression analysis of proportion of dive cycle spent travelling Regression analysis of proportion of dive cycle spent foraging Regression analysis of proportion of dive cycle spent at the surface Regression analysis of dive-pause ratio by depth Estimated oxygen storage capacrty of a dugong

LIST OF FIGURES
Figure 1.1 Optimal surface time and optimal oxygen store Figure 1.2 Optimal surface time and optimal foraging time Figure 2.1 Dugong surface time witJ~ two breaths Figure 3.1 1997 observation site map Figure 3.2 198789 observation site map Figure 3.3 Relationship between dive cycle duration and depth for each activrty type Figure 3.4 Histogram of dive mode by depth Figure 3.5 Dive cycle duration by depth Figure 3.6 Submerged time by depth Figure 3.7 Travel time by depth Figure 3.8 Foraging time by depth Figure 3.9a-c Surface time by depth Figure 3.10 Surface time by submerged time Figure 3.1 la-d Number of breaths by depth Figure 3.12a-c Breath rate and surface time by number of breaths Figure 3.13a-c Proportion of dive cycle spent submerged by depth Figure 3.14a-c Proportion of submerged time spent travelling by depth Figure 3.15a-c Proportion of submerged time spent foraging by depth Figure 3.16a-b Proportion of dive cycle spent traveIling by depth Figure 3.17a-b Proportion of dive cycle spent foraging by depth Figure 3.18a-c Proportion of dive cycle spent at surface by depth Figure 3.19a-c Dive-pause ratio by depth Figure 3.20 Dive-pause ratio by submerged time Figure A6.1 Time spent in a patch in two different environments

CHAPTER 1: INTRODUCTION
1.1 Introduction to Topic
The diving behaviour of marine mammals is currently a topic of major
interest and is the focus of many studies (Boyd and Croxall 1996, Boyd et al.
1997, Nowicki et aI. 1997, Beck et al. 2000, Krutzikowsky and Mate 2000, Jaquet
et al. 2000, Schreer et al. 2001). Dugongs (Dugong dugon) are unique among
marine mammals due to their herbivorous habits, shallow-water foraging and low
metabolism, yet studies about their diving behaviour are few. In addition, much of
the dugong diving information that has been reported is without behavioural
andlor environmental context, making it difficult to interpret and therefore of
limited use for comparative or management purposes.
This study describes the diving behaviour of dugongs in Shark Bay,
Western Australia, in terms of activity type and habitat conditions, and specifically
examines how water depth influences the allocation of time between the various
stages of the foraging dive cycle. Particular focus is given to the costs and
benefrts associated with the use of deeper-water habitats by comparing actual
allocation of time to that predicted by optimal diving models developed by
Houston and Carbone (1992) and Carbone and Houston (1996).
Diving behaviour can reveal much about an animal and how it is adapted
to its environment, which are crucial to their management and conservation. This
is particularly important for those species, such as the dugong, that are
vulnerable to extinction (IUCN 2000). In additian, diving data can be used for the

calibration of aerial surveys and can provide important information on the state of
the environment in which the animal lives.
1.2 Background Literature
1.2.1 The Dugong
1 -2.1.1 General information
The dugong belongs to the order of mammals known as the Sirenia, which
are among the only herbivorous aquatic mammals to have evolved. Dugongs,
along with three species of manatee. are all that remain of this order today. Of
the four extant species, the dugong is the only member that is exclusively marine
(Marsh et al. 1978).
Dugongs are benthic feeders that inhabit the shallow tropical and
subtropical near-shore waters of the Indian and West Pacific Oceans, where they
feed almost exclusively on seagrasses (Marsh et al. 1978, Preen 1993). They are
believed to be close to extinction or extinct over much of their historic range, with
the remaining population existing as isolated pockets of animals (Marsh and
Lefebvre 1994). The largest, most studied, and best protected of these relic
populations occurs in the waters of northern Australia, from Shark Bay in
Western Australia to Moreton Bay in Queensland, where the number of dugongs
is estimated to be at least 85,000 (Marsh and Lefebvre 1994). The Shark Bay
population is estimated at about 10,000 animals (Marsh et al. 1994, Preen et al.
1995b) or about 12% of the Australian dugong population, making it the second

largest concentration of dugongs in Australia, based on regional estimates from
Marsh and Lefebvre (1 994).
1.2.1.2 Morphology and physiology
Dugongs are relatively streamlined marine mammals with small pectoral
flippers and a fluked, cetacean-iike tail (Reynolds and Odell 1991). Their
rostrums are down-turned for bottom feeding (Anderson 1979) with the nostrils
located on the dorsal edge of the rostrum, allowing the animal to breathe without
raising much of its head above the surface of the water (Marsh 1991). Food is
either grazed or rooted from the substratum, and is consumed while underwater.
The average length of an adult dugong is about 2.7 metres (Reynolds and Odell
1991). The average weight is 250 - 300 kilograms (Reynolds and Odell 1991),
although adult dugongs can weigh as much as 350 - 400 kg (Aragones and
Marsh 2000). The maximum recorded length and weight are just over 3 metres
and 420 kilograms (Preen 1993). Dugongs are heavier than other marine
mammals of comparable size due to the very high density of their bones.
Dugongs are thought to have low metabolic rates (MR) like manatees
(Gallivan and Best 1980, lrvine 1983, Anderson 1986). This has a number of
consequences for their thermoregulatory abilities, distribution, energy level, and
diving behaviour. Low MR may limit thennoregulatory abilities, causing dugongs
to avoid water temperatures less than 20 "C (Anderson 1984). This avoidance of
cold water is thought to influence the winter distribution of dugongs within Shark
Bay (Anderson 1986, Marsh et al. 1994). Low MR also limits their swimming

ability. Dugongs generally swim at a rate of 4-10 kmlhr (1 -1 1-2.78 mlsec), about
equal to a human wearing fins (Anderson 1979). Short bursts of speed, energetic
physical displays, or struggling when entangled in nets appears to tire them out
quickly (Anderson 1979, Anderson 1997, Marsh et al. 1981). And finally, by
reducing the amount of oxygen needed per unit time, low MR may also allow
sirenians to have a relatively greater diving capacity compared to other marine
mammals that have a similar respiratory pattern (Gallivan and Best 1980). The
aerobic diving capacity of Amazonian manatees (Trichechus inunguis), for
example, exceeds that of other marine mammals of comparable size, mostly due
to their low metabolic rate (Gallivan et al. 1986).
In addition to low MR, breath-holding capacity is further enhanced by
having a large body oxygen store since the bigger the oxygen store, and the
lower the cost of transport in terms of oxygen consumption, the more oxygen
available at depth for foraging (see review in Boyd 1997). Dugongs dive with a
potentially large oxygen store in their lungs, while their hemoglobin and
myoglobin stores are probably modest, as in manatees (Blessing 1972, Farmer
et al. 1979, Snyder 1983, Kooyman 1989). Large lung volume is an inefficient
method for increasing body oxygen stores for diving as it causes an increase in
buoyancy, making it harder to get and stay below the surface, especially during
shallow dives (Kooyrnan 1973). Sirenians have managed to compensate for the
problem of increased buoyancy due to diving with full lungs by increasing the
density, and therefore the weight, of their skeletons through the process of
pachyosteosclerosis (Domning and de Buffrenil 1991). In addition, dugongs may

be able to use their muscular bronchioles to close off respiratory vesicles and
compress the air in their lungs, enabling them to surface or sink with little effort
and without expelling air (Engel 1962). Using the lungs for buoyancy control is
seen in many lower vertebrates and may account for their relatively large lungs
(Burggren 1988). Dugong lungs may also be adapted morphologically for
buoyancy control (Domning and De Buffrenil 1991). Several aspects of dugong
anatomy, including lung morphology, a horizontal diaphragm, and heavy,
pachyosteosclerotic bones, are adapted to maintain neutral buoyancy and
horizontal trim. This is particularly important for dugongs in view of their slow,
stop-and-go herbivorous lifestyles and shallow-water habits. Dugong lungs are
situated dorsally and are elongated, extending posteriorly to the kidneys. They
are also unlobed and contain uniquely designed air passages that may help
maintain horizontal trim by allowing the animal to fill and empty its lungs without
shifting its centre of gravity (Domning and de Buffrenil 1991). It has been
theorized that the development of pachyosteoclerosis allowed the enlargement of
the lungs in slow swimming, shallow diving grazers, such as sirenians (Taylor
2000). Dugongs are therefore uniquely adapted to an aquatic existence with their
large lung volume and low MR to enhance breath-holding capacity and their
heavy bones to offset buoyancy.
1.2.1.3 Dugong diving behaviour
Many aquatic mammals dive for a specific purpose, usually to forage,
before returning to the surface where they bask, interact. moult, mate and give

birth. Dugongs. like the cetaceans and manatees, live their lives primarily
underwater, and as such, their dives can be thought of as simpiy a matter of the
animal returning to its natural environment after a short, but necessary,
interruption to breathe. Animals such as the dugong that spend more than 50%
of their time underwater, surfacing only for the unloading of carbon dioxide and
loading of oxygen, can be thought of as surfacers rather than divers (Kramer
1988). This distinction is important for the understanding of the physiological
constraints under which surfacers like the dugong operate (Fedak and Thompson
1993).
The dugong dive cycle is composed of the following elements: emergence.
exhalation, inhalation, and submergence. During foraging dives, submergence
can be further broken down into foraging, and travel between the surface and the
foraging area. Exhalation and inhalation are rapid (Kenny 1967). Exhalation is
loud and forceful, while inhalation is much quieter- Exhalation generally occurs at
the surface, although occasionally it will begin just below the surface, producing a
fine spray of water droplets (Anderson and Birtles 1978). Ventilation at the
surface is rapid, and sirenians are reported to renew from 42 to 90% of the air in
their lungs with each breath (Scholander and Irving 1941, Gallivan et al. 1986,
Reynolds and Odell 1991) compared to only 10 to 20% in humans (Ronald et at.
1978). The extensive cartilaginous support in the large and small air passages
serves to prevent airway collapse during exhalation by maintaining airway
patency under driving pressures which would cause airway collapse in terrestrial
animals (Ronald et al. 1978, Damning and de Buffrenil 1991). This allows

sirenians, like the cetaceans, to obtain sufficient air with one breath to avoid
prolonged surface intervals (Kooyman 1973, Bergey and Bairer 1987).
Measures of diving abit'i can include the duration of submerged times,
surface times, dive cydes, and foraging times, as well as the types and depths of
dives. Diving ability is usually reported as the maximal depth attained or the
maximal duration of submerged time (Berta and Surnich 1999). However, since
each dive or series of dives is unique because of the set of circumstances under
which it occurred, it can be misleading to compare the elements of various dives
without an indication of the behavioural and environmental factors that may have
influenced the dives (Butler and Jones 1997).
1.2.1.4 Dugong submerged times: empirical data
Studies of wild dugongs in Australia have reported mean submerged times
ranging from 23.60 to 240.03 seconds (Anderson and Birtles 1978, Anderson
19826, Anderson 1984, Marsh and Rathbun 1990). In shallow (0.5 - 3 m) water,
approximately 67% of submerged times were reported to last less than 60
seconds and 55% to last less than 39 seconds (Anderson 1982b). Only about
15% of dives lasted more than 120 seconds, with the longer submerged times
thought to be associated with departure from the feeding area, disturbance, or
resting behaviour (Anderson and Bides 1978. Marsh and Rathbun 1990).
Published maximum submerged times range from 400 seconds (Anderson and
BirtIes 1978) for wild animaIs, to 506 seconds (Kenny 1967) for a captive animal.

The submerged times of aquatic animals frequently increase with
increasing dive depth (Kramer 1988). Dugongs generally submerge for longer
periods of time in deeper water (Anderson 1984). The average submerged time
for adults feeding on Arnphibolis antarctica was about 126.25 seconds (n=17) at
a depth of 1.3 to 4.5 metres, and about 240.03 seconds (n=l) at 6 to 8 metres.
Cow-calf pairs feeding on Amphibolis antarctica submerged for an average of
152.75 seconds (n4 ) at 4.5 metres, and 201.08 seconds (n=17) at 7 metres.
The maximum depths recorded for dugongs are generally between 8.5 to 12
metres (Anderson 1984, Reynolds and Odell 1991), although a recent study of
dugongs frtted with time-depth recorders (TDRs) in Shark Bay has recorded
dives of up to 21 m for over 480 seconds (Gales, N., Lawler, I. and Holley, O.,
pers. cornm., 2001). One record exists of dugong feeding trails at 23.7 metres, in
a Halophila dominated community (Lee Long et al. 1989).
Observations of dugongs in Australia found that average submerged times
during foraging differed according to forage type, The average submerged time
of 54.7 i 2.9 seconds (n=346 dives) for dugongs feeding on the seagrass
Arnphibolis antarctica at Shark Bay (Anderson 1982b) was significantly shorter
than the 73.3 k 2.7 seconds (n=370 dives) for dugongs feeding on the seagrass,
Zostera capricomi, at Shoalwater Bay (Anderson and Birtles 1978). It was
assumed from this that rooting for Zostera rhizomes must be more time-
consuming than grazing on Amphibolis leaf matter [Anderson 1982b), although
the average submerged time of dugongs rooting for Halodule uninervis rhizomes

at depths of 1 to 3 metres in Shark Bay ranged from about 60 to 90 seconds
(Anderson 1 998).
Type of activity can also affect diving behaviour. Reynolds (1981) found
that the mean submerged time of West Indian, or Florida, manatees ( Trichechus
manatus) was greatest whiie resting, followed by feeding, then cruising, which he
expected since energy expenditure increases with greater activrty. When these
data were corrected for the size class of the animal, the mean submerged time of
adult manatees was greatest while resting (177.7 i 6.16 seconds, n=203 dives),
then foraging 136.50 k 5.32 seconds, n=42 dives), and then cruising (1 16.39 2
10.48 seconds. n=22 dives). The mean submerged time for juveniles and calves
was greatest while foraging (juveniles: 170.00 & 16.94 seconds. n=3 dives;
calves: 126.67 seconds, n=1 dive), followed by resting (juveniles: 163.08 +, 6.70
seconds, n=26 dives; calves: 104.20 i 1.26 seconds, n=230 dives), then cruising
(juveniles: 75.00 seconds, n=l dive; calves: 93.26 * 1 .I6 seconds, n=88 dives).
There was no indication that the data were corrected for depth or even of the
depths from which the observations were taken. Given that the manatees in the
study fed on submerged, floating, and emergent vegetation, the foraging data
were probably collected over a range of depths. If manatee foraging dives are
affected by water depth, but their resting and cruising dives are not, then it may
have been inappropriate to compare feeding submerged times to resting and
cruising submerged times without indicating depth.
Body size also affects submerged times. Boyd and Croxall (1996) found a
positive relationship between body size and dive duration for many species of

diving animals. In other words, the larger the animal, the longer it can stay
submerged. Reynolds (1981) found that size class (calf, juvenile, or adult)
affected the mean submerged times of manatees. Calves were consistently
found to have the shortest submerged times when resting or foraging, while
juveniles had the shortest submerged times when cruising. Juveniles had longer
submerged times than unaccompanied adults while feeding, while
unaccompanied adults had longer submerged times than juveniles or caives
while cruising or resting,
Whether or not a dugong adult is accompanied by a calf may affect
submerged times. A study in Shark Bay found that dugong cows accompanied by
calves stayed down approximately five times longer on average than did adults
unaccompanied by calves (Anderson 1982b). The modal class for cows with
calves was 100 to 11 9 seconds (mean = 94.4 + 41 sec, n=162), while the modal
class for unaccompanied adults was 20 to 39 seconds (mean = 54.7 k 2.9 sec,
n=346). The longer submerged times of cows with calves was thought to be due
to the higher food requirements of lactating cows andlor the increased
vulnerability of calves at the surface. However, a subsequent study in Shark Bay
found that cows with calves had shorter dive cycles than unaccompanied adults.
The average dive cycle duration for cows with calves was 47.8 2 1.6 seconds
(n=198 dives or 8 animals), while the average dive cycle duration for
unaccompanied adults using the same horizontal method of foraging was 71.8 i
2.9 seconds (n=88 dives or 7 animals) (Anderson 1998). There was no indication
whether submerged times, rather than dive cycle duration, were also longer for

unaccompanied adults or whether the unaccompanied adults were of larger size
than the cows. A study of Florida manatees also found a relationship between
the submerged time of adults and the presence or absence of calves (Reynolds
1981). Mean submerged times were found to be consistently longer among
adults without calves than among adults with caives, regardless of whether the
animals were feeding, resting, or cruising.
1.2.1.5 Dugong surface times: empirical data
Surface times are less often reported in chronicles of diving behaviour
than are submerged times, and are rare in the dugong literature. Anderson and
Birtles (1978) reported the mean surface time of dugongs from two locations in
Queensland, Australia, to be 1.40 k 0.1 seconds (n=48 observations), while the
mean surface time of a tagged immature, male dugong off the north Queensland
coast was higher at 2.62 k 0.56 seconds (n=132 dives) (Marsh and Rathbun
1990). The longer mean surface time may have been related to water depth or to
activity while diving. Water depths were not reported in either of these studies,
although the average depth of Shoalwater Bay, where most of the Anderson and
Birtles (1978) study took place, is generally less than three metres. Activity types
were also not provided in connection with the reported surface times for either
study. The longer mean surface time of the tagged animal may also have
resulted from the methodology of attaching the floating transmitter to the
dugong's tail by a three metre-long tether, which would have lagged behind the
dugong's actions and remained on the surface at depths of less than three

metres. There may also have been drag associated with the transmitter, which
would have increased the animal's physical effort, possibly causing an increase
in surface time.
Other studies have provided the number of breaths taken at the surface
from which the relative surface time can be inferred, even though no surface
times were given. Anderson (I 982b) noted that dugongs along the eastern shore
of Dirk Hartog Island in Shark Bay took from one to six breaths per surface visit,
which implies that some surface periods were longer than the one or two
seconds necessary for a single breath. The animals were mostly observed in
water from 0.3 to 3 metres deep, with one animal seen in water deeper than 5
metres, Activity type was not reported in mnnection with these breaths. Similarly,
Anderson (1994) reported that animals in the Hopeless Reach area of eastern
Shark Bay remained on the surface for three to five breaths between dives.
These animals were observed diving in water from 9 to 14 metres deep and,
based on the mode of submergence, appeared to be feeding.
1.2.1.6 Study site
Shark Bay is located mid way along the west coast of Australia at
approximately 26 degrees south latitude and covers approximately 14,000
square kilometres. Seagrasses cover more than 4000 square kilometres, or
about a third of the Bay, forming the largest seagrass meadows in the world
(Walker 1989). Up to 12 different species of seagrasses are found in Shark Bay,
more diversity than anywhere else in the world (Walker 1991192). Water depth in

the Bay is mostly less than 15 metres (Walker et al. 1988) with a mean depth of
10 metres (Anderson 1986). Dugong use of deeper water areas in the Bay
increases in winter when cooler water temperatures in the shallower southern
and eastern reaches of the Bay cause dugongs to move to the deeper northern
and western reaches which receive warm oceanic currents (Anderson 1986,
Marsh et al. 1994, Preen et al. 1995b). Seasonal changes in water temperatures
also affect the abundance and distribution of seagrasses in Shark Bay. The
dugongs' preferred forage species, Halodule uninervis and Halophila spinulosa
(Anderson 1986), are limited in Shark Bay by winter water temperatures below
21 "C (H. uninenlis) and 19 "C (H. spinulosa) (Walker and Prince 1987), whereas
their dominant winter forage, Amphibolis antarctica, (Anderson 1986) survives in
water temperatures as low as 17 "C in the Bay (Walker and Prince 1987).
Dugong use of deeper areas outside of the winter months may be influenced by
the availability of forage types, as different seagrasses grow at different depths.
Halophila spinulosa can occur over a wide range of depths, but usuaily grows in
deeper water (to 45 m). It is commonly found at 8-15m depth along the northwest
coast of Australia (Walker and Prince 1987). In Shark Bay it grows at depths of 3
to 14 m, although it is particularly abundant below 8 m, and is patchy or sparse in
shallower water (Walker et al. 1988). Halodule uninenlis can grow in water up to
30 m deep, as can Amphibolis antarcfica, although both are common in shallow
water (2-3m) (Walker aild Prince 1987). The choice of foraging depth does
appear to be influenced by forage type in some instances. Some dugongs in
Shark Bay were observed to forage on Halophila spinulosa in water 9-1 5 m deep

rather than on Amphibolis in water less than 6 m deep (Anderson 1994).
Halophila rhizomes are rich in carbohydrate, relative to Amphibolis foliage, which
may compensate for the increased costs of diving in deeper water (Anderson
1994).
1.2.2 General Diving Behaviour and Physiology
1.2.2.1 From the classic dive response to a new understanding: a brief history of the field of diving behaviour
People have long been interested in how diving animals can survive
without breathing for extended periods of time. The challenge is and has always
been how to study a process that takes place mostly underwater. Early studies
involved the forcible immersion of physically restrained animals (Irving 1939,
Scholander and Irving 1941). Upon submersion these animals exhibited reduced
aerobic metabolism due to selective peripheral vasoconstriction, bradycardia,
and increased anaerobic metabolism, resulting in the accumulation of lactic acid
in the tissues. These rather extreme physiological reactions, known as the dive
response, were thought to be mechanisms for conserving oxygen for use by
hypoxia-sensitive tissues such as the central nervous system. It was not known
at the time whether animals diving under natural conditions would show the same
suite of responses, although observations of freely diving seals and penguins
seemed to suggest this was not the case (Scholander et al. 1942).
The advent of microelectronics (radio and satellite transmitters, and time-
depth recorders) and microprocessor-based storage devices eventually allowed
researchers to collect data from aquatic birds and mammals during voluntary

dives both in the laboratory and, more importantly, in the field (Kooyman 1965,
Millard et al. 1973, Kooyman et al. 1980, Woakes and Butler 1983, Qvist et al.
1986, Le Boeuf et al. 1988, Woakes 1988, Kooyman 1989). These studies
showed actual performance under natural conditions rather than just their
physiological capabilities under extreme conditions. Studies of voluntary diving
showed what had long been suspected but previously unproved, that the vast
majority of dives were aerobic in nature and did not show the expected dive
response (see reviews in Butler 1982, Butler 1988, Butler and Jones 1997),
although some species did use anaerobic metabolism under certain conditions
(Kooyman et al. 1992, Thompson and Fedak 1993). The voluntary diving
response was shown to be more of a modified form of the exercise response,
rather than the oxygen-conserving, classic dive response, and the more adapted
an animal was to unde~later activities, the more this was true (Butler 1988). It
was during this period that the term aerobic dive limit (ADL) was developed to
denote the point beyond which an animal switched to anaerobic metabolism
(Kooyman et al. 1983). It was also shown that during dives exceeding the ADL,
many of the dive response adjustments (heart rate, peripheral vasoconstriction,
and body temperature) were actually under voluntary control and were not a
"response" at all (Kooyman 1985).
One important advantage to using electronic devices for recording dive
data was the abilrty to link physiological responses to actual behaviours. While
early studies of forced dives dealt mainly with physiological mechanisms, later
studies of voluntary dives examined behaviours and their physiological

implications together. Recently there has been a move back to the laboratory and
the use of forced immersions to further examine physiological mechanisms
experimentally (Stephenson and Jones 1992, Thornton et al. 1997a, Thornton et
al. 1997b), although behaviourat studies of voluntary dives continue to provide a
framework in which to evaluate new physiological findings (Boyd et al. 1997). It
has been suggested that future research should concentrate on the evolution of
the diving response (Hochachka 1997198). So far this has only been
accomplished for pinnipeds (Mottishaw et al. 1999), in part due to a lack of
knowledge about the mechanisms and adaptations underlying the dive response
for other groups of aquatic animals (Mangum and Hochachka 1998). Behavioural
studies will play an important role in gaining this knowledge.
1.2.2.2 Influences on the allocation of time within the dive cycle
The dive cycle consists of a time underwater (submerged time) followed
by a time on the surface. Submerged time can be further divided into foraging
time and travel time between the foraging area and the surface. Allocation of time
within the dive cycle is influenced by a number of often-competing physiological,
behavioural, and environmental factors, many of which are variable. It is the
interaction between physiological constraints, behavioural goals, and
environmental variables that determines the organization of a dive.

1.2.2.2.1 Physiological influences
The physiology of an animal sets upper limits on its diving ability, which
has consequences for its behaviour while diving. For example, the absolute
length of submerged time is determined by how often an animal must surface to
breathe. This, in turn, is affected by the size of available oxygen stores and rate
of oxygen consumption (metabolic rate), as well as by tolerance to increases in
H' levels from carbon dioxide build up. The total body store of oxygen consists of
the storage capacities of the lungs, the blood, and the muscles (Kooyman 1973).
if available oxygen stores are near exhaustion, an animal must either surface or
resort to anaerobic metabolism. Any oxygen debt incurred from anaerobic
metabolism must then be repaid either by more frequent visits to the surface.
which would reduce the average submerged time within a dive bout, andfor by
extended time at the surface, which would reduce the proportion of the dive cycle
spent submerged. The length of surface time is determined not only by the state
of the oxygen debt that has occurred, but also by the rate at which ventilation
takes place at the surface.
i) Aerobic respiration and the aerobic dive limit (ADL)
Oxygen is used by the body to produce energy during strobic respiration.
The aerobic dive limit is defined as the maximum breath-hold possible without an
increase in the blood lactic acid concentration during or after submergence
(Kooyman 1989). The ADL of an animal is largely dependent on its oxygen
consumption rate and available oxygen stores (Lydersen et al. 1992).

While the ADL is positively correlated with body size in many marine
mammals since larger animals have a greater oxygen storage capacity and
slower metabolic rate (Kooyman et al. 1983, Boyd and Croxall 1996, Bums and
Castellini 1996, Kelly and Wartzok 1996), it is also influenced by the behaviour of
the animal. An aquatic animal can either swim fast, resulting in a short ADL,
though covering ground quickly, or it can swim slowly to gain the maximum
submerged time and the greatest distance possible (Kooyman 1989). Whether it
is better for an animal to have a high or low ADL will depend on a number of
factors, including the nature of its food (nutritional value) and the energy required
to capture (or process) and ingest the food. The rate of oxygen consumption is
also influenced by the behavioural activity of the animal while diving. Different
activities require different amounts of energy and this can be expected to affect
submerged time. For example, a dugong at rest will use less oxygen and will be
able to stay submerged longer than a dugong that is rooting for rhizomes.
A theoretical ADL can be computed by dividing the amount of available
oxygen by the rate of oxygen consumption (MR). This is a common method for
determining the onset of anaerobic metabolism under conditions where it is
impractical to measure lactic acid levels in the blood. Theoretical ADLs have
been calculated for a number of species, including California sea lions (Zalophus
califomianus) (Feldkamp et al. 1989), northern fur seals (Callorhinus ursinus)
(Gentry et al. 1986), southern elephant seals (Mirounga leonina) (Hindell et al.
1 992), Weddell seals (Leptonychotes weddeliio (Kooyrnan et al. 1980, Kooyrnan
et al. 1983), northern elephant seals (Mirounga angustimstris) (Le Boeuf et al.

1986). Atlantic walruses (Odobenus msmarus rosmarus) (Nowicki et al. 1997,
Wig et al. 1993). hooded seals (Cystophora cristata) (Cabanac 2000), and
belugas (Delphinapterus leucus) (Shaffer et al. 1997). Total body oxygen stores
are determined from measures of blood volume, lung volume, and blood and
muscle oxygen capacity (Kooyman et al. 1983). Metabolic rate is either
measured or estimated and will depend on the animal's level of activity (Berta
and Sumich 1999). A recent study of northern elephant seals suggests that they
may adjust their metabolic rate throughout a dive (Andrews et al. 1997). This
would cause the ADL to change throughout the dive as well, meaning that ADL
may be better represented by a range rather than a single time limit.
Although in some cases the ADLs calculated from oxygen consumption
rate and available oxygen stores may be closely correlated to actual blood
lactate increases (Kooyman et al. 1980, Kooyman et al. 1983. Schaffer et al.
19971, they may also be longer, or shorter (Kooyman and Ponganis 1998) than
those determined from blood lactate levels. Confirmation of calculated ADL
(cADL) by direct measurement of blood lactic acid concentration has only been
accomplished for five species; the Weddel seal (Kooyman et al. 1980, Kooyman
et al. t983), the California sea lion (Ponganis et al. 1997b), the Baikal seal
(Phoca sibirica) (Ponganis et al. 1997a)' the emperor penguin (Aptenodytes
forsten) (Ponganis et al. 1997c), and the beluga (Schaffer et al. 1997). Because
of this, Butler and Jones (1997) suggest that theoretical ADLs determined from
oxygen stores and oxygen use rates be called calculated ADLs (cADL) and that

ADLs determined from measurements of blood lactate levels be called diving
lactate thresholds (DLT) (see Appendix 1 for cADL of the dugong).
The ADL may also be determined behaviourally by examining the effect of
submerged time on postdive surface time. Diving within the ADL can be inferred
by there being no significant effects of submerged time on postdive surface time,
which will increase exponentially with dive duration if anaerobic metabolism is
used (Kooyman 1989). It has been suggested that this upturn in surface time
occurs beyond the ADL rather than at the ADL (Carbone and Houston 1996, Mori
1999). While this would negate its usefulness in determining the exact ADL, a
dramatic upturn in surface time could still indicate the use of anaerobic
respiration. An alternative method of determining ADL behaviourally is to
examine the effect of depth on foraging time. A model developed by Houston and
Carbone (1992) predicted that, as depth increases, foraging time will increase
then decrease then increase again. The second upturn in foraging time indicates
a sudden increase in the amount of energy supplied by anaerobic respiration
(Carbone and Houston 1996).
A study of Weddell seals that compared the three different methods of
determining ADL (physiological, calculated, and behavioural) concluded that the
methods were not interchangeable, and that this was the case whether the seals
were pups, juveniles, or adults (Bums and Castellini 1996). Physiological AD1
was determined from post-dive plasma lactate levels, calculated ADL was
determined from total body oxygen stores and diving MR (DMR), which was
approximated from the resting MR (RMR), and behaviourai ADL was deterrnined

from TDR records. Behavioural ADL in this case was the dive duration of an
animal that was exceeded by only 5% of its dives (Kooyman et al. 1980,
Kooyrnan et al. 1983). This type of behavioural estimation was found to be
unsuitable for young, rapidly developing animals and possibly unsuitable for older
animals as well (Burns and Castellini 1996), although it continues to be used in
other studies (Nowicki et al. 1997).
ii) Anaerobic respiration
When oxygen is not available for metabolism, glucose can be broken
down through the process of anaerobic metabolism. Anaerobic metabolism
produces only 2 ATP molecules per mole of glucose compared to the 36 ATP per
mole of glucose produced by aerobic metabolism, making it 18 times less
efficient in terms of energy production than aerobic metabolism (Ydenberg and
Ctark 1989). Although aerobic metabolism is the dominant mode of respiration in
diving marine mammals, anaerobic dives are known to occur in some marine
mammals, particularly dun'ng foraging. The main advantage of anaerobic
respiration is that it allows the animal to increase its submerged time beyond the
limit of its oxygen stores, and therefore to increase its foraging time. It can also
allow an animal to avoid surfacing if it feels threatened (Krarner t 987). Dugongs,
for instance, exhibit a reluctance to surface in the presence of divers, perhaps as
a way of reducing their vulnerability of attack from below (Anderson 1984). The
main disadvantages of anaerobic respiration are the increase in recovery time at
the surface necessary to process built up anaerobic metabolites, and the acid-

base disruption (Kooyman et al. 1980). However, anaerobic metabolism is not
always inefficient compared to aerobic metabolism (Mori 1999). The additional
use of anaerobic metabolism is actually preferred in cases where the recovery
time for anaerobic metabolism does not exceed the recovery time required for
aerobic recovery (Carbone and Houston 1996, Mori 1999), such as when the
energetic cost of obtaining additional oxygen is very high (Kramer 1988).
Carbone and Houston's (1996) mixed metabolism model predicted that longer
submerged times can be had for the same surface time when mixed metabolism
is used instead of aerobic metabolism.
A model developed for Western grebes (Aechmophorus occidentalis)
predicted the circumstances under which anaerobic diving was optimal for
predators seeking active prey (Ydenberg and Clark 1989). They determined that
anaerobic diving was optimal under only two circumstances: 1) when the
probability of encountering prey, given that prey were encountered on the
previous dive, was intermediate. and 2) when the probability of encountering
prey, given that prey were not encountered on the previous dive (meaning that it
was difficult to locate a new school), was small. In other words, anaerobic
respiration may be worthwhile in cases where a concentrated, mobile food
source may disappear or be difficult to relocate if the forager surfaces to breathe.
In the case of dugongs, which forage exclusively on non-mobile plants and
sessile invertebrates at relatively shallow depths. it is possible that their ADL is
never surpassed during 'normal" diving.

Another model, developed to predict dive bout organization, came to similar
conclusions about the conditions under which anaerobic metabolism was
favourable (Mori 1998b). This model predicted that anaerobic metabolism was
favourable when prey-patch quality was high, the prey-patch was situated in
deep water, and the prey-patch was hard to find, although this last condition was
not critical. In addition, the mobility of the prey was found to have little effect on
the outcome. This is because the model assumed that prey density would
decrease only during the feeding bout, which is more applicable to the situation
that dugongs face while foraging. Under the predictions of the model, it may be
possible that dugongs use anaerobic respiration when foraging in high quality,
deep-water areas.
1.2.2.2.2 Behavioural and environmental influences
Behavioural and environmental influences affect the allocation of dive time
within physiological limits. Factors such as water depth, individual variation, and
the activity in which the animal engages while diving all have the potential to
affect dive time budgets (Krutikowsky and Mate 2000). Depth and prey type have
been found to affect a number of dive variables in pinnipeds and seabirds, for
example (Schreer et al. 2001). Water depth, in particular, is known to influence
both the submerged and surface times of dives (Kramer 1988, Houston and
Carbone 1992). Deeper dives are generally of longer duration for many air-
breathing aquatic animals, including pinnipeds (Le Boeuf et al. 1988, Feldkamp
et al. 1989, Boyd and Ambom 1991, Boyd and Croxall1992), cetaceans (Dolphin

1 987a. Dolphin 1 987b), sirenians [Anderson 1984). and seabirds (cormorants)
(Wilson and Wilson 1988). Evidence that deeper dives are also followed by
longer surface periods exists for Antarctic fur seals (Arctocephalus gazella)
(Boyd et al. 1 995), hump back whales (Megapiera novaeangliae) (Dclp hin 1 987a,
Dolphin 1987b, Dolphin 1988), bowhead whales (Balaena mysticetus) (Wursig et
al. 1984), tufted ducks (Aythya fuligula) (Carbone et al. 1996), pochard (Athya
ferina) (Carbone and Houston 1994, Carbone et al. 1996), and cormorants
(Phalacmcorax sp.) (Watanuki et al. 1996). Evidence that longer dives are
associated with longer surface periods has been found for guillernots (Uria sp.)
(Wanless et ai. 1988, Monaghan 1 996), puffins (Fmtenula arctica) (Wanless et
al. 1988), Antarctic fur seals (Boyd et al. 1994, Boyd et al. 1995), humpback
whales (Dolphin 1987a, Dolphin 1987b), cormorants (Monaghan 1996), tufted
ducks and pochard (Carbone et al. 1996).
Aquatic animals often dive below the limit of their physiological potential
(i.e. to less than their ADL). Rather, the allocation of time within the dive cycle is
the result of a trade-off between behavioural and physiological costs and
benefits, and will be unique to the environment in which it occurs. One method of
examining the costs and benefits of diving and the underlying behavioural
mechanisms is through the use of optimallty modelling.

1.2.3 Optimal Diving Theory
1.2.3.1 Optimality theory
Optimality theory deals with how an animal should behave in a given
situation to get the maximum benefit for the minimum cost. Costs, or the
constraints on a particular behaviour, are based on knowledge of behavioural
and physiological mechanisms of the study organism. Benefit, or the payoff of a
behaviour in terms of either ftness, or something related to fitness, is expressed
as a currency.
Models of optimal behaviour include assumptions about the underlying
constraints and currencies influencing the behaviour of interest. In the case of
optimal diving, the decision of how deep to dive and how long to spend at that
depth will be influenced by the cost of energy expenditure (measurable as
oxygen consumption) versus the benefit of energy gained while foraging.
Although the benefit gained from diving can be any resource gained while
undenvater, it is usually assumed to be food (Houston and Carbone 1992). Total
costs include the time and energy expended to locate, uncover, ingest and
assimilate food items, increased exposure to predators, and the time and energy
rendered unavailable to other activities such as reproduction (Dolphin 1988).
Each type of forage will have its own associated energy gains, depending on
nutritional quality, and its own associated costs, depending on the depth at which
it is found and the foraging method used to extract the food.
Energy gain is expressed in terns of a currency that is maximized.
Whether the oxygen constraint or the energetic benefit has more influence on the

animal's behaviour will depend on which currency the animal is maximizing: the
proportion of time spent in the resource area, the net rate of energy gain (gross
gain minus cost) over time, or the energetic efficiency (gainlcost) while diving.
The currency will also depend on the scale of the study. A currency can pertain
to an individual dive or to a larger scale such as a dive bout (Boyd et al. 1997).
1.2.3.2 Optimal foraging and optimal diving
Certain principles of optimal foraging theory can be applied to breathing in
aquatic animals. An animal that is foraging in a patchy environment must make
decisions not only about which patches to visit, but, since the rate of food intake
in a given area will decrease over time as the food is consumed, it must also
make decisions about when to leave a patch. The marginal value theorem (MVT)
states that to forage optimally, an animal should leave its patch when the
"marginal capture raten in the patch drops to the average capture rate for the
habitat (Charnov 1976). In other words, it is best to forage in a new patch once
the rate of return in the present patch has fallen to the point where the animal will
probably do better elsewhere.
The logic used to predict how Iong a foraging animal should spend in a
patch can be applied to how long a diver should spend at the surface (Houston
and Carbone 1992). Oxygen can be considered a spatially localized resource,
since it is available only at the surface, and like capture rate in the previous
example, the rate of oxygen gain at the surface also decreases after an initially
high rate of oxygen gain (Kramer 1988). This is because as oxygen stores are

recharged over time, the partial pressure differential declines causing lower
diffusion rates. This means that the optimal oxygen store, and therefore the
optimal surface time, may be less than maximum for a dive of a certain length
(Fig. 1.1).
While the MVT of optimal foraging deals only with maximizing the net rate
of energy gain while foraging, optimal diving is concerned with maximizing the
net rate of oxygen gain while at the surface, which, in turn, allows maximization
of the net rate of energy gain while foraging (Kramer 1988). Maximizing the net
rate of oxygen gain at the surface allows the animal to maximize the proportion of
time it spends on the bottom in the foraging area and therefore to maximize its
rate of energy gain while foraging on the bottom. In other words, if an aquatic
animal can maximize the uptake rate of one (oxygen), it can maximize the uptake
rate of the other (energy). However, as mentioned previously, the optimal oxygen
uptake at the surface may be less than maximum, which means that optimal
submerged time will also be less than maximum. This leads to the optimal
allocation of time during the foraging dive cycle: the optimal surface time and the
optimal foraging time at a given depth to provide the greatest payoff for the least
cost (Fig. 1.2). If it were not the case that oxygen were acquired at a diminishing
rate, then an animal attempting to maximize its time in the foraging area would
always remain submerged for as long as its oxygen stores allowed, regardless of
depth (Kramer 1988).

Max. oxygen stores '
Oxygen gained as a function of bme at the surface
b
Surface Time
Fig. 1 .l. Graphical depiction of the optimal surface time, s', and the optimal oxygen stores, OP* (modified from Krarner 1988 and Houston and Carbone 1992).

Oxygen gained as function of time spent at the surface
Foraging Time (t)
Travel Time IT\
= \ = ' '
Fig. 1.2. Graphical depiction of the optimal allocation of time within the dive cycle for three different travel times, r, showing that as travel time increases, the optimal surface time, s*, also increases, whiIe the optimal foraging time, t*, increases then decreases (modified from Houston and Carbone 1992).

1.2.3.4 Optimality models
Optimality models can be used as tools to investigate the constraints and
currencies of a behaviour in order to understand how the animal is designed, or
to understand how well the animal is designed in terms of adaptation to its
environment (Cheverton et al. 1985). Ultimately, optimality models act as guides
for investigating mechanisms of behaviour. For example, an optimality model can
be used to evaluate different currencies. One can test a hypothesis based on
specific constraint and currency assumptions in relation to a behavioural activity.
If one is certain about the constraints of the model, then any discrepancy
between predictions based on the model and observed behaviour will be due to
the chosen currency.
Optimal diving models can make predictions about the optimal surface
time, optimal submerged time, and optimal depth based on the currency being
maximized. The use of anaerobic metabolism can also be predicted. One of the
goals of this study is to use optimal diving models to examine dugong diving
behaviour by comparing the actual allocation of time observed during dugong
foraging dives to the theoretical allocation of time predicted by the models. This
will not only reveal the usefulness of these particular models in describing
dugong diving behaviour and the accuracy of their assumptions, but will also
serve as a mechanism for understanding what drives dugong diving behaviour
through an examination of the costs and benefits involved and the various
currencies used to express the energy gain. It should be noted that only
qualitative rather than quantitative comparison can be made between the

observed and predicted trends since many of the physiological estimates, such
as the rate of oxygen consumption undewater, are not available and were
beyond the scope of this study to collect.
1 -2.3.5 The models
The "marginal value" approach of optimal foraging theory has previously
been adapted for modelling diving behaviour to predict optimal surface time when
an animal is maximizing the proportion of time spent in the foraging area (Kramer
1988). Houston and Carbone (1992) expanded this model to make predictions
about the allocation of time during the foraging dive cycle and how it changes
qualitatively with increasing depth. They solved for the optimal surface time and
optimal foraging time for aerobic dives at various depths in order to maximize
one of three different currencies. They later refined their original aerobic models
to include the use of anaerobic respiration in the mixed metabolism model and
the switch model (Carbone and Houston 1996). All of the models are based on
the dive cycle being divided into three stages. An animal spends a time on the
surface, s, a time travelling from the surface to the foraging area and back to the
surface, T, and a time in the foraging area, t. Submerged time is therefore tts, the
dive cycle is t+~+s, and the dive-pause ratio is (t+ s)/s.'
1 Symbols as in Houston and Carbone (1992).

1.3 Research Questions and Hypotheses
In this study, I tested several predictions and hypotheses concerning the
effect of activity type and depth on dive cycle duration, and the effect of depth on
the allocation of time during foraging dives. I also compared foraging dive data
collected in 1997 to foraging dive data collected in 1987-89 to determine whether
the allocation of time differed between data sets. Specifically, I addressed the
following questions:
1. Given that dives occur during the course of many different activities. does
activity type influence the duration of the dive? I was specifically interested in
whether dives that occur while foraging, resting, and travelling differed in
dive cycle duration. I predicted that foraging dives would be longer than
travelling or resting dives since foraging dives involve a trip to the bottom
while travelling and resting dives can occur close to the surface. Secondly, I
predicted that resting dives would be longer than travelling dives since less
effort is expended while resting and oxygen stores would not be depleted as
quickly. Finally, I predicted that the length of foraging dives would be more
variable than either resting or travelling dives since foraging dives would be
influenced by factors such as water depth, search time, forage type, and
foraging method.
2. Since dugongs must travel to the bottom when foraging but not when
travelling or resting, would depth affect the different dive types equally? It
seemed likely that foraging dives would be affected by depth while travelling
dives would not Resting dives could be influenced by depth if resting

occurred on the bottom, which is often the case for manatees (Hartrnan
1979) and has been reported for dugongs (Anderson 1979). Resting dives
would not be affected by depth if dugongs rested near the surface.
Based on the outcome of question two, I next asked how depth would affect
those dives that were affected by depth. Were some stages of the dive cycle.
such as submerged time, affected by depth, while others, such as surface
time, were not? Were the various stages affected in the same manner or
not? To answer these questions I turned to dive models developed by
Houston and Carbone (1992) and Carbone and Houston (1996) as a source
of predictions about the allocation of time during diving. I tested eight
predictions, the first seven of which were predictions of the models.
I) Foraging time, t, will increase then decrease as depth increases. Over a wide depth range, foraging time will generally decrease with depth. There will be a second peak in foraging time if anaerobic respiration is used.
ii) Surface time, s, will increase with depth.
iii) Submerged time, t+t, will increase then possibly decrease with depth.
iv) Dive-pause ratio, (t+~)ls, will decrease with depth and may be a nonmonotonic (i.e. oscillating) function of depth.
v) Proportion of the dive cycle spent at the surface, s/(t+~+s). will increase with depth and may be a nonmonotonic function of depth.
vi) Proportion of the dive cycle spent foraging, t/(t+r+s), will decrease with depth.
vii) Surface time, s, will increase with increasing submerged time, t + ~ .
viii) Number of breaths will increase with depth. This would follow from hypothesis iii) if tidal volume is fixed.

4. Did the effect of depth on the allocation of time during foraging dives differ
between the two data sets? If so, was this difference a year effect, a
seasonal effect, or observer bias?
5. Based on whether the data fit the predictions of the models, would it be
possible to determine what currency dugongs maximized? Specifically, did
dugongs maximize the proportion of time in the foraging area, gross rate of
energy gain, net rate of energy gain, or foraging efficiency?
6. How does dugong diving compare to that of other marine mammals and
diving birds? If dugong diving behaviour conforms to theoretical predictions
of models which are based on information from other diving animals, then
dugongs must dive in a manner that is comparable to that of other diving
animals. This would suggest that dugong diving is not unique, or at least that
the costs, benefits, and mechanisms that govern their diving are not unique,
even though dugongs are themselves unique in many ways among diving
vertebrates.
7. Were the models able to qualitatively predict dugong diving behaviour? If
not. what assumptions or criteria associated with the models were
inadequate to describe dugong diving behaviour?

CHAPTER 2: METHODS
2.1 Study Period and Study Site
Observations were collected during the months of September, October,
and November of 1997 in Shark Bay, Western Australia. Observations were
collected from both the eastern and western parts of the Bay, with the majonty
taken from the eastern side, off Monkey Mia. Observations were made during
daylight hours, usually between 8:OOam and 4:OOpm when the angle of the sun
on the water was most favorable for viewing.
2.2 Research Vessels
Dugongs were observed from three research vessels. Most of the
observations in the eastern part of the Bay were made from a 33-ft (10m) sailing
catamaran, Nortrek. which also provided Iiving accommodations. Additional
observations in the eastern part of the Bay were made from a 6 0 4 (18m)
ecotourism catamaran, Shotover, which provided a daily dugong cruise for
Monkey Mia tourists. These cruises were generally three hours in duration and
departed in the afternoons. Visibility aboard Shotover was limited due to the
number of tourists on board, and the size and movements of the boat.
Observations in the western part of the Bay were made from a 45-ft (15m)
ecotourism catamaran, SPV James Scheerer, during a three-day cruise to collect
data specifically for my study.
Two aerial surveys were flown during the study period to locate
concentrations of dugongs in the Bay. The first survey was flown over the

eastern part of the Bay early in the study period. The second survey was flown
over the western part of the Bay at a later date. The results of the surveys are not
presented in this thesis.
2.3 Approach of Animals
Animals were approached by Nortrek or James Scheerer while under saii
or motor power. The boat was usually positioned within 15 to 200 metres of the
animal(s) and repositioned to stay within viewing distance as the animal@)
moved.
Observat~ons from Shotover were made while I was a passenger on the
daily dugong tour and, as such, the method of approach was under the control of
the ecotourism company. Dugongs were generally kept as close to the boat as
possible during these tours, sometimes even passing between the two hutls of
the catamaran.
2.4 Selection and Classification of Study Animals
Attempts were made to collect data from most dugongs that were
encountered. Dugongs were observed either singly or as members of groups
composed of two or more animals. When dugongs were encountered in groups,
an effort was made to observe those on the edges of the group to prevent the
animal under observation from being confused with any other animal. When
observing cows with calves, an effort was made to get times for each. When this
was not possible, times were recorded for cows and calves as a pair.

Dugongs were classified as unaccompanied adults (UA) or cows with
calves (CC). Some CCs were accompanied by a third dugong that was generally
smaller than the cow and was assumed to be the juvenile offspring of that cow.
These groups were classified as trios.
2.5 Data Collection
Ougongs were observed from the deck or crowsnest of the research
vessels using binoculars or the unaided eye. Data were collected through direct
observation so that the activity of the dugongs while diving, and the diving and
surfacing modes could be noted. Dive variables that were measurable by direct
observation included the time spent at the surface, the number of breaths taken
per surface visit, and the time spent underwater between surfacings (submerged
time). Dive variables were timed by a digital stopwatch, and recorded either
directly onto data sheets or into a tape recorder for later transcription.
Observation of an animal was terminated when: (1) the animal moved out
of visible range; (2) the animal was "lostn, i.e. it was not seen to resurface after a
dive; (3) confusion emerged over which animal in a group was being obsenred;
(4) the tape on which the observations were being recorded ran out and there
were no replacement tapes available; (5) the state of the sea or the angle of the
sun became such that it was difficult to spot animals; or (6) in the case of
Shotover, the boat moved away from the animaI under observation.
Information about environmental conditions and habitat variables was
collected at each observation site whenever possible. These concliitions included

water depth, water temperature, % cloud cover, speed and direction of wind, sea
state, types of vegetation, substrate, and invertebrates, and the presence of
other animals in the area that might influence dugong behaviour. Depth was
measured by the vessel's depth sounder. Location in the Bay while aboard
Nortrek was determined by a Gamin 38 Global Positioning System (GPS).
Location while aboard Shotover and James Scheerer was determined by
onboard GPS. Water temperature was measured by taking a bucketful of water
from the surface, placing it on the deck of the boat. and measuring the
temperature with a thermometer. Sea state was estimated using the Beaufort
scale. Type of vegetation and substrate were determined either by examination
of the anchor after it was weighed, by direct examination of the site by
snorkelling, or in some cases through the use of an underwater video camera. If
the water was very shallow (~2m). visual observation from the deck of the boat
was usually sufficient.
2.5.1 Activity Categories
Dugongs were observed while engaging in the following activities:
foraging, resting, travelling, investigating, basking, and fleeing. Foraging was
assumed whenever a dugong dove to the bottom and moved slowly along the
substrate. No differentiation was made between searching for food and actively
rooting for andlor consuming food. Foraging behaviour could be observed
directly in shallow water (c3m). In deeper water (>3m), it was assumed that an
animal was foraging whenever it dove in a more verticaI manner, by arching its
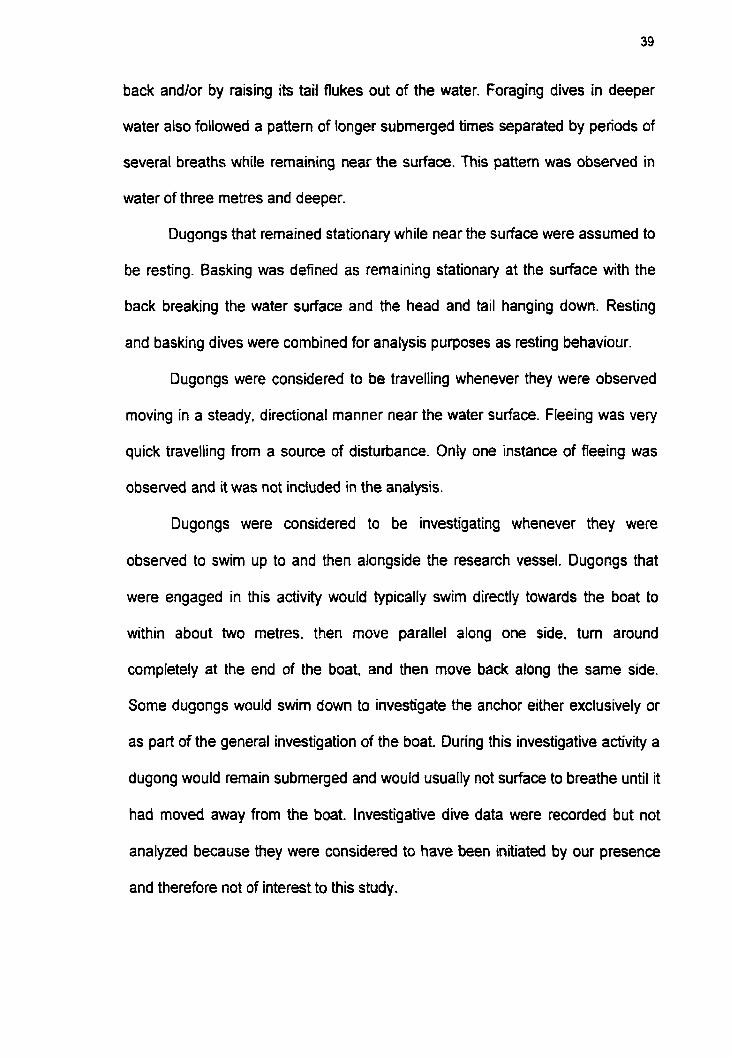
back andlor by raising its tail flukes out of the water. Foraging dives in deeper
water also followed a pattem of longer submerged times separated by periods of
several breaths while remaining near the surface. This pattern was observed in
water of three metres and deeper.
Dugongs that remained stationary while near the surface were assumed to
be resting. Basking was defined as remaining stationary at the surface with the
back breaking the water surface and the head and tail hanging down. Resting
and basking dives were combined for analysis purposes as resting behaviour.
Dugongs were considered to be travelling whenever they were observed
moving in a steady, directional manner near the water surface. Fleeing was very
quick travelling from a source of disturbance. Only one instance of fleeing was
observed and it was not inciuded in the anaiysis.
Dugongs were considered to be investigating whenever they were
observed to swim up to and then alongside the research vessel. Dugongs that
were engaged in this activity would typically swim directly towards the boat to
within about two metres, then move parallel along one side, turn around
completely at the end of the boat, and then move back along the same side.
Some dugongs would swim down to investigate the anchor either exclusively or
as part of the general investigation of the boat. During this investigative activity a
dugong would remain submerged and would usually not surface to breathe until it
had moved away from the boat. Investigative dive data were recorded but not
analyzed because they were considered to have been initiated by our presence
and therefore not of interest to this study.

During an observation period, a dugong would sometimes engage in more
than one type of activity. The dive cycles of these animals were sorted by activity
type before determining separate mean submerged times, surface times, and
numbers of breaths for each activity performed by that animal.
2.5.2 Dive Variable Definitions
2.5.2.1 Diving and surfacing modes
Definitions of diving and surfacing modes are as described in Anderson
and Birtles (1978). According to Anderson and Birttes, dugongs surface in one of
three ways. The "horizontal" mode of surfacing occurs when the animal breaks
the surface in the horizontal plane as it slowly moves fonuard. A small portion of
the head or trunk emerges, then the snout is wrinkled so as to raise the nares
above the surface of the water for exhalation and inhalation. The eyes and ears
do not appear. The second mode of surfacing is the "high horizontal" mode
where the dugong's body heaves upward out of the water at an angle of up to 45
degrees. The snout is tossed up and back as the animal sinks so that the nares
stay clear of the water during inhalation. The eyes may clear the water as well.
The third mode of surfacing is the "vertical" mode where the animal emerges
straight upward or rolls upward in an arc without foward movement. The eyes
and ears clear the water's surface allowing the animal to survey its above-water
surroundings.
After surfacing in the horizontal or high horizontal mode, submergence
can occur either with the animal sinking gently beneath the surface as it moves

foward, or in a more foroefully downwarddirected motion, or roll, with the back
arching above the surface as the animal descends at a steeper angle, much like
a surface dive. The tail flukes are often lifted above the water surface during
these steep dives. A third method of submergence is to sink tail first beneath the
surface. This is primarily done by large individuals after surfacing in the high
horizontal or vertical mode (Anderson and Birtles 1978).
Dives that were observed to begin with the sinking or rolling dive mode are
referred to in the text as 'sink divesn or "roll dives", respectively, while those that
began with the tail flukes being lifted above the surface are referred to in the text
as "fluke dives". No "sink dives" were observed in 1997.
2.5.2.2 Surface time
Surface time could be as short as one breath, including only the period
during which the nostriis were above the surface, or it could extend for several
breaths, during which time the snout was raised and lowered repeatedly with
each breath while the animal remained near the surface (Fig. 2.1). These
relatively shortduration submerged periods that occur between breaths are
referred to by some as 'surfacing" dives (Baird et al. 2000) or "recovery" dives
(Gallivan et al. 1986). In the current study, surface periods that included more
than one breath alternated with submerged times of longer duration, generally
when foraging at depths of three metres or more. These longer submerged
periods were preceded by roll or fluke dives, indicating a return to depth. Only
postdive surface times were used whenever surface time was analysed.
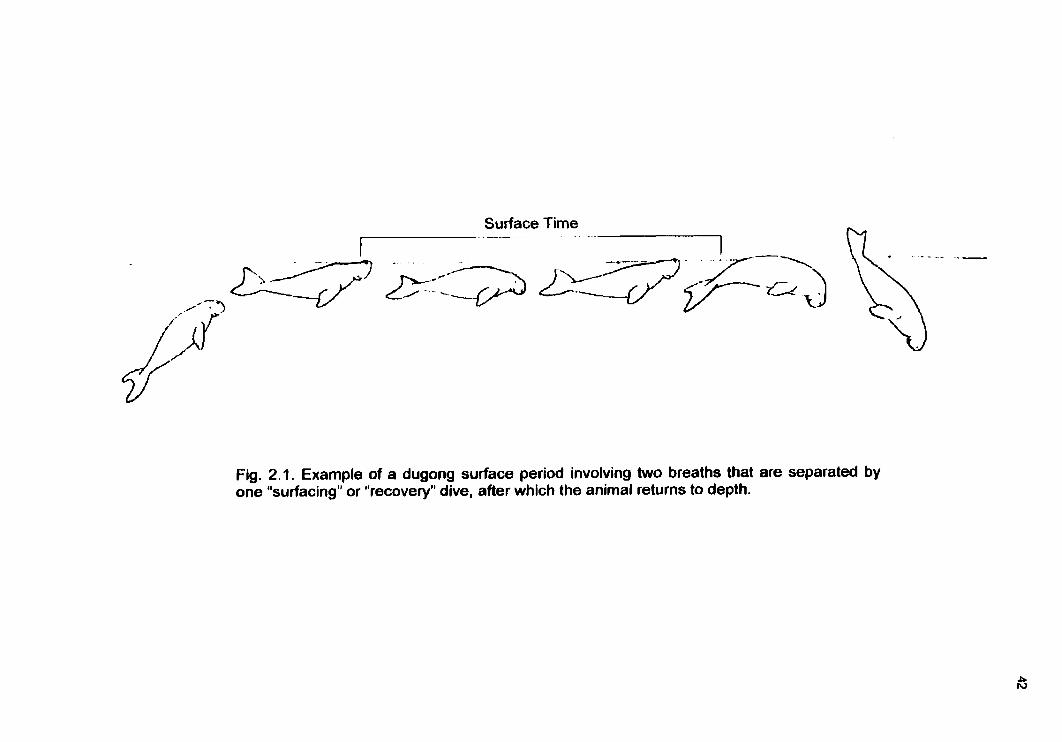
Surface Time
I--- - I --.._ ,-
Fig. 2.1. Example of a dugong surface period involving two breaths that are separated by one "surfacing" or "recovery" dive, after which the animal returns to depth.

2.5.2.3 Submerged time, foraging time, and travel time
Submerged time was the time spent undennrater between surface periods.
For foraging dives, this included both the round-trip travel time to depth and the
time spent in the foraging area. Foraging time was calculated by subtracting
travel time from submerged time. Round-trip travel time was calculated as
described in subsection 2.5.3.
2.5.2.4 Dive cycle duration
The dive cycle durations used in the analysis of the effect of depth on
foraging dives consisted of submerged time plus the subsequent (or postdive)
surface time. The dive cycle durations used to analyze the effect of activtty on
dive cycle duration inciuded predive surface times rather than postdive surface
times. This allowed more dives to be included in the analysis.
2.5.3 Rate of Travel
Travel rate was determined from underwater observations of travel times
between the bottom and the surface that were collected by Dr. P.K. Anderson in
1983. The observations were made visually while snorkelling and were timed by
stopwatch. The travel times were used to determine a mean travel rate (misec)
from which mean round-trip travel time was calculated for each depth. It is
unknown whether the sample units (i-e. dugongs) are independent in this data
set.

2.6 Additional Observations
Observations collected in Shark Bay during 1987 to 1989 by Dr. P.K.
Anderson were used in this study in addition to my own data from 1997. They
were combined with the 1997 data for the analysis of the effect of activity type on
dive cycle duration, and were also compared separately to the 1997 data in the
section examining the effect of depth on the allocation of time within the foraging
dive cycle. The 1987 data were collected during October, the 1988 data were
collected during January to March and July to December, and the 1989 data
were collected during February to April and June to October. These observations
were made from Nortrek in the manner described previously. Water temperature
was measured differently than in 1997. Samples were obtained by letting a bottle
fill up as it sank to the bottom, rather than taking surface samples. Similar data
were collected, although surface times were not noted or were added to the
submerged times to give the total dive cycle duration. The number of breaths
was also not noted in many cases. Only data with separate submerged and
surface times were used in the analysis of the effect of depth on these variables.
Only total dive cycle data were used to analyze the effect of activrty type on
diving due to a lack of resting dive data with separate submerged and surface
times.
Several additional activity categories were observed during 198789 that
were not observed in 1997. These activities are believed to be associated with
male lekking behaviour (Anderson 1998) and were not used in this study.

2.7 Data Sheets
Data from 1997 were recorded on two types of data sheets. The Site Data
Sheet (Appendix 2) was used to record general data whenever dugongs were
encountered. It provided a record of the location, depth, date, time,
environmental conditions, habitat variables, the number and activrty of dugongs
encountered, and a brief overview of the kind of data collected and the
equipment that was used during each encounter. The Dive Data Sheet (Appendix
3) was used to record inforrnation about each animal and its dives. One Dive
Oata Sheet was used per individual animal or cow and calf pair. Dive Oata
Sheets provided a record of the dugong under observation and contained
inforrnation about the dive variables, diving and surfacing modes, and the activrty
of the animal being recorded. General information about the animal was afso
recorded on the Dive Data Sheets, such as its relative size, whether it was an
unaccompanied adult or a cow and calf pair, whether it had any distinguishing
marks or features, and the depth of the area where it was diving.
2.8 Data Management
Both the Site Data Sheets and the Dive Data Sheets were produced using
a database program (MS@ Access 97) and functioned as data entry forms both
in the field and on the computer. Data recorded on the hard copy sheets were
entered into the interactive computer forms, which automatically produced tables
of the 1997 data for analysis and reporting purposes.

Data from 1987-89 were first entered into a spreadsheet (MS@ Excel 97),
then imported into the database and appended to the 1997 data using a union
query. Travel time data from 1983 were entered into a separate Excel
spreadsheet and analyzed separately from the data in the database.
2.9 Data Analysis
Statistical analyses were done using SPSS@ Systat 8.0 for Windows.
Regression analysis and analysis of covariance (ANCOVA) were used to
determine whether activity type had an effect on dive cycle duration. Multiple
linear regression analysis was used to characterize the relationship between
foraging dive cycle variables and depth, and also to compare the foraging data
collected in 1997 to the foraging data collected in 1987-89. The critical cut-off
point for all tests was a=0.05. Two-way analysis of variance (ANOVA) was used
to detect any effects of travel direction (up or down) andlor water depth on the
rate of underwater travel.
I assumed that dugongs were sampled randomly from the population in 1997
and that they were not sampled more than once. These assumptions were based
on the observation that the animals were consistently moving southward during
the study period while on their spring migration to the southern reaches of the
Bay. Since we searched a rather small area of the Bay, I felt that the available
sample of dugongs changed on a daily basis. Additionally, special care was
taken when observing animals in groups to observe any one animal only once.
The raw data from 1987-89 contained a number of identified individuals that were

observed repeatedly over a period of time. These known animals were not
"sampledn more than once from the 1987-89 data set. It was assumed that the
unknown individuals from the 1987-89 study period were sampled randomly from
the population and that they were also not sampled more than once, based on
date and site information.
2.9.1 Rules for Dropping Terms
Multiple linear regression was used to examine the relationships between
depth and the foraging dive variables. For each relationship the data sets from
1997 and 1987-89 were regressed using one model which employed a dummy
variable, d l , to represent each data set in turn during the analysis. The 1997
data set was represented by the dummy variable, dl=0, so that it acted as the
reference line. The 1987-89 data set was represented by the dummy variable,
d l =l. The use of one model to regress both data sets simultaneously allowed me
to produce separate regression equations for both data sets while statistically
comparing one data set to the other. This method results in regression equations
that are a compromise between the best-fit equations that would arise for each
data set were they regressed separately.
The regression equation for both the 1997 and 1987-89 data sets was
described by the following initial model:
y = Po + PI"X + Pz'dI + P3* 2 + Ps*dlUx + psUdl*?
where, Po = intercept of 1997 data,
Pt*x = slope for 1997 data,
P2'dl = increment in intercept for 1987-89 data,

p3*x2 = rate of change in slope for 1997 data.
p4*dl *x = increment in slope for 1987-89 data,
p5*dl*x2 = increment in rate of change in slope for 1987-89 data.
The null hypothesis was that no significant difference existed between the
1997 and 1987-89 regression equations in terms of intercept, slope, andlor rate
of change of slope, and that the data sets therefore came from the same
population. If the increments in intercept, slope, and rate of change in slope from
the reference line were non-significant, the null hypothesis was not rejected. An
u-value of 0.05 was used to determine whether the increments in intercept,
slope, andlor rate of change in slope were significant and should be kept in the
final model, or whether they were non-significant and should be discarded. A p-
value of 0.05 or less was considered significant, so terms with this value were
kept in the model. Terms with a p-value greater than 0.05 were discarded from
the model. This backward stepwise elimination of insignificant terms from the
initial model produced the final model comparing the 1997 and 1987-89 data sets
for each relationship of interest.
Low tolerance values (~0.1) resulting from autocorrelation of the data sets
made it necessary to transform the data before performing the regression
analyses. The data were transformed by subtracting the mean of the
independent variables from each of the independent variable data points. For
example, 1 subtracted six from each depth when depth was the independent
variable, and subtracted 202 from each submerged time when submerged time
was the independent variable. The resulting regression equations were then

back-transformed to eliminate the transformations from the final models. Back-
transformation was accomplished by algebraic manipulations (multiplying through
the transformation terms followed by combination of like terms) (Appendix 4).
2.9.2 Exclusion Criteria
Observations were rejected from analysis if, (1) it was difficult to determine
whether all the observations were from one animal, i.e. when I couldn't tell
whether the animal that just surfaced to breathe was the same animal that I had
previously seen dive. This occurred occasionally when observing groups of
animals or when obsewing cows with calves, and was the most frequent reason
for rejecting an observation; (2) the sea state was higher than three on the
Beaufort scale, which made it difficult to see when an animal surfaced; or (3) a
surface time did not have a preceding submerged time. This last criterion applied
only to data used in the allocation of time during foraging dives section.
2.10 Models
2.1 0.1 Assumptions
Houston and Carbone's (1992) models make several assumptions regarding
the behaviour of the divers. Firstly, the animal is assumed to be able to eat while
undewater so that capture of prey does not terminate the dive. Dugongs fit this
assumption since they consume all of their food while submerged.
Secondly, foraging time may indude periods of consumption and periods of
travelling between patches of food. My data compiy with this assumption since

dugongs moved between patches of seagrasses during foraging dives, no
distinction was made between active feeding and searching during foraging
dives, and bottom time was considered to have been spent foraging.
The third assumption is that oxygen gains and losses are balanced over the
dive. All the oxygen gained while the animal is at the surface is used white
underwater so that the dives are not only aerobic. but that no reserve of oxygen
is left upon surfacing. This is also assumed when calculating ADLs, which is in
contradiction to Butler (1982), who states that aerobic dives are usually
terminated well before oxygen stores have been depleted in both diving birds and
mammals. This reserve of oxygen is necessary for the functioning of the central
nervous system (Butler and Jones 1997). Since the amount of remaining oxygen
stores upon surfacing from a dive would affect the rate of oxygen uptake at the
surface, this assumption could affect the predicted allocation of times. For
example, the rate of oxygen uptake at the surface would be faster if oxygen
reserves were more depleted. Also, measurements of lactate concentration in the
blood of some divers suggest that anaerobic metabolism begins before all
oxygen stores are depleted (Butler and Jones 1997). This scenario is addressed
by the mixed metabolism model (Carbone and Houston 1996).
The fourth assumption is that the rate of travel between the surface and the
foraging area does not change with depth, which allows round-trip travel time to
represent depth in the model. If an animal swims at a constant rate, then round-
trip travel time is proportional to depth (Houston and McNamara 1994). Data
used in my study suggest that dugongs do have a constant rate of travel between

the surface and the bottom regardless of depth or direction of travel. This also
complies with the models' assumption.
The ffih assumption is that the rate of oxygen use while travelling
underwater can differ from the rate of oxygen use while foraging. The aerobic
models examine cases where the rates of oxygen use while travelling and
oxygen use while foraging are different and cases where they are equal. For
dugongs, the rates of oxygen use could differ depending on how much effort it
takes to travel to depth, to the surface, and to forage on different species of
seagrass and invertebrates. However, since rates of oxygen use were not
measured for this or any other dugong study, they are unknown. The model may
provide some insight into this area depending on which scenario of oxygen use
rate from the modef best ffis the actual data.
And finally, while the aerobic models test three different currencies, Houston
and Carbone (1992) focus on the proportion of time spent in the foraging area as
the main currency. Any model that is based on this currency assumes that the
rate of energy gain from foraging is proportional to the time spent in the foraging
area (Houston and McNamara 1994).
2.10.2 Currencies
Houston and Carbone (1992) tested three currencies with their aerobic
models. The first currency was the proportion of time spent in the foraging area.
This is equal to the proportion of the dive cycle that is spent in the foraging area,

relative to the amount of time spent on the surface and during ascent and
descent (travel time).
foraqino time dive cycle duration
The second currency tested was the net rate of energy gain, which is the
gross rate of energy gain minus the energy used to travel and forage over the
total dive cycle.
energv qained - enerav ex~ended dive cycle duration
The third currency tested was foraging efficiency, or the proportion of
energy gained relative to energy expended.
enerclv oained energy expended

CHAPTER 3: RESULTS
3.9 Introduction
Activity type while diving affected mean dive cycle duration. Resting dives
were longer than travelling dives, while foraging dives were longer than either
resting or travelling dives when depth was greater than three metres. When
depth was less than three metres, foraging dive duration was comparable to that
of resting and travelling dives. Onty the duration of foraging dives was affected by
water depth.
When foraging dives were examined exclusively, alt of the foraging dive
cycle variables were found to be affected by depth. Most of the variables
increased with depth. However, the proportions of time spent foraging, tl(t+t+s)
and tl(t+~), decreased with depth, as did the proportion of time spent submerged,
(t+r)/(t+r+s), and the dive-pause ratio, (t+t)ls. Surface time, s, increased with
increasing submerged time, t+t.
The 1997 and 1987-89 data sets were shown to be significantly different
for all of the dependent variables except for the relationship between the
proportion of the dive cycle spent foraging, tl(t+~+s), and depth, where the data
sets were found to be from the same population. Overall, the dive cycte variables
from the 1997 data set were longer in duration, and the trends more pronounced,
than in the 1987-89 data set.
Detailed results for each relationship are presented in the following
subsections. The text contains the regression equations that describe the data
sets. The equations have been back-transformed, making the regression

coefficients different from those shown in the statistical output. The graphical
representation of each relationship includes the regression equation for each
data set separately, also after back-transformation. The statistical output for each
relationship, which presents the regression coefficients before back-
transformation, is supplied in table format in Appendix 5.
3.2 Sample Description
3.2.1 Combined Data Set
Data from both the 1997 and the 1987-89 data sets were combined to test
the effect of activity type and depth on dive cycle duration. This was necessary in
order to have a sufficient number of dives within each activity category. The
combined data set contained observations of 333 UA dugongs (or sample units)
collected from all over Shark Bay and covering a depth range of 0.7 to 12.5
metres. Of the 3947 dive cycles recorded, 58.3% occurred while foraging, 11.9%
while travelling, and 9.9% while resting. Observations from 154 of the 333
dugongs were considered useabie, 74 from the 1997 data set and 80 from the
1987-89 data set (Table 3.1). The majority of the observations occurred while the
animals were foraging (59%), followed by travelling (30%), then resting (1 1%).
The effect of activity type was analysed on dive cycle duration as a whole, rather
than on the components of the dive cycle separately, because surface times
were not available for many of the 1987-89 observations.

Table 3.1. Composition of combined data set used for activity type results. Only the useable observations are induded in the table.
1997 Data Set
1987-89 Data Set TOTAL
# Animals Oh # Animals % # Animals %
ACTIVITY
Foraging 3 1 42 60 75 91 5 9
Travelling 37 50 9 11 46 30
Resting 6 8 11 14 17 11
TOTAL 74 100 80 100 154 100

3.2.2 1997 Data Set
At least 137 dugongs were obsewed during 1997, consisting of 91
unaccompanied adults, 20 cow-calf pairs, and 2 trios, over a depth range of 0.7
to 12.5 metres. Adults made up 82.5% of the observed animals, while calves and
juveniles made up 17.5%. Only unaccompanied adults (UAs) were used in the
analysis. Thirty-one of the 91 UA dugongs were observed while foraging. Of
those 31 foraging animals, data from 28 were used in the analysis of the
allocation of time during foraging dives. These were compared to foraging data
collected in 1987-89.
The 1997 data set was composed of observations made exclusively during
the spring, mostly from the eastern portion of Shark Bay (Fig. 3.1, Table 3.2).
Water temperatures ranged from 21 - 24.5 "C, with an average temperature of
22.1 "C. Forage was mostly restricted to Amphibolis antarctica, particularly in the
shallow sites, or was unknown or absent. Halophila spinulosa was observed
sprouting in the western portion of the Bay towards the end of October. Halodule
uninewis was present at a few sites during the entire 1997 sampling period
(Sept. to Nov.), although it does not reach its peak biomass and rhizome
productivity in Shark Bay until the month of January (Anderson 1998) Two of the
28 animals fed on sea pens rather than seagrass.

a8 1 animal * 3 animals
4 animals 0 5 animals
6 animals
Fig. 3.1. Map of Shark Bay, showing sites of 1997 foraging obsenrations (modified from Walker et al. 1988).

Table 3.2. Site information for 1997 data set.
Animal Month - Site Water Temp ' C Foaae Tv~es
1 Sept Monkey Mia 21 Amphibolis antarctica. Halodule unmervis
2 Sept Monkey Mia 21 A. antarctica
3 Sept Monkey Mia 21 A. antarctica
4 Sept Wooramel Bank 21.1 A. antarctica
5 Sept. Wooramel Bank 21.5 A. antarctica
6 Sept Wwramel Bank 21.5 A. antarctica
7 Sept Wooramel Bank 21.5 A. antarctica
8 Sept. Wooramel Bank 21.5 A. antarctica
9 Oct Wwramel Bank 21.5 A. antarctica
10 Oct Wooramel Bank 21 5 A. antarctrca
11 Oct Wooramel Bank 21 .S A. antarctica
12 Oct Wooramel Bank 21.5 A. antarctica
13 Oct Wooramel Bank 21.5 A. antarctica
14 Oct Wwramel Bank 21 .5 A. antarctica
15 Oct. Monkey Mia 21.5 A. antarctica
16 Oct Monkey Mia 23.5 A. antarctica
17 Oct. Charlie's Rock 22.5 A. antarctica. H. uninervis, Pos~donra, little bit Halophila sprnulosa
18 Oct south of Three Bays Island 22.3 H. uninervis. H. sprnulosa
19 Oct south of Three Bays Island 23 H. uninervis. H. sprnulosa
20 Oct south of Three Bays Island not available sea pens
2 1 Oct south of Three Bays Island not available sea pens
22 Oct Monkey Mia not available unknown
23 Oct Monkey Mia not available unknown
24 Oct. Monkey Mia to Wooramel 24.5 Bank
25 Oct Monkey Mia to Wooramel 24.5 Bank
26 Oct Monkey Mia to Wooramel 24.5 Bank
27 Nov. Monkey Mia 23
A. antarctica
none (on anchor)
none (on anchor)
A. antarctica
28 Nov. Monkey Mia 22.8 A. antamtica

3.2.3 1987- 89 Data Set
At least 196 dugongs were observed during 1987-89, consisting of 122
unaccompanied adults, 34 cow-calf pairs, and 2 trios, over a depth range of 1 to
12 metres. Adults made up 80.6% of the observed animals, while calves and
juveniles made up 19.4%. Only unaccompanied adults (UAs) were used in the
analysis. Sixty of the 122 UA dugongs were observed while foraging. Of those 60
foraging animals. 25 were used for the analysis of the allocation of time during
foraging dives.
Most of the observations in the 1987-89 data set were collected in 1988 and
1989, and almost all of the animals were observed in the western portion of
Shark Bay, mostly during the winter (Fig. 3.2, Table 3.3). Because of the limited
useable data from 1987 and 1989, no attempt was made to detect differences
among years. Water temperatures ranged from 18 - 25 "C, with an average
temperature of 19.5 "C. Forage was mostly restricted to Amphibolis antarctica, or
was scarce or absent. In four instances. animals were foraging for invertebrates.

2 animals 3 animals 6 an~mals 9 an~mals
Fig. 3.2. Map of Shark Bay, showing sites of 1987-89 foraging observations (modified from Walker et al. 1988).
Table 3.3. Site information for 1987-89 data set.
Animal Month Water T e m ~ 'C - Site
1 1987 Oct 21 Monkey Mia
2 1987 Oct 21 Monkey Mia
3 1988 Jan. u/a Prickly Point
4 1988 Feb. 25 Three Bays Is.
5 1988 July 20 Sandy Point
6 1988 July 18.8 Notch Point
7 1988 July 18.8 Notch Point
8 1988 July 18.8 Notch Point
9 1988 July 18 Notch Point
10 1988 July 17.6 Notch Point
11 1988 July 18.5 Notch Po~nt
12 1988 July 18.5 Notch Point
I 3 1988 July 18.2 Notch Point
14 1988 August 18 Notch Point
15 1988 Sept. 19 Three Bays Is.
16 1988 Sept. 19 Three Bays Is.
17 1988 Sept 18.8 Three Bays Is.
18 1989 June 18.9 Notch Point
19 1989 June 19.8 Louisa Bay
20 1989 June 19.3 Shagmia
2 1 1989 June 19.3 Shagmia
22 1989 June 19.7 Louisa Bay
23 1989 June 19.7 Louisa Bay
24 1989 August 20.5 Louisa Bay
25 1989 Sept 21 South Cove
Fonae T v w s
A. antarctica
H. ovalis. H. uninervis
H. uninervis (sparse), Posidonia (scattered)
A. antarctica (assumed)
invertebrates
invertebrates
invertebrates
invertebrates
A. antantica
A. antarctica
A. antarctica
A. antarctica
A. antarctica, H. unrnervis
H. spinulosa. H. ovalis
H. sp!nulosa, H. ovalis
H. spinulosa, some H. uninervis
A. antarctica
A. antarctica
A. antarctica
A. a n t a m
A. antarctrrctrca
A. antarctica
A. antarctica
sparse, not examined

3.3 Effect of Activity and Oepth on Dive Cycle Duration
The mean durations of foraging, resting and travelling dive cycles, t+~+s,
were compared at various depths (Fig.3.3). Dive cycle duration showed an
increasing but decelerating relationship with increasing depth when animals were
foraging, but was not affected by depth when animals were resting or travelling.
This difference between the foraging dives and the resting or travelling dives was
confirmed by comparing the slopes of the three trends. The interaction between
depth and activity was significant when comparing all three activities (ANCOVA;
F rz,lssI=68.480, pc0.05) (Appendix 5, Table 3.4), but was non-significant when
resting and travelling dives were compared to each other (ANCOVA; F [1,571 =
0.202, p > 0.05) (Appendix 5, Table 3 3 , indicating parallel slopes for these two
activities. Further analysis of the resting and travelling dives showed a non-
significant effect of depth on slope (ANCOVA; F [l.581 = 0.045, p > 0.05)
(Appendix 5, Table 3.6). Resting dives had a significantly higher mean dive cycle
duration (73.3 r 6.3 sec) than did travelling dives (53.7 i 3.9 sec: (ANOVA; F
[r.581= 7.080, p c 0.05). Mean dive cycle duration while foraging was greater than
while either resting or travelling when beyond the three metre depth, but was
comparable in shallower water (Fig. 3.3).

Foraging m Resting o Travelling
Fig. 3.3. The relationship between dive cycle duration and depth for three activities. Each data point represents the mean duration for one animal.

3.4 Travel Rate
Travel times in seconds were obtained from ten animals during 1983 over
a range of five depths (3, 3.75, 4.5, 6.4, and 8 m). Two directions of travel were
observed: descent from the surface to the bottom and ascent from the bottom to
the surface. An average of t.6 down times and an average of 2.3 up times were
collected per animal, for a total average of 3.9 travel times per animal. Depth
and/or direction of travel did not significantly affect rate of travel (ANOVA: depth
F ,;.,, = 0.466, pp0.05; direction F t l , ~ l = 0.024, p0.05; interaction F [3.81 = 0.266,
p 0 . 0 5 ) (Appendix 5, Table 3.7), so the mean rate of travel for each of the ten
animals was averaged and a combined mean rate of travel of 0.42 +_ 0.047 mlsec
was used in the study. However, it must be noted that subsequent power
analysis of the data showed a significantly high probability of Type II error
(direction of travel P=0.944; depth P=0.826; interaction P=0.918).

3.5 Effect of Depth on Dive Mode
Data from 1997 were analyzed for the effect of depth on dive mode. The
analysis included 38 animals and 233 dives. Dive mode was found to be affected
by depth (Fig. 3.4). Dives in water less than 2.3 metres deep were predominantly
(95.9%) sink dives. From 2.3 to 3.2 metres, 48.6% were sink dives and 51 -4%
were either roll dives or fluke dives. Beyond 3.2 metres, 85.7 to 100% of the
dives were roll or fluke dives. The 1987-89 data were not included due to lack of
dive mode information.

f
- - -
- - . -.
Sink I RoIVFluke
-
r T r
Fig. 3.4. Histogram showing the effect of depth on dive mode in 1997.

3.6 Allocation of Time during Foraging Dives - A Test of Optimality Models
3.6.1 Effect of Depth on Foraging Dive Cycle Variables
3.6.1 -1 Dive cycle duration
Dive cycle duration, t-s, increased with depth in a curvilinear manner for
both the 1997 and 1987-89 data sets (Fig. 3.5). The best fitting line was a
quadratic (dive cycle duration = -19.37 + 73.312'depth - 69.975'dl -
3.738*depth2; Regression; F p.uj = 40.205, p c 0.05) (Appendix 5, Table 3.8).
Both data sets had parallel slopes at the intercept (73.312). The 1997 data set
had a higher intercept (-19.37) than the 1987-89 data set (-89.345). Visual
inspection of the data shows that dive cycle durations were generally longer in
1997 than in 1987-89 (Fig.3.5).
Fig. 3.5. Effect of depth on dive cyde duration. r + t + s. Each data paint represents tile mean value for one animal in all graphs.

3.6.1.2 Submerged time
Submerged time, t * ~ , increased with depth in a curvilinear manner for both
data sets (Fig. 3.6). The best fitting line was a quadratic (submerged time = -
6.981 + 57.872'depth - 53.969'dl - 2.777*depth2; Regression; F pqM1 = 37.946.
p c 0.05) (Appendix 5. Table 3.9). The 1997 data set had a higher intercept (-
6.981) than the 1987-89 data set (-60.95). Both data sets had parallel slopes at
the intercept (57.872). The 1997 data set generally had longer submerged times
than the 1987-89 data set (Fig.3.6).
Fig. 3.6. Effed of depth on submerged time, t + t

3.6.1 -3 Travel time
Because a constant rate of travel (0.42 mlsec) was used to determine
travel time rather than measuring it directly, round-trip travel time, t. increased
proportionately with deph by 4.76 seconds for every metre of depth (travel time =
4.76'depth) (Fig. 3.7) (Appendix 5, Table 3.10).
Fig. 3.7. Effect of depth an round-tnp travel time. t

3.6.1 -4 Foraging time
Foraging time, t, increased with depth in a curvilinear manner for both data
sets (Fig. 3.8). The best fitting line was a quadratic (foraging time = -6.98 +
53.1 l'depth - 53.969'dl - 2.777*depth2; Regression; F p . 4 4 = 26.608, p c 0.05)
(Appendix 5. Table 3.1 1). Both data sets had parallel slopes at the intercept
(53.11). The 1997 data set had a higher intercept (-6.98) than the 1987-89 data
set (-60.949). Time spent in the foraging area was generally longer in 1997 than
in 1987-89.
C - 01
! roo ¶L
Fig. 3.8. Effect of depth on foraging time, t.

3.6.1.5 Surface time
Surface time, s, remained low (one or two seconds) and relatively
constant for depths less than 2.3 m during 1997 (Fig. 3.9a). There were almost
no data available from 1987-89 at these shallow depths for comparison. Between
2.3 and 11 metres, surface time increased in a curvilinear fashion with depth for
both data sets (surface time = -9.490 + 14.859'depth - 17.051'dl -
0.929*depthi: Regression; F p,3gl = 8.331, p < 0.05) (Fig. 3.9a) (Appendix 5.
Table 3.12a). Both data sets had positive, parallel slopes (14.859), while the
1997 data set had a higher intercept (-9.490) than the 1987-89 data set (-
26.541). Visual inspection of the data shows that surface times were generally
longer in 1997 than in 1987-89 (Fig.3.9a).
The effect of depth on surface time can be divided into two phases
(Fig.3.9a). Phase one, at depths less than 2.3 m, showed no effect of depth on
surface time. Phase two, at depths of 2.3 to 11 m, did show an effect of depth on
surface time. Surface time therefore appears to be unaffected by water depth
until a threshold depth of about 2.3 m is reached, beyond which surface time
increases with increasing depth.
I felt it was best to analyze the two phases of the relationship separately to
highlight their different trends. Examining the phases separately allowed me to
focus primarily on the trends seen in phase two, which was beneficial for two
reasons. Firstly, phase two included the region of depths the data sets had in
common. Focusing on this common region allowed the data sets to be regressed
together and compared to each other. Comparing the data sets to each other, by

analyzing them together rather than separately, increased the power of the
analysis. Secondly, phase two included the region where the dive variables were
generally affected by depth. The questions of whether the dive variables were
affected by depth, how those variables were affected by depth, and whether the
resulting trends ft the predictions of the dive models are the major focus of this
study. Although the observation that the dive variables were not affected by
depth in the phase one region was interesting, it did not lend itself to detailed
analysis or comparison to the dive models' predictions, and therefore needed to
be isolated from the rest of the data during the regression analysis in order to
allow the trends in phase two to become apparent.
When the data sets were regressed separately in the phase two region,
two different trends were observed. The 1997 data set showed a curvilinear
increase with depth in the phase two region (2.3 to 11 metres) (surface time = -
23.569 + 21.048'depth - 1.451'depth2; Regression; F pill = 4.797, p 4 0.05)
(Fig. 3.9b) (Appendix 5, Table 3.12b). wt-lile the 1987-89 data set, which was
composed mostly of data points in the phase two region, showed a linear
increase in surface time with depth (surface time = 4.035 + 3.383'depth;
Regression; F [I.,, = 16.762, p c 0.05) (Fig. 3.9~) (Appendix 5, Table 3.12~).
From this point in the results onward, the phase one data points are
represented in the plots by open symbols whenever they are not part of the
regression analysis. They have been retained in the plots for comparison to the
phase two trends.

Fig. 3.9. Effect of depth on surface time, s. Regressions for, a) both data sets from 2.3 - 11 m, b) 1997 data set from 23 - 1 1 m, and c) 1987-89 data set overfull depth mnge. Graph a) illustrates the two-phase trend of surface time with depth (see text for details). Data points represented by open symbols were not included in the regression anatyses.

3.6.1.5.1 Surface time by submerged time
Surface time was also plotted against submerged time for comparison with
studies that use this relationship to estimate the onset of anaerobic respiration.
Surface time remained low (one or two seconds) and relatively constant for
submerged times of less than 90.5 seconds in 1997 (Fig. 3.10). Insufficient data
were available from 1987-89 at these low submerged times for comparison. At
submerged times of 90.5 seconds and longer, surface time increased linearly
with submerged time for both data sets (surface time = 14.024 +
0.119'submerged time - 10.194*61; Regression; F ~ 3 ~ 1 = 13.654, p c 0.05)
(Appendix 5, Table 3.13). Both data sets had positive, parallel slopes (0.1 19),
while the 1997 data set had a higher intercept (1 4.024) than the 1987-89 data set
(3.380)-
The trend shown in Figure 3.10 can be divided into two phases, as was
done with the surface time by depth trend. Phase one, at submerged times betow
90.5 seconds, showed no effect of submerged time on surface time. Phase two,
at submerged times greater than 90.5 seconds, did show an effect of submerged
time on surface time. Surface time therefore also appears to be unaffected by
submerged time until a threshold submerged time of about 90.5 sec is reached,
beyond which surface time increases with increasing submerged time.
Submerged times reached this duration at 2.3 m in depth (Fig. 3.6). which is the
approximate depth where surface times were previously shown to be influenced
by depth (Fig. 3.9a). Surface times did not therefore appear to be influenced by

either depth or submerged time until a threshold was reached, beyond which
they increased.
- 2 sutface tme = 3.830 + 0.11 Ssubmerged time 0 5 c -
P-1 Phase2
Submerged Time (sec)
100
80 U Q) In ; 60 E - t
4 0 .
Fig. 3.10. Effect of submerged time, t+~, on surface time, s, for both data sets at submerged times greater than 90.5 seconds. Also illustrated is the Wephase trend of surface time with submerged time (see text for details).
surface tune = 14.024 + 0.1 TQsubmerged tune - * -
i 1987-89
1
2 o t i

3.6.1 -6 Number of breaths
As with surface time, the number of breaths taken per surface visit
remained low (less than two breaths) and relatively constant at depths of 2.3 m
or less during 1997 (Fig. 3.11a). No data were available from 1987-89 at these
low depths for comparison. Beyond 2.3 m, number of breaths increased
nonmonotonically with depth for both data sets (number of breaths = -7.362 +
5.134'depth + 3.185'dl - 0.685depth2 - 1.678dl*depth + 0.136*dl*depth2 +
0.0290*depth3; Regression; F P,ul = 12.067. p c 0.05) (Appendix 5. Table 3.14a).
Both data sets had positive slopes (5.1 34 for 1997; 3.456 for 1987-89). The 1997
data set had a lower intercept (-7.362) than the 1987-89 data set (-4.177),
although visual inspection of the data shows that the number of breaths were
generally greater in 1997 than in 1987-89 (Fig.3.1 la) for any given depth.
As with the surface time relationship, the trend shown in Figure 3.1 l a can
be divided into two phases. Phase one. at depths less than 2.3 m, showed
essentially no effect of depth on the number of breaths taken at the surface.
Phase two, at depths greater than 2.3 m, did show an effect of depth on the
number of breaths. In other words, the number of breaths appears to be
unaffected by water depth until a threshold depth of approximately 2.3 m is
reached, beyond which the number of breaths increases with increasing depth.
This is also the approximate depth at which surface time increases.
In this relationship, the observations in phase one had enough influence
on the rest of the data to alter the shape of the overall trend. For example, when
the 1997 data were regressed across all depths, the resulting equation was a

strongly curved quadratic (number of breaths = -0.562 + 1.327'depth -
0.081'depth2: Regression; F w51 = 33.039. p c 0.05) (Fig. 3.1 1b) (Appendix 5,
Table 3.14b). If the shallow depths below 2.3 rn were removed from the analysis,
the 1997 data showed a nonmonotonic increase with depth (number of breaths =
- -7.788 + 5.372'depth - 0.725'deplh2 + 0.031'depth3: Regression; F p.nol -
14.528, p c 0.05) (Fig. 3.1 1c) (Appendix 5, Table 3.14~). The 1987-89 data set,
which was composed entirely of data points in the phase two region, showed a
linear increase in the number of breaths with depth (number of breaths = 1.340 +
0.296'depth; df = 13: pe0.05) (Fig. 3,l ld) (Appendix 5, Table 3.14d).
Phase t pha5e 2
Fig. 3.1 la. Effect of depth on the number of breaths for both data sets from 2.3 - l l m . Also illustrated is the two-phase trend of tfit number of breaths with depth (see text for details).
1 o o b -- 1
- = - 4 t n t 3 4 m e p m - o ~ e p t h Z * ~ ~ ~ 9 d e p t h ' l
0 - o 2 4 6 a 10 12
Depth (m)

Fig. 3.1 1 b-d. Effect of depth on the number of breaths. Regressions for, b) 1997 data set across full depth range, c) 1997 data set from 2.3-1 1m. and d) 1987-89 data set across full depth range.

3.6.1 -6.1 Breathing rate during surface period
When more than one breath was taken per surface period, the breathing
rate (number of breaths per second of surface time) for both data sets was
relatively constant at about 0.1 1 breaths per second (or one breath every nine
seconds) (Fig. 3.12a). Regression analysis of breathing rate for both data sets
showed that breathing rate was not affected by the number of breaths between
1.8 to 7 breaths (Regression: F p , ~ = 7.483, p > 0.05) (Appendix 5, Table 3.1 5a).
Breathing rate in 1997 was 0.91 breaths per second when only one breath was
taken compared to 0.11 breaths per second when more than one breath was
taken (Fig.3.12b). The 1987-89 data set did not contain any observations with
less than two breaths so a similar comparison could not be made for this data
set. When surface time was plotted against the number of breaths, surface time
increased linearly as the number of breaths increased, again indicating that
breathing rate during a surface period did not change as surface time increased
(Fig. 3.12~). Regression analysis of both data sets across the full range of
breaths showed that both data sets were described by the same equation
(surface time = -12.145 + 12.585'breaths; Regression; F [1.411 = 162.975, p c
0.05) (Appendix 5, Table 3.1 5b).

Fig. 3.12. Effect of the number of breaths on, a) breath rate far both data sets, b) breath rate in 1997, and c) surface time for both data sets. Regression for both data sets over full range of breaths, c).

3.6.2 Effect of Depth on the Proportions of the Foraging Dive Cycle
3.6.2.1 Proportion of dive cycle spent submerged
When both data sets were analyzed for the effect of depth on the
proportion of the dive cycle spent submerged, (t+r)/(t+r+s), over the full range of
depths, the 1997 data set showed a markedly curved relationship while the trend
for the 1987-89 data set was nearly flat (Fig. 3.13a). Both data sets were
described by a quadratic polynomial (proportion cycle spent submerged = 1.028 - O.OM*depth - 0.175'dl + 0.005*depth2 + O.OfCdl*depth - 0.006*dl*depth2;
Regression; F [s,sz~ = 4.71 2, p < 0.05) (Appendix 5, Table 3.1 6a).
Because the 1987-89 data set did not include observations in the
shallowest depth range, the data sets were next compared from 2.3 to 11 metres
to determine whether the differences in their trends was due to this lack of
observations at depths less than 2.3 metres in the 1987-89 data. When
regressed together, analysis in the common region of 2.3 to 11 metres showed
that both data sets were described by a cubic polynomial (proportion cycle spent
submerged = 1.403 - 0.292*depth + 0.137'dl + 0.044*depthz - O.OlS*dl*depth - 0.002*depth3; Regression: F [5.371 = 4.086. p < 0.05) (Fig. 3.13b) (Appendix 5.
Table 3.16b).
The data from 1997 were next analyzed separately to determine what
effect the shaIlowest depths had on the proportion of the dive cycle spent
submerged. The data were divided into observations less than 2.3 metres and
observations from 2.3 to 11 metres and each section was examined separately.
Visual inspection of the depths less than 2.3m showed that the proportion of the

dive cycle spent submerged was variable. This region coincided with phase one
of the surface time by depth relationship. The relatively constant surfaces time at
these depths ailowed the proportion of time spent submerged to increase initially
as submerged times increased. Analysis of the 1997 data between 2.3 and 1 I m
showed that the proportion of time spent submerged decreased
nonmonotonically as depth increased (Fig. 3.13~. This region coincides with
phase two of the surface time by depth relationship. The regression was
described by a cubic polynomial (proportion cycle spent submerged = 1.427 -
0.304'depth + 0.045'depthz - 0.002'depth3: Regression: F p,ml= 7.593, p c 0.05)
(Appendix 5, Table 3.16~).
The 2987-89 data set, which was composed mostly of data points in the
phase two region, showed no effect of depth when analyzed separately over its
full depth range (Regression; F tr.tal= 0.681, p > 0.05) (Appendix 5, Table 3.16d).

. proportion = 0.853 + 0.010depU1- 0.~1deplh' .
Fig. 3.13. Effect of depth on proportion of the dive cycle spent submerged, (ttt)ift+~+s). Regressions for, a) both data sets over full depth range, b) both data sets from 2.3 - 11 m, and c) 1997 data set from 2.3 - 1 lm.

3.6.2.1.1 Proportion of submerged time spent travelling
The proportion of submerged time spent travelling between the surface
and the bottom, T/(~+T), showed no relationship with depth when both data sets
were compared over the full range of available depths (Regression; F (2.451 =
5.953, p > 0.05) (Appendix 5, Table 3.17a).
Since the 1987-89 data lacked observations from the shallowest
depths, the data below 2.3 metres were eliminated from both data sets and the
regression was re-run across their common depth range. From 2.3 to 11 metres.
the proportion of submerged time spent travelling increased linearly with depth
for both data sets (proportion submerged time spent travelling = 0.066 +
O.OIOndepth + 0.051'dl; Regression; F [2.401 = 9.313, p < 0.05) (Fig. 3.14a)
(Appendix 5, Table 3.17b). Both data sets had a positive slope (0.010), while the
1987-89 data had a higher intercept (0.1 16) than the 1997 data (0.066). Overall,
a greater proportion of submerged time was spent travelling in 1987-89 than in
1997.
The initially high proportion of time spent travelling at shallow depths
was probably an artifact of the method used to determine round trip travel time
and not a true reflection of the amount of time spent travelling between the
bottom and the surface in shallow water (see discussion in Section 4.3.3). The
removal of these observations from the analysis allowed the trend of increasing
proportion of time spent travelling with depth to appear, As was shown previously
in the results, the observations in the shallow regions can influence the overall
shape of the trend, which was the case here as well. When the 1997 data, which

contain observations in this region, were regressed across all depths, the
resulting equation was a second order quadratic (proportion submerged time
spent travelling = 0.169 - O.OZO*depth + 0.002'depth2; Regression; F 12.2q =
3.650, p c 0.05) (Fig. 3.14b) (Appendix 5, Table 3.17~). When the observations
below 2.3 m were removed from the analysis of the 1997 data set, the regression
equation was a straight line that increased with increasing depth (proportion
submerged time spent travelling = 0.07 + O.OOg*depth; Regression; F [1,221 =
12.973, p < 0.05) (Fig. 3.14~) (Appendix 5, Table 3.17d). The 1987-89 data,
which were missing observations in this regior! showed no effect of depth
(Regression; F [1.,81= 1.286, p > 0.05) (Appendix 5, Table 3.17e).

Fig. 3.14. Effect of depth on proportion af submerged time spent b'avelling. d(t+~) . Regressions far, a) both data sets from 2.3 - 1 lrn, b) 1997 data across all depths, and c) 1997 data from 2.3 - 1 lm.

3.6.2.1.2 Proportion of submerged time spent foraging
The proportion of submerged time spent foraging, t/(t+.r), showed no effect
of depth when both data sets were compared aver the hrll range of available
depths (Regression; F = 5.953, p > 0.05) (Appendix 5, Table 3.18a).
As was done in several of the preceeding analyses, the data below 2.3
metres were eliminated from both data sets in order to compare them over their
common depth range and the regression was re-run. From 2.3 to 11 metres, the
proportion of foraging time decreased linearly with depth (proportion of
submerged time spent foraging = 0.927 - O.OO9'depth + 0.049'dl; Regression; F
[2.40, = 9.313, p c 0.05) (Fig. 3.15a) (Appendix 5, Table 3.18b). Both data sets had
a negative slope (-0.009), while the 1997 data had a higher intercept (0.927) than
the 1987-89 data (0.878). A greater proportion of submerged time was spent
foraging in 1997 than in 1987-89.
Visual inspection of the 1997 data below 2.3 metres showed an increase in
the proportion of submerged time spent foraging, although it was variable. A
higher than expected proportion of travel time in this region may have resulted in
a lower than expected proportion of submerged time spent foraging, causing the
initial increase with depth in this region. The removal of these observations from
the analysis revealed the trend of decreasing proportion of submerged time spent
foraging with depth. As was shown in previous sections, the observations in the
shallow regions can influence the overall shape of the trend. This was the case
here as well. When the 1997 data, which contained observations in this region,
were regressed across all depths, the resufting equation was a second order

quadratic (proportion of submerged time spent foraging = 0.831 + O.020'depth -
0.002~depth'; Regression; F = 3.650, p c 0.05) (Fig. 3.1 5b) (Appendix 5.
Table 3.18~). When the observations below 2.3 m were removed from the
analysis of the 1997 data set. the regression equation was a straight line that
decreased with increasing depth (proportion of submerged time spent foraging =
0.920 - 0.008'depth: F 11.221 = 12.973, p c 0.05) (Fig. 3.1%) (Appendix 5, Table
3.18d). The 1987-89 data, which were missing observations in this region,
showed no effect of depth (Regression; F ft,t81 = 1.286, p > 0.05) (Appendix 5,
Table 3.1 8e)

Fig- 3.15. E M of depth on proportion of submerged time spent faraging, t/(t+r). Regression equations for, a) both data sets from 2.3 - l lm. b) 1997 data across all depths, and c) t 997 data from 2 3 - 1 1 m.
3.6.2.2 Proportion of dive cycle spent travelling
The proportion of the dive cycle spent travelling between the bottom and
the surface, d(t+t+s), decreased then increased with depth in a curviiinear
fashion when both data sets were compared over the full range of available
depths (proportion cycle spent travelling = 0.153 - 0.021*depth + 0.046'dl +
0.002*depth2; Regression; F [3,44 = 6.295, p c 0.05) (Fig. 3.16a) (Appendix 5,
Table 3.1 9a).
As mentioned previously in Section 3.6.2.1.1, travel times at depths less
than 2.3 metres were thought to be artificially long and were removed from the
analysis. In the 2.3 to 11 metre depth range, the proportion of travel time
increased linearly with depth for both data sets (proportion cycle spent travelling
= 0.061 + O.OO8'depth + 0.043'dl; Regression; F p401 = 11.134, p < 0.05) (Fig.
3.16b) (Appendix 5, Table 3.19b). Both data sets had positive slopes (0.008),
while the 1997 data had a lower intercept (0.061) than the 1987-89 data (0.104).
The proportion of cycle time spent travelling was generally greater in 1987-89
than in 1997.

Fig. 3.16. Effect of depth on the proportion of the dive cycle spent travelling, tl(tcs+s) Regressions for, a) both data sets across full depth range and b) both data sets from 2.3 - l lm.

3.6.2.3 Proportion of dive cycle spent foraging
The proportion of the dive cycle spent foraging, t/(t+r+s), decreased
linearly with depth (Fig.3.17a). Both data sets were described by the same
regression equation (proportion of cycle spent foraging = 0.791 - O.OOg*depth:
Regression; F [1.46j = 5.928. p < 0.05) (Appendix 5, Table 3.20a).
When the data sets were compared from 2.3 to 1q m which covers their
common range of data points, the proportion of foraging time was not affected by
depth (Regression; F t1,411= 3.631, p > 0.05) (Appendix 5, Table 3.20b).
The data from 1997 were next analyzed separately to determine what
effect the shallowest depths had on the proportion of submerged time. The data
were divided into observations less than 2.3 metres and observations from 2.3 to
11 metres and each section was examined separately. Visual inspection of the
depths less than 2.3 m showed that the proportion of submerged time was
variable, which was due to the relatively constant surface times as foraging time
increased. This shallow region coincided with phase one of the surface time by
depth relationship. Analysis of the data between 2.3 and I 1 m showed that the
proportion of foraging time decreased nonmonotonically as depth increased (Fig.
3.17b), as was predicted by the models (Houston and Carbone 1992, Carbone
and Houston 1996). This deeper region coincided with phase two of the surface
time by depth relationship. The regression was described by a cubic polynomial
(proportion cycle spent foraging = 1.353 - 0.302"depth + 0.044'deplhz -
0.002*depth3; F p.l~l = 5.779. p 5 0.05) (Appendix 5. Table 3.20~). Again, this was
similar to the proportion of the cycle spent submerged result (Sec. 3.6.2.1). The

1987-89 data, which were missing observations in this region, showed no effect
of depth (Regression; F 11 = 1.242, p > 0.05) (Appendix 5, Table 3.20d)
Fig. 3.17. Effect of depth on the proportion of the dive cycle spent foraging, tl(tct+s). Regressions for. a) both data sets over full depth range, b) 1997 data From 2.3 - I1 m.

3.6.2.4 Proportion of dive cycle spent at the surface
When both data sets were analyzed together over the full range of depths
for the effect of depth on the proportion of time spent at the surface, s/(t+r+s), the
1997 data set showed a markedly curved relationship while the trend for the
1987-89 data set was nearly flat (Fig 3.1 8a). Both data sets were described by a
quadratic polynomial (proportion cycle spent at surface = -0.028 + 0.064'depth +
0.1 75'd 1 - 0.005*depth2 - 0.074'd 1 *depth + 0.006'dl *depth2; Regression; F
l5.42, = 4.712, p c 0.05) (Appendix 5, Table 3.21a). This was similar in shape to
the proportion of the cycle spent submerged trend shown previously, although in
that case the data sets curved in the opposite directions (Fig. 3.1 3a).
As was done with the proportion of submerged time relationship, the data
sets were next compared from 2.3 to 11 metres to determine whether the
difference in trends was due to the lack of shallow depths in the 1987-89 data.
Here, the relationship was described by a cubic polynomial (proportion cycle
spent at surface = -0.403 + 0.292'depth - 0.137'dl - 0.044*depth2 +
O.OIS'dl*depth + 0.002*depth3; Regression; F 15 .4 = 4.086, p c 0.05) (Fig.
3.18b) (Appendix 5, Table 3.21 b). This was also similar in shape to the proportion
of submerged time relationship.
To determine what effect the shallowest depths had on the proportion of
the dive cycle spent at the surface, the 1997 data were examined separately. At
depths less than 2.3 m, the proportion of surface time during 1997 was variable
due to the relatively constant surface times at these shallow depths. At depths of
2.3 to 11 metres, the proportion of surface time increased nonmonotonically

(Fig.3.18~). Again, this was similar in shape to the proportion of submerged time
trend, except that the proportion decreased with depth in that case, rather than
increased. The relationship was described by a cubic polynomial (proportion
cycle spent at surface = -0.427 + 0.304'depth - 0.045*depth2 + 0.002*depth3;
Regression: F [3,201= 7.627, p < 0.05) (Appendix 5, Table 3.21~). Houston and
Carbone (1992) showed that proportion of surface time could be a nonmonotonic
function of depth.
The 1987-89 data set, which was composed mostly of data points in the
phase two region, showed no effect of depth when analyzed over its full depth
range (Regression; F [r.ral= 0.681, p > 0.05) (Appendix 5, Table 3.21d).

Fig.3.18. Effect of depth on the propoltion of the dive cycle spent at the surface, sl(t+r+s). Regressions far, a) bath data sets aver full depth range. b) both data sets horn 2 3 - 1 1 rn, and c) 1997 data set from 2.3 - 11 m.

3.6.2.4.1 Dive-pause ratio
The dive-pause ratio, or submerged timelsurface time, (t+t)ls, indicates
the length of submerged time relative to surface time and is commonly reported
in the dive literature.
Dive-pause ratio decreased with depth in a curvilinear manner when the
data sets were compared over the full depth range (Fig.3.19a). Both data sets
were described by the same quadratic polynomial (DPR = 42.332 - 0.036'depth
+ 0.65'depth2; Regression; F [2.451 = 8.769, p c 0.05) (Appendix 5. Table 3.22a).
At depths less than 2.3 m, the dive-pause ratio (DPR) during 1997 was
variable due to the relatively constant surface times and fluctuating submerged
times at these shallow depths. Between 2.3 and 11 m, the dive-pause ratio
decreased nonmonotonically with depth for both data sets. 80th data sets were
described by the same cubic polynomial (DPR = 89.865 - 38.870'depth - 5.597'
depth2 + 0.252*depth3; Regression; F ~~~~ = 6.335, p < 0.05) (Fig. 3.19b)
(Appendix 5, Table 13.22b).
When the 1997 data were analyzed separately the dive-pause ratio
decreased nonmonotonically between 2.3 to 11 metres (Fig.3.19~). This
relationship was described by a cubic polynomial (DPR = 107.838 - 48.458'depth
+ 6.937*depth2 - 0.307*depth3; Regression; F p.201 = 4.446, p < 0.05) (Appendix
5, Table 3.22~). The decreasing dive-pause ratio in this region of the 1997 data
indicates that the proportion of the dive cycle spent at the surface, s/(tcr+s),
increased with depth, as was shown in section 3.6.2.4, while the proportion of the
dive cycle spent submerged, (t+r)/(t+~+s), decreased with depth, as was shown

in section 3.6.2.1. The inverse relationship seen between DPR and the
proportion of time spent at the surface was expected since the proportion of time
spent at the surface is equal to 1/(1 + DPR) (Houston and Carbone 1992). If DPR
increases, the proportion of time spent at the surface should decrease and vice
versa.
The 1987-89 data set, which was composed mostly of data points in the
phase two region, showed no effect of depth when analyzed over its full depth
range (Regression; F rl.lal= 0.069, p > 0.05) (Appendix 5, Table 3.224).

Fig. 3.19. Effect of depth on divepause ratio, (t+t)ls. Regressions for, a) both data sets across full depth range, b) both data sets from 23 - l lm, and c) 1997 data set from 2.3 - 1 Im.

3.6.2.4.2 Dive-pause ratio by submerged time
No regression analysis was performed on this relationship as the trend of
the relationship was not of interest. However, the plot is included here for later
discussion (Fig. 3.20).
Submerged Time (sec)
Fig. 3.20. Effect of submerged time on the dive-pause ratio, (t+t)ls, showing the ~nitial increase in the 1997 dive-pause ratio with depth.

CHAPTER 4: DlSCUSSlON
4.1 Introduction
The salient features of the results discussed in detail below are: (1) activity
type affected dive cycle duration, so that resting dives were longer than travelling
dives, while foraging dives were longer than either resting or travelling dives
when water depth exceeded three metres, but were comparable at less than
three metres, (2) only foraging dives were affected by water depth, with dive
cycle duration increasing with depth, (3) all stages of the foraging dive cycle
increased with water depth, while the proportions of the dive cycle either
increased or decreased with depth or were unaffected, and (4) there were
significant differences between the two data sets in the allocation of time during
foraging dives.
Also discussed are a review of the methods, including the suitability of the
models to dugong diving behaviour, the question of whether dugongs use
anaerobic respiration white diving. the currency dugongs maximize while
foraging, and management implications of the results.
My results on dugong diving behaviour are compared to findings for other
diving vertebrates throughout the discussion. These sorts of comparisons among
species can serve to highlight, and maybe explain, the various physiological,
morphological, environmental, and behavioural constraints that affect their diving
behaviour (Feldkamp et al. 1989). Dugongs are ideal for this sort of comparison
because of the major differences between them and other marine mammals in
terms of behaviour (herbivores rather than predators, shallow water foraging) and

physiology (low metabolism, and reliance on lung oxygen stores rather than
blood or muscle oxygen stores).
4.2 General Results
Submerged and surface times were well within the range of values reported
from previous studies of free-ranging dugongs. The maximum submerged time of
377.67 seconds observed in this study was somewhat less than pubiished
maximum submerged times which range from 400 (Anderson and Birtles 1978)
to 506 seconds (Kenny 1967). The maximum submerged times observed during
this study and past studies were also substantially less than the cADL of 826.80
seconds (13.78 minutes) calculated in Appendix 2. which suggests that the
proportion of time spent submerged. (tts)/(t+t+s), may be maximized by
dugongs. Gallivan et al. (1986) determined that the ADL of Amazonian manatees
was far longer than any dive they had observed in their study animals. Such a
strategy may actually be beneficial since, over time, a series of short aerobic
dives results in a greater proportion of submergence than do a few long dives,
mostly because of the pronounced increase in surface time after long dives
(Kooyman et al. 1980). The fact that dugongs probably rarely remain submerged
to the limit of their oxygen stores suggests that submerged time is not a simple
function of the amount of oxygen they can carry in their bodies. In addition, the
wide variation between data points observed in many of the relationships could
indicate that not all dives conformed to the pattern expected from a marginai
value model of diving behaviour (Boyd et al. 1995).

Calves and juveniles made up 17.5% of the observed dugongs in 1997 and
19.4% in 1987-89. This was consistent with 1989 and 1994 aerial survey results
from Shark Bay, which found 19% and 16.6% of the observed animals to be
calves (Preen et al. 1995).
4.3 Review of Methods
4.3.1 Direct Observations
Data were collected by direct observation of animals rather than through
the deployment of tagging devices, such as TDRs. While the study of diving
behaviour has beneffied enormously from the use of such devices to record
diving information, there are a number of disadvantages associated with their
use. Of most relevance to this study is that once a TDR has been deployed, the
animal is released and cannot usually be observed during the recording period.
The animal's activities while diving are therefore unknown and must be inferred
from the shape of the resulting dive profiles, if at all possible. The number of
breaths taken after a dive is also usually unknown (Nowicki et al. 1997). Another
concern is whether an animal behaves normally after being tagged since such
devices sometimes interfere with the drag-reduced streamlining of the animal
(Wanless et al. 1988). Transmitter-shaped devices have actually been used to
create drag and artificially increase foraging effort (Boyd et al. 1997, Ropert-
Coudert et al. 2000). Studies which rely on direct observations avoid these
disadvantages both by reducing interference with the animal and by linking each
dive and the following surface period directly to the activity of the animal (Chu
1988, Dolphin 1988, Nowicki et at. 1997, Sumich 1983). However, studies that
make use of direct obsenrations are themselves not without disadvantages. For
example, separating submerged time into foraging time and travel time can be
difficult, especially in deep or murky water or when ascentldescent rates are
unavailable, and observations can only be made during daylight hours. In
addition, the number of continuous dives that can be recorded from any one
animal is limited by how long the animal can be kept in sight. This is especially
difficult when the animal under observation is travelling away from the observer,
is in a large group, is diving to depth, or remains submerged for a long period of
time. Environmental conditions can also limit the amount of time available for
direct observations, as wave height, precipitation, darkness, and glare at certain
times of the day can make observation difficult, if not impossible.
4.3.2 Surface Time Definition
Breathing patterns and how they are dealt with during the analysis of diving
behaviour can have an effect on mean submerged and surface times. Manatees,
like dugongs, follow a long dive with several short recovery dives during which
metabolic readjustments are made (Gallivan and Best 1980). These short dives
outnumber the longer dives resulting in a decreased mean submerged time when
they are averaged together. Since sirenians take only one breath each time they
break the water surface, unlike seals which can breath several times at the
surface, a series of short, near-surface dive cycles (including breaths at the
surface) that following a long dive to the foraging area can be regarded as the

surface period between the longer dives, This results in a longer mean dive time
and a longer mean surface time for the same series of dives. A similar breathing
pattern is also seen in cetaceans. A study of migrating gray whales found a
pattern of long and short dives. of which the short dives outnumbered the long
dives three to one (Surnich 1983). It is rarely mentioned in marine mammal
literature whether such patterns are taken into account when determining mean
submerged and/or surface times, yet their interpretation can have a profound
effect on reported mean times.
In my study, the surface time following a long dive included a series of
short, near-surface dives and breaths. A similar definition of surfacing time was
used to classify bowhead whale diving patterns (Wiirsig et al. 1984). During short
recovery dives by Amazonian manatees, oxygen in the blood and lungs
increased while carbon dioxide in the blood and lungs decreased as the body
gas stores equilibrated (Gallivan et al. 1986). Series of short, near-surface dives
between breaths function as the surface recovery period. The number of short
recovery dives, and therefore the duration of surface time, needed after a bnger
dive will be determined by the alveolar oxygen pressure (PA02) and the alveolar
carbon dioxide pressure (PAC02) following the longer dive, with PAC02 being the
more important factor (Gallivan et al. 1986).
Only postdive surface times were used whenever surface time was
analysed. This is commonly done in studies of diving behaviour (Boyd et al.
1995, Nowicki et al. f 997), possibly because surface time is viewed as a cost
that resuIts from the previous submerged time. Wiirsig et at. (1 984) found that

the surface times of bowhead whales were more highly correlated with the
duration of the preceding submerged time than the subsequent submerged time.
Similarly, Gallivan et al. (1986) found that there was no correlation between
alveolar oxygen and carbon dioxide pressure and the duration of the subsequent
dives in Amazonian manatees.
4.3.3 Travel Time
The rate of travel between the surface and the foraging area was found not
to change significantly with depth or direction of travel, allowing round-trip travel
time to represent depth in accordance with the models' assumption. This
assumption may be questionable since depth has the potential to influence both
travel rate and travel distance through dive mode. The finding of a constant travel
rate in my study is also questionable because of the low statistical power of the
analysis used to test the effect of depth and travel direction on travel rate.
Depth influences dive mode. Dugongs foraging in deeper water (9 to 14 m)
have been observed to dive steeply, with flukes raised above the surface upon
descent (Anderson 1994). In my study, dive mode became more vertical at
depths beyond 2.3 metres, switching from shallow-angled sink dives at depths
less than 2.3 metres, to the more vertical roll and fluke dives at depths greater
than 2.3 metres. This suggests that there may be an advantage to using the
more vertical dive modes in deeper water.
Dive mode influences the angle of descent, and therefore the distance
travelled between the surface and the bottom. Vertical dives are the most direct

route to the bottom, and cover a distance that is equal or close to that of the
water depth, while dives of a shallower angle cover a distance greater than the
depth of the water. Travel distance may therefore be greater than depth when
sink dives are used, and may become equal to depth when roll or fluke dives are
used. A model developed by Thompson et al. (1993) predicted that seals should
swim as directly as possible to their foraging area, which in most cases would
mean swimming as near to vertical as possible. This is supported by evidence
from other marine mammals. A free-ranging harbour porpoise (Phocoena
phocoena) was obsewed to increase dive angle for deeper dives during both
ascent and descent (Otani et al. 2000).
Dive mode may also affect the rate of descent. Dugongs foraging in water
deeper than 2.3 metres arch their backs and sometimes lift their flukes above the
water's surface upon descent. Such dives appear to have more weight and force
behind them than sink dives, suggesting that descents in deeper water may be
faster than descents in shallower water. The harbour porpoise from the previous
example increased its speed as well as its dive angle during ascent and descent
from deeper dives (Otani et al. 2000). The ascent velocity of humpbacks has
been shown to increase with depth, although the descent velocity was found to
be unaffected by depth (Dolphin f987a). Overall ascent time still increased
linearly with depth in spite of the increase in velocity. These observations are in
contrast to the findings of Thompson et a[- (1993) whose model predicted that the
ascentldescent rates of seals should remain constant or even decline with depth,
but should not increase with depth, regardless of whether the goal of the dive is

to maximize the proportion of time spent foraging, the net rate of energy intake,
or energy efficiency. The extra physical effort required for a more rapid descent
andlor ascent may only be optimal in cases where the benefit outweighs the
additional costs, such as during deep-water foraging. This may have been the
case for fur seals, whose speed decreased with both depth and travel time at
shallow depths, as predicted by Thompson et al. (1993). but increased with both
depth and travel time at deeper depths (Boyd et al. 1997). While no evidence yet
exists to confirm that dugong descent rate or ascent rate changes with water
depth, the more frequent use of the vertical dive mode when diving in deeper
water suggests that there might be some advantage in addition to a more direct
route.
In spite of the fact that depth has the potential to influence travel rate through
dive mode, the data used in this study showed no effect of depth or travel
direction on travel rate. However, subsequent power analysis of the data showed
a significant probability of failing to reject the null hypothesis when it was false for
depth, direction of travel, and the interaction between direction and depth. Type II
errors, wherein the null hypothesis of no difference between means is accepted
when it is not true, can result from a small data set or from small effect size
(Peterman 1990). The data set from which travel rate was determined was very
small, consisting of observations from only ten animals. It is therefore unlikely
that an effect of depth andlor direction on travel rate can be detected with this
data set even if such an effect does exist. It would be even more unlikely if the
effect size is small. In addition to the small sample size, travel rate was

determined from a data set that covered only a porh'on of the depth range to
which it was ultimately applied and the mean travel rate was extrapolated to
depths outside of that range. Travel rate in water less than 3 m and greater than
8 m, outside of the range from which it was calculated, may in fact be different
from the travel rate measured between 3 and 8 m. This is even more likely given
the fact that the shallow-angled sink dives mostly occur at depths below the
range used to determine travel rate.
If travel rate does in fact change with depth, there could be a number of
potential consequences for the results, depending on the magnitude of the
change. Since travel rate was used to calculate travel time, and travel time was
used to calculate foraging time, any over- or under-estimation of travel time
would have had consequences for the calculations of the proportions of time
spent foraging, t/(t+~+s) and U(t+T), and the proportions of time spent travelling,
T/(~+T+s) and t/(tct), as well as the calculation of foraging time, t. For example,
the use of a travel rate slower than 0.42 mtsec at shallow depths would cause an
increase in round-trip travel times and a decrease in foraging times beyond what
was used in this study. There would also be a decrease in the proporlion of time
spent foraging. A slower travel rate seems unlikely, however, since the travel
times calculated for the shaIlowest depths already seem too long, suggesting that
travel times at these depths may have been over-estimated, rather than under-
estimated. For example, at the travel rate used in this study it would take a
dugong 2.38 seconds to dive one metre. Given that the average length of an
adult dugong is about 2.7 metres, this seems excessive even when allowing for

the shallow dive mode used at that depth. Travel times at depths greater than 2.3
metres may also have been over-estimated if the roll and fluke dives used at
these depths allow for a more rapid descent than the sink dives used in shallower
water. Faster rates of travel in deeper water would produce shorter travel times
and longer foraging times at those depths than were used in this study. The
proportion of time spent foraging would also be greater at deeper depths.
There would be further consequences for the trends of these dive
variables with depth. If the assumption that round-trip travel time was equivalent
to depth is incorrect, then the relationships of the dive variables to depth are also
incorrect, although by how much and whether it would affect the conclusions of
this study are unknown. It is possible that the travel times used in this study to
calculate foraging times were over-estimated. However, since the results of the
study fit the predictions of the models in which travel time is assumed to be
proportional to depth, any over-estimation of travel times in this study may have
been minor.
A more complete study of dugong ascent and descent times, with a larger
sample size, is necessary in order to conclusively determine whether round-trip
travel time is affected by depth andlor direction of travel.
4.3.4 Suitability of Models
In general, the models developed by Houston and Carbone (1992) and
Carbone and Houston (1996) did qualitatively predict dugong diving behaviour
while foraging, although a modified version of Houston and Carbone's aerobic

model, developed by Walton et al. (1998) and based on an unusual oxygen gain
function, predicted some aspects of dugong diving behaviour better.
Dive patterns that were predicted by the models but were not observed in
my study include: 1) a decrease in foraging time with depth following an initial
increase, and 2) a secondary increase in foraging time at the deepest depths,
fueled by anaerobic respiration. Either these patterns are not features of dugong
diving or the range of depths covered in my study did not include the depths at
which they occur.
Dive patterns that were observed in my study but which were not
predicted by the models include: 1) constant surface times at depths of less than
2.3 metres and at submerged times of less than 90,5 seconds, 2) a constant
number of breaths at depths of less than 3.3 metres, and 3) an initial increase in
DPR to a maximum point before decreasing with depth. These features were
better predicted by another model (Walton et al. 1998), which is discussed in
sections 4.5.1.5 and 4.5.1.6.
Other models could be developed which may predict dugong diving
behaviour better or may reveal more about the mechanisms governing their
diving patterns. For instance, carbon dioxide was found to be more important
than oxygen in the control of ventilation and diving in Amazonian manatees and
was a better predictor of submerged time (Gallivan 1980, Gailivan et al. 1986). If
this is the case for dugongs as well, then perhaps an even more accurate dive
model could be developed based on a carbon dioxide unloading (from the blood
to the lungs) curve rather than an oxygen uploading (from the lungs to the blood)

curve, Another potential model could be based on a waste-product removal curve
(Fedak and Thompson 1993).
Modelling could also be used to distinguish between dietary preferences.
Opinion is divided regarding whether the dietary preferences of dugongs are
based on high total nitrogen (protein) and low neutral detergent fibre (Lanyon
1991), or on soluble carbohydrates (Anderson 1998, Preen 1993, De longh et al.
1995). It has been noted that sheep are more likely to concentrate their foraging
effort on those plants that provide the best energetic return, while no evidence
exists of their foraging behaviour being influenced by differences in the
concentrations of specific nutrients (Armstrong and Robertson 2000). A model
could be developed for dugongs to distinguish between a foraging strategy based
on the optimization of nutritional balance and a foraging strategy based on
energy maximization.
4.4 Effect of Activity Type and Depth on Dive Cycle Duration
4.4.1 Effect of Activity Type
Dive cycle duration was affected by activity during the dive. Resting dives
were longer than travelling dives at any depth. Foraging dives were longer than
either resting or travelling dives at depths greater than three metres, but
approximated resting or travelling dives at depths less than three metres.
Because the dive cycle is composed of both a time undewater
(submerged time) and a time at the surface, its duration is affected by a change
in either. Just how much of the dive cycle is allocated to submerged time versus

surface time is governed by the rate of oxygen gain at the surface, which is an
increasing but decelerating function of time at the surface (Kramer 1988). The
optimal surface time may therefore be less than the maximum surface time, and
the optimal submerged time may be less than maximum as well. Because of this,
it is optimal for an animal to make a short dive followed by a short surface time
whenever possible. The ability to do so will depend on the activity during the dive
and environmental factors such as depth of the resource.
Distance from the surface during the various activities may account for the
observed differences in dive cycle duration since the closer to the surface an
animal is, the shorter the submerged times and surface times can be. Indeed,
longer dive cycles occurred when the dugongs were further from the surface and
shorter dive cycles occurred when they were closer to the surface. For instance,
dugongs remained relatively close to the surface while travelling or resting,
making it easy to surface for a breath, while the distance that foraging animals
travelled to breathe depended on water depth in the foraging area. As a result,
shallow foraging dives (< 3m) were comparable in length to travelling and resting
dives, while deeper foraging dives (> 3m) became increasingly longer with depth.
The amount of oxygen consumed during each of the activities could also
have accounted for the observed differences in dive cycle duration. Resting
dugongs remained motionless in the water, which would allow them to conserve
oxygen through a reduced metabolic rate. A low metabolic rate would allow a
resting dugong to maximize its ADL and its submerged time, thereby increasing
the overall dive cycle duration. Travelling dives were shorter than resting dives

perhaps due to the greater energy (and oxygen) demands of exercise. A greater
oxygen demand shortens the ADL and the submerged time, resulting in a shorter
dive cycle. Foraging dives were longer than resting or travelling dives at certain
depths but comparable at others because the amount of energy and oxygen
used while foraging would depend on the distance travelled between the surface
and the bottom (i.e. on the depth of the water). It would probably also depend on
the foraging method employed by the dugong (e.g. grazing versus rooting), as
some methods are likely more energy-intensive than others. Leeuw (1996)
reported that the metabolic rates of a variety of marine mammals and other
divers increased with activity level. Metabolic rates were lowest during inactive
diving, or resting, moderate during low speed travelling, and highest during
foraging.
While no information was available for dugongs, a study of Florida
manatees found that activity type affected submerged time (Reynolds 1981). The
mean submerged time of adult manatees unaccompanied by calves was longest
while resting, followed by feeding and then travelling. Although the dugong data
were analyzed for dive cycle duration rather than submerged time, the manatee
results were somewhat consistent with the dugong results for depths less than
three metres, since resting submerged times were the longest, but were not
consistent with the dugong resuits for depths greater than three metres, where
foraging dives were greater than resting dives. Overall it was difficult to
determine whether the manatee results agreed or disagreed with the dugong
results since the manatee study did not report the effect of depth on submerged

time for the various activity types. This further highlights the need for more
detailed collections of diving data.
Activity type was also found to affect the surfacing, respiration, and dive
characteristics of bowhead whales (WOrsig et al. 1984). Differences were seen
between feeding or socializing bowheads and actively migrating bowheads.
Submerged times were shorter, while blow intervals, surface times, and number
of breaths at the surface appeared to be longer, or greater, while migrating than
while feeding or socializing. In addition, surface times were shorter while skirn-
feeding at the surface than while socializing or apparently feeding in the water
column. The mean number of breaths (blows) was also smaller while skim-
feeding than while feeding in the water column. Blow rate was shorter while
column feeding than while socializing. Wiirsig et al. (1984) also found bowhead
submerged and surface times to be significantly higher in one year than in two
other years, which they related to changes in activrty type. The number of
breaths taken at the surface was higher in that same one year, although the blow
rate was lower, probably because submerged times and the number of breatns
were longer, or greater. They speculated that the differences between years
were due to a change in feeding activrty to include more water-column feeding,
as opposed to surface-skimming, and less socializing. Grey seals (Halichoerus
grypus) were also shown to have significantly longer mean submerged times and
surface times while foraging than while travelling (Thompson et a[. 1991).
The effect of activity type on dugong diving in this study was only available
for dive cycle duration, rather than for submerged and surface times, so it is

unknown whether an effect would be found for each stage of the dive cycle.
Additional data on submerged times and surface times for the various activities
would be more conclusive and would facilitate comparison with other marine
mammals.
Overall, these findings suggest that behavioural activity during dives
should always be reported whenever dive parameters are presented in order to
provide context to the results.
4.4.2 Effect of Depth by Activity Type
Foraging dive cycles increased in duration as water depth increased.
Resting and travelling dive cycle durations remained unchanged as depth
increased.
Dugongs remained at or near the surface while resting or travelling,
regardless of water depth. However, as dugongs are obligate bottom-feeders,
travel distance between the surface and the bottom increases with depth while
foraging. Foraging dive cycles increase with depth not only because more time
must be spent travelling between the surface and the bottom, but also because
more time must be spent foraging during deeper dives to make the increased
energy expenditure of the longer trip worthwhile, and because more time must be
spent on the surface recovering from the increased time spent underwater. The
increase in foraging dive cycle duration with depth is therefore due to combined
increases in foraging time, travel time, and recovery time at the surface.

Optimal dive models predict that as depth increases so do submerged
time and postdive surface time, the two main components of the dive cycle
(Kramer 1988, Houston and Carbone 1992, Carbone and Houston 1996). This
suggests that dive cycle duration can be expected to increase with depth as well.
While most dive studies report the effect of depth on submerged times and
surface times separately rather than on the dive cycle as a whole, humpback
whale dive cycles have been reported to increase with depth while foraging
(Dolphin 1987a, Dolphin 1987b, Dolphin 1988).
A positive relationship between depth and submerged time has also been
noted for foraging humpback whales (Dolphin 1987a, Dolphin 1987b). As with the
dugongs, this relationship is not as strong for whales engaged in behaviours
other than foraging. Baird et al. (2000) noted a decrease in strength of the
relationship between submerged time and depth for humpback whales that were
believed to be singing rather than foraging.
These findings suggest that water depth needs to be taken into account
whenever dive cycle durations are reported for foraging dugongs, but not for
resting or travelling dugongs. The relationship between depth and the various
stages of the foraging dive cycle is examined in detail in the next section.
4.5 Allocation of Time during Foraging Dives: A Test of Optimality Models
4.5.1 Effect of Depth on Foraging Dive Cycle Variables
Once it had been determined that only foraging dives were affected by
depth, I set out to determine whether depth affected the various stages of the

foraging dive cycle equally. This was done by comparing the allocation of time
within foraging dive cycles to predictions from optimal dive models.
Overall, my results supported a number of qualitative predictions of the
models presented in Houston and Carbone (1992) and Carbone and Houston
(1996). The durations of each stage of the dive cycie were significantly affected
by depth. Dive cycle duration increased with depth (Fig. 3.5) as each stage of the
dive cycle (surface time, travel time, and foraging time) increased with depth
(Figs.3.6-3.9). fhe effects of depth on each of these stages are discussed
separately.
4.5.1.1 Foraging time
The aerobic models (Houston and Carbone 1992) predict that optimal
time in the foraging area, t, will increase as depth increases when depth is small,
then decrease as depth increases when depth is large. This will be true whether
the animal is maximizing the proportion of time in the foraging area, energetic
efficiency, or net rate of energy gain. Over a wide range of depths, foraging time
will generally decrease as both depth and oxygen consumption underwater
increase. The mixed model (Carbone and Houston 19961, which assumes the
diver uses both aerobic and anaerobic metabolism, predicts the same
relationship between foraging time and depth (i-e. foraging time will increase and
then decrease) if the shift in the fraction of energy supplied towards anaerobic
respiration is not abrupt If the shift is abrupt, the mixed model predicts that
foraging time will increase then decrease then increase again. This second

increase will be associated with an increase in anaerobic respiration. Under the
switch model (Carbone and Houston 1996), which assumes that a diver uses
only one metabolic pathway at a time, a step increase in foraging time is
predicted at the depth when the animal switches to anaerobic respiration. This
switch to anaerobic respiration will occur before the ADL is reached. A similar
pattern of increasing, decreasing, then increasing foraging time with depth is also
predicted by a model which uses a unique sigmoid-shaped oxygen gain function
(Mori 1998b). The sigmoid model assumes that metabolism during a dive is
either completely aerobic or a mixture of aerobic and anaerobic.
The explanation for the predicted pattern is as foliows. As depth
increases, round-trip travel time to the foraging area also increases unless travel
rate is adjusted to depth (Fig. 3.7). The longer the trip to the foraging area the
more time an animal must spend in the area gaining energy to compensate for
the extra time and effort spent travelling back and forth to the surface, resulting in
the initial increase in foraging time with depth predicted by Houston and Carbone
(1992). This follows from the MVT which predicts that the amount of time spent in
a patch will increase as the travel cost between patches increases, causing a
lower average intake rate from the environment. If time in the foraging area is
proportional to the time taken to consume food, then the amount of food
consumed will also increase with increasing travel costs. Deterministic models
such as the MVT assume that energy intake increases with time spent in the
patch in a smooth curve that rises to an asymptote (Chamov 1976). Any model
that is based on maximizing the proportion of time spent in the foraging area

assumes that the gain from foraging is proportional to the time spent in the
foraging area (Houston and McNarnara 1994). If the "patchn in question is the
surface, the distance between patches will be the distance between the surface
and the foraging area, i.e. water depth. It therefore follows that time spent in the
foraging area will increase with increasing depth, at least initially (Fig. 1.2).
Dugong foraging time did increase with depth as predicted by Houston and
Carbone (1992) (Fig.3.8). Foraging time increased in a curvilinear manner,
suggesting that foraging time either levels off or decreases at depths beyond I f
metres. Anderson (1 984) also found evidence to suggest that the foraging time of
dugongs in 6 to 8 metres of water either increased, or was not significantly
reduced, compared to those in 1 to 4.5 metres of water.
Since submerged time is finite, foraging time must eventually decrease as
depth continues to increase and travel time takes up ever more of the submerged
time. An eventual decrease in foraging time with depth was not seen in the
results, although the rate of increase in foraging time slowed at greater depths.
This may be because the decrease occurs at depths greater than those
observed, in which case observations at depths greater than 11 metres might
show the predicted decrease in foraging time. Or, it may mean that the dugongs
did not maximize the proportion of time spent in the foraging area, t/(t+r+s), and
that the rate of energy gain wnh time spent in the foraging area was not constant,
since the gain function can mask the effect of depth on foraging time (Houston
and Carbone 1992).

The initial increase in foraging time seen for dugongs has also been
observed in several other diving animals. The foraging time of Antarctic fur seals
increased with round-trip travel time, which may approximate depth when travel
rate is constant (Boyd et al. 1997). As with dugongs, no subsequent decrease in
foraging time was seen with longer travel times for fur seals, although it was felt
that a decline in foraging time may have begun at the longest travel times. The
authors inferred this to mean that the seals were attempting to maximize the
proportion of foraging time. t/(ttt+s). Houston and Carbone (1992), however,
suggest that an increase then decrease in foraging time with depth will be true
whether the animal is maximizing the proportion of foraging time, energetic
efficiency, or net rate of energy gain unless the gain function is not constant over
time, in which case the pattern may be hard to detect. An earlier study of
Antarctic fur seals did observe a subsequent decrease in foraging time as depth
increased (Boyd et al. 1995). A study of humpback whales also reported an initial
increase in foraging time with depth (Dolphin 1987b, Dolphin 1988). Again, there
may have been a slight decrease in foraging time at the greatest depths.
Similar results have been seen for diving birds. The foraging time of tufted
ducks and pochards increased significantly with depth, in a non-linear manner
(Carbone and Houston 1994, Carbone et al. 1996). While the pochard data
seemed to be nonmonotonic (Carbone et al. 1996), no significant decrease in
foraging time was observed for either bird at the deeper depths, which was
attributed to the experimental diving chamber not being deep enough. Cape
cormorants (Phalacrocorax capensis) and crowned cormorants (Phalacmcomx

comnatus) also showed increased foraging time with depth. while no relationship
between foraging time and depth was observed for white-breasted or bank
cormorants (Wilson and Witson 1988). King penguins did not show any change in
bottom time (potentially foraging time) with depth (Kooyman et al. 1992).
Foraging time of Japanese cormorants (Phalacmcorax capillatus) increased with
depth and also with submerged time (Watanuki et ai. 1996).
If travel time continues to increase with depth there will theoretically come
a point where so much of the submerged time is spent travelling that not enough
time can be spent foraging to make travel to those depths worthwhile. This point
wouid depend on the quality of forage and the foraging method used, since these
would affect the amount of energy gained per unit time. An animal could opt at
this point to use anaerobic respiration in order to increase its available
submerged time and subsequently its foraging time. This would result in a
second increase in foraging time with depth, as predicted by both the switch and
mixed metabolism models (Carbone and Houston 1996). No secondary increase
in foraging time was seen in my results, suggesting that either dugongs were not
observed foraging at depths where this might occur. or that they do not use
anaerobic respiration at depths less than 11 metres. It may never be optimal for
dugongs to use anaerobic respiration while foraging if comparable, or at least
adequate, forage material is available at shallower depths. However. if good
quality food became scarce at shallow depths, the use of anaerobic respiration to
exploit deeper areas could bemrne necessary. The use of anaerobic respiration
would extend the foraging time at any given depth and would also increase the
range of depths that could be exploited.
4.5.1.2 Proportion of the dive cycle spent foraging
The aerobic models predict that the proportion of the dive cycle spent in
the foraging area, t/(t+-c+s), will decrease as depth increases, which is true of any
model where the proportion of time spent foraging is maximized (Houston and
McNamara 1994). The decrease will be due to the increase in both travel time to
depth, t, and surface time, s, as depth increases.
The proportion of the dugong dive cycle spent foraging also decreased
with depth, as predicted by Houston and Carbone (1992), from about 80% to
about 70% (Fig. 3.17). This suggests that the dugongs maximized their
proportion of time spent foraging at each depth. According to Carbone et al.
(1996). a decrease in the proportion of the dive cycle spent foraging with
increasing depth is a general prediction of models like Houston and Carbone
(1 992) in which the proportion of time spent foraging is maximized.
The proportion of the dive cycle spent foraging is also known as searching
efficiency (Dolphin 1988, Ydenberg and Clark 1989) or foraging efficiency
(Watanuki et al. 1996). Since foraging in deeper water incurred costs to the
dugongs in terms of a reduced proportion of time spent foraging, deep dives
were less efficient than shallow dives. A study of Mted ducks revealed that even
when diving costs (as measured in Joulesfsec) are no greater at deeper depths,
the resulting increases in submerged time and surface time, and the decrease in

the proportion of time spent foraging in a dive cycle, indicate that deeper diving is
less efficient than shallower diving. It is thus more costly to obtain a specific
amount of food during a deep dive than during a shallow dive (Leeuw 1996).
Similar decreases have been obsenred in diving birds and in whales. The
proportion of the dive cycle spent foraging by king penguins decreased from 44%
during shallow dives (less than 60 metres) to 15% for deep dives (greater than
150 metres) (Kooyman et al. 1992). Similar decreases in the proportion of
foraging time with depth have also been noted for humpback whales (Dolphin
1988), tufted ducks (Carbone et al. 1996, Leeuw 1996), and pochard (Carbone et
al. 1996). However, the proportion of foraging time was not affected by depth for
Japanese cormorants (Watanuki et al. 1996) which the authors took as a sign
that anaerobic respiration was not used and also that depth did not affect travel
rate.
4.5.1.3 Proportion of submerged time spent foraging
The proportion of submerged time that dugongs spent foraging, tl(t+t),
also declined with depth, from a maximum of about 93% to about 79% in 1997,
and from about 90% to about 75% in 1987-89 (Fig.3.15). Although both foraging
time and travel time increased with depth, travel time increased at a faster rate
than foraging time, causing the proportion of foraging time to decrease. The
decrease observed in the proportion of foraging time with depth suggests that the
proportion of time spent foraging was maximized at each depth and declined as
the proportion of time spent travelling increased.

Foraging in deeper water incurred costs in terms of a reduced proportion
of time spent foraging, making deep dives less efficient than shallow dives. The
proportion of time spent foraging declined steadily and did not level off at the
deeper depths, which could occur if travel rate increased at deeper depths. Since
a constant travel rate was used to determine travel time, which was then used to
determine foraging time, such a leveling off would not have been evident.
Whether it would be profitable, or even possible, for a dugong to spend
proportionately less of its submerged time foraging at greater depths than was
observed (as the continually decreasing trend suggests), or whether travel rate
would increase, and therefore slow or even hait the decrease in the proportion of
foraging time, would depend on the benefits in terms of quality of available
forage. Dugongs in Shark Bay were observed to forage on Halophila in water 9-
15 m deep rather than on Amphibolis in water of 8 m or less (Anderson 1994).
Halophila is rich in carbohydrate, unlike Amphibolis, so this may compensate for
the increased costs of diving in deeper water (Anderson 1994). Diving ducks
have been shown to switch to less proffiable food patches at shallower depths as
the depth of the more profitable patches increased, rather than forage at deeper
depths (Carbone and Houston 1994). There could also be a lower limit to the
proportion of time spent foraging for dugongs below which it is not worthwhile for
dugongs to feed. Whether to go anaerobic or go shallow at this lower limit could
depend on patch quality. Models developed by both Houston and Carbone
(1992) and Mori (1998b) showed that patch quality is either not important, or is
only slightly important to the allocation of time over the dive cycle when aerobic
respiration is used. This does not mean that animals should not forage on better
patches in such cases, just that the allocation of time is determined more by
other factors, such as depth. In cases where anaerobic respiration is favourable,
patch quality is important to the allocation of time, especially in deep water (Mori
1998b). Indeed, Mori found anaerobic respiration to be favourable only when
patch quality was good, deep, and hard to find. The use of anaerobic respiration
would cause foraging time to increase further with depth, which would probably
have an effect on the proportion of time spent foraging as well, unless travel rate
increased at deeper depths.
A study of Antarctic fur seals found that the proportion of submerged time
spent foraging increased up to a maximum of about 40-50 then decreased
steadily as depth increased, down to about 10-20% of submerged time (Boyd et
a!. 1995). Grey seals were observed to spend about 60% of their submerged
time on the bottom during foraging dives (Thompson et al. 1991). No information
was given as to whether this proportion changed with depth. A subsequent study
of fur seals showed the proportion of submerged time spent foraging increased to
about 55% then decreased to about 34% as depth increased (Boyd et al. 1997).
The authors suggested this meant that either deep dives are less profitable than
shallow dives (since less time is spent, proportionally, on foraging), or that fur
seals dive for more profitable prey at deeper depths (presumably to make the
reduction in the proportion of time spent foraging worthwhile). Dugongs appear to
be more efficient foragers than either fur or grey seals, at least in terms of the
proportion of time they are able to spend foraging, although dugong foraging

efficiency in terms of energy is unknown. Dugongs expend less energy while
submerged than do seals, both because of their low metabolism and the fact that
they do not actively pursue prey, although they gain less energy while foraging
since their food source is less nutritious than that of seals. The proportion of time
spent foraging by seals, on the other hand, is limited by their higher metabolic
rates, in spite of their larger body oxygen stores. This is further illustrated by the
fact that fur seals also spend less absolute time underwater than dugongs - only
about 50 seconds or so - for dives of 11 to 33 metres.
Diving birds show a similar trend. King penguins spent a greater
proportion of their submerged time on the bottom (potentially in the foraging
area) during shallow dives than during deep dives (Kooyman et al. 1992). About
50% of submerged time was spent on the bottom during shallow dives (depth
less than 60 metres), but only 19.6% of submerged time was spent on the bottom
during deep dives (depths greater than 150 metres). In this case, the decrease in
the proportion of time spent foraging was entirely due to the increase in travel
time with depth rather than a decrease in foraging time, which barely changed.
Dugong foraging time increased with depth, but not as fast as travel time,
causing the observed decrease in the proportion of time spent foraging with
depth.
4.5.1 -4 Submerged time
Carbone and Houston's (1992) aerobic models predict that submerged
time, t+f, will increase with depth if the rate of oxygen use while travelling is

equal to the rate of oxygen use while foraging, or it will increase then decrease
with depth if the oxygen use rate while travelling is greater than while foraging. If
submerged time simply increases with depth, it will be a decelerating function
whose maximum will be influenced by the ADL.
Submerged time was observed to increase with depth, as predicted by the
aerobic models, although it did not subsequently decrease with depth (Fig. 3.6).
This suggests that either oxygen use while travelling was equal to oxygen use
while foraging, or that the predicted subsequent decrease in submerged time
may occur at depths beyond those observed. The rate of increase slowed as
depth increased, which is consistent with maximizing the proportion of the dive
cycle spent foraging, U(t+.c+s). The increase in dugong submerged time with
depth was due to an increase in both travel and foraging times (Figs. 3.7 & 3.8).
Anderson (1984) noted an increase in the submerged time of dugongs
with increasing depth. Similar increases in submerged time with depth have also
been seen in a variety of other mammalian and avian divers, inciuding Antarctic
fur seals (Boyd and Croxall 1992, Boyd et al. 1997), humpback whales (Dolphin
1987a, Dolphin 1987b, Dolphin 1988), bowhead whales (Wiirsig et al. 1984),
elephant seals (LeBoeuf et al. 1988, Boyd and Ambom 1991), ringed seals
(Phoca hispida) (Kelly and Wartzok 1996), sea otters (Lutra l u h ) (Nolet et al.
1993), tufted ducks (Leeuw 1996), pochards (Carbone and Houston 1994), and
cormorants Wlson and Wilson 1988, Watanuki et al. 1996). The increase in
submerged time with depth for otters was attributed to an increase in both travel
and foraging times (Nolet et at. 1993). Otter foraging time eventually decreased

with depth while the rate of increase in travel time remained constant, causing
the rate of increase in submerged times to slow as depth increased. Ougong
foraging times did not show a similar decrease, although the rate of increase in
foraging time slowed as depth increased, causing a similar reduced rate of
increase in submerged time. A reduction in the rate of increase in submerged
time with depth has also been noted for fur seals (Boyd et ai. 1995) and king
penguins, where submerged time increased less rapidly beyond 40 metres in
depth (Kooyrnan et al. 1992).
4.5.1.5 Surface time
4.5.1.5.1 Surface time by depth
The aerobic models predict that surface time, s, should increase as depth
increases (Carbone and Houstone 1992) whether the animal is maximizing the
proportion of time in the foraging area, energetic efficiency, or net rate of energy
gain. However, since surface time is affected by the rate of oxygen uptake at the
surface, the increase in surface time may be subtle in cases where air exchange
is rapid. The mixed metabolism model, which assumes a shift in the proportion of
aerobic and anaerobic respiration with increasing depth, also predicts that
surface time will increase as depth increases (Carbone and Houston 1992). The
switch model (Carbone and Houston 1996) predicts the same step increase in
surface time with depth when anaerobic respiration is used as was predicted for
foraging time. This switch will occur before the ADL.

Two trends were observed for dugong surface time. initially, surface time
was unaffected by deptfi and remained relatively constant as depth increased.
Then, once a threshold depth of about 2.3 metres was reached, surface time
increased with depth in a linear fashion. Beyond the threshold depth, the results
qualitatively fit the model's prediction of an increase in surface time with depth.
The increase in surface time with depth in the 1997 data set was best described
by a quadratic equation suggesting that the rate in increase of surface time may
have slowed at deeper depths during this sample period.
Theoretically, surface time should increase with depth, as should the size
of oxygen stores (Kramer 1988). Increased surface time and larger oxygen
stores allow for more foraging time at deeper depths by reducing the number of
trips to the surface (Carbone and Houston 1994). The increase in surface time
will accelerate as the maximum diving depth is reached due to the lower oxygen
intake rates as oxygen storage sites become fully saturated (Carbone and
Houston 1994). Deep dives therefore incur costs in terms of an increase in
surface time, as well as an increase in submerged time and a decrease in the
proportion of foraging time, as shown earlier. The benefit of deep diving for
dugongs may be the higher nutritional quality of the seagrasses found in deeper
water. Foraging in deeper water may also be necessary for dugongs if they are
excluded from shallower foraging areas.
Increases in surface time with depth have also been observed for
Antarctic fur seals (Boyd et al. 1995). humpback whales (Dolphin 1987a. Dolphin
f987b, Dolphin 1988), bovthead whales (Wijrsig et al. 1984), tufted ducks

(Carbone et al. 1996), pochard (Carbone and Houston 1994, Carbone et al.
1996), and cormorants (Watanuki et al. 1996), although consistently low,
constant surface times at the shallowest depths, as seen for dugongs, were not
reported for any of these divers.
4.5.1 5 . 2 Surface time by submerged time
The predicted effect of submerged time on surface time is complex.
According to Carbone and Houston (1992), if the rate of oxygen use while
travelling equals the rate of oxygen use while foraging, then surface time
depends on submerged time as a whole. If the rate of oxygen use while foraging
is greater than while travelling, then the separate components of surface time, s,
travel time to depth, r, and foraging time, t, will each affect surface time. At any
given depth. surface time will increase as foraging time, and therefore
submerged time, increases. When the optimal foraging time is considered over a
range of depths, surface time will increase in approximately a straight line as
submerged time increases. This is because the optimal foraging times will be
chosen so as to avoid costly surface times. There is no effect when the rate of
oxygen use while travelling is greater than while foraging.
When plotted against submerged time instead of depth, surface time was
initially unaffected by submerged time and, as with depth, remained relatively
constant as submerged time increased (Fig. 3.10). Beyond a threshold
submerged time of about 90.5 seconds, surface time increased with depth in a
linear fashion, although no rapid increase was seen at the longer submerged

times, suggesting that all observed dives were aerobic in nature (see Kooyman
1989). Short submerged times are beneficial since surface times (and oxygen
reserves) can be minimal, allowing the diver to take advantage of the higher
rates of oxygen intake during short surface intervals, while long submerged times
are more costly in terms of increased surface time.
Increases in surface time with submerged time have also been observed
for Antarctic fur seals (Boyd et al. 1994, Boyd et al. 1995), humpback whales
(Dolphin 1987a, Dolphin 1987b), guillemots and shags (Monaghan 1996), and
tufted ducks and pochard (Carbone et al. 1996). Consistently low surface times
at low submerged times were not reported for any of these divers, although
surface times of guillemots and puffins have shown a similar lack of response
until a certain submerged time was reached (Wanless et al. 1988).
The two-part pattern in surface time by submerged time seen for dugongs
is predicted by a dive model developed for seabirds. Walton et al. (1 998) adapted
the models of Kramer (1988) and Houston and Carbone (1992) by changing the
oxygen gain function to reflect the unique respiratory physiology of birds. Instead
of a smooth oxygen gain curve, the shape of the curve was modified to increase
very rapidly at first, then abruptly decrease in rate, creating a kink in the curve.
The unique shape of the curve was intended to divide the initial, faster oxygen
uptake into the respiratory tract from the slower oxygen uptake into hemoglobin
and myoglobin.
Walton et al.'s seabird model predicted a distinct upturn in optimal surface
time at a certain submerged time that they termed the "critical point". The optimal

surface time for dives of less than this critical submerged time was predicted to
increase only slowly with submerged time, while beyond the critical point. surface
time was predicted to increase at a much higher rate. The critical point therefore
represented the optimal submerged time. (tcr)', or the longest submerged time
possible without causing an increase in surface time. Dives shorter than the
optimal submerged time, (t+r)*, were predicted to have a surface time close to
the optimal surface time, s*, while dives longer than (tw were predicted to have
relatively long surface times. This produced a pattern similar to that which I
observed for dugongs. which was characterized by near-constant surface times
for dives less than 90.5 seconds (or depths less than 2.3 metres) followed by a
subsequent increase in surface time for dives of 90.5 seconds or longer (or to 2.3
m or deeper).
The optimal surface time is the time necessary to replenish oxygen in the
respiratory tract. it can be calculated by dividing the optimal submerged time by
the peak DPR (Waiton et al. 1998). For dugongs, the optimal surface time is only
one to two seconds, The extensive cartilaginous reinforcement of their airways
enables sirenians to fill and empty their lungs rapidly allowing them to avoid
prolonged surface times (Bergey and Baier 1987). As with the dugong data, the
increase in the seabirds' surface times happened at relatively short submerged
times, well before anaerobic respiration would be necessary. This distinguishes it
from the upturn in surface time that has been attributed to the onset of anaerobic
respiration (Kooyman et al. 1980).

The "critical point" predicted by Walton et al.'s model is comparabie to the
threshold submerged time found in this study for dugongs. which would make the
optimal submerged time for dugongs in this study approximately 90.5 seconds.
Similarly, the optimal depth would be about 2.3 m or less. According to the
predictions of this model, a dugong should therefore surface approximately every
90.5 seconds or less, whenever it is possible to do so without sacrificing too
much foraging time, such as when foraging in shallow (2.3 m or less) water. At
depths greater than 2.3 m, surfacing this often may reduce the proportion of time
spent foraging to something less than an acceptable level, as travel time would
become a larger proportion of the submerged time.
Having such a shallow optimal foraging depth is supported by a model
developed to predict optimal foraging depth, which determined that the optimal
depth is always shallower than the depth at which forage denslty is the highest,
even if the depth with the highest density is within easy reach (Mori 1999). It is
beneficial to choose an optimal depth at which to forage whenever the availability
of food depends on depth (Mori 1999).
The straight-line increase in surface time with submerged time seen for
dugongs beyond the threshold submerged time suggests that foraging time is
optimized so as to avoid costly surface times (Houston and Carbane 1992).
Surface time appeared to be unaffected by submerged time until the threshold
submerged time of about 90.5 seconds was reached, beyond which surface time
increased with increasing submerged time. Submerged times usually reached
this duration at about 2.3 m in depth (Fig. 3.6), which is the threshold depth

where surface time was influenced by depth (Fig. 3.9). Surface time therefore did
not appear to be influenced by either depth or submerged time until some
threshold was reached, beyond which it increased. I suggest that for foraging
dives this sudden (aerobic) increase in surface time is more a factor of
submerged time than of depth since at shallow depths (~2.3 m) surface times
were only observed to increase beyond the one or two seconds needed for
expirationhnspiration on those occasions when submerged times were also
longer than usual for those depths. Submerged times do vary in shallow water,
and may be a function of individual variation or of the foraging method used.
Digging for invertebrates may require longer submerged times than grazing or
rooting for seagrass, causing increased energy expenditure and oxygen
consumption, and leading to increased surface times at shallow depths.
While depth may influence surface time simply because it causes
submerged time to increase, surface time was never more than one or two
seconds during travelling or resting dives regardless of whether depth or
submerged time increased beyond the threshold values seen for foraging dives
(pers. obs.; data of this study). This suggests that the surface time of foraging
dives may ultimately be influenced by something other than depth or submerged
time, such as the physical effort involved in foraging, and the resulting cost in
terms of oxygen consumption. Foraging must therefore be more energetically
costly than even travelling, although both behaviours involve an exercise
component. Although energy costs were not measured during this study, an
examination of data for a variety of diving mammals found that foraging involved

a higher level of metabolic activity than either travelling at low speed or resting
(Leeuw 1996).
The dive models of Houston and Carbone (1992) and Carbone and
Houston (1996) do not predict constant surface times either at shallow depths or
at low submerged times. This could be due to the shape of the oxygen gain
function used in the models. A minor change in the shape of the curve can affect
the predictions of the model (Walton et al. 1998, Ruxton et al. 2000). According
to Boyd (1997) the oxygen gain (or loading) curve commonly used in dive models
comes from studies of hemoglobin and myoglobin oxygen dissociation curves,
forced diving, and Weddell seals in which the rate of reoxygenation of blood
following a dive was examined (Qvist et al. 1986). It seems unlikely that this
curve would apply equally well to all diving animals given that the shape of the
curve would be affected by physiological and morphological characteristics of the
respiratory and circulatory tracts (Kramer 1988). A study of gas exchange in grey
seals, for instance, found that oxygen extraction from inhaled air was not
instantaneous upon surfacing (Reed et al. 1994). as is implied by the tissue
oxygen saturation curve used in the model by Houston and Carbone (1992).
Furthermore, incorporation of a delay in oxygen loading into Houston and
Carbone's model more accurately predicted the diving behaviour of Antarctic fur
seals, particularly for dives of short duration (Boyd et al. 1995). Both Boyd (1997)
and Ruxton et al. (2000) believe there is a need for more rigorous testing and
more careful selection of oxygen recovery curves based on the physiology of the

study animal. The dive patterns of dugongs obsenred in this study provide further
evidence to support this view.
4.5.1.6 Dive-pause ratio
4.5.1.6.1 Dive-pause ratio by depth
Dive-pause ratio, or the submerged time to surface time ratio. (t+t)/s,
should decrease as the proportion of time spent at the surface increases
(Houston and Carbone 1992). As Kramer (1988) predicted that the proportion of
time at the surface should increase with depth, so the dive-pause ratio would be
expected to decrease with depth. The aerobic models predict that the dive-pause
ratio can be a nonmonotonic function of depth (Carbone and Houston 1992).
Dive-pause ratio in 1997 increased to a maximum of about 80 at 1.5
metres before decreasing to approximately 6 by a depth of 3 metres, beyond
which it remained fairly constant (Fig. 3.19b). Between 2.3 and 11 metres
(beyond the threshold depth), DPR initially decreased with depth (Fig. 3.19~).
This relationship was described by a third order polynomial, which is consistent
with Houston and Carbone's (1992) prediction that DPR could be a
nonmonotonic function of depth.
The decrease in DPR beyond the threshold depth was caused by an
increase in the proportion of time spent at the surface and a decrease in the
proportion of time spent submerged. Both surface time and submerged time
increased with depth, but since surface time increased at a faster rate than

submerged time, the proportion of time within the dive cycle was shifted in favour
of surface time, as predicted by Kramer (1988).
4.5.1.6.2 Dive-pause ratio by submerged time
When plotted against submerged time, DPR in 1997 increased to a
maximum of about 80 at a submerged time of 81.6 seconds then decreased with
increasing submerged time to about 6 (Fig. 3.20). A similar pattern has been
noted for several seabird species (Wanless et al. 1988, Walton et al. 1998).
Walton et al. (1998) attributed this pattern in seabirds to an abrupt upturn in
surface time at a critical submerged time, which caused the DPR to be
maximized at this submerged time, leading to a secondary decrease in DPR. The
authors' suggested that this was due to the unique respiratory anatomy (and
therefore possibly a unique oxygen uptake function) of birds. Dugongs also
showed an abrupt upturn in surface time as submerged time increased (Fig.
3.10), causing a similar effect on the DPR. The initial increase in the dugong
DPR was a result of near constant surface times as submerged time increased
up to a threshold of about 90.5 seconds, beyond which surface time began to
increase and consequently DPR began to decrease. Examination of guillemot
and puffin dive data (Wanless et al- 1988) showed a similar lack of response by
surface times until a threshold (or critical) submerged time was reached. The
threshold submerged time (which was different for each species of seabird) was
also the point at which the guillemot and puffin DPRs reached their maxima and
began to decrease. This pattern in DPR was predicted by the Walton et al.

(1998) model. Again, the main difference between this model and the Houston
and Carbone (1992) model from which it was adapted is that the oxygen gain
curve used by Walton et at. has a kink that divides oxygen uptake into the
respiratory tract from oxygen uptake into hemoglobin and myoglobin, with the
initial oxygen uptake into the respiratory tract being faster than the secondary
uptake into the tissues. It was later determined, however, that a kink in the
oxygen gain curve is neither necessary nor sufficient to produce a nonmonotonic
dive-pause ratio (Houston 2000. Ruxton et al. 2000).
Walton et al.'s model predicted that when divers use more oxygen than is
stored in the lungs and make use of the oxygen stored in the hemoglobin and
myoglobin, there will be an overall reduction in DPR at any submerged time, and
either a reduced peak in DPR that occurs at a lower submerged time or no peak
at all. Dives that require more effort at any given depth or for any given
submerged time would use more oxygen and could possibly produce such an
effect, probably because submerged time would decrease for a given depth while
surface time would increase, causing the ratio of submerged time to surface time
to be smaller. The obvious peak in DPR for dugongs suggests that their diving in
1997 did not require more oxygen than was stored in the lungs. It also offers a
possible explanation as to why this DPR pattern has not been seen in other
diving mammals - they make use of hemoglobin/myoglobin oxygen stores, rather
than relying on lung oxygen stores.
Another possibility is that this DPR pattern does occur in other marine
mammals, but because it can only occur during short, shallow foraging dives, it

has been overlooked due to methodology. Most diving behaviour data for marine
mammals is collected using TDRs rather than by direct observation. Unless
observed directly, shallow dives can be impossible to separate into travelling,
feeding, or resting dives and are often suppressed (Kooyman et al. 1992, Boveng
et al. 1996). The resolution of most TDRs may not be fine enough to provide an
accurate picture of diving behaviour during short dives or at shallow depths. It is
common practice to select a TDR sample interval that is, at most, half the
duration of the shortest-duration behaviour being detected. which is normally the
surface time (Boyd 1993). A study of Antarctic fur seals considered dives of less
than two metres to be outside the accuracy of the TOR and excluded them from
analysis (Boyd et al. 1994). Such exclusion of short, shallow dives causes an
increase in the maximum depth, and in the mean submerged and surface times
of dives (Boyd 1993). TDR threshold depths can also depend on the brand of
recorder (Kooyman et al. 1992). Brands with broad resolutions may be chosen
either because researchers are more interested in maximum submerged times
and depths, or because the study animals in question rarely if ever make such
short, shallow dives, or simply to save memory for longer deployment. A study of
king penguins, which are very deep divers, used TDRs with sample rates ranging
from 8 or 10 per second to once every 4 seconds, and dive thresholds of about 3
to 5 metres (Kooyman et al. 1992). Similar resolutions are also used for animals
that do not usually dive very deep, or for very long. For example, the TDRs used
in a study of California seal lions could only resolve dives greater than 10 metres
in depth and 30 seconds in duration, even though the majonty of the animals'

dives were about 80 metres in depth and less than 3 minutes in duration
(Feldkamp et al. 1989). A study of cormorants used a TOR sampling interval of
five seconds for birds that usually dove for less than 100 seconds and to less
than 30 metres (Watanuki et al. 1996). A study of fur seals, which are shallow
(15-30 m) and short (1-2 min) divers (Boyd 19931, used a TDR sampling interval
of five seconds and a resolution of two metres (Boyd et al. A995). Although this
was a shorter interval than is commonly used, the author admitted that some
surfacings may still have been missed, and that even shorter intervals may be
required to detect finescale behaviour patterns (Boyd 1993). The degree of
resolution used in these studies would not have revealed the pattern I obsewed
for dugongs.
The choice of TDR sampling interval can have a significant impact on
what data is collected and therefore on the interpretation of the study animal's
diving behaviour. For example, Boyd (1993) studied the effects of changing the
TDR sampling interval on the observed behaviour of southern elephant seals and
Antarctic fur seals. He found that increasing the sampling interval caused a
significant loss of information. This was especially true for the fur seals, which
are shaliower, shorter divers than elephant seals. Increasing the sampling
interval from 5 to 40 seconds resulted in about 50% of fur seal surface periods
going unrecognized. He concluded that these results would probably apply to a
wide range of diving species and that therefore TDR sampling intervals must
always be chosen very carefully.

4.5.1 -7 Similarity between diving patterns of dugongs and seabirds
Walton et al. (1998) stated that the unique diving patterns observed in
seabirds have not been seen in marine mammals, yet their model applies to
dugongs as well as it does to seabirds for predicting optimal submerged time,
optimal surface time, and dive-pause ratio. This may be due to something that
dugongs and birds share in common, such as the use of the lungs as the primary
oxygen source while diving. A substantial proportion of the oxygen available to
diving birds is held in the respiratory system (Butler and Jones 1997). Walton et
al. (1 998) have created a model not for birds per se, but for divers whose oxygen
gain curves are either not smooth or increase at a very steep rate initially. Their
model may apply to aquatic animals that rely more on their lung oxygen store
while diving than on their hemoglobinlmyoglobin stores, andlor that possess
some biochemical property of their blood that enhances the rate of oxygen
uptake from the lungs, such as enhanced oxygen affinity. If this is the case, one
might also expect similar diving patterns to be seen in the sea otter, for example.
whose total lung capacity is 5 to 8 times greater than would be predicted from
body weight (Leith 1976).
Dugongs probably rely much more on their lung oxygen store while diving
than on hemoglobin or myoglobin stores. A Florida manatee was found to carry
58.8% of its stored oxygen in the lungs, compared to 35.3% in the blood and
5.9% in the muscle (Scholander and Irving 1941). Dugongs dive with a significant
amount of air space in their lungs (Domning and De Buffidnil 1991), so there is a

potentially large lung oxygen store available while diving. In addition, Marsh et al.
(t978) felt that dugongs probably do not experience significant lung collapse,
which would force the oxygen into those areas of the respiratory system where
gas exchange cannot occur, as they dive in relatively shallow water and do not
exhale before diving. However, recent evidence has shown that partial collapse
of the chest-wall is necessary for survival at depths of only 3.5 metres for all
breath-hold divers (Brown and Butler 2000). While no information is available
regarding the hemoglobin and myoglobin stores of dugongs, they are modest in
manatees compared to other marine mammals, with values of 12.8 to 14.8 g of
hemoglobin per dl of blood (Medway et ai. 1981. Kooyman 1989) and 15.0 g of
myoglobin per kg of tissue (Blessing 1972, Snyder 1983).
Dugongs also possess certain blood properties that may enhance the use
of their lung oxygen stores. The oxygen affinity of dugong blood, as measured by
is very high, which may reflect a blood-oxygen equilibrium that is left-shifted
in comparison to human blood (McCabe et al. 1978), as it is in the Florida
manatee (White et al. 1976). This would imply an enhanced blood-oxygen
affinity, which aids in rapid oxygen uptake from the lungs, and may also favour
oxygen release to tissues under conditions of severe hypoxia (Turek et al. 1973).
Houston and Carbone (1992) predicted that in cases where air exchange is
rapid, an increase in surface time with depth (and presumably with submerged
time) might be subtle. So, perhaps any diver with rapid air exchange, such as the
dugong and diving birds (Millard et al. 1973). will produce the observed pattern of

an initially flat surface time at low depths (or low submerged times) followed by
an aerobic increase in surface time at a threshold depth (or submerged time).
4.5.1.8 Number of breaths and breathing rate
The number of breaths increased with depth (Fig. 3.1 lad). This was not
predicted by either model, however it seemed likely for the number of breaths to
be related to surface time and therefore to be influenced by the same factors.
Indeed, surface time increased linearly as the number of breaths increased (Fig.
3,12c), indicating that surface time was a function of the number of breaths
taken.
The number of breaths has been shown to increase with depth in
bowhead whales (Wursig et at. 1984). The number of breaths has also been
shown to increase with submerged time (Dolphin 1987a, Dolphin 1987b) and
surface time in humpback whales (Dolphin 1987a, Dolphin 1987b, Chu 1988)
and walruses (Nowicki et al. 1997).
The number of breaths taken at the surface can indicate whether an
oxygen debt has built up during the preceding dive (Chu 1988). Animals which
exchange most of their lung volume with each breath (i-e. tidal volume near
maximal) cannot increase ventilation by breathing more deeply or more strongly,
but must increase their breathing frequency instead (Sholander and Irving 1941).
Breathing frequency can be increased either by increasing in the number of
breaths during a surface visit, resulting in an increase in surface time, or by
increasing the number of surface visits within a dive bout, resulting in a decrease

in mean submerged time. The breathing frequency of Amazonian manatees
within a dive bout was shown to increase in response to low oxygen and high
carbon dioxide levels in the alveoli (Gallivan 1980) which would occur as
submerged time increases. In fact, Gallivan (1980) found that increased minute
ventilation (the amount of air in Iitres expelled from the lungs per minute) in
Amazonian manatees was due primarily to an increase in breathing frequency,
and that increased ventilatory drives therefore caused a decrease in submerged
time and, ultimately, a change in dive patterns.
Breathing frequency (or rate) can be used to estimate energetic costs
(Sumich 1983) since there is a correlation between breathing rate and metabolic
rate (Scholander and Irving 941). Breathing rate, or blow rate, is frequently
studied in whales (Sumich 1983, WSrsig et a[. 1984 and 1986, Dolphin 1988). In
part, this is because blows are so visible, but also because it acts as an indicator
of physiological state (Dolphin 1987b). Breathing rate was found to increase as a
function of submerged time in harp seab (Kooyman et al. 1971) and other marine
mammals (Ridgeway et al. 1969, Kooyman 1973). Migrating gray whales
increased their breathing rate (breaths per minute of dive cycle) as their swim
velocity increased (Sumich 1 983). This increase was achieved by decreasing
submerged time rather than by increasing the number of breaths taken after a
given submerged time. tf the submerged time is already near the ADL, this would
prevent having to use anaerobic respiration.
Dugong breathing rate in 1997 was approximately one breath per second
when one breath was taken per surface visit, but only about 0.1 1 breaths per

second (or one breath every nine seconds) when more than one breath was
taken per surface visit (Fig. 3.12b). Breathing rate for both data sets remained
nearly constant when more than one breath was taken per surface visit (Fig.
3.12a). resulting in an increase in surface time as the number of breaths
increased (Fig. 3.12~).
4.5.1 -9 Proportions of the dive cycle spent at the surface and submerged
Kramer (1988) predicted that the proportion of time spent at the surface,
s/(t+s+s), will increase vath increasing depth while the proportion of time spent
submerged, (t+.r)l(t+t+s), will decrease with increasing depth. The proportion of
time at the surface is expected to increase with depth because oxygen is
acquired at a decreasing rate the longer the animal stays on the surface, causing
surface time to increase more quickly than submerged time (Kramer 1988).
Houston and Carbone (1992) predicted that the proportion of time spent at the
surface can be a nonrnonotonic function of depth. The proportion of time spent at
the surface did increase nonmonotonically in 1997 between the depths of 2.3 and
1 I metres (Fig. 3.21). If the proportion of the dive cycle spent at the surface
increases, then the proportion spent submerged must decrease, which was also
seen in the results (Fig. 3.16). The decrease in the proportion of time spent
submerged occurred in spite of an increase in the absolute submerged time with
depth, showing that surface time did increase more rapidly than submerged time.

4.5.1 . A 0 Evidence of anaerobic respiration?
Behavioural evidence of anaerobic respiration can be found by examining
the effect of submerged time on postdive surface time and of depth on foraging
time. An increase in submerged time will result in a longer recovery period at the
surface (Kramer 1988). The increase in surface time wiii be more dramatic if
anaerobic respiration is used. While surface time was shown to increase with
submerged time and with depth in this study, again as predicted by the aerobic
models, no abrupt upturn in surface time was seen either at the deepest depths,
or at the longest submerged times (Figs.3.9 8 3.10). This suggests that dugongs
did not use anaerobic respiration at depths up to 11 metres or at submerged
times of up to 377.67 seconds, although an anaerobic upturn in surface time can
occur after the ADL has been reached rather than at the ADL (Mori 1999), nearer
the combined aerobic-anaerobic limit (Carbone and Houston 1996). If this is the
case, the surface time results taken alone do not rule out the use of anaerobic
respiration at the obsenred depths and submerged times. In addition, evidence of
anaerobic metabolism in the form of long surface times may be difficult to find
since animals would normally choose foraging times that avoid the cost of long
surface times (Houston and Carbone 1992). Regardless, anaerobic metabolism
coutd occur in dugongs under times of stress, such as during predator avoidance
or when foraging on scarce, good quatity patches in deep water. A study of
forced submersions of a Florida manatee did show evidence of anaerobic
metabolism (Scholander and Irving 1941), although it may have been an artifact

of restraining recently caught animals and may not normally occur under free-
diving conditions.
Carbone and Houston (1996) predicted with their mixed metabolism model
that foraging time will increase, then decrease, then increase with depth and that
this second increase would be associated with an increase in anaerobic
respiration. They suggested that foraging time might provide a more reliable
behavioural measure of a shift to anaerobic respiration than does surface time
under conditions where the shift in the fraction of energy spent by aerobic
respiration is abrupt. No such secondary increase in dugong foraging time was
observed, suggesting again that dugongs do not use anaerobic respiration while
diving at depths up to 11 metres or while submerged for up to 377.67 seconds.
4.5.1 .I 1 Conclusions regarding depth effects on foraging dive cycle variables
The foraging dive patterns observed for dugongs were similar in many
ways to other marine mammals with the exception of the unique surface time and
dive-pause ratio patterns, which were more like patterns observed in diving birds.
In addition, a larger proportion of time was devoted to foraging than seen in other
divers, which is not surprising given the dugongs' low metabolic rate and low
quality diet.
While a number of qualitative predictions of the models presented in
Houston and Carbone (1 992) and Carbone and Houston (1 996) were supported
by the results, certain aspects of the allocation of time during foraging dives were
better predicted by the model presented in Walton et al. (1 998).

4.5.2 Comparison of the Data Sets
4.5.2.1 Introduction
The 1997 and 1987-89 data sets were significantly different, in pattern
andlor in magnitude of difference between the statistics, for all but one of the
foraging dive variable relationships. Although in some cases the relationship
trends of the two data sets had the same shape (and even the same slope), the
absolute values of the variables were generally larger and the trends more
pronounced in 1997 than they were in 1987-89. Furthermore, while the various
proportions of the dive cycle and of submerged time were affected by depth in
1997, they were generally not affected by depth in 1987-89.
Changes in foraging patterns, such as those observed between the two
data sets, can be the result of changes in foraging conditions. Because foraging
models predict an optimum set of behaviours under particular circumstances, a
change in foraging conditions would be expected to cause an alteration in
foraging behaviour (Boyd et al. 1994). Changes in foraging dive patterns in
response to variations in foraging conditions have been observed in several
species of diving animals, from marine mammals (Costa et al. 1989, Feldkamp et
at. 1989, Jaquet et al. 2000) to seabirds (Watanuki et al. 1993, Monaghan et al.
1994, Monaghan 1996, Culik et al. 2000, Hull 2000). The diving behaviour of fur
seals has been shown to change to accommodate variation in the abundance
and distribution of food (Boyd et al. 1994).

According to Watanuki et at. (1993), diving behaviour can be altered in
response to changing conditions in the following ways: i) the profile, depth, and
duration of each dive, ii) the duration and frequency of dive bouts, iii) the overall
activity budget of a foraging trip in terms of the proportions of time spent
travelling, diving, and resting, and iv) the energy expenditure during the various
stages of a dive or dive bout. The specific response often varies by species and
may be affected by the nature of their food source.
Foraging and environmental conditions change seasonally in Shark Bay.
Since the two data sets were collected in different seasons, and therefore under
conditions of different water temperatures and forage availability, seasonal
changes in foraging and environmental conditions may be the basis for the
observed differences in dive patterns.
Full interpretation of the differences between the data sets is ultimately
beyond the scope of this thesis since it would require a long-term study
integrating dugongs, forage availability and quality, and physical conditions.
However, since differences in foraging behaviour between years can provide an
indication of how foraging behaviour is adapted to changing environmental
conditions (Boyd et al. 1994), it is important to consider potential reasons for the
differences observed in this study. There are also management implications to
such differences in dive patterns. Dive data are considered useful tools for
studying the changes in foraging and environmental conditions experienced by
marine mammals (Boveng et al. 1996) and can be used by wildlife and
ecosystem managers to indirectly monitor changes in these conditions through

obsenration of periodic changes in dive patterns (Monaghan 1996, Culik et at.
2000).
Several sources of variability are examined in the remainder of this section
as possible explanations for the observed differences between the hrvo data sets.
While my study did not provide the kind of data necessary to reach a definitive
conclusion regarding the observed differences, it is my intention that the folIowing
examination may serve as the basis for future studies in this area.
4.5.2.2 Sources of variabiltty
4.5.2.2.1 Observer bias
The simplest, and perhaps most obvious, factor that may have influenced
the data sets is observer bias. The data sets were collected by different
observers engaged in different studies. The observations in 1997 were collected
solely for the purposes of this study, while those in 1987-89 were not, and may
therefore have been coliected in a manner that influenced the results differently.
4.5.2.2.2 Seasonal variability in Shark Bay
The water temperature of Shark Bay changes seasonally, affecting both
the distribution of dugongs and the availability of forage types within the Bay
(Anderson 1986). The two data sets were collected from Shark Bay during
different seasons and therefore under different environmental and foraging
conditions (Tables 3.2 and 3.3). Seasonal variation in either environmental or

foraging conditions, or both, may account for the observed differences in dive
patterns.
I) Foraging conditions
Foraging conditions encompass the availability, abundance, distribution,
type, and quality of food. Changes in foraging conditions occur annually,
seasonaily, or irregularly, usually in response to environmental conditions. A
change in one aspect of foraging can lead to a change in another. Changes in
food availability, due to shortages or alterations in spatial and temporal growth
patterns, can necessitate changes in food type, foraging mode, and often
foraging effort as well.
Foraging conditions in Shark Bay change on an annual cycle. Seasonal
differences in the types of forage items available, the variability in their nutritional
quality, and the foraging modes used to consume them could account for some
of the differences observed between the two data sets. Annual variation in
production, biomass, and nutrient status has been observed in certain
seagrasses that may be a result of changing environmental conditions (Walker
and McComb 1988). Dugongs are forced to feed mainly on Amphibolis antarctica
during the winter, when it is the dominant forage type available (Anderson 1986).
They switch to their preferred species of seagrasses, Halodule uninervis and
Halophila spinulosa, when water temperatures allow access to them (Anderson
1986, Anderson 1994) and when those species are at their peak (Walker et al.
1988). The different types of seagrasses have different nutritional qualities and

are consumed using different foraging modes. Dugongs root in the substratum
for the underground rhizomes of Halodule sp. and Halophila sp. (Marsh et at.
1982). Rhizomes rich sources of carbohydrate, in the form of starch (Birch 1975)
and glucose, and have a higher caloric content than the leaves in most species
of seagrass (Johnstone and Hudson 1981). Only the leaves of Amphibolis are
eaten (Anderson 1982b, Anderson 1986). They are high in nitrogen, but are less
digestible than the leaves of either Halodule or Halophila due to their higher fibre
content. There is evidence to suggest that dugangs select seagrasses with low
fibre content (Lanyon 1991). Dugongs have been observed to choose smaller,
sparsely distributed plants over dense. old stands of the same species (Anderson
and Birtles 1978, Preen 1993, De longh et at. 1995), although this may be due to
the coincidence of low above-ground biomass and high below-ground biomass
with high levels of soluble carbohydrates (De longh et al. 1995), rather than to a
rejection of older, more fibrous plants. In addition to seagrasses, several kinds of
invertebrates, such as sea pens, burrowing mussels (Anderson 1989), and
benthic tunicates (Preen 1993) are selectively eaten and these, too, are good
sources of protein. Like seagrass rhizomes, these particular invertebrates must
be dug from the substrate. It is unknown whether consumption of invertebrates is
seasonal.
The time and effort needed to consume particular forage types could
account for the observed differences in the present study because certain
foraging modes may be more energetically demanding or time consuming than
others. Individual foraging behaviours or strategies can have different costs and

benefits, including metabolic costs (Costa 1988). For example, Anderson (1998)
observed that the mean dive cycle duration of dugongs foraging in a Halodule
community in the "flukes-upn or "headstand" mode (body angle >45 to bottom)
was almost half that of dugongs foraging on Halodule in the "horizontal" mode
(body angle 4 5 to bottom). The greater exertion required to forage in the more
vertical mode may have reduced the ADL. shortening the submerged times, and
ultimately decreasing the dive cycle durations of these animals. Anderson (1982
and 1984) felt that rooting for rhizomes, and presumably invertebrates, must be
more energetically demanding than grazing on leaves. Comparing dugongs
rooting for Zostera rhizomes in Shoalwater Bay, Queensland (Anderson and
Birtles 1978), with dugongs grazing on Amphibolis leaves in Shark Bay,
Anderson (1982b), found that mean submerged time was significantly greater
while rooting. The longer submerged times for rooting dugongs suggest that
while rooting may be more time consuming than grazing, it probably does not
consume more energy, although the actual amount of energy needed for this and
other foraging modes has never been confirmed by measures of oxygen
consumption. Certain plants may require longer handling times or consumption
rates than others, due to differences in plant anatomy, fibre content, and material
properties, rather than differences in foraging mode. Florida manatees, for
example, were observed to consume plants with tubular stems and numerous
branches faster than plants with flat blades (Marshall et al. 2000). While no
similar information exists for dugongs, longer submerged times may be
necessary when foraging on certain foods. The longer submerged times

obsenred in the 1997 data set may have been due to a predominance of rooting
over grazing as preferred forage types became increasingly available during the
annual springtime southward migration. The shorter submerged times from the
1987-89 data set may have been the result of the predominance of winter
grazing behaviour.
Abundance of forage, rather than the type of forage, can also affect dive
patterns. Submerged times were shorter in Shark Bay, where vegetation was
more abundant, than in Shoalwater Bay (Anderson 1982b, Anderson 1984).
Abundance of seagrass may have also affected the submerged times of dugongs
rooting for Zostera (Anderson and Bittles 1978). The average length of dugong
feeding trails were 64% longer in an area where vegetation density was 800%
less (Anderson and BirtIes 1978, Anderson 1984). Since each trail was assumed
to represent a single foraging trip, the Ionger trails imply that foraging times, and
therefore submerged times, were longer in the areas with less abundant
vegetation. However, there is also the possibility that the differences in mean
submerged time in these examples were due to differences in water depth rather
than abundance. Depth was reported only as "various" for the Shark Bay
obsenrations, compared to the three metre depth in Shoalwater Bay.
Changes in foraging conditions can affect foraging patterns in different
ways depending on the nature of the animal's prey. This is demonstrated by the
effect of a known food shortage on the dive patterns of two species of seabirds.
The postdive surface times of guillemots were found to be shorter for any given
submerged time during a year with poor foraging conditions than during a year

with good foraging conditions (Monaghan et al. 1994). This indicated that
guillemots could adjust their time budgets in response to foraging conditions by
spending less time on the surface. The authors inferred from the difference in
surface time between years that either a particular surface time does not ahvays
represent the optimal recovery time for a particular length of submerged time, or
that guillemots can build up a recovery debt to be paid off between bouts of
diving. Furthermore, they felt that shorter surface times during poor foraging
conditions could aid in maximizing search time during a diving bout. Dugongs,
unlike most diving birds, were not observed to forage in discreet bouts followed
by a resting period. However, while dugongs may be able to delay recovery from
prolonged diving bouts with less than optimal surface times, this seems unlikely
due to their non-predatory foraging behaviour.
Food shortage was also found to influence time allocation wrthin the dive
cycle of shags (cormorants), although in a different manner than with the
guillemots (Monaghan 1996). While guillemot surface times were shorter during
poor foraging conditions for a given submerged time, shag surface times were
longer, especially at the longer submerged times. Monaghan postulated that the
difference between the two species was due to their different foraging methods:
guillemots feed on fish in mid-water while shags forage on fish buried in the
bottom. Both species were presumed to work harder and use more oxygen under
poor foraging conditions, thereby increasing their foraging effort. However, while
it may be beneficial under poor conditions for guillemots to postpone full recovery
while fish are available, shags can afford to recover fully after each dive, since

bottomdwelling fish are less mobile. Any increase in foraging effort by shags
would therefore result in an immediate increase in postdive surface time. Since
dugongs also feed on non-mobile food sources, one would not expect them to
postpone recovery time from foraging dives, suggesting that their surface times
may increase under poor foraging conditions.
ii) Environmental conditions - water temperature
It may be the seasonal changes in water temperature that occur in Shark
Bay, rather than the resulting changes in foraging conditions, that are directly
responsible for the observed differences between the two data sets. The
dugongs in Shark Bay are at the southernmost limit of their range (Anderson and
Heinsohn 1978) and must undergo a seasonal migration within Shark Bay that is
determined by water temperature (Anderson 1986, Marsh et al. 1994). In the
winter, water temperatures fall inside the Bay and dugongs are restricted to the
outermost (western and northern) edges of the Bay where warm ocean currents
keep the water temperature within the range favoured by dugongs (Anderson
1982a, Anderson 1986). In the spring, as water temperatures increase, dugongs
migrate towards the inner (southern and eastern) portions of the Bay for the
summer.
Ougongs prefer water temperatures greater than 19 "C (Anderson 1984).
Since water temperatures in the 1987-89 data set averaged only 19.S°C,
compared to 22.1 "C in the 1997 data set, dugongs may have been metabolically
stressed during the 1987-89 observation period, causing an alteration in dive

patterns. Citing evidence from a study on Amazonian manatees (Gallivan et al.
1983), Anderson (1 984) suggested that cooler water temperatures could require
dugongs to be cnore physically active in order to maintain core body temperature
and to surface more frequently, thereby reducing submerged times. However, an
increase in muscular activity to produce body heat implies an increase in MR.
While an increase in MR could account for a reduction in submerged and
foraging times due to a reduction in ADL, it does not explain the shorter surface
times which were observed during the 1987-89 sampling period. Although shorter
submerged times would allow shorter surface times under normal metabolic
conditions, an increase in MR would require a longer surface recovery period for
any given submerged time, and surface times were shorter in 1987-89 than in
1997 for any given submerged time rather than longer (Fig. 3.10).
Another possibility is that more frequent surfacing in cooler water may
simply be a means of increasing the time spent in warmer surface water
(Anderson 1984). Although not measured in either the 1997 or 1987-89 studies in
Shark Bay, temperature differences between the surface and the bottom
recorded on the nearby North-West Shelf in 20 mdeep water found a difference
of at least 2 "C between the surface and the bottom (Walker and Prince 1987).
More frequent surfacing would reduce the average submerged time but might not
necessarily involve an increase in MR. Shorter submerged times without an
increase in MR would not result in longer surface times for given submerged
times. Under this scenario, a decrease in submerged time for any given depth

would also cause a decrease in surface time for any given depth, as was seen in
the 1987-89 observation period compared to 1997.
4.5.2.3 Dive cycle proportions
While the various proportions of the dive cycle and of submerged time were
affected by depth in 1997, there was no effect of depth on similar observations
collected in 1987-89. Houston and Carbone (1992) found that the proportion of
time spent foraging was sometimes a constant function. They attributed this to
the allocation of time being influenced by factors not included in their model, such
as social interaction. The proportion of time spent foraging was not maximized in
such instances because something other than the goal of maximizing the
proportion of time spent foraging was determining the allocation of time within the
dive cycle. The fact that the proportion of time spent foraging did not decrease
with increasing depth in 1987-89 meant that the proportions could not have been
near their maximum at any depth, which suggests that there was little cost in
being less than maximum. Perhaps the pay-off during 1987-89 was not in terms
of energy gain, but was something not measured in the model, such as
maximizing surface time in order to maintain body temperature. This would
support my hypothesis that cooler water temperatures played a role in the 1987-
89 results. It could also mean that some of the predictions of conventional diving
models. which are based on foraging theory and energy acquisition, might not
apply to dugong foraging behaviour in cold water, if energy conservation rather
than energy gain is the main goal.

The proportion of time spent foraging can be affected by foraging effort.
Higher foraging costs caused fur seals to spend proportionately less submerged
time foraging, tl(tcr), at all depths (Boyd et al. 1997). In my study, the proportion
of submerged time spent foraging was significantly smaller at any given depth in
the 1987-89 data set, suggesting that there was an additional cost to foraging
during that sampling period. This could also have been due to the cooler water
temperatures. However, surface time was also shorter for any given depth during
this same period, which is contrary to Houston and Carbone's (1992) predictions
regarding increased foraging costs or increased underwater costs. In addition,
the proportion of the dive cycle (rather than submerged time) spent foraging,
t/(t+r+s), was described by the same regression equation for both data sets,
suggesting that foraging efficiency was similar during both sampling periods in
spite of the shorter foraging times in 1987-89. This was the only proportional
reiationship that did not differ between the two data sets.
It is also possible that the 1987-89 data set was just too small to detect an
effect that was there (type I1 error). Conversely, the 1997 data set may have
been too small to reject an effect when one did not exist (type I error).
4.5.2.4 Conclusions of Comparison
Although it is impossible to determine exactly what caused the differences
between the two data sets, it seems likely that they were the result of variation in
either foraging conditions or environmental conditions between the two sampling
periods. These conditions are known to change seasonally in Shark Bay,

suggesting that changes in dugong foraging dive patterns may be a regular
seasonal occurrence.
Poor foraging conditions have been shown to cause changes in foraging
behaviour. These changes in foraging behaviour can be expressed as an
increase in foraging effort, characterised by either an increase in foraging time or
by an increase in metabolic rate, resulting in reduced foraging time. In general,
an animal must work harder, or longer, to obtain a comparable amount of food
from a poorer environment.
The 1997 data set may represent a period of poor foraging resulting in a
lower energy intake rate. This may have involved increased rooting behaviour,
which could have caused the observed increases in foraging time, submerged
time, and surface time for any given depth. The average net rate of energy intake
from the environment can be affected by a number of parameters associated with
foraging conditions, including the cost of travelling between patches, the cost of
searching for food, the costs associated with various foraging methods, and the
benefits associated with different forage types. An increase in any or all of these
costs, or a decrease in benefits, would decrease the net rate of energy intake.
Information regarding forage types at the observation sites was insufficient to
properly interpret the results of the two data sets in terms of the prevaiting
foraging conditions.
Environmental conditions can also influence foraging behaviour. The
1987-89 data set may represent a period of increased surfacing, due to cooler
water temperatures, which resulted in the observed decreases in foraging time,
submerged time, and surface time for any given depth.
For further discussion of theories behind changes in foraging dive
patterns, and their application to dugongs and to the seabird example from this
section, see Appendix 6.
4.5.3 What Currency Where Dugongs Maximizing?
While animals clearly attempt to gain energy while foraging, it is not
always so clear what aspect of energy intake is being maximized (Thompson et
al. 1993). The various models tested in this study make predictions based on one
of four currencies: the proportion of time spent in the foraging area, the gross
rate of energy intake, the net rate of energy intake, and foraging efficiency.
The proportion of time spent in the foraging area is the currency used by
many models (see Wilson and Wilson 1988). Kramer (1988) theorized that if the
total rate of gain of energy increases with time at depth, then natural selection
should favour animals that maximize the proportion of time spent in the foraging
area. However, this does not take into account the cost of doing so, which may
make such behaviour unprofitable overall. The proportion of the dive cycle spent
foraging is also known as searching efficiency (Dolphin 1988, Ydenberg and
Clark 1989), or foraging efficiency (Watanuki et al. 1996) when it is calculated in
terns of time. Foraging efficiency can be calculated in terms of either energy
(energy gainedlenergy cost) or time (foraging timeldive cycle duration), but is
always a measure of a costfbenefit ratio.

Net rate of energy intake and foraging efficiency (the efficiency of energy
intake) do take the costs of foraging into account, making them more likely
currencies. As such, they are the currencies of choice in many foraging studies
(net rate of energy intake: Chamov 1976, Pyke et af. 1977, Tome 1988, Mori
1998b; foraging efficiency: Watanuki et al. 1996, Mori 1998a). A study of gulls
found that an animal should maximize its foraging efficiency whenever it can
easily meet its energy demands and when there is some demonstrable cost to
expending energy (Welham and Ydenberg 1988). De longh et al. (1995)
speculated that the goat of dugong foraging was energy maximization, possibly in
terms of a high net rate of energy intake, although this was unclear.
Houston and Carbone (1992) determined that it would be difficult to
distinguish between the proportion of time spent foraging, net rate, and efficiency
based on the allocation of time within the dive cycle since the predictions
generated by each currency were so similar, although the proportion of time
spent foraging can be distinguished from the other two since it predicts that the
minimum depth should be chosen. Net rate can be distinguished from efficiency
by determining the dependence of optimal surface time and optimal foraging time
on energy gain at a given depth since net rate will be affected by energy gain
while efficiency will not. As dugongs did not appear to always choose the
minimum depth for foraging, they were probably not maximizing the proportion of
time spent foraging. Energy gain was not measured in my study, so 1 cannot
distinguish between net rate and efficiency. Houston and Carbone (1992) felt that
since there were only small differences in the time budgets predicted by the
maximization of the net rate of energy intake and the proportion of time spent
foraging, the model based on maximizing the proportion of time spent foraging
gave reasonable estimates of foraging time and surface time for a given depth.
According to Thompson et al. (1993). it is unlikely that an aquatic animal
would attempt to maximize the gross rate of energy intake since this could cost
more energy overall than would be gained, resulting in a net energy deficit.
Unlike gross rate of energy intake. net rate of energy intake and foraging
efficiency both take into account the cost of energy expended. Net energy intake,
for example, was found to be a better predictor of sheep foraging behaviour than
gross energy intake when the energetic costs from exposure in winter were high
(Armstrong and Robertson 2000). There are, however, circumstances where the
cost of energy expenditure can be negligible. For example, predictions
concerning the summer foraging behaviour of sheep based on gross energy
intake were as likely to be accurate as those based on net energy intake when
the costs involved (in this case, walking and therrnoregulation) were small or
nonexistent (Armstrong and Robertson 2000). A similar condition may exist for
dugongs in summer.
Gross rate of energy intake and the proportion of time spent foraging are
sometimes interchangeable. The gross rate of energy intake is the product of the
proportion of the time spent foraging and the intake rate (Carbone and Houston
1994). However, since the intake rate has I i e effect on the time budget
predicted by net rate if it is constant (Houston and Carbone 1992). the gross rate
of energy gain can be cxlnsidered equivalent to the proportion of time spent in the

foraging area (Mori 1998b). In addition, the gross rate of energy intake can be
used to predict the optimal depth at which to dive given that food concentration
vanes with depth (Houston and Carbone 1992).
Animals may adopt different foraging strategies with different currency
goals depending on their particular circumstances. A study of fur seal swimming
speeds found that a variety of tactics were used during diving and that the tactic
used depended on the depth range of foraging (Boyd et al. 1995). Variation in
swimming speed with depth may indicate switches in the currency being
maximized; from maximizing energetic efficiency at shallow depths to maximizing
gross energy intake at deeper depths. Such currency switches are an inherent
problem with modeling animal behaviour (Ydenberg and Clark 1989) and can
restrict models in their capacrty to predict anything but average behaviour (Boyd
et al. 1995), although, the average foraging behaviour should be very dose to
that which results in maximum fitness, within current constraints (Pyke et al.
1977). It is important to note that the time scale over which the optimization is
applied (one day, one week, the animal's lifetime) can affect the prediction of
what is the optimal behaviour, particularly if the behaviour of the animal at one
point in time alters its optimal behaviour at a later point in time (Pyke et al. 1977).
Dugong swim rate was constant regardless of depth or direction of travel
(ascent or descent) suggesting that the currency being maximized did not
change during dives. Thompson et al. (1993) developed a model for seals that
made predictions about optimal swimming speed both during ascentldescent and
during foraging based on various currencies. They determined that an animal will

have a swimming speed at which it is the most efficient, based on drag, which
they termed the minimum cost of transport (MCT) speed. The model predicts that
animals should normally travel vertically between the surface and the foraging
area at this MCT speed, unless the animal is maximizing its energy intake (gross
or net), in which case it may be optimal for swimming speed to decline with
increasing depth. Seals that are attempting to maximize the proportion of time in
the foraging area or the net rate of energy intake should alter ascent and descent
rate according to depth. Seals that are attempting to maximize the efficiency of
energy intake (foraging efficiency) should always swim at the MCT speed,
regardless of depth. The same model also predicts that the MCT speed be used
during deep dives, regardless of the currency being maximized, and also when
foraging on stationary prey, once on the bottom, in order to maximize the area
covered and therefore to maximize the encounter rate. Since dugong travel rate
does not appear to change with depth, this would support the hypotheses that
they do not maximize either gross or net energy gain, but that they may attempt
to maximize foraging efficiency in terms of energy intake.
There may be an added effort of diving that pertains to buoyancy
(Kooyman and Ponganis 1998) which could affect currency use and optimal
behaviour. Even if travel rate does not change with depth, the physical effort
required as an animal fights positive buoyancy on the way down and negative
buoyancy on the way up may make certain depths more energetically costly to
visit than others, perhaps resulting in a switch in currency at these depths. There
will be a depth, however, where an animal could coast down or up. Whether an
animal would reach this point or not depends on how deep it dives. Ougongs may
be able to use their muscular bronchioles to close off respiratory vesicles in order
to compress the volume and density of air in their lungs, enabling them to surface
or sink with little effort and without expelling air (Engel 1962). This may reduce
the effect of depth on the amount of physical effort required to dive, perhaps
negating the need to switch currency at a certain depth.
4.5.3.1 Conclusions as to currency
Based on the available behavioural evidence, dugongs may have
attempted to maximize foraging efficiency in terms of energy gain, although
information regarding energy gain at given depths would be necessary to make
this determination.
4.6 Management Implications
4.6.1 Introduction
Dugong numbers have declined dramatically, even in protected areas. and
they are listed as Vulnerable to extinction worldwide (IUCN 2000). Shark Bay is
the most important known dugong area in the Indian Ocean (Preen 1998). The
approximately 10,000 dugongs in the Bay (Marsh et al. 1994, Preen et al.
1995 b), constituting about 10% of the Australian dugong population (Marsh and
Lefebvre 1994), have come under the threat of development in the past few
years. In spite of the fact that Shark Bay contains a Marine Park and is listed as a
World Heritage Site, the Western Australian government allows potentially

damaging activities to take place in such protected areas and has recently issued
permits for petroleum exploration in the Bay (Preen 1998). Increases in tourism
and aquaculture are atso potential threats, as is unregulated hunting by native
groups. Evaluation of the effects of such threats for management purposes
requires baseline data on undistuhed behaviour and habitat use.
Wijrsig et al. (1984) considered a quantitative description of dive
behaviour to be an essential component of any evaluation of the effects of
industrial disturbance, such as oil exploration, on marine mammal behaviour. The
allocation of time during the dive cycle and how it is affected by external forces,
in particular, have many implications for management. During foraging dives, the
proportion of the dive cycle that an animal spends in the foraging area must be
large enough to ensure adequate energy gain. Factors that decrease the
proportion of time available for foraging could lead to a decrease in the fitness of
the animal. Water depth and seasonal changes in foraging and environmental
conditions are two factors that can affect the allocation of time within the foraging
dive cycle and ultimately influence foraging efficiency.
4.6.2 Implications of Depth Effects
4.6.2.1 Habitat
Investigation of the relationship between dugong diving behaviour and
deep-water habitat in Shark Bay is crucial due to the importance of these areas
to dugongs. Dugong distribution in Shark Bay is known to change seasonally
(Anderson 1986). A winter survey found that dugong density in Shark Bay was

highest in relatively deep water (12-20m) (Marsh et al. 1994), confirming that
these deep-water areas are important winter habitat for dugongs when water
temperatures fall in other areas (Anderson 1986).
The proportion of time dugongs spend both at the surface and travelling
between the surface and the foraging area increases with depth, while the
proportion of time they spend foraging decreases with depth, making diving in
deeper water more costly than diving in shallower water. The increased cost of
diving in deep water may be offset by additional energy gain if diving to depth
allows access to more abundant or more nutritious forage. However, dugongs
are not always able to choose their foraging depths. Dugongs in Shark Bay are
forced to migrate to areas of deeper water during the winter when water
temperatures in other parts of the Bay decrease below tolerable levels. Diving
under cooler conditions increases the metabolic cost of maintaining body
temperature in addition to the costs of diving in deeper water, making winter an
even more stressful period for dugongs. Disturbances to dugongs, or to their food
supplies, in shallower areas may force dugongs into deeper areas, causing
stress.
Deep-water habitats may be less vulnerable to some kinds of disturbance
than are shallow-water habits, but more vulnerable to others. Preen et al.
(1995a) have shown that seagrass in deep-water recovers more quickly from
disturbances caused by cyclones and flooding than seagrass in shallow-water.
However, these deep-water seagrasses are also more vulnerable to
sedimentation since the maximum depth at which any seagrass is found will

depend on light availability and clarity of the water (Duarte 1991). Human
activities that disturb the seabed, such as trawling, have the potential to both
damage seagrasses and increase the suspension of sediments in the water
column, making the effect of deep water on dugongs of particular concern for the
management of areas where such activities occur. This is of even greater
concem given that deep-water seagrass meadows are thought to be important
winter habitat, and that the effects of trawling on seagrass meadows, particulariy
those composed of fragile species such as H. spinulosa, are largely unknown
(Preen et al. 1995a).
The relationship of surface time to depth may also influence vulnerability
to shark attack since surface time and the proportion of time spent at the surface
increase with depth, and dugongs are thought to be more vulnerable to attack
from below (Anderson 1984). Tiger shark predation on dugongs has recentIy
been shown to be more of a risk in Shark Bay than was previously thought
(Heithaus, in press, Simpfendorfer et al., in press). However, it is unknown
whether the incidence of shark attacks on dugongs is influenced by water depth,
and tiger sharks in Shark Bay are actually more common in shallow water ( a m )
(Heithaus, pers comm).
4.6.2.2 Aerial surveys
The relationship between water depth and the ratio of surface time to
submerged time is crucial to the development of accurate correction factors used
to account for unobservable submerged animals during aerial suweys of

abundance. It is for this reason that Wiirsig et al (1984) considered it imperative
that a quantitative description of dive behaviour be collected as the basis for any
detailed ecological study or census of marine mammals. Marsh and Sinclair
(1989b) also point out the need for more data on dugong diving and surfacing
under different environmental conditions in order to provide more accurate
population assessments. The correction factor used for avai:ability bias in a July
1989 survey by Marsh et al. (1994) made the untested assumption that the
proportion of dugongs at the surface was constant throughout t!!e survey area
across depths, time, and activities (Preen et al. 1995b). My 1997 data, however,
showed that the proportion of time spent at the surface, s/(ttr+s), increased with
increasing water depth when dugongs were feeding. While this is not a concern
for surveys over shallow water habitats where visibility from the air extends to the
seabed, the relationship between depth and the proportion of time spent at the
surface becomes important as depth increases and visibility from above
decreases. Aerial surveys need only be corrected for availability bias when
animals are observed in areas where water depth exceeds the limit of visibility.
The survey correction factor must then be adjusted for the proportion of time
spent at the surface in those areas where depths increase beyond this limit, The
depth to which dugongs are visible from above will depend on the clarity of the
water in the survey area (Marsh and Sinclair 198913) and will need to be
determined on a survey-to-survey basis.
Correction factors developed for shallow-water areas risk over-estimating
the number of animals in deep-water habitats because the proportion of the dive

cycle spent at the surface increases with depth. While a winter survey found that
dugong density was highest in relatively deep water, the proportion of animals
using these deeper water areas as compared to shallower areas was unknown
since survey correction factors were not adjusted for depth (Marsh et al. 1994).
Since only foraging dives were affected by depth, correction factors must
be calibrated for depth only when counting foraging dugongs, but not when
counting travelling or resting dugongs. Since Marsh and Sinclair (1989a) found
that observers could not reliably classify dugong behaviour during an aerial
survey, information regarding the percentage of a dugong's day spent on various
behavioural activities is a necessary component, in addition to water depth, for
refining aerial survey correction factors. This alternative method of categorizing
behaviour may work better than assigning behaviours to dugongs as they are
observed from the airplane.
It has been suggested that the various foraging modes used by dugongs
require different amounts of energy. Since surface time may be influenced by
effort, as well as by submerged time and depth, it may also be necessary to
determine how often dugongs use each foraging mode, and to what degree this
is affected by season, or even depth. Such information will serve to further refine
aerial survey correction factors that are already corrected for the effects of
activity type and depth of availability.

4.6.3 Implications of Possible Seasonal Effects
Dive data are considered useful tools for studying changes in foraging and
environmental conditions experienced by marine mammals (Boveng et al. 1996).
Variations in forage density andlor distribution, in particular, whether natural or
caused by human exploitation of marine resources, are known to affect diving
performance (Monaghan 1996, Culik et al. 2000). This makes it possible to
indirectly monitor changes in foraging and environmental conditions by looking
for periodic changes in dive pattems. The differences observed between the two
data sets in my study suggest that dugong dive pattems may change in response
to seasonal variations in foraging andlor environmental conditions. This supports
previous speculation (see Anderson 1986) that there may be seasonal stresses
that increase the foraging effort and therefore the vulnerability of dugongs in
Shark Bay, although further examination of seasonal changes in dive pattems is
necessary to provide conclusive evidence of whether this is actually the case.
Dugongs are recognised as reliable indicators of seagrass distribution
(Preen et al. 1995a). Their foraging dive pattems may be able to act as indicators
of seasonal seagrass abundance andlor quality as well. If this is true, these
findings have important management implications for both the dugongs and the
seagrasses of Shark Bay. A study dedicated to the examination of how dugong
foraging behaviour changes in relation to major changes in foraging and
environmental conditions, and also of which aspects of foraging behaviour are
most sensitive to such changes, is warranted. In addition, dive models could be
developed to investigate the options available to diving animals under different

conditions and these predictions tested in the field (Boyd 1997). Such information
could aid in the interpretation of periodic changes in diving patterns. The
allocation of time within foraging dives may serve as an indicator of the state of
seagrass resources wrthin Shark Bay. If so, the cost to dugongs, in terms of time
andlor physical effort spent foraging, of changes in the state of seagrass
resources could be identified and quantified.
In order to understand the significance of variation in foraging patterns
between either individuals or time periods, Boyd et al. (1994) considered it
essential to obtain accurate information about food availability, to measure the
energy expenditure associated with each type of foraging behaviour, and to
relate, within individuals, differences in foraging behaviour to fitness. Empirical
data about seagrass availability by year or season in Shark Bay is limited, and
even less is known about invertebrate populations. A detailed time budget is
necessary to quanttfy the effects of food availability an foraging behaviour. A
timeenergy budget, that would examine how dugongs spend their time and
energy by collecting be havioural data concurrently with measurements of energy
expenditure, would be the natural extension of an initial time budget.
4.6.3.1 Seasonal effects on aerial surveys
Seasonal influences on foraging patterns could impact the calibration of
aerial surveys, making it necessary to use season-specific correction factors.
White the proportion of surface time increased with depth in the 1997 sampling
period, it was unaffected by depth in the 1987-89 period, perhaps because the

benefit of maintaining an optimum body temperature in the cooler winter water
was more important than maximizing the proportion of foraging time. If this was
indeed the case, then aerial surveys undertaken during the winter may need to
employ correction factors that take the effect of thermal stresses on dugong dive
patterns, rather than depth. into account. This could also mean that the winter
survey of dugongs in Shark Bay undertaken in July 1989 (Marsh et al. 1994) did
not produce an over-estimate, as suggested, since depth may not have affected
dugong availability.
4.6.4 Implications of Direct Observations for TDR Studies
While dive data from free-diving marine mammals can be collected either
through direct observation or by the attachment of TDRs, data collected by direct
observation can also be used to contribute to successful TDR studies. Time-
depth recorders are useful for studying long-term diving patterns, but are limited
by the difficufty and expense of tagging more than a few individuals. Since it is
the individual animal that acts as the sampling unit, data from a few tagged
individuals may not provide an adequate sample size to make inferences about a
population. Direct observations can provide the necessary data on variability
between individuais that is needed to determine the minimum number of tagged
animals required for future TDR studies in order to be able to detect differences
or changes between years, sites, or seasons (Boveng et al. 1996). Because of
the usefulness of direct observation as a method for studying diving behaviour, !
suggest that it be included in future evaluations of techniques used to study

sirenians and their habitats, such as the one produced by the Sirenian Research
Workshop in 1994 (Marsh and Lefebvre 1994).
4.6.5 Conclusions regarding management implications
Clearty, dive data must be reported in such a way as to provide as much
behavioural, environmental, and circumstantial context to the information as
possible. Dive data that indicate behavioural activity (particularly foraging activity)
and depth can have management implications that they would not have
otherwise. Further information on the daily dive budget would also be useful in
this area.
Depth is a crucial variable in the determination of diving patterns and should
always be included in reports of foraging dive behaviour. Deep-water habitats
have a higher cost, in terns of reduction in the proportion of foraging time and
increase in surface time, than do shallow-water habitats, making dugongs more
vulnerable when foraging in these areas.
Allocation of time within the foraging dive cycle provides insight into the costs
and benefits of deep-water habitats, which could reflect in the overall distribution
of dugongs in marginal areas. Optimat dive models are a useful method of
examining the trade-offs between these costs and benefits. This would be
enhanced by more information on the distribution of seagrasses within these
habitats during the various seasons.
SUMMARY
1. Dive cycle duration was affected by dugong activtty. Resting dives were
longer than travelling dives. Foraging dives were longer than resting or
travelling dives at depths greater than three metres and were comparable in
duration to resting and travelling dives at depths less than three metres.
2. Foraging dives were affected by water depth, while resting and travelling
dives were not. Each stage of the foraging dive cycle increased with
increasing depth, while the proportion of time spent foraging and the dive-
pause ratio decreased with increasing depth.
3. Dugongs may have maximized foraging eficiency in terms of energy gain,
although information on the rate of gain at given depths would be necessary
to make a more definitive determination.
4. Proportionately more of the dive cycle was spent at the surface in 1997 as
depth increased. This has implications for aeriai surveys since it affects the
proportion of dugongs visible from the air, especially in areas of deeper water
where turbidity limits the depth to which dugongs can be seen within the
water column from above.
5. Most of the foraging dive trends were qualitatively similar to predictions from
optimal dive models (Houston and Carbone 1992, Carbone and Houston

1996), although the surface time and dive-pause ratio trends were more like
predictions from a dive model developed by Walton et al. (1998). Diving
behaviour in 1997 was better predicted by the models than was diving
behaviour in 1987-89.
6. The similanty of certain dugong diving patterns (surface time and DPR) to
those of diving birds may be related to the use of the lungs as the primary
oxygen storage site. These unusual patterns indicate that dugongs have a
shallow optimal dive depth (-2.3 m) and a short optimal surface time (-1 secj,
both of which may be missed by the use of TDRs to collect dive data.
There appears to be a threshold depth between approximately 2.3 to 3
metres, above which surface time (-2.3rn), dive cycle duration (-3m), and the
number of breaths (-2.3m) are unaffected by depth (or activity type, in the
case of dive cycle duration), and below which the "typicaln dive patterns, as
predicted by the dive models, occur. This threshold depth may be the optimal
depth at which to forage. There also appears to be an optimal submerged
time (as defined in Walton et al. 1998) of 90.5 seconds which occurs at the
optimal, or threshold, depth of approximately 2.3 metres. It is this increase in
submerged time to >90.5 seconds that likely causes an increase in surface
time and the number of breaths at depths beyond 2.3 metres. Foraging
dugongs appear to be able to replenish their oxygen supplies with only one
breath following submerged times of less than about 90.5 seconds, but need

more than one breath (and therefore more surface time) following submerged
times of more than 90.5 seconds.
8. Dugong dive behaviour is qualitatively comparable to that of many other
marine mammals, diving birds, and other aquatic divers in the effects of both
activity type and depth on dive patterns, suggesting they exploit the aquatic
environment in a similar manner.
9. No behavioural evidence of anaerobic respiration was found, either in terms
of dramatically increased surface time with submerged time, of a secondary
increase in foraging time with depth, or of the maximum submerged time
exceeding the cADL.
8. Results differed significantly between the two data sets, both in relationship
trends and degree of effects, indicating that dugong dive patterns are not
fixed. The differences between the data sets may be related to an increase in
foraging effort during particular seasons when dugongs may be more
vulnerable to stress, or to seasonal differences in water temperature,
although neither explanation was conciusive. Lack of response by the various
dive cycle proportions to depth in 1987-89 could indicate that foraging dive
models do not apply to dugongs foraging in cold water.

9. Foraging dives appear to use more energy (oxygen) per second of
submerged time than either travelling or resting dives, as evidenced by the
fact that surface times increased with increasing submerged time only while
foraging (pers. obs.; data af this study). Foraging dives were therefore
energetically more costly than travelling or resting dives, although this would
be offset by their obvious beneffis in terms of energy gain.
1O.The effect of depth on surface time while foraging was an indirect result of the
increase in submerged time with depth. In fact, surface time was more
affected by submerged time than it was by depth. At depths less than 2.3
metres, post-dive surface time only increased beyond the usual one or two
seconds during those dives where the previous submerged time was longer
than usual. In other words, although there was a relationship between surface
time and depth, it was not a causative one. Rather, depth caused travel time
to increase, causing foraging time to increase, both of which then caused
submerged time to increase, resuIting in an increase in surface time. Also, as
surface time was only affected by submerged time or depth while foraging but
not while resting or travelling (pers. obs.; data of this study), there must be an
additional energetic (i-e. oxygen consumption) component to the
determination of surface time. However, since depth can be measured from a
map, whereas oxygen consumption while underwater and submerged time
cannot, the effect of depth on surface time remains a useful tool for
management purposes.

LITERATURE CITED
Anderson, P.K. 1979. Dugong behavior: on being a marine mammalian grazer. Biologist 61 (4): 1 13-144.
Anderson, P.K. 1982a. Studies of dugongs at Shark Bay, Western Australia. I. analysis of population size, composition, dispersion and habitat use on the basis of aerial survey. Aust. Wildl. Res. 9: 69-84.
Anderson, P.K. 1982b. Studies of dugongs at Shark Bay, Western Australia. 11. surface and subsurface observations. Aust. Wildl. Res. 9: 85-99.
Anderson, P.K. 1984. Submerged times of dugongs. Proceedings: Reunion lnternacional Para el Estudio de Los Mamiferos Marinos 29.
Anderson, P.K. 1986. Ougongs of Shark Bay, Australia - seasonal migration, water temperature, and forage. Natl. Geogr. Res. 2(4): 473-490.
Anderson, P.K. 1994. Dugong distribution, the seagrass Halophila spinulosa, and the thermal environment in winter in deeper waters of eastern Shark Bay, Western Australia. Wildl. Res. 21: 381-388.
Anderson, P.K. 1997. Shark Bay dugongs in summer. I: lek mating. Behaviour 134: 433462.
Anderson, P.K. 1998. Shark Bay dugongs (Dugong dugon) in summer. II. foragers in a Halodule-dominated community. Mammalia 62(3): 409-425.
Anderson, P.K., and A. Birtles. 1978. Behaviour and ecology of the dugong, Dugong dugon (Sirenia): observations in Shoalwater and Cleveland Bays, Queensland. Aust. Wildl. Res. 5: 1-23.
Anderson, P.K., and G.E. Heinsohn. 1978. The status of the dugong and dugong hunting in Australian waters: a survey of local perceptions. Biol. Conserv. 13: 1 3-26.
Andrews, R.D., Jones, D.R., Williams, J.D., Thorson, P.H., Oliver, G.W., Costa, D.P. and B.J. Le Boeuf. 1997. Heart rates of northern elephant seals diving at sea and resting on the beach. J. Exp. Biol. 200: 2083-2095.
Aragones, L., and H. Marsh. 2000. Impact of dugong grazing and turtle cropping on tropical seagrass communities. Pac. Conserv. Biol. 5: 277-288.

Armstrong, H.M., and A. Robertson. 2000. Energetics of free-ranging large herbivores: when should costs affect foraging behaviour? Can. J. Zool. 78: 1604-1615.
Baird, R.W., Ligon, A.D. and S.K. Hooker. 2000. Sub-surface and night-time behavior of humpback whales off Maui, Hawaii: a preliminary report. Hawaii Wildlife Fund Report, Paia, Hawaii. 19pp.
Beck. C.A., Bowen, W.D. and S.J. Iverson. 2000. Seasonal changes in buoyancy and diving behaviour of adult grey seals. J. Exptl. Biol. 203: 2323-2330.
Bergey, M., and H. Baier. 1987. Lung mechanical properties in the West Indian Manatee (Trichechus manatus). Respir. Physiol. 68: 63-75.
Berta, A., and J.L. Sumich. 1999. Marine Mammals: Evolutionary Biology. Academic Press, San Diego. 494 pp.
Birch, W.R, 1975. Some chemical and calorific properties of tropical marine angiosperms compared with those of other plants. J. Appl. Ecol. 12: 2201- 2212.
Blessing, M.H. 1972. Studies on the concentration of myoglobin in the sea-cow and porpoise. Comp. Biochem. Physiol. 41A: 475-480.
Boveng, P.L., Walker, B.G. and J.L. Bengtson. 1996. Variability in Antarctic fur seal dive data: implications for TDR studies. Mar. Mamm. Sci. 12(4): 543- 554.
Boyd, I .L. 1993. Selecting sampling frequency for measuring diving behavior. Mar. Mam. Sci. 9(4):424-430.
Boyd, I.L. 1997. The behavioural and physiological ecology of diving. Trends E d . Evo~. 12(6): 213-217.
Boyd, I,L., and T. Ambom. 1991. Diving behaviour in relation to water temperature in the southern elephant seal: foraging implications. Polar Biol. 11 : 259-266.
Boyd, I.L., and J.P. Croxall. 1992. Diving behaviour of lactating Antarctic fur seals. Can. J. Zool. 70: 919-928.
Boyd, I.L., and J.P. Croxall. 1996. Dive durations in pinnipeds and seabirds. Can. J. 2001.74: 1696-1705.

Boyd, I.L., Amould, J.P.Y., Barton, T. and J.P. Croxall. 1994. Foraging behaviour of Antarctic fur seals during periods of contrasting prey abundance. J. Anim. Eco~. 63: 703-71 3.
Boyd, I.L., Reid. K. and R.M. Bevon. 1995. Swimming speed and allocation of time during the dive cycle in Antarctic fur seals. Anim. Behav. 50: 769-784.
Boyd, I.L., McCafferty, D.J. and T.R. Walker. 1997. Variation in foraging effort by lactating Antarctic fur seals: response to simulated increased foraging costs. Behav. Ecol. Sociolbiol. 40: 135-144.
Brown, R.E., and J.P. Butler. 2000. The absolute necessity of chest-wall collapse during diving in breath-hold diving mammals. Aquat. Mamm. 26(1): 26-32.
Burggren, W. 1988. Cardiovascular responses to diving and their relation to lung and blood oxygen stores in vertebrates. Can. J. 2001. 66: 20-28.
Burns, J.M., and M.A. Castellini. 1996. Physiological and behavioral determinants of the aerobic dive limit in Weddel seal (Leptonychotes weddellir) pups. J . Cornp. Physiol. 6. 166: 473-483.
Butler, P.J. 1982. Respiratory and cardiovascular control during diving in birds and mammals. J. Exp. Biol. 100: 195-221.
Butler, P.J. 1988. The exercise response and the "classical" diving response during natural submersion in birds and mammals. Can. J. fool. 66: 29-39.
Butler, P.J., and D.R. Jones. 1997. Physiology of diving birds and mammals. Physiol. Rev. 77: 837-899.
Cabanac, A.J. 2000. Blood volume in hooded seals: implications for diving capacity. Can. J. Zool. 78: 1293-1299.
Carbone, C., and A.I. Houston. 1994. Patterns in the diving behaviour of the pochard, Aythya ferina: a test of an optimaliky model. Anim. Behav. 48: 457- 465.
Carbone, C., and A.I. Houston. 1996. The optimal allocation of time over the dive cycle: an approach based on aerobic and anaerobic respiration. Anim. Behav. 51 : 1247-1 255.
Carbone, C., DeLeeuw, J.J. and AI, Houston. 1996. Adjustments in the diving time budgets of tufted duck and pochard: is there evidence for a mix of metabolic pathways? Anim. Behav. 51: 1257-1268.
Charnov, E.L. 1976. Optimal foraging, the marginal value theorem. Theor. Popui. Biol. 9: 126-136.
Cheverton, J., Kacelnik, A. and J.R. Krebs. 1985. Optimal foraging: constraints and currencies. Experimental Behavioral Ecology. 0. Holldobler and M. Lindauer, eds. G. Fischer Verfog, Stuttgart. xiv + 488 pp.
Chu, K.C. 1988. Dive times and ventilation patterns of singing humpback whales (Megaptera novaeangliae). Can. J. Zool. 66: 1322-1 327.
Costa, D.P. 1988. Methods for studying the energetics of freely diving animals. Can. J. Zool. 66: 45-52.
Costa, D.P., Croxall, J.P. and C.D. Duck. 1989. Foraging energetics of Antarctic fur seals in relation to changes in prey availability. Ecology 70(3): 596-606.
Culik, B., Hennicke, J. and T. Martin. 2000. Humboldt penguins outrnanoevring El Nifio. J. Exp. Biol. 203: 231 1-2322.
De longh, H.H., Wenno, B.J. and E. Meelis. 1995. Seagrass distribution and seasonal biomass changes in relation to dugong grazing in the Mofuccas, East Indonesia. Aquat. Bot. 50: 1-19.
Dolphin, W.F. 1987a. Ventilation and dive patterns of humpback whales, Megaptera novaeangliae, on their Alaskan feeding grounds. Can. .I. Zool. 65: 83-90.
Dolphin. W.F. 1987b. Dive behavior and estimated energy expenditure of foraging humpback whales in southeast Alaska. Can. J. 2001. 65: 354-362.
Dolphin, W.F. 1988. Foraging dive patterns of humpback whales, Megaptera novaeangliae, in southeast Alaska: a cost-benefit analysis. Can. J. Zool. 66: 2432-2441.
Domning, D.P., and V. De Buffrenil. 1991. Hydrostasis in the sirenia: qualitative data and functional interpretations. Mar. Mamm. Sci. 7(4): 331-368.
Duarte, C.M. 1991. Seagrass depth limits. Aquat. Bot. 40: 363-377.
Dunstone, N., and R.J. O'Connor. 1979. Optimal foraging in an amphibious mammal. I. the aqualung effect. Anim. Behav. 27: 1182-1 194.
Engel, S. 1962. The air-passages of the dugong lung. Acta Anat. 48: 95-107.
Farmer, M., Weber, R.E., Bonaventura, J., Best, R.C. and D. Domning. 1979. Functional properties of hemoglobin and whole blood in an aquatic mammal, the Amazonian manatee (Tnchechus hunguis). Comp. Biochem. Physiol. 624: 231 -238.
Fedak, M.A., and D. Thompson. 1993. Behavioural and physiological options in diving seals. Symp. Zool. Soc. Lond. 66: 333-348.
Feldkamp, S.D., DeLong, R.L. and G.A. Antonelis. 1989. Diving patterns of California sea lions, Zalophus califomianus. Can. J . Zool. 67: 872-883.
Gallivan, G.J. 1980. Hypoxia and hypercapnia in the respiratory control of the Amazonian manatee (Tnchechus inunguis). Physiol. Zool. 53(3): 254-261.
Gallivan, G.J., and R.C. Best -1980. Metabolism and respiration of the Amazonian manatee (Trichechus inunguis). Physiol. Zool. 53(3): 245-253.
Gallivan, G.J., Kanwisher, J.W. and R.C. Best. 1986. Heart rates and gas exchange in the Amazonian manatee (Trichechus inunguis) in relation to diving. J. Comp. Physiol. 0. 156: 415423.
Gentry, R.L., Kooyman, G.L. and M.E. Goebel. 1986. Feeding and diving behavior of northern fur seals. In: Fur Seals: Maternal Stratgies on Land and at Sea, edited by R.L. Gentry and G.L. Kooyman. Princeton, NJ: Princeton Univ. Press, 1986, pp. 61-77.
Hartman, D.S. 1979. Ecology and Behavior of the Manatee (Trichechus manatus) in Florida. Special Publication No.5. Amer. Soc. Mammalogists. viii + 153 pp.
Heithaus. M.R. in press. The biology of tiger sharks. Gaieocerdo cuvier, in Shark Bay, Western Australia: sex ratio, size distribution, and catch rates. Environ. Biol. Fishes.
Hindell, M.A., Slip. D.J., Bur!on, H.R. and M.M. Bryden. 1992. Physiological implications of continuous, prolonged, and deep dives of the southern elephant seal (Mirounga leonina). Can. J. 2001. 70: 370-379.
Hochachka, P.W. 1997198. Is evolutionary physiology useful to mechanistic physiology? the diving response in pinnipeds as a test case. 2001.-Jena 1 OO(4): 328-335.
Houston, A.I. 2000. Nonmonotonic dive to surface ratios: comments on Walton et al. (1998). Anim. Behav. (Forum) 59: F.13-Fl5.

Houston, A.I., and C. Carbone. 1992. The optimal allocation of time during the dive cycle. Behav. Ecol. 3(3): 255-265.
Houston, A.I., and J.M. McNamara. 1994. A general theory of central place foraging for single-prey loaders. Theor. Popul. Biol. 28: 233-262.
Hull, C.L. 2000. Comparative diving behaviour and segregation of the marine habitat by breeding Royal Penguins, Eudyptes schlegeli, and eastern Rockhopper Penguins, Eudyptes chrysocorne filhoii, at Macquarie Island. Can. J. 2001. 78: 333-345.
Irvine, A.B. 1983. Manatee metabolism and its influence on distribution in Florida. Biol. Conserv. 25: 31 5-334.
Irving, L. 1939. Respiration in diving mammals. Physiol. Rev. 19: 112-1 34.
[IUCN] International Union for Conservation of Nature and Natural Resources. 2000. The 2000 IUCN Red List of Threatened Species home page. <http:/W.redlist.org>. Accessed Jan. 26.
Jaquet, N., Dawson, S. and E. Slooten. 2000. Seasonal distribution and diving behaviour of ma!e sperm whales of Kaikoun: foraging implications. Can. J. Zool. 78(3): 407419.
Johnstone, I.M., and B.E.T. Hudson. 1981. The dugong diet: mouth sample analysis. Bull. Mar. Sci. 31: 681-690.
Kelly, B.P., and D. Wartzok. 1996. Ringed seal diving behavior in the breeding season. Can. J. 2001.74: 1547-1 555.
Kenny, R. 1967. The breathing pattern of the dugong. Aust. 3. Sci. 29(10): 372- 373.
Kooyman. G.L. 1965. Techniques used in measuring diving capacities of Weddell seals. Polar Rec. 12(79): 391-394.
Kooyman, G.L. 1973. Respiratory adaptations in marine mammals. Am. Zool. 13: 457-468.
Kooyman, G.L. 1985. Physiology without restraint in diving mammals. Mar. Mam. Sci. l(12): 166-1 78.
Kooyman, G.L. 1989. Diverse Divers: Physiology and Behavior. Springer-Verlag, Berlin Heidelberg New York London Paris Tokyo, 200pp.

Kooyman, G.L., and P.J. Ponganis. 1998. The physiological basis of diving to depth: birds and mammals. Annu, Rev. Physiol. 60: 19-32.
Kooyman, G.L., Kerem, D.H., Campbell, W.H. and J.J. Wright. 1971. Pulmonary function in freely diving Weddell seals, Leptonychotes weddelli. Respir. Physiol. 12(3): 271-282.
Kooyman, G.L., Wahrenbrock. E.A., Castellini, M.A., Davis, R.W. and E.E. Sinnett. 1980. Aerobic and anaerobic metabolism during voluntary diving in Weddell seals: evidence of preferred pathways from blood chemistry and behavior. J. Comp. Physiol. 138: 335-346.
Kooyman, G.L., Castellini, M.A., Davis, R.W. and R.A. Maue. 1983. Aerobic diving limit of immature Weddell seals. J. Comp. Physiol. 151: 171-174.
Kooyman, G.L., Cherel, Y., Le Maho, Y., Croxall, J.P., Thorson, P.H., Ridoux, V. and C.A. Kooyman. 1992. Diving behavior and energetics during foraging cycles in king penguins. Ecol. Monogr. 62(1): 143-163.
Kramer, D.L. 1988. The behavioral ecology of air breathing by aquatic animals. Can. J. Zool. 66: 89-94.
Krebs. J.R., Ryan, J.C. and E.L. Charnov. 1974. Hunting by expectation or optimal foraging? a study of patch use by chickadees. Anim. Behav. 22: 953- 964.
Krutikowsky, G.K., B.R. and Mate. 2000. Diving and surfacing characteristics of bowhead whales (Balaena mysticetus) in the Beaufort and Chukchi Seas. Can. J. Zool. 78: 1182-1 198.
Lanyon, J.M. 1991. The nutritional ecology of the dugong (Dugong dugon) in tropical North Queensland. PhD Thesis, Monash University. 326 pp.
Le Boeuf, B.J. Costa, D.P.. Davis, R.W., Huntley, A.C. and G.L. Kooyman. 1986. Pattern and depth of dives in northern elephant seals. J. fool. 208: 1-7.
Le Boeuf, B.J., Costa, D.P., Huntley, A.C. and S.D. Feldkamp. 1988. Continuous, deep diving in female northern elephant seals, Mirounga angusfirostris. Can. J. ZOO^. 66: 446-458.
Lee Long, W.J., Coles, R.G., Helmke, SA. and R.E. Bennett. 1989. Seagrass habitats in coastal, mid shelf and reef waters from Lookout Point to Barrow Point in North-Eastern Queensland. Dept. Primary Industries, Queensland Govt.

Leeuw, J.J. de. 1996. Diving costs as a component of daily energy budgets of aquatic birds and mammals: generalizing the inclusion of dive-recovery costs demonstrated in tufted ducks. Can. J. Zool. 74: 2131-2142.
Leith, D.E. 1976. Comparative mammalian respiratory mechanics. Physiologist 19: 485-510.
Lydersen, C., Ryg, M.S., Hammill, M.O. and P.J. O'Brien. 1992. Oxygen stores and aerobic dive limit of ringed seals (P hoca hispida). Can. J. Zool.
Mangum, C.P., and P.W. Hochachka. 1998. New directions in comparative physiology and biochemistry mechanisms, adaptations, and evolution. Physiol. Zool. 71(5): 471484.
Marsh, H. 1991. Our tropical siren. Aust Geagr. 21 : 43-57.
Marsh, H., and L.W. Lefebvre. 1994. Sirenian status and conservation efforts. Aquat. Mamm. 20(3): 155-1 70.
Marsh, H., and G.B. Rathbun. 1990. Development and application of conventional and satelrite radio tracking techniques for studying dugong movements and habitat use. Aust. Nldl. Res. 17: 83-1 00.
Marsh, H., and D.F. Sinclair. 1989a. An experimental evaluation of dugong and sea turtle aerial survey techniques. Aust. Wildl. Res. 16: 639-650.
Marsh, H., and D.F. Sinclair. 1989b. Correcting for visibilty bias in strip transect aerial surveys of aquatic fauna. J. Wildl. Manag. 53(4): 101 7-1 024.
Marsh, H., Spain, A.V. and G.E. Heinsohn. 1978. Physiology of the dugong. Comp. Biochem. Physiol. 61A(2): 159-168.
Marsh, H., Gardner, B.R. and G.E. Heinsohn. 1981. Present-day hunting and distribution of dugongs in the WeIIesley Islands (Queensland): implications for conservation. Biol. Consew. 19: 255-267.
Marsh, H., Channells, P.W., Heinsohn, G.E. and J. Momssey. 1982. Analysis of stomach contents of dugongs fro Queensland. Aust. Wiidl. Res. 9:55-67.
Marsh, H., Prince, R.I.T., Saalfeld, W.K. and R. Shepherd. 1994. The distribution and abundance of the dugong in Shark Bay, Western Australia. Wildl. Res. 21: 149-161.
Marshall, C.D., Kubilis, P.S., Huth, G.D., Edmonds, V.M., Halin, D.L. and R.L. Reep. 2000. Food-handling ability and feeding-cycle length of manatees feeding on several species of aquatic plants. J. Mammal. 81 (3): 649-658.

McCabe, M., Hamilton, R. and H. Marsh. 1978. Some studies on the oxygen affinity of haemoglobin from the dugong. Comp. Biochem. Physiol. 61A: f 9- 22.
Medway, W., Rathbun, G.B. and D.J. Black. 1981. Hematology of the West Indian manatee (Tn'chechus manatus). Vet. Clin. Pathol. 11 (2): 11-15.
Millard, R.W., Johansen, K. and W.K. Milsom. 1973. Radiotelemetry of cardiovascular responses to exercise and diving in penguins. Comp. Biochem. Physiol. 46A: 227-240.
Monaghan, P. 1996. Relevance of the behaviour of seabirds to the conservation of marine environments. Oikos 77: 227-237.
Monaghan, P., Walton, P., Wanless, S., Uttley, J.D. and M.D. Burns. 1994. Effects of prey abundance on the foraging behaviour, diving efficiency and time allocation of breeding Guillernots Uria aaige. Ibis 136(2): 214-222.
Mori, Y. 1998a. Optimal choice of foraging depth in divers. J. Zool. (Lond). 245: 279-283.
Mori, Y. 1998b. The optimal patch use in divers: optimal time budget and the number of dive cycles during a bout. J. Theor. Biol. 190: 187-1 99.
Mori, Y. 1999. The optimal allocation of time and respiratory metabolism over the dive cycle. Behav. Ecol. 10(2): 155-160.
Mottishaw, P.D., Thornton, S.J. and P.W. Hochachka. 1999. The diving response mechanism and its surprising evolutionary path in seals and sea lions. Am. ZOO^. 39: 434-450.
Nolet, B.A., Wansink, DEH. and H. Kruuk. 1993. Diving of otters (Lutra lutra) in a marine habitat: use of depths by a single-prey loader. J. Anim. Ecol. 62: 22-32.
Nowicki, S.N., Stirling, I. and B. Sjare. 1997. Duration of stereotyped underwater vocal displays by male Atlantic walruses in relation to aerobic dive limit. Mar. Mam. Sci. 13(4): 566-575.
Otani, S., Naito, Y., Kato, A. and A. Kawamura. 2000. Diving behavior and swimming speed of a free-ranging harbor porpoise, Phocoena phocoena. Mar. Mamm. Sci. 16(4): 81 1-814.
Peterman, R.M. 1990. Statistical power analysis can improve fisheries research and management. Can. J. Fish. Aquat. Sci. 47: 2-15.
Ponganis, P.J., Kooyrnan, G.L., Baranov. EA.. Thorson. P.H. and B.S. Stewart. 1997a. The aerobic submersion limit of Baikal seals, Phoca sibirica. Can. J. ZOO^. 75: 1325-1 327.
Ponganis, P.J., Kooyman, G-L, Winter, L.M. and L.N. Starke. 1997b. Heart rate and plasma lactate responses during submerged swimming and trained diving in California sea lions, Zalophus califomianus. J. Comp. Physiol. 8. 167: 9-16.
Ponganis, P.J., G.L., Kooyman, G.L., Starke, L.N., Kooyman, C.A. and T.G. Kooyrnan. 1997c. Postdive blood lactate concentrations in emperor penguins. Aptenodytes forsten J. Exp. Biol. 200: 1623-1 626.
Preen, A. 1993. Interactions between dugongs and seagrasses in a subtropical environment. PhD Thesis, James Cook University. 265 pp.
Preen, A. 1995. Impacts of dugong foraging on seagrass habitats: observational and experimental evidence for cultivation grazing. Mar. Ecol. Prog. Ser. 124: 201-213.
Preen, A. R. 1998. Marine protected area and dugong conservation along Australia's Indian Ocean coast. Environ. Manag. 22(2):
Preen, A*, Lee Long, W.J. and R.G. Cotes. 1995a. Flood and cyclone related loss. and partial recovery. of more than 1000 km2 of seagrass in Hervey Bay. Queensland, Australia. Aquat. Bot. 52: 3-17.
Preen, A., Marsh, H., Lawler, I.R., Prince, R.I.T. and R. Sheperd. 1995b. Winter distribution and abundance of dugongs, turtles, dolphins and other large fauna of Shark Bay, Ningaloo Reef and Exmouth Gulf, Western Australia. Report to Dept. of Conservation and Land Management (CALM), W. Aust. 29 PP-
Pyke, G.H., Pulliam, H.R. and E.L. Charnov. 1977. Optimal foraging: a selective review of theory and tests. Q. Rev. Biol. 52(2): 137-1 54.
Qvist, J., Hill, R.D., Schneider, R.C., Falke, K.J., Liggins, G.C., Guppy, M., Elliot. R.L., Hochachka, P.W. and W.M. Zapol. 1986. Hemoglobin concentrations and blood gas tensions of free-diving Weddell seals. J. Appl. Physiol. 61(4): 4 560-1 569.
Reed, J.Z., Chambers, C., Fedak, M.A and P.J. Butler. 1994. Gas exchange of captive freely diving grey seals (Halichoerus grypus). J. Exp. Biol. 191 : 1-1 8.
Reynolds, J.E.,III. 1981. Behavior patterns in the West Indian manatee, with emphasis on feeding and diving. Fla. Sci. 44(4): 232-242.

Reynolds, J.E.,III, and D.K. Odell. 1991. Manatees and Dugongs. Facts on file, New York.
Ridgeway, S.H., Scronce, B.L. and J. Kanwisher. 1969. Respiration and deep diving in the bottlenose porpoise. Science 166: 1651-1654.
Ronald, K., Gelley, L.J. and E.C. Amoroso. 1978. Biological synopsis of the manatee. Ottawa, International Development Research Centre, 1-1 12.
Ropert-Coudert, Y., Bost, C.-A., Handrich, Y., Bevan, R.M., Butler, P.J., Woakes, A.J. and Y. Le Maho. 2000. Impact of externally attached loggers on the diving behaviour of the king penguin. Physio. Bio. Zool. 73(4): 438-445.
Ruxton, G.D., Walton, P. and P. Monaghan. 2000. The shape of oxygen recovery curves: reply to Houston (2000). Anim. Behav. (Forum) 59: F16.
Scholander, P.F., and L. Irving. 1941. Experimental investigations on the respiration and diving of the Florida manatee. J. Cell. Comp. Physiol. 17: 169-191.
Scholander. P.F.. Irving, F. and S,W. Grinnell. 1942. Aerobic and anaerobic changes in seal muscles during diving. J. Biol. Chem. 142: 432-440.
Schreer, J.F., Kovacs, K.M. and R.J. O'Hara Hines. 2001. Comparative diving patterns of pinnipeds and seabirds. Ecol. Monogr. 71 (1): 137-162.
Shaffer, S.A., Costa, D.P., Williams, T.M. and S.H. Ridgway. 1997. Diving swimming performance of white whales, Delphinapterus leucas: an assessment of plasma lactate and blood gas levels and respiratory rates. J. Exptl. Biol. 200: 3091-3099.
Simpfendorfer, C., McAuley, R.A. and Godfried. in press. Size, sex, and geographic variation in the diet of tiger sharks in West Australian waters. Environ. Biol. Fishes.
Snyder, G.K. 1983. Respiratory adaptations in diving mammals. Respir. Physiol. 54: 269-294.
Stahl, W.R. 1967. Scaling of respiratory variables in mammals. 5. Appl. Physiol. 22(3): 453-460.
Stephenson, R.. and D.R. Jones. 1992. Metabolic res onses to forced dives in PI Pekin duck measured by indirect calorimetry and P-MRS. Am. J. Physiol.
263: (Regulatory Integrative Comp. Physiol. 32): R1309-R1317.

Surnich, J-L, 1983. Swimming vetocities, breathing patterns, and estimated costs of locomotion in migrating gray whales, Eschrichtius robustus. Can. J. Zool. 61 : 647-652.
Taylor, M.A. 2000. Functional significance of bone ballast in the evolution of buoyancy control strategies by aquatic tetrapods. Hist. BioL 14(1-2): 15-31.
Thompson, D., and M.A. Fedak. 1993. Cardiac responses of grey seals during diving at sea. 3. Exp. Biol. 174: 139-164.
Thompson, D., Harnmond, P.S., Nicholas, K.S. and MA. Fedak. 1991. Movements, diving and foraging behaviour of grey seals (Halichoems grypus). J. 2001. (Lond). 224: 223-232.
Thompson, D., Hiby, A.R. and M.A. Fedak. 1993. How fast should I swim? Behavioural implications of diving physiology. Symp. Zool. Sac. Lond. 66: 349-368.
Thornton, S.J.. Pelc. N.J., Spielman, D.M., Liao, J.R., Costa, D.P., Crocker, D.E., Houser. D., Kohin, S., Le Boeuf, B.J., Pek, L.R. and P.W. Hochachka. 1997b. Vascular flow dynamics in a diving elephant seal (Mirounga angustirostris). Proc. Intl. Soc. Magn. Res. Med. 2: 823.
Thornton, S.J., Spielman, D.M., Block, W.F., Hochachka, P.W., Crocker, D.E. Le Boeuf, B.J., Costa., D.P., Houser, D., Kohin, S., Pelc, L.R. and N.J. Pelc. 7997a. MR imaging in a diving seal. Proc. Intl. Soc. Magn. Res. Med. 2: 822.
Tome, M.W. 1988. Optimal foraging: food patch depletion by ruddy ducks. Oecologia 76: 27-36.
Turek, Z., Kreuzer, F. and L. J.C. Hoofd. 1973. Advantage or disadvantage of a decrease of blood oxygen affinity for tissue oxygen supply at hypoxia: a theoretical study comparing man and rat. Pfliigers Arch. Eur. J. Physiol. 342: 185-1 97.
Walker, D.I. 1989. Regional studies - Seagrass in Shark Bay, the foundation of an ecosystem. In: Biology of Seagrasses. A Treatise on the Biology of Seagrasses with Special Reference to the Australian Region, Edited by Larkum, A.W.D., McComb, A.J. and Shepherd, SA., pp. 182-210.
Walker, 0.1. 1991192. Grasses of the sea. Landscape 7(2): 42-46.
Walker, D.I., and A.J. McComb. 1988. Seasonal variation in the production, biomass and nutrient status of Amphibolis antarcfica (Labill.) Sonder Ex Aschers. and Posidonia australis Hook F. in Shark Bay, Western Australia. Aquat Bot. 31: 259-275.

Walker, D.I., and R.I.T. Prince. 1987. Distribution and biogeography of seagrass species on the northwest coast of Australia. Aquat. Bot. 29: 19-32.
Walker, D.I., Kendrick, G.A. and AJ. McComb. 1988. The distribution of seagrass species in Shark Bay, Western Australia, with notes on their ecology. Aquat. Bot. 30: 305-317.
Walton, P., Ruxton, G.D. and P. Monaghan. 1998. Avain diving, respiratory physiology and the marginal value theorem. Anim. Behav. 56: 165-1 74.
Wanless, S., Morris, J.A. and M.P. Harris. 1988. Diving behaviour of guillemot Uria aalge, puffin Fratercula arctica and razorbill Alca toda as shown by radio-telemetry. J. Zool. (Lond). 216: 73-81 .
Watanuki, Y., Kato, A., Mori, Y. and Y. Naito. 1993. Diving performance of adelie penguins in relation to food availability in fast sea-ice areas: comparison between years. J. Anim. EcoI. 62: 634-646.
Watanuki, Y., Kato, A. and Y. Naito. 1996. Diving performance of male and female Japanese cormorants. Can. J. Zoo[. 74: 1098-1 109.
Welham, C.V.J., and R.C. Ydenberg. 1988. Net energy versus efficiency maximizing by foraging ring-billed gutls. Behav. Ecol. Sociobiol. 23(2): 75-82.
White. J.R., Harkness, D.R., Isaacks, R.E. and D.A. Duffield. 1976. Some studies on blood of the Florida manatee, Trichechus manatus latirostris. Comp. Biochem. Physiol. 55A: 413417.
Wiig, O., Gjertz, I. Griffiths, 0. and C. Lyderson. 1993. Diving patterns of an Atlantic walrus Odobenus rosmarus msmam near Svalbard. Polar Biol. 13~71-72.
Wilson, R.P.. and M-P.T. Wilson. 1988. Foraging behaviour in four sympatric cormorants. J. Anim. Ecol. 57: 943-955.
Woakes, A.J. 1988. Metabolism in diving birds: studies in the laboratory and the field. Can. J. Zool. 66: 138-141.
Woakes, A.J., and P.J. Butler. 1983. Swimming and diving in tufted ducks, Aytha fuligula, with particular reference to heart rate and gas exchange. J. Exp. Biol. 107: 31 1-329.

Wiirsig, B., Dorsey, E.M, Fraker, M.A., Payne, R.S., Richardson, W.J. and R.S. Wells. 1984. Behavior of bowhead whales, Balaena mysticetus, summering in the Beaufort Sea: surfacing, respiration, and dive characteristics. Can. J. Z00l.62: 191 0-1 921.
Ydenberg, R.C., and C.W. Clark. 1989. Aerobiosis and anaerobiosis during diving by western grebes: an optimal foraging approach. J. Theor. Biol. 139: 437-449.
APPENDIX 1
Calculated Aerobic Dive Limit (cADL) for the Dugong
It is possible to determine a rough cAOL for dugongs by using published
measurements of oxygen stores and metabolic rate from the manatee literature
and general respiratory values. Only the value for the oxygen binding capacity
applies directly to dugongs.
Oxygen is stored in the lungs, blood, and muscle tissue. Assuming that
dugong total lung capacity (TLC) can be determined by using the allometric
scaling constant of 53.5 m k g body weight (Stahl 1967, Leith 1976), the TLC for
an average-sized adult dugong weighing 300 kg would be 16.1 litres. This value
may be conservative since no marine mammal data were used to determine
Stahl's constant and marine mammal lungs tend to be slightly larger than those
of terrestrial mammals (Kooyman 1973). In addition, Stahl admits that
physiological specialization or other factors can cause deviations of 50% or more
for individual species. The lung volume of Wo Florida manatees after an average
inspiration was determined to be about 5.2% of body weight (Scholander and
Irving 1941). Applied to the dugong, this would give an inspiratory lung volume of
15.6 litres, or up to 97% of the estimated TLC. If 15% of inspired air is utilizable
oxygen (Kooyrnan 1973), then the dugong would have about 2340 ml of oxygen
available in its lungs. The blood volume of the dugong, if assumed to be
comparable to that of the manatee, is about 8% of its weight, or 24 litres for a
300 kg animal (Scholander and Irving t 941). Wm a relatively low oxygen binding
capacity of 16 ml 02/100 ml blood (EIsner 1968), about 3840 ml oxygen could be

stored in the blood. Using an estimate from a 350 kg manatee of 700 rnl oxygen
stored in the muscle (Scholander and lnring 1941), an average-sized dugong
would store 636.4 ml oxygen in its muscles. Combining the oxygen stores from
the lungs, blood, and muscles, the total oxygen stores of a 300 kg dugong would
be 6780 ml or 22.6 mlkg (Table Al).
The resting metabolic rate (RMR) of the Florida manatee has been
estimated to be in the range of 27.94 mlOz/kg/hr (lwine 1983) to 32.75 mlOz/kg1hr
(Scholander and Irving 1941), for an average RMR of 30.35 ml02lkglhr (or 0.51
m102/kg/min). The MR of the dugong, while probably still very low compared to
other mammals, is thought to be somewhat higher than that of the manatee due
to the dugong's smaller, more stream-lined shape and the higher activity level
necessitated by its exclusively marine habitat (Anderson, P.K., pers. comrn.). A
more accurate estimate of ADL would atso use diving metabolic rate (DMR),
which varies with dive type and duration, rather than RMR. DMRs of twice the
basal metabolic rate (BMR) or RMR are frequentfy used (Boyd and Croxali
1996). Scholander and Irving (1941) noted that their captive manatees had a
higher breathing frequency when restrained than while swimming freely. The MR
measured from these restrained animals was 1.64 mlodkglmin, or about three
times faster than the estimated RMR. Using this higher estimate of MR, which
may better represent the DMR of the dugong, a 300 kg dugong would use
oxygen at a rate of 492 m102/min, for a cADL of 13.78 minutes.
While the accuracy of this cADL is questionable, the exercise itself is
valuable in that it highlights the lack of basic respiratory data for the dugong.

Table A1 .l. Estimated oxygen storage capacity of a dugong based on a body mass of 300 kg. (modified from Shaffer et al. 1997)
Lungs I
i Total lung capacity (TLC):53.5 ml kg*' Stahl (1967), Leith (1976) I I
( lnspiratory lung volume (97% of TLC): Scholander and Irving (1941) ( t 51.9 ml kg" I I
Alveolar [Oz]: 15% Kooyman (1 973) Total lung 02available: 7.8 ml kg" Blood
Volume (8Oh body weight): 80 ml kg-' Scholander and lwing (1941) 1 0 2 binding capacity: 16 ml O2 100 mf1 Elsner 1968 I
I blood I
Total blood 0 2 capacity: 12.8 ml kg*' I 4
Muscle Myoglobin mb]: 15 g Mb kg-' tissue Blessing (1 9721, Snyder (1 983)
Total muscle Oz available: 2.0 ml kg" Scholander and Irving 1941 Combined Oz stores available: 22.6 ml kg*'

APPENDIX 2
Encounter Site Sheet
-- - - - - - - -
Sept @ Od Lat L-
Day p Long. 1- - .
start- ( ~ n d ~ i i i Name: Stepp~ng Stones, Which Bank.
Water Temp. IC) 7 Sea Condition C W Cover (X [r I wid speed (kph) wim Direction 7 I
Mud Sand @ Silt Rocky Shell Coral Unknown
@& Halodule Amph~bolls g Haloph~la Posldonla No Veg. Unknown
- - - -
Inverts: Sea Pens Anemones Sea Cucumbers Urchins No Inverts. Unknown 3
Feeding Resting Basking - Cavorting lnvestigabng
Reelng Travelling g Unknown Direction of Movement 7 Comments No response to boat
- Vocalizations - None 2
Equipment KLV Bluey Handycam Oir. Hyd. Sonobuoy
-.
SCUBA Snorkle Hi8 -
Catamaran: Sail Power 1 Drift - - Anchor Name l ~ o r ~ n k -- - I Dingy: R m n g - Anchored Drifting - Notused 9 I

APPENDIX 3
Dive Data Sheet
Obsewer(s) - - -
- I Record Number 7 I - - - - - - --- . - - - -- - - - -
Focal Anlrnal hrtance fmn Mat D~stmguh~ng Mah. 7 I
Feeding
Flee~ng Travelling ~ - Oiredion of Movement Comments -I Method
KLV Bluey . Handycam Or Hyd. Sonobuoy -
Hi8 A OS SCUBA S n o m = Bmmlan Eye . I o w n Breaths:
up I I Down Breaths:
Down Breaths:
Down 7 Breaths:
D- 1- Breaths:
up 7 L 0- - Bream"

APPENDIX 4
Back-Transformation of Regression Equations through Algebraic Manipulations
Example: Surface Time vs Depth
bo = 50.756 b4 = -0.641 b~ = 4.044 b5 = 1.557 b2 = -26.31 5 y = surface time b3 = -1.577 x = depth
The transformation consisted of subtracting the mean of the depths (6 m) from the depths before doing the regression analysis on the data. The coefficients were multiplied through the x 4 terms to expand the equations before the terms were gathered and the equation was solved using the coefficient values.
y = (bo - 6b1 + 36b3) + ~ ( b l - 12b3) + dl(b2 - 6b4 + 36b5) + b3x2 + dlx(b4- 12b5) + bsdlx2
Therefore, for the 1997 data, substituting 0 for d l yields
surface time = -30.28 + 22.968'depth - 1.577*depth2,
and for the 1987-89 data, substituting 1 for d l yields,
surface time = 3.303 + 3.643'depth - 0.02'depth2.

APPENDIX 5
Statistical Output from Chapter 3: Results
Table 3.4. ANCOVA of the effect of depth on the dive cycle duration of all three activity types (foraging, resting and travelling) for the combined data set. Note significance of interaction term, indicating non-parallel slopes for the activities.
- _ . r 'y," - ,.+ uar: I - ~ L ~ N: 152 Xulciple 3: 3 .396 Squared suit-plt ?.: 2.SC3
d n a l y s i s of Variance
Sum-sf - S q a r e s df Mean-Square - Saurce r - r a c i a ?
Table 3.5. ANCOVA of the effect of depth on resting and travelling dive cycle durations for the combined data set Note non-significance of interaction term, indicating parallel slopes for the activities.
-4nalysis s f Variance
--a- -- - 51s-cf-Sq~ares af Yean-Spars - _ _ , - - - . ,o,,o ?

Table 3.6. ANCOVA of the effect of depth on the slopes of resting and travelling dive cycle durations for the combined data set. Note the non-significance of depth and the significance of activity.
A n a l y s i s of Variance
Table 3.7. Two-way ANOVA of the effect of depth and direction of travel on the rate of travel.
... m - n 2 C ? L Z 2 5 - I-. .. df-S(;xares 2 Yean-Square - - v - - . ,-
.. - - u c - u -

Table 3.8. Regression analysis of the effect of depth on dive cycle duration, t*+s.
. . z - ; s : s ~ srLars3 3 ~ L 1 1 p l e 3: 3.':: Scancar: e r r o r sf esrlrnsce: f E . 3?S
3.3;;r.ze 5 ~ - c f -Squares df Yean-Square F - r a ~ i c ?
Table 3.9. Regression analysis of the effect of depth an submerged time, t + ~ .

Table 3.10. Regression analysis of the effect of depth on travel time, s.
-2-d I us - - - sqcarec nc l : rp le 8 : I. S O G 3car.dard e r r c r zf t s r i s a r e : 5 . >?::,
- - - - -?,= - - - - < z , -. -- - -..c- --..-snz S t d Z r r z r S t 3 C s e f Tz le rance : ? Y Z : ~
Table 3.1 1. Regression analysis of the effect of depth on foraging time, t.

Table 3.12a. Regression for the effect of depth on surface time, s, for both data sets from 2.3 to 1 I m.
Sep 'Tar: 32RFACE T IME N: 33 Multi~le 3: 0 .625 Squared aulticle 3: - - - * d . l Y -
Aa:x~scec sqzaren 3~1:1?12 3: 3 . 3 3 3 5 - - ,ancard e r r o r 35 ast~xate: 15.ZiI
-:: :;-ecc Cceff:clenc 3rd E r r o r S c a Csef Tolerance - 7 - . - - . , - .C&*
Table 3.12b. Regression of the effect of depth on 1997 surface times, s, from 2.3 to 11 metres.
.qc;xsced sqcarec 3ult;pie 3: 3.248 Standard e r r a r o f esclmate: 1S.533
- - - ::re~: : ce f f r= ren i S:d E r r o r S i d Coef Tclerance : ?'; :a11
:cur=s 2.x'il-sf-3qcares 5f Yeail-Square - _ _ - - - . - . ,aclC -

Table 3.12~. Regression of the effect of depth on 1987-89 surface times, s, over full depth range.
- - - =: :tcr :ceff i = l e n c SCd E r r o r 5 t d C ~ e f Tclerance - 2 ; ~ T-;i -3 - - .
Table 3.1 3. Regression of the effect of submerged time, t+s, on following surface time, s, for both data sets for submerged times greater than 90.5 sec.
- - - =::ec= Z22"- - - e l t --,L,-.. St3 Z r x r S t c Coef 3olerar.ce - ? ( 2 -7.- - -3:-

Table 3.14a. Regression of the effect of depth on the number of breaths from 2.3 to 1 1 metres for both data sets.
2ep Var: 3RE4TBS 3: 3 3 Multlcle 3: C.833 Squared mui:ipls 5 : 1.633
- ? - - - - - .:-dl!~scsd squared axl=:cle 3.: J . 020 Sca?aard t r r c r cf ?strnaze: - . ?4
- - - - - :z:ecr Eoe::rcrtnt 3rd E r r o r Stz Coef Toierance : F i 2 Tall
Table 3.14b. Regression of the effect of depth on the number of breaths in 1997 over full depth range.

Table 3.14~. Regression of the effect of depth on the number of breaths in 1997 from 2.3 to I 1 metres.
- - - . - rzrect f~err~~ren: S r c E r r o r S t 6 Zsef TcLerante z ?.i T x L :
.+.alys~s 3f 'iariance
Source Sun-cf -Squares df Xean-Square ? - r a t i o F
Table 3.14d. Regression of the effect of depth on the number of breaths in 1987- 89 over full depth range.
Zf fee: 'sef fi,z,enr 2 - 4 --r-, --a :--u- Src Coef Tolerance - 2 : ~ -;- .---, : '

Table 3. t5a. Regression of the effect of the number of breaths on breath rate for both data sets from 1.8 to 7 breaths.
3ep Var: BREATS U T E Y:37 Xul : i~Le ?.: 0.553 S q u a r e d m u l t i p l e 3: G.3C6
Aalusrrea s q u a r e d nul::ple 3: 13.265 S c a n d a r a e r r o r 3f est imarre : 5 . 2 2 -
- - - . - - - - - - -PC= Z 3 t : :2t12n: St2 E r r o r 3 : ~ C3ef T o l e r a n c e - - .--- - 2 ' 2 T-. . .
~SC'-' - - - - -- S1zn-cf -Squares zf Yean-Square : - r a t i s
Table 3.1 5b. Regression of the effect of the number of breaths on surface time for both data sets over the full range of breaths.
L2c ' iar : SUSFACE ":ME N: 4 2 Yuit~pis 3: 3 . ~ 9 4 Squared auLt ;p le 3: 2.739

Table 3.16a. Regression of the effect of depth on the proportion of the dive cycle spent submerged. (t+t)/(t+~+s). Comparison of both data sets over full range of depths.
l e p .Jar: ?RCPORPION CYCLE SPENT SUBMERGED N: 48 Yultiple 3: 0 . 5 5 9 Zcquazec nul::?le 3: 3. j 5 9
- - * a
.kizcsr2c squarsc nuiz~cla 3 : 3 . 2 9 3 Sracaard s r r c r s f esc i za t? : -.I:- - - - - - --,-- ,:3e ; = i -. ;rnr ---r-- ------.-- :- i - - E r r Scz Zcef Tolerance - - - - , - - . - - - :s:-
; c ' ~ r ce Sum-of-Squares df Mean-Square ; - ra t io - "
Table 3.16b. Regression of the effect of depth on the proportion of the dive cycle spent submerged, (tcr)/(tts+s). Comparison of both data sets from 2.3 to 11 m.
:,=p : j a r : ?RC?C3TT3N Df ,Z7{CLE SPENT SiJEMEaGED N: 43 Yciiiple 3 : '2.536 Squared i n u l z i ~ L e 3: 3.356
- 4 c j ~ s t e c sq~areb xcl:iple 3: 0.269 Scandard error sf ;stlna;e: 3 . 2 4 6
- - - ? i ec= -- - - - - - -ser::z~cnr 3:s Errsr St= Csef .o lerance : ? ' Z Tail
. - Scurce Sun-cf-Squares 3: Yean-Square - r - r a r i c ?

Table 3.16~. Regression of the effect of depth on the proportion of the dive cycle spent submerged, (t+t)l(t+~+s), in 1997 from 2.3 to 1 1 m.
Dep Var: PROFORTION OF CYCLE SPENT SUBMERGED N: 24 Multiple 3: C V 7 3 0 Squared mill=-ple B: 3 .532
.;a?usted squared multrple 3: 0.462 S t a n d a x error o f esc~ma:e: 3.345
Zffec t C s e f f i c l e n t Std Error S t d Coef Tolerance t P ( 2 T a i l )
C3NSTANT 0.'91 9-31' 3.000 4 7 . a ~ ~ 0 .900 3EPTII 3.020 0.3C8 3.336 0 . 1 6 9 2.514 0 .321 3EPTH'DEPTE 0 .004 0.002 L.080 0.455 4.767 0.300 3EFTHgDEFTH 'DEPTH -0.002 0.001 -1.454 9.114 -3.2'9 U . O C 4
Analysis o f Variance
Source Sun-o ?-Squares df Mean-Square F-ratio 2
Table 3.16d. Regression of effect of depth on proportion of the dive cycle spent submerged, (t+T)/(t+~+s), in 1 98789.
3 e ~ ' ja r : ?ROPORTTON OF CYCLE SZENT SUEME3.GEC N: 20 Muitlple 3 : 5 . :31 Squarec x i r : ? l e 3: 3.336
Adjusted squared n u l c i p i e 3: O.OOC Scandard error c f escrmate: 3.54:
-cc L, Let: Coef f i c len: S:d Zrzor S t d Zoef Tolerance t ? : 2 ?a::!
CONSTANT J - 8 7 2 3.304 3.300 44.293 9.3GO DEPTH -1J.3C 3 3.504 -0. L 41 1 .300 -0.825 7.42C
.Analysis of Variance
Ssurce s.m-o z &-Squares df Yean-Square F-ratio ?
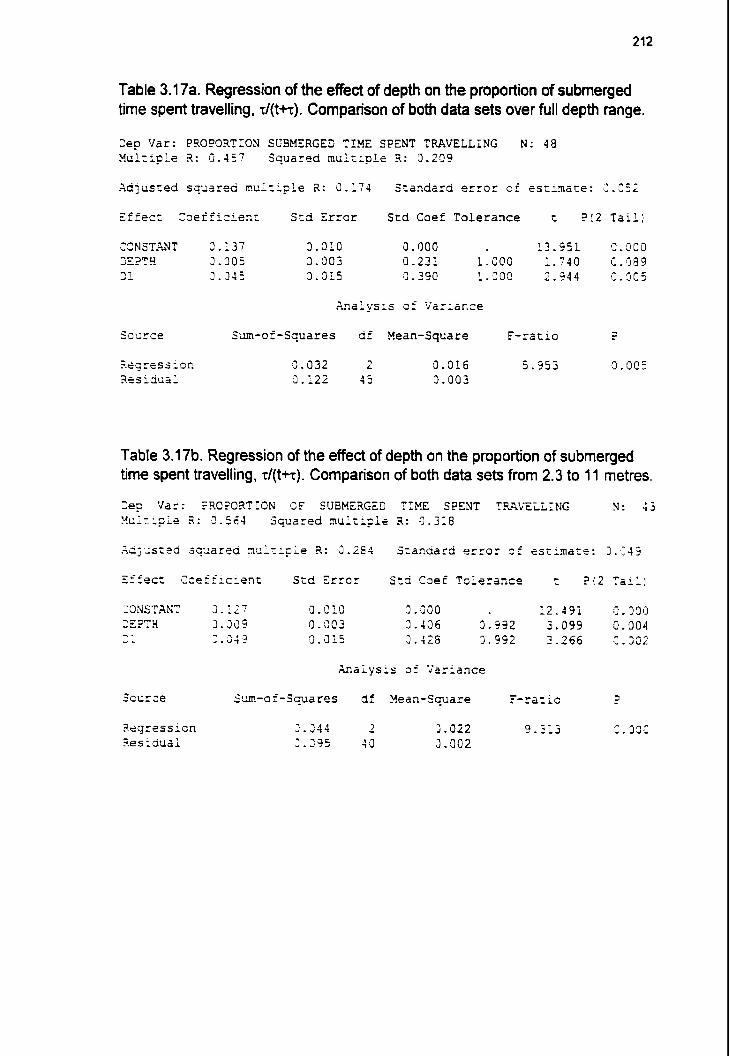
Table 3.17a. Regression of the effect of depth on the proportion of submerged time spent travelling, r/(t+t). Comparison of both data sets over full depth range.
3ep Var: PBOPORTION SUBMERGEG TIME SPENT TRAVELLING N: 49 !=!cl=ipls 3: 6 . 4 5 7 Squared nulcrple 3: O.?C!9
-2-ajusted squared mci:iple 3: 0.174 Standard error c f estxnace: 3 . 3 5 1
:+Fecr --- Coefficient Stb Error Std Coef Tolerance t ?!2 Tail:,
Source Sum-of-Squares af Hean-Sqnare - r -ratio
Table 3.17b. Regression of the effect of depth on the proportion of submerged time spent travelling, t/(ttr). Comparison of both data sets from 2.3 to 11 metres.
Sep Var: FBCPORTfON I;F SUaMERGED TIHE SPENT TMVELLING : 43 ucic:pie 2 : 3 . 5 6 4 Squared aultlple 3.: fl.318
Aajzsrac sqxarec aul:~ple 3: 9-25: 5:anaard error sf tscimate: 1 - 2 4 ?
E f f e c t Zaefficrent Std Error Sta C3ef Tolerance t 2 ! 2 Tatl)
Socrza - St=-of -Squares df Xean-Square r - r a t i c
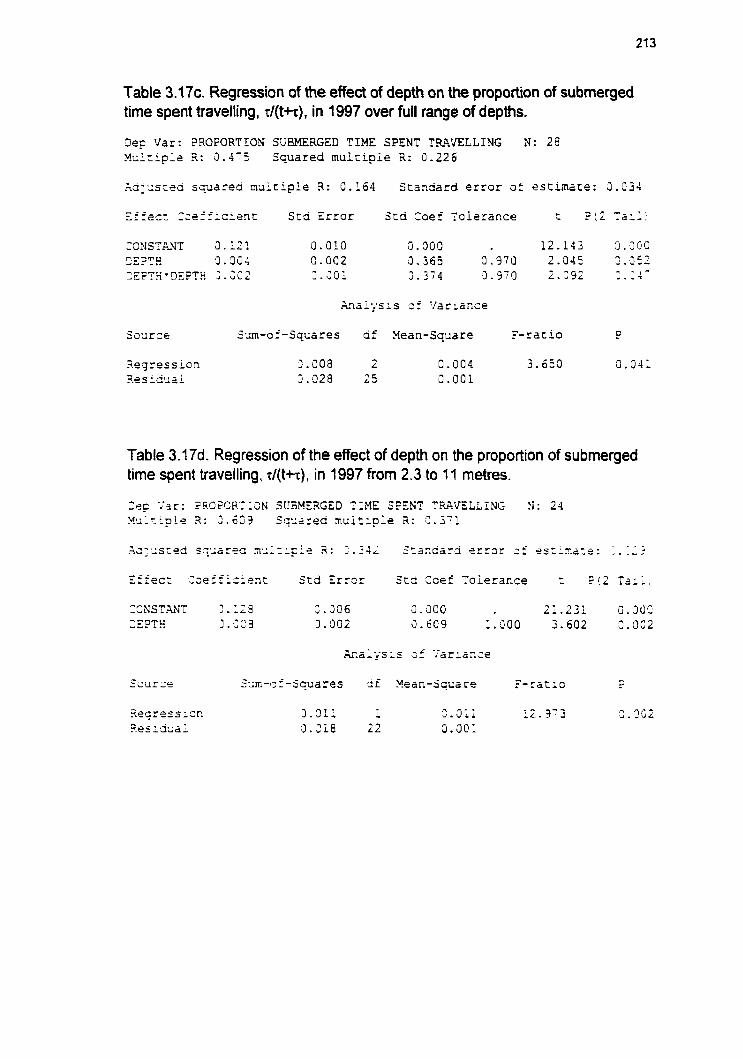
Table 3.17~. Regression of the effect of depth on the proportion of submerged time spent travelling, d(t+.t), in 1997 over full range of depths.
3ep Var: PROPORTION SUEMERGED TIME SPENT TRAVELLING N : 26 Mu1:ipLs 3.: 5 . 4 7 5 Squared m u l t i p l e R: 0.226
.:.as,~s;td s q a r e d m s F c i p l e 3: 0 . 1 6 4 Standard e r r o r s f estimate: 3.934
- - - ~zracz 1;effrc:ent Scd E r r o r Std Coef T o l s r a n c e t P ( 2 T a i l :
5 .m-of-Squares af Hean-Square - Source : - r a t io
Table 3.17d. Regression of the effect of depth on the proportion of submerged time spent travelling, t/(t+.c), in 1997 from 2.3 to 1 I metres.
zep ';ar: 2ROFCRTION SU3MERGED TZNE SFENT TRAVELLING X : 24 ~u;ripl? 3: J . 6 5 3 Sqcared n u i t r p l e 2 : 2.371
- - - =irec= :;ef fi::tnt S:d Z r r s r S t d Coef T o i e r a n c e - - - r !2 Ta;:.
- .,x ,-,. --.-. 22urze - I ,L :+uares zf Mean-Square . --* - a t l G - "
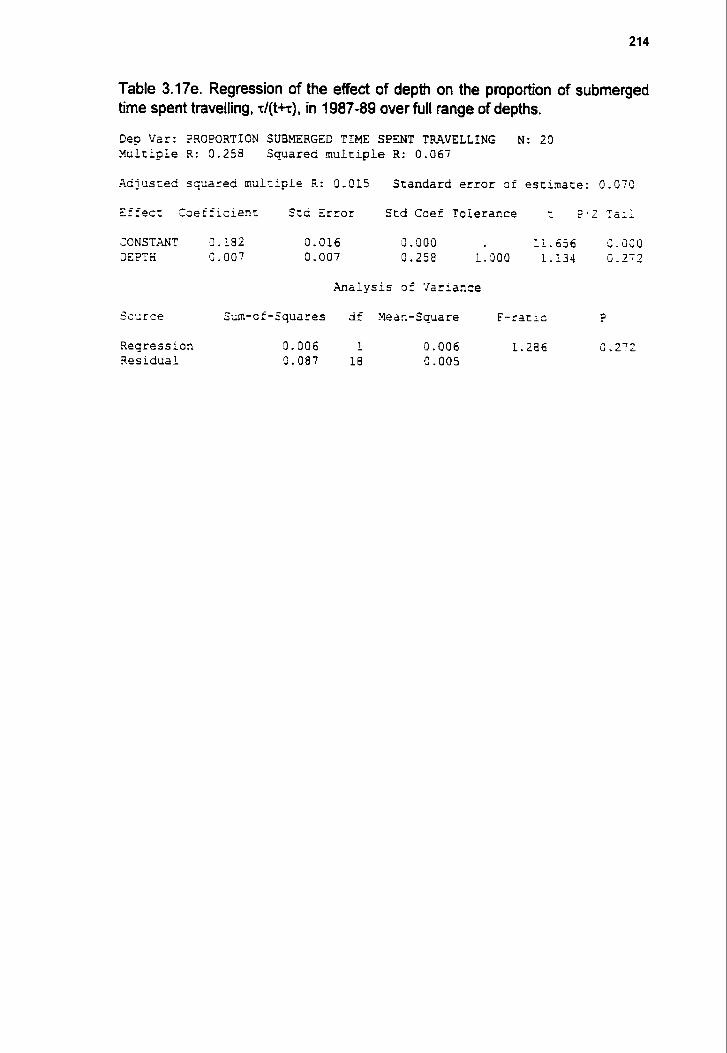
Table 3.17e. Regression of the effect of depth on the proportion of submerged time spent travelling, t/(t+t), in 1987-89 over full range of depths.
Dep Var: ?ROPORTION SUBMERGEC TIME SPENT TRAVELLING N: 20 Multiple 4: 0.258 Squared nulciple R: 0.067
.Adjusted squared mulriple R: 0,015 Standard error of estimate: O.O?C
- - - -- - - * I ,I - ' ~ - c c Coefficienr Std Error Scd Coef Tolerance = : ,: T a ~ l
CONSTANT 3. L92 0.016 0.300 11.656 C.SC0 3EPTH 1;. 007 0.007 0.258 i.000 1.134 0.272
Sccrce Sum-c f-Squares df Yean-Square F-rario ?
Reqression 3esidual

Table 3.18a. Regression of the effect of depth on the proportion of submerged time spent foraging, t/(t+r). Comparison of both data sets over full depth range.
3ep Var: ?ROFORTION SL'BPERGED TIME SPENT FORAGING N: 4 8 WuLtFpla 8 : 2 . 4 5 ' Squared m u l t i p l e 3: 3.209
. - - - 'ajcscsa squared a u l t ~ p l e ?: 12.174 Scanaara e r r c r s f asciaars: - . - = -
===*ct -- - - Coefficlcnz S t d Error Std Coef Tolerance r P i 2 T a r l .
;o!;rce Sum-of-Squares df Mean-Square F-ra t ic 2
Table 3.18b. Regression of the effect of depth on the proportion of submerged time spent foraging, t/(tts). Comparison of both data sets both data sets from 2.3 to 11 metres.
2e? 7ar : ?!?C?ORTI,>i SLSEERGE3 TIME SPENT F O U G i N G N : 43 >!cL=:pLe 3.: 3.564 Squared n u l t i p l e 3: 2.316
.qd:aszec squared aul:iple R: O.284 Standard error of estimate: 0 . 3 4 4
Zffecc Coef f icrenz Srd E r r o r S t d Ccef Tolerance D ( 2 --. . a-L . J
.*.a1 y s i s of Variance
- Scnrce Sm,-af -Squares df Mean-Square r - r a t i o P

Table 3 .18~ . Regression of the effect of depth on the proportion of submerged time spent foraging, tl(t+r), in 1997 over full depth range.
3ep .Jar: 2ROFORTION S'JBFERGED TIME SPENT FORAGING N: 29 i s : I . Squared a u l r i p l e 9: C.226
Cf fec: Cceff~zienr Sta Error Std Coef Tolerance t 1 ( 2 Tail]
Source Sum-af-Squares a f Kean-Square F- ra t io P
3eqress :on 0. 09e A 1 0.004 3.550 C . 3 4 1 3es:dcal 2 .023 2 5 0. O O i
Table 3.18d. Regression of the effect of depth on the proportion of submerged time spent foraging, t/(t+-r). in 1997 from 2.3 to 11 metres. - . -EC %?&:: ?XC?CgTIC,N 3' SUBMERGES TIUE SPENT FORACING N: 24 "c:: i c l e 4: ?.+ jag Squared sui::cle 3: 0.3'1
.;c-.. -scca - - - sq-area xnlzlcle 3: 5 . 2 4 2 S:azaarc e r r o r :f ectrsace: 1 . 2 2 3
- - - =r=ec= Cseffiz:*n: S:d Zrror Std Ccef Tolerance : ? i 2 Tall:
23ilr,-e S,iii-c f -Squares 5f Yean-Square =-y . -aL-b -.- - -

Table 3.18e. Regression of the effect of depth on the submerged time spent foraging, tl(t+-r), in 1987-89 over full range of depths.
3ep V a r : ?E(@PORTION SUBMERGED TfXE S X N T FOWGING N : 20 Xulriple X: 0 , 2 5 2 Sauazea moicLpie 3: 5 . 3 6 7
Acjustea sqcarec nclzlple 2 : ?.'I: Standard error o r escimare: 0 .076
- - - zr rec t Ccefiicien: Std Error Std Coef Tolerance L ? ( 2 Tal l !

Table 3.19a. Regression of the effect of depth on the proportion of the dive cycle spent travelling, t/(t+~+s). Comparison of both data sets over full depth range. - . ,zp iar: ?40?0RTION CYCLE SPENT TIiAVEZLiNG N: 38 Wultlpl? 3: O.f4@ Squared nulclple 8 : 0.300
.Ac;:s=ec sqcarec ~ . u l = ~ p l a B: 0 . 2 5 3 Sczndara e r r o r sf =sc:rnate: 3 . ;:: - - - r : ~ e c z Zcerr;c:ent S c a 5rror Srd Coef Tolerance - p ( 7 s .L ~ ~ ~ l '
-3SST;iNT 5.549 G . 311 5 -200 - *, ., .- 3 . 2 5 3 ..,,, --., 2.302 - * - - ~ z . r ? S rJ. 2 2 j '1.193 0.459 1.533 - . - -- . .
-. 7 . " - --,. 51 ; . : - I6 a . J L c 2 - 4 8 ? S . 3 1 3 3 . 7 1 6 -. v~ - - ~ ~ ~ - ~ ~ ~ ~ ~ . + - 2 . : : : :.:C: 3 .354 ? . $ I 3 L . O ~ > - ,- - '- - b' - - - -
Source Sum-c f -Squares df Hean-Square F-ra t io ?
Table 3.1 9b. Regression of the effect of depth on the proportion the dive cycle spent travelling, rJ(t+t+s). Comparison of both data sets from 2.3 to I 1 metres.
Effec: C;eff:cienc Std Error S:d Caef Toleracce t ? ( Z T a i l i

Table 3.20a. Regression of the effect of depth on the proportion of the dive cycle spent foraging, tl(t+~+s). Comparison of both data sets across full depth range,
3ep Y a r : FEOPOFiTION C T L E SPENT FORAGING N : 4 8 Xulriple X: 0.338 S q i a r t d n u l r l p l e R: 3.114
. , - - - .~.cl-s-,ea ~ ? ~ ~ r e d 3 ~ 1 = i ~ l s R: 3 . 5 9 5 Stazaard e r r o r cf esxrmacs: ,., , - - - - r - o p t ,-'- f f i -;ant -- - - - - Lue S t d E r r o r 5czi Caef Tolerance t --; -4-- -
Table 3.20b. Regression of the effect of depth on the proportion of the dive cycle spent foraging, tl(t+r+s). Comparison of both data sets from 2.3 to 11 rn.

Table 3 .20~ . Regression of the effect of depth on the proportion of the dive cycle spent foraging, t/(t+s+s) for 1997 data from 2.3 to 11 m.
2ep Var: 7RdPORTION OF CYCLE SPENT FORGING N: 24 Multiple R: 0 . 6 8 1 Sqiarsa xulciple 8 : C .464
- - - - - zzfecz :ze=flcl+rr ::a Error 5'3 Zsef Tolerance - - = - , - - . . - \ L - G - -
Table 3.20d. Regression of the effect of depth on the proportion of the dive cycle spent foraging, t/(t+s+s) for 1987-89 data.
LC- .. .. Aks;sa s c p a r ~ c x~11:ipLe 3: 2 . S I 3 Standard er ro r o f es::nace: j . J 9 f

Table 3.21a. Regression of the effect of depth on the proportion of the dive cycle spent at the surface, s/(t+r+s). Cornparison of both data sets across full depth range.
. l . ialysis of Variance
Table 3.21 b. Regression of the effect of depth on the propofion of the dive cycle spent at the surface, sl(t+r+s). Cornparison of both data sets from 2.3 - 11 m.

Table 3 .21~ . Regression of the effect of depth on the proportion of the dive cycle spent at the surface, s/(~+T+s), in 1997 from 2.3 to 11 m.
2-21; Var: ?RO?ORTION OF TIHE SEEN 'T SURFACE N: 24 Y u l t l p i e 3: 2.'3: Squared xcl=:cl? ?: ;.53;
.Z-dlustsd SqLarec snlzrcl? 3: C . 4 6 4 S t a n d a r d t r r c r sf oscxnat t : Z . 2 4 5
zf fecc zsef=: -,cie?.t S:d Ez ro r Scd Coef Tolerance : ' ( 5 T a l l
Source Sun-cf-Squares df Yean-Square Z-racio ?
Table 3.21d. Regression of the effect of depth on the proportion of the dive cycle spent at the surface, s/(t+r+s), in 1987-89 over full range of depths.
- - - - r::tc: - z e f f l c ~ e n r S c d Z r r o r S:cCoef To le rance = P(? Tall?

Table 3.22a. Regression of the effect of depth on the dive-pause ratio, (t+t)/s. Comparison of both data sets over full depth range.
- ;c~:s=es sz_arec ncl=:ple 3: 3 .248 Scanaard e r r c r zf es:laace: 13.412
Table 3.22b. Regression of the effect of depth on the dive-pause ratio, (t+s)/s. Comparison of both data sets from 2.3 - 11 m.
IZNSY.?N, : - . - - c d d 1 . 3 4 4 I. C O G . - . - - - - - - 7 - - - - - - . 7 - -
+ * 4 " -
-Clr.. - , - --. -.. - . - - 1. 2.16 - . &;. , 7 m - - . - - + 2 . 2 : : - - - A - 4 2 U -. 2 L 2 -- - t?TTB-2EFT9 1 . 5 6 1
-+* 9.273 0.769 3 . 4 4 2 >-ZSL 3.2GS
,L=T!~'DE?TE I*-- ;=;?3 -,; - 2 5 2 0.086 -1.636 a - 2 . 3 2 - ,>. 2 2 6

Table 3.22~. Regression of the effect of depth on the dive-pause ratio, (ttr)/s, in 1997 from 2.3 to 11 m.
3ep 'Jar: DPR N: 24 Muitlple 2: 0.633 Squared multiple R: 0 . 4 6 0
.=.djxsted sq~arec aulziele 2: 0.310 Standard error sf estinate: IC.155
Table 3.224. Regression of the effect of depth on the dive-pause ratio, (t+t)/s, in 1987-89 over the full range of depths.
It? 'iar: : ? ? ? I : f C XuL:rpLs 3: 3.302 S q ~ a r e c mcl=rpLe 3: 3. S C 4

APPENDIX 6
Theoretical Bases for Differences in Foraging Dive Patterns
The following is a discussion of two competing theories about foraging
behaviour and their application to the differences in foraging dive patterns
observed between the two data sets used in this study. While both theories are
based on the marginal value theorem, and are therefore related, they produce
contradictory predictions regarding the allocation of time within a dive.
Marginal Value Theorem
Optimal foraging models predict different outcomes under different
foraging conditions. Chamov's (1976) marginal value theorem (MVT) predicts
that time spent in a patch should increase when the average net rate of energy
intake from the environment decreases. Since the gain from foraging is assumed
to be proportional to the time spent in the foraging area, more time in a patch
equals more energy gained (Houston and McNamara 1994). Thus, the "giving up
timen would be longer under conditions of lower encounter rates because the
search times required to attain a given level of energy intake would be longer
than under conditions of higher encounter rates (Krebs et al. 1974, Dunstone and
O'Connor 1979) (Fig.A6.1). This prediction was supported by a controlled
experiment on a bottom-feeding bird, the ruddy duck. which found that more prey
were consumed per patch in a poorer environment (less prey) at any given depth
(Tome 1988). The increase in prey consumption by the ducks is analogous to

spending more time foraging in the poorer patches since the number of prey
consumed increased with time spent in a patch. In the present study, the longer
foraging times observed in the 1997 data set at any given depth may indicate a
lower rate of energy intake during that sampling period than in the 1987-89
sampling period. Longer foraging times at any depth would also result in longer
submerged times, unless travel rate changes, and therefore in longer surface
recovery times. Dugong surface times, foraging times, and submerged times
were all longer at any given depth in 1997 than in 1987-89. Travel rate was
assumed not to change with depth.
The MVT was developed for terrestrial foragers so the predicted time
spent in a patch is not limited by the need to breathe. When foraging occurs
underwater, the constraints imposed by oxygen are of greater importance to the
duration of foraging time than energetic factors such as the rate of energy gain.
In contrast to the MVT predictions, Houston and Carbone (1992) found that the
rate of energy gain had little effect on foraging time, and then only when the
currency being examined was the net rate of energetic gain, as in Tome's ruddy
duck study. They also found that foraging time during a dive was not determined
by the marginal value condition that the rate of energy gain falls to the rate of
gain for the environment, and also that foraging time had a "best valuen even
when the rate of gain increased rather than decreased. These findings suggest
that MVT-based predictions about the effect of foraging conditions on foraging
time have limited application to the behaviour of diving animals and care should
be taken when applying them.

Average net rate of energy intake in the Average net rate of energy 'good' h a b i t intake in the 'paor' habitat
Energy gain curve of the paWl
TP TP Time in Patch
Fig. A6.1. Graphical depiction of the optimal time to leave a patch in habitats of different quality. The average energy intake rate is greater in the "good" habitat than in the 'poor" habitat. The rate of energy gain in the patch falls to the average rate of energy intake for the habitat when the line representing average energy gain becomes tangent to the energy gain curve of the patch. Because the marginal value theorem predicts that an animal should leave a patch when the rate of gain in that patch falls below the average intake rate of the environment, the time spent in the patch is less in the *goodn habitat (T,) than in the "poor" habitat (Tp) (modified from Tome 1 988).

Level of Energy Expenditure
Variation in physical effort while foraging can also affect foraging patterns,
although in a different manner than does a change in the rate of energy intake.
Houston and Carbone's (1992) and Cahone and Houston's (1996) models,
which are based on the M W , predict that foraging time will be lower at any given
depth when oxygen consumption underwater (or just during foraging) increases.
Foraging time will therefore be shorter at any depth when more energy is
expended while underwater or while foraging. Surface time will also increase at
any depth if the combined underwater costs of both foraging and travelling are
higher, but will not be affected if foraging costs alone increase (Houston and
Carbone 1992). An increase in the cost of foraging alone therefore reduces
foraging time at any depth without influencing surface time. This prediction was
supported by laboratory studies of pochard (Carbone and Houston 1994) and
tufted ducks (Carbone et al. 1996). where an increase in effort (caused by an
increase in sand depth) resulted in a decrease in foraging time at any depth while
not affecting the surface time (Carbone and Houston 1994). Consumption rate
was also significantly reduced by the increase in sand depth, although it was
assumed not to have been a factor in the reduction of foraging time because
consumption rate did not affect foraging times in pochard (Carbone and Houston
1994) and intake rates did not have a strong effect on predicted foraging times
(Houston and Carbone 1992). Houston and Carbone's (1 992) predictions
regarding physical effort were also supported by an experimental study which
compared the diving behaviour of fur seals with different degrees of foraging

effort (Boyd et al. 1997). Wooden blocks were attached to treatment animals to
artificially increase foraging effort. The treatment animals made shorter,
shallower dives, took longer surface intervals for a given depth (therefore used
more oxygen) and swam slower than the control group. They also spent
proportionately less of their submerged time foraging at any depth than did the
control group. The authors concluded that the seals adapted their behaviour at
the level of the individual dive in order to compensate for the increase in foraging
effort. The dugong results from the present study do not support the predictions
for increased metabolic costs while travelling and foraging underwater, or even
just while foraging. Although foraging times were shorter in 1987-89 than in 1997,
so too were surface times. It is therefore difficult to interpret the differences in the
data sets in terms of undewater costs. Perhaps the foraging behaviour of
animals such as dugongs, which usually dive well within their ADLs, is governed
more by the rate of energy gain, as suggested by the MVT, than by oxygen
constraints. Whether an animal increases its foraging effort by foraging longer or
by foraging harder when faced with a poorer environment may depend on the
nature of its food. If the animal must increase its physical effort in order to catch
scarce prey or to access more deeply buried prey, then it probably does so.
Otherwise, the animal may simply forage longer, if its ADL allows, rather than
forage harder. Perhaps dugongs can use either strategy depending on forage
type. foraging mode, or the nature of the substrate. Although no evidence in
terms of dive patterns was seen of increased metabolic costs during either the

1997 or the 1987-89 observation periods, it may still be an option available to
dugongs.
While the level of energy expenditure of foraging dugongs has never been
quantitativeiy examined, limited evidence exists to suggest that dfferent foraging
modes require different levels of effort and that an increase in foraging effort can
affect diving patterns. Anderson (1998b) observed that the mean dive cycle
duration of dugongs foraging on Halodule in the "flukes-upn or "headstand" mode
(body angle >45 to bottom) was almost half that of dugongs foraging on Halodule
in the "horizontal" mode (body angle ~ 4 5 to bottom), The greater exertion
required to forage in the more vertical mode may have reduced the ADL,
shortening the submerged times, and ultimately decreasing the dive cycle
durations of these animals. No infomation was available on how foraging times
and surface times were affected specifically, so it is unknown how this result fes
into Houston and Carbone's (1 992) metabolic cost predictions.
Application to Seabird Example
While prey type and foraging mode did seem to have had an effect on
strategies for dealing with food shortages in guillemots and shags (Monaghan
1996, Monaghan et a1.1994), it is difficult to determine the theoretical basis of
those effects. Without additional information on foraging times, it is impossible to
determine whether the different outcomes were strictly the result of foraging
harder, as suggested by the authors, or whether they were the result of foraging
longer- According to the MVT, foraging time in a patch should increase in a

poorer environment (Charnov 1976). This would lead to an increase in
submerged time, followed by an increase in postdive surface time. Houston and
Carbone's (1992) theory, meanwhile, predicts that an increase in oxygen
consumption while underwater will lead to a decrease in foraging time at any
given depth, while surface time will either increase or will not be affected. Surface
time did increase for any given submerged time during the poorer year in the
shag example, suggesting either an increase in foraging time to compensate for
the decrease in the average net rate of energy intake, or an increase in both
foraging and travel costs. Surface time decreased for any given submerged time
in the guillemot example, which was not predicted by either theory. The effect on
time allocation at a given depth rather than for a given submerged time is also
unknown for either the shags or the guillemots. The submerged times of the
shags were said to be slightly longer in both the poor year and in one of the best
years. However, there was also a tendency for the shags to dive deeper in the
poor year, which may account for the longer submerged times during that period.