Submersion time, depth, substrate type and sampling method as variation sources of marine periphyton
33
Please note that this is an author-produced PDF of an article accepted for publication following peer review. The definitive publisher-authenticated version is available on the publisher Web site 1 Aquaculture October 2009, Volume 295, Issues 3-4, Pages 209-217 http://dx.doi.org/10.1016/j.aquaculture.2009.07.005 © 2009 Elsevier B.V. All rights reserved. Archimer Archive Institutionnelle de l’Ifremer http://www.ifremer.fr/docelec/ Submersion time, depth, substrate type and sampling method as variation sources of marine periphyton M. Richard a, b, * , C. Trottier a , M.C.J. Verdegem c and J.M.E. Hussenot d a Institut Français de Recherche pour l'Exploitation de la Mer (IFREMER), 17137L'Houmeau, France b Littoral, Environnement et Sociétés (LIENSs), UMR 6250, CNRS-Université de La Rochelle, 2 rue Olympe de Gouges, F-17042 La Rochelle Cedex 01, France c Aquaculture and Fisheries Group, Department of Animal Sciences, Wageningen University, P.O. Box 338, 6700 AH Wageningen, The Netherlands d Institut Français de Recherche pour l'Exploitation de la Mer (IFREMER), Dept AGSAE, Station d'aquaculture, 85230 Bouin, France *: Corresponding author : M. Richard, Tel.: +33 2 51 68 89 46; fax: +33 2 51 49 34 12, email address : [email protected] Abstract: Periphyton is an additional food source in African and Asian brackish and freshwater fish ponds. The present study was a preliminary assessment of periphyton development on artificial substrates in temperate marine ponds. The effects of submersion time, substrate type, water depth, and total or partial sampling methods on the quantity and quality of periphyton collected, were evaluated. Four types of substrate (W: wooden poles, S: smooth fiber-glass strips, m: mosquito screen (1 mm-mesh) and M: garden netting (5 mm-mesh)) were deployed in a marine pond, and periphyton was collected 15 and 30 days later. The total amount of periphyton per substrate unit was collected as one sample or as 5 sub-samples. Results showed that (i) periphyton biomass in a marine pond increased between day 15 and day 30, (ii) more periphyton was collected on mosquito screen than on wooden poles, fiberglass strips and garden netting, (iii) periphyton biomass increased with submersion depth, (iv) sub-sampling leads to an underestimate compared to whole unit sampling, and (v) a correction of periphyton weight must be carried out considering the dissolved inorganic salts present in periphyton samples from marine and brackish ponds. Whole substrate unit sampling using a tube and stopper is recommended to avoid underestimation of periphyton development. Finally, the autotrophic fraction in the periphyton communities was very low compared to periphyton developed on biodegradable substrates in fertilized tropical ponds. Studies on fertilization and use of biodegraded substrates (i.e. long-time submerged wood) are recommended to further optimize periphyton development in temperate marine ponds. Keywords: Periphyton; Fouling; Artificial substrate; Marine pond; Aquaculture
-
Upload
independent -
Category
Documents
-
view
2 -
download
0
Transcript of Submersion time, depth, substrate type and sampling method as variation sources of marine periphyton
Ple
ase
note
that
this
is a
n au
thor
-pro
duce
d P
DF
of a
n ar
ticle
acc
ept
ed fo
r pu
blic
atio
n fo
llow
ing
peer
rev
iew
. The
def
initi
ve p
ub
lish
er-a
uthe
ntic
ated
ve
rsio
n is
ava
ilab
le o
n th
e pu
blis
her
Web
site
1
Aquaculture October 2009, Volume 295, Issues 3-4, Pages 209-217 http://dx.doi.org/10.1016/j.aquaculture.2009.07.005 © 2009 Elsevier B.V. All rights reserved.
Archimer Archive Institutionnelle de l’Ifremer
http://www.ifremer.fr/docelec/
Submersion time, depth, substrate type and sampling method as variation sources of marine periphyton
M. Richarda, b, *, C. Trottiera, M.C.J. Verdegemc and J.M.E. Hussenotd
a Institut Français de Recherche pour l'Exploitation de la Mer (IFREMER), 17137L'Houmeau, France b Littoral, Environnement et Sociétés (LIENSs), UMR 6250, CNRS-Université de La Rochelle, 2 rue Olympe de Gouges, F-17042 La Rochelle Cedex 01, France c Aquaculture and Fisheries Group, Department of Animal Sciences, Wageningen University, P.O. Box 338, 6700 AH Wageningen, The Netherlands d Institut Français de Recherche pour l'Exploitation de la Mer (IFREMER), Dept AGSAE, Station d'aquaculture, 85230 Bouin, France *: Corresponding author : M. Richard, Tel.: +33 2 51 68 89 46; fax: +33 2 51 49 34 12, email address : [email protected]
Abstract: Periphyton is an additional food source in African and Asian brackish and freshwater fish ponds. The present study was a preliminary assessment of periphyton development on artificial substrates in temperate marine ponds. The effects of submersion time, substrate type, water depth, and total or partial sampling methods on the quantity and quality of periphyton collected, were evaluated. Four types of substrate (W: wooden poles, S: smooth fiber-glass strips, m: mosquito screen (1 mm-mesh) and M: garden netting (5 mm-mesh)) were deployed in a marine pond, and periphyton was collected 15 and 30 days later. The total amount of periphyton per substrate unit was collected as one sample or as 5 sub-samples. Results showed that (i) periphyton biomass in a marine pond increased between day 15 and day 30, (ii) more periphyton was collected on mosquito screen than on wooden poles, fiberglass strips and garden netting, (iii) periphyton biomass increased with submersion depth, (iv) sub-sampling leads to an underestimate compared to whole unit sampling, and (v) a correction of periphyton weight must be carried out considering the dissolved inorganic salts present in periphyton samples from marine and brackish ponds. Whole substrate unit sampling using a tube and stopper is recommended to avoid underestimation of periphyton development. Finally, the autotrophic fraction in the periphyton communities was very low compared to periphyton developed on biodegradable substrates in fertilized tropical ponds. Studies on fertilization and use of biodegraded substrates (i.e. long-time submerged wood) are recommended to further optimize periphyton development in temperate marine ponds. Keywords: Periphyton; Fouling; Artificial substrate; Marine pond; Aquaculture
Variation sources of marine periphyton 3
1. Introduction24
Periphyton refers to the entire complex of attached aquatic biota on submerged 25
substrates, including associated non-attached organisms and detritus (van Dam et al., 2002).26
This assemblage comprises bacteria, fungi, protozoa, phyto and zoo-plankton, benthic 27
organisms and detritus (Azim et al., 2005). It can be used as additional food in aquatic 28
production systems. Aquaculture based on periphyton was originally derived from traditional 29
fishing methods known in Africa as Acadja (Welcomme, 1972) and in Asia as Kathas and 30
Samarahs (Van Dam et al., 2002). Artificial substrates are added into aquatic system to 31
enhance the food availability. This semi-extensive aquaculture system is well known to 32
increase the production of fish (Ramesh et al., 1999; Umesh et al., 1999; Azim et al. 2001a). 33
Although widely tested in freshwater fish culture (Azim et al., 2005), the use of periphyton in 34
brackish or marine waters (van Dam et al., 2002; Huchette and Beveridge, 2005; Khatoon et 35
al., 2007) is limited to shrimp (Bratvold and Browdy, 2001; Moss and Moss, 2004; Arnold et 36
al., 2006) and abalone cultures (Kawamura et al., 2005).37
Variation of periphyton quantity and quality depends on a range of factors such as (i) 38
submersion time (Azim and Aseada, 2005), (ii) substrate type (Ramesh et al., 1999; 39
Keshavanath et al., 2001; Azim et al., 2002a), and (iii) light intensity and quality (Kirk 1994; 40
Goldsborough et al., 2005). The latter is strongly influenced by the depth of the substrates 41
(Asaeda and Son 2000). Thus, Azim et al. (2001a, 2003b) waited minimum 2 weeks to allow 42
periphyton to develop on the substrates before stocking fishes. Keshavanath et al. (2001) 43
observed that fish production based on periphyton depends on artificial substrate type and 44
preferred to use bamboo rather than PVC pipes or sugarcane bagasse bundles when culturing45
masheer (Tor khudree) fingerlings. Azim et al. (2001b, 2002a, 2004a) and Keshavanath et al. 46
(2001) pooled several sub-samples of periphyton collected at equally spaced depths along 47
vertical substrates to analyse the composition of periphyton. This pooled sample was 48

Variation sources of marine periphyton 4
considered by these authors to represent the mean composition of periphyton developed on 49
substrate, going from the photic zone close to the surface to the aphotic zone above the 50
bottom.51
The potential contributions of semi-extensive aquaculture to environmental protection 52
and restoration of coastal areas have been clearly recognised within EU policy. The 53
SEACASE program (Sustainable extensive and semi-extensive coastal aquaculture system in 54
Southern Europe) was started in 2007 to develop sustainable extensive and semi-extensive 55
coastal aquaculture systems in Southern Europe (Conceição et al., 2007). The present 56
SEACASE study is a preliminary assessment of the feasibility to grow periphyton on artificial 57
substrates in temperate marine ponds. The effects of submersion time, substrate type, water 58
depth, and total or partial sampling methods, on the quantity and quality of periphyton59
collected, were evaluated. The goals of this study were to identify (i) the best periphyton 60
substrate type and (ii) a methodology of periphyton sampling for further studies on 61
periphyton-based marine aquaculture.62
63
2. Materials and methods64
65
2. 1. Experimental site and design66
67
The experiment was carried out from 9 May till 6 June 2007 in a 200 m2 marine pond 68
in the IFREMER-L’Houmeau experimental facilities, located on the Atlantic coast of France, 69
near La Rochelle. Four types of substrates were used for this experiment (Fig. 1): (i) 2.5 cm 70
wide square wooden poles (fir tree: W), and 5 cm wide strips of (ii) smooth fiber-glass (S), 71
mosquito screen (1mm-mesh; m) and (iv) garden netting (5mm-mesh; M). The mean 72
submersion depth of the substrates (± SE) was 76.3 ± 2.7 cm after 15 days of submersion 73
Variation sources of marine periphyton 5
whereas it was 66.3 ± 4.6 cm after 30 submersion days. The mean submerged surface area (± 74
S.E.) was 713 ± 9.3 cm² and equal for each substrate type. Eleven poles or strips (called units) 75
of each substrate type were deployed in the marine pond. The units were put 20 cm apart from 76
the closest other units in 4 parallel rows with 11 units each within a 1.0 m x 2.4 m plot, 77
randomly assigning the different unit types to the available locations. The different strip types 78
were suspended in the water column from iron bars fixed on a horizontal wooden frame 79
standing slightly above the surface on poles driven in the bottom, while the pole units were 80
standing in the sediment, under the iron bar. 81
82
Total sampling: Influence of substrate type and submersion time83
84
On sampling days, four units of each substrate type were randomly collected. All the 85
periphyton on each unit was collected. Sampling was done 15 (23 May 2007; T15d) and 30 86
days after submersion (4-5 June 2007; T30d). Collected units were not placed back. In total, 32 87
units were collected (4 units/type/date x 4 types x 2 dates).88
89
Sub-sampling: Influence of substrate type and submersion depth90
91
At the end of the experiment (T30d), the remaining 3 units of each substrate type (W, S, 92
m, M) were sampled in a random order. The submerged area of each unit was divided in five 93
15-cm-segments starting from the bottom (Fig. 2a: 1: 0-15 cm, 2: 15-30 cm, 3: 30-45 cm, 4: 94
45-60 cm, 5: 60-75 cm). Each 15-cm sub-sample (i.e. 1 to 5; Fig. 2a) was completely cleaned. 95
The order of the segment cleaning was randomly assigned for each unit. Each sub-sample was96
next separately stored. In total, 60 samples were collected (3 units/type x 4 types x 5 sub-97
samples/unit). 98
Variation sources of marine periphyton 6
99
Total vs. sub-sampling: comparison of both sampling methods100
101
Each 15-cm sub-sample was analysed separately. The average periphyton composition 102
on each unit was calculated in two ways (Fig. 2b):103
1. Per unit, the data of the five 15-cm sub-samples (1 to 5) were added together, to 104
represent the whole surface area (S-5), and 105
2. Per unit, the top (1: 0-15 cm), middle (3: 30-45 cm) and bottom (5: 60-75 cm) sub-106
samples were added together, and extrapolated to the total unit area (S-3).107
These data were compared with the results of the whole unit samples (T) collected on the 108
same day (30d). 28 data were thus used for each set of comparison ((4 units/types x 4 types) + 109
(S-3 or S-5 sampling method 3 units/type * 4 types)).110
Three units (one W, m and M) were incorrectly treated and could not be included in the data 111
set. It explains why the total degree of freedom was lower than expected (Tables 1 through 3). 112
113
2.2. Sampling and storage114
115
At T15d and T30d, water temperature (°C), salinity, pH were measured with a multi-116
parameter probe (HI9828 HANNA) at the water top 15 cm of three sites in the pond, at 5:00 117
PM. Mean water temperature, salinity and pH (± SE) were 24.4 ± 0.76 °C, 32.2 ± 0.14 ppt and 118
8.1 ± 0.07 at T15d vs. 26.3 ± 0.93 °C, 32.9 ± 0.14 ppt and 8.2 ± 0.03 at T30d. Mean oxygen 119
concentration (± SE) was at 6.4 ± 0.1 mg.L-1 (92.8 ± 2.2 %) T15d and 6.9 ± 0.1 mg.L-1 (102.7 120
± 2.7%) at T30d. The water samples were collected immediately after the probe recording. 121
Means of suspended matter (± SE) and particulate organic matter were 13.7 ± 1.04 mg.L-1 and 122
1.9 ± 0.2 mg.L-1, respectively, at T15d. The suspended matter was composed of 85.9 ± 0.4 % of 123
Variation sources of marine periphyton 7
inorganic matter. At T30d, mean Chl a was 5.3 ± 0.3 g.L-1. Chlorophyll pigments included124
15.2 ± 1.2 percent of Phaeophytin a.125
126
Periphyton 127
128
The order and the location of collected units were randomly assigned. Each unit was 129
sampled by putting a PVC tube (diameter of 6 cm x 110 cm of length) over it and closing it 130
with a 100 µm-meshed stopper to avoid periphyton loss. The length of the submerged part of 131
the collected substrate was measured in order to calculate the exact substrate area with 132
periphyton (cm²). Each unit was carefully and completely cleaned with fingers and a 133
toothbrush into a plastic flask with a fixed volume of !"#$ %-filtered sea-water (200 ml for 134
total unit samples and 40 ml for 15-cm samples). All material from the inner part of the net of 135
meshed substrates was removed. Each sample was next sub-sampled using a Motoda box-136
splitter (Motoda, 1959): 1/8 part was stored in a dark box at - 20°C for Chla analysis, 7/16 137
parts were stored with 4% formalin for taxonomic analysis, and 7/16 parts were used for 138
periphyton weight analyses, putting it directly in pre-weighted box at 60°C. 139
140
2.3. Sample analyses141
142
Dry weight and Ash free dry weight143
144
Periphyton samples were dried at 60°C for 72h, weighed (DW: dry weight), and burned for 4h 145
at 450°C to calculate the ash-free dry weight (AFDW; Byers et al., 1978). DW, AFDW and 146
the weight of ash (ASH) were measured to the nearest 10-5 g with an AE240 Mettler Toledo 147
Balance. As filtered sea-water was used to clean units, “salt correction” was applied on 148
Variation sources of marine periphyton 8
periphyton weight. The effects of added filtered seawater (7/16 of 200ml or 40 ml according 149
to the type of sampling) on DW, ASH and AFDW of periphyton were determined considering150
the salinity of the cleaning water and the corresponding calibration curves (DW (g.L-1) = 1.17 151
Salinity (R2=0.99), ASH (g.L-1) = 0.94 Salinity (R2=0.99), and AFDW (g.L-1) = 0.23 Salinity 152
(R2=0.96). These equations were established using based on DW, AFDW and ASH content of 153
&'())$ ()*+,-.&)/$ 01$ !"#$ %-filtered water in which the salinity was either 0, 10.7, 20.4, 28, 154
28.7, 36.37, 36.42, 38.03, 38.12, 40.17 or 40.38 ppt. Sea-water (28 to 40) was collected in 155
marine ponds. Water in which the salinity ranged from 10 to 20 corresponded to diluted sea 156
water by Milli-Q water (0 ppt).157
Values were reported to the total sample volume (200 or 40 ml) and to the total length of the 158
unit. DW, ASH and AFDW were thus expressed in mg.cm-2. 159
160
Chlorophyll a and Phaeophytin a161
162
Chlorophyll a (Chl a) and phaeophytin a (Phaeo a) observed in periphyton were 163
determined with a Turner TD 700 fluorometer after 12 hours of acetone extraction at 4°C in 164
the dark without and with acidification. Nine ml of 100% acetone were added to 1 ml-165
periphyton as could performed Azim’s team (M.C.J. Verdegem, Pers. Com.). Chl a and Phaeo166
a data were reported to the total sample volume (200 or 40 ml) and to the total length of the 167
unit. Values were expressed in µg.cm-2 for periphyton. The ratio of phaeophytin vs. sum of 168
chlorophyll pigments was also calculated as (Phaeo a).(Phaeo a + Chl a)-1 and expressed in %169
(% Phaeo a). The autotrophic index (AI) was calculated as: AFDW (mg.cm-2)/ Chl a (µg.cm-170
2) * 1000 µg/mg (APHA 1992). 171
172
2.4. Statistical analyses173
Variation sources of marine periphyton 9
174
The assumptions of normality and homoscedasticity were evaluated using Shapiro-175
Wilk (Shapiro and Wilk, 1965) and Brown-Forsythe (Brown and Forsythe, 1974) tests, 176
respectively. When required, data were transformed to satisfy both assumptions. ANOVAs 177
were next performed to test the influence of (i) submersion time (TIME), (ii) substrate type 178
(TYPE), (iii) submersion depth (DEPTH), (iv) sampling method (SAMPLING), and (v) their 179
interactions on periphyton DW, AFDW, Chl a, Phaeo a, %Phaeo a and AI. Tukey’s HSD 180
(honestly significant differences) pairwise multiple comparison tests were used to identify the 181
differences when a source of variation was significant (P < 0.05). 182
183
3. Results184
185
3.1. Total sampling: Influence of submersion time and substrate type186
187
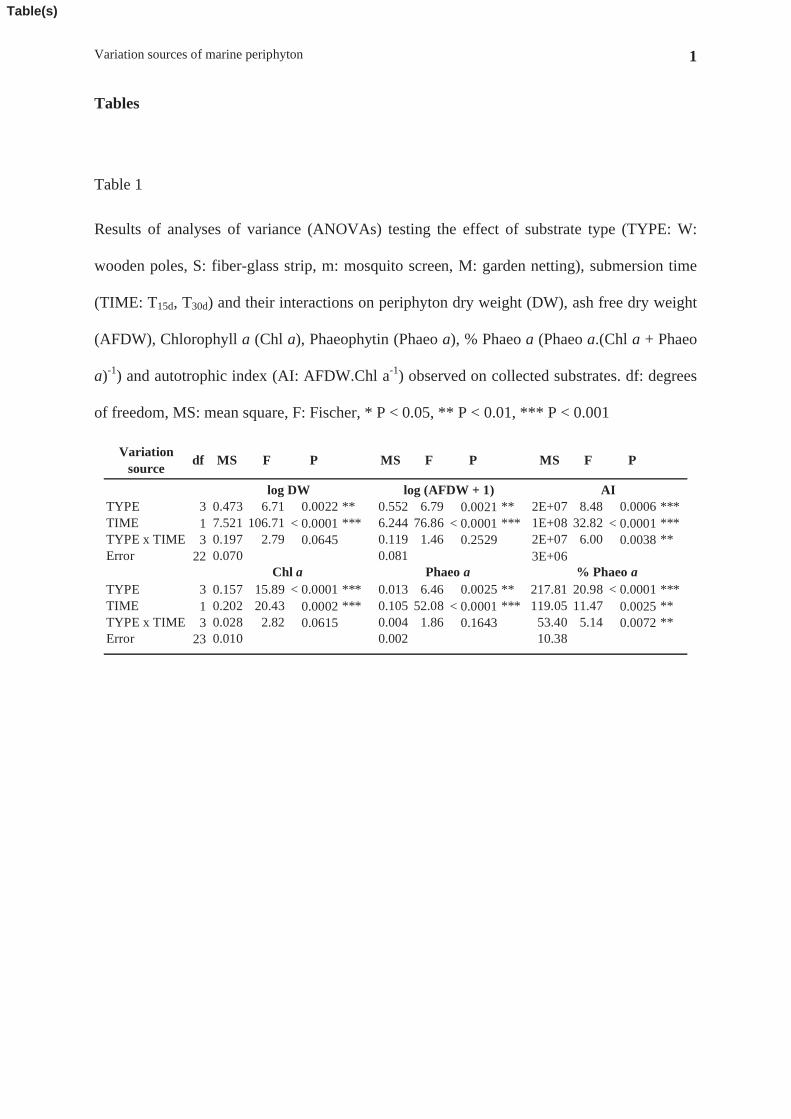
According to the ANOVA results (Table 1), dry weight, ash free dry weight, 188
chlorophyll a and phaeophytin a varied significantly among submersion time (TIME; Table 189
1). Means were greater at T30d than at T15d. Mean AFDW and Phaeo a were more than twice190
higher at T30d than at T15d (DW: 6.3 mg.cm-2 vs. 2.3 mg.cm-2 and Phaeo a: 0.2 µg.cm-2 vs. 0.1 191
µg.cm-2; Fig. 3a, b). 192
Substrate type (TYPE) significantly affected the amount of periphyton collected in 193
terms of DW, AFDW, Chl a and Phaeo a (Table 1). Tukey HSD tests revealed that means of 194
DW, AFDW, Chl a and Phaeo a were larger on mosquito screen (m) that on the other 195
substrate types (M, S or W; Fig. 3c, d). Mean periphyton DW and total chlorophyll pigment 196
varied between 3.4 and 6.4 mg.cm-2 (Fig. 3c) and between 0.5 and 1 µg.cm-2, respectively,197
among substrate types (Fig. 3d).198
Variation sources of marine periphyton 10
The interaction of both factors (TYPE x TIME) was a significant variation source of % 199
Phaeo a (Table 1). Relatively more Phaeo a was present on mosquito screen at T30d (m-T30d: 200
27.7%) than at T15d (m-T15d: 16.7%). In contrast, mean % Phaeo a did not significantly differ 201
over time on wooden poles (W), fiber-glass (S) and garden netting (M). Means (± SE) were 202
respectively 30.2 ± 0.9 %; 28.2 ± 1.1 % and 18.7 ± 1.6 %. At T15d, a higher % Phaeo a was 203
observed on smooth substrates (W, S) than on meshed substrates (m, M). At T30d, the %204
Phaeo a observed on wooden poles (W) was higher than on garden netting (M).205
The autotrophic index was significantly different for the factors TYPE and TIME, and 206
showed a significant interaction (Table 1). The mean AI observed on wooden poles (W) was 207
more than 6 times lower at T15d (1554 ± 410) than at T30d (9449 ± 1479). In contrast, the mean 208
AI observed on the other substrates (S, m, M) did not vary over time. 209
210
3.2. Sub-sampling: Influence of substrate type and submersion depth211
212
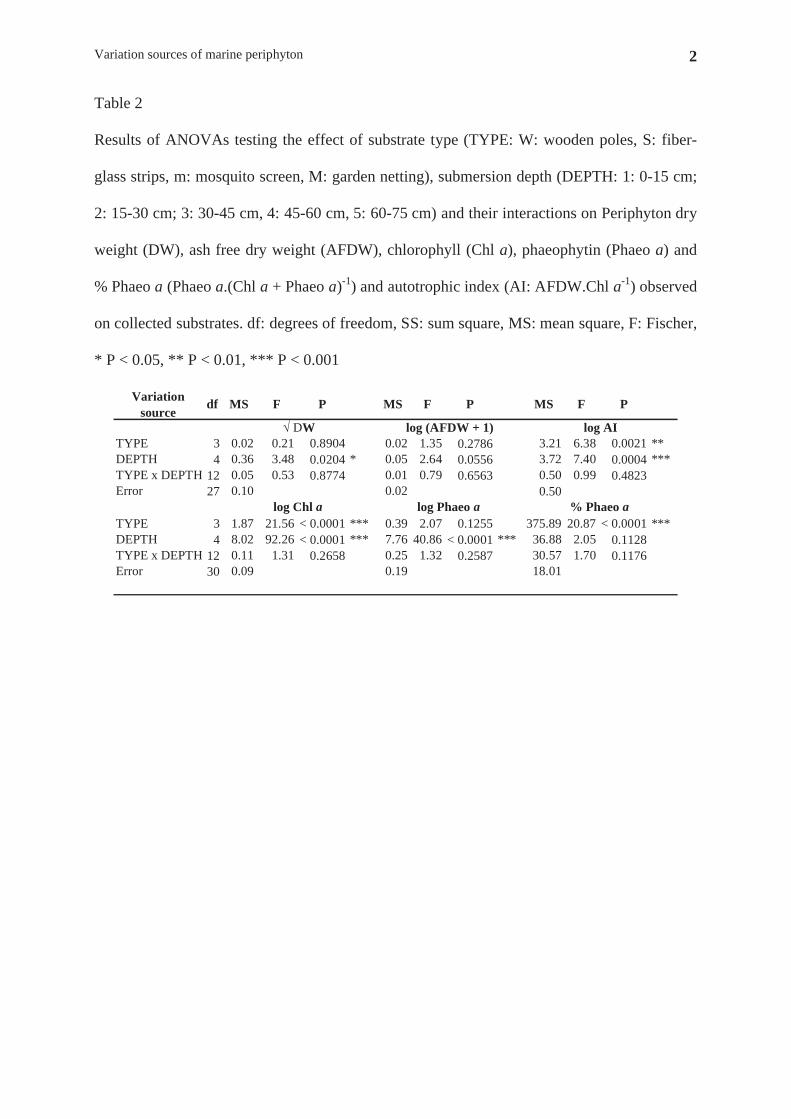
Chl a, % Phaeo a and the AI were significantly different among substrate type (Table 213
2). HSD tests showed that at T30d, the Chl a mean was greater on meshed substrates and 214
fiberglass than on wooden poles (m, M, S: 0.6 ± 0.12 µg.cm-2 > W: 0.26 ± 0.08 µg.cm-2). At 215
T30d, % Phaeo a varied such as W > S, M 2 M, m. The AI mean was almost three times higher 216
on wooden poles (W: 2815 ± 816) than on the other substrates (S, M, m: 939 ± 299).217
Periphyton DW, Chl a and Phaeo a significantly changed with depth (DEPTH; Table 218
2). More periphyton was collected at 60-75 cm depth than at 0-15 cm depth (Fig. 4). 219
Respectively 2 and 12 times more DW and total chlorophyll a was collected in the bottom 15 220
cm than at the top 15 cm. Mean differences between sampling depths of DW and Phaeo a221
were not statistically significant whereas means seemed to increase between 15 and 60 cm 222
depth. In contrast, Chl a increased gradually with depth (Fig. 4b). The mean AI (± SE) was 223
Variation sources of marine periphyton 11
more than three times larger in the top 15 cm (3406 ± 1002) than between 15 and 60 cm (900 224
± 260). The % Phaeo a did not vary with depth whatever the type substrate (Table 2) and was 225
25.7 ± 2.05%.226
227
3.3. Total vs. sub-sampling: comparison of both sampling methods228
229
Five sub-sampling230
231
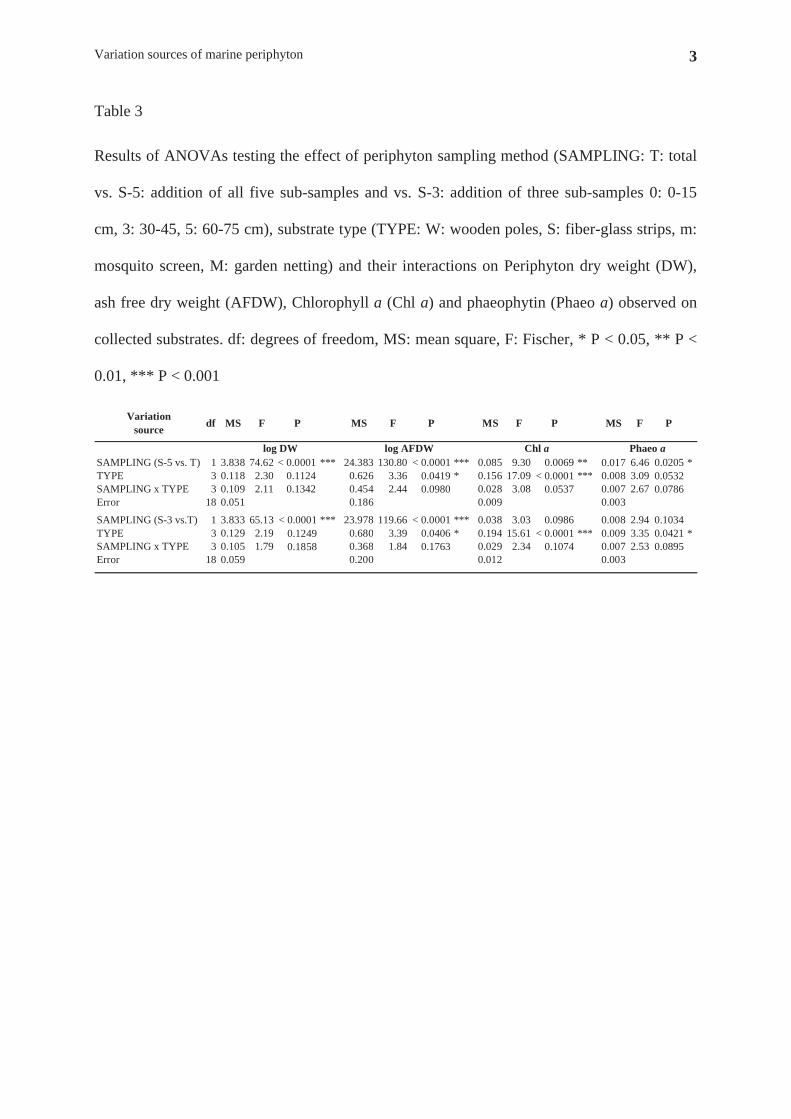
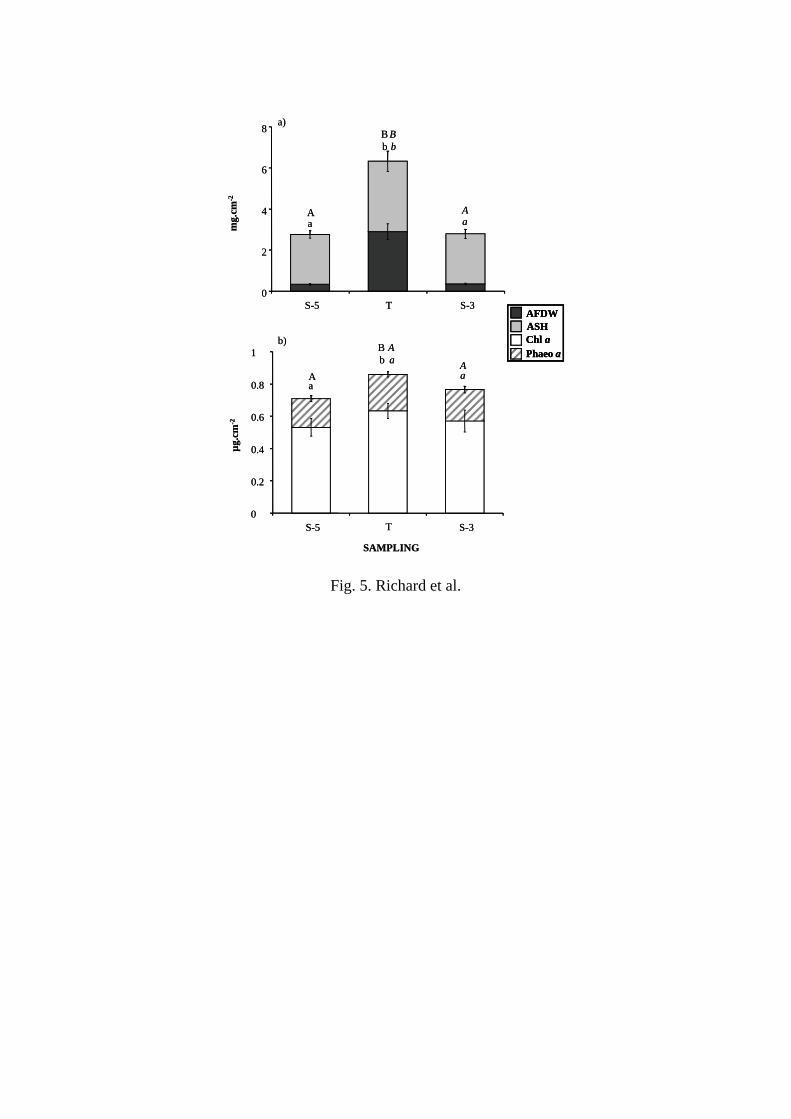
The mean DW, AFDW, Chl a and Phaeo a differed significantly between sampling methods232
(SAMPLING (S-5 vs. T); Table 3). Means were higher with the total sampling (T) than the S-233
5 sub-sampling method whatever the substrate type (Fig. 5a, b). It was particularly right for 234
periphyton quantity rather than quality. DW and AFDW determined through S-5 sampling 235
were 2 and 8 times, respectively lower than T means (Fig. 5a) whereas the mean of 236
chlorophyll pigment obtained with S-5 sampling corresponded to 82.6% of means obtained 237
with total sampling T (Fig. 5b). 238
239
Three sub-sampling240
241
Sampling was a significant source of variation for DW and AFDW (SAMPLING (S-3242
vs. T); Table 3). More DW and AFDW were measured with total sampling (T) than with the 243
S-3 sub-sampling method (Fig. 5a). As S-5 means, S-3 means of DW and AFDW were 2 and 244
8 times, respectively, lower than the T means (Fig. 5a). In contrast, Chl a and Phaeo a means 245
did not significantly differ between S-3 and T (Fig. 5b). 246
247
4. Discussion248
Variation sources of marine periphyton 12
249
4.1. Marine periphyton and its variation sources250
251
Marine periphyton252
A thin mat of matter was observed on all the immersed surface of the different types of 253
substrate after 15 days of submersion. The inorganic fraction of periphyton (ASH) could 254
originate from trapping of suspended inorganic particles. The latter would be favoured during 255
resuspension caused by wind driven turbulence or people working around units during 256
sampling. The organic matter (AFDW) fraction originated from the accumulation of detritus, 257
bacteria, fungi, flora and fauna on substrates. The presence of photosynthetic pigments (Chl a 258
and Phaeo a) could indicate flora colonization of artificial substrates. The presence of 259
phaeophytin a indicated that the flora observed was partly degraded (15 to 30 %). The mean 260
autotrophic index ranged between 250 (60-75 cm section of mosquito screen at T30d) and 261
9450 (wooden poles at T30d). These high values indicate that the periphyton contained mainly 262
heterotrophic organisms and dead organic matter, as specified by Huchette et al. (2000) for an 263
AI above 200. In situ observations showed that periphyton was also composed of detritus and 264
small-sized organisms as harpacticoid copepods (Richard et al., unpublished data). 265
266
Submersion time267
268
A significant increase of periphyton DW, AFDW and photosynthetic pigments was 269
shown on all substrate types. According to periphyton colonization models (Hoagland et al.,270
1982; Steinman, 1996), AFDW and Chl a levels increase exponentially until a biomass peak. 271
Organisms at the base of the biofilm become light and nutrient limited, eventually die and 272
detach from the substrate (Hansson et al., 1992; Asaeda et al., 2000; Keshavanath et al., 273

Variation sources of marine periphyton 13
2001a; Azim and Aseada, 2005). In this investigation, periphyton was still in its accretion274
phase on day 30 on all substrate types. As noted Eding et al. (2006), biofilm establishment 275
seems to be slower in marine than in freshwater. It would be better to wait a minimum of 4 276
weeks rather than 2 as Azim et al. (2001a, 2003b) did in freshwater, before introducing fish in 277
marine periphyton-based ponds. 278
279
Substrate type280
281
DW, AFDW, Chl a, Phaeo a and %Phaeo a varied according to substrate type. 282
Keshavanath et al. (2001) showed that biodegradable substrates could be more efficient than 283
synthetic substrates (eg. Bamboo vs. PVC tubes) because of the nutrient leaching that 284
occurred at the substrate-water interface (van Dam et al., 2002). In the same way, Anderson 285
and Underwood (1994) reported higher recruitment by epifauna on plywood than on 286
fibreglass or aluminium substrates in an estuary. In contrast, periphyton biomass was not 287
larger on natural (i.e. wooden poles) than on fiberglass strips in this study. 30 days-288
submersion time might have been too short to permit to a significant nutrient leaching at the 289
interface of wooden poles. Nevertheless, the periphyton grown on wooden poles contained 290
relative more phaeophytin (higher % Phaeo a) and non autotrophic matter (higher AI) than the 291
other substrates. The observed increase in AI could have originated from uptake of 292
decomposition products from the wood.293
More dry matter and Chl a were found on meshed substrates (mosquito and garden meshes) 294
than on smooth substrates (i.e. wood and fiber-glass). The meshes might favour the trapping 295
of particles, in contrast to smooth surfaces. Moreover, higher circulation of water and 296
nutrients across the meshed substrates could stimulate periphyton growth and explain this 297
result.298
Variation sources of marine periphyton 14
The substrate type could also influence the nature of the heterotrophic associated community. 299
Richard et al. (2007) observed that mesh substrates, as aquaculture pens, offered appropriate 300
structures for infauna, as Corophium sp. whereas newly submerged smooth substrate, 301
favoured epifauna recruitment. In this study, some polychaete tubes were observed on 302
mosquito screen, but not on smooth substrates. The results of this study indicate that more and 303
qualitatively better periphyton grew on mosquito screen than on the other substrates. 304
305
Submersion depth306
307
The light intensity and its spectral composition change with depth, influencing the308
quality and type of flora (Boston and Hill, 1991; Hansson, 1992; Kirk, 1994), as periphyton 309
(Goldsborough et al., 2005). In contrast to the observations of Azim et al. (2002a), periphyton 310
DW and chlorophyll pigments increased with depth in this investigation. A decrease of the 10 311
cm-water level at T30d could explain why less periphyton was collected on the 0-15 cm part of 312
substrates than on the deeper parts. Nevertheless, the lower chlorophyll pigment concentration 313
observed on the 15-60 cm part of substrates compared to the deeper part (60-75 cm) could be 314
due to a photo-inhibition processes, as Hansson (1992) suggested when periphyton Chl a was 315
negatively correlated with light. Unfortunately, light incidence was not measured during this316
study. 317
Maximal periphyton biomass could be observed where the combination of light and nutrient 318
are optimal (Hansson et al., 2002). In this way, periphyton observed on the deeper part of 319
substrates could have the advantage over the one observed on the surface part by benefiting 320
from nutrient released at the water-sediment interface. Moreover it could benefit from321
trapping suspended sediment and microphytobenthos present at the bottom of the pond. 322
323
Variation sources of marine periphyton 15
4.2. Comparisons 324
325
Sampling method326
327
The sum of 3 samples taken between 0-15 cm, 30-45 cm and 60-75 cm (S-3 method) 328
led to comparable Chl a and Phaeo a means with the ones obtained with total sampling (T). 329
That was not the case with S-5 method. Nevertheless, the DW and AFDW of the periphyton 330
collected with both sub-sampling methods (S-5 and S-3) were significantly lower than with 331
total sampling. The sub-sampling, especially the one of mesh substrates, necessitated extra 332
handling for cutting before periphyton collection. Each handling event results in losses,333
making both the S-5 and S-3 methods less accurate than whole unit sampling. Total sampling 334
was easier and more periphyton was collected. In further studies, the total sampling method 335
will be preferred to sub-sampling one. 336
In this investigation, the use of 200 ml of filtered salt-water for unit cleaning induced 337
over-estimation of periphyton weight. The DW, the ASH and the AFDW added when338
cleaning 750 cm²-periphyton substrate with 200 ml of 0.7 µm seawater of 32.55 ppt were 339
respectively 10.1, 8.1 and 2 mg.cm-2. These values are very important compared to the real 340
periphyton weight (Table 4), especially for DW and ASH. Without the salt correction, ASH 341
would be more than 6 times greater than the real values (with correction) at T15d and 3 times at 342
T30d. Analysis of three blanks of cleaning water should be envisaged at each sampling date in 343
subsequent studies. To avoid the salt correction, the use of milliQ water could be envisaged in 344
case where the determination of periphyton weight would be the only analysis to carry out on 345
the sampled unit. The periphyton fauna and flora could be analysed from other units cleaned 346
with filtered seawater to avoid osmotic shock of the living cells.347
348
Variation sources of marine periphyton 16
Periphyton in other aquatic systems349
350
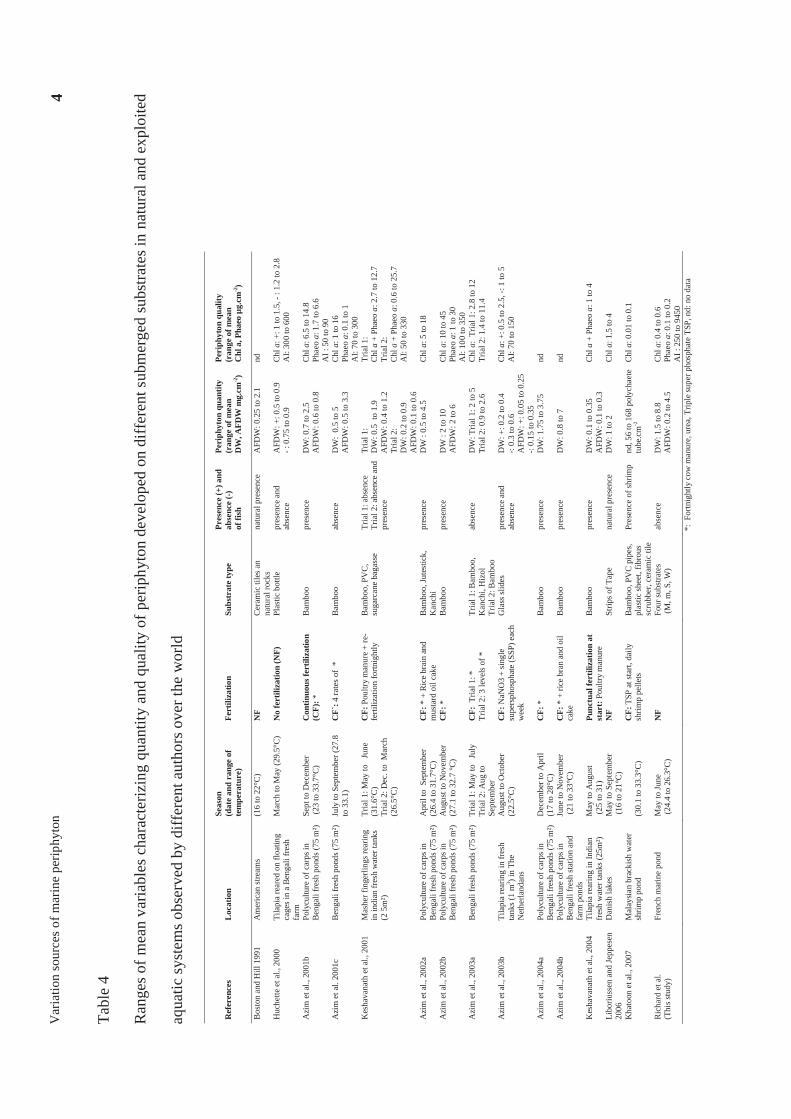
Absolute values which described the quantity and the quality of periphyton developed 351
on our substrates deployed in marine water were different with the one observed mainly in 352
freshwater by others authors (Table 4). The mean DW observed on our substrates reached 8.8353
mg.cm-2 on mosquito screen m at T30d (Table 4). This is relatively high since 10 studies out of354
13 found a DW < 5mg.cm-2. Maximal mean organic periphyton (AFDW) observed in this 355
study (4.5 mg.cm-2) was greater than means observed by others authors which generally did 356
not exceed 1 mg.cm-2 with the exception of Azim et al., 2002b (Table 4). In contrast to this 357
investigation, in most of the cited studies, periphyton substrates are simply removed from the 358
water causing probably a lot of loosely attached to be lost and could explain lower mean of 359
AFDW. The use of a tube with a stopper for substrate sampling is recommended to avoid 360
underestimation of periphyton development. 361
High autotrophic index of this investigation (Table 4) was induced by greater AFDW but also 362
by very low chlorophyll a concentration observed on substrates (0.4 to 0.6 µg.cm-2 ; Fig. 3b). 363
Numerous studies observed Chl a levels above 10-15 µg.cm-2 (Azim et al., 2001b,c, 2002a 364
2003a; Keshavanath et al., 2001; Table 4). Low periphyton concentration could originate 365
partly from the use of inert substrate (Huchette et al. 2000; Azim et al. 2003b; Liboriussen 366
and Jeppesen, 2006; This study: Table 4) rather than nutrient-leaching substrate (Azim et al., 367
2001b, 2002a, 2002b). Nevertheless, others factor could influence the primary productivity, 368
such as temperature, light and nutrient availability (Liboriussen and Jeppesen, 2005; Vermaat369
et al., 2005). The high densities of periphyton recorded by Azim et al. (2001b, 2002a, 2002b) 370
and Keshavanath et al. (2001) were observed in tropical ponds in Bangladesh and India with 371
more light and higher temperatures than in temperate ponds in France, in the Netherlands 372
(Azim et al., 2003b) or Denmark (Liboriussen and Jeppesen, 2006). It is the same in water 373
Variation sources of marine periphyton 17
column where mean Chl a was above 200 µg.L-1 in Bengali fresh ponds (Azim et al. 2002b), 374
whereas it was 5 µg.L-1 in our temperate marine pond. Productivity in freshwater is generally 375
higher than in marine water. However, the ponds were fertilized with urea, manure, food in 376
most studies listed in Table 4 whereas our pond was not fertilized. Azim et al. (2001c, 2003a) 377
showed that periphyton biomass increased with increasing fertilization rate up to a maximum. 378
Thus, in future studies, as part of EU policy of environmental protection and restoration of 379
coastal areas, fertilized effluents of intensive farms could be used to maximise periphyton 380
production and the associated production of herbivorous fishes. 381
382
The present investigation showed that (i) periphyton biomass in a marine pond 383
increased between day 15 and day 30, (ii) more periphyton was collected on mosquito screen 384
than on wooden poles, fiberglass strips or garden netting, (iii) periphyton biomass increased 385
with water depth submersion, (iv) sub-sampling methods underestimated periphyton 386
development compared to whole unit sampling, and (v) a correction of periphyton biomass 387
must be carried out for the dissolved inorganic salts present in marine or brackish systems388
using blank weight of cleaning salt filtered water. The use of a tube with stopper for substrate389
sampling will reduce periphyton sampling losses. Finally, the autotrophic fraction in the 390
periphyton communities was very low compared to periphyton developed on biodegradable 391
substrates used in fish cultures in fertilized tropical ponds. Thus, pond fertilization and use of 392
biodegraded substrates (i.e. long-time submerged wood) should be envisaged in further 393
studies on periphyton-based marine aquaculture in temperate regions. 394
395
Acknowledgements396
397
Variation sources of marine periphyton 18
This study has been carried out with the financial support from the Commission of the 398
European Communities, specific RTD programme “Specific Support to Policies”, SSP-2005-399
44483 “SEACASE - Sustainable extensive and semi-intensive coastal aquaculture in Southern 400
Europe”, and does not necessarily reflect the European Commission views and in no way 401
anticipates the Commission’s future policy in this area. This study was co-funded by the 402
IFREMER institute. This paper was written thanks to the administrative help of P. 403
Bustamante and L. Picard (CNRS, UMR 6250, University of La Rochelle). The authors thank 404
M. Prineau and N. Lachaussée for their advice and help during structure and substrate 405
construction. Thanks go to G. Colli, C. Couturier, N. Lachaussée, F. Mornet and L. Pavie for 406
their precious help in the field. Finally, authors thank A. Bodoy, M.L Begout, M. Breret, L. 407
Joassard, B. Lebreton and P. Richard for the loan of materials. 408
409
References410
Anderson, M.J., Underwood, A.J., 1994. Effects of substratum on the recruitment and 411
development of an intertidal estuarine fouling assemblage. J. Exp. Mar. Biol. Ecol. 184, 412
217-234.413
APHA, 1992. Standard Methods for the examination of water and wastewater. American 414
Public Health Association, Washington DC.415
Arnold, S.J., Sellars, M.J., Crocos, P.J., Coman, G.J., 2006. Intensive production of juvenile 416
tiger shrimp Penaeus monodon: An evaluation of stocking density and artificial substrates. 417
Aquaculture 261, 890-896.418
Asaeda, T., Son, H.D., 2000. Spatial structure and populations of a periphyton community: a 419
model and verification. Ecological Modelling 133, 195-207.420
Variation sources of marine periphyton 19
Azim, M.E., Asaeda, T., 2005. Periphyton structure, diversity and colonization. In: Azim, 421
M.E., Beveridge, M.C.M., van Dam, A.A., Verdegem, M.C.J. (Eds.), Periphyton: 422
Ecology, exploitation and management. CABI Publishing, pp. 15-34.423
Azim, M.E., A, M., Wahab, M.A., Verdegem, M.C.J., 2003a. Periphyton-water quality 424
relationships in fertilized fishponds with artificial substrates. Aquaculture 228, 169-187.425
Azim, M.E., Verdegem, M.C.J., van Dam, A.A., Beveridge, M.C.M., 2005. Periphyton: 426
Ecology, exploitation and management. CABI Publishing, 319 pp.427
Azim, M.E., Wahab, M.A., van Dam, A.A., Beveridge, M.C.M., verdegem, M.C.J., 2001a. 428
The potential of periphyton-based culture of two Indian major carps, rohu Labeo rohita429
(Hamilton) and gonia Labeo gonius (Linnaeus). Aquacult. Res. 32, 209-216.430
Azim, M.E., Rahaman, M.M., Wahab, M.A., Asaeda, T., Little, D.C., Verdegem, M.C.J., 431
2004b. Periphyton-based pond polycultre system: a bioeconomic comparison of on-farm 432
and on-station trials. Aquaculture 242, 381-396.433
Azim, M.E., Verdegem, M.C.J., Singh, M., van Dam, A.A., Beveridge, M.C.M., 2003b. The 434
effects of periphyton substrate and fish stocking density on water quality, phytoplankton, 435
periphyton and fish growth. Aquacult. Res. 34.436
Azim, M.E., Verdegem, M.C.J., Khatoon, H., Wahab, M.A., van Dam, A.A., Beveridge, 437
M.C.M., 2002a. A comparison of fertilization, feeding and three periphyton substrates for 438
increasing fish production in freshwater pond aquaculture in Bangladesh. Aquaculture 439
212.440
Azim, M.E., Verdegem, M.C.J., Rahaman, M.M., Wahab, M.A., van Dam, A.A., Beveridge, 441
M.C.M., 2002b. Evaluation of polyculture of Indian major carps in periphyton-based 442
pond. Aquaculture 131-149.443
Variation sources of marine periphyton 20
Azim, M.E., Wahab, M.A., Biswas, P.K., Asaeda, T., Fujino, T., Verdegem, M.C.J., 2004a. 444
The effect of periphyton substrate density on production in freshwater polyculture ponds. 445
Aquaculture 232, 441-453.446
Azim, M.E., Wahab, M.A., van Dam, A.A., Beveridge, M.C.M., Huisman, E.A., Verdegem, 447
M.C.J., 2001b. Optimization of stocking ratios of two Indian major carps, rohu (Labeo 448
rohita Ham.) and catla (Catla catla Ham.) in a periphyton-based aquaculture system. 449
Aquaculture, 33-49.450
Azim, M.E., Wahab, M.A., van Dam, A.A., Beveridge, M.C.M., Milstein, A., Verdegem, 451
M.C.J., 2001c. Optimization of fertilization rate for maximizing periphyton production on 452
artificial substrates and the implications for periphyton-based aquaculture. Aquacult. Res. 453
32, 749-760.454
Boston, H.L., Hill, W.R., 1991. Photosynthesis-light relations of stream periphyton 455
communities. Limnol. Oceanogr. 36, 644-656.456
Bratvold, D., Browdy, C.L., 2001. Effects of sand sediment and vertical surfaces 457
(AquaMatsTM) on production, water quality, and microbiological ecology in an intensive 458
Litopenaeus vannamei culture system. Aquaculture 195, 81-94.459
Brown, M.B., Forsythe, A.B., 1974. Robust tests for the equality of variances. J. Am. Stat. 460
Ass. 69, 364-367.461
Byers, S.C., Mills, E.L., Stewart, P.L., 1978. A comparison of methods of determining 462
organic carbon in marine sediments, with suggestions for a standard method. 463
Hydrobiologia 58, 43-47.464
Conceição, L.E.C., Cunha, M. E., Yúfera, M., Hussenot, J., Blachier, P., Anras, L., Bailly, D., 465
Marino, G., Cataudella, S., Patarnello, T., Divanach, P., Kentouri, M. and M.T. Dinis, 466
2007. Sustainable extensive and semi-intensive coastal aquaculture in Southern Europe –467
Variation sources of marine periphyton 21
the SEACASE project. In Competing claims Aquaculture Europe 07, book of abstracts, p 468
120.469
Eding, E.H., Kamstra, A., Verreth, A.V., Huisman, E.A., Klapwijk, A., 2006. Design and 470
operation of nitrifying trickling filters in recirculating aquaculture: A review. Aquacult. 471
Eng. 34, 234-260.472
Goldsborough, L.G., McDougal, R.L., North, A.K., 2005. Periphyton in freshwater lakes and 473
wetlands, Periphyton: Ecology, exploitation and management. CABI Publishing, pp. 71-474
98.475
Hansson, L.A., 1992. Factors regulating periphytic algal biomass. Limnol. Oceanogr. 37, 322-476
328.477
Hoagland, K.D., Roemer, S.C., Rosowski, J.R., 1982. Colonization and community structure 478
of two periphyton assemblages with emphasis on the diatoms (Bacillariophyceae). Am. J. 479
Bot. 69, 188-213.480
Huchette, S.M.H., Beveridge, M.C.M., 2005. Periphyton-based cage aquaculture, Periphyton: 481
Ecology, exploitation and management. CABI Publishing, pp. 237-245.482
Huchette, S.M.H., Beveridge, M.C.M., Baird, D.J., Ireland, M., 2000. The impacts of grazing 483
by tilapias (Oreochromis niloticus L.) on periphyton communities growing on artificial 484
substrate in cages. Aquaculture 186, 45-60.485
Kawamura, T., Roberts, R.D., Takami, H., 2005. Importance of periphyton in Abalone 486
culture, Periphyton: Ecology, exploitation and management. CABI Publishing.487
Keshavanath, P., Gangadhar, B., Ramesh, T.J., van Dam, A.A., Beveridge, M.C.M., 488
Verdegem, M.C.J., 2004. Effects of bamboo substrate and supplemental feeding on 489
growth and production of hybrid red tilapia fingerlings (Oreochronis mossambicus x490
Oreochromis niloticus). Aquaculture 235, 303-314.491
Variation sources of marine periphyton 22
Keshavanath, P., Gangadhar, B., Ramesh, T.J., van Rooij, J.M., Beveridge, M.C.M., Baird, 492
D.J., Verdegem, M.C.J., van Dam, A.A., 2001. Use of articicial substrates to enhance 493
production of freshwater herbivorous fish in pond culture. Aquacult. Res. 32.494
Khatoon, H., Yusoff, F., Banerjee, S., Shariff, M., Sidik Bujang, J., 2007. Formation of 495
periphyton biofilm and subsequent biofouling on different substrates in nutrient 496
enriched brackishwater shrimp ponds. Aquaculture 273, 470-477.497
Kirk, J.T.O., 1994. Light and photosynthesis in Aquatic ecosystems. Cambridge University 498
Press, Cambridge, Massachussetts.499
Liboriussen, L., Jeppesen, E., 2003. Temporal dynamics in epipelic, pelagic and epiphytic 500
algal production in a clear and a turbid shadow lake. Freshw. Biol. 48, 418-431.501
Liboriussen, L., Jeppesen, E., 2006. Structure, biomass, production and depth distribution of 502
periphyton on artificial substratum in shallow lakes with contrasting nutrient 503
concentrations. Freshw. Biol. 51, 95-109.504
Liboriussen, L., Jeppesen, E., Bramm, M.E., Majbritt, F.L., 2005. Periphyton 505
macroinvertebrate interactions in light and fish manipulated enclosures in a clear and a 506
turbid shallow lake. Aquat. Ecol. 39, 23-29.507
Moss, K.R.K., Moss, S.M., 2004. Effects of artificial substrate and stocking density on the 508
nursery production of pacific white shrimp Litopenaeus vannamei. J. world Aquacult. 509
Soc. 35, 536-542.510
Motoda, 1959. Devices of simple plankton apparauts. Memoirs. Faculty of Fisheries. 511
Hokkaido University 7, 73-94.512
Ramesh, T.J., Shankar, K.M., Mohan, C.V., Varghese, T.J., 1999. Comparison of three plant 513
substrates for enhancing carp growth through bacterial biofilm. Aquac. Eng. 19, 119-131.514
Richard, M., Archambault, P., Thouzeau, G., McKindsey, C.W., Desrosiers, G., 2007. 515
Influence of suspended scallop cages and mussel lines on pelagic and benthic 516
Variation sources of marine periphyton 23
biogeochemical fluxes in Havre-aux-Maisons Lagoon, Îles-de-la-Madeleine (Quebec, 517
Canada). Can. J. Fish. Aquat. Sci. 64, 1491-1505.518
Shapiro, S.S., Wilk, M.B., 1965. An analysis of variance test for normality (complete 519
samples). Biometrika 52, 591-611.520
Steinman, A.D., 1996. Effect of grazers on freshwater benthic algae, Algal ecology: 521
freshwater benthic ecosystems. Academic Press, San Diego, California, pp. 341-373.522
Umesh, N.R., Shankar, K.M., Mohan, C.V., 1999. Enhancing growth of common carp, rohu 523
an Mozambique tilapia through plant substrate: the role of bacterial biofilm. Aquac. Int. 7, 524
251-260.525
van Dam, A.A., Beveridge, M.C.M., Azim, M.E., Verdegem, M.C.J., 2002. The potential of 526
fish production based on periphyton. Rev. Fish Biol. Fish. 12, 1-31.527
Vermaat, J.E., 2005. Periphyton dynamics and influencing factors. In: Azim, M.E., 528
Beveridge, M.C.M., van Dam, A.A., Verdegem, M.C.J. (Eds.), Periphyton: Ecology, 529
exploitation and management. SPI publisher systems, pp. 35-49.530
Welcomme, R.L., 1972. An evaluation of the acadja methods of fishing as practised in the 531
coastal lagoons of Dahomey (West Africa). J. Fish Biol. 4, 39-45.532
533
Variation sources of marine periphyton 1
Tables
Table 1
Results of analyses of variance (ANOVAs) testing the effect of substrate type (TYPE: W:
wooden poles, S: fiber-glass strip, m: mosquito screen, M: garden netting), submersion time
(TIME: T15d, T30d) and their interactions on periphyton dry weight (DW), ash free dry weight
(AFDW), Chlorophyll a (Chl a), Phaeophytin (Phaeo a), % Phaeo a (Phaeo a.(Chl a + Phaeo
a)-1) and autotrophic index (AI: AFDW.Chl a-1) observed on collected substrates. df: degrees
of freedom, MS: mean square, F: Fischer, * P < 0.05, ** P < 0.01, *** P < 0.001
Variation
sourcedf MS F P MS F P MS F P
TYPE 3 0.473 6.71 0.0022 ** 0.552 6.79 0.0021 ** 2E+07 8.48 0.0006 ***TIME 1 7.521 106.71 < 0.0001 *** 6.244 76.86 < 0.0001 *** 1E+08 32.82 < 0.0001 ***TYPE x TIME 3 0.197 2.79 0.0645 0.119 1.46 0.2529 2E+07 6.00 0.0038 **Error 22 0.070 0.081 3E+06
TYPE 3 0.157 15.89 < 0.0001 *** 0.013 6.46 0.0025 ** 217.81 20.98 < 0.0001 ***TIME 1 0.202 20.43 0.0002 *** 0.105 52.08 < 0.0001 *** 119.05 11.47 0.0025 **TYPE x TIME 3 0.028 2.82 0.0615 0.004 1.86 0.1643 53.40 5.14 0.0072 **Error 23 0.010 0.002 10.38
log (AFDW + 1)
Chl a % Phaeo a
AI
Phaeo a
log DW
Table(s)
Variation sources of marine periphyton 2
Table 2
Results of ANOVAs testing the effect of substrate type (TYPE: W: wooden poles, S: fiber-
glass strips, m: mosquito screen, M: garden netting), submersion depth (DEPTH: 1: 0-15 cm;
2: 15-30 cm; 3: 30-45 cm, 4: 45-60 cm, 5: 60-75 cm) and their interactions on Periphyton dry
weight (DW), ash free dry weight (AFDW), chlorophyll (Chl a), phaeophytin (Phaeo a) and
% Phaeo a (Phaeo a.(Chl a + Phaeo a)-1) and autotrophic index (AI: AFDW.Chl a-1) observed
on collected substrates. df: degrees of freedom, SS: sum square, MS: mean square, F: Fischer,
* P < 0.05, ** P < 0.01, *** P < 0.001
Variation
sourcedf MS F P MS F P MS F P
TYPE 3 0.02 0.21 0.8904 0.02 1.35 0.2786 3.21 6.38 0.0021 **DEPTH 4 0.36 3.48 0.0204 * 0.05 2.64 0.0556 3.72 7.40 0.0004 ***TYPE x DEPTH 12 0.05 0.53 0.8774 0.01 0.79 0.6563 0.50 0.99 0.4823Error 27 0.10 0.02 0.50
TYPE 3 1.87 21.56 < 0.0001 *** 0.39 2.07 0.1255 375.89 20.87 < 0.0001 ***DEPTH 4 8.02 92.26 < 0.0001 *** 7.76 40.86 < 0.0001 *** 36.88 2.05 0.1128TYPE x DEPTH 12 0.11 1.31 0.2658 0.25 1.32 0.2587 30.57 1.70 0.1176Error 30 0.09 0.19 18.01
log Chl a log Phaeo a % Phaeo a
!DW log (AFDW + 1) log AI
Variation sources of marine periphyton 3
Table 3
Results of ANOVAs testing the effect of periphyton sampling method (SAMPLING: T: total
vs. S-5: addition of all five sub-samples and vs. S-3: addition of three sub-samples 0: 0-15
cm, 3: 30-45, 5: 60-75 cm), substrate type (TYPE: W: wooden poles, S: fiber-glass strips, m:
mosquito screen, M: garden netting) and their interactions on Periphyton dry weight (DW),
ash free dry weight (AFDW), Chlorophyll a (Chl a) and phaeophytin (Phaeo a) observed on
collected substrates. df: degrees of freedom, MS: mean square, F: Fischer, * P < 0.05, ** P <
0.01, *** P < 0.001
Variation
sourcedf MS F P MS F P MS F P MS F P
SAMPLING (S-5 vs. T) 1 3.838 74.62 < 0.0001 *** 24.383 130.80 < 0.0001 *** 0.085 9.30 0.0069 ** 0.017 6.46 0.0205 *TYPE 3 0.118 2.30 0.1124 0.626 3.36 0.0419 * 0.156 17.09 < 0.0001 *** 0.008 3.09 0.0532SAMPLING x TYPE 3 0.109 2.11 0.1342 0.454 2.44 0.0980 0.028 3.08 0.0537 0.007 2.67 0.0786Error 18 0.051 0.186 0.009 0.003
SAMPLING (S-3 vs.T) 1 3.833 65.13 < 0.0001 *** 23.978 119.66 < 0.0001 *** 0.038 3.03 0.0986 0.008 2.94 0.1034TYPE 3 0.129 2.19 0.1249 0.680 3.39 0.0406 * 0.194 15.61 < 0.0001 *** 0.009 3.35 0.0421 *SAMPLING x TYPE 3 0.105 1.79 0.1858 0.368 1.84 0.1763 0.029 2.34 0.1074 0.007 2.53 0.0895Error 18 0.059 0.200 0.012 0.003
Phaeo alog DW log AFDW Chl a
Var
iati
on s
ourc
es o
f m
arin
e pe
riph
yton
4
Tab
le 4
Ran
ges
of m
ean
vari
able
s ch
arac
teri
zing
qua
ntit
y an
d qu
alit
y of
per
iphy
ton
deve
lope
d on
dif
fere
nt s
ubm
erge
dsu
bstr
ates
in n
atur
al a
nd e
xplo
ited
aqua
tic
syst
ems
obse
rved
by
diff
eren
t aut
hors
over
the
wor
ld
Refe
ren
ces
Loca
tion
Sea
son
(date
an
d r
an
ge
of
tem
per
atu
re)
Fer
tili
zati
on
Su
bst
rate
typ
e
Pre
sen
ce (
+)
an
d
ab
sen
ce (
-)
of
fish
Per
iph
yto
n q
uan
tity
(ran
ge
of
mea
n
DW
, A
FD
W m
g.c
m-2
)
Per
iph
yt o
n q
uali
ty
(ran
ge
of
mea
n
Ch
l a,
Ph
aeo
µg.c
m-2
)
Bos
ton
and
Hill
199
1A
mer
ican
str
eam
s(1
6 to
22°
C)
NF
Cer
amic
tile
s an
na
tura
l roc
ksna
tura
l pre
senc
eA
FDW
: 0.2
5 to
2.1
nd
Huc
hett
eet
al.,
200
0T
ilapi
a re
ared
on
floa
ting
cage
s in
a B
enga
li f
resh
fa
rm
Mar
ch to
May
(29
.5°C
)N
o f
erti
liza
tion
(N
F)
Pla
stic
bot
tlepr
esen
ce a
ndab
senc
eA
FDW
: +: 0
.5 to
0.9
- : 0
.75
to 0
.9C
hl a
: +: 1
to 1
.5, -
: 1.
2 to
2.8
AI:
300
to 6
00
Azi
met
al.,
200
1bP
olyc
ultu
re o
f ca
rps
in
Ben
gali
fre
sh p
onds
(75
m²)
Sep
t to
Dec
embe
r (
23 to
33.
7°C
)C
on
tin
uou
s fe
rtil
izati
on
(CF
): *
Bam
boo
pres
ence
DW
: 0.7
to 2
.5A
FDW
: 0.6
to 0
.8C
hl a
: 6.5
to 1
4.8
Pha
eo a
: 1.7
to 6
.6A
I : 5
0 to
90
Azi
m e
t al.
2001
cB
enga
li f
resh
pon
ds (
75 m
²)Ju
ly to
Sep
tem
ber
(27.
8 to
33.
1)C
F`:
4 r
ates
of
*B
ambo
oab
senc
eD
W:
0.5
to 5
AFD
W: 0
.5 to
3.3
Chl
a: 1
to 1
6P
haeo
a: 0
.1 to
1A
I: 7
0 to
300
Kes
hava
nath
et a
l., 2
001
Mas
her
fing
erli
ngs
rear
ing
in in
dian
fre
sh w
ater
tank
s (2
5m
²)
Tri
al 1
: May
to
June
(3
1.6°
C)
Tri
al 2
: Dec
. to
Mar
ch
(26.
5°C
)
CF
: P
oult
ry m
anur
e +
re-
fert
iliz
atio
n fo
rtni
ghtl
yB
ambo
o, P
VC
, su
garc
ane
baga
sse
Tri
al 1
: abs
ence
Tri
al 2
: abs
ence
and
pr
esen
ce
Tri
al 1
:D
W: 0
.5 t
o 1.
9A
FDW
: 0.4
to 1
.2T
rial
2:
DW
: 0.2
to 0
.9A
FDW
: 0.1
to 0
.6
Tri
al 1
:C
hl a
+ P
haeo
a: 2
.7 to
12.
7T
rial
2:
Chl
a +
Pha
eo a
: 0.6
to 2
5.7
AI:
50
to 3
30
Azi
met
al.,
200
2aP
olyc
ultu
re o
f ca
rps
in
Ben
gali
fre
sh p
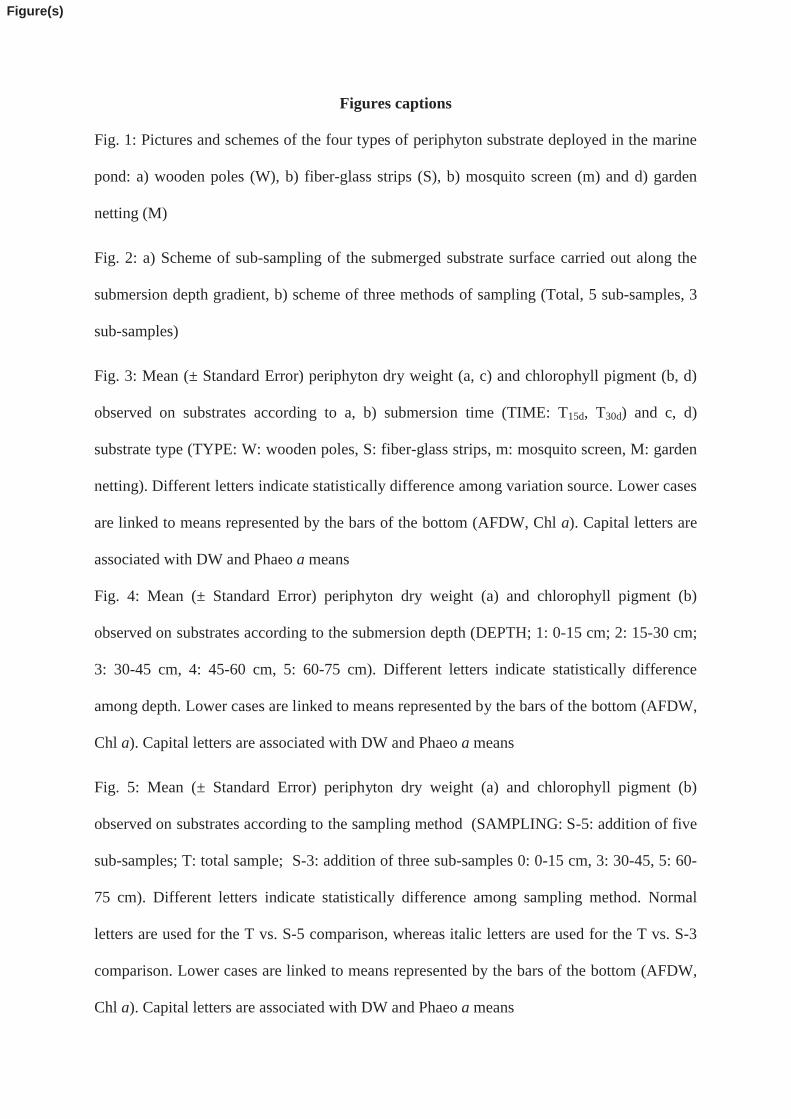
onds
(75
m²)
Apr
il to
Sep
tem
ber
(26.
4 to
31.
7°C
)C
F:
* +
Ric
e br
ain
and
mus
tard
oil
cak
eB
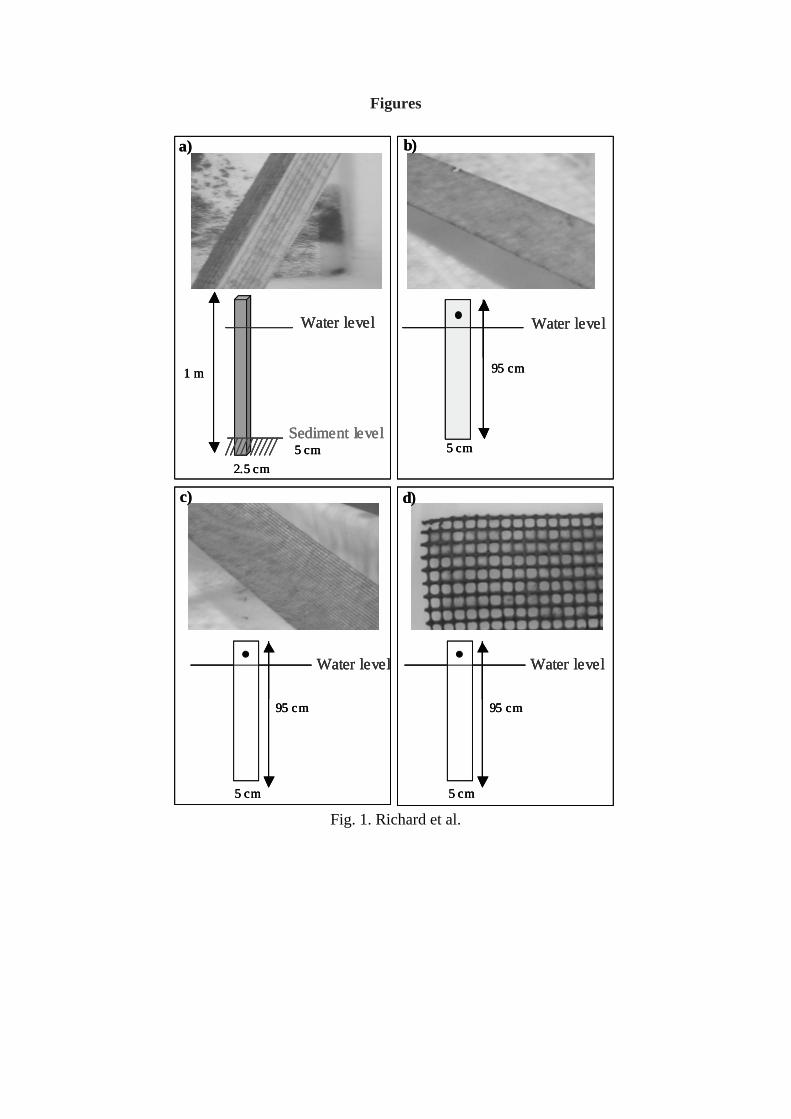
ambo
o, J
utes
tick
, K
anch
ipr
esen
ceD
W :
0.5
to 4
.5C
hl a
: 5 to
18
Azi
met
al.,
200
2bP
olyc
ultu
re o
f ca
rps
in
Ben
gali
fre
sh p
onds
(75
m²)
Aug
ust t
o N
ovem
ber
(27.
1 to
32.
7 °C
)C
F:
*B
ambo
opr
esen
ceD
W: 2
to 1
0A
FDW
: 2 to
6C
hl a
: 10
to 4
5P
haeo
a: 1
to 3
0A
I: 1
00 to
350
Azi
m e
t al.,
200
3aB
enga
li f
resh
pon
ds (
75 m
²)T
rial
1: M
ay to
Ju
lyT
rial
2: A
ug to
S
epte
mbe
r
CF
: T
rial
1: *
Tri
al 2
: 3 le
vels
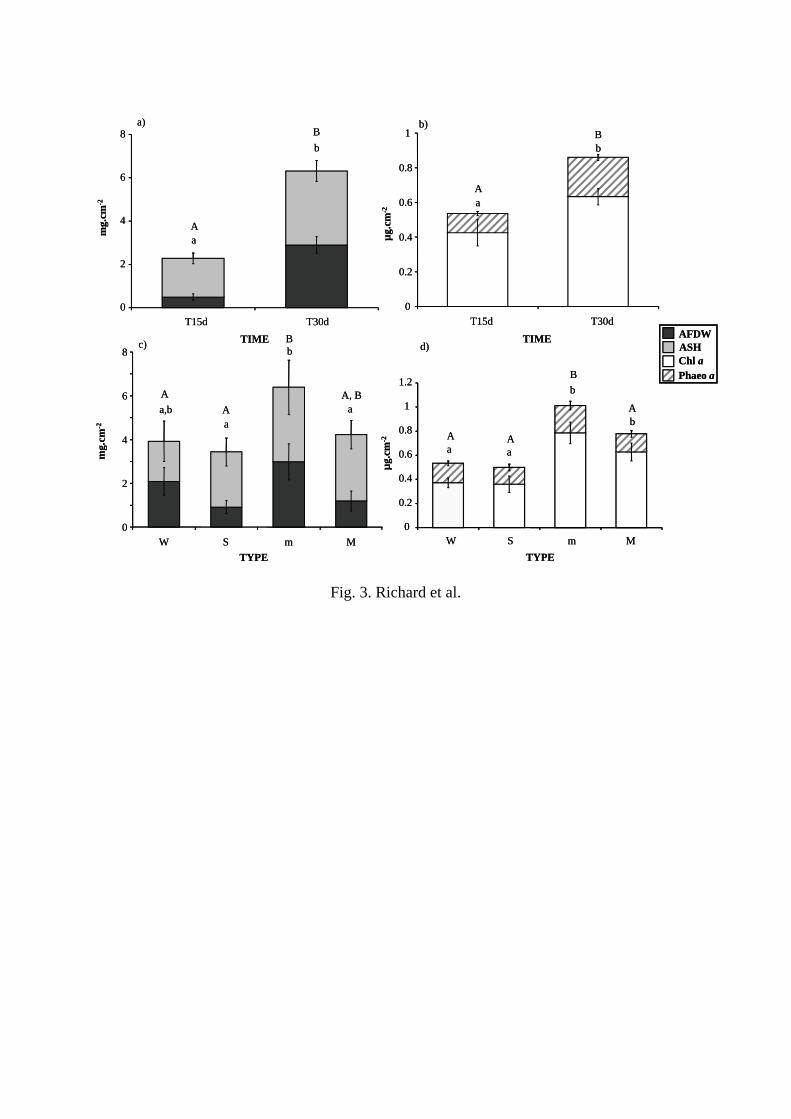
of
*T
rial
1: B
ambo
o,
Kan
chi,
Hiz
olT
rial
2: B
ambo
o
abse
nce
DW
: Tri
al 1
: 2 t
o 5
Tri
al 2
: 0.9
to 2
.6C
hl a
: T
rial
1: 2
.8 to
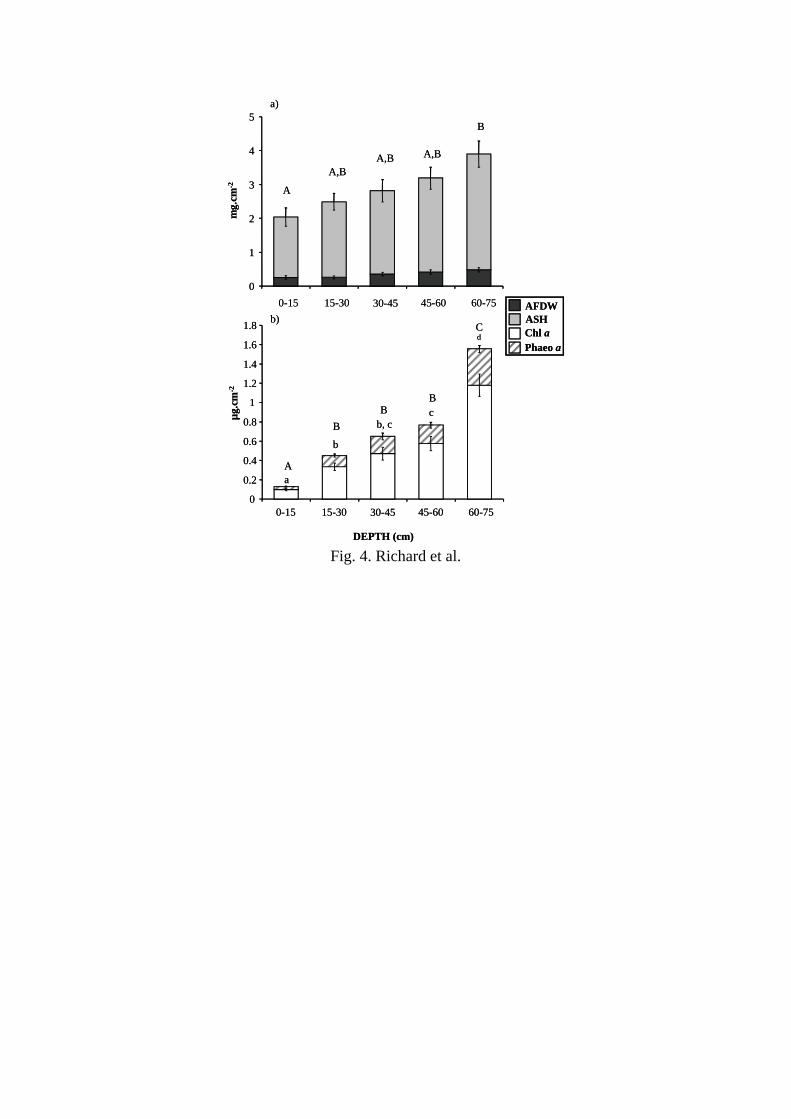
12
Tri
al 2
: 1.4
to 1
1.4
Azi
met
al.,
200
3bT
ilapi
a re
arin
g in
fre
sh
tank
s (1
m3 )
in T
he
Ne t
herl
anda
ns
Aug
ust t
o O
ctob
er
(22.
5°C
)C
F:
NaN
O3
+ s
ingl
e su
pers
phos
phat
e (S
SP)
eac
h w
eek
Gla
ss s
lide
spr
esen
ce a
nd
abse
nce
DW
: +: 0
.2 to
0.4
-: 0
.3 to
0.6
AFD
W: +
: 0.0
5 to
0.2
5-:
0.1
5 to
0.3
5
Chl
a: +
: 0.5
to 2
.5, -
: 1 to
5A
I: 7
0 to
150
Azi
met
al.,
200
4aP
olyc
ultu
re o
f ca
rps
in
Ben
gali
fre
sh p
onds
(75
m²)
Dec
embe
r to
Apr
il
(17
to 2
8°C
)C
F:
*B
ambo
opr
esen
ceD
W: 1
.75
to 3
.75
nd
Azi
met
al.,
200
4bP
olyc
ultu
re o
f ca
rps
in
Ben
gali
fre
sh s
tati
on a
nd
farm
pon
ds
June
to N
ovem
ber
(21
to 3
3°C
)C
F:
* +
ric
e br
an a
nd o
il
cake
Bam
boo
pres
ence
DW
: 0.8
to 7
nd
Kes
hava
nath
et a
l., 2
004
Tila
pia
rear
ing
in I
ndia
n fr
esh
wat
er ta
nks
(25m
²)M
ay to
Aug
ust
(25
to 3
1)P
un
ctu
al
fert
iliz
ati
on
at
start
: P
oult
ry m
anur
e B
ambo
opr
esen
ceD
W: 0
.1 to
0.3
5A
FDW
: 0.1
to 0
.3C
hl a
+ P
haeo
a: 1
to 4
Lib
oriu
ssen
and
Jep
pese
n 20
06D
anis
h la
kes
May
to S
epte
mbe
r (
16 to
21°
C)
NF
Str
ips
of T
ape
natu
ral p
rese
nce
DW
: 1 to
2C
hl a
: 1.5
to 4
Kha
toon
et a
l., 2
007
Mal
aysi
an b
rack
ish
wat
er
shri
mp
pond
(30.
1 to
33.
3°C
)C
F:
TSP
at s
tart
, dai
ly
shri
mp
pelle
tsB
ambo
o, P
VC
pip
es,
plas
tic s
heet
, fib
rous
sc
rubb
er, c
eram
ic ti
le
Pre
senc
e of
shr
imp
nd, 5
6 to
168
pol
ycha
ete
tube
.cm
-2C
hla
: 0.0
1 to
0.1
Ric
hard
et a
l.(T
his
stud
y)F
renc
h m
arin
e po
ndM
ay to
Jun
e (
24.4
to 2
6.3°
C)
NF
Fou
r su
bstr
ates
(M
, m, S
, W)
abse
nce
DW
: 1.5
to 8
.8A
FDW
: 0.2
to 4
.5C
hl a
: 0.4
to 0
.6P
haeo
a: 0
.1 to
0.2
AI
: 250
to 9
450
*: F
ortn
ight
ly c
ow m
anur
e, u
rea,
Tri
ple
supe
r ph
osph
ate
TSP
, nd:
no
data

Variation sources of marine periphyton 5
Figures captions
Fig. 1: Pictures and schemes of the four types of periphyton substrate deployed in the marine
pond: a) wooden poles (W), b) fiber-glass strips (S), b) mosquito screen (m) and d) garden
netting (M)
Fig. 2: a) Scheme of sub-sampling of the submerged substrate surface carried out along the
submersion depth gradient, b) scheme of three methods of sampling (Total, 5 sub-samples, 3
sub-samples)
Fig. 3: Mean (± Standard Error) periphyton dry weight (a, c) and chlorophyll pigment (b, d)
observed on substrates according to a, b) submersion time (TIME: T15d, T30d) and c, d)
substrate type (TYPE: W: wooden poles, S: fiber-glass strips, m: mosquito screen, M: garden
netting). Different letters indicate statistically difference among variation source. Lower cases
are linked to means represented by the bars of the bottom (AFDW, Chl a). Capital letters are
associated with DW and Phaeo a means
Fig. 4: Mean (± Standard Error) periphyton dry weight (a) and chlorophyll pigment (b)
observed on substrates according to the submersion depth (DEPTH; 1: 0-15 cm; 2: 15-30 cm;
3: 30-45 cm, 4: 45-60 cm, 5: 60-75 cm). Different letters indicate statistically difference
among depth. Lower cases are linked to means represented by the bars of the bottom (AFDW,
Chl a). Capital letters are associated with DW and Phaeo a means
Fig. 5: Mean (± Standard Error) periphyton dry weight (a) and chlorophyll pigment (b)
observed on substrates according to the sampling method (SAMPLING: S-5: addition of five
sub-samples; T: total sample; S-3: addition of three sub-samples 0: 0-15 cm, 3: 30-45, 5: 60-
75 cm). Different letters indicate statistically difference among sampling method. Normal
letters are used for the T vs. S-5 comparison, whereas italic letters are used for the T vs. S-3
comparison. Lower cases are linked to means represented by the bars of the bottom (AFDW,
Chl a). Capital letters are associated with DW and Phaeo a means
Figure(s)
Figures
1 m
5 cm
2.5 cm
Sediment level
Water level
95 cm
Water level
5 cm
a) b)
c) d)
95 cm
Water level
5 cm
95 cm
Water level
5 cm
1 m
5 cm
2.5 cm
Sediment level
Water level
95 cm
Water level
5 cm
1 m
5 cm
2.5 cm
Sediment level
Water level
95 cm
Water level
5 cm
a) b)
c) d)
95 cm
Water level
5 cm
95 cm
Water level
5 cm
95 cm
Water level
5 cm
95 cm
Water level
5 cm
Fig. 1. Richard et al.

b)
0
15
30
45
60
75
1
2
3
4
5Su
bm
ers
ion
dep
ht
gra
die
nt
(cm
) 1
2
3
4
5
1
3
5
Total sampleT
5 sub-samplesS-5
3 sub-samplesS-3
a) Sub-sampling b)
0
15
30
45
60
75
1
2
3
4
5Su
bm
ers
ion
dep
ht
gra
die
nt
(cm
) 1
2
3
4
5
1
3
5
Total sampleT
5 sub-samplesS-5
3 sub-samplesS-3
a) Sub-sampling
Fig.2. Richard et al.
T15d T30d
TIME
mg.c
m-2
a)
mg.c
m-2
c)
TYPE
0
2
4
6
8
A
B
a
b
0
2
4
6
8
W S m M
A
AA, B
B
a,ba
b
a
0
0.2
0.4
0.6
0.8
1
T15d T30d
B
a
b
µg
.cm
-2
TIME
b)
0
0.2
0.4
0.6
0.8
1
1.2
W S m M
B
A A
A
a a
b
b
µg.c
m-2
d)
TYPE
A
AFDW
ASH
Chl a
Phaeo a
T15d T30d
TIME
mg.c
m-2
a)
mg.c
m-2
c)
TYPE
0
2
4
6
8
A
B
a
b
0
2
4
6
8
W S m M
A
AA, B
B
a,ba
b
a
0
0.2
0.4
0.6
0.8
1
T15d T30d
B
a
b
µg
.cm
-2
TIME
b)
0
0.2
0.4
0.6
0.8
1
1.2
W S m M
B
A A
A
a a
b
b
µg.c
m-2
d)
TYPE
A
AFDW
ASH
Chl a
Phaeo a
Fig. 3. Richard et al.
0-15 15-30 30-45 45-60 60-75
0
0.2
0.4
0.6
0.8
1
1.2
1.4
1.6
1.8
A
C
a
b
b, cc
d
B
BB
DEPTH (cm)
µg
.cm
-2m
g.c
m-2
a)
b)AFDW
ASH
Chl a
Phaeo a
0-15 15-30 30-45 45-60 60-75
0
1
2
3
4
5
A
A,BA,B A,B
B
0-15 15-30 30-45 45-60 60-75
0
0.2
0.4
0.6
0.8
1
1.2
1.4
1.6
1.8
A
C
a
b
b, cc
d
B
BB
DEPTH (cm)
µg
.cm
-2m
g.c
m-2
a)
b)AFDW
ASH
Chl a
Phaeo a
0-15 15-30 30-45 45-60 60-75
0
1
2
3
4
5
A
A,BA,B A,B
B
Fig. 4. Richard et al.
SAMPLING
T
µg
.cm
-2m
g.c
m-2
a)
b)
0
0.2
0.4
0.6
0.8
1
S-5 S-3
A
B
a
b A
aA
a
0
2
4
6
8
S-5 T S-3
A
B
a
b B
b
A
a
AFDW
ASH
Chl a
Phaeo a
SAMPLING
T
µg
.cm
-2m
g.c
m-2
a)
b)
0
0.2
0.4
0.6
0.8
1
S-5 S-3
A
B
a
b A
aA
a
0
2
4
6
8
S-5 T S-3
A
B
a
b B
b
A
a
AFDW
ASH
Chl a
Phaeo a
AFDW
ASH
Chl a
Phaeo a
Fig. 5. Richard et al.