THE EFFECT OF CHANGING THE SALINITY OF SEA WATER ON FILTER FEEDING IN MUSSELS
33
Pp0 | Page THE EFFECT OF CHANGING THE SALINITY OF SEA WATER ON FILTER FEEDING IN MUSSELS By Jordan Davidson Abstract: The aim of this investigation was to determine if changing the salinity of seawater affected the rate of filter feeding in the common mussel (Mytilus edulis). The affect was observed through the use of spectrophotometry, a common technique used to measure absorption rate. A dye was added to the different seawater concentrations and from this the absorption rate of the dye was measured using the spectrophotometer. This demonstrated the rate of filter feeding in different salinities. It was discovered and concluded that mussels filter feed optimally in pure (100%) seawater but are able to adapt to their surrounding environment when placed in the solution of 75% Seawater. However a decrease in the rate still occurred. In saline conditions below 75% Seawater the rate of filter feeding decreased rapidly until filter feeding nearly stopped completely, showing mussels have the ability to withstand environmental fluctuations to an extent but at lower salinities, filter feeding is affected considerably. 2014
-
Upload
independent -
Category
Documents
-
view
0 -
download
0
Transcript of THE EFFECT OF CHANGING THE SALINITY OF SEA WATER ON FILTER FEEDING IN MUSSELS

Pp0 | P a g e
THE EFFECT OF CHANGING THE SALINITY OF SEA WATER ON FILTER FEEDING IN MUSSELSBy Jordan DavidsonAbstract:
The aim of this investigation was to determine if changing the salinity of seawater affected the rate of filter feeding in the common mussel (Mytilus edulis). The affect was observed through the use of spectrophotometry, a common technique used to measure absorption rate. A dye was added to the different seawater concentrations and from this the absorption rate of the dye was measured using the spectrophotometer. This demonstrated the rate of filter feeding in different salinities.
It was discovered and concluded that mussels filter feed optimally in pure (100%) seawater but are able to adapt to their surrounding environment when placed in the solution of 75% Seawater. However a decrease in the rate still occurred. In saline conditions below 75% Seawater the rate of filter feeding decreased rapidly until filter feeding nearly stopped completely, showing mussels have the ability to withstand environmental fluctuations to an extent but at lower salinities, filter feeding is affected considerably.
2014

Contents
Introduction: Page 2
Underlying Biology: Page 2
Mussels Page 2
Salinity Page 3
Carmine Red Dye Page 3
Spectrophotometry Page 4
Hypotheses: Page 4
Aim: Page 4
Biological Importance of Investigation Page 5
Procedures: Page 9
Results: Page 13
Experiment 1 Page 18
Experiment 2 Page 19
Experiment 3 Page 21
Averages Page 22
Evaluation:Page 25
1 | P a g e
Conclusion:Page 27
References: Page 28
Acknowledgments:Page 29
Appendix: Page 30
Introduction:Underlying Biology:
Mussels:
Mussels (Mytilus edulis) are common organisms mainly found in the Northern hemisphere, especially in shallow waters where they can attach themselves to the rock surfaces or piers in sheltered harbours, (Bayne 1976) and are usually found with a glossy bluish coloured shell but can sometimes be brown. Mussels also have wide tolerance to both salinity and temperature fluctuations withstanding a range between 0ppt to 31ppt and between sub-zero and 35°C, respectively. Again, similar to most bivalves, mussels are enclosed in two “pear” shaped shells and projecting from the shell we can see bundlesof brown fibres, better known as Byssal threads, which help the organisms attach to their desired surface. (www.awi.de. 2013) The Byssal threads are secreted by the feet, (Gosling 2003) which have a soft collagen like fibrous protein core anda harder outer wall of proteins. (www.npr.org. 2013)
2 | P a g e
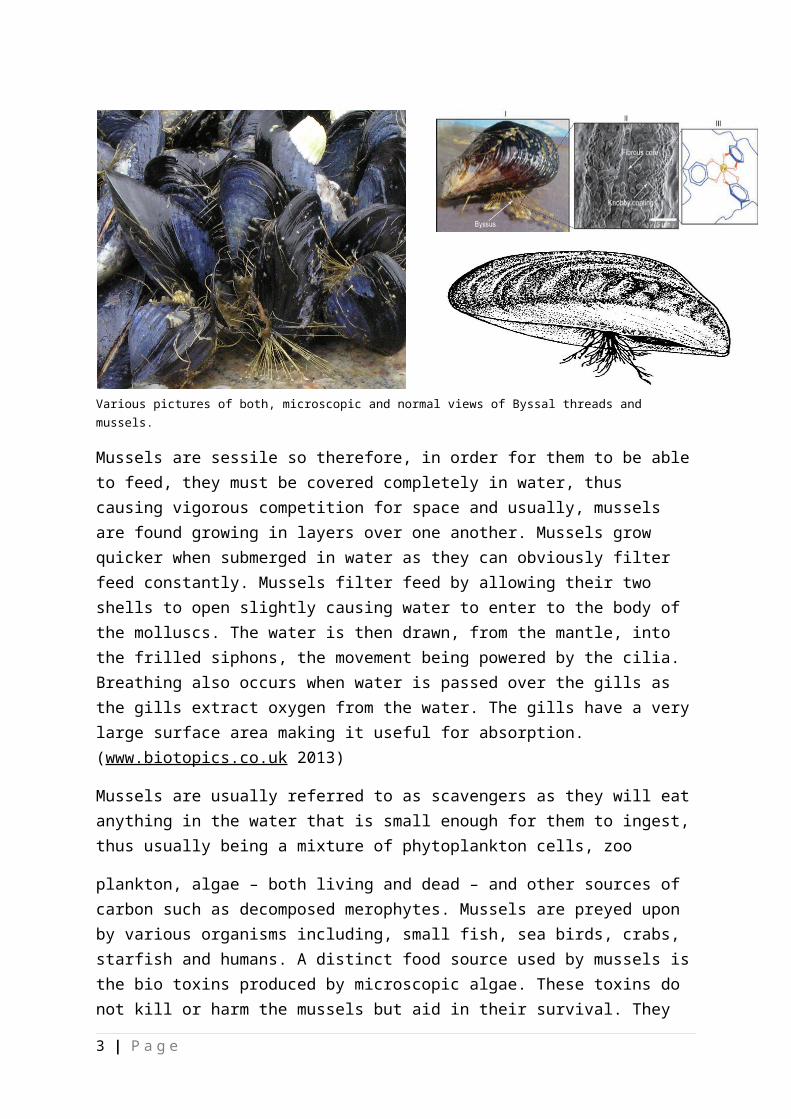
Various pictures of both, microscopic and normal views of Byssal threads and mussels.
Mussels are sessile so therefore, in order for them to be ableto feed, they must be covered completely in water, thus causing vigorous competition for space and usually, mussels are found growing in layers over one another. Mussels grow quicker when submerged in water as they can obviously filter feed constantly. Mussels filter feed by allowing their two shells to open slightly causing water to enter to the body of the molluscs. The water is then drawn, from the mantle, into the frilled siphons, the movement being powered by the cilia. Breathing also occurs when water is passed over the gills as the gills extract oxygen from the water. The gills have a verylarge surface area making it useful for absorption. (www.biotopics.co.uk 2013)
Mussels are usually referred to as scavengers as they will eatanything in the water that is small enough for them to ingest,thus usually being a mixture of phytoplankton cells, zoo
plankton, algae – both living and dead – and other sources of carbon such as decomposed merophytes. Mussels are preyed upon by various organisms including, small fish, sea birds, crabs, starfish and humans. A distinct food source used by mussels isthe bio toxins produced by microscopic algae. These toxins do not kill or harm the mussels but aid in their survival. They
3 | P a g e
can be extremely dangerous for predators or humans if ingested, preventing the mussels being eaten by predators. (www.awi.de 2013).
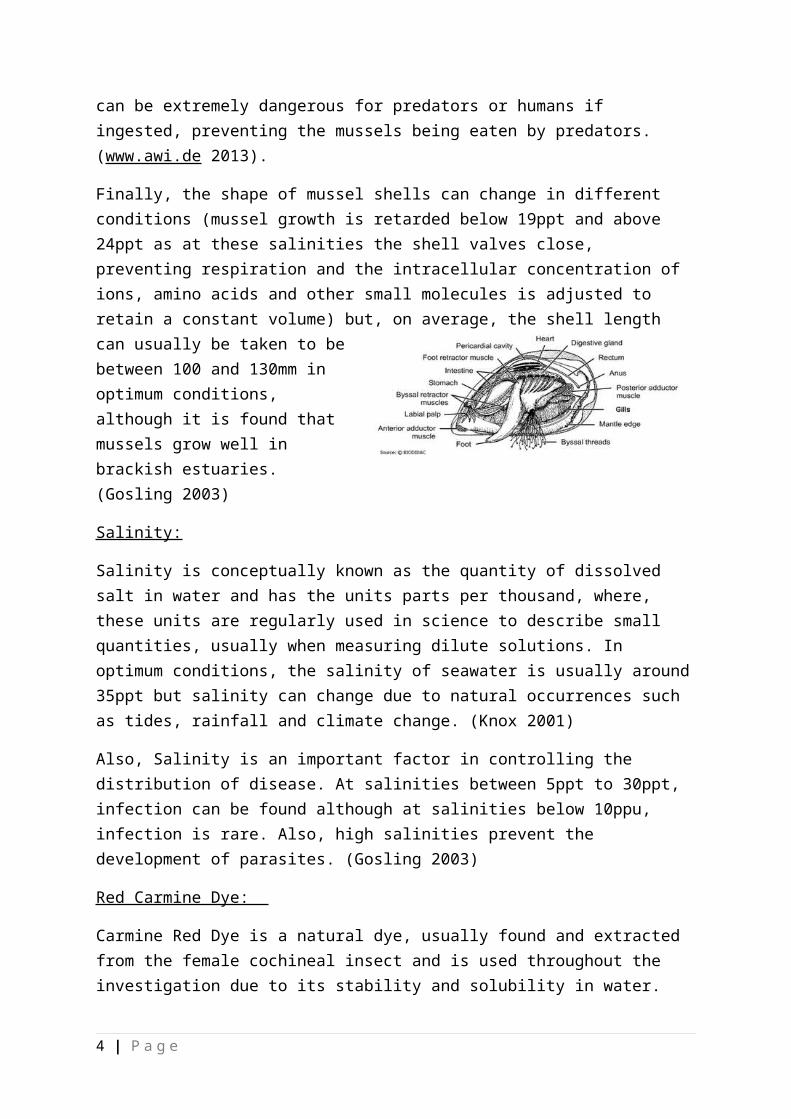
Finally, the shape of mussel shells can change in different conditions (mussel growth is retarded below 19ppt and above 24ppt as at these salinities the shell valves close, preventing respiration and the intracellular concentration of ions, amino acids and other small molecules is adjusted to retain a constant volume) but, on average, the shell length can usually be taken to bebetween 100 and 130mm inoptimum conditions,although it is found thatmussels grow well inbrackish estuaries.(Gosling 2003)
Salinity:
Salinity is conceptually known as the quantity of dissolved salt in water and has the units parts per thousand, where, these units are regularly used in science to describe small quantities, usually when measuring dilute solutions. In optimum conditions, the salinity of seawater is usually around35ppt but salinity can change due to natural occurrences such as tides, rainfall and climate change. (Knox 2001)
Also, Salinity is an important factor in controlling the distribution of disease. At salinities between 5ppt to 30ppt, infection can be found although at salinities below 10ppu, infection is rare. Also, high salinities prevent the development of parasites. (Gosling 2003)
Red Carmine Dye:
Carmine Red Dye is a natural dye, usually found and extracted from the female cochineal insect and is used throughout the investigation due to its stability and solubility in water.
4 | P a g e
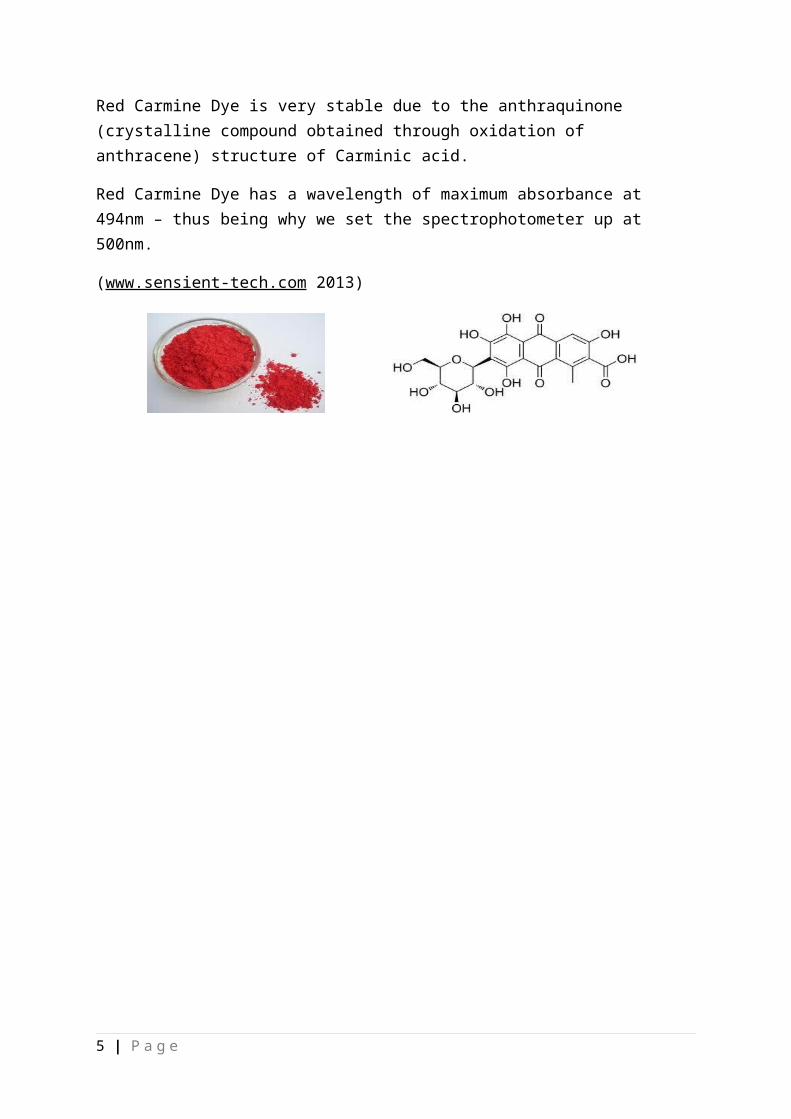
Red Carmine Dye is very stable due to the anthraquinone (crystalline compound obtained through oxidation of anthracene) structure of Carminic acid.
Red Carmine Dye has a wavelength of maximum absorbance at 494nm – thus being why we set the spectrophotometer up at 500nm.
(www.sensient-tech.com 2013)
5 | P a g e
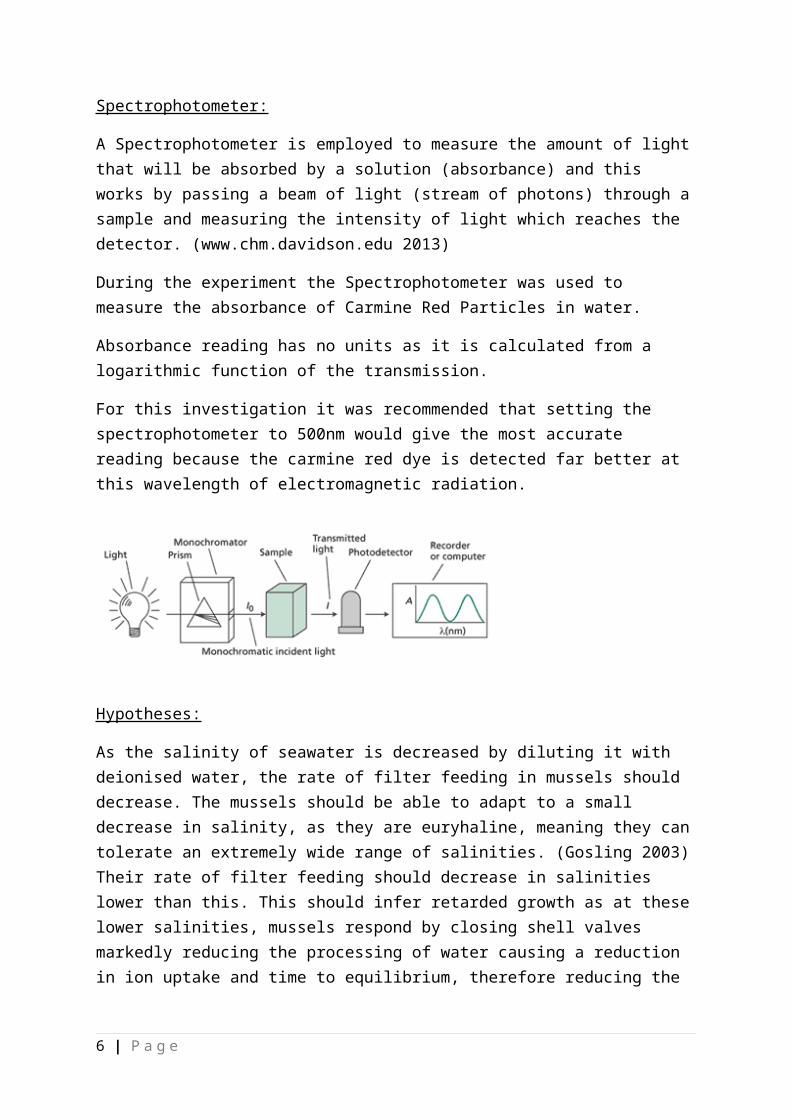
Spectrophotometer:
A Spectrophotometer is employed to measure the amount of lightthat will be absorbed by a solution (absorbance) and this works by passing a beam of light (stream of photons) through asample and measuring the intensity of light which reaches the detector. (www.chm.davidson.edu 2013)
During the experiment the Spectrophotometer was used to measure the absorbance of Carmine Red Particles in water.
Absorbance reading has no units as it is calculated from a logarithmic function of the transmission.
For this investigation it was recommended that setting the spectrophotometer to 500nm would give the most accurate reading because the carmine red dye is detected far better at this wavelength of electromagnetic radiation.
Hypotheses:
As the salinity of seawater is decreased by diluting it with deionised water, the rate of filter feeding in mussels should decrease. The mussels should be able to adapt to a small decrease in salinity, as they are euryhaline, meaning they cantolerate an extremely wide range of salinities. (Gosling 2003)Their rate of filter feeding should decrease in salinities lower than this. This should infer retarded growth as at theselower salinities, mussels respond by closing shell valves markedly reducing the processing of water causing a reduction in ion uptake and time to equilibrium, therefore reducing the
6 | P a g e

rate of aerobic respiration and the mussel will not grow to the desired size. (Gosling 1992)
Aim:
The aim of the investigation is to determine what will happen to the rate at which the common Mussel (Mytilus edulis) will filter feed when placed in varying salinities so that an optimum salinity for growth can be discovered. Theoretically, at lower salinities, retarded growth should occur as in these conditions the mussels close their valves causing a decrease in the rate of filter feeding (Gosling 2003) and therefore themussel receives less essential nutrients needed for aerobic respiration. By doing this experiment an optimum salinity willbe found and allowing mussels to be grown in optimum conditions, ensuring better size and better commercial distribution.
Biological Importance of Investigation:
Mussels are a widely available for human consumption and the minimum size mussels need to be before they can be used as a food source is between 45mm and 50mm. (http://www.seafish.org 2013) A change in salinity may alters the filter feeding in mussels and could therefore preventing the mussels growing to the desired size. At lower salinities, if the mussels filter feed less, they will be receiving fewer nutrients, so aerobic respiration will not be occurring at its optimum and they willnot grow to an optimum size. After finding the optimum salinity for filter feeding, the research could be used in industries so that the mussels can be grown in the best conditions to ensure optimal size is reached and the best possible commercial distribution is achieved.
7 | P a g e

ProceduresApparatus:
5 - 1 Litre Jugs
30 Bowls
Measuring Cylinders (25 cm³, 100 cm³, 250cm³, 1000cm³)
5 Beakers (100ml and 250ml)
Tank
8 | P a g e
Sea Water
Distilled Water
30-40 Mussels (50mm-55mm in size)
Carmine Red Powder – 0.08 Grams

Oxygen Pump
Stop clock
Calipers
Spatula
Pipette
Weighing Boats
Cuvettes
Magnetic Stirrers
Thermometer
Hand Refractometer
Top hand Balance
Spectrophotometer
Magnetic Hot Plate Stirrer
9 | P a g e
Method:
After travelling to a sheltered pier on the harbour, found on the coastline of the town of Millport on the isle of Cumbrae, the mussel specimens were collected, all being of similar size. Once back in the Marine Centre laboratories, a tank was set up, filled with seawater and connected to an oxygen pump. The mussels were measured, using the calipers, and 40 specimens that were between 50mm – 55mm were transferred into the tank to rest until they were needed for the experiment.
Once the mussels had been transferred into the tanks, the different saline solutions had to be made up, each being made as a stock solution of 1 Litre from which 150ml of each stock solution could be used in the experiment. There were five different saline concentration solutions made up; see the table below and a measurement of the salinity of each was taken using the hand refractometer. To make the stock solutions, 0.08 grams of Carmine Red Dye was weighed out, using the Top hand balance, and this was mixed into 900ml of the solution, in a 1 Litre jug. To make sure the dye was in full suspension, the Magnetic Hot Plate Stirrer and flea was used in order to stir the solution. Once in full suspension, more seawater or distilled water, dependent on the solution being made up, was added to make the stock solution up to the 1 Litre mark. This was repeated for the five different stock solutions.
After deriving the five different stock solutions, calibrationcurves had to be constructed for each different saline solution. The calibration curve was achieved through using serial dilution of each stock solution, making each mixture slightly more dilute from the last dilution made. 50ml of the stock solution was poured into a bowl. Some of this was pipetted into a cuvette, thus being of a concentration factor of 1. 00. 40ml of the solution in the bowl was added into another bowl and along with it, 10ml of water to dilute the mixture to a concentration factor of 0.80. Again, some of this
10 | P a g e
was pipetted into a different cuvette. 38 ml of the solution with a concentration factor of 0.8 was transferred into another bowl and to this 13 ml of water was added ensuring thesolution was diluted to a concentration factor of 0.60. Once more, the mixture was pipetted into a cuvette. 33ml of the solution with a 0.60 concentration factor was added to anotherbowl along with 17ml of water in order to dilute the mixture further to a concentration factor of 0.40. A cuvette filled with the solution was prepared again. Finally 25ml of the solution with a concentration factor of 0.40 was added to a separate bowl with 25ml of water in order to dilute the solution further to a concentration factor of 0.20 and a finalcuvette of this solution was taken. The cuvettes were then taken to the spectrophotometer, set to 500nm in absorbance mode, and the machine was allowed to warm up for 10 minutes. Acuvette with filtered sea water was first placed in the spectrophotometer to ensure the reading was set to zero. Each cuvette was then placed in the machine and from this an absorbance reading was given and from which a calibration curve (graph of absorbance against concentration of solution) was plotted. The graph looked like a straight line passing through the origin. This was repeated for each different stocksolution.
With each different stock made up, 150ml of each solution was added into two different bowls – one in which a mussel would be placed and one which would be used as a control (no musselsbeing placed in these bowls) – as this volume was enough to fully cover the specimens. One mussel was placed in one bowl for each different salinity solution and at time zero (immediately after the mussels had been placed in the bowls) samples were pipetted from each of the bowls and the control experiments, these samples being placed into clean cuvettes. After 15 minutes, timed using a stop clock, another sample from each bowl and each control was taken and placed into clean cuvettes. Finally, at 30 minutes, another pipette of each bowl and control was taken. Using the cuvettes and the
11 | P a g e
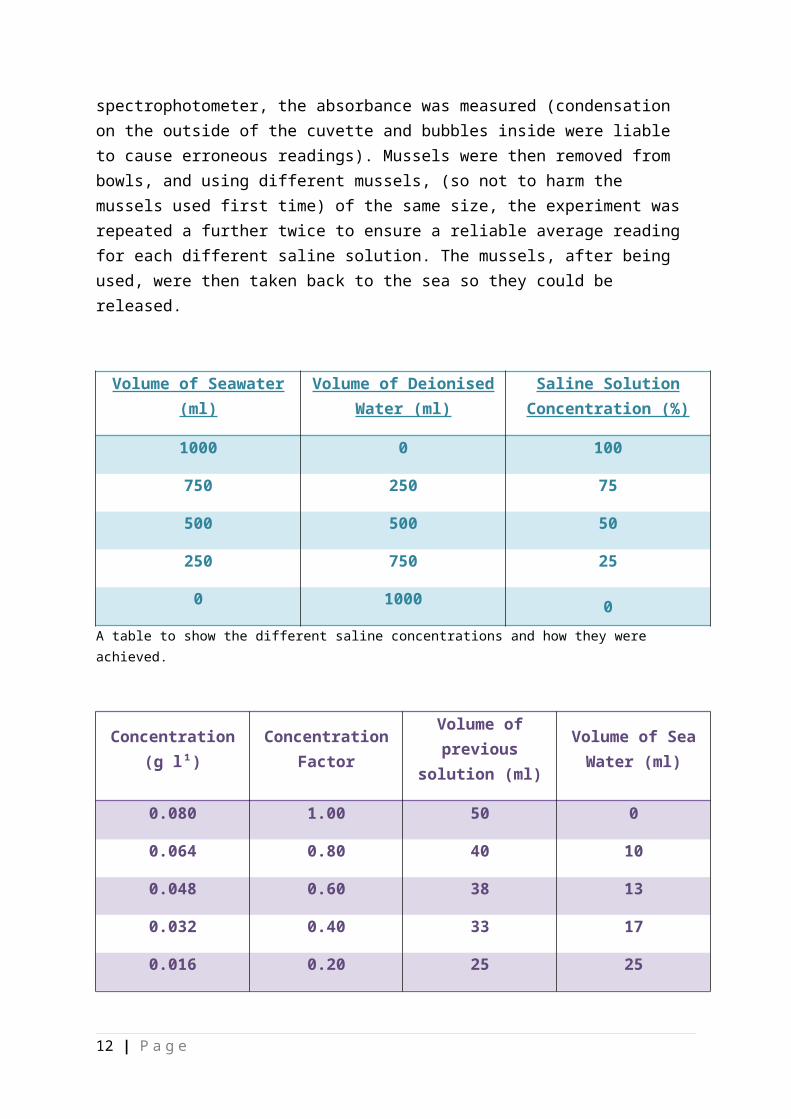
spectrophotometer, the absorbance was measured (condensation on the outside of the cuvette and bubbles inside were liable to cause erroneous readings). Mussels were then removed from bowls, and using different mussels, (so not to harm the mussels used first time) of the same size, the experiment was repeated a further twice to ensure a reliable average reading for each different saline solution. The mussels, after being used, were then taken back to the sea so they could be released.
Volume of Seawater(ml)
Volume of DeionisedWater (ml)
Saline SolutionConcentration (%)
1000 0 100
750 250 75
500 500 50
250 750 25
0 1000 0A table to show the different saline concentrations and how they were achieved.
Concentration(g l¹)
ConcentrationFactor
Volume ofprevious
solution (ml)
Volume of SeaWater (ml)
0.080 1.00 50 0
0.064 0.80 40 10
0.048 0.60 38 13
0.032 0.40 33 17
0.016 0.20 25 25
12 | P a g e
A table to show how serial dilution occurred (an example of serial dilution).
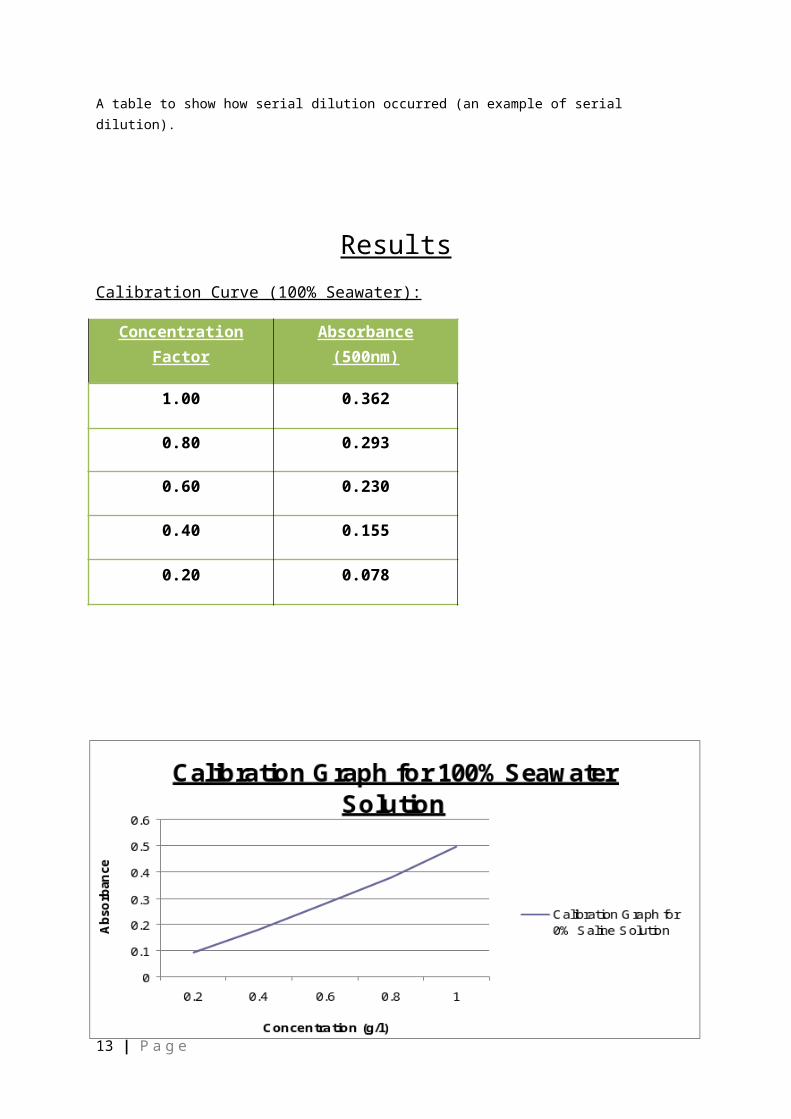
ResultsCalibration Curve (100% Seawater):
ConcentrationFactor
Absorbance(500nm)
1.00 0.362
0.80 0.293
0.60 0.230
0.40 0.155
0.20 0.078
13 | P a g e
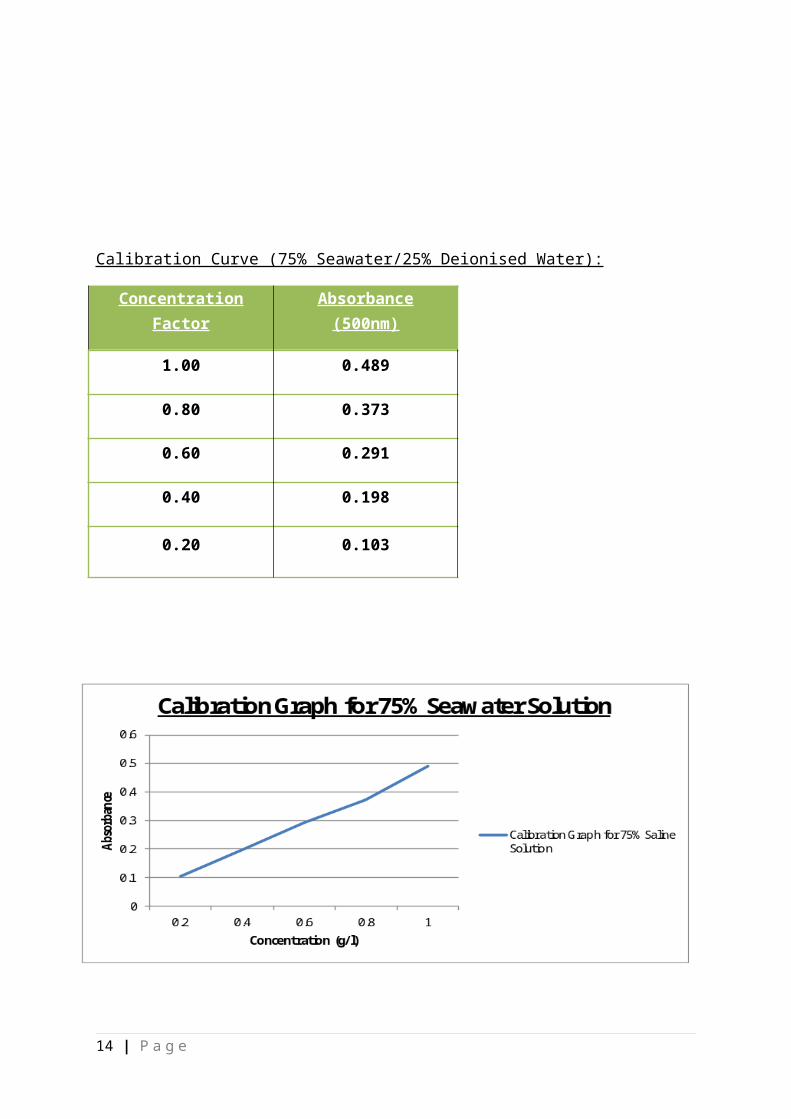
Calibration Curve (75% Seawater/25% Deionised Water):
ConcentrationFactor
Absorbance(500nm)
1.00 0.489
0.80 0.373
0.60 0.291
0.40 0.198
0.20 0.103
14 | P a g e
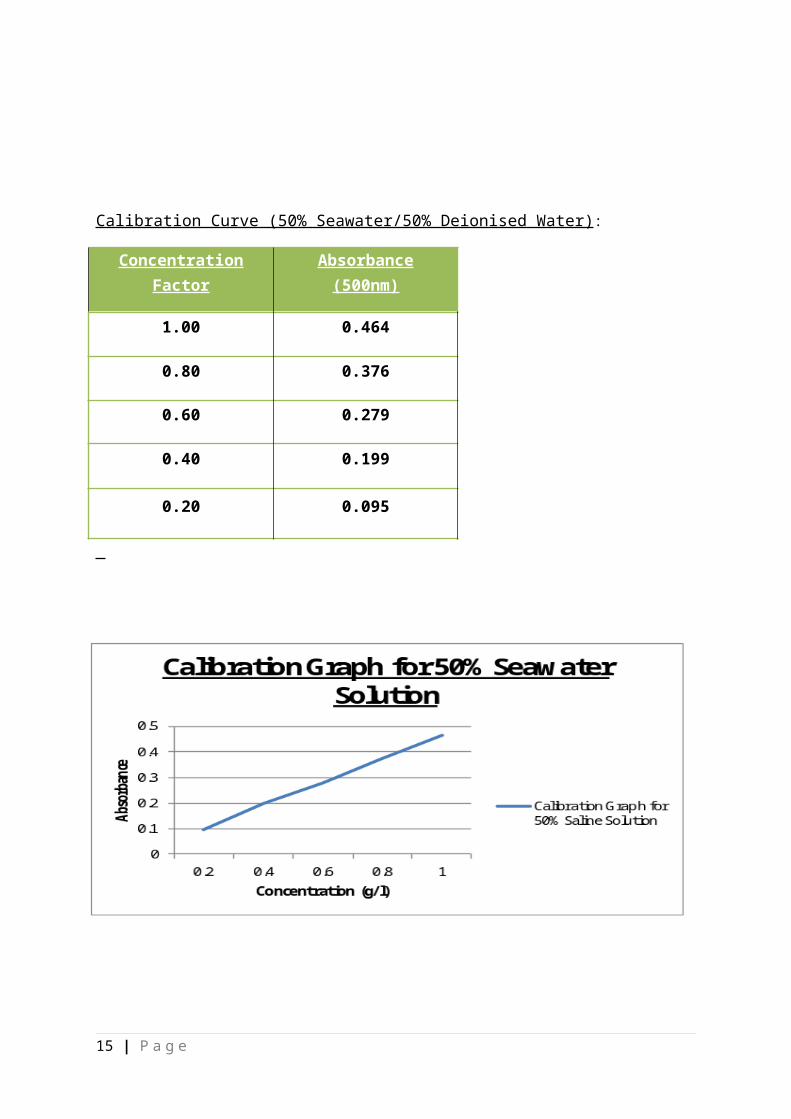
Calibration Curve (50% Seawater/50% Deionised Water):
ConcentrationFactor
Absorbance(500nm)
1.00 0.464
0.80 0.376
0.60 0.279
0.40 0.199
0.20 0.095
15 | P a g e
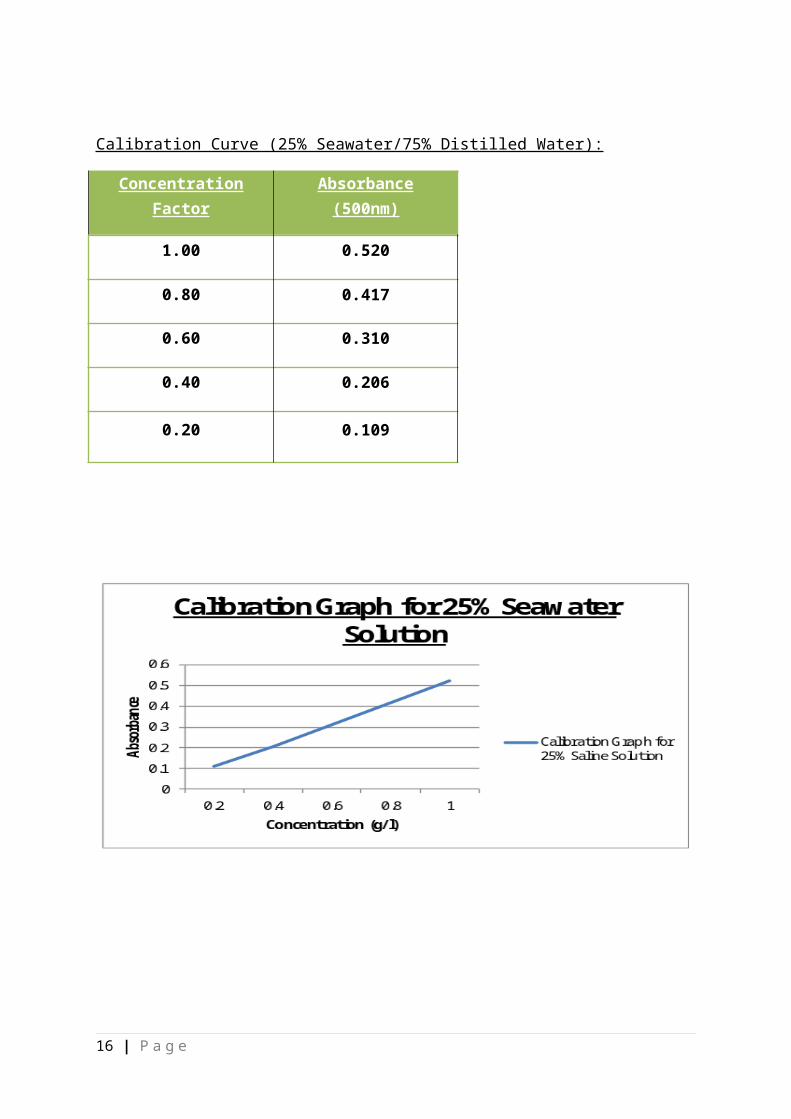
Calibration Curve (25% Seawater/75% Distilled Water):
ConcentrationFactor
Absorbance(500nm)
1.00 0.520
0.80 0.417
0.60 0.310
0.40 0.206
0.20 0.109
16 | P a g e

Calibration Curve (100% Deionised Water):
ConcentrationFactor
Absorbance(500nm)
1.00 0.495
0.80 0.377
0.60 0.278
0.40 0.181
0.20 0.093
Filter Feeding in Mussels Results (Experiment 1):
17 | P a g e

SeawaterSolution (%)
Absorption(500nm) atTime Zero
Absorption(500nm) at 15
Minutes
Absorption(500nm) at 30
Minutes
100 0.617 0.391 0.396
75 0.491 0.410 0.379
50 0.502 0.508 0.505
25 0.560 0.540 0.549
0 0.540 0.524 0.535
From the Graph, it is shown that mussels filter fed optimally when in a solution of 100% Seawater as the absorbance reading had a difference of 0.221 between the absorbance readings at 0Minutes and 30 Minutes. It is also shown that mussels can adapt to a small change in salinity as in the 75%, 25% and 0% Seawater solutions the mussels did filter feed even though it was at a slower rate. In lower salinities, it was shown the
18 | P a g e
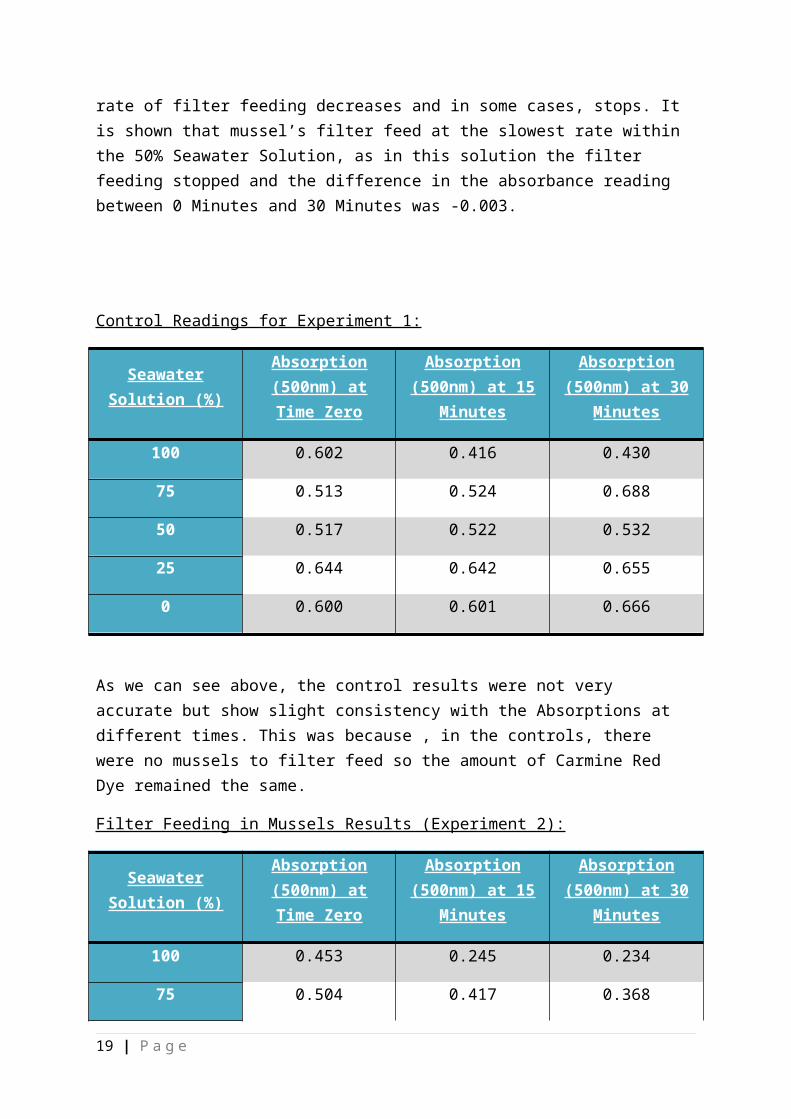
rate of filter feeding decreases and in some cases, stops. It is shown that mussel’s filter feed at the slowest rate within the 50% Seawater Solution, as in this solution the filter feeding stopped and the difference in the absorbance reading between 0 Minutes and 30 Minutes was -0.003.
Control Readings for Experiment 1:
SeawaterSolution (%)
Absorption(500nm) atTime Zero
Absorption(500nm) at 15
Minutes
Absorption(500nm) at 30
Minutes
100 0.602 0.416 0.430
75 0.513 0.524 0.688
50 0.517 0.522 0.532
25 0.644 0.642 0.655
0 0.600 0.601 0.666
As we can see above, the control results were not very accurate but show slight consistency with the Absorptions at different times. This was because , in the controls, there were no mussels to filter feed so the amount of Carmine Red Dye remained the same.
Filter Feeding in Mussels Results (Experiment 2):
SeawaterSolution (%)
Absorption(500nm) atTime Zero
Absorption(500nm) at 15
Minutes
Absorption(500nm) at 30
Minutes
100 0.453 0.245 0.234
75 0.504 0.417 0.368
19 | P a g e
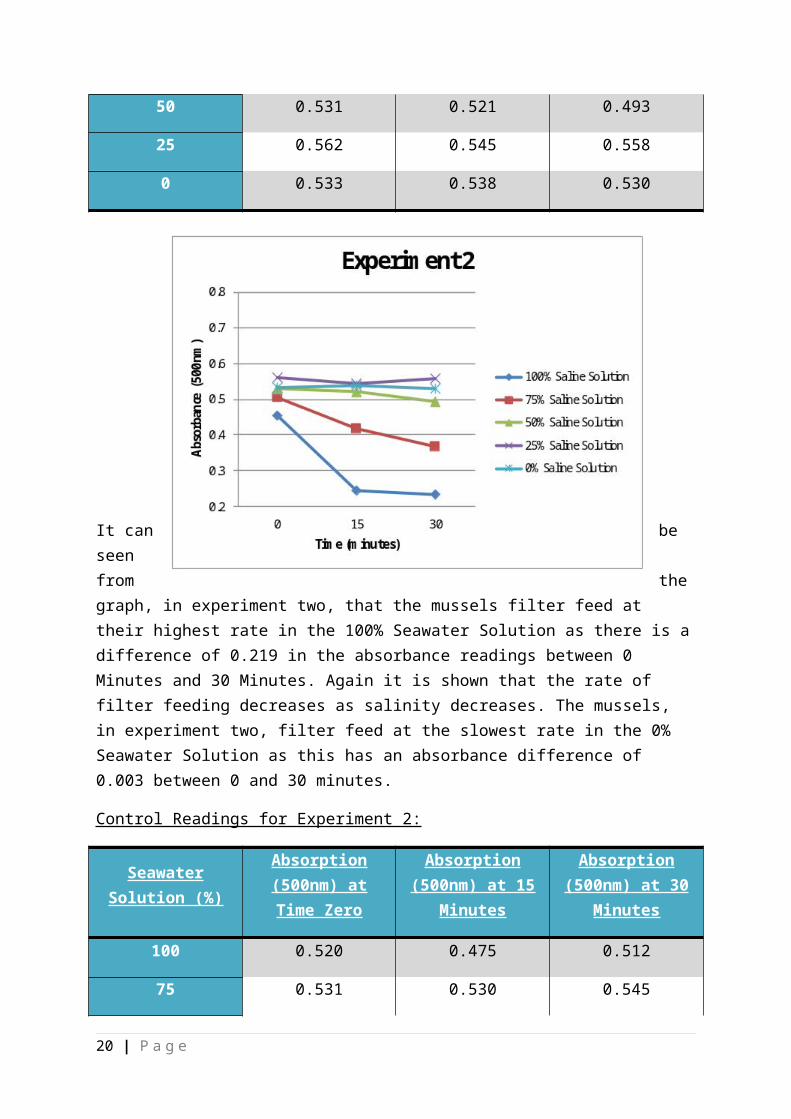
50 0.531 0.521 0.493
25 0.562 0.545 0.558
0 0.533 0.538 0.530
It can be seenfrom thegraph, in experiment two, that the mussels filter feed at their highest rate in the 100% Seawater Solution as there is adifference of 0.219 in the absorbance readings between 0 Minutes and 30 Minutes. Again it is shown that the rate of filter feeding decreases as salinity decreases. The mussels, in experiment two, filter feed at the slowest rate in the 0% Seawater Solution as this has an absorbance difference of 0.003 between 0 and 30 minutes.
Control Readings for Experiment 2:
SeawaterSolution (%)
Absorption(500nm) atTime Zero
Absorption(500nm) at 15
Minutes
Absorption(500nm) at 30
Minutes
100 0.520 0.475 0.512
75 0.531 0.530 0.545
20 | P a g e
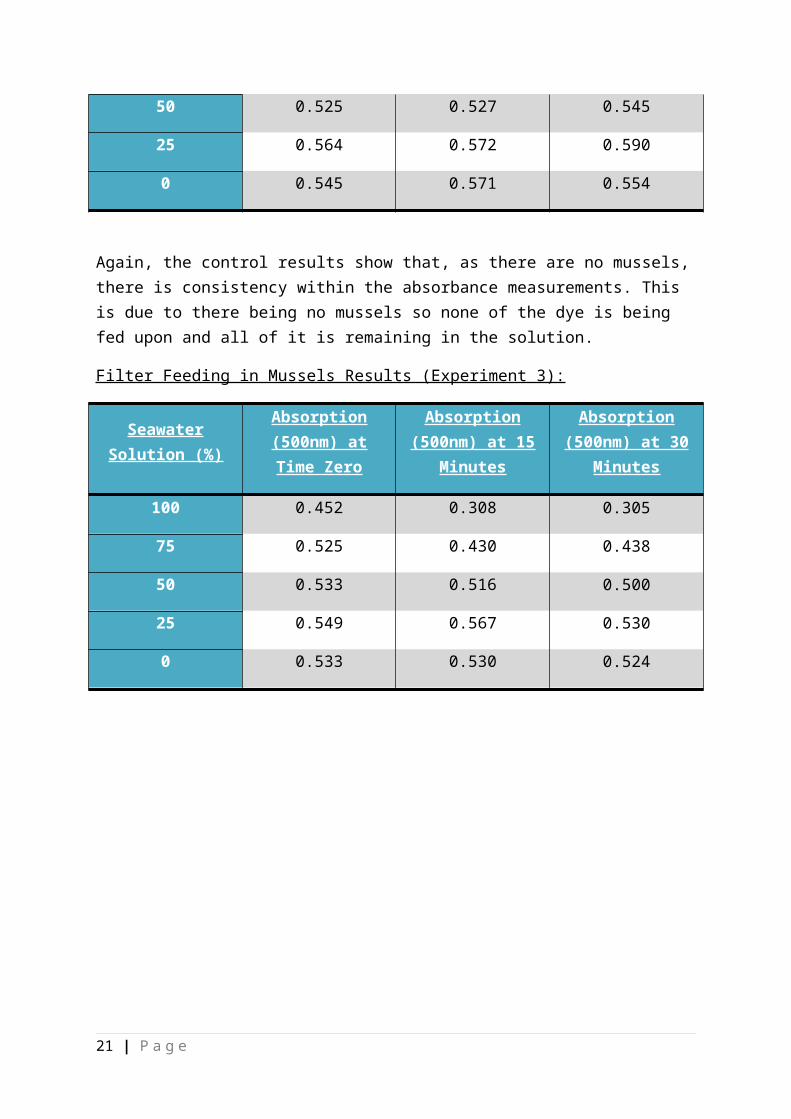
50 0.525 0.527 0.545
25 0.564 0.572 0.590
0 0.545 0.571 0.554
Again, the control results show that, as there are no mussels,there is consistency within the absorbance measurements. This is due to there being no mussels so none of the dye is being fed upon and all of it is remaining in the solution.
Filter Feeding in Mussels Results (Experiment 3):
SeawaterSolution (%)
Absorption(500nm) atTime Zero
Absorption(500nm) at 15
Minutes
Absorption(500nm) at 30
Minutes
100 0.452 0.308 0.305
75 0.525 0.430 0.438
50 0.533 0.516 0.500
25 0.549 0.567 0.530
0 0.533 0.530 0.524
21 | P a g e
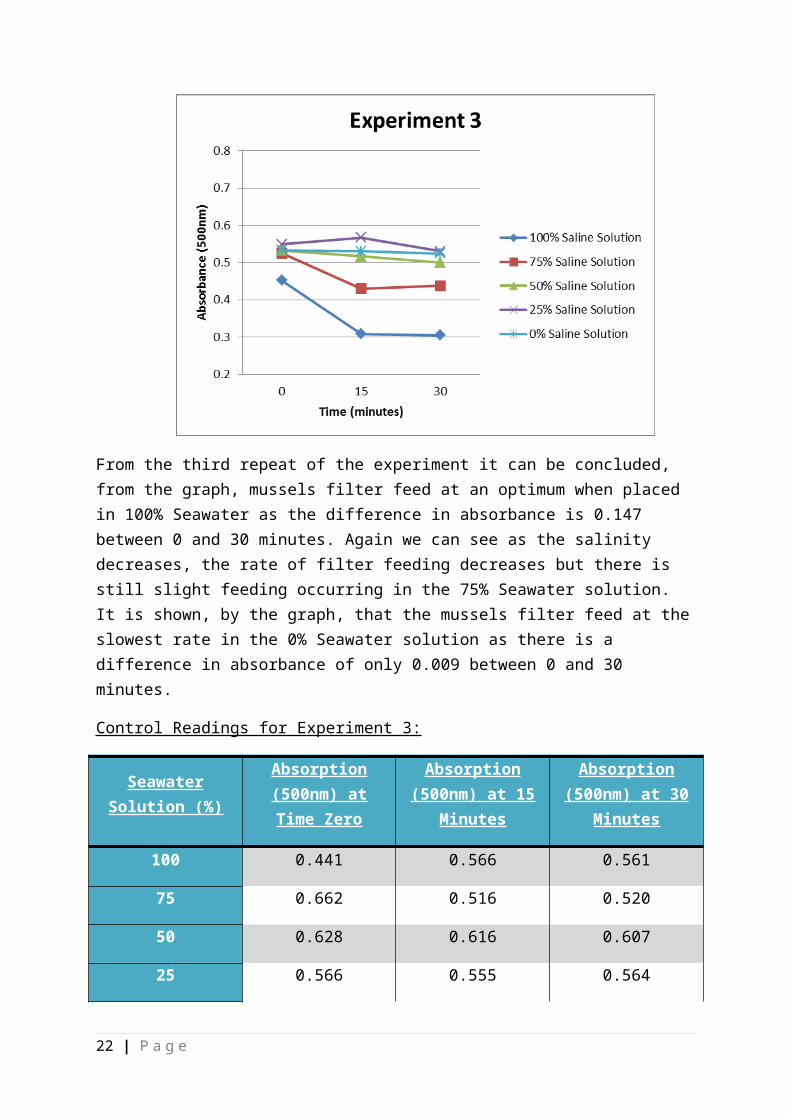
From the third repeat of the experiment it can be concluded, from the graph, mussels filter feed at an optimum when placed in 100% Seawater as the difference in absorbance is 0.147 between 0 and 30 minutes. Again we can see as the salinity decreases, the rate of filter feeding decreases but there is still slight feeding occurring in the 75% Seawater solution. It is shown, by the graph, that the mussels filter feed at theslowest rate in the 0% Seawater solution as there is a difference in absorbance of only 0.009 between 0 and 30 minutes.
Control Readings for Experiment 3:
SeawaterSolution (%)
Absorption(500nm) atTime Zero
Absorption(500nm) at 15
Minutes
Absorption(500nm) at 30
Minutes
100 0.441 0.566 0.561
75 0.662 0.516 0.520
50 0.628 0.616 0.607
25 0.566 0.555 0.564
22 | P a g e
0 0.682 0.722 0.729
Again, the control results show that, as there are no mussels,there is consistency within the absorbance measurements.
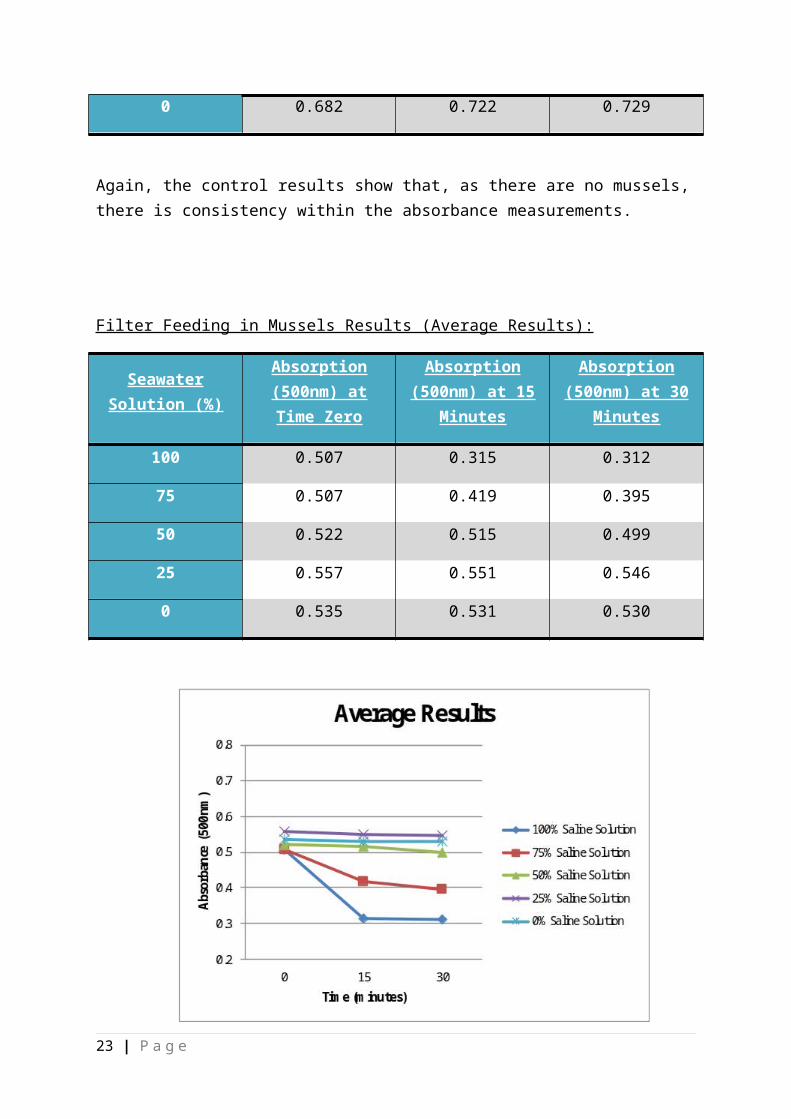
Filter Feeding in Mussels Results (Average Results):
SeawaterSolution (%)
Absorption(500nm) atTime Zero
Absorption(500nm) at 15
Minutes
Absorption(500nm) at 30
Minutes
100 0.507 0.315 0.312
75 0.507 0.419 0.395
50 0.522 0.515 0.499
25 0.557 0.551 0.546
0 0.535 0.531 0.530
23 | P a g e
From the graph of the overall averages, it can be concluded that mussels filter feed at the highest rate when in a solution of 100% Seawater as there is a difference in absorbance of 0.195 between 0 and 30 minutes. It is shown thatin salinities below this filter feeding decreases however in the 75% Seawater solution filter feeding still occured. It canfinally be concluded that mussels filter feed at the slowest rate in the 0% Seawater solution, as there is an absorbance difference of 0.005 between 0 and 30 minutes.
Control Readings for Experimental Averages:
SeawaterSolution (%)
Absorption(500nm) atTime Zero
Absorption(500nm) at 15
Minutes
Absorption(500nm) at 30
Minutes
100 0.521 0.486 0.501
75 0.569 0.523 0.584
50 0.557 0.555 0.561
25 0.591 0.590 0.603
0 0.609 0.631 0.630
As the control results are so close together, this proves thatthe decrease in absorbance is due to the mussels filter feeding as when there are no mussels, all of the dye is leftover and when there are mussels the dye is fed upon.
Salinity % of solutions:
Volume of Seawater used (%) Salinity of Water (%)
100 35
24 | P a g e
75 24
50 15
25 5
0 0
The salinity of each solution was measured using the hand refractometer and samples of each stock solution.
EvaluationThere are a number of factors that need to be taken into account when analysing the results.
The mussels were taken out of their natural habitat and placed in foreign surroundings. This could have interfered with the mussels eating habits as they may nothave been filter feeding at their optimum as they were not used to the surroundings.
25 | P a g e
The same mussel was not always used and different musselsvary in size, eating habits and age therefore each musselwill filter feed at different rates from one another resulting in an error within results.
There was no tidal movement in the tanks so the mussels may have reacted differently. Also there were no predators present so they may have felt inclined to filter feed more than they would in the sea causing errors in results.
There may have been errors in measurements taken during the experiment due to the possibility in errors of the equipment. If the balance had been set to three or four decimal places would have increased the reliability of results as a more accurate measurement of the amount of dye needed would be taken. There may have been slight errors due to the cuvettes being dirty, an improvement being to clean the Cuvettes before use. Also, there may have been errors in the serial dilution as some of the solution was lost through spillage. Finally, the calipersmay have small uncertainties in the sizing causing error in results of mussel size.
The mussels placed in solutions had various sea organisms growing on them, which could have affected results as these too may have been respiring or could have left waste in the solutions which were placed in cuvettes.
The cuvettes were transferred from the labs to the spectrophotometer by a route outside and as it was raining, the results may have errors due to dilution by the rain, however the cuvettes were covered during transport.
The mussels were left in aquariums, so would have been filter feeding for the duration of the day, so when used
26 | P a g e
in the experiment, may not have been filter feeding at anoptimum.
The mussels may not have been in their optimum conditionsas the temperature of the sea water and the sea water used form the labs may be different even though it was pumped directly from the sea into the labs.
To improve the reliability of the results, the experiment could be repeated and when samples of the solution have been taken after mussels have been placed in them, a centrifuge would be suitable to remove any unwanted particles found in cuvettes caused by organisms such as coral being attached to mussels.
Also, using mussels from different parts of the country would help make the results more reliable as natural selection allows mussels to adapt to different surroundings, so a wider range of mussels would give a wider range of results.
If a longer period of time was given to conduct the experiment, the effect of a tighter range of salinities could have been investigated or the effect of other organisms being in the aquarium could be investigated, thus being more complexbut rewarding investigations.
27 | P a g e
ConclusionFrom the results the investigation provided, it can be concluded that changing the salinity of water affects filter feeding in mussels and as salinity decreases, as does filter feeding. Also, it is appropriate to note that filter feeding can be regarded as negligible below 20% Salinity.
It is now known that mussels can adapt to a change in salinitybetween 35 and 20% as there is only a small fluctuation in filter feeding rates but below this filter feeding decreases rapidly.
Overall, the slowest rate of filter feeding was found to be in0% Seawater, with the greatest being found in 100% Seawater. This indicates the rate of filter feeding in mussels depends on the salinity of the solution the organism is present in.
28 | P a g e

Finally, it can be said, that mussels should be grown in 100% Seawater as at this salinity, they filter feed at the greatestrate and will therefore grow to an optimum size as they are receiving all the nutrients they need for respiration, and this information can be passed on to the food industry that deals with mussel propagation so that the greatest commercial distribution can be achieved.
ReferencesURL: http://www.awi.de/de/forschung/neue_technologien/marine_aquacu
29 | P a g e
lture_maritime_technologies_and_iczm/research_themes/marine_aquaculture/candidate_species/blue_mussels/.
Visited: 24/09/2013
URL: www.biotopics.co.uk/pot/odds/filter.htm/
Visited: 24/09/2013
URL: www.biology.clc.uc.edu/fankhauser/lahs/.../Growth.../spectrophotometer.htm
Visited: 24/09/2013
URL: www.chm.davidson.edu/uce/spectrophotometry/spectrophotometry.html
Visited: 24/09/2013
URL: www.sensient-tech.com/cosmetics_sku_color/carmine_overview.htm
Visited: 02/10/2013
Gosling, E. (2003) – Biology, Ecology and Culture – Blackwell Publishing – Fishing New Books
Gosling, E. (1992) – Ecology, Physiology, Genetics and Culture – Elsevier Science Ltd – Regional Technical College, Dublin Road, Galway,Ireland
B.L. Bayne (1976) – Marine Mussels: their ecology and physiology – Cambridge University – The Syndics of the Cambridge UniversityPress – Page 17
A. Knox, G. (2001) – The ecology of Seashores – CRC Press LLC
Cbst.ucdavis.edu/education/courses/spring-2007-ist9/lewfinaldraft.doc
Visited: 02/10/2013
30 | P a g e

AcknowledgementsI would like to thank the biology department, Jonathon Payne, Karen Ross and Steve Begarnie, and the staff at Millport Marine Biological Centre for all their help as without both, this project would not have been possible. I would also like to thank Cameron Wallace and Rory Pendreigh, two fellow students in their efforts assisting me late at night, to help finish the practical aspect to this investigation.
31 | P a g e

32 | P a g e