the economic impact of fig production on dry land farmers in ...
264
THE ECONOMIC IMPACT OF FIG PRODUCTION ON DRY LAND FARMERS IN PUNE DISTRICT (WITH SPECIAL REFERENCE TO PURANDAR TALUKA, FROM 2005-06 TO 2009-10) A Thesis Submitted to Tilak Maharashtra Vidyapeeth, Pune (Deemed University) for the Doctor of Philosophy (Ph. D.) Degree in Economics By DURGADE DIGAMBAR GANPAT Under the guidance of DR. KULKARNI B. D. M. A., Ph. D. Department of Economics TILAK MAHARASHTRA VIDYAPEETH Gultekadi, Pune - 411037 DECEMBER - 2011
-
Upload
khangminh22 -
Category
Documents
-
view
1 -
download
0
Transcript of the economic impact of fig production on dry land farmers in ...

THE ECONOMIC IMPACT OF FIG PRODUCTION ON
DRY LAND FARMERS IN PUNE DISTRICT (WITH SPECIAL REFERENCE TO PURANDAR TALUKA,
FROM 2005-06 TO 2009-10)
A Thesis Submitted to Tilak Maharashtra Vidyapeeth, Pune
(Deemed University) for the Doctor of Philosophy (Ph. D.)
Degree in Economics
By
DURGADE DIGAMBAR GANPAT
Under the guidance of
DR. KULKARNI B. D.
M. A., Ph. D.
Department of Economics
TILAK MAHARASHTRA VIDYAPEETH
Gultekadi, Pune - 411037
DECEMBER - 2011

II
C E R T I F I C A T E
This is to certify that the thesis entitled, “The economic impact
of fig production on dry land farmers in Pune District (with special
reference to Purandar Taluka, from 2005-06 to 2009-10)” which is
being submitted herewith for the award of the Doctor of Philosophy
degree in Economics of Tilak Maharashtra Vidyapeeth, Pune is the
result of original research work completed by Shri. Durgade Digambar
Ganpat under my supervision and guidance. To the best of knowledge
and belief the work incorporated in this thesis has not formed the
basis for the award of any degree or similar title of this or any other
university or examining body.
Place : Pune.
Date : 30.12.2011 Dr. B. D. Kulkarni Research Guide

III
D E C L A R A T I O N
I hereby declare that the thesis entitled, The economic impact
of fig production on dry land farmers in Pune District (with special
reference to Purandar Taluka, from 2005-06 to 2009-10) submitted by
me for the degree of Doctor of Philosophy (Economics) is my original
work and has not previously formed the basis for the award or any
degree or other similar title of this for any other university or
examining body.
Place : Pune
Date : 30.12.2011 Mr. Durgade D. G. Researcher

IV
ACKNOWLEDGEMENT
I wish to place on record my profound gratitude to my research
guide Dr. B. D. Kulkarni, Professor (Retd). Department of Economics
of Nehru Institute of Social Sciences, Tilak Maharashtra Vidyapeeth,
Pune for his valuable guidance, his kind help, encouragement,
motivation, Valuable criticism and devotion to my work. I found these
words inadequate to express my gratitude. I am highly indebted to
him.
I express my sincere thanks to Prof. Vijay Karekar, Dean, Nehru
Institute of Social Sciences and Dr. Umesh Keskar, Registrar, Tilak
Maharashtra Vidyapeeth, Pune.
I feel very happy to express my obligation to Dr. Sanjeev
Sonawane, Dean, Faculty of Education, University of Pune, Dr. G. K.
Shirude Director, Naralkar Institute, Pune, Ex. Secretary S. P.
Mandali, Pune and Dr. Nandini Patil, Principal, Tilak College of
Education, Pune -30 who are the source of strength and Inspiration to
me. I am highly indebted to them.
I express my thanks to Dr. M. U. Mulani, Head of Department of
Economics, S. P. Mahila Mahavidyalay, Sharadanagar, Baramati and
Dr. Nitin Birmal, Dr. Babasaheb Ambedkar College, Yerawada, Pune
for their uncountable help valuable guidance and inspiration. I also
wish to thanks my friends and colleagues Dr. Dipak Chavan, Dr. Vijay
Dhamane and Prof. Rajendra Thigale from Tilak College of Education,
Pune for their support and motivation.
I thank to Mr. Borkar, (Dy. Director, Agriculture) District
Agriculture officer, Pune, Mr. Dighe, Taluka Agriculture Officer,
Purandar, Pune for making available the relevant and authentic data
of Horticulture and Fig cultivation. I also thankful to the fig producer
and Non Fig producer farmers of Purandar Taluka for giving the
responses to the questionnaires.

V
I express my sincere thanks to Agriculture Department,
Government of Maharashtra, Agriculture Department of Zillha
Parishad, Pune and Panchayat Samittee Purandar, Mahatma Phule
Krushi Vidyapeeth, Rahuri, Mahatma Phule Agriculture College, Pune
Regional Office of NABARD, Pune District Central Co-operative Bank,
Pune for their valuable help and for providing me the relevant and
updated information.
I am extremely thankful to the librarians of Tilak Maharashtra
Vidyapeeth, Pune, Gokhale Institute of Economics and Politics, Pune.
I also wish to thank my friends Prof. Santosh Nawale, Prashant
Shah, Sandeep Durgade, Prof. Dadasaheb Bhore Prof. Ajay Funde and
Shamrao Durgade for their kind cooperation.
I record my thanks to my colleagues, teaching and non teaching
staff of Tilak College of Education, Pune – 30 and teaching and Non
Teaching staff of Nehru Institute of Social Sciences, Tilak Maharashtra
Vidyapeeth, Pune, for their help and encouragement.
I am also thankful to Venkatesh S. Dasa who typed the thesis
scrupulous excellence.
I am thankful to my friends Prof. Yashwant Dumbre, Prof.
Rajkumar Survase for their moral support. I also thank to Pintu,
Pradeep, Pawan, Devidas and Santosh Durgade, Ganesh More,
Laxman Jagtap and Atul Salunkhe for their assistance.
Last but not least, I express my gratitude to my wife Swati,
daughter Prajakta, mother in law Smt. Mandakini Barabhai who
extended moral support, co-operation, inspiration and motivation to
complete the work.
Place : Pune.
Date : 30.12.2011 Durgade D. G. Researcher

VI
INDEX
Sr. No. Description Page No.
Certificate II Declaration III Acknowledgement IV Index VI List of Tables X List of Graphs XIII List of Maps XVI List of Photographs XVI List of Abbreviations XVI
CHAPTER 1 : INTRODUCTION1.1 Introduction 1 1.2 Fruits. 2
1.2.1 Production of the fruits in the world : 2 1.2.2 Production of the fruits in India. 5 1.2.3 State wise production of the fruits: 6
1.3
Fig fruit 8 1.3.1 Significance of fig. 8 1.3.2 Importance of fig from diet’s viewpoint 9 1.3.3 Importance of fig as a dry fruit 10 1.3.4 Importance of fig as a processed food item 10 1.3.5 Importance of fig in the view of deep
cultivation 12
1.3.6 Importance of fig to earn foreign exchange 12 1.4 Types and breeds of fig. 13 1.5 History of the fig 18 1.6 Area, production and productivity of fig in
the world 20
1.7 Area, production and productivity of fig in India.
23
1.8 Area, production and productivity of fig in Maharashtra.
24
1.9 Cultivation and production of fig in Maharashtra.
25
1.10 Area of fig in Pune district 26

VII
Sr. No. Description Page No.
CHAPTER 2 : RESEARCH METHODOLOGY 2.1 Introduction 31 2.2 Schultz’s Theory 31 2.3 Statement of the problem 36 2.4 Selection of subject 36 2.5 Review of related literature 39 2.6 Importance of research 44 2.7 Objectives of research 46 2.8 Hypotheses of research 47 2.9 Research methodology 47
2.9.1 Primary data 47 2.9.2 Secondary data 55 2.9.3 Statistical tools 55 2.9.4 Limitation of research 56
2.10 Chapter Scheme 56 References 58
CHAPTER 3 : GEO-PHYSICAL AND SOCIO ECONOMIC REVIEW : PUNE DISTRICT AND PURANDAR TALUKA
SECTION I : GEO-PHYSICAL AND SOCIO-ECONOMIC FEATURES OF PUNE DISTRICT.
3.1 Introduction 60 3.2 Geo-physical features of Pune District 60 3.3 Administrative information of Pune
District 61
3.4 Population 62 3.4.1 Sex wise distribution of rural urban
population 63
3.4.2 Literacy 64 3.4.3 Employment 65
3.5 Land 65 3.6 Land required for fig production. 66 3.7 Climate 67 3.8 Temperature 67 3.9 Rainfall 68 3.10 Rivers 68 3.11 Irrigation 68 3.12 Irrigation area in Pune District 69 3.13 Cropping pattern 69 3.14 Fruits and vegetable 71 3.15 Horticulture area 71 3.16 Transport and communication 73

VIII
Sr. No. Description Page No.
Section II: Geo-Physical And Socio Economic Features of Purandar Taluka In Pune District.
3.17 Introduction : 73 3.18 Geo physical features of Purandar Taluka 74 3.19 Land and climate 75 3.20 Social aspects 75 3.21 Economic aspects 77
CHAPTER 4:
ANALYSIS AND INTERPRETATION OF DATA
4.1 Introduction 83 4.2 Selection of respondents. 84
4.3 Personal information 86 4.4 Fig plantation 107 4.5 Effects of fig production on other farming. 132 4.6 Health 137 4.7 Tours 138 4.8 Material facilities 140 4.9 Problems of fig producer farmers 142 4.10 Solutions to the problems of fig producers 146 4.11 Hypotheses testing 151 4.12 Application of Schult’z theory to present
research. 154
CHAPTER 5 :
FINDINGS AND SUGGESTIONS
5.1 Observations 158 5.2 Findings 177 5.3 Hypotheses Testing 197 5.4 Conclusions 200 5.5 Recommendations 203 5.6 Application of Schultz’s theory 209 5.7 Scope for Further research. 213
BIBLIOGRAPHY
214
IX
Sr. No. Description Page No.
APPENDICES
Appendix 1 Questionnaire for Fig Producer Farmers.
222
Appendix 2 Questionnaire for Non Fig Producer Farmers. 229 Appendix 3 List of fig producers villages in Purandar
Taluka 235
Appendix 4 List of fig producers in Purandar Taluka
237
Appendix 5 List of non fig producers in Purandar Taluka 240

X
LIST OF TABLES
Table No. Description Page No.
1.1 Fruit production of the world 3
1.2 Fruit Production in India. 5
1.3 Statewise production of fruits in India. 6
1.4 Country wise area and production of fig in world. 20
1.5 State wise Area, production and Productivity of Fig. 23
1.6 Cultivation and Production of Fig in Maharashtra. 25
1.7 Talukawise area under the cultivation of fig in
Pune District(Year 1994-95 and 2007-08)
26
2.1 Classification of Reviewed related literature. 39
2.2 Divisionwise Fig Plantation area In Maharashtra. 48
2.3 Districtwise fig plantation in West Maharashtra. 49
2.4 Talukawise fig plantation area in Pune District. 50
2.5 Villagewise plantation of fig in Purandar Taluka 52
3.1 Administrative Divisions of Pune District 61
3.2 Sub Divisionwise Distribution of Talukas in Pune
District.
62
3.3 Urban and Rural Population in Pune District 63
3.4 Sex wise Distribution of Rural Urban Population in
Pune District
63
3.5 Employment Status in Pune District. 65
3.6 Geographical land area classification in Pune
District.
65
3.7 Nature of Land required for fig production 66
3.8 Pune District Irrigation Area 69
3.9 Cropping Pattern in Pune District in 2005-06. 70

XI
3.10 Talukawise area under Fig Plantation 72
3.11 Fig producing Talukas in Pune District. 74
3.12 Castewise classification of population. 76
3.13 Land use in Purandar Taluka 77
3.14 Rainfall in Purandar Taluka 78
3.15 Cropwise Production in Purandar Taluka 80
3.16 Fruit plantation wise area. 81
4.1 Selection of Respondents 84
4.2 Types of Residence of A Farmers and B Farmers 86
4.3 Types of Family 87
4.4 Size of Family 88
4.5 Educationwise Classification of A and B farmers 89
4.6 Children’s Education wise Classification 91
4.7 Religionwise Classification of A farmers and B
farmers
93
4.8 Castewise Classification of farmers. 94
4.9 Occupationwise distribution of Fig farmers and
Non Fig farmers.
95
4.10 Land Holding Position. 97
4.11 Subsidiary Occupation of the farmers 99
4.12 Classification of Monthly (consumption
expenditure) of A and B farmers.
100
4.13 Bank depositwise Classification of A and B
farmers.
102
4.14 Sources of Loan. 103
4.15 Loanwise classification. 105
4.16 Refund of Loan 106
4.17 Sourcewise classification of encouragement to Fig
farmers.
107

XII
4.18 Acrewise Fig Plantation and Non Fig plantation in
Purandar Taluka
109
4.19 Water Sourceswise classification of A Farmers and
B Farmers
112
4.20 The irrigation systemwise classification of A
Farmers and B Farmers
113
4.21 Yearwise classification of cost of production of fig
and non fig.
115
4.22 Yearwise classification income of A Farmers and B
farmers.
119
4.23 Profitwise classification of A Farmers and B
Farmers.
123
4.24 Process on fig Production 127
4.25 Marketwise classification of A farmers and B
farmers.
128
4.26 Agriculture based Occupations of Farmers 129
4.27 Farmer’s Satisfaction about fig production. 131
4.28 Effects of Fig production on other farming. 132
4.29 Generation of Employmentwise classification of A
Farmers and B Farmers.
134
4.30 Agricultural implementwise classification of
producer farmers.
136
4.31 Classification of A Farmers and B Farmers on basis
of provision of health facilities
137
4.32 Tour programmes of A Farmers and B Farmers. 139
4.33 Classification of A Farmers and B Farmers getting
material facilities
140
4.34 Problems of Fig producers 142
4.35 Solutions to problems of fig producers 146

XIII
LIST OF GRAPHS
Graph No.
Description Page No.
1.1 Fruit Area in the World. 4
1.2 Fig Production in the World. 4
1.3 Talukawise Area of Fig. 27
2.1 Districtwise Fig Plantation 50
4.1 No. of Producer Farmers 85
4.2 Villagewise selection of Fig Producer Farmers 85
4.3 Villagewise selection of Non Fig Producer
Farmers
85
4.4 Type of Residential Houses 87
4.5 Types of Family 88
4.6 Size of Family 89
4.7 Educational Classification 90
4.8 Children’s Educationwise Classification (Boys) 92
4.9 Children’s Educationwise Classification (Girls) 92
4.10 Religionwise Classification 93
4.11 Castwise Classification 95
4.12 Occupationwise Distribution of Fig Producers 96
4.13 Occupationwise Distribution of Non Fig
Producers
96
4.14 Area of Land Holding 98
4.15 Subsidiary Occupationwise Classification 100
4.16 Classification of Monthly Expenditure 101
4.17 Bank Depositwise Classification 103
4.18 Sources of Loanwise Classification 104
4.19 Loanwise Classification 105

XIV
4.20 Refund of Loanwise Classification 106
4.21 Sourcewise classification of encouragement to
Fig producers.
108
4.22 Fig plantation area upto 1 Acre 110
4.23 Fig plantation area upto 1 to 2 Acre 110
4.24 Fig plantation area upto 2 to 3 Acre 111
4.25 Fig plantation area upto 3 to 4 Acre 111
4.26 The Sources of waterwise Classification 113
4.27 Irrigation Systemwise Classification 114
4.28 Production costwise Classification between Rs.10
to Rs.20 thousand
117
4.29 Production costwise Classification between Rs.20
to Rs.30 thousand
117
4.30 Production costwise Classification between Rs.30
to Rs.40 thousand
118
4.31 Production costwise Classification between Rs.40
to Rs.50 thousand
118
4.32 Production costwise Classification between Rs.50
thousand and above.
119
4.33 Income Classification upto Rs. 1 Lac 121
4.34 Income Classification between Rs.1 Lac to Rs.2
Lacs
121
4.35 Income Classification between Rs. 2 Lacs to Rs.3
Lacs
122
4.36 Income Classification between Rs.3 Lacs and
above
122
4.37 Yearwise profit upto Rs.50 thousand 125
4.38 Yearwise profit between Rs.50 thousand to Rs.1
Lac
125
4.39 Yearwise profit between Rs.1 Lac to Rs.1.5 Lacs 126
XV
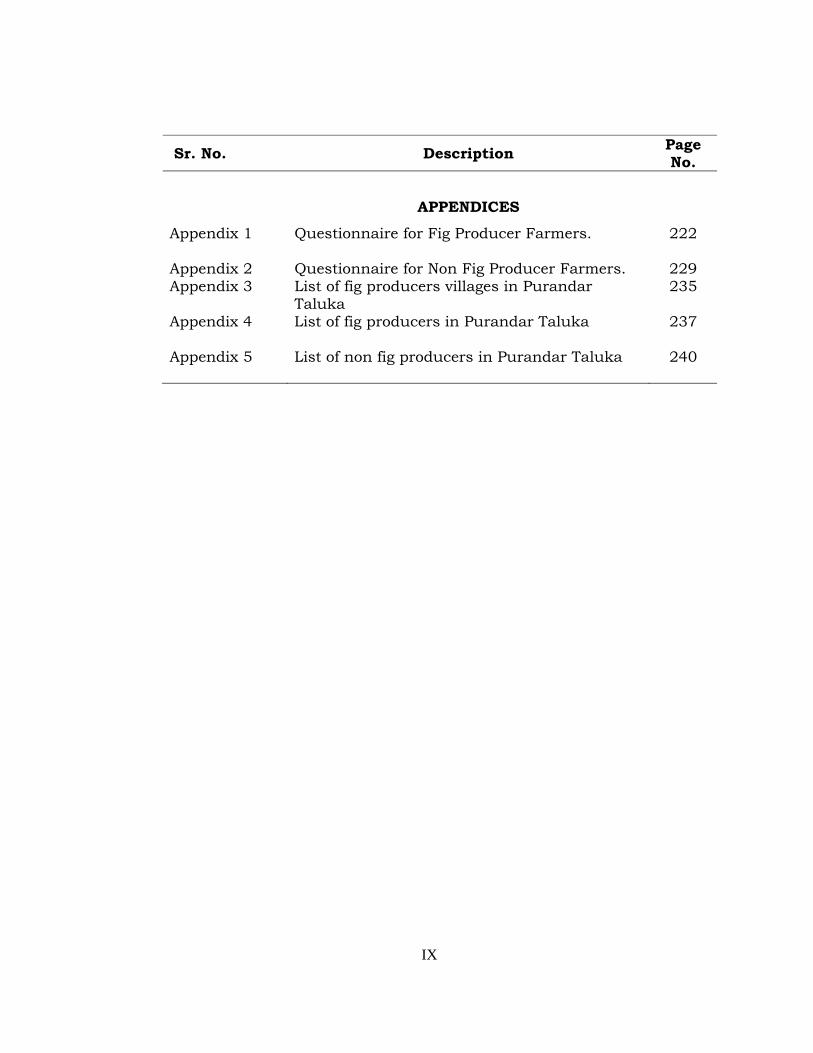
4.40 Yearwise profit between Rs.1.5 Lacs and above 126
4.41 Marketwise Classification of A and B Farmers 129
4.42 Agricultural Based occupation. 130
4.43 Farmers Satisfaction due to fig production. 131
4.44 Effects of Fig production on other farming 133
4.45 Employmentwise classification – Temporary
Employment
135
4.46 Employmentwise classification - Permanent
Employment
135
4.47 Agricultural implementwise classification 137
4.48 Classification of farmers on the basis of health
facilities
138
4.49 Tour programmes 140
4.50 Material Facilities 141

XVI
LIST OF MAPS
Map No.
Description Page No.
2.1 India and Maharashtra State Maps. 48-A
2.2 Pune District Map showing the selected Tahsils 50-A
2.3 Selected Villages in Purandar Taluka 54-A
LIST OF PHOTOGRAPHS
Photo No.
Description
1.1 Trained / Pruned orchard of fig
2.1 Fully grown orchard of fig.
3.1 Fig plant with fruits.
4.1 Field visit of expert with farmers.
5.1 Fig fruits before harvesting.
ABBREVIATIONS
1) A Farmers = Fig Producer farmers.
2) B Farmers = Non Fig producer farmers.
3) A.O = Agriculture Officer.
4) B. D. O. = Block Development Officer.
5) NABARD = National Bank for Agriculture and Rural
Development.
6) PDCC Bank = Pune District Central Co-Operative Bank.
1
CHAPTER 1
INTRODUCTION
1.1 INTRODUCTION
Agriculture is an engine of economic growth and
development. Agriculture constitutes the main source of
employment of the majority of the world’s poor. The share of
agriculture in total employment in developing countries
constitutes 53% of the total work force in 2004. The history of
the world provides overwhelming global evidence that general
economic growth of any nation must be preceded or at least
accompanied by solid agricultural growth. Agriculture has
played this central role. Since the Agricultural Revolution in
England this process still applied today, and poor countries in
Africa, Asia and South America will be no exception.
When we think of sustainable development, the
agricultural sector of any economy is viewed broadly to
encompass the associated aspects of food, farming and natural
resources management.
Agriculture in India has a long history, dating back to ten
thousand years. Today India ranks second the world in respect
of Farm output. Agriculture and allied sectors like forestry and
loggings accounted for 16.6% of the GDP in 2007. It employed
52% of total work force. It is still the largest economic sector

2
and plays a significant role in the overall social economic
development of India. India is the largest producer of fresh
fruits. It is second only to China in the production of rice. It is
second largest producer of Cashews, Cotton seed, fresh
vegetable. It is largest producer of Mango, Papaya, and Sapota.
1.2 FRUITS.
About 10 percent of total production of the fruits in the
world is produced in India. India holds the first position in the
world in producing Papaya, Mangoes, Sapota and Banana.
India produces large variety of food crops. The diversified
agriculture is the priority of the central government. The
technical and financial support is being extended to farmers to
encourage diversitzation especially in the areas of horticulture,
floriculture, medicinal and aromatic plants, apiculture (bee-
keeping) and sericulture, Maharashtra, Tamilnadu, Karnataka,
Andhra Pradesh, Bihar, Uttar Pradesh and Gujrat are the major
fruits growing states in India.
1.2.1 Production of the fruits in the World :
Table 1.1 indicates the figures of cultivated area
and production of the fruits in various countries of the
world.
3
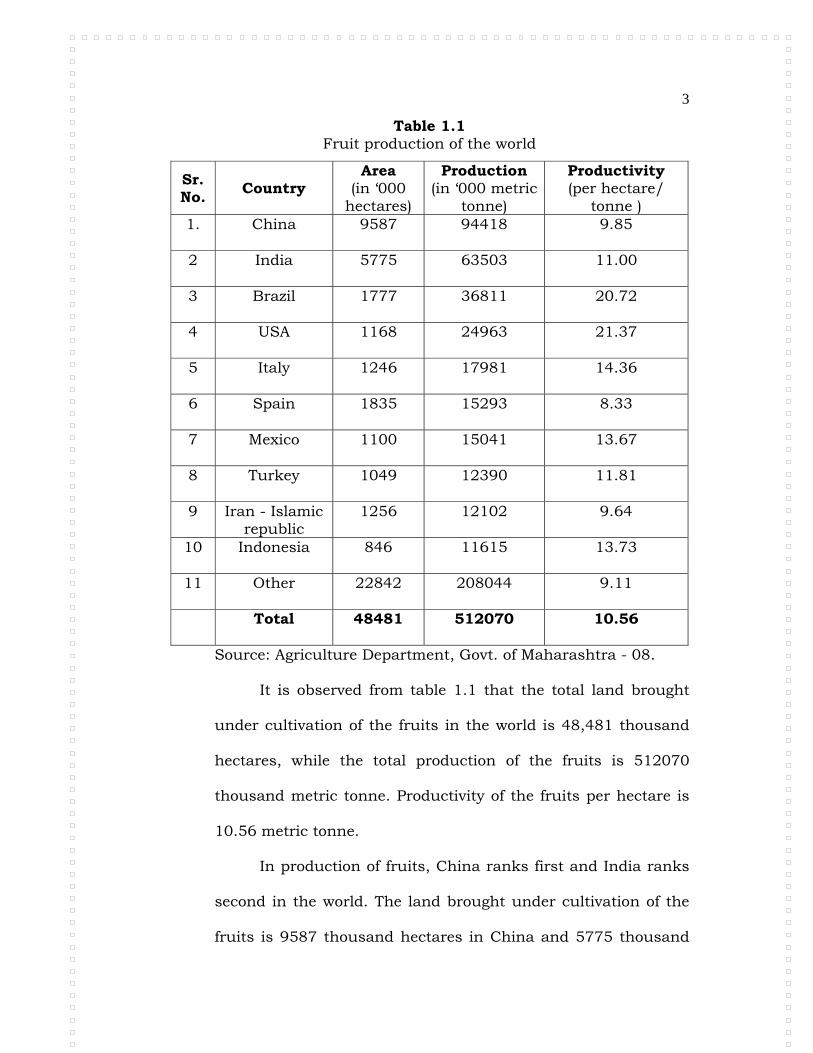
Table 1.1 Fruit production of the world
Sr. No.
Country Area
(in ‘000 hectares)
Production (in ‘000 metric
tonne)
Productivity (per hectare/
tonne ) 1. China 9587 94418 9.85
2 India 5775 63503 11.00
3 Brazil 1777 36811 20.72
4 USA 1168 24963 21.37
5 Italy 1246 17981 14.36
6 Spain 1835 15293 8.33
7 Mexico 1100 15041 13.67
8 Turkey 1049 12390 11.81
9 Iran - Islamic republic
1256 12102 9.64
10 Indonesia 846 11615 13.73
11 Other 22842 208044 9.11
Total 48481 512070 10.56
Source: Agriculture Department, Govt. of Maharashtra - 08.
It is observed from table 1.1 that the total land brought
under cultivation of the fruits in the world is 48,481 thousand
hectares, while the total production of the fruits is 512070
thousand metric tonne. Productivity of the fruits per hectare is
10.56 metric tonne.
In production of fruits, China ranks first and India ranks
second in the world. The land brought under cultivation of the
fruits is 9587 thousand hectares in China and 5775 thousand

4
hectores in India. With productivity of 21.37 tonne per hectare,
United States of America ranks first in the world; while India
ranks seventh in the world with 11.00 tonne per hectare which
is more than China by 9.85 tonne. The graphs indicating fruit
cultivation area in world and fruit production in world are given
in graph 1.1. and 1.2.
Graph No. 1.1. Fruit Area in world
9587
5775
1777 1168 1246 1835 1100 1049 1256 846
22842
0
5000
10000
15000
20000
25000
Chin
aIndia
Brazil
USA
Italy
Spain
Mex
ico
Turkey
Iran - I
slamic
repu
blic
Indo
nesia
Other
Country
Are
a H
ecto
rs
Source : Table No. 1.1
Source : Table No. 1.1
Graph 1.2 Fruit Production in World
94418
63503
3681124963 17981 15293 15041 12390 12102 11615
208044
0
50000
100000
150000
200000
250000
China India Brazil USA Italy Spain Mexico Turkey
Iran - Islamic republic Indonesia Other
Contry
Production Metric Tone

5
1.2.2 Production of the Fruits in India.
In India, the land brought under plantation of the fruits is
increasing constantly, as the plantation of the fruits receives
various grants. Table 1.2 reveals the production of fruits in
India.
Table 1.2 Fruit Production in India.
Year Area (‘000
hectare)
% increase/decrease
Production
(‘000 m. tonne)
% increase/decrease
Productivity (m.tonne/hectare)
2005-06 5324 - 55356 8.10 10.4
2006-07 5554 4.14 59563 7.06 10.7
2007-08 5775 3.82 63503 6.20 11.0
Source: Agriculture Department, Govt. of Maharashtra, 2009-10, Pune
It is observed from table 1.2 that the area under fruits
production in India increased by 8.40 % from 5324 thousand in
2005-06 to 5775 thousand hectares in 2007-08.
The production of fruits increased by 14.71 % from 55356
thousand tonnes in 2005-06 to 63503 thousand tons in 2007-
08. The productivity of fruits has also registered upward trend
from 10.4 m. tonne per hectare in 2005-06 to 11.0 m tonne per
hectare in 2007.08.

6
1.2.3 Statewise Production of the fruits:
Table 1.3 indicates the statewise production of the fruits in
India.
Table 1.3 Statewise production of fruits in India
Sr. No.
State
Area (in ‘000
hectares) 2005-06
Rank
Production (in ‘000
metric tone) 2005-06
Productivity (per hectare/
tonne) 2005-06
1 Maharashtra 7.5 24 10252.3 1432.3
2 Andhra Pradesh
11.1 16 8696.4 853.0
3 Tamilnadu 22.4 3 5778.6 292.3
4 Gujarat 17.3 6 4677.6 306.9
5 Karnataka 16.1 8 4241.8 279.0
6 Uttar Pradesh 11.1 14 3137.2 316.0
7 Bihar 11.1 15 3084.9 286.2
8 West Bengal 13.3 11 2301.7 194.3
9 Keral 8.2 21 2793.1 323.3
10 Jammu Kashmir
7.39 23 1389.3 194.9
11 Aasam 12.0 12 1352.1 122.7
12 Orisa 5.9 27 1403.4 265.3
13 Madhya Pradesh
25.1 2 1173.0 46.7
14 Punjab 14.5 10 746.3 61.6
15 Chhatisgad 9.0 19 601.8 107.7
16 Uttaranchal 4.1 28 676.1 171.3
17 Himachal Pradesh
3.8 29 692.4 202.4

7
18 Tripura 15.9 9 525.1 34.1
19 Rajasthan 16.9 7 418.5 27.6
20 Zarkhand 11.7 13 388.6 37.6
21 Manipur 6.1 26 189.1 39.1
22 Hariyana 8.7 20 236.2 33.6
23 Meghalaya 8.2 22 231.7 28.6
24 Mizoram 3.6 31 66.0 22.3
25 Arunachal Pradesh
2.0 32 105.1 57.5
26 Goa 17.7 5 183.8 11.0
27 Nagaland 1.9 33 19.6 11.8
28 Pondicherry 31.1 1 52.0 1.7
29 Andaman Nicobar
6.4 25 18.5 30.0
30 Dadra and Nagar Haveli
10.1 18 7.1 1.8
31 Sikkim 1.5 34 13.2 9.3
32 Lakshadweep 3.67 30 1.10 0.35
33 Chandigadh 11. 17 1.10 0.10
34 Delhi 17.95 4 0.99 0.06
35 Dadam and Div.
1.35 35 0.02 0.02
Total 10.4 - 55356 5775
Source: Agriculture Department, Govt. of Maharashtra, Pune 2009-10,
It is observed from table 1.3 that fruits are produced in all
states in India. Pondecherry tops in the list with 31.1 thousand
hectares in 2005-06. Total fruits production was 52 thousand
metric tonnes. It is followed by Madhya Pradesh, where total

8
area under fruits was 25.1 thousand hectares with production
of 1173 thousand metric tonnes. Tamilnadu ranks third in the
list with total area of 22.4 thousand hectares and production of
5778 thousand tonnes. Delhi occupied fourth place with 17.95
thousand hectares and production of 990 m. tonnes.
Maharashtra ranks 24th in the production of fruits in India with
total area of 7500 hectares and production of 10252 thousand
tones.
It is observed that total area under fruits in Maharashtra
is 7500 hectares, it has production of 1.2 Lacs tonnes and it is
because of the fact that productivity per hectare is highest in
Maharashtra.
1.3 FIG FRUIT :
All types of fruits are produced in India, such as, custard
apple, pomegranate, jujube, sapota, sweet lime, orange, lemon,
banana, jackfruit, apple, grapes, fig, cashew nut, coconut,
tamarind, guava, etc. The atmosphere, precipitation and
variation of land in India are favourable for cultivation of these
various fruits. The fevarouable land, atmosphere, precipitation
is also exist in India for the cultivation of fig.
1.3.1 Significance of Fig. :
Fig is an important fruit, which has been under
cultivation since ancient time. Fig was unattended crop till the
date. But day by day, more and more land is being brought

9
under cultivation of fig. Farmers who engaged in the fostering of
this fruit were being benefited to a large extend. Fig contains
minerals such as iron, copper and calcium in a large quantity
and plenty of various vitamins. Food items like dry fig,
sweetmeat, fig milkshake etc. are made from fig. Due to all these
reasons, fig has become a significant fruit. As fig blooms rapidly
after cultivation, it becomes possible to bloom the fig in the
consecutive year, which facilitates the immediate earnings.
1.3.2 Importance of Fig from Diet’s Viewpoint :
People prefer to eat fig, which has sachharine taste. Fresh
fig contains sugar (12-18 per cent), calcium, iron, vitamin A and
C in a large quantity. Fig is useful to fulfil the deficiency of iron
in the blood. Thus, fig being full of various nutrients is
nourishing to health. According to Ayurved, fig is used as a
medicine to cure the disease, such as disorder of blood,
tuberalosis constipation and anaemic illness. Dry fig contains a
large quantity of iron along with different types of alkalis and
vitamins. Fig keeps the digestive system intact, which helps to
increase appetite and it also helps to amplify the quantity of
hemoglobin in the blood. Unani practitioners consider a fig to be
the best stimulant. Fresh or a dry fig, being digestive, is believed
to be a valuable fruit, as it is power gainer and blood purifier.
Fig contains various medicinal properties, as it works as a
laxative and appetizer. A fresh or dry fig with warm water, if

10
taken before sleep, brings a good healthy result within five to
seven day. Ayurved alleges that a dry fig proves to be beneficial
to cure the problem of insomnia (sleeplessness). A fig proves to
be useful to get the rid of constipation, thus, the physical
problem arising due to constipation can be prevented.
1.3.3 Importance of Fig as a Dry Fruit :
Dry fig stands at a higher position in dry fruit. An
important food contents in a dry fig have been indicated, which
bring a significance to fig. Dry fruits are always in a great
demand in the festivals like Dasara, Diwali, Ramzan, etc. Dry fig
is important in the countries like Iran, Greece and is sold at Rs.
250 to 300 per kg in the domestic market. Thus, to make dry
fig, it is necessary to import the suitable breeds of fig to produce
it on a large scale in India. Thus, developing the technology and
the allied processing industry is a need of the day, which has a
great scope in the near future.
1.3.4 Importance of Fig as a processed food item :
Considering the demand for the processed fig in the state
and the world, it is essential to cultivate fig, which is suitable to
be processed, on a large scale. Grants are being made available
through various schemes under National Fruit Production
Programme for making various types of food items from the
processed fig and for the grading, packaging, storage and sale of

11
such food items. Every fig producer should take the maximum
advantage of these schemes to enhance the production.
Value added process of fig includes the following
components.
1. Dry Fig.
2. Fig fruit leather.
3. Fig jam.
4. Dry fruits of fig.
5. Fig pulp.
6. Fig sweetmeat.
7. Fig cake
8. Fig powder.
We had fig production on small scale in the earlier time.
Farmers used to get benefited due to a substantial demand
for the fresh figs in the market. But now there are many
farmers producing the fig, which produce the fig in a large
quantity in a fruit season. However, farmers are compelled to
face the difficulties to get proper price for their produce due
to the absence of sufficient demand for the fruits. Ripened fig
can not stay fresh more than 2-3 days; therefore, farmers are
motivated to produce value added food items by processing
the ripened fig. Thus, considering about the increased
production, it would certainly be beneficial, if farmers get

12
themselves engaged into the processing industry based on fig
production.
Members of Shriram Farmers Club of Madha taluka in
Maharashtra have decided to develop dry fruits of fig and wine
from fig as they have successfully cultivated fig on large scale.
1.3.5 Importance of Fig in the view of deep cultivation:
Fig contains plenty of minerals such as iron, copper and
calcium and it also has rich vitamins. Food items dry fig, fig
jam, fig sweetmeat etc. are processed from fig fruit. This has
made a fig a significant fruit.
It has been noticed in the survey about the marketing a
fig that only one person in of one lac population is familiar with
fig. Further, only single person in every three lacs people has
had the taste of this fruit and in every ten lacs people, only one
person enjoys fig regularly. It shows clearly that there is a wide
scope for the cultivation of the fig in the forthcoming time. There
is scope to sell fig in national as well as international market
also. While comparing to other fruits, fig plant bloom in the very
first year and it has a blossom twice in every year, which makes
the cultivation of fig more profitable.
1.3.6 Importance of Fig to earn Foreign Exchange :
Fig, being a perishable fruit, can be processed to have
various food items from it. Food items made from fig like dry
fruits are rich in quality and last for more than a year.

13
Therefore, these foods items can have a foreign market. In the
early times, fig was being exported to foreign countries from
Maharashtra. Plantation of fig has under taken on large scale
owing to good precipitation during last two years. Production of
fig certainly will grow in near future. Thus, the surplus
production of fig, if exported to foreign countries, would
undoubtedly earn huge amount of foreign exchange.
1.4 TYPES AND BREEDS OF FIG. :
Fig belongs to Moraceae family of the flowering plants. It
is a foremost fruit developed from the Hypanthodium tye of
inflorescence. There are more than 1000 sub breeds in this
family. Fig is one of these fruit plants.
There are four types of fig according to the pollination.
a. Capri Fig :
This is also known as ‘Forest Fig’, This kind of fruits
are not eatable, because it contains insects and a dry bunch
of flowers.
b. Smirna Fig :
Stiffness of the seeds can be felt while eating Smirna Fig.
This type of fig contains high quantity of sugar and can be
preserved for a long time.

14
c. White San Pedro :
First crop of this kind of fig can be taken without
pollination; however, pollination is required for the
subsequent crop. Plants of this breed are called as ‘Breva’.
d. Adriatic Common Fig :
Pollination is not necessary for this kind of fig, because
it blooms naturally. Seeds of this breed are thin. These seeds
are not useful for new cultivation. This type of fig is
cultivated in Saswad (Pune) and Daulatabad (Aurangabad) in
Maharashtra. It is also cultivated in Coimbture and some
parts of the state of Gujrat. Adriatic common fig is cultivated
in the countries like Italy, Spain and France. Fruits of this
breed are eatable. Plants of Adriatic Common Fig ensure
assured and high quantity of produce compared to Smirna
Fig.
Despite of these four types of fig as discussed above,
there are many other popular breeds of fig on basis of their
cultivation qualities. Research work on fig has been
undertaken in various Agriculture Universities in
Maharashtra such as Mahatma Phule Agriculture University,
Rahuri, Marathwada Agriculture University and Parbhani
Agriculture University.
Renowned expert of fig Mr. Bobone has classified fig
into different breeds according to fruits size, colour of skin,

15
taste, length. In accordance with these features, there are 52
breeds of fig. All these breeds are found in Portuguese.
Grasovaski, an agricultural scientist, has referred 40 breeds
of fig in Palestine; while Italian scientist Ravasini has
classified fig into 50 different breeds. Caudit, an
agriculturist, has specified that there are 711 breeds of fig,
which are known as 946 sub names. Despite numerous
breeds of fig having local names as Anjir in Marathi, Hindi
and Gujarati following breeds of fig are mostly cultivated and
prevalent.
1. Poona Fig :
This breed, having commercial value, is very popular
among the farmers. The breed of Poona fig tone with Indian
weather and land. The colour of the skin of a fruit is light purple
and colour of the pulp is similar to strawberry, besides, it has a
sweet taste and the fruit is very delicious. The weight of a fruit
is 40-50 gms. and its skin is slender. Because of sweet taste
and high quantity of production Poona Fig is cultivated in
Western Maharashtra on a large scale.
2. Marsels :
This breed is imported from foreign countries and it is
cultivated in mostly in South India. Gradation is not carried out,
as the size of a fruit is middling. The skin of a fruit is soft. The
colour of a fruit is light green and the taste of a fruit is sweet.

16
3. Dienna :
The distinctive feature of Dienna fruit is that its average
weight is more than other breeds of fig. The colour of this fig is
lemon yellow and the colour of the pulp is light yellow. The taste
of its pulp is sweet.
4. Dinkar :
This breed has been innovated at Daulatabad. The size of
this fruit is comparatively bigger than other. Proceeds from this
breed has reached the top when compared to other breeds of fig.
The quantity of sugar in the fruit is found up to 21 bricks.
Dinkar is more popular in Marathwada and progressively more
land is being brought under cultivation of this breed of fig.
5. Black Ichia :
This breed of a fig is known as Black Ichia, as the colour
of this fruit is gloomy purple. By and large, black Ichia is
cultivated at Lakhnow and Saharanpur in Uttar Pradesh. The fig
of this breed survives and grows even in a dry weather
condition.
6. Brown Turkey:
The colour of this fruit is brown. This breed of fig has
been developed in Saharanpur at Uttar Pradesh and Kodur at
Tamilnadu.

17
7. Coimbtur Fig:
This breed is better than Poona Fig. The trees grow up to
two meters. Fruits colours is pink and the fruit has a sweet
taste. Production of this breed is moderately high.
8. Conadriya :
Conadriya is imported from United States of America,
which is known as high yielding breed. The colour of the fruits
is green and the pulp has pink colour. The distinctive feature of
this breed is that the fruits can be dried within a short span of
time and it is an excellent breed for process industry.
9. Excel :
Excel is a breed of fig, which is imported from USA. The
skin of the fruit is yellowish, while the pulp has a colour
combination of pink and yellow. The taste of the fruits is sour
sweet. Excel figs are excellent in every way as its name indicates
itself.
Besides, there are various breeds of fig viz Diredo,
Fladders, Mission, Yovhonno, Salebee, Tena, Rainia, Nardine,
Vienna, Gulban, Iveram, which are found in the United States of
America. Similarly, some breeds of fig are found in India, such
as Ganjam, Banglore, Siserram, Kabul, Lucknow, Bezvada, etc.

18
1.5 HISTORY OF THE FIG :
The sub name of a fig is Anjoos Dumar Simayati. Fig
belongs to Moraceae family of Umbar breed. The scientific name
of fig is ficus caruca. The fig belongs to the family of Umbar,
Banyan, Peepul, Jack fruit and Mulberry. The height of the tree
of fig is medium.
Fig is a fruit developed from a breed of Umbar. In ancient
times, a tree of fig was found near the city of Athens. The tree
was known as holy tree. This fact proves that origination of fig
was at Greece. Various reference of Bible affirms that
proliferation of fig was carried out from the region of Central Sea
to the rest of the world. Fig is supposed to be popular fruit
during 4000 B. C. Fig is also supposed to originate in Western
Asia. Fig was being cultivated in Turkey, Spain, Italy, Greece,
Algeria, and Portuguese from the commercial viewpoint.
Besides, fig is cultivated also in New Zealand, California,
Australia and some region of India. 26 per cent of the total
production of fig in the world comes from Turkey. Principally,
dry fig was produced in United States of America, Greece,
Turkey and Spain.
Fig, has high in nutritious value and rich in food quality,
has been popular as strength boosting and as a medicine since
ancient times. Fig has a great ancient and historical reference.
In India, fig as belonging to the Umbar family is presumed to be
19
sacred. The origination of fig is believed to be in 3000 B. C. in
South Arabsthan.
Mughal Emperor Mohammad Tughlak had shifted his
capital city from Delhi to Daulatabad in 1338 A. D. He was
associated with few of his colleagues, who were well acquainted
with the cultivation of the fruits in Central Asia and Kabul.
These associates cultivated the different fruits in the land in
Daulatabad. Fig was cultivated successfully along with grapes
and strawberry, where the production of fig went on increasing.
In 1550, King of Ahmednagar had given various grants to
Christian mission, which was active at Aurangabad, where he
stimulated the cultivation of the fruits on a large scale. It helped
the cultivation of fig to a great extent. In the middle of
seventeenth century, the cultivation of fig was carried out on a
large scale at Aurangabad, as there was a very high demand for
the fig from the palace and the army of Aurangjeb.
Meanwhile, the fig plant was moved on the way to Pune
from Daulatabad. Especially, in 1904, fig was cultivated at
Jadhavwadi of Divegaon, in Purandar Taluka. Yet fig is found to
be cultivated in a few states.
Fig is also cultivated at Bangalore in the State of
Karnataka. There is production of fig in Shrirangpattan and
Penkonda of Andhra Pradesh and Saharanpur of Uttar Pradesh

20
on a small scale. However, Maharashtra State ranks first in the
production of fig in India.
1.6 AREA, PRODUCTION AND PRODUCTIVITY OF FIG IN THE
WORLD :
Fig has secured a significant place in the world. The
figures indicating production, productivity and area covered are
revealed in Table 1.4.
Table 1.4 Countrywise area and production of fig in world
S. No.
Country Area (In
hectares) % Production %
Average Producti
on (hectare/t
onne)
Rank
1 Albania 9500 2.29 16650 1.56 1.75 10
2 Algeria 49180 11.84 914227 8.55 1.86 3
3 Argentina 251 0.06 827 0.08 3.29 31
4 Australia 30 0.01 56 0.01 1.86 37
5 Azerbaijan Republic
1479 0.35 11361 1.06 7.68 18
6 Bolivia 274 0.07 1750 0.16 6.38 30
7 Bosina and Harjego
2911 0.7 450 0.04 0.15 13
8 Brazil 22 0.01 236 2.22 10 39
9 China 1500 0.36 7000 0.65 4.66 17
10 Columbia 86 0.02 1710 0.07 19.88 36
continued

21
11 Croatia 1370 0.33 2031 0.19 1.48 20
12 Cairprus 383 0.09 3900 0.36 10.18 29
13 Aquadaur 25 0.01 25 0 1 38
14 Egypt 29000 6.98 170000 15.92 5.86 5
15 France 460 0.11 2648 0.25 5.75 27
16 Greece 2750 0.66 23524 2.2 3.63 15
17 India 2750 0.66 12315 1.15 4.47 14
18 Iran, Islamic Republic
51256 12.34 87522 8.2 1.7 2
19 Israel 109 0.03 1380 0.13 12.66 34
20 Italy 3848 0.93 23269 2.18 6.04 12
21 Japan 1181 0.28 15942 1.5 13.49 22
22 Jordan 542 0.13 3481 0.33 6.43 26
23 Lebanon 1400 0.34 6900 0.65 4.92 19
24 Lebion Arab
1992 0.48 5601 0.52 2.81 16
25 Macedonia 20 0 847 0.1 17.35 40
26 Malta 110 0.03 388 0.04 3.52 33
27 Mexico 1025 0.25 6678 0.62 6.41 23
28 Montenjiro Republic
1200 0.29 4000 0.38 8.33 21
29 Morocco 44000 10.59 77000 7.21 1.75 4
30 Pakistan 2498 0.05 730 0.07 2.93 32
31 Peru 566 0.14 1741 0.26 4.86 25
32 Portugal 85900 20.68 6115 0.57 0.07 1
33 Slovenia 7 0 49 0 7 41

22
34 South Africa 700 0.17 1525 0.14 2.17 27 35 Spain 20000 4.82 37000 3.47 1.85 6
36 Syrian Arab Republic
10000 2.41 49800 4.66 4.98 9
37 Tayunishia 15000 3.61 25000 2.34 1.66 7
38 Turkistan 15000 15.65 290141 27.18 4.46 8
39 USA 4978 12 46176 4.32 9.27 11
40 Uzbekistan 100 0.02 1400 0.13 14 35
41 Yemen 445 0.11 4569 0.43 10.46 28
Total 415325 100 1043989 100 2.51
Source: Agricultural Department of Maharashtra (2009-10) Pune.
Following are the observations from table 1.4
1. The total land brought under the cultivation of fig in the
world is 4.15 lac hectares, while in India it is 2750 hectares.
2. Turkey is a leading fig producing country in the world,
followed by Egypt and Algeria. India ranks fifteenth in the
world. However, in case productivity, India ranks twenty
second. Thus, it becomes apparent that there is wide scope
for the cultivation of fig in India.
3. Protuguese is a country, where the utmost area of land
(85900 hectares) has been brought under the cultivation of
fig. followed by Turkey (65000 hectares), Iran (51256
hectares) and Algeria (49180 hectare). On the contrary, in
India, the land brought under the cultivation of fig is
relatively low, i.e. 2750 hectares.

23
1.7 AREA, PRODUCTION AND PRODUCTIVITY OF FIG IN INDIA.
In India, the fig is cultivated in the dry areas, of in the
states like Maharashtra, Karnataka, Tamilnadu and Andhra
Pradesh where the annual rain fall is 500 to 600 mm. In
Maharashtra, fig is produced on commercial basis.
Table 1.5 indicates statewise area and production of fig.
Table 1.5 Statewise Area, production and Productivity of Fig
S. No. State
Area (in
hectares)% Production
(m. tonne) %
Average Production (Hectare/ Tonnes)
1 Maharashtra 2242 77.34 7894 56.67 3.52
2 Karnataka 641 22.11 6021 43.22 9.39
3 Andhra Pradesh
16 0.55 15 0.11 0.93
Total 2899 100.00 13930 100.00 4.80
Source: Agricultral department of Maharashtra (2007-08) Pune.
It is evident from table 1.5 in India, the largest area
brought under the cultivation of fig is in the state of
Maharashtra i.e. 2242 hectares out of 2899 hectares from India.
It means that, 77.34% of total area in India cultivated under fig
is in Maharashtra. The Productivity of fig in Maharashtra State
is 3.52 tonnes per hectare. The productivity of Karnataka is
9.39 tonne per hectare which is 5.87 tonnes more than that of
Maharashtra. However, Maharashtra has a great opportunity to
increase its productivity. Production in Maharashtra is 56.67

24
per cent of the total production of fig in India. The average
productivity of fig of the country is 4.80 tonne per hectare, while
in case of Maharashtra; it is 3.52 tonne per hectare.
1.8 AREA, PRODUCTION AND PRODUCTIVITY OF FIG IN
MAHARASHTRA :
The cultivation of the fig in Maharashtra was confined to
Saswad, Rajewadi, Walhe, Velu and Khedshivapur in Pune
District. But now days the cultivation of fig is extended in other
areas of Pune District, such as, Daund Ambegaon, Junnar and
Haveli. Likewise, the fig plantation is also taking place in the
Districts of Parbhani, Latur, Osmanabad, Ahmednagar, Satara,
Solapur and Jalgaon, where the weather is arid.
In Maharashtra prior to 1990, the land brought under the
cultivation of fig was 300 hectare and after 1990-91, under
employment Guaratnee Scheme, nearly 650 hectare of land has
been brought under the cultivation of fig. The area under fig
plantation varies between 800 to 850 hectares. At present the
total area under the cultivation of fig 2242 hectares. The
cultivation of fig is extended in other districts especially Nashik,
Solapur, Sangli, and East Khandesh.
The area under cultivation of fig is increasing. It includes
mainly Purandar Taluka in Pune District, where Poona fig breed
of fig has been planted on a large Scale. In the earlier days,
Dinkar, a new breed of fig is being cultivated on a large scale

25
around Aurangabad. Similarly, Dienna breed is also being
cultivated to a greater extent. Even though, the cultivation of
Poona fig and Dinkar is taking place commercially on a large
scale, the new breeds, such as Dienna, Conadriya and Excel
have been tested in the research carried out in Agriculture
University at Rahuri.
1.9 CULTIVATION AND PRODUCTION OF FIG IN MAHARASHTRA.
There is a continuous growth in the cultivation and production
of fig in Maharashtra from 2005. Table 1.6 describes the
cultivation and production of fig in Maharashtra.
Table 1.6 Cultivation and Production of Fig in Maharashtra
Sr. No. State
Area (in
hectares)
Average Rate of Growth per
year (%)
Production (Tonnes in
Lacs)
Average Rate of
Growth per year (%)
1 2004-05 944 32.03 2763 20.81
2 2005-06 1371 45.23 3587 29.8
3 2006-07 1671 21.88 4118 14.0
4 2007-08 2242 34.17 7894 52.16
Source: Agricultral department of Maharashtra, Pune (2007-08).
It is observed from table 1.6 that the area under the cultivation of fig
was 944 hectares in 2004-05, in Maharashtra. It increased up to 2242
hectares in the year 2007-08. It means that the cultivated area
increased by 1298 hectares. It makes comprehensible that the growth
of 42.10 per cent in the area under the cultivation of fig has taken
place in Maharashtra during last three year. The production has

26
increased by 5131 lac tonne. This growth of production is 35.00 per
cent. It leads us to conclude that average productivity of the fig
increased.
1.10 AREA OF FIG IN PUNE DISTRICT :
There is an increase in the area under the cultivation of
fig in Pune district from 1994-95.
Table 1.7 shows the growth in the total area that has been
brought under the cultivation of fig during 1994-95 to 2007-08
in each Taluka of Pune District.
Table 1.7 Talukawise area under the cultivation of fig in Pune District
(Year 1994-95 and 2007-08)
Sr. No. Taluka 1994-95 2007-08
Hectars % Hectares % 1 Purandar 243.00 73.86 410.17 56.99 2 Bhor 47.00 14.51 93.30 12.96
3 Haveli 29.00 8.80 72.55 10.08
4 Daund 8.00 2.45 32.10 4.46
5 Junnar 1.00 0.19 25.45 3.53
6 Indapur 1.00 0.19 5.70 0.79
7 Shirur - - 20.30 2.82
8 Ambegaon - - 19.34 2.68
9 Khed - - 2.30 0.35
10 Baramati - - 38.45 5.34
11 Velha - - - -
12 Maval - - - -
13 Mulshi - - - -
Total 329.00 100.00 719.60 100.00 Source: Agricultral department of Maharashtra, Pune (1994-95 to 2007-08).
27
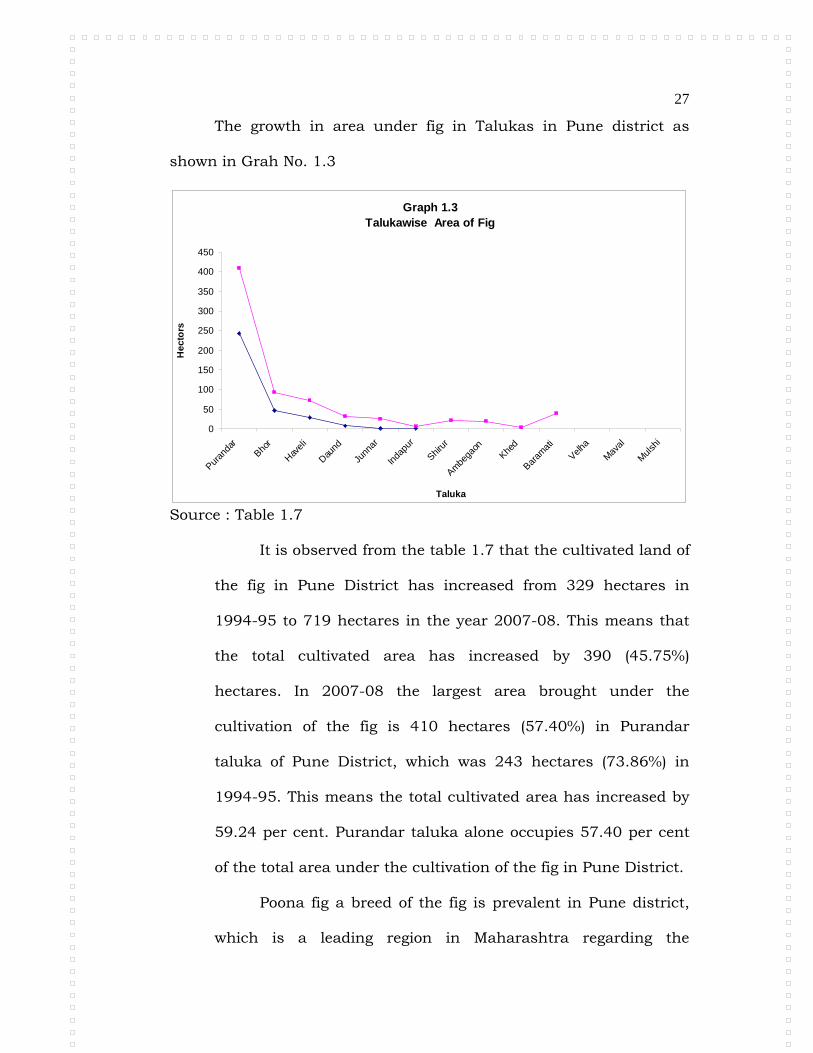
The growth in area under fig in Talukas in Pune district as
shown in Grah No. 1.3
Graph 1.3 Talukawise Area of Fig
0
50
100
150
200
250
300
350
400
450
Puran
dar
Bhor
Havel
i
Daund
Junn
ar
Inda
pur
Shirur
Ambe
gaon
Khed
Baram
ati
Velha
Mav
al
Mul
shi
Taluka
He
cto
rs
Source : Table 1.7
It is observed from the table 1.7 that the cultivated land of
the fig in Pune District has increased from 329 hectares in
1994-95 to 719 hectares in the year 2007-08. This means that
the total cultivated area has increased by 390 (45.75%)
hectares. In 2007-08 the largest area brought under the
cultivation of the fig is 410 hectares (57.40%) in Purandar
taluka of Pune District, which was 243 hectares (73.86%) in
1994-95. This means the total cultivated area has increased by
59.24 per cent. Purandar taluka alone occupies 57.40 per cent
of the total area under the cultivation of the fig in Pune District.
Poona fig a breed of the fig is prevalent in Pune district,
which is a leading region in Maharashtra regarding the

28
cultivation of fig. Fig is cultivated principally in Khedshivapur in
Bhor Taluka, Gogalwadi in Haveli Taluka, Purandar Taluka in
Pune District. Similarly, fig is cultivated in Daund, Baramati
and Junnar Talukas also. Albeit, fig is known as a rare fruit in
India and Maharashtra, it is very popular in the cities of Pune
and Mumbai. When we talk about fig, the areas such as
Purandar, Saswad and Khedshivapur in Pune district come up
on the forefront. Fig of Pune District is poular as Rajewadi Anjir,
in the foreign markets. Fig can be bloomed two times in a year
in Pune District. Blossom that takes places in the months of
July and August in rainy season is known as Khatta Bahar.
Fruits of fig which ripen in this season have moderate sweet
taste. The colour of the fruits is also not so attractive. The
subsequent period of blossom comes in the months of March,
April and May, which is known as Meetha Bahar (Sweet
Blossom). The fruits in this season have a sweet taste and the
quality of the fruits is excellent, which give good earnings. As
the fruits is also eye catching. The fig produced by the farmers
with the help of a favourable weather condition in the region of
Pune is treated as high grade fig.
The fig is cultivated in fifty villages of Purandar Taluka in
Pune district. Nearly 1500 (410) hectares land is under
cultivation of Poona fig in Purandar taluka. In the last year,
Dinkar a new breed of fig was cultivated on the land of 550

29
hectares as recommended by the university. The fig producing
farmers in the village of Gurholi named Ramchandra Khedekar,
Mhasku Dadasaheb Khedekar and Bapusaheb Khedekar and
exported the fig before two years. Later, fig could not be
exported of due to drought in the village.
It is said that for the first time, fig was cultivated before
101 years i.e. in 1904 around Jadhavgadhi near the Dive village
in Purandar Taluka of Pune district. Maharashtra State Fig
Producer Organization was established at Pune on 2nd August,
2006 with an intention to the increase the area to be brought
under the cultivation of fig.
Application of new techniques such as cultivate through
graft use of biological fertilizers, achieve the technique of
blooming, gardening on water sprinkling, deployment of
earthwork fertilizers, pesticides, chemical fertilizers, and organic
fertilizer have made the cultivation of fig more profitable in
many regions of Maharashtra. Purandar Taluka is a leading
region in Pune District in this respect. Especially, the villages in
Purandar Taluka, such as Gurholi, Waghpur, Singapore,
Rajewadi, Dive, Zendewadi, Kalewadi, Sonori, Vanpuri, Pimple,
Supe, Pisarve, Kothale, Chambali, Bhivari, Bobgaon, Garade,
Walhe, Hivare, Risepise, Malshiras, etc. have contributed a lot.
Besides, the cultivation of fig is constantly increasing in the
villages like Khedshivapur (Velu), Shindewadi, Nhavi,

30
Bhongawali, Kondhanpur of Bhor Taluka, Shirval, Khandala
and Bavda.
Moreoever, the grants are given by Government to
undertake the cultivation of fig in the regions of Satara, Sangli,
Kolhapur, Pune, Nashik and Solapur in western Maharashtra.
********

31
CHAPTER - 2 RESEARCH METHODOLOGY
2.1 INTRODUCTION :
The present research is focused on the study of the
economic impact of Fig Production of Dry Land Farmers in Pune
district with special reference to Purandar Taluka. The land
brought under the cultivation of fig varies between 2500 to 3000
hectares. In India, Maharashtra ranks first in the production of
the fig. The fig is cultivated in 2242 hectares of land in
Mahrashtra, especially in the districts of Pune, Nasik,
Aurangabad and Ahmednagar.
A comparative study of the production and the cost of
production of fig producing farmers and non fig producing
farmers with dry land farming is carried out in the present
research. This research work is based on the Schultz’s theory of
transformation of traditional agricultural to modern agriculture.
2.2 SCHULTZ’S THEORY :
2.2.1. Introduction
The only significant contribution of Prof. Schultz was his
thesis on the subject of Transformation of Traditional
Agriculture, 1 published in 1964.
1. Schutlz Thedore W., (1964), Trasnforming Traditonal Agriculture, New
Haven and London, Yale University Press.

32
“How to transform traditional Agriculture, which is niggardly,
into a highly productive sector of the economy is the central
problem”2 of the thesis put forth by Prof. Schultz.
2.2.2 Summary of Schultz’s Thesis :
Schultz’s whole thesis of Traditional Agriculture may be
summarised in his own words:
The man who is bound by Traditional agriculture cannot
produce much food no matter how rich the land. Thrift and
work are not enough to overcome the niggardliness of this type
of agriculture. To produce an abundance of farm products
requires that the farmers has access to and has the skill and
knowledge to use what science knows about soils, plants,
animals and machines. To command farmers to increase
production is doomed to failure even though they have access to
knowledge. Instead, an approach that provides incentives and
rewards to farmers is required. The knowledge that makes the
transformation possible is a form of capital, which entails
investment. Investments not only a material inputs in which a
part of this knowledge is embedded but importantly also
investment in farm people”.3
___________________________________________________________________________________
2. Ibid., p. 4 3. Op. cit. 206

33
His th esis can be studied in two parts.
Part 1 : Traditional Agriculture
Part 2 : Transformation of Traditional Agriculture.
Part 1 : Traditional Agriculture
Agriculture is the back bone of the Indian Economy.
Agricultural development is central to economic of the country.
It is primary sector of economy. It provides food to mankind and
raw material to industry.
2.2.3 Old Doctrines :
Physiocrates believed that the agriculture alone is
productive, for it yields, the subsistence of its worker, the
earning of entrepreneurs and surplus (rent), while industry and
trade are sterile, since no such surplus (extra income) is
produced in these two sectors.
The classical economists put forth a dynamic model of
growth based on accumulation of capital, Malthusian
population law and law of diminishing returns.
Schultz refutes all these doctrines. He believes that these
doctrines do not stand empirical tests. Schultz also refutes the
doctrine of “disguised unemployment” and factor individualism.
2.2.4 Traditional Agriculture :
Traditional farming is a farming which is carried on with
the factors of production used for generations. The countries,

34
dependent upon traditional agriculture, are poor and these
countries spend much of their income on food.
Mellor’s4 model of the Economics of agricultural
development is yet another significant contribution to
agricultural economics. He published this model in 1966.
Accordingly to Millor, the traditional agriculture is
primarily peasant farming characterised by back word primitive
and labour intensive agriculture, with low productivity. These
are generally small sized farms and in the absence of alternative
avenues of employment, labour force employed per farm is
much higher as compared to high income countries. Resource
allocation is perfect and rational in these developing countries.
The land and labour are the principal inputs of traditional
agriculture. Capital exists in traditional agriculture in the form
of crude tools and implements, bullocks etc. which have very
low productivity.
In short, traditional agriculture tends to be characterised
by low level of utilisation of resources, low levels of productivity
and relatively high levels of efficiency in combining resources
and enterprises.
These three factors are interrelated. Collectively they
suggest little scope for rapidly increasing either total production
of productivity per unit of the resources within the context of a
traditional agriculture, but very great scope of increasing total
production and resource productivity through technological
change.
_____________________________________________________________________ 4. Millor, J. W.; (1969) Economics of Agricultural Development, Bombay,
Vora and Co.

35
Part 2 : Transformation of Traditional Agriculture to
modern agriculture.
Schultz pointed out traditional agriculture is a particular
type of economic equilibrium. It is an equilibrium at which
agriculture gradually arrives over a long period of time, provided
particular conditions prevail. This type of equilibrium is not
readily subject to change.
According to Schultz, traditional agriculture can be
transformed in modern agriculture such transformation
depends on the following.
a. New factors of production.
b. Availability and price of non traditional (modern)
agricultural inputs.
c. Modern material inputs.
d. Farm people with modern skills.
e. Investment in human capital.
Prof. Schultz has stated that, differences in land are least
important, differences in the quality of material capital are of
great importance and differences in the capabilities of farm
people are most important in explaining the differences in the
amount and rate of increase in farm production.
Hypothesis of Schultz was that “the rate at which farmers
who have settled into traditional agriculture accept a new factor

36
or production depends upon its profit, with due allowance for
risk and uncertainty and in this regard the response is similar
that observed by farmers in modern agriculture”.3 He also
suggested that farmers are remarkably efficient in allocating the
factors at their disposal in current production. According to
Schultz, there is no correlation between the size of farms and
productivity.
He asserted that modern agricultural inputs must be
available at reasonable rate. That will lead to investment in
agricultural profitable.
According to Schultz, the investment in human capital
has radical social and economic implications41. He emphasized
that education is the best form of investment in human capital.
2.3 STATEMENT OF THE PROBLEM:
The statement of this research is, The economic impact
of fig production on dry land farmers in Pune District (with
special reference to Purandar Taluka, from 2005-06 to 2009-10)
2.4 SELECTION OF SUBJECT :
Dry land farming is the main subject of this research.
87 % of the cultivated area in Maharashtra is rain fed.
Out of the said area, 40 percent is drought prone – area.
Agriculture is the mainstream of the state of
Maharashtra. Agriculture is the main occupation of the people.
Both food crops and cash crops are grown in the state. Large

37
area of the state has been brought under fruit cultivation. There
is major proportion of area of the under irrigation.
Even after the realization of the full potential of irrigation
across the river basins in the state, the problems of scarcity
areas (especially those with low water balance) would continue
on the agenda of the planners of agricultural sector. The
drought prone area of the state is spread over 89 Talukas and
cover 35.4 per cent of the Geo-graphical area of the state.
All types of fruits are produced in India. India is a
continental country. The atmosphere, precipation and variation
of the land favourable for cultivation of fig also exist in India.
The largest area brought under the cultivation of fig is in
Maharashtra State.
During 2005-06 total area under fig plantation was 1371
hectares in Maharashtra. The area under fig plantation was 466
hectares (33.92%) in Pune District in 2005-06. This is followed
by 206 hectares (14.99%) in Osmanbad, 201 Hectares (14.63%)
in Latur, and 195 hectars (14.19%) in Ahmednagar district
Horticulture is useful for dry land farming Maharashtra
state is leading for fruit production and hence it is known as
Depot of fruits.

38
On this background the researcher has selected this
subject, other reasons are given as under:
1. In India maximum fig production is in Maharashtra and
in Mahrashtra, Purandar Taluka, Dist : Pune.
2. In Purandar taluka Fig cultivation and production is
concentrated in Walhe, Rajewadi, Sonori, Pimple, Guroli,
Dive villages. These villages produce about 90% fig in the
district. Walhe is the home town of the researcher and
hence the selection.
3. For the plantation of fig production the climate should be
dry, Hillslope, Medium Land i.e. slowly tempering and
cooling lately is essential. This climate is observed in
Purandar taluka.
4. For fig plantation purpose, the dryland is very much
profitable.
5. Profit of Fig production is estimated Rs. 2.5 lacs per
hectare. In other fruits this is about Rs. 1 to 1.5 lacs only.
6. In India more than 50% fig production is in Purandar
Taluka and so this area is selected for study. In last some
years there is Draught and even then the fig crop is
existing, Familieis are steady living. Due to figs the
standard of soil is maintained. Therefore this subject is
choosen.

39
2.5 REVIEW OF RELATED LITERATURE :
The researcher has traced seventeen references for the
review of related previous researches and literature. The
Research material is classified into following six groups:
Table No. 2.1.
Classification of Reviewed Related Literature
Sr. No.
Literature related to Sources
Number of researches
A. Fig 4 books and 3 theses 7
B. Custard Apple 1 Thesis and 1 Project 2
C. Pomogranate 2 Articles and 1 Project. 3
D. Ber 1 Article 1
E. Other Fruits 2 Articles and 1 Project. 3
F. Accounts 1 Book 1
Total 17
The review of related literature is narrated as given below.
A. Research material related to the Fig :
1. Patil Ved Prakash1 has written a book entitled Fig
Plantation after a substantial research on the Crop of
fig. This book is published in 2000 by Continental
Publication, Pune. It provides useful information to the
researcher for the proposed research.
2. Khaire B. A.,2 Regional Fruit Research Centre, Pune has
published book entitled as Anjeer Baag. This book is
published in 2001 by Continental Publication, Pune. He
has written about the fig and its process in detail. This

40
Book is helpful to the researcher while arranging the
information related to origination and history of the fig.
3. Tayade B. M.3 submitted his thesis, titled An Economic
Investigation into the production and Marketing of
Figs in Pune District to Mahatma Phule Agriculture
University for the degree of Ph. D. in 1971, wherein he
studied regarding the production expenditure and
marketing expenditure of fig. This information was useful
to researcher.
4. Bongane, Satish4 has presented in 2009 the Ph. D. thesis
entitled, Fig Cultivation in Western Maharashtra and A
study of marketing expenditure (Especially in the
context of Pune District). He has studied the cultivation
of the fig and the marketing expenditure in detail, wherein
he has accepted a proficient viewpoint.
5. Regaon S. K. 5 presented in 1997 his thesis title
Marketing of Fig in Purandar Block” for the degree of
M. Sc. of Mahatma Phule University at Rahuri. He has
shown that the income received by the producer of Pune
district and Mumbai is 57.26 per cent and 42.74 per cent
respectively.
6. Sanghavi K. U. and Katole Ravindra 6 have published a
book, entitled Fig Plantation and Process Industry. This
book is published in 2008 by Godawa Prakashan, Pune –

41
9. This book gives detail information of fig output. It
provides secondary data for this research.
7. Raut V. G.7 has published a book entitled New Fig
Plantation in 2005. This book was published by Saket
Prakashan, Aurangabad. This book provides details,
analysis of fig plantation.
The review of four books and three theses on fig
plantation is taken by the researcher. These books and
research work have guided the researcher to frame out his
research.
B. Research Material Related To Custard Apple:
Custard apple is produced in Purandar taluka
subsequent to fig. The researches carried out in this
regard are as follows:
8. Pokharkar S. A. (1996)8 has carried out The study of
Marketing of custard apple in the district of Beed, He
has explained that for augmentation of custard apple, Rs.
2160/- has to be spent every year.
9. Jadhav Balasaheb (2007)9 has studied The production
and marketing of custard apple in the Solapur
District. This research would be useful for the production
and marketing of the fig.
Custard apple is considered as a substitute fruit to
fig. These two references about the study of production,

42
expenditure and marketing of custard apple are helpful to
the researcher to analyse the comparative study of the
production, expenditure and marketing of fig fruit and
non fig fruits.
C. Research Material Related to Pomogranate :
10. Pujari A. G. (1998)10 conducted the study on the topic
Proceed and future of pomogranate and Jujube in the
District of Solapur and set forth his findings that the
relation between land holding of gardens and the
expenditure for raising a crop is contradictory. Similarly,
albeit, the expenditure of the cultivation per acre is higher
in case of the farmers belonging to a small group, the
income per hectare received by them is comparatively
high. This article is published in Indian Journal of
Agricultural marketing.
11. Bembalkar G. K. (2001)11 has conducted the research for
his M. Sc. degree on the topic titled Economics of the
production and marketing of pomegranate in the
Solapur District of Maharashtra State. Here the cost of
production of pomegranate has been analysed. This has
provided important information to the researcher to
analyse the cost of production of pomegranate.
12. Khunt12 and others published an article entitled
Economics of production and marketing of

43
pomegranate in 2003 in Indian Journal of Agricultural
Economics.
These references are useful to the researcher to
have comparative analysis of production, expenditure and
marketing of fig fruits and non fig fruits in this research.
D. Research Material Related To Ber :
13. Mali B. K. and others13 have published their article on
Marketing of Ber in Maharashtra in 1997 in Indian
Journal of Bihar in Agricultural Marketing.
This article provides the information of Ber in
Maharashtra State.
E. Research Material Related to Fruits:
There are two articles and one M. Sc. Research on fruits.
14. Karansingh and others14 published in 2001 an articles
entitled, Pattern of production and marketing of fruits
crops in Punjab in Indian Journal of Agricultural
marketing.
15. Deshmukh Sachin Nanasaheb Submitted a project for M.
Sc. Degree, entitled Production and marketing of fruits
in Solapur District in 2004. His finding are useful to the
researcher to compare the production, expenses and
marketing of fig and Non fig fruits.

44
16. Mukharji Ishta and Edward 16 published article, entitled
Economics of fruts marketing in Pune District in 1993
in Artha Vidnyan Pune.
This provides secondary data for the said research.
F. Accounts of Agriculture.
17. Waghmare R. A. and Bhapkar D. A. 17 have published a
book, in 1992, entitled, Accounts of Agriculture. This
book is published by Continental Publication, Vijay Ngar,
Pune. This book is useful for this research.
In this way during the present research work the
researcher has referred above literature, giving due
citation. This review of related researches was very useful
for the researcher at every step of research from
preparation of research proposal to the report writing.
2.6 IMPORTANCE OF RESEARCH.
Horticulture is important for water scarcity zone. The soil
of the scarcity zone is brown to black, clacarious and with
varying depth and texture. 87% of the cultivated area in
Maharashtra is rain fed. But of it, 40 percent is drought prone
area. Large area of the state is brought under fruit cultivation.
Scarcity areas are especially with low water balance.
Maharashtra Government declared 89 talukas as the scarcity
zone in Maharashtra. Purandar, Baramati, Indapur, Daund,
45
Bhor talukas of Pune district are declared by the government of
Maharashtra as drought prone talukas.
The researcher has selected Purandar taluka as the
representative of the drought prone area. The main crops of this
scarcity area are Jowar, cotton, wheat, ground nut and
sunflower.
Fig, custered apple, pomegranate, ber are popular fruits
grown in this area. Land, water, hilly area and climate are
considered for Horticulture. The area under plantation in
Maharashtra was 222.8 lacs hectares in 2001-02. Out of this
area, 13% area was under horticultural plantation. Total area
under irrigation was 16.4% or total plantation area in
Maharashtra. It means 83.6 % is dry area, whereas horticulture
programme is fruitful.
Due to shortage of ground water, the roots of fruit trees
are in deep area. Fig and other fruits survive on limited water.
Fig production is highest in Pune District, followed by
Aurangabad and Ahmednagar.
Maximum area out of total 29 lakh hectares dry land in
the state is to be used for horticulture such as custered apple
and pomegranate etc.
The horticulture yields net profit of about Rs. 1 to 1.5 lacs
per hectar. The fig plantation yields Rs. 2 to 2.5 lacs net profit

46
per Hectares. These fruits are very profitable from waste and
Dry land to the agriculturist in the state.
For the economic development of farmers having dry and
waste land the fruit plantation is useful. It may to increase
exports and earn foreign currency. Hence this research of fig is
very important. Fig crop is useful as it also generates
employment. At present, Indian export of fruits is only 1% in
International fruit market. This needs to be increased by
extending plantation area under fig.
This research has separate entity. It contributes to the
present research. It analyses the betterment of financial status
selected farmers of Purndar Taluka. It compares financial
position of fig farmers and non fig farmers. Such kind of
research is unique and has separate entity.
2.7 OBJECTIVES OF RESEARCH :
Following are the objectives of research.
1. To study the impact of fig production on economic
development of dryland farmers.
2. To compare the financial status of fig producer farmers
and non fig producer farmers.
3. To study the impact of fig plantation on agriculture based
occupations.
4. To find out the problems of fig producer farmers.
5. To suggest solutions for the problems of dry land fig
producers.

47
2.8 HYPOTHESES OF RESEARCH.
The following hypotheses are tested in this research.
1. Fig plantation helps the producer farmers to improve their
financial status.
2. Comparatively fig producer farmers are earning more than
the non fig producer farmers.
3. Fig production has good effects on agriculture based
occupation.
4. Farmers are not processing the figs.
5. Fig producer farmers have various problems during the fig
production.
2.9 RESEARCH METHODOLOGY :
This research is based on the primary data and secondary
data collected during the research .The survey method of
research is used for this research work.
2.9.1 Primary Data:
The primary data are collected from the farmers. These
farmers are selected by stratified random sampling method. For
this research work the area (Maharashtra, Western
Maharashtra, Pune District, Purandar Taluka and villages) and
the farmers from the villages were selected as follows:

48
2.9.1.1 Selection of Maharasthra. :
In the first stage, Maharashtra state is selected. During
the year 2005-06 Maharashtra State has the highest area of
1371 hectares (49.85%) under fig plantation as against 2750
hectares in India. Thus as the highest fig producing state
Maharashtra was selected for this work.
2.9.1.2 Selection of Western Maharashtra
Within Maharashtra the fig production is concentrated
mainly in the Konkan, Western Maharashtra, Marathwada and
Vidarba. In fig plantation the Western Maharashtra has the
highest area of 736 hectares (53.68%) in plantation. Therefore,
Western Maharashtra was selected for this study. The division
wise fig plantation is given in table No. 2.2
Table No. 2.2
Divisionwise Fig Plantation in Maharashtra.
Sr. No. Division
Area (in Hectares) Percentage
1 West Maharashtra 736 53.68
2 Marathwada 632 43.09
3 Vidarbha 03 3.23
4 Konkan - -
Total 1371 100.00
Source : Agriculture Commissioner, Pune (2009-10).
From table 2.2 it is observed that West Maharashtra has
the highest area of 736 Hect (53.68%) under Fig plantation.

49
Hence this division is selected for study. The division wise map
of Maharashtra is given in Map No. 2.1
2.9.1.3 Selection of Pune District :
In Western Maharashtra, there are three divisions viz.
Pune, Nashik, and Kolhapur Divisions. District wise fig
plantation area is given in Table No. 2.3.
Table No. 2.3 Districtwise fig plantation in West Maharashtra.
S. No. District Area (in Hectares) Percentage
A Nashik Division. 1 Nashik 17 02.30
2 Dhule 8 01.09
3 Nandurbar 2 0.28
Total 27 3.67
B Kolhapur Division.
5 Satara 23 3.12
6 Sangli 15 02.04
7 Kolhapur 03 0.41
Total 41 5.57
C Pune Division
8 Ahmednagar 194 26.50
9 Pune 466 63.18
10 Solapur 8 01.08
Total 668 90.76
A+B+C Grand Total 736 100.00
Ref : Agriculture commissionerate , Pune (2005-06).
It is observed from table No. 2.3 that the area under fig
plantation in West Maharashtra is 736 Hectares. Out of that,
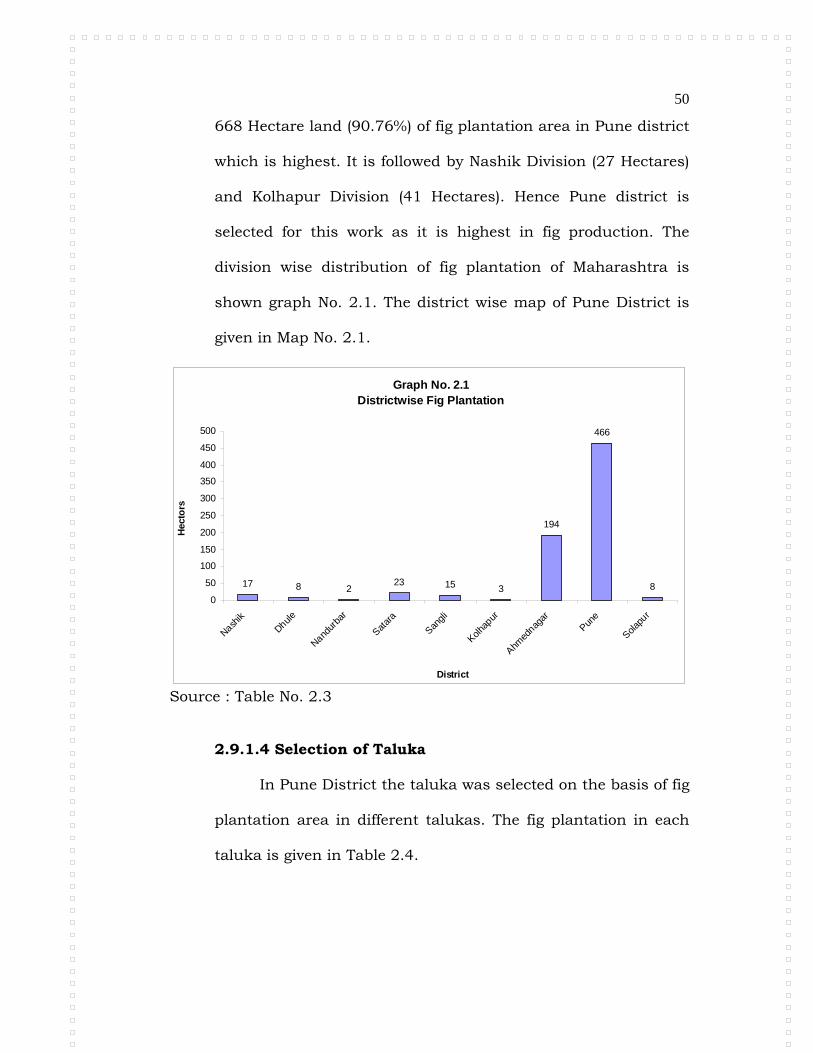
50
668 Hectare land (90.76%) of fig plantation area in Pune district
which is highest. It is followed by Nashik Division (27 Hectares)
and Kolhapur Division (41 Hectares). Hence Pune district is
selected for this work as it is highest in fig production. The
division wise distribution of fig plantation of Maharashtra is
shown graph No. 2.1. The district wise map of Pune District is
given in Map No. 2.1.
Graph No. 2.1 Districtwise Fig Plantation
17 8 223 15 3
194
466
80
50
100
150
200
250
300
350
400
450
500
Nashik
Dhule
Nandur
bar
Satar
a
Sangli
Kolhap
ur
Ahmed
nagar
Pune
Solapu
r
District
Hec
tors
Source : Table No. 2.3
2.9.1.4 Selection of Taluka
In Pune District the taluka was selected on the basis of fig
plantation area in different talukas. The fig plantation in each
taluka is given in Table 2.4.

51
Table 2.4 Talukawise fig plantation area in Pune District.
Sr. No.
Taluka Area (in Hectare) Percentage.
1 Purandar 214.17 45.92
2 Bhor 90.00 19.30
3 Haveli 65.00 13.94
4 Daund 28.60 6.13
5 Junnar 19.70 4.22
6 Indapur 18.44 3.95
7 Shirur 16.00 3.43
8 Ambegaon 12.50 2.68
9 Khed 2.00 0.43
10 Baramati - -
11 Velha - -
12 Maval - -
13 Mulshi - -
Ref : Agriculture commissionerate , Pune (2005-06).
It is observed from table 2.4 that from total fig plantation
area in Pune District is 466.41 hectares and out of that 90%
area is in the Purandar, Bhor, Baramati, Haveli and Daund
talukas. Purandar Taluka is on the top with 214.17 hectares
(45.92%) area under fig production in Pune District. Therefore
researcher has selected the Purandar Taluka for the purpose of
this study. The taluka wise map of Pune District is given in Map
No. 2.2
2.9.1.5 Selection of Villages
There are 101 villages in Purandar Taluka . It is observed
from the records of agricultural officer, Purandar that there are
50 villages (Please refer Appendix 3) out of 101 villages which

52
are known as fig plantation villages. The average fig plantation
for these 50 villages is calculated for 5 years from 2005-06 to
2010-11. This information is given in table 2.5.
Table No. 2.5
Villagewise plantation of fig in Purandar Taluka
(Only the main fig producing villages are considered)
Sr. No. Name of the village Area 1 Sonori 81.50
2 Pimple 29.00
3 Walhe 27.00
4 Supe Khurda 25.00
5 Kalewadi 24.80
6 Shivari 22.00
7 Jadhavwadi 20.55
8 Dive-2 16.65
9 Garholi 14.33
10 Dive -1 14.33
11 Zendewadi 13.95
12 Borhalawadi 12.00
13 Singapur 11.15
14 Waghapur 6.30
15 Somurdi 5.40
16 Bhivari 4.00
17 Lapatalwadi 2.40
18 Devadi 2.15
19 Garade 2.00
20 KJodit Budruk 2.00
21 Vanapuri 1.60
22 Pingori 1.50
23 Rakh 1.40
24 Nawali 1.20

53
25 Thoaptewadi 1.20
26 Walunja 1.10
27 Mandaki 1.00
28 Gulunche 1.00
29 Pimpare Khurda 1.00
30 Saswad 1.00
31 Kodit Khurda 1.00
32 Rajuri 1.00
33 Paragaon 1.00
34 Udachiwadi 0.90
35 Khalad 0.90
36 Bhivadi 0.870
37 Naygaon 0.80
38 Rajewadi 0.80
39 Pisarve 0.75
40 Pokhar 0.60
41 Sakurde 0.50
42 Jawalarjun 0.40
43 Karnalwadi 0.40
44 Jeur 0.40
45 Aambale 0.40
46 Vir 0.20
47 Nazare K. P. 0.20
48 Bhosalewadi 0.20
49 Khanwadi 0.20
50 Takrarwadi 0.15
* : Selected fig producing villages. Source : Department of Agriculture, Purandar, 2009-10.
It is observed from table 2.5 that Sonori (81.50), Pimple
(29), Supe (25), and Walhe (27) are first four villages in

54
Purandar, taluka having 162.50 hectare of land under fig
plantation. Therefore, these four villages are selected for the
purpose of study. The map of Purandar taluka indicating these
four villages is given in map No. 2.3.
There are 50 villages in which fig is cultivated in Purandar
Taluka, (Please refer Appenxure 3)
2.9.1.6 Selection of Farmers :
The list of farmers from selected four villages has been
taken from agriculture officer, Purandar. Total fig producer
farmers are 1172 in 2009-10. From the every village 25 fig
producer farmers and 25 non fig producer farmers are selected
by lottery method. In this way 100 fig producer farmers (Please
refer Appendix 4) and 100 non fig producer (Please refer
Appendix 5) are selected from four villages (Sonori, Pimple, Supe
and Walhe) by using stratified random sampling method. Thus
the total sample is 200 farmers.
The primary data were collected through the field work by
providing questionnaire to these selected fig producer farmer
and non fig producer farmers. Separate questionnaire for fig
producer farmers (Please refer Appendix 1) and quastionnaire
for non fig producer farmers (Please refer Appendix 2) were
developed by the researcher and used for the collection of
primary data.

55
2.9.2 Secondary Data :
The researcher has visited to the well known research
centres and institutes for collection of secondary data. Mainly
reference books, reference volumes, journals have been studied.
History of fig fruit is collected from Mahatma Phule Agriculture
University, Rahuri, Dist: Ahmednagar. The Statistical
information regarding production and expenditure on fig
production is collected from Marhatta Chamber of Commerce
and Industries, Senapati Bapat Road, Pune and Gokhale
Institute of Politics and Economics, Pune. From commissioner of
Pune, the information in respect of districtwise and talukawise
fig production is collected. The sub division officer, Baramati
provided fig plantation data in his division. The information of
villagewise fig plantation in Purandar taluka along with Sonori,
Pimple, Supe and Walhe villages are collected from Talathi
Offices and Circle Offices. Also reference Books, Volumes are
referred from Tilak Maharashtra Vidyapeeth, Pune, Pune
University, Agriculture College, Pune and and Zilla Parishad,
Pune and from the library of Z. P. Internet facility is used for
latest information.
2.9.3 Statistical tools
The statistical tools used in analyzing primary and
secondary data are Tabulation and percentages. Similarly
different types of graphs are also used for the presentation of
the data.

56
2.9.4 Limitation of Research :
1. This research is limited to study the economic impact only.
2. The research is limited to dryland farmers only.
3. It is also limited to the dry land farmers of Maharashtra state.
4. The present research is limited to the farmers from Pune
district only.
5. The sample covers four villages in Purandar Taluka.
6. The sample includes only 100 fig producer farmers and 100
non-fig producer farmers.
7. This research is also limited to the economic development of
fig producer farmers in comparison to Non fig producer
farmers.
8. The data collected for this research is within the period from
2005-06 to 2009-10.
9. The conclusions of this research depend on the responses of
the selected farmers.
2.10 CHAPTER SCHEME.
The research report of this study includes the following
five chapters.
Chapter 1 : Introduction
In this introductory chapter, the origin of fig fruit and
production at the National and International level are given. The
fig production in Purandar Taluka, Bhor Sub Division, Pune
District and Maharashtra State are explained.

57
Chapter 2 : Research Methodology
In this Chapter research objectives and research
hypotheses are given. The importance of this research is also
explained with reference of research literature.
Chapter 3 : Geo-physical and Socio – Economic review
In this third chapter, Geo-physical and socio economic
review of Pune district and of Purandar Taluka are given. The
areas and production of horticulture crops in the district and
Purandar Taluka are given.
Chapter 4: Analysis and Interpretation of Data.
In the chapter the primary data collected from the selected
Dryland Farmers are analyzed along with the secondary data.
Questionnaire served to the fig producer famers and non
fig producer farmers covers personal, family information, area of
fig plantation or other fruit plantation actual expenditure, total
annual income rain water, irrigation source, capital source and
marketing of product.
This analysis also covers health, tours, material facilities,
and problems of fig producer farmers. It gives the testing of the
hypotheses. It attempts to study the application of Schultz’s
Theory of Transformation of Traditional Agriculture to modern
Agriculture to present research.
Chapter 5: Findings and Suggestions:
This chapter is divided into four sub sections namely
findings, summary, suggestions and scope for further research.
The observations are based on first three chapters findings are
based on fourth chapter. There are 32 observations in this
chapter. Researcher has also given 23 suggestions regarding fig
production, problems and solutions to overcome them.
*******

58
REFERENCES
1. Patil Vedprakash (2000), Fig Plantation Pune, Continental
Publication, Vijay Nagar,
2. Khaire, B. R. (2001), Fig Garden, Continental Publication,
Pune, Vijay Nagar.
3. Tayade, B. M., (1971), An Economic Investigation in the cost
of production and Marketing of figs in Pune District a
Thesis.
4. Bongane, Satish., (2009), West Maharashtra – Fig Plantation
and Marketing expenses study (specially Pune District).
5. Regan, S. K., (1997), Marketing in Purandar Block of Pune
District, M. Sc., Project.
6. Sanghavi, K. U. and Katole, Ravindrda., (2008), Fig Plantation
and Process Industry, Pune, Godawal Prakashan.
7. Raut, V. G., (2005), New fig Plantation, Aurangabad, Saket
Prakashan.
8. Pokharkar, S. M. (1996), Marketing of Custard Apple in Beed
District- A case study, M. Sc. Porject.
9. Jadhav, Balasaheb., (2007), Production And Marketing
Management of Custard Apple in Solapur District.
10. Pujari, A. G. (1998), Marketing of Pomegranate and Ber
Indian Journal of Agril, Marketing 12 (1) Pages 121-125.
11. Bembalkar, G. K. (2001) Economics of production marketing
and export of Pomegranate from Solapur District of
Maharshtra State, M. Sc. Project.
12. Khunt and Others (2003), Economics of Production and
Marketing of Pomegranate Indian Journal of Agricultural
Economics, 17 (1) : Page 10.
13. Mali, B. K. and Others (1997), Marketing of Ber in
Maharashtra Indian Journal of Agricultural Marketing, 5 (2)
228-230.

59
14. Milor, J. W.; Economics of Agricultural Development, Vora
and Co. Bombay.
15. Karansingh and others (2001), Pattern of Production and
Marketing of fruits crops in Punjab: Indian Journal of
Agricultural Marketing, 15 (2), : 8-13.
16. Deshmukh, Sachin Nanasaheb (2004), Production and
Marketing of fruits in Solapur District, M. Sc. Project.
17. Ishta Mukharji Edwards (1993), Economics of Fruits
Marketing in Pune District, Artha Viaynan XXXV (4) page 402.
18. Millor, J. W., (1969), The Economics of Agricultural
Development, Bombay Vora and Co.
19. Schutlz Thedore W., (1964), Trasnforming Traditonal
Agriculture, New Haven and London, Yale University Press.
20. Waghamare, R. A. and Bhapkar, D. G., (1992) Accounts of
Agriculture, Pune, Continental Publication.
WEBSITES
A. Gerdien Meuernik and Pim Roza: (2005), The role of agriculture
in development, makers Chains and sustainable development
strategy and poicy, paper No. 5 stitching DLO Wageningen
(http://www.boci.wuv.nl/uk) publication.
B. Lennat Bage : Agriculture and Economic Development out
planet (www.unep.org).
C. Mandivamba Rukuni: The growing business (www.unep.org/our
planet)
D. The Free Eneyelopaedia: Agriculture in India.
(http/en.wikipaedia.org).
E. H. M. Chandra Sekhar : Changing Scenario of Organic farming
in India : An Overview (http://www.academic journals.org).

60
CHAPTER 3
GEO-PHYSICAL AND SOCIO-ECONOMIC REVIEW : PUNE DISTRICT
AND PURANDAR TALUKA
3.1 INTRODUCTION :
This research studies The impact of fig production on
dry land farmers in Pune District (with special reference to
Purandar Taluka, from 2005-06 to 2009-10).
This chapter is divided into 2 sections, first section deals
with Geo-Physical and Socio-economic aspects of Pune District
and second section deals with Geo-physical and socio-economic
aspects of Purandar Taluka.
SECTION I : GEO-PHYSICAL AND SOCIO-ECONOMIC
FEATURES OF PUNE DISTRICT.
3.2 GEO-PHYSICAL FEATURES OF PUNE DISTRICT :
Pune District lies between 170-54’ and 190-24’ North
latitude and 730-19’ and 750-19’ East longitude. Pune District is
surrounded on the North by Ahmednagar district, on the East
by Ahmednagar and Solapur districts, on the South by Solapur
and Satara Districts and on the West by Raigad and Thana
Districts. Total geographical area of Pune District is 15642 sq.
km.
The rural area is 15021 sq. km. (96.02%) and the urban
area is 621 sq. km. (3.98%).

61
3.3 ADMINISTRATIVE INFORMATION OF PUNE DISTRICT:
Pune District is divided into five Sub Divisions. e.g.
Baramati, Haveli, Khed, Bhor and Maval.
Table 3.1 indicates the administrative divisions in Pune District.
Table 3.1 Administrative Divisions of Pune District
Sr. No.
Information
Pune District Nos.
1 Total Talukas 13
2 Total Tahasil Body (Panchayat Samiti) 13
3 Total villages 1866
4 Urban 25
5 Corporations 2
6 Municipalty 11
7 Total Grampanchayat 1401
8 Total Banks 246
A. Scheduled 130
B. Their Branches 573
C. Pune District Co. Op. Bank Branches. 247
Source : Pune District Economical Social Review 2008-09.

62
Table No. 3.2 Indicates the distribution of 13 Talukas of Pune
district in five sub divisions.
Table No. 3.2
Sub Divisionwise Distribution of Talukas in Pune District
Sr. No Sub Divisions Talukas Covered. 1 Baramati Baramati
Daund Indapur
2 Khed Khed Ambegaon Junnar
3 Haveli Haveli and Area. 4 Bhor Bhor
Purandar Velhe
5 Maval Maval Shirur Mulshi
Source : Socio Economic Review and District Statistical
Abstract, Pune 2008-09.
It is observed from table 3.2 that there are 3 talukas in
Baramati Sub Division, 3 Talukas in Khed Sub Division and 1
Taluka and other area in Haveli Sub Division. 3 Talukas in Bhor
sub division and 3 talukas in Maval sub division. Purandar
Taluka selected for study comes under Bhor sub division.
3.4 POPULATION
Pune District is second highest in population in
Maharashtra State. Urban and Rural Population of Pune
District is given in Table 3.3

63
Table 3.3 Urban and Rural Population in Pune District
(In Lacs)
S. No. Particulars of Population
Pune District Nos. Percentage
1 Rural 30.31 41.92
2 Urban 42.01 58.08
Total 72.32 100.00
Source: Soc-Economic Review and District Statistical Abstract - 2008-09.
It is observed from table 3.3 that rural population is 30.31
lacs (41.92%) and Urban Population is 42.01 lacs (58.08%).
3.4.1 Sexwise Distribution of Rural Urban Population
Table 3.4 indicates Male Female distribution of Rural Urban
Population in Pune District
Table 3.4 Sexwise Distribution of Rural Urban Population in Pune District
(In Lacs) Sr. No.
Particulars Rural Urban Total
Nos % Nos % Nos % A Pune District 30.31 41.91 42.00 58.09 72.31 100.00
1 Male 15.57 21.53 22.11 30.57 37.68 52.10
2 Female 14.74 2.38 19.89 27.50 34.63 47.90
Source : Socio-Economic Review and District Statistical Abstract
2008-09.
It is observed from Table 3.4 that male Population is
37.68 lacs, (52.10%) and it is more than female members in
Pune District. Female population was 34-63 lacs. (47.90%) The

64
sex ratio in Pune District is 919 as per 2001 census as against
922 at the state level.
3.4.2 Literacy
As per census 2001 the literacy rate in Pune District was
80.45% as against 76.9% at the state level. The literacy rate
among male is 88.34% in Pune District, as against 86% at the
State level. The literacy rate of females was 71.89% in Pune
District as against 67% at the state level. Pune is known as
Educational Hub.
a) Primary Schools
The total number of primary schools in Pune District was
4440 in 2002-03, as against 67291 in Maharashtra State in
2003-04. Total number of students enrolled in primary school in
Pune district was 780000 in 2002-03, as against 1,16,89,000 in
2003-04 in State.
b) Secondary Education :
There were 1099 high schools, with 6,70,000 students in
Pune District in 2002-03. This number was 17985 with
10122000 students in 2003-04 in Maharashtra State.
c) Higher Education
Total institutes imparting higher education were 810 in
Pune District as against 1878 at the state level.

65
3.4.3 Employment
Table 3.5 indicates the employment situation in Pune District.
Table 3.5 Employment Status in Pune District.
(Figures in Lacs)
S. No. Particulars
Male Female Total Rural Urban Total Rural Urban Total
1 Earning
Population
8.64 11.51 20.15 6.51 2.86 9.37 29.32
2 Non
Earning
Population
6.53 10.59 17.12 8.22 17.02 25.24 42.20
Total 15.17 22.10 37.27 14.73 19.88 34.61 71.52
Source: Soci-Economic Review and District Statistical Abstract table.
It is observed from 3.5 that out of total 71.52 lacs population
29.32 lacs population (41.11%) is employed and rest is dependent
population. The ratio of employed to dependent is 41:59.
3.5 LAND
Table 3.6 indicates geographical area.
Table 3.6 Geographical land area classification in Pune District.
Sr. No.
Particulars Area in Hectares
Percentage on Total Area
1 Net Plantation Area 940800 60.23
2 Dusota 210100 13.45
3 Area under crops 1150900 73.68
4 Forest 162300 10.39
5 Waste Land Area 248800 15.93
Total Geographical Area 1562000 100.00
Source : Socio-Economic Review and District Statistical Abstract
2008-09.

66
The observations of table 3.6 are as under:
Maharashtra is important state in India. South Table
Land is made by Lava. On this table Land Besalt and Granite
rocks are seen. The soil of Maharashtra is made by depreciation
of rocks.
The soil of Pune District is created due to effect of the
above things. Black soil, Purple Soil, Rock soil are the types of
soils found in Pune District. Calcium soil is found in the
Purandar Taluka. The Potacium soil ratio is more and this soil
is more productive such slippery land is important for fig
horticulture.
Table 3.6 shows geographical area. The net plantation
area is 60.23%. Dusota land is 13.45. The Crops cover the total
area upto 73.68%. Waste and other uncultivated land area ratio
is 15.93% and under the Forest area is 10.39.
3.6 LAND REQUIRED FOR FIG PRODUCTION.
Table 3.7 gives details of the nature of land required for fig
production.
Table 3.7 Nature of Land required for fig production
S. No. Nature Percentage
1. Rock Ratio 38.99
2. Moisture Percentage 28.00
3. Organic Things 2.80
4. Natra Ratio 0.06
5. Limestone 0.60
6. Sulfure 0.28 Source : Socio-Economic Review of Pune District 2008-09

67
It is observed from table 3.7 that highest percentage of
38.99 is of Rock Ratio followed by moisture percentage (28%).
This land is useful for Horticulture especially fig output.
In all professions or different units the education is very
important unit and it is essential for selection of crops,
irrigation system, Manure, Germicide, Market Rate, Transport,
Agriculture Product, Sales, Third Party, Product Packing,
Horticulture Management etc.
If the farmer is illiterate, having faith in, superstitions, he
turns to traditional agriculture. He is not ready to adopt modern
technique.
3.7 CLIMATE
Maharashtra had very special climate. At the West side
Sahyadri Hills are effective for climate. It is also same climate in
Pune District. Parallel Coastiline of Konkan at North South lane
has effected on climate. Due to these hills, south west mansoon
gives rainfall to the District.
In the summer season, climate is hot in Pune District.
3.8 TEMPERATURE
The temperature in Pune District is changing. In March,
April, May and June there is summer season in the District. The
annual minimum temperature is 10.500 and maximum
temperature is 37.700. In the summer season May is very hot
with maximum temperature ranges upto 420.

68
3.9 RAINFALL :
Generally Monsoon starts in June. Monsoon comes from
Southwest. In the western part of Pune district the annual
average ratio of rainfall is upto 400 cm. In Maval area rainfall is
200 to 400 cm. The average rainfall is 50-100 cm in Western
side of Pune District which covers Bhor, Velha, Maval, Mulashi,
Khed, Ambegaon and Junnar Talukas. The average rainfall is
1171 mm is in Junnar. From West to East rainfall ratio is less.
For the East Taukas minimum average of rainfall is less than
the average. It is less in the Purandar Taluka which is
prominent area for the fig production.
3.10 RIVERS
Bhima river is the prime river in Pune District. It flows
from Bhima Shankar in Sahyadri range and flows South East
and enters into Solapur District. Velu and Ghod rivers are on
left side of Bhima and Bhama. Indrayani, Mula and Mutha
rivers are on its right side. These are sub rivers. On the south
border of Pune District, there are Nira River. Karha, Kukadi,
Pavana, Meena, Gunjavani, Pushpavati, Shivaganga. These
rivers overflows in rainy days and become dry in summer. Each
Taluka in Pune District has a river.
3.11 IRRIGATION
The geophysical area of Pune District is suitable for
irrigation. Hence the number of small and major irrigation

69
projects is significant. It covers Pimpalgaon Joga, Yedgaon,
Dimbe, Manik Doh, Vadaj, Chaskaman, Varasgaon, Panshet,
Khadakwasla, Mulshi, Pawana, Ghod, Nazare, Ujani, Bhatghar,
Nira, Deodhar.
3.12. IRRIGATION AREA IN PUNE DISTRICT
Irrigation Area in Pune District shows in table 3.8
Table 3.8
Pune District Irrigation Area.
S. No.
Types of Irrigation Hectares Percentage
1 Through Canal and other 94782 36.02
2 From Wells 168426 63.98
Total irrigation Area 263208 100.00
Source - Socio Economic Review 2005-06.
It is observed from table 3.8 that the total irrigation area
is 263208 hectares and out of this, higest percentage is of wells
(63.98%) irrigation followed by Canal irrigation (36.02%).
3.13. CROPPING PATTERN
In the Pune District Bhor, Velha, Mawal, Mulashi, Khed,
Ambegaon and Junnar Taluka are on the West side. Rice,
Nachani, Sag, Pawata and other forest productions are taken. In
Junnar, Ambegaon and Khed, maximum Adivasi community is
settled. The climate of Purandar, Haveli, Shirur, Baramati,
Indapur and Daund Talukas is hot and dry. Here the
agriculture is mostly dependent in Monsson.

70
In Baramati, Haveli, Daund, Indapur Talukas there is
canal irrigation and hence the crops are taken such as Sugar
cane, grapes and other fruits, vegetable. The cropping pattern in
Pune District is given in Table 3.9
Table 3.9
Cropping Pattern in Pune District in 2005-06.
S. No. Crops Hectares Percentage.
1 Food grains 751000 62.26
2 Legume (Kaddhanya) 83900 7.29
3 Sugarcane 53800 4.67
4 Spice Crops 7800 0.68
5 Fig 466 0.04
6 Other fruits 15224 1.32
7 Vegetables 57900 5.03
8 Edible Oils 92200 8.01
9 Non Edible Oils 24200 5.60
10 Other Crops 64410 5.60
Total 1150900 100.00
Source : Socio economic Review 2008-09.
It is observed from table 3.9 that the total cropped area in
Pune District is 1150900 Hectares and maximum area of
65.26% is covered by food grains. It is followed by Edible oils
(8.01%) Legumes (7.29%) Sugarcane (04.67%) and other crops
such as Edible and Non Edible oil (5.60%) Area under fig
plantation is 0.04%.

71
3.14 FRUITS AND VEGETABLE :
Fruits and Vegetable area is increasing in Pune District.
Banana in Junnar, Grapes in Baramati, Junnar and Haveli and
Pomogranate, Fig and Custerdapple in Purandar are taken. In
Purandar Taluka Chilly production is taken. Tomato production
is taken in Junnar, Ambegao, Haveli taluka. Lemon fruits
production is taken in Daund, Baramati and Shirur taluka.
3.15 HORTICULTURE AREA :
In Pune District in different area, different fruits
production has been taking i.g. Fig, Pomogranate, Grapes,
Custardapple, guava, lemon, Mango etc. In Pune District
different fruits plantation area is mentioned in the following
table 3.10.
It is observed from Table 3.10, that total plantation area
in Pune District is 1150900 Hectors. Out of total area maximum
plantation of 156418 (13.59%) is in Shirur Taluka followed by
Junnar (11.87) Khed (9.96%), Indapur (9.82%) Bhor (2.82%).
Total area under Fig plantation is 466.41 hectors in Pune
District. Purandar taluka (45.92%) is on the top, followed by
Bhor (19.30%) Haveli (13.94%). Baramati (6.13%), Daund
(4.43%) and Khed Taluka (0.43%) Maval, Mulashi and Velhe
Talukas and Indapur Taluka have no fig plantation.

72
Fig production in different Talukas in Pune District is
given in Table 3.10
Table 3.10 Talukawise area under Fig Plantation
S. No.
Taluka Under Plantation
Total area (in Hectares)
Fig Plantation Total Area
( in Hectares)
Fig Plantation comparative ratio
with total plantation area.
1 Purandar 80852 (7.03) 214.17 0.26
2 Bhor 32459 (2.84) 90.00 0.27
3 Haveli 91907 (7.99) 65.00 0.07
4 Baramati 110292 (9.58) 28.60 0.02
5 Daund 91590 (7.96) 20.70 0.02
6 Maval 53712 (4.67) - -
7 Mulashi 39147 (3.40) - -
8 Velhe 37649 (3.27) - -
9 Junnar 136567 (11.87) 12.50 0.009
10 Indapur 112970 (9.82) - -
11 Khed 114663 (9.96) 02.00 0.001
12 Shirur 156418 (13.59) 16.00 0.01
13 Ambegaon 92674 (8.05) 17.44 0.01
Total 1150900 (100.00) 466.41(100.00) 0.04 Source : Agriculture Commissionerate, Pune (2005-06)
While comparing the fig plantation with total plantation area it
is seen from table 3.10 that it is 0.27% in Bhor followed by Purandar
(0.26%), Haveli (0.07%) Baramati (0.02%), Daund (0.02%), Junnar
(0.009), Khed (0.001), Shirur (0.01%), and Ambegaon (0.01).

73
3.16 TRANSPORT AND COMMUNICATION
Transport is third important place of human life. The
economic development of country is depends on the transport
facility.
As per 2001 statistics, fast express Ways, National High
ways, State Highway and village roads are available in the
District. The total length of all these roads is 13554 Km. The
length of National highways is 302 Km. The National Highways
i.e. Mumbai Fast Express ways, Pune Nasik, Pune Solapur,
Pune Mumbai, Pune Bangalore, Pune Miraj, and Pune Solapur
are available Pune is Railway Junction. The Sattelite Channels,
Doordarshan, Akashwani and News papers are the important
mediums of communications available in Pune District.
SECTION II
GEO-PHYSICAL AND SOCIO ECONOMIC FEATURES OF
PURANDAR TALUKA IN PUNE DISTRICT.
3.17 INTRODUCTION :
The researcher has selected Purandar taluka for research
as this Taluka is highest in Fig production in Pune district. The
table 3.11 indicates villagewise classification of all talukas of
Bhor Sub Division of Pune District.

74
Table 3.11 Major Fig producing villages of the Talukas in Pune District
S. No.
Taluka Total
Villages
Fig Plantation
Villages Percentage.
1 Purandar 101 50 49.50
2 Bhor 196 09 4.59
3 Haveli 160 25 15.62
4 Baramati 117 22 18.80
5 Daund 97 14 14.43
671 128 19.07
Source : Socio Economic survey 2005-06.
It is observed from table 3.11 that, Purandar Taluka tops
with 49.50 coverage of villages under fig plantation. It is
followed by Baramati Taluka (18.80%), Haveli (15.62%), Daund
(14.43%) and Bhor (4.59%) Hence Purandar Taluka is selected
for the purpose of study.
3.18 GEO-PHYSICAL FEATURES OF PURANDAR TALUKA
Purandar Taluka lies between 180-17’-20’’ and 180-17’-34’’
North latitude and 730-58’-29’’ and East Longitude, Purandar
Taluka is one of 13 Talukas in Pune District. Purandar Taluka
is surrounded on the north by Haveli, and Daund Talukas on
the East, on the South by Satara District and on the West by
Bhor Taluka.

75
Total geo-graphical area of Purandar Taluka is 1099.73
sq. kilometers.
There are 2 towns viz. Saswad, Jejuri and 101 villages in
Purandar Taluka.
3.19 LAND AND CLIMATE
The climate of Purandar Taluka is hot and dry. Total
cultivable land in Purandar Taluka is 98059 hectares. Out of it
79048 hectares of land is net cultivated area. It comes to
71.63%. The land under horticulture is 6525 hectares. It is
6.65% of total cultivable area.
The climate of Purandar Taluka is suitable for
horticulture and especially for fig fruits. The highest
temperature is 39.05 Celsius and minimum temperature is
10.50 Celsius. The annual average rainfall is about 711.72 mm.
SOCIO-ECONOMIC ASPECTS.
The socio economic aspects of Purandar Taluka are
divided into two parts: A) Social Aspects B) Economic Aspects.
3.20. SOCIAL ASPECTS.
The social aspects of Purandar Taluka cover population,
density, rural urban population, sex ratio, castewise,
Classification of population and worker population education
etc.

76
3.20.1 Population :
Total population of Puandar taluka was 223428, out of
which 174604 (78.23%) was rural population and 48824
(21.77%) urban Population.
3.20.2 Density
The density of population in Purandar taluka was 265 in
2001 as against 462 in Pune District.
3.20.3 Sex Ratio
The sex ratio of Purandar Taluka was 927 in 2001 as
against 919 in Pune District.
3.20.4 Caste
Table 3.12 inicates castewise Classification of Population
in Purandar Taluka
Table 3.12 Castewise classification of population
Sr.
No. Particulars Male % Female % Total %
1 Rural Population 88885 77.90 85799 18.47 174604 78.23
Urban 25215 22.10 23609 21.53 48844 21.77
Total 114100 100.00 109328 100.00 223428 100.00
2 Advanced Caste 104402 91.52 99966 91.43 204368 91.46
3 Schedule Caste 7479 7.16 7272 6.65 14751 6.60
4 Schedule Tribe 2219 2.12 2090 1.92 4309 1.94
Source : Socio Economic Survey 2005-06.
It is observed from table 3.12 that rural population is
78.23% whereas urban population is 21.77% in Purandar
taluka. The advanced caste population is 91% whereas S. C.

77
population is 7% and S. T. population is 2% in Purandar
Taluka.
3.20.5 Education
The literacy in Purandar Taluka indicates that total
150206 (77.34%) is literate. Out of them the rural literate
population is 114380 (73.32%) and urban literate population is
35826 (84.60%).
The literacy rate for men in Purandar Taluka is 87.51% as
against female literate 66.90%.
3.21 ECONOMIC ASPECTS
3.21.1 Land Use
The land utilization in Purandar Taluka is given in Table 3.13.
Table 3.13 Land use in Purandar Taluka
S.
No. Particulars
Land
(In Hectares) %
1 Total geographical Area 110355 100.00
2 Forest 2221 2.01
3 Non Agricultural Land 8137 7.37
4 Follow Land 11448 10.37
5 Net Area Shown (Cultivated Area)
79048 71.63
6 Cultivable Area. 98059 88.85
7 Plantation Area 80852 73.26
8 Fig Plantation Area. 214.17 0.26
Source : Socio – Economic Survey, 2005-06

78
It is observed from table 3.14 that total cultivable area in
Purandar Taluka is 98059 hectors. Plantation area is 80852
hectares (73.26%) follow land is 1448 hectares (10.37%) which
can suitably be brought under plantation.
3.21.2 Rainfall.
West side of Purandar Taluka gets ample rain which is
useful to Kharip crops, i.e. Rice Jawar, Bajra, East Side of
Purandar Taluka is getting less rainfall. Pea crops area usually
taken here the average annual rainfall is given in table 3.14
Table 3.14 Rainfall in Purandar Taluka
S. No. Year Rainfall mm.
1 2004-05 707
2 2005-06 1139
3 2006-07 1480
4 2007-108 535
5 2008-09 446
6 2009-10 895
7 2010-11 738
Average 848
Source : Socio Economic Review 2010-11.
It is observed from table 3.14 that Purandar Taluka gets
848 mm rainfall on an average. There was excess rainfall in
2005-06, 2006-07 and 2009-10. In the rest of the year total
annual rainfall was below the average.

79
3.21.3 Irrigation.
Total irrigation area minus Dusota area will be net
irrigated area. In Purandar Taluka out of total 83501 hectares
land under cropped area, 18061 hectares land is irrigated. Out
of 18061 hectares irrigated land, 16664 hectares land is under
well irrigation and 825 hectares land by canal irrigation.
3.21.4 Drought prone Area.
Five talukas in Pune District are declared by the
Government of Maharashtra as drought Prone Areas. These are
Purandar, Daund, Baramati, Indapur, and Shirur. Out of total
104 villages in Shirur Taluka 104 villages (100%) are drought
prone. Purandar taluka has 100% villages (total villages 101)
covered under drought prone area. All 117 villages in Baramati
Taluka and all 97 villages in Daund Taluka are drought prone.
But 144 villages out of 145 villages in Indapur Taluka are
drought Prone.
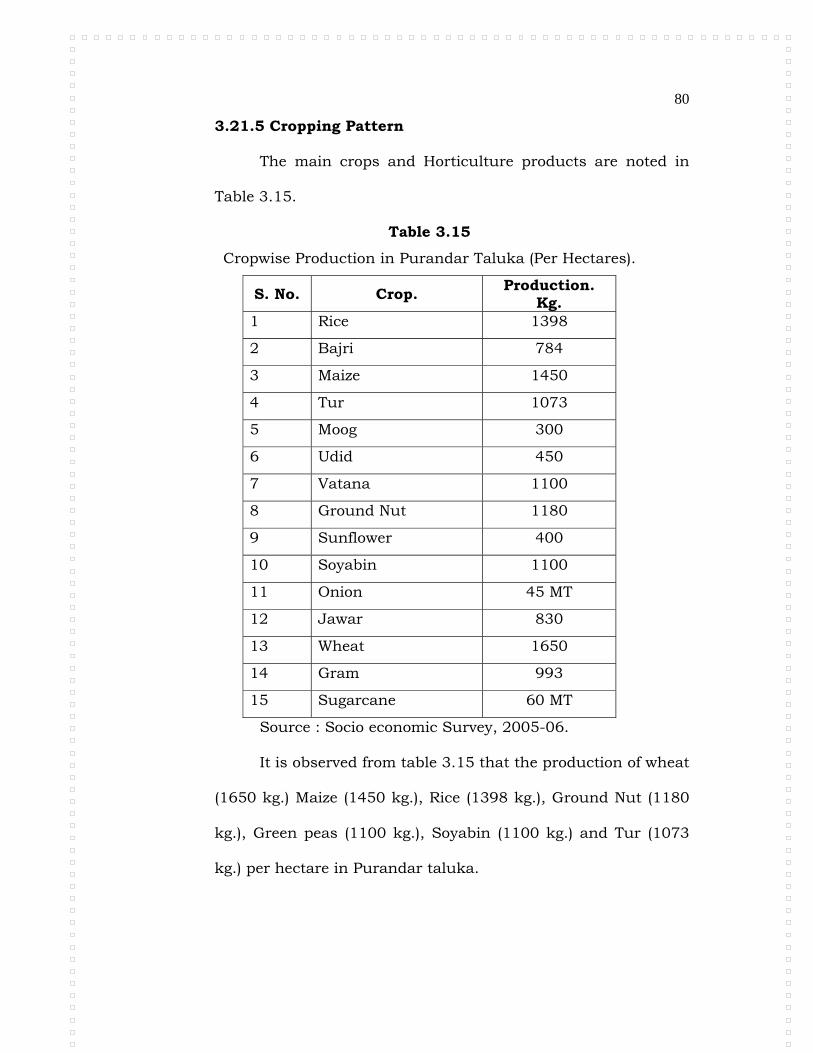
80
3.21.5 Cropping Pattern
The main crops and Horticulture products are noted in
Table 3.15.
Table 3.15
Cropwise Production in Purandar Taluka (Per Hectares).
S. No. Crop. Production.
Kg. 1 Rice 1398
2 Bajri 784
3 Maize 1450
4 Tur 1073
5 Moog 300
6 Udid 450
7 Vatana 1100
8 Ground Nut 1180
9 Sunflower 400
10 Soyabin 1100
11 Onion 45 MT
12 Jawar 830
13 Wheat 1650
14 Gram 993
15 Sugarcane 60 MT
Source : Socio economic Survey, 2005-06.
It is observed from table 3.15 that the production of wheat
(1650 kg.) Maize (1450 kg.), Rice (1398 kg.), Ground Nut (1180
kg.), Green peas (1100 kg.), Soyabin (1100 kg.) and Tur (1073
kg.) per hectare in Purandar taluka.

81
3.21.6 Horticulture
Total geographical area of Purandar taluka is 110355
hectares and out of It area under plantation is 80852 hectares
(73.26 %) The total irrigated area in Purandar Taluka is 18995
hectares. The ratio of irrigated area to total plantation is
23.49%. The fruit plantation wise area is noted in Table 3.16.
Table 3.16 Fruit plantationwise area
Sr. No. Crops Pvt. E. G. S. Total
Living Trees Area H.
1 Custard Apple 931.58 3800.40 4731.98 2106.50
2 Mean (Chikku) 169.65 872.80 1042.45 404.50
3 Fig 259.73 1175.50 1435.23 493.00
4 Mango 57.03 170.00 227.03 121.70
5 Pomogranate 258.53 978 1236.53 699.00
6 Tamarind 4.15 35.40 39.55 34.00
7 Lemon 2.85 11.90 14.75 58.50
8 Myrobalan 16.75 71.35 88.10 0.40
9 Guava 47.71 114.45 162.16 130.00
10 Orange 41.83 56.60 98.43 11.00
11 Mosambi 7.25 37.80 45.05 32.00
12 Grapes 2.20 0.00 2.20 4.50
13 Banana 16.60 5.70 22.30 22.30
14 Papaya 0.50 0.00 0.50 17.00
Total 1816.36 7329.9 9146.26 4134.40
(Ref. Pvt. = Private, EGS = Employment Guarantee Scheme.)
It is observed from table 3.16 that maximum 4731.98
(51.73%) hectares land is under custard apple, followed by fig

82
1435.23 (15.369%), Pomogranate 1236.53 (13.55%), and mean
1042.45 (11.39%).
There are 80 villages in Purandar Taluka producing
custard apple.
Total horticulture area in Purandar taluka is 1403
hectares, and total fig plantation area is 214.17 hectares
(15.26%).
3.21.7 Marketing
Fruit season is September to November every year.
Generally fig is sold at Rs. 15 to 20 per kg. Fruits can be
processed. Generally most of fruit producers sell their product
locally. Few of them sell the fruits in Mumbai market.
********

83
CHAPTER 4
ANALYSIS AND INTERPRETATION OF DATA
4.1 INTRODUCTION
Maharashtra has the highest area of 2242 hectares
(77.34%) in India under fig plantation. Pune District is the
leading region in Maharashtra regarding fig plantation.
Purandar taluka tops in Pune district with 410 hectares area
under fig plantation in 2007-08.
One of the objectives of this research is to study the
economic impact of fig production on the Dry land farmers. The
attempt is made by the researcher to compare the financial
status of fig producers with non-fig producers.
The researcher has selected Purandar Taluka, as it is on
the top in fig plantation in Pune district. The researcher has
selected four villages viz, Sonali, Pimple, supe and Walhe.
The researcher has selected 25 fig producer farmers and
25 non-fig producer farmers from each selected villages of
Purandar taluka in Pune district Thus, the total sample size is
200 farmers. The primary data are collected through field work
by providing questionnaire to these selected 200 farmers.

84
For the analysis purpose 100 fig producer farmers are
designated as A farmers and 100 Non Fig producer farmers are
designated as B farmers. The analysis and interpretation of the
collected data is given in this chapter.
The analysis of the primary data is classified as under
A) Personal information
B) Fig production and marketing
C) Impact of fig production on dry land farmers
D) Problems of fig producers
E) Solutions
4.2 SELECTION OF RESPONDENTS
Table 4.1 indicates the selection of the respondents Table No. 4.1
Selection of Respondents
Sr.No.
Name of selected village
Total
Selected Farmers Total
Fig producers
Non fig producer
Fig producer farmers
Non fig producer farmers
1 Sonori 357 869 25 25 50
2 Pimple 119 367 25 25 50
3 Supe
Khurd
95 269 25 25 50
4 Walhe 82 619 25 25 50
Total 653 2123 100 100 200
Source : Field Work.
It is observed from Table 4.1 that out of 653 fig producers the
researcher has selected 100 respondents (15.31%).
Out of total 2123 Non fig producers the sample of 100 Non fig
producers is selected. (4.71%).

85
This is also represented in graph No. 4.1, 4.2 & 4.3.
Graph No. 4.1No. of Fig Producer
357
11995
82
0
50
100
150
200
250
300
350
400
Sonori Pimpale Supe Khurd Valhe
Name of Villages
Fig
Pro
duce
rs
Source : Table No. 4.1
Source : Table No. 4.1
Source : Table No. 4.1
Graph No. 4.2Villagewise selection of Fig Producer Farmers
Sonori 25
Pimpale 25
Supe Khurd25
Valhe25
Sonori
Pimpale
Supe Khurd
Valhe
Graph No. 4.3Villagewise selection of Non Fig Producer Farmers
Sonori 25
Pimpale 25
Supe Khurd 25
Valhe25
Sonori
Pimpale
Supe Khurd
Valhe

86
4.3 PERSONAL INFORMATION
The personal information of the respondents is divided
into social aspects and economic aspects. For the purpose of
analysis the fig producer farmers are designated as A farmers
and Non Fig producers farmers as B farmers.
4.3.1 Social Aspects
The social aspects cover Residence, Types of Family, size
of family, Education, Religion and Caste of the respondents.
4.3.1.1 Residence
Table 4.2 indicates types of residence wise classification of
the respondents.
Table No. 4.2
Types of Residence of A Farmers and B Farmers
Sr.No Name of selected village
A Farmers B Farmers Nos. % Nos. %
1 Hut - - 23 23.00 2 Rough House 10 10.00 39 39.00 3 Semi Rough & Semi Fix
(Rough Walls & Concrete Roof)
22 22.00 25 25.00
4 Mix House (Some Fix and Some Rough Rooms)
20 20.00 05 05.00
5 Fix House/Bunglow 39 39.00 02 02.00 6 Flats 09 09.00 06 06.00
Total 100 100.00 100 100.00Source : Field Work (Note - Each member gave more than one choice hence total may not tally)
It is observed from Table 4.2 that A farmers are not residing in
Huts but 23 (23%) from B farmers are residing in Huts. It leads us to

87
state that A farmer are residing in good house due to income from Fig
Production. A farmers residing in Good House or Bunglow are 39
(39%) and 2 (2%) from B farmers. It also leads us to state that, their
standard of living is increased. 39 B farmers (39%) reside. In Rough
Houses alongwith 24 A farmers (24%). The Fig producer Farmers are
economically developed due to fig production.
Graph No. 4.4 : Type of Residential Houses
A Farmer , 0
A Farmer , 10
A Farmer , 22 A Farmer , 20
A Farmer , 39
A Farmer , 9
B Farmer , 23
B Farmer , 39
B Farmer , 25
B Farmer , 5B Farmer , 2
B Farmer , 605
1015202530354045
Hu
t
Ro
ug
h H
ou
se
Se
mi R
ou
gh
&S
em
i Fix
(Ro
ug
h W
alls
&C
on
cre
te R
oof
)
Mix
Ho
use
(So
me
Fix
an
dS
om
e R
ou
ghR
oo
ms)
Fix
Ho
use
/Bu
ng
low
Fla
ts
Type of Houses
Pro
du
ce
rs
A Farmer B Farmer
Source : Table No. 4.2
4.3.1.2 Types of Family
Table 4.3 indicates the types of family wise classification of A farmers
and B farmers.
Table 4.3 Types of Family
Sr. No.
Name of selected village
A Farmers B Farmers Nos. % Nos. %
1 Joint Family 76 76.00 71 71.00
2 Nuclear Family 24 24.00 29 29.00
Total 100 100.00 100 100.00
Source : Field Work

88
It is observed from Table No. 4.3 that 76 (76%) A farmers and 71
(71%) B farmers have joint families and 24 (24%) A farmers and 29
(29%) B farmers have nuclear families.
It leads us to conclude that both A farmers and B farmers are
joint families. This is expanded with help of Graph No. 4.5.
Graph No. 4.5 Types of Family
76
24
71
29
0
10
20
30
40
50
60
70
80
Joint Family Nuclear Family
Types of Families
Pro
duce
rs
A Farmers B Farmers
Source : Table No. 4.3
4.3.1.3 Size of family
Table 4.4 indicates the size of family wise classification of A farmers
and B farmers.
Table No. 4.4
Size of Family
Sr. No
No. of family members A Farmers B Farmers
Nos. % Nos. %1 1 to 5 Members Family 54 54.00 58 58.00
2 6 to 10 Members Family 37 37.00 35 35.00
3 Above 10 Members Family 09 9.00 7 7.00
Total 100 100.00 100 100.00
Source : Field work.
It is observed from Table 4.4 that maximum 54 (54%). A farmers
and 58 (58%) B farmers have 1 to 5 members size in their family.

89
There are 37 (37%) A farmers and 35 (35%) B farmers have a size of a
family with 6 to 10 members. Only 9 (9%) A farmers and 7 (7%) ‘B’
farmers have more than 10 members in their family. This is given in
graph No. 4.6
Gragh No. 4.6 Size of Family
54
37
9
58
35
7
0
10
20
30
40
50
60
70
1 to 5 Members Family 6 to 10 Members Family Above 10 Members Family
Size of Family
Pro
duce
rs
A Farmers
B Farmers
Source : Table No. 4.4
4.3.1.4 Education
The educationwise classification of A and B farmers is given in Table
4.5.
Table 4.5
Educationwise Classification of A and B farmers
Sr. No. Name of selected village
A Farmers B Farmers Nos. % Nos. %
1 Illiterate 11 11.00 11 11.00
2 1st to 8th education 31 31.00 37 37.00
3 9 th to 10th Std. education 23 23.00 21 21.00
4 11th to 12th Std.Edn 23 23.00 21 21.00
5 Graduate 08 08.00 06 6.00
6 Post Graduate 01 01.00 04 4.00
7 Non information 03 03.00 - -
Total 100 100.00 100 100.00
Source : Field work

90
It is observed from Table 4.5 that maximum 31 (31%) A farmers
and 37 (37%) B farmers have taken their primary education. It is
followed by 23 (23%) A farmers and 21 (21%) B farmers who
completed their secondary education. Other 23 (23%) A farmers and
21 (21%) B farmers have studied higher secondary level. 9 (9%) A
farmers and 10 (10%) B farmers are graduate and post graduate .
But 11 (11%) A farmers and B farmers each are illiterate. This
information is explained in graph No. 4.7
It leads us to conclude that maximum A and B farmers are
educated.
Graph No. 4.7 Educational Classification
11
31
23 23
8
13
11
37
21 21
64
00
5
10
15
20
25
30
35
40
Illiterate 1st to 8theducation
9 th to 10thStd.
education
11th to 12thStd.Edn
Graduate PostGraduate
Noninformation
Educational Classification
Pro
du
cers
A Farmers
B Farmers
Source : Table No. 4.5.

91
4.3.1.5 Children’s education
Table 4.6 indicates the education wise classification of children of A
and B farmers.
Table 4.6 Children’s Educationwise Classification
Sr.No
Particulars Fig Producers Non fig Producers
Total Boys % Girls % Total Boys % Girls %
1 Illiterate 8 8% 19 19 27 14 14 28 28 42
2 1st to 8thstd. education 14 14% 24 24 38 15 15 18 18 33
3 9th to 10thStd.
education
10 10 17 17 27 13 13 12 12 25
4 11th to 12th Std. Edn. 20 20 21 21 41 37 37 21 21 58
5 Graduate 39 39 06 02 18 12 12 07 07 19
6 Post Graduate 09 09 07 06 12 08 8 08 08 16
7 Non information 00 00 06 06 06 01 1 06 06 07
Total 100 100 100 100 100 100 100 100 100 200
Source : Field Work
It is observed from Table 4.6 there are 42 illiterate children of B
farmers as against 27 illiterate children of A farmers. There are 38
children of A farmers as against 33 children of B farmers who got
primary education. The number of children who completed secondary
education is 27 children of A farmers and 25 children of B farmers.
There are 41 children of A farmers and 58 children of B farmers who
got higher secondary level education. 45 children of A producer and
19 children of B farmers are graduate. There are 16 children of A
farmers and 16 children of B farmers who completed post graduation.
This information explained in Graph No. 4.8 and 4.9.

92
It leads us to conclude that children of both A and B producer
farmers are educated.
Graph No. 4.8 : Childrens Education wise Classification (Boys)
8
1410
20
39
9
0
14 1513
37
12
8
10
5
10
15
20
25
30
35
40
45
Illiterate 1st to 8th std.education
9th to10thStd.
education
11th to 12thStd. Edn.
Graduate Post Graduate Noninformation
Childrens Educationwise Classification (Boys)
A Farmers
B Farmers
Source : Tabel No. 4.6
Graph No. 4.9 : Childrens Education wise Classification (Girls)
19
24
17
21
67
6
28
18
12
21
78
6
0
5
10
15
20
25
30
Illiterate 1st to 8th std.education
9th to10thStd.
education
11th to 12thStd. Edn.
Graduate Post Graduate Noninformation
Childrens Educationwise Classification (Girls)
A Farmers
B Farmers
Source : Table No. 4.6

93
4.3.1.6 Religion
Table 4.7 indicates the religionwise classification of A farmers and B
farmers.
Table No. 4.7 Religionwise Classification of A farmers and B farmers
Sr.
No. Particulars
Fig Producer Non fig producer
No of farmers % No. of farmers %
1 Hindu 95 95.00 99 99.00 2 Muslim 02 02.00 01 01.00 3 Shikh 01 01.00 4 Chriscian - - 5 Boudha/Navbaudha 02 02.00 6 Jain - - 7 No religion - - 8 Others - - 9 Not known - - - - Total 100 100 100 100
Source : Filed Work
It is observed from Table 4.7 that 194 farmers are Hindu and
thereafter 3 are Muslims, 1 Shikha and 2 are Navbauddh. It leads us
to conclude that, majority of A & B farmers are Hindus. It is shown in
graph No. 4.10.
Graph No. 4.10 Religionwise Classification
95
2 1 0 2 0 0 0 0
99
1 0 0 0 0 0 0 00
20
40
60
80
100
120
Hindu
Mus
limShi
kh
Chrisc
ian
Boudh
a/Nav
baud
ha
Jain
No re
ligion
Other
s
Not kno
wn
Religionwise Classification
Pro
duce
rs
A Farmers
B Farmers
Source : Table No. 4.7

94
4.3.1.7 Caste
The castewise classification of A and B producer farmers is given in
Table 4.8.
Table No. 4.8 Castewise Classification of farmers.
Sr. No Particulars
Fig Producer Non fig producer Total No of
farmers % No. of
farmers % Nos. %
1 Maratha 82 82.00 68 68.00 150 75
2 Kunabi - - 01 01.00 1 1
3 Mali 12 12.00 24 24.00 36 18
4 Dhangar - - 01 01.00 1 1
5 Ramoshi 02 02.00 03 03.00 5 2
6 Harijan 01 01.00 - - 1 1
7 Nhavi 03 03.00 01 01.00 4 2
8 Navbaudha - - - - - -
9 Gondhali - - 01 2.00 1
10 Others - - 01 01 1
Total 100 100.00 100 100 200Source : Field Work
It is observed from Table 4.8 that 150 members (75%) are from
Maratha Caste out of them 82 (41%) are A farmers and 68 (34%) B
farmers . There are 36 (18%) are from Mali Caste out of them 24
(12%) from A farmers and 12 (6%) B farmers. It leads us to conclude
majority of A farmers and B farmers belong to Maratha & Mali caste.
This information explained in Graph No. 4.11.

95
Graph No. 4.11 Castwiese Classification
82
0
12
0 2 1 30 0 0
68
1
24
1 30 1 0 1 10
10
20
30
40
50
60
70
80
90
Maratha
Kunab
i
Mali
Dhang
ar
Ramos
hi
Harija
n
Nhavi
Navba
udha
Gon
dhali
Other
s
Castwise Classification
Pro
duce
rs
A Farmers
B Farmers
Source : Table No. 4.8
4.3.2 Economic Aspects
The economic aspects cover occupation profession, land holding
subsidiary business, income, expenditure, bank deposits, loan and
repayment of loan.
4.3.2.1 Occupation
The occupationwise distribution of A farmers and B farmers is
given in Table 4.9
Table No. 4.9 Occupationwise distribution of Fig Producers and Non Fig Producers
Sr. No
Particulars Fig Producer Non fig producer Total
No of farmers % No. of
farmers % Nos. %
1 Agriculture/Farmer
87 87.00 95 95.00 182 91
2 Trading 06 06.00 - - 06 3
3 Business
/industry
03 03.00 - - 03 1.5
4 Service 02 02.00 04 04.00 06 3
5 Not known 02 02.00 01 01.00 03 1.5
Total 100 100.00 100 100 200 100 Source : Field Work

96
It is observed from Table 4.9 that 182 (91%) members are
Farmers. Out of them 95 (47.5%) from B farmers and 87 (43.5%) from
A farmers. There are 6 (3%) producters who are in Trading and 3% A
farmers in business and 2 (2%). A farmers and 4 members (4%) of B
farmers are in service. This is explained with the help of Graph No.
4.12 and 4.13
Graph No. 4.12 Occupationwise Distribution Fig Producers
Agriculture/Farmer, 87
Trading, 6
Business/industry , 3
Service , 2
Not known , 2Agriculture/Farmer
Trading
Business/industry
Service
Not known
Source : Table No. 4.9
Graph No. 4.13 Occupationwise Distribution Non Fig Producers
Agriculture/Farmer, 95
Trading, 0
Business/industry , 0
Service , 4
Not known , 1
Agriculture/Farmer
Trading
Business/industry
Service
Not known
Source : Table No. 4.9.

97
4.3.2.2 Land holding
The Table 4.10 indicates land holding position of A farmers and B
farmers.
Table No. 4.10
Land Holding Position.
Sr.No
Particulars Fig Producer Non fig producer Total
No of farmers % No. of
farmers % Nos. %
1 Upto 2.5 Acres 37 37.00 46 46.00 83 41.5
2 Above 2.5 & upto 5 Acres
47 47.00 41 41.00 88 44
3 Above 5 & upto Acres
10 10.00 08 08 18 9.0
4 Above 10 & upto 15 Acres
02 02.00 01 01 03 1.5
5 Above 15 &
upto Acres
02 02.00 01 01 03 1.5
6 Above 20 Acres 02 02.00 03 03 5 2.5
7 No Answer - 00 00 0 0
Total 100 100.00 100 100.00 200 100
Source : Field Work.
It observed from Table 4.10 that maximum 88 members (44%)
have land between 2.5 and upto 5 Acres. Out of them 47 members
(47%) are from A farmers and 41 members (41%) from B farmers. It
is followed by 83 farmers (41.5%) who hold land upto 2.5 Acres. Out
of them 37 members (37%) are form A farmers and 46 (46%) members
from B farmers.
18 members (9%) hold land between 5.10 Acres. Out of them
10 farmers are from A farmers and 8 farmers (8%) from B farmers. 3
members have 10 to 15 acres land each out of them 2 members (1%)
from A farmers and 1 (0.5%) from B farmers.

98
There are 13 members (6.5%) of B producer category who hold
land between 5 to 20 acres. There are only16 members (8%) in A
category who hold same size of land.
It leads us to state that marginal farmers (upto 2.5 Acres) and
small farmers (2.5 Acre-10 Acre) are in majority in the sample size.
This is shown in graph No. 4.14
Source : Table No. 4.10
Graph No. 4.14 Land Holding Position
37
47
10
2 2 2
46
41
8
1 13
0
5
10
15
20
25
30
35
40
45
50
Upto 2.5 Acres Above 2.5 &upto 5 Acres
Above 5 & uptoAcres
Above 10 &upto 15 Acres
Above 15 &upto Acres
Above 20 Acres
Area of Land Holding
Producers
A Farmers
B Farmers

99
4.3.2.3 Subsidiary Occupation
Table 4.11 indicates subsidiary occupationwise classification of A
farmers and B farmers.
Table 4.11
Subsidiary Occupation of the farmers
Sr. No
Particulars Fig Producer Non fig producer Total
No of farmers % No. of
farmers % Nos %
1. Fig Farming 91 91.00 18 18.00 109 54.5
2. Non Fig farming 05 05.00 61 61.00 66 33
3. Subordinate to
Farming
02 02.00 10 10.00 12 6
4. Trading 01 01.00 - - 01 0.5
5. Service - - 06 06.00 06 03
6. Others 01 01.00 05 05.00 06 03
Total 100 100.00 100 100.00 200 100
Source : Field Work.
It is observed from Table No. 4.11 that maximum members of
109 (54.5%) farmers Members are Fig Farmers. Out of them 91
(45.5%) are A producer Farmers and 18 (9%) from B Producer
Farmers. Further out of 66 (33%) Members, 61 B producer Members
are Non Fig Farmers doing farming and 5 (2.5%) from A producer
Members non-fig product farmers and other 12 (6%) members doing
subsidiary to farming. Out of them 10 (5%) are from B producer
Farmers and 2 (1%) from A producer Farmers. 6 (3%) Members are
doing service from B producer Farmers. It leads us to conclude that
percentage of Fig Farmers is more than 50%. The graph 4.15 explains
subsidiary occupationwise classification of the respondents.

100
Graph No. 4.15 Subsidiary Occupationwise Classification
91
52 1 0
18
61
10
06
0
10
20
30
40
50
60
70
80
90
100
Fig Farming Non Fig farming Subordinate toFarming
Trading Service
Subsidiary Occupationwise Classification
Pro
duce
rs
A Farmers
B Farmers
Source : Table No. 4.11
4.3.2.4 Monthly Expenditure
The classification of monthly expenditure of A farmers and B farmers
is given in table 4.12
Table No. 4.12
Classification of Monthly expenditure of A and B farmers
Sr. No
Particulars Fig Producer Non fig producerNo of
farmers % No. of farmers %
1. Upto 5 Thousand 46 46.00 51 51.00
2. 5 to 10 Thousand 37 37.00 43 43.00
3. 10 to 15 Thousand 10 10.00 04 04.00
4. 15 to 25 Thousand 03 03.00 - -
5. 25 to 50 Thousand 01 01.00 - -
6. Above 50 Thousand 02 02.00 - -
7. Not known 01 01.00 02 2.00
Total 100 100 100 100.00
Source : Field Work.

101
It is observed from Table 4.12 that maximum number of 46 A
farmers (46%) and 51 B farmers (51%) have monthly expenditure upto
Rs. 5 thousand. Other 37 A farmers (37%) and 43 (43%) B farmers
spent between Rs. 5 to 10 thousand per month. Other 10 A farmers
(10%) and 4 B farmers (4%) spend in the range of Rs. 10 to 15
thousand per month. Other 7 A farmers (7%) have spent between Rs.
15 to50 thousand per month. A farmers adopted fig plantation.
Hence their monthly expenditure increased. Which is due to their
standard of living. Graph 4.15 explains this classification.
Graph No. 4.16 Classification of Monthly Expenditure
46
37
10
31 2 1
51
43
40 0 0
20
10
20
30
40
50
60
Upto 5Thousand
5 to 10Thousand
10 to 15Thousand
15 to 25Thousand
25 to 50Thousand
Above 50Thousand
Not known
Monthly Expenditure
Pro
du
cers
A Farmers
B Farmers
Source : Table No. 4.12
4.3.2.5 Bank deposits
It is observed in the field work that 91 A farmers and 94 B
farmers opted to bank accounts. It leads us to conclude that there is
no difference between A farmers and B farmers regarding opening the
bank account. This is good habit.

102
These A farmers and B farmers had deposits in the bank. The
details are given in Table 4.13.
Table No. 4.13 Bank depositwise Classification of A and B Producer farmers.
Sr. No Particulars
Fig Producers Non fig producers No of
farmers % No. of
farmers %
1. 1 to 10 Thousand 40 40.00 53 53.00
2. 10 to 15Thousands 14 14.00 13 13.00
3. 25 to 50 Thousand 14 14.00 07 07.00
4. 50 Thousands to 1 Lac 09 09.00 01 01.00
5. Above 1 lack 06 06.00 03 03.00
6. Non Depositors 17 17 23 23.00
Total 100 100.00 100 100.00 Source : field work
It is observed from Table 4.13 that maximum number of 40 A
producer farmers (40%) and 53 B producer farmers (53%) have
deposited in the banks the amounts in the range upto Rs. 10
thousands. It is followed by 14 depositors (14%) of A farmers and 13
depositors (13%) of B farmers who deposited in the bank in the range
of Rs. 10-25 thousands. Another 14 depositors (14%) of A farmers and
7 depositors (7%) of B farmers deposited in the bank in the range of
Rs. 25-50 thousands 9 depositors of A farmers (9%) and one
depositor (1%) of B producer have deposited in the bank in the range
of Rs. 50,000- 1,00,000. There are 6 depositors (6%) of A farmers and
3 depositors (3%) of B farmers who deposited more than Rs. One lakh.
It leads us to conclude that initially there were 53 depositors of B
farmers as against 40 depositors of A producer who deposited upto
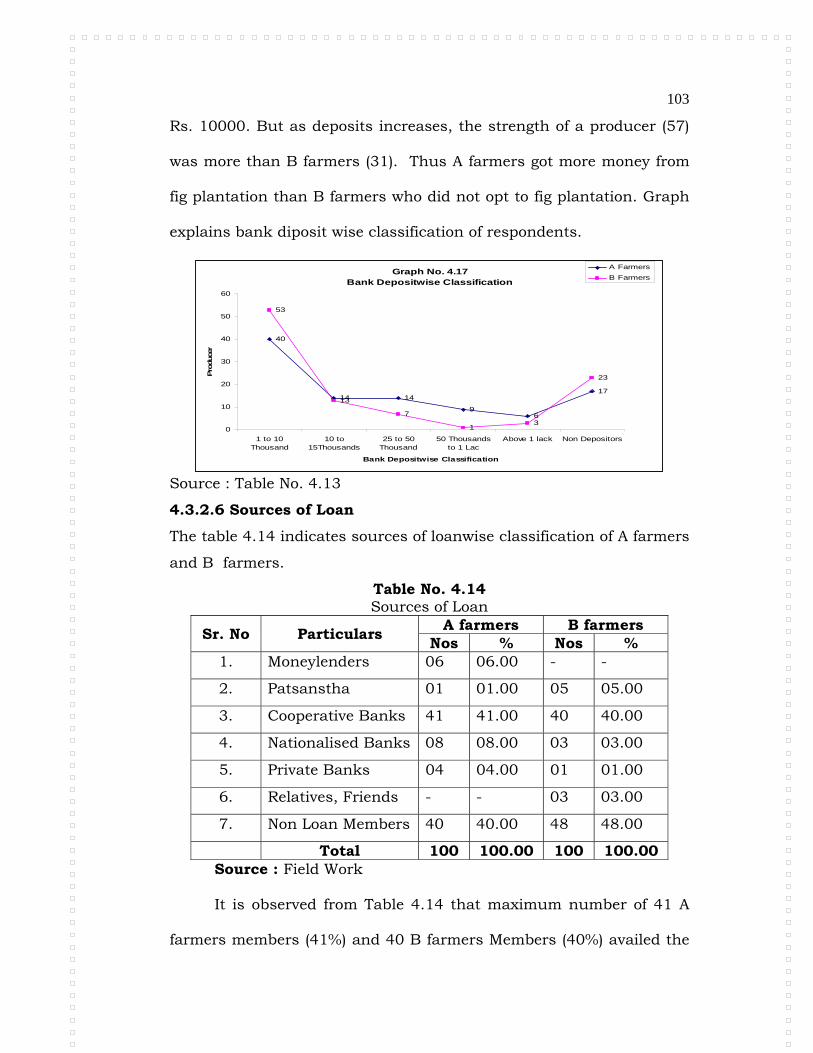
103
Rs. 10000. But as deposits increases, the strength of a producer (57)
was more than B farmers (31). Thus A farmers got more money from
fig plantation than B farmers who did not opt to fig plantation. Graph
explains bank diposit wise classification of respondents.
Graph No. 4.17 Bank Depositwise Classification
40
14 14
96
17
53
13
7
13
23
0
10
20
30
40
50
60
1 to 10Thousand
10 to15Thousands
25 to 50Thousand
50 Thousandsto 1 Lac
Above 1 lack Non Depositors
Bank Depositwise Classification
Pro
duce
r
A Farmers
B Farmers
Source : Table No. 4.13
4.3.2.6 Sources of Loan
The table 4.14 indicates sources of loanwise classification of A farmers
and B farmers.
Table No. 4.14 Sources of Loan
Sr. No Particulars A farmers B farmers
Nos % Nos % 1. Moneylenders 06 06.00 - -
2. Patsanstha 01 01.00 05 05.00
3. Cooperative Banks 41 41.00 40 40.00
4. Nationalised Banks 08 08.00 03 03.00
5. Private Banks 04 04.00 01 01.00
6. Relatives, Friends - - 03 03.00
7. Non Loan Members 40 40.00 48 48.00
Total 100 100.00 100 100.00 Source : Field Work
It is observed from Table 4.14 that maximum number of 41 A
farmers members (41%) and 40 B farmers Members (40%) availed the

104
loan from Co-operative Banks. It is followed by 40 A farmers members
(40%) and 48 B producer members who did not avail any kind of loan.
Marginally 11 A farmers members (11%) and 12 B producer members
(12%) approached moneylenders, patsanstha and relatives and private
banks. Thus it leads us to conclude that the cooperative bank is the
major source for loans to them. The borrowing capacity of A farmers
opting to fig plantation increased rapidly. The classification of
respondents is given in graph No. 4.17
Graph No. 4.18 Sources of Loanwise Classification
6
1
41
84
0
40
0
5
40
31
3
48
0
10
20
30
40
50
60
Moneylenders Patsanstha CooperativeBanks
NationalisedBanks
Private Banks Relatives,Friends
Non LoanMembers
Sources of Loanwise Classification
Pro
du
ce
rs
A Producers
B Producers
Source : Table No. 4.14

105
4.3.2.7 Amount of loan
Amount of loanwise classification of A farmers and B farmers is
given in table 4.15
Table 4.15 Loanwise classification
Sr. No Particulars
(A Producer) (B Producer) Nos % Nos %
1. Upto 25 Thousnads 10 10.00 08 08.00
2 25 to 50 Thousand 16 16.00 20 20.00
3 50 to lac 11 11.00 10 10.00
4 Above 1 lac 23 23.00 14 14.00
5 Non Loan Members 40 40.00 48 48.00
Total 100 100.00 100 100.00 Source : Field Work
It is observed from Table 4.15 that 40 A farmers (40%)
and 48 B farmers (48%) did not avail loan maximum 23 A
farmers (23%) and 14B farmers had loan above Rs. One Lakh
Due to fig plantation borrowing capacity of A farmers is
improved. Graph 4.18 explains these details.
Graph No. 4.19Loanwise Classification
10
16
11
23
40
8
20
1014
48
0
10
20
30
40
50
60
Upto 25Thousnads
25 to 50 Thousand 50 to lac Above 1 lac Non LoanMembers
Loanwise Classification
Pro
du
cers
A Farmers
B Farmers
Source : Table No. 4.15

106
4.3.2.8 Refund of Loan
Table 4.16 indicates refund of loanwise classification of A
and B producer farmers.
Table No. 4.16 Refund of Loan
Sr.No Particulars A Farmers B Farmers
Nos % Nos % 1. Defaulters 18 18.00 09 09.00
2. Regular Refund 61 61.00 82 82.00
3. Refunded Loan 21 21.00 09 09.00
Total 100 100.00 100 100.00
Source : Field Work.
It is observed from Table No.4.16 that 61 (61%) Members
from A farmers and 82 (82%) Members from B farmers have
refunded Loan regularly. Then 21 (21%) from A farmers 18
(18%) Members and 9 (9%) from B farmers had not refunded the
Loan regularly. It leads us to conclude that 82 A farmers (82%)
and 91 B farmers (91%) are punctual in repayment of the loan.
Graph No. 4.20 Refund of Loanwise Classification
18
61
21
9
82
9
0
10
20
30
40
50
60
70
80
90
Defaulters Regular Refund Refunded Loan
Refund of Loanwise Classification
Pro
duce
rs
A Farmers
B Farmers
Source : Table No. 4.16

107
4.4 FIG PLANTATION
In this section the researcher has made an attempt to
cover the encouragement to opt for fig plantation, yearwise fig
plantation, irrigation sources, irrigation system, year and
acrewise expenditure, processing of fig, marketing of fig,
satisfaction, effects of fig plantation, employment generation
and use of agricultural implements.
4.4.1 Encouragement
The table 4.17 gives the sourcewise classification of
encouragement to fig producers.
Table 4.17 Sourcewise classification of encouragement to Fig producers
Sr.No
Particulars A Farmers B farmers
Nos % Nos % 1. Neighbour 56 56.00 50 50.00
2. Relatives 11 11.00 10 10.00
3. Friends 12 12.00 02 02.00
4 News Papers 02 02.00 01 01.00
5 Agriculture Officer 08 08.00 03 03.00
6 Workshop/Training 08 08.00 02 02.00
7 Not known 02 02.00 16 16.00
8 Not applicable 01 01.00 16 16.00
Total 100 100.00 100 100.00
Source : Field work
(NB – Total may not tally as each one has opted more than options)

108
It is observed Table No. 4.17 that Fig Producer and Non-
Fig prodoctor are imitating the farming techniques from their
Neighbors. 56 (56%) from A Farmer and 50 (50%) from B
Farmer started the Fig Production due to encouragement from
Neighbours, further 12 (12%) from A Farmer and 2 (2%) B
Farmer got inspiration from friends and thereafter 11 (11%)
from A Farmer and 10 (10%) from B Farmer got encouragement
from relatives and 16 Members encouraged from Agriculture
Officer and training.
It leads us to conclude that 80% Fig Farmers and Non fig
Farmers are encouraged by Neighbourers and Relatives and
Friends for fig plantation. Graph 4.19 gives details.
Graph No. 4.21 Sourcewise Classification of Encouragement to Fig producers
56
11 12
28 8
2 1
50
10
2 1 3 2
16 16
0
10
20
30
40
50
60
Neighbo
ur
Relative
s
Friends
News Pap
ers
Agricu
lture
Offic
er
Works
hop/T
raini
ng
Not know
n
Not app
licab
le
Sourcewise Classification Encouragement of Fig producers
Pro
du
cers
A Farmers
B Farmers
Source : Table No. 4.17

109
4.4.2 Yearwise Fig and Non Fig Plantation Area
Table 4.18 indicates yearwise fig and non fig plantation areawise
classification of A Farmers and B farmers.
Table No. 4.18
Acre wise Fig Plantation and Non Fig plantation in Purandar taluka
Year Fig Plantation Area Upto 1 Acre 1 to 2 Acre 2 to 3 Acre 3 to 4 Acre Total
A B A B A B A B No. % No % No. % No % No % No % No % No. % No 2006 87 87 68 68 9 9 30 30 3 3 1 1 1 1 1 1 200
2007 87 87 80 80 9 9 30 30 3 3 1 1 1 1 1 1 200
2008 87 87 68 68 9 9 30 30 3 3 1 1 1 1 1 1 200
2009 87 87 68 68 9 9 30 30 3 3 1 1 1 1 1 1 200
2010 87 87 68 68 9 9 30 30 3 3 1 1 1 1 1 1 200
Source : Field Work
It is observed from 4.18 that in the year 2006 to 2010 there is
no change in plantation of Fig production. Upto 1 Acre the number of
A Farmers were 87 members. But B Farmers are 68 in 2006 and in
the year 2007 it upto 80. Also 1 to 2 Acres Area A Farmers there is no
change in the year 2006 -10 they are 9 members. No change in B
Farmers which was 30. But 3 A Farmers and 1 B farmer have 2-3
acres fig plantation area in 2006-2010. Only one farmer each from A
and B groups has 3 to 4 acres of fig plantation area in 2006-2010. It
means there is no change in the plantation of Fig farming. Main
reasons were employment, shortage of water supply, change of
climate, diseases etc. Grah 4.20 to 4.23 gives explanation.

110
Graph No. 4.22Plantation Area upto 1 Acre
87 87 87 87 87
68
80
68 68 68
0
10
20
30
40
50
60
70
80
90
100
2006 2007 2008 2009 2010
Loanwise Classification
Pro
du
cers
A Farmers
B Farmers
Source : Table No. 4.18
Graph No. 4.23Plantation Area upto 1 to 2 Acre
9 9 9 9 9
30 30
18
30 30
0
5
10
15
20
25
30
35
2006 2007 2008 2009 2010
Loanwise Classification
Pro
du
cers
A Farmers
B Farmers
Source : Table No. 4.18

111
Graph No. 4.24Plantation Area upto 2 to 3 Acre
3 3 3 3 3
1 1 1 1 1
0
0.5
1
1.5
2
2.5
3
3.5
2006 2007 2008 2009 2010
Loanwise Classification
Pro
du
cers
A Farmers
B Farmers
Source : Table No. 4.18
Graph No. 4.25Plantation Area upto 3 to 4 Acre
1 1 1 1
2
1 1 1 1 1
0
0.5
1
1.5
2
2.5
2006 2007 2008 2009 2010
Loanwise Classification
Pro
du
cers
A Farmers
B Farmers
Source : Table No. 4.18

112
4.4.3 Sources of Water
Table 4.19 indicates the sources of waterwise classification of A
Farmer and B Farmer.
Table No. 4.19
Water Sourceswise classification of A Farmers and B Farmers
Sr.No Particulars A Farmers B Farmers
Nos % Nos % 1. Monsoon 91 91.00 50 50.00
2. Well 96 96.00 93 93.00
3. Borewell/Well 33 33.00 19 19.00
4. Farm Tank 08 8.00 05 5.00
5. Upsajalsinchan 02 2.00 02 2.00
6. Canal -
7. River -
8. Other 3 3.00 1 1.00
Source : Field Work (NB – As each respondent opted more than one total may not tally)
It is observed from table 4.19 that 91 A Farmers (91%) and 86 B
Farmers (86%) rely on mansoon for water supply. Other 96 A
Farmers 96% and 93 B Farmers (93%) depend on well for supply of
water. Borewell is the convenient source of water to 33 A Farmers
33% and 19 B Farmers 19% farm tank is the source of water to 8 A
produces 8% and 5B Farmers 5% This leads us to conclude that
mansoon is most important source of water. Indian agriculture
depends on vegeries of nature. All the year irrigation through river and
canal is not available to fig Farmers. Graph 4.24 explains water
source wise classification of respondences.

113
Graph No. 4.26 The Sources of Water wise Classification
9196
33
82 0 0 3
50
93
19
5 2 10
20
40
60
80
100
120
Mon
soon
Well
Borewell/W
ell
Farm T
ank
Upsaja
lsinc
han
Canal
River
Oth
er
Sources of Water wise Classification
Pro
du
cers
A Farmers
B Farmers
Source : Table No. 4.19
4.4.4. Irrigation System
Table 4.20 indicates that the irrigation systemwise
classification A Farmers and B Farmers.
Table 4.20
The irrigation systemwise classification of A Farmers and B Farmers
Sr.No Particulars A Farmers B Farmers
Nos % Nos %
1. Water sub-canal 93 93.00 96 96.00
2. Drip Irrigation 07 07.00 04 04.00
3 Sprinkle Irrigation - - - -
Total 100 100 100 100
Source : Field Work

114
It is observed from table 4.20 that 93 A Farmers (93%) and 96 B
Farmers (96%) use sub canal water. The drip irrigation is used by 7 A
Farmers (7%) and 4 B Farmers (4%). This leads us to conclude that
there is still scope for farmers to use drip irrigation and sprinkle
irrigation. The Graph 4.25 shows this information.
Graph No. 4.27 Irrigation Systemwise Classification
93
7
0 0
50
40 00
10
20
30
40
50
60
70
80
90
100
Water sub-canal Drip Irrigation Sprinkle Irrigation Others
Irrigation Systemwise Classification
Pro
du
cer
A Farmers
B Farmers
Source : Table No. 4.20
4.4.5 Annual Cost of production of Fig and Non Fig Farmers
during the period from 2006-2010. (Per Acre)
Table 4.21 indicates the year wise fig and non fig
production expenditure wise classification of A Farmers and B
farmers.

115Table No. 4.21
Yearwise fig and non fig production cost classification
Years
Rs. 10 to 20
thousands.
Rs.20 to 30
thousands
Rs. 30 to 40
thousands.
Rs. 40 to 50
thousands.
Rs. 50 to 60
thousand.
Total
Farmers
A B A B A B A B A B
No. % No. % No. % No. % No. % No. % No. % No. % No. % No. %
06 4 4 66 66 12 12 23 23 25 25 02 02 32 32 06 06 27 27 3 3 100
07 3 3 60 60 12 12 22 22 17 17 11 11 13 13 4 4 5 5 3 3 100
08 2 2 53 53 11 11 27 27 13 13 13 13 11 11 3 3 63 63 4 4 100
09 2 2 42 42 6 6 21 21 9 9 19 19 13 13 12 12 65 65 4 4 100
10 3 3 41 41 6 6 21 21 9 9 19 19 13 13 12 12 69 69 7 7 100
Source : Field Work.

116It is observed from Table 4.21 that per acre annual cost of fig
production is in the range of Rs. 10000 to Rs. 50000.
The annual cost of Non Fig Farmers was between Rs. 10000 to
Rs. 40000 it means fig production cost is more than Non fig
production.
It is observed from table 4.21 during the period 2006-2010
annual cost of Rs. 10000-20000 was incurred by minimum 2 and
maximum 4 fig farmers.
During the period from 2006-2010 the annual cost for Non Fig
output per acre was Rs. 10000-20000 and it was incurred by
minimum 41 Non Fig Farmers and maximum 66 farmers.
Non Fig farmers spend Rs. 20000 to 30000 per Acre per annum
and fig farmers also spent to the same amount but there were 23 Non
fig farmers as against 12 fig farmers in 2006 and 21 non fig farmers
and 6 fig farmers in 2010.
Further there were 25 fig farmes and 2 non fig farmes spending
in the range of Rs. 30000 to Rs. 40000 in 2006. There were 17 fig
farmes and 11 Non Fig Farmers in 2007. Finally 9 fig farmers and 19
non Fig farmers spent same amount in 2010.
During the period 2006 to 2010 majority of fig farmers spent Rs.
40000-50000 per annum per acre there was very few non fig farmer in
this category.
This indicates that fig farming is costilier than Non fig farming.

117
Source : Table No. 4.21
Source : Table No. 4.21
Graph No. 4.28Production costwise classification upto 10 to 20 thousand
4 3 2 2 3
6660
53
42 41
0
10
20
30
40
50
60
70
2006 2007 2008 2009 2010
Year
Producers
A Farmers
B Farmers
Graph No. 4.29Production costwise classification between 20 to 30 thousand
12 12 11
6 6
23 22
27
21 21
0
5
10
15
20
25
30
2006 2007 2008 2009 2010
Year
Producers
A Farmers
B Farmers

118
Source : Table No. 4.21
Source : Table No. 4.21
Graph No. 4.30Production costwise classification between 30 to 40 thousand
25
1713
9 9
2
11 13
19 19
05
1015202530
2006 2007 2008 2009 2010
Year
Producers
A Farmers
B Farmers
Graph No. 4.31Production costwise classification between 40 to 50 thousand
32
13 11 13 13
6 4 3
12 12
0 10
20
30
40
2006 2007 2008 2009 2010
Year
Producers
A Farmers
B Farmers

119
Source : Table No. 4.21
4.4.6 Annual Income of Fig and Non Fig Farmes during the period
from 2006-2010 (Per Acre).
The incomewise classification of A Farmers and B Farmers is given in
Table 4.22
Table 4.22 Incomewise classification of A Farmers and B farmers
Farmers category Year Upto Rs.
1 lac Rs. 1 lac to Rs.2 lacs
2 lacs -3 lacs
3 lacs above Total
Fig
producers
2006 29 62 08 01 100
2007 16 74 09 01 100
2008 10 74 14 02 100
2009 8 73 17 02 100
2010 7 68 24 01 100
Non fig
producers
2006 99 01 0 0 100
2007 98 02 0 0 100
2008 97 02 01 0 100
2009 97 02 0 01 100
2010 96 03 00 01 100
Source : Field Work
Graph No. 4.32Production costwise classification between 50 to 60 thousand
27
5
63 65 69
3 3 4 4 7 0
10 20 30 40 50 60 70 80
2006 2007 2008 2009 2010
Year
Producers
A Farmers
B Farmers

120One of the objectives of this research work is to have
comparitive analysis of annual income of Fig Farmers and Non Fig
Farmers. The hypothesis is that, comparitively fig producer farmers
are earning more than non fig producer farmers. This can be tested
positively with the help of table 4.22. The number of fig producer
farmers earning per Acre the Income upto Rs. 1 lacs were 29 % in
2006. This trend of fig producer farmers decreased to 16 (16%) in
2007, 10 (10%) in 2008, 8 (8%) in 2009, 7 (7%) in 2010. This is due to
increasing income of these fig producer farmers.
That Non fig producer farmers earning upto Rs. 1 Lac per acre
per annum were in the range of 96 to 99 in 2006-2010.
Fig producer farmers earning Rs. 1 Lac to 2 Lacs were per
annum and per acre were 62 (62%) in 2006, remnaing constant to 74
in 2007-2008, 73 (73%) in 2009 and 68% (68%) in 2010.
This is significant numbers of fig producer farmers earning upto
Rs. 2 lacs per acre.
During the same period from 2006 to 2010 hardly 3 Non fig
producer farmers could get same income.
Further 8 fig producer farmes earned Rs. 2 Lacs – 3 Lacs in
2006, 9 fig producer farmers in 2007, 14 fig producer farmes in 2008,
17 fig producer farmes in 2009 and 24 fig producer farmers in 2010
had annual income Rs. 2 Lac – 3 Lac per acre.
During the period 2006-2010 only a single non fig producer
farmer could achiee this income Rs. 2 Lacs – 3 Lacs in 2008.

121It is more significant from the fact that during 2006, 2007
and 2010. 1 fig producer farmer and during 2008 and 2009, 2 fig
producer farmers had their income more than Rs. 3 Lacs and above
per year per acre.
Therefore, the hypothesis is that, comparitively fig producer
farmers are earning more than non fig producer farmers is
positively tested and accepted.
Graph No. 4.33Incomewise Classification upto 1 Lac
2916 10 8 7
99 98 97 97 96
0
20
40
60
80
100
120
2006 2007 2008 2009 2010
Year
Pro
ducers
A Farmers
B Farmers
Source : Table No. 4.22
Source : Table No. 4.22
Graph No. 4.34Incomewise Classification between 1 to 2 Lac
62 74 74 73 68
1 2 2 2 3 0 20 40 60 80
2006 2007 2008 2009 2010
Year
Producers
A Farmers
B Farmers

122
Source : Table No. 4.22
Source : Table No. 4.22
4.4.7 Profitwise classification of A Farmers and B Farmers.
The annual profit wise classification of A Farmers and B
farmers is given in Table 4.23
Graph No. 4.35Incomewise Classification between 2 to 3 Lacs
8 9
1417
24
0 0 1 0 0 0 5
10
15
20
25
30
2006 2007 2008 2009 2010 Year
Producers
A Farmers
B Farmers
Graph No. 4.36Incomewise Classification from 3 lacs and above
1 1
2 2
1
0 0 0
1 1
0 0.5
1 1.5
2 2.5
2006 2007 2008 2009 2010
Year
Producers
A Farmers
B Farmers

123Table No. 4.23
Profitwise classification of A Farmers and B Farmers
Years
Upto Rs 50000 Upto 50000 to 1 lac Rs. 1 lac to 1.5 lacs Rs. 1.50 lacs and
above
Total
Farmers
A B A B A B A B
No. % No. % No. % No. % No. % No. % No. % No. %
2006 14 14.00 91 91.00 51 51.00 8 8.00 29 29.00 1 1.00 6 6.00 - - 100
2007 21 21.00 95 95.00 31 31.00 - - 42 42.00 2 2.00 6 6.00 3 3.00 100
2008 14 14.00 96 96.00 30 30.00 - - 43 43.00 - - 13 13.00 5 5.00 100
2009 42 42.00 95 95.00 41 41.00 2 2.00 14 14.00 1 1.00 3 3.00 2 2.00 100
2010 15 15.00 93 93.00 24 24.00 5 5.00 46 46.00 - - 15 15.00 2 2.00 100
Source : Field Work.

124
It is observed from table 4.23 that the profit earned upto Rs.
50000 by 14 fig farmers in 2006, 21 fig farmers in 2007, 14 fig
farmers in 2008, 42 fig farmers in 2009 and 15 fig farmers in 2010.
There were 91 Non Fig farmers earning the same profit in 2006, 95
Non fig farmers in 2007, 96 Non fig farmers in 2008, 95 Non Fig
farmers in 2009 and 93 fig farmers in 2010.
It means non fig farmers were more than fig farmers earning
profit upto Rs. 50000.
There were 51 fig farmers who earned profit between Rs. 50000
to Rs. 100000 as against 8 non fig farmers in 2006, there were 41 fig
farmers in 2009 and 2 non fig farmers in 2009 earning the same
profit. There were 24 fig farmers and 5 non fig farmers earning the
same profit in 2010. It means that fig farmers were more than Non fig
farmes who earned profit between Rs. 50000 to Rs. 100000.
Same is the case of fig farmers earning profit in the range of Rs.
1 Lac and 1.5 lacs there were 29 fig farmers in 2006, 42 fig farmers in
2007, 14 fig farmes in 2009, 46 fig farmers in 2010 who earned profit
Rs. 1 Lac to Rs. 1.5 lacs as against 2 non fig farmers in 2007 and 1
Non Fig farmers in 2009 it means fig farmers are more than non fig
farmers earning the profit in the range of Rs. 1 lac to 1.5 lacs.
There were 6 fig farmers in 2006 and 2007, 13 fig farmers in
2008, and 15 fig farmers in 2010 who earned profit more than 1.5
lacs. There were 3 non fig farmers in 2007, 4 non fig farmers in 2008,
and 2 non fig famers in 2010 who earned same profit. It means fig
farmers are more than Non fig farmers who earned more profit than
Non fig farmers to the extent of more than Rs. 1.5 lacs.

125
The hypothesis of this research is that fig production helps
the producer farmers to improve their financial status. The table
4.13 concludes that fig production is resutling in improvement of
financial status of fig producer dry land farmers. Therefore, this
hypothesis is positively proved.
Source : Table No. 4.23
Source : Table No. 4.23
Graph No. 4.37
Yearwise profit upto Rs. 50 Thousand
1421
14
42
15
91 95 96 95 93
0 20
40
60
80
100 120
2006 2007 2008 2009 2010
Year
Producers
A Farmers
B Farmers
Graph No. 4.38
Yearwise profit between Rs. 50 Thousand to 1 Lac
51
31 30
41
24
8 0 0 2 5
0 10 20 30 40 50 60
2006 2007 2008 2009 2010
Year
Producers
A Farmers
B Farmers

126
Source : Table No. 4.23
Source : Table No. 4.23
4.4.8 Processing of Fig.
Researcher has selected 100 ‘A' Farmers who opted fig
production. All of there are not processing their own fruits. But there
is still scope to have processing unit and earn good profit. They can
process fig fruits. Dry fruits, chocolate, juice, pulp, powder ice cream,
Graph No. 4.39
Yearwise profit between Rs. 1 Lac to 1.5 Lacs
29 42 43
14
46
1 2 0 1 00
10
20
30
40
50
2006 2007 2008 2009 2010
Year
Producers
A Farmers
B Farmers
Graph No. 4.40
Yearwise profit between Rs. 1 .5 Lacs to above 1.5 Lacs
6 6
13
3
15
03
52 2
0 5
10
15
20
2006 2007 2008 2009 2010
Year
Producers
A Farmers
B Farmers

127
jam, and jelly, candy, Milkshake, fig lether, toffy packed tins, khir,
coffee, wine etc. This is profitable business.
In the table No. 4. 24 fig Farmer members fruit process wise
classification is given.
Process on Fig Crops :
In this research the fig farmers are not processing the their
production this fact is clarified by Researcher and it is found as per
table No. 4.24.
Table No. 4.24
Process on fig Production
S. No. Particulars Nos. Percentage
1 Yes 00 00
2 No 100 100.00
Total 100 100%
It is clear from the table No. 4.24 that the Fig Farmers are not
processing any thing on their production.
In this connection it is recommended that Fig producers may
process the Fig Production by starting their process Units and earn
the good profit. In processing fig the fig producer may get Dryfruits,
Choclate, Juice, Pulp, Powder, Icecream, Jam and Jelly, Candy,
Milshake, Fig Leather, Toffy, Packed Tins, Khir, Coffy, Wine etc. This
may add to their income.
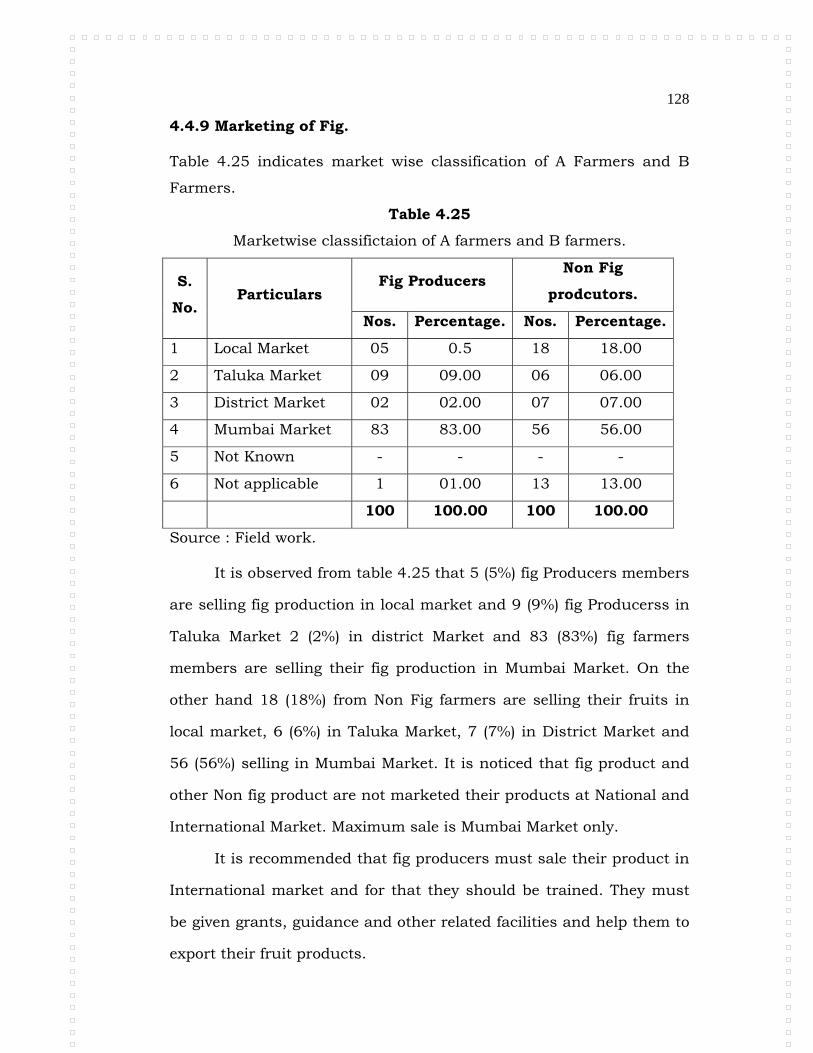
128
4.4.9 Marketing of Fig.
Table 4.25 indicates market wise classification of A Farmers and B
Farmers.
Table 4.25
Marketwise classifictaion of A farmers and B farmers.
S.
No. Particulars
Fig Producers Non Fig
prodcutors.
Nos. Percentage. Nos. Percentage.
1 Local Market 05 0.5 18 18.00
2 Taluka Market 09 09.00 06 06.00
3 District Market 02 02.00 07 07.00
4 Mumbai Market 83 83.00 56 56.00
5 Not Known - - - -
6 Not applicable 1 01.00 13 13.00
100 100.00 100 100.00
Source : Field work.
It is observed from table 4.25 that 5 (5%) fig Producers members
are selling fig production in local market and 9 (9%) fig Producerss in
Taluka Market 2 (2%) in district Market and 83 (83%) fig farmers
members are selling their fig production in Mumbai Market. On the
other hand 18 (18%) from Non Fig farmers are selling their fruits in
local market, 6 (6%) in Taluka Market, 7 (7%) in District Market and
56 (56%) selling in Mumbai Market. It is noticed that fig product and
other Non fig product are not marketed their products at National and
International Market. Maximum sale is Mumbai Market only.
It is recommended that fig producers must sale their product in
International market and for that they should be trained. They must
be given grants, guidance and other related facilities and help them to
export their fruit products.

129
Graph No. 4.41 Market Wise Classification
5 92
83
0 1
18
6 7
56
0
13
0102030405060708090
LocalMarket
TalukaMarket
DistrictMarket
MumbaiMarket
NotKnown
Notapplicable
Market wise Classification
Pro
du
cers
A Farmer
B Farmer
Source : Table No. 4.25
4.4.10 Agriculture Based Occupation.
The fig fruit production helped the fig producers to be
economically well off. They also started the agriculture based
occupation to supplement their income.
Table 4.26 indicates the position of Fig producer and Non Fig
producer farmers in establishing agriculture based occupation.
Table 4.26 Agriculture Based Occupations of Farmers
S.
No. Particulars Fig Producers Non Fig Producers TotalNos. % Nos. %
1 Milk Business 39 39.00 38 38.00 100 2 Poultry Farm 06 06.00 06.00 06.00 100 3 Fish Farm - - 01 01.00 100 4 Ship Firm - - 02 02.00 100 5 Goat Farm - - 07 07.00 100 6 Fig Trading 04 04.00 01 01.00 100 7 Fig Nursary 04 04.00 - - - 8 Trading - - - - - 9 Industry 01 01.00 01 01.00 100 10 Agriculture Tourism - - - - - 11 Other - - 01 01.00 100 Source : Field Work.

130
It is observed from table 4.26 that 39 (39%) Fig producers
started milk business, 6 (6%) members started poultry farm, 4 (4%) fig
trading, 4 (4%) fig plant Nursary and 1(1%) is the industrialist.
It is recommended that, the fig producers may be encouraged to
take up new agriculture based occupations instead of traditional
farming. There is ample scope for modern agriculture based
occupations such as sub food production, such as Fish Farming,
Agriculture implement manufacturing, export, agriculture tourism,
etc. the graphs 4.34 shows these details.
Graph No. 4.42 Agrilcture Based Occupation
39
60 0 0
4 40 1 0 0
38
61 2
71 0 0 1 0 00
51015202530354045
Milk
Busin
ess
Poultr
y Far
m
Fish F
arm
Ship F
irm
Goat F
arm
Fig Tra
ding
Fig Nur
sary
Tradin
g
Indu
stry
Agricu
lture
Tou
rism
Other
Agriculture Based Occupation
Pro
du
cer
A Farmers
A Farmers
Source : Table No. 4.26

131
4.4.11 Farmer’s Satisfaction
Table 4.27 indicates how far the fig producers Farmer’s are satisfied.
Table 4.27 Farmer’s Satisfaction about fig production.
S. No. Particulars A Farmers
Nos. Percentage.
1 Non satisfaction 05 05.00
2 Partially satisfied 33 33.00
3 Satisfied 60 60.00
4 Cannot say 02 02.00
Total 100 100.00 Source : Field work :
It is observed from table 4.27 that 60 (60%) fig producers
are satisfied. Five fig producers (5%) are not satisfied. 33 fig
producers are partially satisfied.
It lead us to state that about 93% fig producers are
satisfied as fig has yielded maximum returns to them. Graph
4.43 indicates the satisfaction level of respondents.
Graph No. 4.43Farmers Satisfaction about fig production.
0
10
20
30
40
50
60
70
Non satisfaction Partially satisfied Satisfied Cannot say
Farmers Satisfaction due to fig production.
Pro
duce
rs
Source : Table No. 4.27.

132
4.5 EFFECTS OF FIG PRODUCTION ON OTHER FARMING.
Table 4.28 indicates the effects of fig production on other
farming.
Table 4.28 Effects of Fig production on other farming.
S.
No. Particulars
A Producers B. Prodcutors. Nos. % Nos. %
1 Planted on wasteland 80 80.00 43 43.00
2 Irrigation facility (Drip, Sprinker,
Pipelines)
41 41.00 14 14.00
3 Other Horticulture Plantation 51 51.00 19 19.00
4 Encouragment for agriculture
tourism.
14 14.00 07 07.00
5 For other crops. Production
shortage of Employment
50 50.00 28 28.00
6 Shortage of water for other crops. 63 63.00 87 87.00
7 Shortage of capital for other crops. 47 47.00 39 39.00
Source : Field Work.
It is observed from table 4.28 that the first major effect of fig
production is on bringing the waste land under plantation. The
number of 80 A producers (80%) and 43 B producers (43%) have
confimed it may helped them to increase their income due to
extension in area under fig plantation.
Then 51(51%) from A producers and 19 (19%) B producers have
extended horticulture due to fig production and 50 (50%) from A
Farmers and 28 (28%) B Farmers told that there is shortage
manpower due to fig production. Also 63 (63%) from A Farmers and
87 (87%) B Farmers told that there is shortage of water for other crops

133
due to fig production and 47 (47%) from A Farmers and 39(39%) B
Farmers have told about shortage capital due to fig plantation. 41
(41%) from A Farmers and 14 (14 %) B Farmers have opted water
saving system i.e. Drip irrigation, Sprinker, pipeline, etc. due to fig
plantation. 14 (14%) A Farmers and 7 (7%) B Farmers informed that
due to fig plantation the agriculture tourism is encouraged. Graph
4.44 indiates the effects of fig production.
Graph No. 4.44 Effects of Fig Production on other farming
80
41
51
14
50
63
4743
1419
7
28
87
39
0
10
20
30
40
50
60
70
80
90
100
Planted onwasteland
Irrigation facility(Drip, Sprinker,
Pipelines)
Other HorticulturePlantation
Encouragment foragriculturetourism.
For other crops.Productionshortage
Employment
Shortage of waterfor other crops.
Shortage ofcapital for other
crops.
Effects of Fig Production on other farming
Pro
duce
rs
A Farmers
B Farmer
Source : Table No. 4.28.

134
4.5.1 Generation of Employment
Table 4.29 indicates generation of employment as the effect of
fig farmes.
Table No. 4.29 Generation of Employmentwise classification of A Farmers and B
Farmers.
S. No. Particulars
Temporary Employment Permanent employment.A Farmers B Farmers A Farmers B Farmers
No % No. % No. % No. %1 1 to 2 labours 47 47.00 48 48.00 14 14.00 34 34.00
2 3 to 5 lobours 44 44.00 42 42.00 17 17.00 21 21.00
3 5 to 10 labours 09 09.00 02 02.00 01 01.00 - -
4 Above 10
labours
- - 08 08.00 19 19.00 - -
5 Not applicable - - - - 49 49.00 45 45.00
Total 100 100.00 100 100 100 100 100 100
Source : Field Work.
It is observed from table 4.29 that due to fig production
temporary and permanent employment have been generated. 47 (47%)
A producers and 48 (48%) from B producers told that 1 to 2 man
power temporary employment are generated and 14 (14%) from A
producers and 34 (34%) B producers told that 1-2 labour permanent
employment is generated. 44 A producers (44%) and 42 B producers
(42%) told that employment is temporarily generated for 3 to 5
laboures. But 17 A producers (17%) and 21 B producers (21%) told
that permanent employment is generated to 3 to 5 labours.

135
It leads us to conclude that fig production has capacity to
generate employment. This information is recorded in graph No.4.45
to 4.46.
Graph No. 4.45 Employmentwise Classification - Temporary Employment
4744
9
0 0
48
42
2
8
00
10
20
30
40
50
60
1 to 2 labours 3 to 5 lobours 5 to 10 labours Above 10 labours Not applicable
Employment Classification
Pro
duce
rs
A Farmers
B Farmers
Source : Table No. : 4.29
Graph No. 4.46Employmentwise Classification - Permanent Employment
1417
1
19
49
34
21
0 0
45
0
10
20
30
40
50
60
1 to 2 labours 3 to 5 lobours 5 to 10 labours Above 10 labours Not applicable
Employment Classification
Pro
duce
rs
A Farmers
B Farmers
Source : Table No. : 4.29

136
4.5.2 Agricultural Implements
Table 4.30 gives the agricultural implementwise classification of A and
B producers farmers.
Table 4.30
Agricultural implementwise classification of producer farmers.
S. No.
Particulars A Farmers B Farmers
Nos. % Nos. %
1 Bullcart 87 87.00 56 56.00
2 Tractor 28 28.00 13 13.00
3 Jeep 10 10.00 04 04.00
4 Tempo 05 05.00 05 05.00
5 Truck 04 04.00 02 02.00
6 JCB 06 06.00 06 06.00
7 Medicine Spray, Petrol Pump, 19 19.00 29 29.00
8 Others 15 15.00 07 07.00
Source : Field Work.
It is observed from table 4.30 that maximum 87 A Farmers and
56 B Farmers have used Bullcart for agriculture production. Other 28
A Farmers and 13 B Farmers used Tractor and 19 A Farmers and 29
B Farmers used Petrol Pump spray for medicine JCB is used by 6 A
Farmers and 6 B Farmers tractor is used by 5 members are from A
and B Farmers. But 15 A Farmers and 7 B Farmers used other
agriculture instruments.
It leads us to conclude that the traditional fig Farmers are more,
but modern agriculture instruments i.e. tractor, truck, JCB etc are
used by 47 (47%) a Farmers and 24 (24 %) from B Farmers. It means

137
that due to fig production the farmers encouraged for modern technics
for agricultures.
Graph 4.47 indicates agricultural implement wise classification
of Farmers.
Graph No. 4.47 : Agricultural Implement
0
10
20
30
40
50
60
70
80
90
100
Bullcart Tractor Jeep Tempo Truck JCB MedicineSpray,Petrol
Pump,
Others
Agricultural Implement wise classification
Pro
du
cers
A Farmers
B Farmers
Source : Table No. 4.30
4.6 HEALTH Table 4.31 indicates classification of A Farmers and B
Farmers on basis of health facilities provided to them.
Table No. 4.31 Classification of A Farmers and B Farmers on basis of provision of
health facilities S.
No. Particulars A Farmers B Farmers
Nos. % Nos. % 1 No facility 06 06.00 - -
2 In Village 12 12.00 02 02.00
3 Primary Health Centre 25 25.00 15 15.010
4 Private Clinic 57 57.00 83 83.00
Total 100 100.00 100 100.00
Source : Field Work.
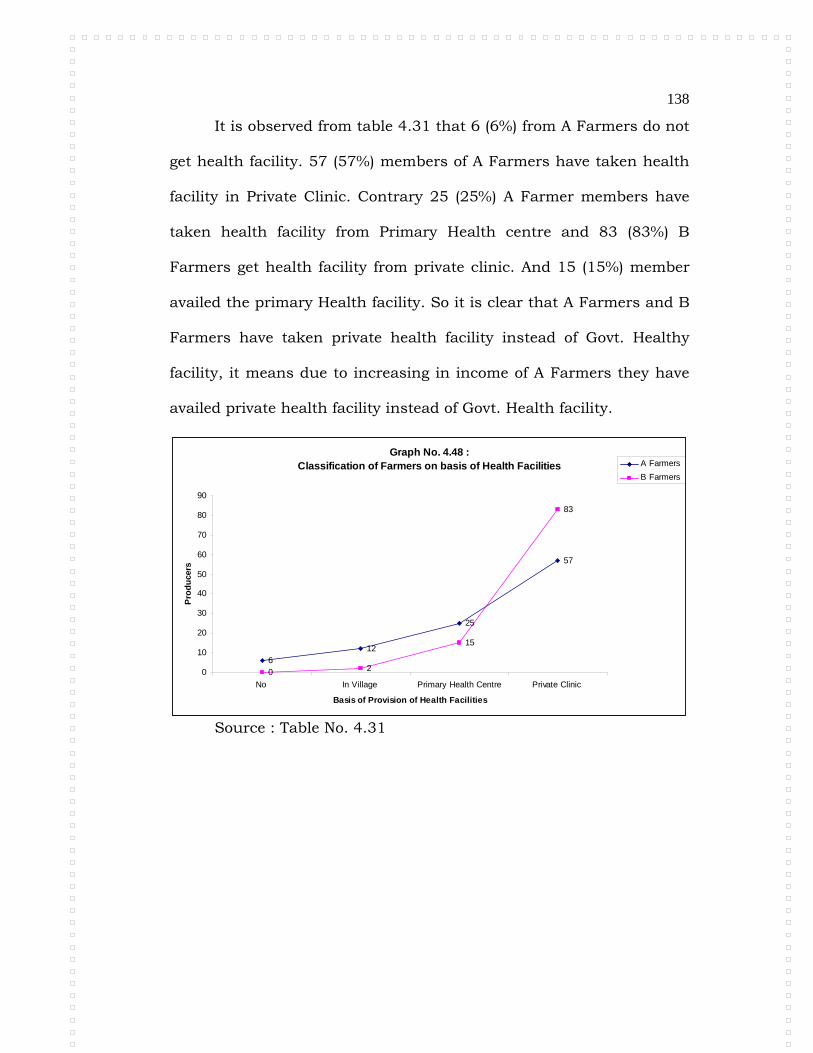
138
It is observed from table 4.31 that 6 (6%) from A Farmers do not
get health facility. 57 (57%) members of A Farmers have taken health
facility in Private Clinic. Contrary 25 (25%) A Farmer members have
taken health facility from Primary Health centre and 83 (83%) B
Farmers get health facility from private clinic. And 15 (15%) member
availed the primary Health facility. So it is clear that A Farmers and B
Farmers have taken private health facility instead of Govt. Healthy
facility, it means due to increasing in income of A Farmers they have
availed private health facility instead of Govt. Health facility.
Graph No. 4.48 : Classification of Farmers on basis of Health Facilities
612
25
57
0 2
15
83
0
10
20
30
40
50
60
70
80
90
No In Village Primary Health Centre Private Clinic
Basis of Provision of Health Facilities
Pro
du
cers
A Farmers
B Farmers
Source : Table No. 4.31

139
4.7 TOURS
Due to fig plantation the A Farmers earn more than B
Farmers. They were asked about tours, responses are recorded
in Table 4.32.
Table No. 4.32
Tour programmes of A Farmers and B Farmers.
S. No. Particulars
A Farmers B Farmers Nos. Percentage. Nos. Percentage.
1 Village Area 34 34.00 25 25.00
2 Taluka 04 04.00 08 08.00
3 District 12 12.00 13 13.00
4 State 48 48.00 49 49.00
5 National 02 02.00 05 05.00
Total 100 100.00 100 100.00
Source : Field work.
It is observed from table No. 4.32 that the maximum members
have enjoyed the State level Tourism i.e. 48 (48%) from A Farmers and
49 (49%) are from B Farmers. Other 34 (34%) from A group and 25
(25%) from B group members had tours in village area. Further 12
(12%) members from A group and 13 (13%) from B group member
have enjoyed the District level. Other 4 (4%) members from A group
and 8 (8%) members from B group enjoyed the Taluka level Tour. But
2 members from A group and 5 from B group members had enjoyed
tour at National Level.
So it is clear that A group and B Group Farmers members are
taking experience within their area to collect additional information for
fig cultivation. Graph 4.40 indicates tour programmes of the
respondents.

140
Graph No. 4.49 : Tour Programmes
34
4
12
48
2
25
8
13
49
5
0
10
20
30
40
50
60
Village Area Taluka District State National
Tour Programmes
Pro
duce
rs
A Farmers
B Farmers
Source : Table No. 4.32
4.8 MATERIAL FACILITIES.
Table 4.33 indicates the classification of A and B producer
farmers in respect of material facilities they enjoyed.
Table 4.33 Classification of A Farmers and B Farmers getting material facilities
S. No.
Particulars A Farmers B Farmers
Nos. % Nos. % 1 Domestic Gas 91 91.00 90 90.00
2 Cycle 66 66.00 60 60.00
3 Pump Set (Agri) 39 39.00 35 35.00
4 Light Fan 84 84.00 82 82.00
5 Television 81 81.00 86 86.00
6 Telephone / Mobile 94 94.00 70 70.00
7 Motorcycle 62 62.00 70 70.00
8 Tractor 25 25.00 15 15.00
9 Newspaper 45 45.00 40 40.00
10 Car/jeep/Van 29 29.00 15 15.00
11 Aircondition facility 27 27.00 20 20.00
12 Computer / Internet 37 37.00 12 12.00
Source : Field Work.

141
(N.B.- As each member opted to more than one it may not tally.)
It is observed from Table 4.33 that there is no difference
in the basic needs of A and B Farmers. These are essential
things i.e. Domestic Gas (For cooking) cycle, Pumpset, Fan,
Television, Telephone, Mobile and Motorcyle these things have
both Producerss. But tractors, Car, Jeep, Van Air Condition,
Facility, Computer and internet these high prices material
things are double in quantity with A Farmers than B Farmers.
It leads us to conclude that, the Fig producers have more
purchasing capacity than Non fig farmers and hence they could
purchase high priced luxurious commodities. Graph 4.50
indicates material facilitywise classification of respondents.
Graph No. 4.50 : Material Facilities
91
66
39
84 81
94
62
25
45
29 27
37
90
60
35
8286
70 70
15
40
1520
12
0
10
20
30
40
50
60
70
80
90
100
Domestic G
as
Cycle
Pump
Set (Agr
i)
Light F
an
Televis
ion
Telepho
ne / M
obile
Mot
orcy
cle
Tracto
r
Newspap
er
Car/jeep
/Van
Aircond
ition
facil
ity
Computer
/ In
tern
et
Material Facilities
Pro
du
cers
A Farmers
B Farmers
Source : Table No. 4.33.

142
4.9 PROBLEMS OF FIG PRODUCERS.
Table 4.34 indicates the problem wise classification of fig
producing farmers.
Table 4.34
Problems of Fig producers
S. No.
Difficulties Fig
Producers Nos. %
1 No Training 50 50.00
2 Climate 72 72.00
3 Shortage of Water 73 73.00
4 Increase in Disease on fig crop. 94 94.00
5 Shortage of capital 73 73.00
6 Shortage of storage (AC house) 50 50.00
7 Catagories and Classification 48 48.00
8 Shortage of market facility 71 71.00
9 Market Rate 88 88.00
10 No export 49 49.00
Source : Field Work.
It is observed from table 4.34 that for the fig production,
the main difficulties are the changing in climate, water supply,
capital shortage, employment and diseases. The analysis is as
follows.
1. Increase in diseases of Fig production :
Total 94% fig Producers have difficulties of heavy diseases
of fig production. Main diseases for fig plant are as Tembera,
Pandhari Bhushi, Thipake, Phalkuj, spots on leaves, Phulkide,

143
Mawa, Khodkida, etc. are the main disease and so the
expenditure on medicine are burden on income from the same.
2. Shortage of Labourers :
80% fig Producers have shortage of labourers.
3. Shortage of Water supply :
73% fig Producerss have water shortage difficulty. Actually it
is told that 500 ml to 625 ml (20 to 25 Inch) Monsoon is
essential for the same. In Sept and Oct. Monsoon must be
stoped. This crop is to be taken at 1200 mtrs from sea level and
table land area. But that area is deep valley climate area and it
is cool so decrease the production.
4. Climate :
For fig production the climate is required Light winter,
light summer and light monsoon. High Winter, mist, hailstone
are damaging to fig Trees. Due to more Winter Climate process
of preparation of sugar is stopped. 72% Fig Producers are of the
opinion that the bad climate is difficulty.
5. Non Education/Training
50% fig Producers told that due to lack of education and
absence of training the fig farmers could not get maximum
output.
6. Shortage of Capital :
73% fig Producers told that due to shortage of capital the
production is not come out. For the Modernisation, Irrigation

144
facility, Process industries, Storage, AC House, Transport
facilities are required heavy capital.
For agriculture purpose minimum interest loan is not
provided for the capital, so Government should give more low
interest capital and grant to fig farmers.
7. Market Management :
In the view of Market management fig producer’s difficulties
are shortage of storage capacity, gradation and classification
shortage of Market facility. The specifications are as under:
i) Market Rate :
No reasonable market rate is fixed for fig production
according to 88% fig Producers. When there is large number of
production rates will collapses. Production is decreased due to
diseases and hence farming of fig production is not profitable.
Therefore Govt. may give the minimum market rate for fig
production.
ii) Shortage of Market Facilities :
71% fig Producers says that there are no facilties of the
market and this is main difficulties.
Now fig fruits producers depend on local market. Some
may sell it at Mumbai but there is no marketing in the country
and international Market, there should be good transport
facility, gradation and classification of products.

145
Training, Study tourism, transport facilities may be
increased for the fig producers.
iii) Storage Facility :
In the opinion of 50% fig Producers, there is no cold
storage facility. Due to storage difficulty, the fig fruits are being
sent to local market. The fluctuations in market rate can not
give more benefit to the fig farmers therefore of storage facility is
essential.
iv) Gradation and Standardisation :
The fig production must be graded and standardised for
getting better price. But it is fact that 48% fig fruits are not
graded and standardised.
For the purpose gradation and standarisation, training,
and staderdised production is essential. This may help fig
producers to export their product.
v) No export of fig production :
49% producers complained that there is no proper
management for export. The fig fruits can be exported to
America. England, Arebean Contries, Africa, Europe. For the
export there should be the quality fruits. There packaging must
be light, attractive and cold storage is also essential for export.

146
4.10 SOLUTIONS TO THE PROBLEMS OF FIG PRODUCERS.
The solutions suggested by the fig producer farmers are
recorded in Table 4.35
Table 4.35
Solutions to problems of fig producers
S. No. Difficulties Nos. % 1 Training 65 65.00
2 Community Farming 39 39.00
3 Irrigation Facilities 76 76.00
4 Modernisation 52 52.00
5 Minimum Interest Loan 73 73.00
6 Federation of fig producers. 60 60.00
7 Process industry (Value added) 50 50.00
8 Reasonable Market Rate 72 72.00
9 Transport facility 55 55.00
10 Govt Grant 72 72.00
11 Study Tours 38 38.00
12 Research of minimum sugar and durable plants 47 47.00
13 Interest fre loan 70 70.00
14 Grant 73 73.00
Source : Field work.
The suggestions given by fig producer farmers are recorded as under:
i) Training :
65% fig farmers want training so that they can get more
production. It needs to be graded, standardised and properly
packed for export. For this purpose Government and different
NGO’s may provide the training to the farmers at their local
areas.

147
ii) Community Farming:
According to 35% fig Producers support storages, export,
process industry, irrigation, transport, modernization. Their
difficulties can be solved through the community farming.
Due to community farming maximum profit can be
earned. Common Medicine spray, Modernisation in agriculture,
Cold storage, storage, process industries, Raw Materials and
availability of Capital are the favourable for community farming
system. For that purpose farmers group, Govt. and N.G.O.’s
should take the lead and enlighten to farmers.
iii) Irrigation Facilities :
According to 76 (76%) of fig Producers, the irrigation
facilities may be enhanced, and the government should help to
the lift irrigation. The grants and minimum interest rate loan
may also be provided.
iv) Modernisation :
52 (52%) fig Producer farmers told that if the
modernization is done in the agriculture, the productivity also
will be increased and 48 % members told that there is no need
of modernization. The modernization must be done but for that
purpose govt. must provide the loan with minimum interest
along with grant.

148
v) Minimum Interest Loan.
73% fig Producers says that Govt. may provide the loan
with minimum interest rate and 28% fir Producers have no
complaint about the interest.
If Govertment provide the special capital for crops and
minimum interest loan for fruit cultivation in dryland area, it
will help for solving the problems. Process industry should be
started to ehance export.
vi) Federataion of Fig Producers:
60% Fig Producers wants to make fig producers Sangh,
because fig Producers Sangh is constituted to solve the problem
of Fig Producers.
Encouragment for constituting the Fig Producers Sangh
should be given by the Govt. and enlight for the same. Help to
the Sangh, automatically the Fig Producers Production will be
increased.
vii) Establishment of process industries (Value added
process):
50% fig Producer gave good response for process industries.
Process industry is established for the Jam, Chocklate,
Dryfruits, Burfy, Milkshake, Packed Tin Figs, Powder etc. such
sub products may be prepared. This may help to increase profit
by 3 to 4 times.

149
viii) Reasonable Market Rate :
72% fig Producerss wish to earn reasonable market rate.
Fig production expenditure is more, so if they do not get the
reasonable rate, they will not earn the good profit. Many times
other fruits are coming in market that affects sale of fig. And
some times due to different deseases production is less and that
time no profit is earned by the fig Producers.
For that government should give surety of minimum rate
to fig producers and if it is done the it will be safety.
ix) Goverment Grants:
72% fig Producerss feels that the Govt. may provide the
grant to the fig production and 28% fig Producerss said that
there is no need of grant. They have self-sufficient capacity on
themselves.
Dryland agriculture is developing, poor agriculturist to
selfsufficient and some percent unemployment problem is
solving. Govt. may give the grant for fruit cultivation.
x) Study Tours :
Out of the fig Producerss 39 % farmer members feels that
study toors may be arranged and 62% fig Producerss member
have no importance for the same.
If study tours of farmers are arranged, the farmers can
learn the different research and implement modern agriculture,
irrigation facilities, export capacity, figs and process industry

150
knowledge and for the development they can start their own
process industries.
So Co-operative Society, NABARD, Agriclture Department,
Federation of Farmers may arrange study tours of socities and
for that purpose grant and free trous and concessions may be
provided.
xi) Research on fig :
47% fig Producers members feels that the research must
be done on fig crops. And 53% members have no importance for
the same.
Due to research minimum sugar fruits production will be
taken by producers and due to lack of water facilities minimum
water require plants should be introduced by research.
Fig production research is conducted in Agriclture
University and Government may give the grants for the same.
Then the export quality figs can be produced.
xii) Exemption in Loan :
73% fig Producer members wants the exemption in Loan.
And 27% members not responded for exemption.
After getting the loan exemption, farmers have sufficient
capital and the fig production will be increased and farmers may
enter in the fig process industry.

151
4.11. HYPOTHESES TESTING
Five hypotheses were decided for this research work. After
the analysis of collected data these hypothesis are tested as
follows:
Hypothesis No. 1
Fig plantation helps the producer farmers to improve their
financial status.
This hypothesis is tested with the help of data given in the
table No. 4.21 to 4.23 in respect of income of fig producer
farmers, their earning of profit, their residence available to them
and health.
A. Income of Fig producer farmer :
Table 4.22 explains that maximum number of 62 farmers
had the annual income in the range of Rs. 1 Lac to 2 Lacs in
2006. This number is increased to 68 in 2009 who earn the
same income.
Secondly table 4.22 explains that there were 2 fig farmers
earning more than Rs. 3 Lacs per annum in 2008-2009.
B. Profit :
Table 4.23 indicates that the fig farmers had more
profit per hectore than the Non Fig farmers.
C. Residence :
It is observed by the researcher that fig farmes earn
more income and hence they could afford to reside in
bungalow, concrete house, this is explained in table 4.2.

152
Thus the hypothesis No. 1 is positively proved and
accepted. Fig plantation helps the producer farmers to
improve their financial status.
Hypothesis – 2
Comparatively fig producer farmers are earning more than
the non fig producer farmers.
This hypothesis is tested on the basis of data given in
table 4.22. Maximum numbers of 74 fig farmers earn Rs. 1 Lac
to 2 Lacs in 2008 but only 2 Non fig farmers earn the same
amount further ‘A’ fig producer increased from 8 in 2006 to 24
in 2010 to earn income Rs. 2-3 lacs whereas there was not a
single non fig producer earning the same.
Considering the profit there were 51 A farmers earn profit
Rs. 50000 – 1 Lac whereas 8 B farmers earn the same amount.
In 2010, 46 ‘A’ farmers earn Rs. 1 -1.5 lacs and 24 A farmers
eearned profit Rs. 50000 -1 lac it indicate fig farmers are
earning more than B non fig farmers. In this way hypothesis No.
2 is positively tested and accepted. Comparatively fig producer
farmers are earning more than the non fig producer farmers.
Hypothesis – 3
Fig production has good effects on agriculture based
occupation.
This hypothesis is tested with the help of the data given
in the table 4.27

153
The major effect of fig production is to bring waste land
under plantation which is confiemd by 80 A farmers and 43 B
farmers. Further fig production is extended fruit cultivation.
It is told by 51 A Farmers and 19 B Farmers there is
shortage of capital, shortage of water and shortage of man
power due to fig production but 41 A Farmers and 14 B Farmers
have opted water saving system i.e. sprinkler, pipeline.Thus the
hypotheses No. 3 is positively tested and accepted. Fig
production has good effects on agriculture based occupation.
Hypothesis – 4
Farmers are not processing the figs.
This hypothesis is tested on the basis of data given in
table 4.24 In this table not a single fig producer is processing
his fruits. (100% fig producers are not processing their fruits).
Therefore, hypothesis No. 4 is is positively tested and acceted.
Farmers are not processing the figs.
Hypothesis – 5
Fig producer farmers have various problems during the fig
production.
This hypothesis is tested with the help of the data given in
the table 4.34. It indicates that the main problems for fig
production are the climate change, water supply (scarcity of
water), capital shortage, employment and fruit dieseases. As the
fig producer farmers are faced above problems during the fig
production the hypothesis No. 5 is positively testd and accepted.

154
Fig producer farmers have various problems during the fig
production.
4.12 Application of Schultz theory to present research.
According to Schultz the transformation of Traditional
Agriculture in modern agriculture depends on the following :
a. New factors in production.
b. Availability and price of non traditional (Modern)
agricultural inputs.
c. Modern Material inputs.
d. Farm people with modern skills.
e. Investment in human capital.
Schultz theory may be considered in the context of this
research, which studies the impact of fig plantation on Dry land
farmers in Pune District.
1. Traditional Agriculture
It is primarily peasant farming, characterised by back
world, primitive and labour intensive agriculture, with low
productivity. Indian economy is agrarian in character. There are
generally small sized farms. The land and labour are principal
inputs of traditional agriculture. But there is great scope for
increasing total production and resource productivity through
technological change.

155
Total are under cultivation in Pune district is 1150900
hectares (73.68% of total area), total area under cultivation in
Purandar Taluka is 98059 hectares (88.85%) of total area).
2. Transformation to modern agriculture.
Government of Maharashtra declared five Talukas of Pune
District as drought prone area. Horticulture is important for
water scarcity zone with low water balance. The fruit plantation
is useful for the economic development of farmers having waste
land. The area under plantation in Purandar Taluka is 80852
hectares (73.26% of total geographical area).
Fig, custerred apple, pomegranate, bear are popular fruits
grown in this area. Land, water, hilly area and climate are in
favour of horticulture in Purandar Taluka. The horticulture
yields net profit of about Rs. 1 to 1.5 lacs per Acre, whereas the
fig plantation yields Rs. 2 to 2.5 lacs net profit per Acre.
Fig plantation in Purandar Taluka can be considered as
transformation of traditional agriculture to modern agriculture.
3. New factors of Production.
Prof. Schultz pointed out that the traditional farmers
accept new factors of production considering its profit.
Fig plantation was accepted by the farmers in Purandar
taluka as they were encouraged by Neighbourers, friends, and
agricultural officers. (P. 102 of thesis)

156
Moreover the hypothesis of this research is that, “Fig
plantation helps the producer farmers to improve their financial
status”. This hypothesis is positively proved as income of fig
producer farmers increased and they earned profit. (P. 145).
Secondly hypothesis of the research was that
“comparatively fig producer farmers are earning more than the
non fig producer farmers”. This hypothesis is positively proved.
(P. 146.)
4. Modern Material inputs.
Prof. Schultz asserted that modern agricultural inputs
must be available at reasonable rate. That will lead to
investment in agriculture. Irrigation, better seeds, better
manures and fertilizers, plant protection, use of mechanisation
are various aspects of agricultural inputs.
A. Drip Irrigation.
The filed work indicates that 93% fig producer farmers
used such Sub canal water. 7% fig producer farmers used the
drip irrigation. Hence it is concluded that there is still scope for
farmers to use drip irrigation. (P. 108),
76 % fig producers insisted on extension of irrigation
facilities and the government should help to the lift irrigation.
The grants and minimum interest rate loan may be also being
provided.

157
B. Market Facilities.
Reasonable market rate for fig is to be fixed. 71% fig
producers complained that there are no facilities in market.
There should be good transport, facilities, gradation and
classicization of products.
C. Fig processing Unit:
Though at present there is no fig processing unit in
Purandar Taluka, it is the demand of fig producer to have such
processing unit. It will increase profit to fig producer (Page No.
121).
d. Farm people with modern skills.
50% fig producers told that due to lack of education and
absence of training the fig farmers could not get maximum
output (P. 137) training is essential for gradation of fig
production 39% fig produce felt that study tours may be
arranged. (P. 143) Maximum farmers have taken experience of
tour at local state and national level.
5. Investment in human capital.
Literacy rate in Purandar taluka is 77.34% these farmers
want training. This can be given by government and different
Non Government Organisations. They should arrange seminars,
workshops, orientations, field visits and interviews of successful
fig farmers. This will be useful for the farmers to improve their
knowledge and skills regarding the fig production, which
directly affects the quality and yield of the fig. It will be exported
to earn more foreign exchange.
*******

158
CHAPTER 5
FINDINGS AND SUGGESTIONS
This research was focused on the the study of the economic
impact of Fig Production on Dry Land Farmers in Pune District with
special reference to Purandar Taluka from 2005-06 to 2009-10.
This chapter is divided into seven parts.
5.1. Observations
5.2. Findings
5.3 Hypothesis Testing.
5.4. Conclusions
5.5. Recommendations
5.6 Schult’z Theory.
5.7 Scope for further research
5.1 OBSERVATIONS
I. Introduction.
Agriculture is an engine of economic growth and
development. Agriculture constitutes the main source of
employment of the majority of the world’s poor. Agriculture in
India has a long history, dating back to ten thousand years.
Today India ranks second the world in respect of Farm output.
India is the largest producer of fresh fruits. India holds the first

159
position in the world in producing papaya, Mango, Sapota and
Banana.
The area under fruits production in India increased;
therefore the production of fruits is also increased. India has
atmosphere, precipitation and variation of land favourable for
cultivation of fruits.
Fig is an important fruit, which has been under
cultivation since ancient time. Fig contains minerals such as
iron, copper and calcium in a large quantity and plenty of
various vitamins. Food items like dry fig, sweetmeat, fig
milkshake etc. are made from fig. Due to all these reasons, fig
has become a significant fruit. In the Ayurved science, fig fruit is
used as powerful medicine on blood defect, cancer disease,
constipation, anemic disease. Fig fruit is very important in food
standard. Considering the demand for the processed fig in the
state and the country, it is essential to cultivate fig, which is
suitable to be processed, on a large scale. Grants are being
made available through various schemes under National Fruit
Production Programme for making various types of food items
from the processed fig and for the grading, packaging, storage
and sale of such food items. Every fig producer should take the
maximum advantage of these schemes to enhance the
production. It is noticed that one person in one lac population
knows fig, one person in three lacs population have tested it,

160
and one in ten lacs enjoys it regularly. This indicates that there
is wide scope for fig plantation. Fig is important to earn foreign
exchanges.
Fig belongs to Umbar Family which is known as
Moraceae. There are four types of fig. viz. Capri Fig, Smirna Fig,
White San Pedro and Adriatic Common Fig. Renowned expert of
Fig Mr. Bobane said that there are 52 breeds of fig found in
Portuguese.
The breeds of Fig under cultivation in India and
Maharashtra are Poona Fig, Marsels, Dienna, Dinkar, Black
Khia, Brown Tukrye, Coimbture Fig, Conadriya and Excel.
There are different references of fig in Bible. This fig fruit
is spared in Mediterranean Sea to other Areas in the world. Fig
is very famous fruit since 3000 years. It is said that the origin of
fig is from South Arabstan before 3000 years. Mughal Badshaha
Mohemmed Tughlak has shifted his Capital from Delhi to
Daulatabad in 1338. At that time peoples shifted from Middle
Asia and Kabul and they brought fig plantation to Daulatabad
Area. State of Ahmednagar gave Grants to the Christian
Missionary to come to Ahmednagar from Aurangabad in 1550.
He planted figs in Ahmednagar.
First fig was planted in 1904 at Jadhavwadi near
Divegaon in Purandar Taluka. This fig plantation was spread to
Khed Shivapur, Shirval and Khandala. The plantation of figs

161
main was done in villages nearby the boundary of Nira River
Valley i.e. Khed Shivapur, Shirval, Khandala was covered. Fig
plantation increased at Purandar, Saswad and Jejuri area.
Purandar Taluka is leading in fig plantation in Pune District.
Specifically Gurholi, Waghpur, Singapur, Rajewadi, Walhe, Dive,
Zendewadi, Kalewadi, Sonori, Banpuri, Pimple, Supe, Pisarve,
Garade, Hivare, Risepise and Malshiras etc. villages have large
share in the production of figs.
Within Maharashtra there was 300 Hectares fig plantation
in 1990. Then in 1990-91 under fruit Plantation programme
was implemented, on near about 650 hectares with the help of
Employment Guarantee Scheme. Thus the plantation under this
programme was extended to 800 to 850 hectares Area.
Maharashtra government had constituted Maharashtra State
Fig Plantation Federation in Pune on 2nd Aug, 2006. Pune
District is leading for fig plantation in the Maharashtra State.
The Figs planted in Pune district is famous in International
Market.
II. Research Methodology
1. Statement of the Problem
The Statement of the Problem is “The economic
impact of fig production on dry land farmers in Pune
District (with special reference to Purandar Taluka, from
2005-06 to 2009-10)”

162
A comparative study of the production and the cost
of production of fig producing farmers and non fig
producing farmers with dry farming is carried out in the
present research.
2. Selection of subject :
Going through the available literature it is observed
that, such type of study is not done in the past. It is
unique study as it considers production and expenditure
of fig producers and Non fig producers. Maharashtra is
leading for Horticulture which is useful for dry land
agricultural development. Total area under fig plantation
is 1374 hectars in Maharashtra in 2005-06. Pune district
has the highest area of 466 hectares (33.92%) followed by
Osmanabad district 206 hectares, or (14.99%) Lature
District 201 hectares (14.63%) and Ahmednagar District
195 Hectars (14.19%).
3. Reasons for selection of this subject area as
under:
a. Maharashtra is on the top in fig production in India
and Puradnar taluka is first in Maharashtra in this
respect.
b. The fig Plantation is mainly found in near about 50
(57.42%). Villages in Purandar Taluka. Out of them
Sonori, Pimple, Supe, and Walhe produces

163
maximum fig fruits. Walhe is home town of the
researcher. Hence this village is selected.
c. The climate should be dry with Hillslope, Medium
Land i.e. slowly tempering and cooling lately is
essential for plantation of fig production, this
climate is available in Purandar Taluka.
d. Estimated profit is Rs. 2.5 lakh per hectare for fig
as against hectares to other crops where it is 1.5
lacs.
e. Highest fig production is in Purandar taluka. Even
though there is drought in the last four years the fig
crop supported the farmers. Therefore this subject
is selected.
4. Review of related literature:
The researcher has traced seventeen references for the
review of related previous researches and literature. These
researches are divided in six groups. The researches in this
groups are related to Fig, Custard apple, Pomogranate, Ber,
other fruits and accounts regarding fruit production.
1. Literature related to Fig (4 Books and 3 thesis)
2. Literature related to Custard apple (1 Project and 1 Thesis)
3. Literature related to Pomogranate (2 Articles and 1 Project)
4. Literature related to Ber (1 Article)
5. Literature related to other fruits (2 Articles and 1 Project)

164
6. Accounts regarding fruit production (1 Book)
A special mention can be made of Schultz’s theory of
Transformation of Traditional Agriculture to Modern
Agriculture. The researcher has made an attempt to apply this
theory to the present research.
During the present research work the researcher has
referred the related literature, giving due citation. This review of
related literature was very useful for the researcher at every step
of research.
5. Importance of the research study.
Horticulture Department is established in 1981 in Pune.
Total area under plantation in Maharashtra was 222.8 lacs in
2001-02. 16.4% of this area is under irrigation and 83.6% area
is dry area. The Horticulture programme is fruitful in such dry
area. In Maharashtra Fig production is mainly in Pune,
Aurangabad and Ahmednagar districts. The fig production
yields Rs. 2 to 2.5 lacs net profit per hectare. This plantation is
very profitable in Waste and Dry Land area in Maharashtra.
For the economic development of Farmers, dry, waste
land must be brought under fig plantation which can be
exported to earn foreign currency. Fig needs to be processed. At
present Indian share is 14% only international fruit market. It
needs to be increased.

165
In this connection, this study is important for the above
reasons. It is observed from the available material, that this
research is completely separate as it contributes to economic
development of fig Farmers of Purandar in Pune. It also
compares the production and expenditure of fig producers with
non fig produces in Purandar Taluka. This research has its own
entity.
6. Objectives of Research
Following are the objectives of research.
1. To study the impact of fig production on economic
development of dryland farmers.
2. To compare the financial status of fig producer and non
fig producer farmers.
3. To study the impact of fig plantation on agriculture based
occupations.
4. To find out the problems of fig producer farmers.
5. To suggest solutions for the problems of dry land fig
producers.
7. Hypotheses
The following hypotheses are tested in this research.
1. Fig plantation helps the producer farmers to improve their
financial status.
2. Comparatively fig producer farmers are earning more than
the non fig producer farmers.

166
3. Fig production has good effects on agriculture based
occupation.
4. Farmers are not processing the figs.
5. Fig producer farmers have various problems during the fig
production.
8. Collection of Data
The present research is based on Primary data and
secondary data collected through the survey.
i) Primary Data:
a. Selection of Maharasthra: The Maharashtra is on
the top in respect of fig production in India (49.85%).
Hence the Maharashtra is selected for research.
b. Selection of District: Pune District is on the top of
fig production in Maharashtra with 63.18 % share in fig
production. Hence Pune District is selected.
c. Selection of Taluka: Purandar Talukas is on the
top (45.92%) of fig production in Pune District. Hence
Purandar Taluka is selected for study.
d. Selection of Villages: Walhe, Sonori, Pimple, supe
are the villages having maximum fig production in
Purandar Taluka. Their share is 50%. Hence these villages
are selected.
e. Selection of Farmers: The researcher has selected
25 fig producers and 25 Non fig producers from each

167
village. Total sample size is 200 farmers. The selection of
farmers is made through lottery system.
ii) Secondary Data
Secondary data are collected from following institutions
1. Mahatma Phule Agricultural University, Rahuri,
Dist. Ahmednagar.
2. Maratha Chamber of Commerce and Industries,
Pune.
3. Gokhale Institutes of Politics and Economics, Pune.
4. The commissioner, Pune.
5. Sub Divisional Officer, Baramati.
6. Zilla Parishad, Pune.
7. Agricultural College, Pune.
8. University of Pune, Pune.
9. Tilak Maharashtra Vidyapeeth, Pune.
9. Statistical Tools
The statistical tools used in analyzing primary and
secondary data are Tabulation and percentages. Similarly
different types of graphs are also used for the
presentation of the data.
10. Limitations of Research:
1. This research is limited to economic impact only.
2. The research is limited to dry land farmers only.

168
3. It is also limited to the dry land farmers of
Maharashtra state.
4. The present research is limited to the farmers from
Pune districts only.
5. The sample is selected only from four villages in
Purandar Taluka.
6. The sample includes only 100 fig producer farmers and
100 non-fig producer farmers.
7. This research is also limited to the economic
development of fig producer farmers.
8. The data collected for this research is within the period
from 2005-06 to 2009-10.
9. The questionnaire is developed by the researcher.
10.The conclusions of this research are depends on the
responses of the farmers to the questionnaire.
III. GEO-PHYSICAL AND SOCIO-ECONOMIC REVIEW:
PUNE DISTRICT:
Section I : Geo Physical And Socio Economic
Features of Pune District:
Pune District lies between 170-54’ and 190-24’ North
latitude and 730-19’ and 750-19’ East longitude. Total
geographical area of Pune District is 15642 sq. km. The
rural area is 15021 sq. km. (96.02%) and the urban area
is 621 sq. km. (3.98%).

169
Pune District is divided thirteen talukas and five sub
divisions into Baramati, Haveli, Khed, Bhor and Maval.
There talukas in Baramati Sub Division, 3 Talukas in
Khed Sub Division and 1 Talukas and other area in Haveli
Sub Division, 3 talukas in Bhor Sub Division and 3
talukas in Maval Sub Division. Purandar taluka selected
for study comes under Bhor Sub Division.
1. Population: Pune district is second highest in
population in Maharashtra State. Rural population is
30.31 lacs (41.92%) and Urban Population is 42.01
lacs (56.08%).
Male Population is 37.68 lacs, (52.10%) and Female
population was 34.63 lacs. (47.90%) The sex ratio in
Pune District is 919 as per 2001 census 922 at the
state level.
2. Literacy: As per census 2001 the literacy rate in Pune
District was 80.45%. The literacy rate among male is
88.34% in Pune District. The literacy rate of females
was 71.89%.
3. Employment: Out of total 71.52 lacs population 29.52
lacs population (41.11%) is employed and rest is
dependent population. The ratio of employed to
dependent is 41:59.

170
4. Land: The soil of Maharashtra is made by depreciation
of Besalt and Granite rocks.
The soil of Pune District is created due to effect
of the above things. Black soil, Purple Soil, Rock soil is
the types of soils found in Pune District. Calcium soil
is found in the Purandar Taluka. The Potacium soil
ratio is more and this soil is more productive such
slippery land is important for fig horticulture. The net
plantation area is 60.23%. Dusota Crops cover the
total area upto 73.68%. Waste and other uncultivated
land area ratio is 15.93% and under the Forest area is
10.39.
5. Climate: Maharashtra had very special climate. At the
westside Sahyadri Hills are effective for climate. Same
climate is there in Pune District. Due to these hills,
south west mansoon gives rainfall to the District. In
the summer season, climate is hot in Pune District.
6. Temperature: The temperature in Pune District is
changing. In March, April, May and June there is
summer season in the District. The annual minimum
temperature is 10.500 and maximum temperature is
37.700. In the summer season May is very hot with
maximum temperature gone upto 420.
7. Rainfall: Generally Monsoon starts in June. Monsoon
comes from Southwest. In the western part of Pune

171
district the annual average ratio of rainfall is upto 400
cm. In Maval area rainfall is 200 to 400 cm. The
average rainfall is 50-100 cm in Western side of Pune
District which covers Bhor, Velha, Maval, Mulashi,
Khed, Ambegaon and Junnar Talukas. The average
rainfall is 1171 mm is in Junnar. From West to East
rainfall ratio is less. For the East Taukas minimum
average i.e. rainfall is Less rainfall is in the Purandar
Taluka which is prominent area for the fig production.
8. Rivers: Bhima River is the prime river in Pune District.
Velu and Ghod rivers are on left side of Bhima and
Bhama. Indrayani, Mula and Mutha rivers are on its
right side. These are Sub Rivers. On the south border
of Pune District, there are Nira River, Karha, Kukadi,
Pavana, Meena, Gunjavani, Pushpavati, Shivaganga.
These rivers overflow in rainy days and become dry in
summer. Each Taluka in Pune District has a river.
9. Irrigation: The geophysical area of Pune District is
suitable for irrigation. Hence the number of small and
major irrigation projects is significant. It covers
Pimpalgaon Joga, Yedgaon, Dimbe, Manik Doh, Vadaj,
Chaskaman, Varasgaon, Panshet, Khadakwasla,
Mulshi, Pawana, Ghod, Nazare, Ujani, Bhatghar, Nira
and Deodhar.

172
The total irrigated area Pune District is 263208
hectors and out of this, higest percentage is of wells
(63.98%) irrigation followed by Canal irrigation
(36.02%).
10. Cropping pattern: Total cropped area in Pune
District is 1150900 hectares and maximum area of
65.26% is covered by food grains. It is followed by
Edible oils (8.01%) Legumes (7.29%) Sugarcane
(04.67%) and other crops such as Edible and Non
Edible oil (5.60%) Area under fig plantation is 0.04%.
11. Fruits and Vegetable: Fruits and Vegetable area is
increasing in Pune District. Banana in Junnar, Grapes
in Baramati, Junnar and Haveli and Pomgranate, Fig
and Custerdapple are taken in Purandar. In Purandar
Taluka Chilly production is taken. Tomato production
is taken in Junnar, Ambegao and Haveli taluka. Lemon
fruits production is taken in Daund, Baramati and
Shirur taluka.
12. Horticulture area: Diferent fruits are produced in
different talukas of Pune district. These fruits are Fig,
Pomgranate, Grapes, Custarapple, guva, leman, Mango
etc.
Total plantation area in Pune District is 1150900
Hectors. Out of total area maximum plantation of
156418 (13.59%) is in Shirur Taluka followed by
173
Junnar (11.87) Khed (9.96%), Indapur (9.82%) Bhor
(2.82%).
Total area under Fig plantation is 466.41 hectors in
Pune District. Purandar taluka (45.92%) is on the top,
followed by Bhor (19.30%) Haveli (13.94%). Baramati
(6.13%), Daund (4.43%) and Khed Taluka (0.43%)
Maval, Mulashi and Velhe Talukas and Indapur Taluka
have no fig plantation.
13. Transport and Communication: As per 2001
statistics, fast express Ways, National High ways, State
Highway and village roads are available in the District.
The total length of all these roads is 13554 KM. The
length of National highways is 302 KM. The National
Highways i.e. Mumbai Fast Express ways, Pune Nasik,
Pune Solapur, Pune Mumbai, Pune Bangalore, Pune
Miraj, Pune Mumbai and Pune Solapur are available
Pune is Railway Junction. The Sattelite Channels,
Doordarshan, Akashwani and News papers are the
important mediums of communications available in
Pune District.
Section II : Geo-Physical And Socio-Economic
Features Of Purandar Taluka.
The researcher has selected Purandar taluka as this
Taluka is top in Fig production in Pune district.
Purandar Taluka tops with 57.42% coverage of villages

174
under fig plantation. It is followed by Baramati Taluka
(18.80%), Haveli (15.62%), Daund (14.43%) and Bhor
(4.59%) Hence Purandar Taluka is selected for the
purpose of study.
I. Geo-Physical Features of Purandar Taluka :
Purandar Taluka lies between 180-17’-20’’ and 180-17’-
34’’ North latitude and 730-58’-29’’ and East
Longitude, Purandar Taluka is one of 13 Talukas in
Pune District.
A. Land and Climate : The climate of Purandar
Taluka is hot and dry. Total cultivable land in
Purandar Taluka is 98059 hectors. Out of it 2790
hectors of land is net cultivated area. It comes to
80.61%. The land under horticulture is 6525 hectors.
It is 6.65% of total cultivable area.
The highest temperature is 39.05 Celsius and
minimum temperature is 10.50 Celsius. The annual
average rainfall is about 711.72 mm. The climate of
Purandar Taluka is suitable for fruits plantation and
special for fig fruits.
B. Population : Total population of Puandar taluka
was 223428, out of which 174604 (78.23%) was rural
population and 48824 (21.77%) urban Population.

175
The density of population in Purandar taluka was
265 in 2001 as against 462 in Pune District. The sex
ratio of Purandar Taluka was 927 in 2001 as against
919 in Pune District.
Rural population is 78.23% whereas urban
population is 21.77% in Purandar taluka. The
advanced caste population is 91% whereas S. C.
population is 7% and S. T. population is 2% in
Purandar Taluka.
C. Education: The literacy in Purandar Talukas
indicates that total 150206 (77.34%) is literate. Out of
them the rural literate population is 114380 (73.32%)
and urban literate population is 35826 (84.60%). The
literacy rate for men in Purandar Taluka is 87.51% as
against female literate 66.90%.
D. Land Use : Total cultivable area in Purandar
Taluka is 98059 hectors. Plantation area is 80852
hectors (73.26%) follow land is 1448 (10.37%) which
can suitably be brought under plantation.
E. Rainfall : West side of Purandar Taluka gets ample
rain which is useful to Kharip crops, i.e. Rice Jawar,
Bajra, East Side of Purandar Taluka is getting less
rainfall. Purandar Taluka gets 848 mm rainfall on an
average.

176
F. Irrigation : Total irrigation area minus Dusota area
will be net irrigated area. In Purandar Taluka out of
total 83501 hectares land under cropped area, 18061
hectores land is irrigated. Out of 18061 hectores
irrigated land, 16664 hectores land is under well
irrigation and 825 hectors land by canal irrigation.
Five talukas in Pune District are declared by the
Government of Maharashtra as drought Prone Areas.
These are Purandar, Daund, Baramati, Indapur, and
Shirur. Purandar taluka has 100% villages total
villages 101) covered under drought prone area.
G. Cropping Pattern : The production of wheat (1650
kg.) Maize (1450 kg.) Rice (1398 kg.), Ground Nut
(1180 kg.) Green pease (1100 kg.) Soyabin (1100 kg.)
and Tur (1073 kg.) per hectare in Purandar taluka.
H. Horticulture : Total geographical area of Purandar
taluka is 110355 hectors and out of It area under
plantation is 80852 (73.26 %) The total irrigated area
in Purandar Taluka is 18995 hectors. Maximum
4731.98 hectare land is under custard apple, followed
by fig 1435.23, Pomogranate (1239). There are 80
villages in Purandar Taluka producing custard apple.
Total horticulture area in Purandar taluka is 1403

177
hectors, and total fig plantation area is 214.17
hectares.
I. Marketing: Fruit season is September, November
every year. Generally fig is sold at Rs. 15 to 20 per kg.
Fruits can be processed. Generally most of fruit
producers sell their product locally. Few of them sell
the fruits in Mumbai market.
5.2 FINDINGS:
The researcher has selected Purandar Taluka, as it is on
the top in fig plantation in Pune district. The researcher has
selected four villages viz, Sonori, Pimple, supe and Walhe.
The researcher has selected 25 fig producer farmers and
25 non-fig producer farmers from each selected villages of
Purandar taluka in Pune district Thus, the total sample size is
200 farmers. The primary data are collected through field work
by providing questionnaire to these selected 200 farmers.
For the analysis purpose 100 fig producer farmers are
designated as A farmers and 100 Non Fig producer farmers are
designated as B farmers.
A. Social Aspects
The social aspects cover Residence, Types of Family, size
of family, Education, Religion and Caste of the respondents.

178
1. Residence: Maximum number of A farmers are residing
in good houses or Bunglows than B farmers. This is due
to more income from Fig Production. (Table No. 4.2).
2. Types of Family: 76% A farmers and 71% B farmers have
joint families and 24 % A farmers and 29% B farmers
have nuclear families. Most of the A farmers and B
farmers are joint families. (Table No. 4.3).
3. Size of family: Maximum 54% A farmers and 58% B
farmers have 1 to 5 members size in their family. While
Only 9% A farmers and 7% farmers have more than 10
members in their family. (Table No. 4.4).
4. Education: 31% A farmers and 37% B farmers have
taken their primary education. 23%) A farmers and 21%
B farmers were completed their secondary education.
Only 9% A farmers and 10% B farmers are graduate and
post graduate. But 11% A farmers and 11% B farmers
are illiterate. Maximum A farmers and B farmers are
educated. (Table No. 4.5)
5. Children’s Education : 38% A farmers and 33% children
of B farmers’ children have completed their primary
education. The number of children who completed
secondary education is 27% children of A farmers and
25% children of B farmers. 45% A farmers and 19% B
farmers’ children are graduate. There are 16% A farmers

179
and 16% B farmers’ children completed their post
graduation. Children of both A farmers and B farmers are
educated. (Tabel No.4.6).
6. Religion: Out of 200 farmers, 194 farmers are Hindu and
thereafter 3 are Muslims, 1 Shikha and 2 are Navbauddh.
Majority of A farmers and B farmers are Hindus. (Tabel
No.4.7)
7. Caste: 150 farmers (75%) are from Maratha Caste out of
them 82 (41%) are A farmers and 68 (34%) B Farmers.
There are 36 (18%) are from Mali Caste out of them 24
(12%) from A farmers and 12 (6%) B Farmers. Majority of
A farmers and B farmers belong to Maratha and Mali
caste. (Table No. 4.8)
B. Economic Aspects: The economic aspects cover
occupation profession, land holding subsidiary business,
income, expenditure, bank deposits, loan and repayment
of loan.
1. Occupation: 182 (91%) members from sample are
Farmers. There are only 6 (3%) members who are in
Trading business and 2 (1 %). A farmers and 4 members
(4%) of B farmers are in service. (Table No. 4.9).
2. Land holding: 87 farmers (43.5%) have land
between 2.5 and upto 5 Acres. It is followed by 81
farmers (40.5%) who hold land upto 2.5 Acres. 18

180
members (9%) hold land between 5.10 Acres. Five
members have 10 to 15 acres land. There are 32 members
(16%) of B producer category who hold land between 5 to
20 acres. Marginal farmers (upto 2.5 Acres) and small
farmers (2.5 Acre-10 Acre) are in majority in the sample
size. (Table No. 4.10).
3. Subsidiary Occupation: Only 12.5% farmers are
doing subsidiary occupations along with farming. (Table
No. 4.11).
4. Monthly Expenditure: 46% A farmers and 51% B
farmers have monthly expenditure upto Rs. 5 thousand.
37% A farmers and 43% B farmers spent between Rs. 5 to
10 thousand per month. 10% A farmers and 4% B
farmers spend in the range of Rs. 10 to 15 thousand per
month. Only 7% A farmers and 7% B farmers have spent
between Rs. 15 to 50 thousand per month. A farmers
adopted fig plantation therefore they can do more
expenditure. (Table No. 4.12)
5. Bank deposits: It is observed in the field work that
91% A farmers and 94% B farmers opted to bank
accounts. There is no difference between A farmers and B
farmers regarding opening the bank account. These A
farmers and B farmers had deposits in the bank. A

181
farmers got more money from fig plantation than B
farmers who did not opt to fig plantation. (Table 4.13).
6. Sources of Loan: 41% A farmers members and
40% B farmers availed the loan from Co-operative Banks.
It is followed by 40% A farmers and 48% B farmers did
not avail any kind of loan. Marginally 11% A farmers and
12% B farmers approached moneylenders, patsanstha
and relatives and private banks. The co operative bank is
the major source for loans to them. The borrowing
capacity of A farmers opting to fig plantation increased
rapidly. (Table No. 4.14)
7. Amount of Loan: 40% A farmers and 48% B
farmers did not avail loan maximum 23% A farmers and
14% B farmers had loan above Rs. oneLac. Due to fig
plantation borrowing capacity of A farmers is improved.
(Table No. 4.15).
8. Refund of Loan: 82% A farmers and 91% B farmers
are punctual in repayment of the loan. (Table No. 4.16)
C. Fig plantation :
In the section the researcher has made an attempt to
cover the encouragement to opt for fig plantation, yearwise
fig plantation, irrigation sources, irrigation system, year and
acrewise expenditure, processing of fig, marketing of fig,

182
satisfaction, effects of fig plantation, employment generation
and use of agricultural implements.
1. Encouragement : Fig Producers and Non-Fig producers
are imitating the farming techniques from their Neighbors.
56 % A Farmer and 50% B Farmers started the Fig
Production due to encouragement from Neighbours. 12% A
Farmer and 2% B Farmers got inspiration from friends. 11%
A Farmer and 10% B Farmers got encouragement from
relatives and 5% farmers encouraged from Agriculture
Officers and training by them.
80% Fig Farmers and Non fig Farmers are encouraged by
Neighbourers, Relatives and Friends for fig plantation. (Table
No. 4.17)
2. Yearwise Fig and Non Fig Plantation Area: In the year
2006 to 2010 there is no change in the area of plantation of
Fig production. Upto 1 Acres A Farmer were 87. But B
Farmers are 68 in 2006 and in the year 2007 it upto 80.
Also 1 to 2 Acre Area A Farmers there is no change in the
year 2006 -10 they are 9 members. No change in B Farmers
which was 30. But A Farmers 3 and B farmers are 1 within
2006 to 2010. For 3 to 4 Acres area A Farmers were only in
2006 to 2009 and one added in the year 2010 total 2
Members, There was no major changes are in the plantation
183
of Fig. Mainly reasons were Employment, shortage of Water
supply, Change of Climate, diseases etc. (Table No. 4.18).
3. Sources of Water: 91% A Farmers and 86% B Farmers
rely on mansoon for water supply. 96% A Farmers and 93%
B Farmers depend on well for supply of water. Borewell is
the convenient source of water to 33% A Farmers and 19% B
Farmers. Farm tank is the source of water to 8% A farmers
and 5% B Farmers. Mansoon is most important source of
water for Indian agriculture. All the year irrigation through
river and canal is not available to fig Farmers. (Table No.
4.19)
4. Irrigation System: 93% A Farmers and 96% B Farmers
use water sub canal. The drip irrigation is used by 7% A
Farmers and 4% B Farmers. There is still scope for farmers
to use drip irrigation and sprinkle irrigation. (Table No. 4.20)
5. Annual Cost of production of Fig and Non Fig crops:
Per acre annual cost of fig production is in the rnage of Rs.
10000to Rs. 50000. The annual cost of Non Fig Farmers was
between Rs. 10000 to Rs. 40000. It means that fig
production cost is more than Non fig production. (Table No.
4.21)
6. Annual Income of Fig and Non Fig Farmes: One of the
objectives of this research work is to have comparitive

184
analysis of annual income of Fig Farmers and Non Fig
Farmers.
Fig producer farmers earning Rs. 1 Lac to 2 Lacs were per
annum and per acre were 62 (62%) in 2006, remaining
constant to 74 in 2007-08, 73 (73%) in 2009 and 68% (68%)
in 2010. This is significant number of fig producer farmers
earning upto Rs. 2 lacs per acre. During the same period
from 2006 to 2010 hardly 2 Non fig producer farmers could
get same income.
Further 8 fig producer farmers earned Rs. 2 Lacs – 3 Lacs
in 2006, 9 fig producer farmers in 2007, 14 fig producer
farmers in 2008, 17 fig producer farmers in 2009 and 24 fig
producer farmers in 2010 had annual income Rs. 2 Lac – 3
Lac per acre.
During the period 2006-2010 only a single non fig
producer farmer could achieve this income Rs. 2 Lacs – 3
Lacs in 2008. It is more significant from the fact that during
2006 1 fig producer farmer and during 2008 and 2009, 2 fig
producer farmers had their income more than Rs. Lacs per
year per acre. (Table No. 4.22). Thus fig production has
positive effect on the economic development of the dry land
farmers.

185
7. Profit of farmers: It is observed from table 4.23 that the
profit earned upto Rs. 50000 by 14 fig farmers in 2006, 21
fig farmers in 2007, 14 fig farmers in 2008, 42 fig farmers in
2009 and 15 fig farmers in 2010. There were 91 Non Fig
farmers earning the same profit in 2006, 95 Non fig farmers
in 2007, 96 Non fig farmers in 2008, 95 Non Fig farmers in
2009 and 93 fig farmers in 2010. It means non fig farmers
were more than fig farmers earning profit upto Rs. 50000.
There were 51 fig farmers who earned profit between Rs.
50000 to Rs. 100000 as against 8 non fig farmers in 2006,
there were 41 fig farmers in 2009 and 2 non fig farmers in
2009 earning the same profit. There were 21 fig farmers and
5 non fig farmers earning the same profit in 2010. It means
that fig farmers were more than Non fig farmers who earned
profit between Rs. 5000 to Rs. 100000.
Same is the case of fig farmers earning profit in the range
of Rs. 1 Lac and 1.5 lacs there were 29 fig farmers in 2006,
42 fig farmers in 2007, 14 fig farmers in 2009, 46 fig farmers
in 2010 who earned profit Rs. 1 Lac to Rs. 1.5 lacs as against
2 non fig farmers in 2007 and 1 Non Fig farmers in 2009 it
means fig farmers are more than non fig farmers earning the
profit in the range of Rs. 1 lac to 1.5 lacs.
There were 6 fig farmers in 2006 and 2007, 13 fig farmers
in 2008, and 15 fig farmers in 2010 who earned profit more

186
than 1.5 lacs. There were 3 non fig farmers in 2007, 5 non fig
farmers in 2008, and 2 non fig farmers in 2010 who earned
same profit. It means fig farmers are more than Non fig
farmers who earned more profit than Non fig farmers to the
extent of more than Rs. 1.5 lacs.
The hypothesis of this research is that fig production
helps the producer farmers to improve their financial status.
The table 4.13 concludes that fig production is resulting in
improvement of financial status fig producer dry land
farmers. Therefore, this hypothesis is positively proved.
(Table No. 4.23). In this way the financial status of fig
producer farmers is better than the non fig producer farmers.
8. Processing of Fig: Farmers are not processing any thing
on their production. (Table No. 4.24).
9. Marketing of Fig: 5% fig Producers are selling fig in local
market and 9% fig Producers in Taluka Market 2% in district
Market and 83% fig farmers are selling their fig production in
Mumbai Market.
On the other hand 18% Non Fig farmers are selling their
fruits in local market, 6% in Taluka Market, 7% in District
Market and 56% selling in Mumbai Market. It is noticed that
fig product and other fruits are not marketed in National and
International Market. Maximum sale is Mumbai Market only.
(Table No. 4.25)

187
10. Agriculture Based Occupation: The fig fruit production
helped the fig producers to be economically well off. They
also started the agriculture based occupation to supplement
their income. 39% Fig producers started milk business, 6%
members started poultry farm, 4 % fig trading, 4% fig plant
Nursery and 1% is the industrialist. (Table No. 4.26).
11. Farmer’s Satisfaction: 60% fig producers are satisfied
while five fig producers 5% are not satisfied. 33% fig
producers are partially satisfied. About 93% fig producers are
satisfied as fig has yielded maximum returns to them. (Table
No. 4.27)
12. Effects of fig production on other farming : The first
major effect of fig production is on bringing the waste land
under plantation. The number of 80% A farmers and 43% B
farmers have confirmed it may help helped them to increase
their income due to extension in area under fig plantation.
51% A farmers and 19% B farmers have extended
horticulture due to fig production and 50% from A Farmers
and 28% B Farmers told that there is shortage manpower
due to fig production. 63% A Farmers and 87% B Farmers
told that there is shortage of water for other crops due to fig
production and 47% A Farmers and 39% B Farmers have
told about shortage capital due to fig plantation. 41 % A
Farmers and 14 % B Farmers have opted water saving
188
system i.e. Drip irrigation, Sprinker, pipeline, etc. due to fig
plantation. 14% A Farmer and 7% B Farmers informed that
due fig plantation the agriculture tourism is encouraged.
(Table No. 4.28)
13. Generation of Employment: Due to fig production
temporary and permanent employment has been generated.
47% A Farmers and 48% B Farmers told that 1 to 2 man
power temporary employment are generated and 14% A
Farmers and 34% B Farmers told that 1-2 labour permanent
employment is generated. 44% A Farmers and 42% B
Farmers told that employment is temporarily generated for 3
to 5 laboures. But 17% A Farmers and 21 A Farmers B
Farmers told that permanent employment is generated to 3
to 5 labours. Fig production has capacity to generate
employment. (Table No. : 4.29)
14. Agricultural Implements: 87% A Farmers and 56% B
Farmers have used Bullcart for agriculture production. 28%
A Farmers and 13% B Farmers used Tractor and 19% A
Farmers and 29% B Farmers use Petrol Pump spray for
medicine JCB is used by 6% A Farmers and 6% B Farmers
tractor is used by 5% A Farmers and B Farmers.
Traditional Fig Farmers are more than the advanced ones.
Modern agriculture instruments i.e. tractor, truck, JCB etc
are used by 47% A Farmers and 24 % B Farmers. It means

189
that due to fig production the farmers encouraged for use of
advanced and modern techniques of agricultures. (Table No.
4.30)
15. Health: 6% A Farmers do not get health facility. 57% A
Farmers have taken health facility in Private Clinic. 25% A
Farmer members have taken health facility from Primary
Health centre and 83% B Farmers get health facility from
private clinic and 15 % member availed the primary Health
facility. So it is clear that A Farmers and B Farmers have
taken private health facility instead of Governments’ Health
facilities, it means due to increasing in income of A Farmers
they have availed private health facility instead of
Governments’ Health facilities. (Table No. 4.31).
16. Tours: 48% A Farmers and 49% B Farmers enjoyed the
State Tourism Scheme. 34% A Farmers and 25% B Farmers
had tours in village area. 12% A Farmers and 13% B
Farmers have enjoyed the District level. 4% A Farmers and
8% B Farmers enjoyed the Taluka level Tour. 2% A Farmers
and 5% B Farmers had enjoyed National tour. So Maximum
Farmers have taken experience of tour at local, state and or
National level. (Table No. 4.32)

190
17. Material Facilities: As there is no difference in the
basic needs of A Farmers and B Farmers all the essential
things i.e. Domestic Gas (For cooking) cycle, Pumpset, Fan,
Television, Telephone, Mobile and Motorcycle these things
are available to them.
But the expensive material facilities like tractors, Car,
Jeep, Van, Air Condition, Computer and internet are
available to more (double) number of A Farmers than B
Farmers. Fig producers have more purchasing capacity than
Non fig producers. (Table No. 4.33)
D. Problems of fig producers:
The farmers have to face many problems while producing
the fig fruits they are as follows: (Table No. 4.34).
1. Increase in diseases of Fig production: Total 94%
fig Producers has difficulties of heavy diseases of fig
production. Main diseases for fig plant are as Tembera,
Pandhari Bhushi, Thipake, Phalkuj, Panawari Thipake,
Phulkide, Mawa, Khodkida, etc. are the main disease and
so the expenditure on medicine are burden on income
from the same.
2. Shortage of Labours: 80% fig Producers has faced
the problem of shortage of labours.
3. Shortage of Water supply: 73% fig Producers has
water shortage difficulty. Actually it is told that few

191
monsoon is to be for fig production, i.e. 500 ml to 625 ml
(20 to 25 Inch) Mansoon is essential for the same. In Sept
and Oct. Monsoon must be stoped. This crop is to be
taken at 1200 mtrs from sea level and high table land
area. But that area is deep valley climate area and it is
cool so decrease the production.
4. Climate: For fig production the climate is required
Light winter, light summer and light monsoon. High
winter, mist, hailstone are damaging to fig Trees. Due to
more Winter Climate process of preparation of sugar is
stopped. 72% Fig Producers are of the opinion that the
bad climate is difficulty.
5. Training: 50% fig Producerss told that due to non
education and absence of training the fig farmers could
not get maximum output.
6. Shortage of Capital: 73% fig Producerss told that
due to shortage of capital the production is not come out.
For the Modernisation, Irrigation facility, Process
industries, Storage, AC House, Transport facilities are
needed heavy capital. For agriculture purpose minimum
interest loan is not provided for the capital, so government
should provide some ratio of capital and grant also.
7. Market Management: In the view of Market
management fig producer’s difficulties are shortage of

192
storage capacity, gradation and classification shortage of
Market facility. The specifications are under:
i) Market Rate: No reasonable market rate is fixed for fig
production according to by 88% fig Producers. When there
is number the rates will crop its price collapses.
Production is decreased due to diseases and hence
farming of fig production is not profitable.
ii) Shortage of Market Facilities: 71% fig Producerss
says that there are no facilties in the market and this is
main difficulties. Now fig fruits producers depends on
local market. Some may sell it at Mumbai but there is no
marketing in the country and international Market and
transport facility.
iii) Storage capacity: In the opinion of 50% fig
Producers, there is no cold storage facility. Due to storage
difficulty, the fig fruits are being sent to local market. The
fluctuations in market rate can not benefit the fig farmers
for want of storage facility.
vi) Gradation and Standardisation: The fig production
must be graded and standardised for getting better price.
But it is fact that 48% fig fruits are not graded and
standardised.

193
For the purpose gradation and standarisation,
training, and staderdised production is essential. This
may help fig producers to export their product.
v) No export of fig production: 49% producers
complained that there is no No proper management for
export. The fig fruits can be exported to America.
England, Arebean Contries, Africa, Europe. For the export
there should be the quality fruits. There packaging must
be light the attractive and cold storage is also essential for
export.
E. Solutions to the problems of fig producers
The suggestions given by fig producer farmers are as
follows: (Table No. 4.35).
1. Training : 65% fig farmers want training so that
they can get more production. It needs to be graded,
standardised and properly packed for export. For this
purpose Government and different NGO’s may provide the
training to the farmers at their local areas.
2. Community Farming: Due to 35% fig Producers
supports storages, export, process industry, irrigation,
transport, modernization. Their difficulties can be solved
through the community farming.
Due to community farming maximum profit can be
earned. Common Medicine spray, Modernisation for

194
agriculture, Cold storage, storage, process industries, Raw
Materials and availability of Capital are the favourable for
community farming system. For that purpose farmers
group, Government and Non Government Organisations
may take the leading and enlighten to farmers.
3. Irrigation Facilities: According to 76 (76%) fig
Producers, the irrigation facilities may be enhanced, and
the govt. may introduce the lift irrigation. The grants and
minimum interest rate loan also may be provided.
4. Modernisation: 52 (52%) fig Producer farmers told
that if the modernization is done in the agriculture, the
productivity also will be increased and 48 % members told
that there is no need of modernization. The modernization
must be done but for that purpose govt. must provide the
loan with minimum interest along with grant.
5. Minimum Interest Loan: 73% fig Producers says
that Govt. may provide the loan with minimum interest
rate and 28% fir Producers have no complaint about the
interest.
If Government provide the special capital for crops
and minimum interest loan for fruit cultivation in dryland
area, it will help for solving the problems. Process
industry should be started to enhance export.

195
6. Federation of Fig Producers: 60% Fig Producers
wants to make fig producers Sangh, because fig Producers
Sangh is constituted to solve the problem of Fig
Producers.
Encouragment for constituting the Fig Producers
Sangh should be given by the Govt. and enlight for the
same. Help to the Sangh, automatically the Fig
Producerss Sangh will be increased.
7. Establishment of Process industries: 50% fig
Producer gave good response for process industries.
Process industry is established for the Jam, Chocklate,
Dry fruits, Burfy, Milkshake, Packed Tin Figs, Powder etc.
such sub products may be prepared. This may help to
increase profit by 3 to 4 times.
8. Reasonable Market Rate: 72% fig Producers wish
to earn reasonable market rate. Fig production
expenditure is more, so if they do not get the reasonable
rate, they will not earn the good profit. Many a times other
fruits are coming in market that affects sale of fig. And
some times due to different deseases production is less
and that time no profit is earned by the fig Producers.
For that dry land agriculture Government should
give the minimum rate surety to Producers.

196
9. Government Grants: 72% fig Producers feels that
the Govt. may provide the grant to the fig production and
28% fig Producers said that there is no need of grant.
They have self-sufficient capacity on themselves.
Dry land agriculture is developing and poor
agriculturist self-sufficient and some percent
unemployment problem is solving. Govt. may give the
grant for fruit cultivation.
10. Study Tours : Out of the fig Producers 39 % farmer
members feels that study tours may be arranged and 62%
fig Producers member have no importance for the same.
If study tours farmers are arranged, the farmers can
learn the different research and implement modern
agriculture, irrigation facilities, export capacity, figs and
process industry knowledge and for the development they
can start their own process industries.
So Co-operative Society, NABARD, Agriculture
Department, Federation of Farmers may arrange study
tours of societies and for that purpose grant and free
tours and concessions may be provided.
11. Research on fig: 47% fig Producers members feel
that the research must be done on fig crops. And 53%
members have no importance for the same.

197
Due to research minimum sugar fruits are producer
production of long time figs are planted. Fig production
required minimum water.
Fig production researches are conducted in
Agriculture University and Government may give the
grants for the same. Then the export quality good quality
figs can be produced.
12. Exemption in Loan : 73% fig Producers members
want the exemption in Loan. And 27% members not
responded for exemption.
After getting the loan exemption, farmers have
sufficient capital and the fig production will be increased
and farmers may enter in the fig process industry.
5.3 HYPOTHESES TESTING
Five hypotheses were formulated for this research work.
After the analysis of collected data these hypothesis are tested
as follows:
Hypothesis No. 1
Fig plantation helps the producer farmers to improve their
financial status.
This hypothesis is tested with the help of data given in the
table No. 4.21 to 4.23 in respect of income of fig producer
farmers, their earning of profit, their residence available to them
and health etc.
198
A. Income of Fig producer farmer
Table 4.12 explains that maximum number of 62 farmers
had the annual income in the range of Rs. 1 Lac to 2 Lacs in
2006. This number is increased to 68 in 2009 who earn the
same income.
Secondly table 4.12 explains that there were 2 fig farmers
earning more than Rs. 3 Lacs per annum in 2008-2009.
B. Profit
Table 4.23 indicates that the fig farmers had more profit
per hectare than the Non Fig farmers.
C. Residence
It is observed by the researcher that fig farmers earn more
income and hence they could afford to reside in bungalow,
concrete house, this is explained in table 4.2.
Thus the hypothesis No. 1 is positively proved and
accepted. Fig plantation helps the producer farmers to improve
their financial status.
Hypothesis – 2
Comparatively fig producer farmers are earning more than
the non fig producer farmers.
This hypothesis is tested on the basis of data given in
table 4.12. Maximum number of 74 fig farmers earns Rs. 1 Lac
to 2 Lacs in 2008 but only 2 Non fig farmers earn the same
amount further ‘A’ fig producer increased from 8 in 2006 to 24

199
in 2010 to earn income Rs. 2-3 lacs whereas there was not a
single non fig producer earning the same.
Considering the profit there were 51 A farmers earn profit
Rs. 50000 – 1 Lac whereas 8 B farmers earn the same amount.
In 2010, 46 ‘A’ farmers earn Rs. 1 -1.5 lacs and 24 A farmers
earned profit Rs. 50000 -1 lac it indicate fig farmers are earning
more than B non fig farmers. In this way hypothesis No. 2 is
positively tested and accepted. Comparatively fig producer
farmers are earning more than the non fig producer farmers.
Hypothesis – 3
Fig production has good effects on agriculture based
occupation.
This hypothesis is tested with the help of the data given in
the table 4.27
The major effects of fig production are to bring waste land
under plantation which is confirmed by 80 A farmers and 43 B
farmers. Further fig production is extended fruit cultivation.
It is told by 51 A Farmers and 19 B Farmers there is
shortage of capital, shortage of water and shortage of man
power due to fig production but 41 A Farmers and 14 B Farmers
have opted water saving system i.e. sprinkler, pipeline. Thus the
hypotheses No. 3 is positively tested and accepted. Fig
production has good effects on agriculture based occupation.

200
Hypothesis – 4
Farmers are not processing the figs.
This hypothesis is tested on the basis of data given in
table 4.4.7. In this table not a single fig producer is processing
his fruits. (100% fig producers are not processing their fruits).
Therefore, hypothesis No. 4 is positively tested and accepted.
Farmers are not processing the figs.
Hypothesis – 5
Fig producer farmers have various problems during the fig
production.
This hypothesis is tested with the help of the data given in
the table 4.9. It indicates that the main problems for fig
production are the climate change, water supply (scarcity of
water), capital shortage, employment and fruit diseases. As the
fig producer farmers are faced above problems during the fig
production the hypothesis No. 5 is positively tested and
accepted. Fig producer farmers have various problems during
the fig production.
5.4 CONCLUSIONS
1. There is positive economic impact of fig production on dry
land farmers.
2. The financial status of fig producer farmers is better than
the non fig producer farmers.
3. There is positive impact of Fig production on agriculture
based occupation.

201
4. Fig producer farmers have following problems during the
fig production:
a. Diseases of fig plants is the major problem infront
of the Fig producer farmers.
b. Shortage of Laborers is another major problem of
the Fig producers.
c. Shortage of Water facility is the big problem to the
Fig production.
d. Bad Climate is again one of the problems of Fig
producer farmers.
e. Absence of training to the fig farmers is also the
problem of Fig producers.
f. Shortage of Capital is the main problem.
g. Guaranteed reasonable market rate for fig is not
fixed.
h. No market opportunities at National and
International level.
i. There are no cold storage facilities and godowns for
fig fruits at local level.
j. No trained labour for gradation and separation of fig
fruits for International market.
k. There is no export facility for fig fruits.

202
6. The solutions for the problems of dry land fig producers are
as follows:
a. For the production of best quality Fig fruits,
Government and NGOs’ different NGO’s should provide
the training to the fig producer farmers at their local
areas.
b. To minimize the expenditure and earn more profit
community farming should be adopted by the Fig
producer farmers.
c. Irrigation facilities should be provided to the Fig
producer farmers.
d. Modern and advanced techniques and equipments
should be used by the farmers for the production of
Figs.
e. Government should provide Minimum Interest Loan to
the Fig producer farmers.
f. Federation of Fig Producers should establish to solve
the problem of Fig Producers.
g. Process industry should establish for processing on the
Fig fruits.
h. Government should give the minimum rate surety to
Fig fruits.
i. Government should provide grants for cultivation of
Fig.

203
j. Study tours of Fig producing farmers should arrange to
motivate them for Fig production and its processing.
k. Researches should be conducted to develop better
varieties of Fig, processing on fig and other areas
related to the Fig.
l. Exemption in the loan should be given to the Fig
producer farmers and farmers who started the Fig
processing industry.
5.5 RECOMMENDATIONS
The researcher suggested the following recommendations
based on the present research work:
1. Encouragement for fig plantation :
Government should encourage the dry land farmers for
plantation of fig production because this is very useful for
economic development to the dry land farmers.
2. Increase the area of fig plantation:
The fig fruit plantation area should not be limited up to the
Maharashtra but it should be extended in all over India where
the dry land is available.
3. Irrigation Facility : Government should provide the irrigation facilities i.e. tank,
irrigation scheme, and dams etc. to provide water to the fig
plants in summar season.
4. Crop Loan:

204
As the production cost of fig plantation is more the
Government should provide crop loan against Fig plantation
and interest should be exempted, if the farmer refunds the loan
in time.
5. Micro Irrigation System:
At present many farmers are using the traditional system for
irrigation which requires a large amount of water and the area
is drought prone area. The micro irrigation system should be
used by the farmers. The government should give the 100%
grants for micro irrigation system.
6. Research of new type of Fig plant:
The Researchers should undertake the researches to find out
new varieties of fig plant which will be diseases resistant,
requires less amount of water and give the maximum yeild.
Government should give motivation, facilities and provide funds
for such type of researches.
7. Fig cultivation Awareness Campaign:
The Government should organize fig cultivation awareness
campaigns to increase the fruit cultivation area, to motivate the
farmers for cultivation of fig to aware them about various
government schemes regarding fruit plant cultivation.
8. Minimum Basic price :
When there is more production of fig fruits, then the rates of
fig collapes which cannot fullfill the expenditure of the farmers.

205
Therefore, government should decide the minimum basic price
for figs based on production cost.
9. Production of export quality fruits:
The farmers should used bilogical and organic fertilizers
for the fig plants, they should avoid chemical fertilizers, they
should maintain the quality of fruits so that, they can export
their fruits and get the benefit of international market and our
country get the foreign currency.
10. Training of farmers:
The Government and agricultural department should
organize various training programmes, seminars, workshops,
orientations, field visits, interviews of successful fig farmers for
the farmers. This will be useful for the farmers to improve their
knowledge and skills regarding the fig production which directly
effects and the quality and yield of the fig. As the quality
increases the fruits will be exported and the farmers earned
more profit through the fig plantation.
11. Cultivation of high yeilding varieties of Fig:
Now days the Poona Fig variety of fig is traditional
cultivated in the Purandar Taluka instead of this variety newly
invented and recommended high yielding varieties like Excel
should be cultivated by the farmers.

206
12. Market and Transport Facility:
The fig fruits of Purandar Taluka farmers are sold in the
local as well as Mumbai market. But they are not getting the
benefit of National and International markets. The government
should provide the facility, infrastructure and linkages with
national and international market.
Internal roads and transport facilities should be better for
the transport of fig fruits from farm to the State, National and
International Market.
13. Removal of Agents:
The government should provide the opportunity for the
farmers to sell the fig fruits directly to the consumer without
agents. It will decrease the production cost and increase the
profit of the farmers.
14. Fig Processing Industry:
The fig processing industry should be established in the
Purandar Taluka so that the fig fruits after there production
immediately processed and it will avoid the wastage of fruits.
The processed figs get more price which increases the profit. The
government should provide grants, low interest loans,
infrastructural and other facilities for the fig processing
industry. The government should motivate the farmers to
established fig processing industry.
15. Community farming:

207
The farmers should initiate the community farming for fig
cultivation. This community farming decreases the production
cost and increases the profit through common irrigation,
maintenance, Transport, godowns, Process Industry, Cold
Storage, agricultural implements, fertilizers and Medicines
facilities.
16. Cold Storage facility:
Government should provide the cold storage facility for fig
fruits. There should be one cold storage after every ten fig
producing villages. Thus there should be 4 to 5 cold storages in
Purandar Taluka. So the fresh fig fruits will be stored
immediately after harvesting and transported in the market
when the rate for the figs is maximum. This will increase the
profit of the fig producer farmers.
17. Fig Producers Federation:
Farmers should form the federation of fig producers. This
federation will take care of the fig production by tackling the
problems of fig producers and providing solutions to them.
18. Study Tours:
Agriculture Department of government, federation of fig
producer farmers, should organize the study tours. They should
visit to the farm of successful fig producer farmers, fig
processing industry, Krushi Vikas Pratisthan, Agricultural

208
Universities, Agricultural Research Center, Markets etc. It will
motivate the farmers to cultivate the fig, to use modern and
advanced technology for fig production, to do the new and
inovative experiments in fig cultivation to acquire the knowledge
and skills regarding fig production and to change their attitude
towards the fig production.
19. Insurance:
The Government should provide insurance facility to the
fig crop. If natural calamity occurs and there is any loss to the
farmer then the farmer will not suffer from this loss and more
number of farmers will get attracted towards Fig cultivation.
20. Loan Exemption:
Government should provide a loan exemption facility to
the fig producer farmers. As the Purandar is drought affected
taluka, the farmers are very poor. If they take the loan from
bank or any financial institute, but due to climate change and
diseases on the fig crop and fluctuation in market price there
may be loss to them. These farmers are unable to repayment the
loans so government should provide loan exemption facility to
such farmers.
21. Stories of successful fig producer farmers:
The stories of successful fig producer farmers should be
written and published in books, news papers, the interviews of
such successful fig producer farmers should be broadcasted on

209
radio and television. Such farmers should be awarded by the
government. This will motivate the other farmers and attract
them towards the cultivation of fig.
5.6 APPLICATION OF SCHULTZ’S THEORY :
5.6.1 Schultz’s Theory :
The man who is bound by Traditional agriculture cannot
produce much food no matter how rich the land. Thrift and
work are not enough to overcome the niggardliness of this type
of agriculture. To produce an abundance of farm products
requires that the farmers has access to and has the skill and
knowledge to use what science knows about soils, plants,
animals and machines. To command farmers to increase
production is doomed to failure even though they have access to
knowledge. Instead, an approach that provides incentives and
rewards to farmers is required. The knowledge that makes the
transformation possible is a form of capital, which entails
investment. Investments not only a material inputs in which a
part of this knowledge is embedded but importantly also
investment in farm people”.
Prof. Schultz has stated that, differences in land are least
important, differences in the quality of material capital are of
great importance and differences in the capabilities of farm
people are most important in explaining the differences in the
amount and rate of increase in farm production.
210
Hypothesis of Schultz was that “the rate at which farmers
who have settled into traditional agriculture accept a new factor
or production depends upon its profit, with due allowance for
risk and uncertainty and in this regard the response is similar t
that observed by farmers in modern agriculture”. He also
suggested that farmers are remarkably efficient in allocating the
factors at their disposal in current production. According to
Schultz, there is no correlation between the size of farms and
productivity.
He asserted that modern agricultural inputs must be
available at reasonable rate. That will lead to investment in
agricultural profitable.
According to Schultz, the investment in human capital
has radical social and economic implication. He emphasized
that education is the best form of investment in human capital.
5.6.2 Application of Schultz theory to present research.
According to Schultz the transformation of Traditional
Agriculture in modern agriculture depends on the following :
a. New factors in production.
b. Availability and price of non traditional (Modern)
agricultural inputs.
c. Modern Material inputs.
d. Farm people with modern skills.
e. Investment in human capital.

211
Schultz theory may be considered in the context of this
research, which studies the impact of fig plantation on Dry land
farmers in Pune District.
1. Traditional Agriculture
It is primarily peasant farming, characterised by back
world, primitive and labour intensive agriculture, with low
productivity. Indian economy is agrarian in character. There are
generally small sized farms. The land and labour are principal
inputs of traditional agriculture. But there is great scope for
increasing total production and resource productivity through
technological change.
Total are under cultivation in Pune district is 1150900
hectares (73.68% of total area), total area under cultivation in
Purandar Taluka is 98059 hectares (88.85%) of total area).
2. Transformation to modern agriculture.
Government of Maharashtra declared five Talukas of Pune
District as drought prone area. Horticulture is important for
water scarcity zone with low water balance. The fruit plantation
is useful for the economic development of farmers having waste
land. The area under plantation in Purandar Taluka is 80852
hectares (73.26% of total geographical area).
Fig, custerred apple, pomegranate, bear are popular fruits
grown in this area. Land, water, hilly area and climate are in
favour of horticulture in Purandar Taluka. The horticulture

212
yields net profit of about Rs. 1 to 1.5 lacs per Acre, whereas the
fig plantation yields Rs. 2 to 2.5 lacs net profit per Acre.
Fig plantation in Purandar Taluka can be considered as
transformation of traditional agriculture to modern agriculture.
3. New factors of Production.
Prof. Schultz pointed out that the traditional farmers
accept new factors of production considering its profit.
Fig plantation was accepted by the farmers in Purandar
taluka as they were encouraged by Neighbourers, friends, and
agricultural officers. (P. 102 of thesis)
Moreover the hypothesis of this research is that, “Fig
plantation helps the producer farmers to improve their financial
status”. This hypothesis is positively proved as income of fig
producer farmers increased and they earned profit. (P. 145).
Secondly hypothesis of the research was that
‘comparatively fig producer farmers are earning more than the
non fig producer farmers”. This hypothesis is positively proved.
(P. 146.)
4. Modern Material inputs.
Prof. Schultz asserted that modern agricultural inputs
must be available at reasonable rate. That will lead to
investment in agriculture. Irrigation, better seeds, better
manures and fertilizers, plant protection, use of mechanisation
are various aspects of agricultural inputs.
A. Drip Irrigation.
B. Market Facilities.
C. Fig processing Unit:
D. Farm people with modern skills.
213
5. Investment in human capital.
Literacy rate in Purandar taluka is 77.34% these farmers
want training. This can be given by government. They should
arrange seminars, workshops, orientations, field visits,
interviews of successful fig farmers. This will be useful for the
farmers to improve their knowledge and skills regarding the fig
production, which directly affects the quality and yield of the fig.
It will be exported to earn more foreign exchange.
5.7 SCOPE OF FURTHER RESEARCH
This research studies the economic impact of fig
production on Dry Land Farmers in Pune District with special
reference to Purandar Taluka. In future any researcher may
study the economic impact of other than fig production on
irrigated or dry Land farmers.
The researcher is quite aware of the fact that there are
several other aspects such as marketing, cost benefit analysis,
impact of Globalisation on fig and Horticulture, Impact of
Globalisation on marketing of fruits and fig and problems before
food processing Industry and Remedial measures to over come
them. There are also some another subjects for further research
such as to study about agro base industry and fruit processing
Industry. The study about export marketing of fig and other
horticulture is also necessary.
The researcher has limitations to complete the research in
stipulated time period. Therefore the researcher felt that there is
further scope for the other scholars to study in more detail the
other aspects of the research problem.

214
BIBLIOGRAPHY BOOKS
1. Bose T. K. (1985) Fruits of India, Tropical and Subtropical,
Calcutta, Naya Prakashan.
2. Datta R. and Sundharam K. P. M., Indian Economy S. Chand
and Company Ltd. New Delhi, Ramnagar.
3. Sadhu and Singh, (2002), Fundamentals of Agricultural
Economics, Himalaya Publishing House, Mumbai.
4. dqaHkkstdj x- fo- ¼1982½] la’kks/ku i/nrh o la[;k’kkL=] dksYgkiwj QMds
izdk’ku] egkOnkj jksM-
5- [kSjs fo- vk- ¼2001½] vathj ckx] iq.ks] dkWfUVusaVy izdk’ku] -
6- ns’keq[k iz- iqa ¼1981½] Hkkjrkrhy QG>kMkaph ykxoM] iq.ks] egkjk”Vª
fo|kihB] xzaFkfufeZrh eaMG] dkWfUVusaVy izdk’ku-
7- ikVhy osnizdk’k ¼2000½] vathjkph ykxoM] iq.ks dkWfUVusaVy izdk’ku-
8- ikVhy v- O;a] vkf.k dkGs ,- vkj ¼1982½] egkjk”Vªkrhy QG>kMs] iq.ks]
dkWfUVusaVy izdk’ku-
9- HkqtcG ch-th- ¼2005½] vathj xkbZM] iq.ks] vkse izdk’ku
10- HkqtcG ch-th- ¼2006½] ^QGs o izdzh;k*] iq.ks] vkse izdk’ku
11- HkkaMkjdj iq- y- ¼1981½] ^lkekftd la’kks/ku i/nrh*] ukxiwj egkjk”Vª
fo|kihB xzaFk fufeZrh eaMG-
12- Bkssacjs f’kokthjko ¼2005½] vathj vrqy cqd ,tUlh] 317] iq.ks dkWfUVusaVy
izdk’ku-
13- ok?kekjs j-,- vkf.k Hkkidj n-xks- ¼1992½] ’ksrhps fg’kksc] iq.ks dkWfUVusaVy
izdk’ku-
215
THESES
1. Bembalkar G. K. (2001), ‘Economics of Production Marketing
an Export of Pomegranate from Solapur District of
Maharashtra State’. A Thesis submitted to the Mahatma Phule
Krishi Vidyapeeth Rahru towards the partial fulfillment of M. Sc.
(Agri) Degree course in Agriculture Economics (Unpublished
Thesis)
2. Deshmukh Sachine Nanasaheb (2004), ‘Production and
Marketing Management of Fruits in Solapur District’. A
Thesis submitted to the Mahatma Phule Krishi Vidyapeeth,
Rahuri towards the partial fulfillment of M. Sc. (Agri) Degree
Course in Agriculture Economics (Unpublished Thesis).
3. Pokharkar S. M. (1996), ‘Marketing of Custard Apple in Beed
District – A Case study M. Sc. (Agri). Thesis submitted to M.
A. V. Parbhani.
4. Ragan. S. K. (1997), ‘Marketing of Fig in Purandar Block of
Pune District’ A thesis submitted to the Mahatma Phule Krishi
Vidyapeeth, Rahuri towards the partial fulfillment of M. Sc.
(Agri) Degree Course in Agriculture Economics (Unpublished
Thesis).
5. Tayade B. M. (1971), ‘An Economic Investigationinto the
Cost of Production and Marketing of figs in Pune District’. A
Thesis Submitted to M. P. K. V. Rahuri.
6. Yadnik Pravin Subhash (2005), ‘Marketing Management of
Banana in Jalgaon District’, A Thesis submitted to the
Mahatma Phule Krishi Vidyapeeth, Rahuri towards the partial
fulfillment of M. Sc. (Agri) Degree Course in Agriculture
Economics (Unpublished Thesis).
7. Bongane Satish (2009), ‘Western Maharashtra : Fig Plantation
and marketing expenses study’, submitted to university of
Pune, Pune (Unpublished Study)
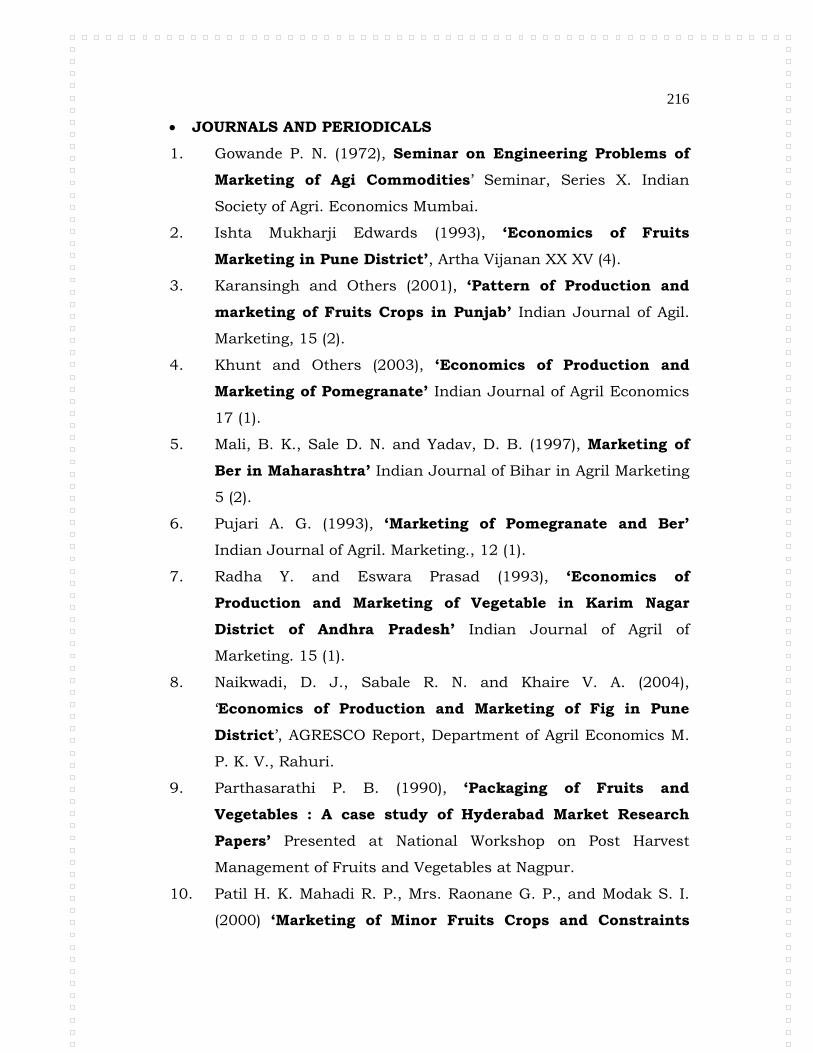
216
JOURNALS AND PERIODICALS
1. Gowande P. N. (1972), Seminar on Engineering Problems of
Marketing of Agi Commodities’ Seminar, Series X. Indian
Society of Agri. Economics Mumbai.
2. Ishta Mukharji Edwards (1993), ‘Economics of Fruits
Marketing in Pune District’, Artha Vijanan XX XV (4).
3. Karansingh and Others (2001), ‘Pattern of Production and
marketing of Fruits Crops in Punjab’ Indian Journal of Agil.
Marketing, 15 (2).
4. Khunt and Others (2003), ‘Economics of Production and
Marketing of Pomegranate’ Indian Journal of Agril Economics
17 (1).
5. Mali, B. K., Sale D. N. and Yadav, D. B. (1997), Marketing of
Ber in Maharashtra’ Indian Journal of Bihar in Agril Marketing
5 (2).
6. Pujari A. G. (1993), ‘Marketing of Pomegranate and Ber’
Indian Journal of Agril. Marketing., 12 (1).
7. Radha Y. and Eswara Prasad (1993), ‘Economics of
Production and Marketing of Vegetable in Karim Nagar
District of Andhra Pradesh’ Indian Journal of Agril of
Marketing. 15 (1).
8. Naikwadi, D. J., Sabale R. N. and Khaire V. A. (2004),
‘Economics of Production and Marketing of Fig in Pune
District’, AGRESCO Report, Department of Agril Economics M.
P. K. V., Rahuri.
9. Parthasarathi P. B. (1990), ‘Packaging of Fruits and
Vegetables : A case study of Hyderabad Market Research
Papers’ Presented at National Workshop on Post Harvest
Management of Fruits and Vegetables at Nagpur.
10. Patil H. K. Mahadi R. P., Mrs. Raonane G. P., and Modak S. I.
(2000) ‘Marketing of Minor Fruits Crops and Constraints

217
Analysis’ Department of Agril Economics K. K. Vidyapeeth
Dapoli, Indian Journal on Marketing.
11. Babu Lal Meena, Pant O. C. and Sharma J. D. (2005), ‘Process
and Channels for Marketing of Guava in Udaipur District in
Rajasthan’. Department of Agril Economics Maharana Pratap of
Agril and Techonology Udaipur, Indian Journal of Agriculture of
Marketing 10 (3).
12. Birari K. S. and Kasar P. V. (1983), ‘Marketing of Jalgaon
Banana in Delhi Market’ Indian Journal of Marketing (6-7).
13. Brijbala (2006), ‘Marketing System for Apple in Hills
Problems and Prospects (A Case study of Kulu District,
Himachal Pradesh), Agril Research and Extension Centre
Bajaura District Kulu, Himachal Pradesh’ Indian Journal of
Agril Economics.
14. George M. V. and Mailik H. S. (1971), ‘Cost and Returns from
Grape Cultivation in Hariyana State’, Department of
Economics Hariyana Agricultural University, Hissar.
15. Subhanarasaiah, N. and Mohan B., (1987), Marketing
Problems and Prospects of Citrus Fruit Growers in a
Backward Region – A Case Study of Guddapah District in
Andhra Pradesh’ Indian Journal of Marketing – (9).
REPORTS
1- ftYgk lkekftd o vkfFkZd lekykspu] iq.ks ftYgk 2009&10] ftYgk
lkaf[;dh dk;kZy;] iq.ks-
2- okf”kZd _rq vkf.k fids ;kapk vgoky r;kj dj.;kpk rDrk ¼2009&10½]
ftYgk fujh{kd Hkwfeys[k dk;kZy;] iq.ks-
3- okf”kZd _rq vkf.k fids ;kapk vgoky r;kj dj.;kpk rDrk ¼2005&06½
¼iqjanj Hkksj] gosyh] ckjkerh o nkSaM rglhy dk;kZy;½-

218
4- iq.ks d`”kh mRiUu cktkj lferh] okf”kZd vgoky 2005&06] rs
2009&10-
5- cktkj vkdkj iqfLrdk 2005&06] iq.ks d`”kh mRiUu cktkj lferh] ekdZsV
;kMZ] xqyVsdMh] iq.ks-
6- ,dkfRed vathj mRiknu o izfdz;k ifjlaokn] Lejf.kdk 2005] egkjk”Vª
jkT; vathj mRiknd la?k] iq.ks-
7- vathj okrkZ Lejf.kdk 2006] egkjk”Vª jkT; vathj mRiknd la?k] iq.ks-
8- jkstxkj geh ;kstus’kh fuxMhr QGckx ykxoM dk;Zdze vkWxLV 2002]
d`”kh vk;qDrky; ¼QyksRiknu foHkkx½] egkjk”Vª jkT;] iq.ks-
9- Indian Horticulture Database – 2008.
WEBSITES
a. Gerdien Meuernik and Pim Roza (2005), the role of Agriculture
in development makers chains and sustainable development
strategy and policy, Paper No. 5 stitching DLOC Wageningen
(http://www.boci.www.hl/uk) Publication.
b. Lennat Bage : Agriculture and Economic Development out
planet (www.unep.org.).
c. Mandivamba Rukuni: The growing business
(www.unep./ourplanet).
d. The free Eneyelopaedia: Agricultures in India
(Lttp/en.Wikipaedia.org).
e. H. M. chandrashekhar: Changing Scenario Farming in India. :
An Overview (http://WWW.Academic Journals.org).

219
DAILY NEWS PAPERS. v-ua o`Rri=@lkIrkfgd fnukad ys[k 1 dSokjh] ejkBk 29@2@2000 iks"kd eqY; vlysys vathj 2 dSokjh] ejkBk 16@1@05 iqjanjP;k QG mRikndkauh ‘ksrrG;kapk iz;ksx
jkcokok- 3 ldkG 26@3@2005 iqjanjyk ykxoM ok<Y;kus vathjkyk iqUgk
xroSHko 4 ldkG 26@3@2005 lIVsacj NkV.kheqGs vathjkps ikp iV mRiknu 5 ldkG 18@4@2005 vathjkph lkFk--------- yk[kksaph cjlkr
lkseqMhaP;k ‘ksrdÚ;kaP;k jk”Vªh; fodze- 6 ldkG 24@4@05 vathjkph ;ksX; fuxk jk[kY;kl lokZr
vf/kd [kk=hps fid 7 ldkG 26@11@05 iqjanjph vathjs txkP;k cktkjkr tk.;klkBh 8 ldkG 8@12@05 uhjk okYgk iV;kr vathjkoj rkacsÚ;kpk
ok<rk izknqHkkZo 9 ldkG 10@12@05 vfro`”Vhr eqG;k dqtY;kus vathj ckxkaoj
ifj.kke 10 ldkG 20@12@05 iqjanjP;k QG mRikndkauh ‘ksrrG;kapk iz;ksx
jkcokok- 11 ldkG 26@12@05 ftYg;kr 2450 gsDVjoj ;ko”khZ QG
ykxoM iqjanje/;s vathj jksi fufeZrh ok<.;kph fpUgs
12 ldkG 27@12@05 vathj ykxoM ok<yh ek= ‘kkL=’kq/n ekxZn’kZukpk vHkko-
13 ldkG 22@2@2005 vathjkP;k ckxsr <sels o ‘ksoxk 14 ldkG 22@2@06 vathjkojhy la’kks/ku 15 ldkG 27@2@06 vathj ckxk xkjBY;k xksMh mrjyh-16 ldkG 1@3@06 xkaMqG [krkoj cgjyh vathj ckx 17 ldkG 8@3@06 vathjkP;k ckxsrwu lkMspkj yk[kkaps mRiUu 18 ldkG 12@3@06 iqjanjP;k ‘ksrdÚ;kaP;k vathjkP;k lkFkhus
fnokGh 19 ldkG 17@3@06 vathojhy la’kks/ku 20 ldkG 3@5@06 <xkG gokekukpk vathjkauk rMk[kk

220
21 ldkG 28@5@06 bfrgkl izfl/n jktsokMhph vathjkyk eksBh
ekx.kh- 22 ldkG 5@7@06 iqjanje/;s gks.kkj Mh,Uuk vathj ykxoM 23 ldkG 12@7@06 ekGjkukoj cjgyh vathjkph ckx 24 ldkG 9@7@06 vathj jksi fufeZrhpk tksM/kank 25 ldkG 11@9@06 mRiknu [kpZ deh gks.;klkBh d`”kh
fon;kihBs dk; djr vkgsr\ 26 ldkG 17@9@06 okYgk ifjljkr tqU;k vathjkoj [kksMfdMhpk
izknqHkkZo 27 ldkG 26@10@06 [kMdkG ekGkoj vathjkps ;’kLoh mRiknu 28 ldkG 6@11@06 [kMdkG ekGkoj vathjkps ;’kLoh mRiknu 29 ldkG 10@11@06 fnO;kP;k efgyus lksMfoys vathjkP;k
cktkjHkkokps xf.kr 30 ldkG 29@11@06 cnyR;k gokekukr iqjanjps 80VDds vathj
mdyys- 31 ldkG 29@01@07 vathjkP;k ckxsr Qqyfoyk lalkj 32 ldkG 2@3@07 fofp= gokeku vathjkauk QVdk Hkko
dkslGyk- 33 ldkG 18@3@07 lqdoY;k tk.kkÚ;k vathj ck.kkoj ns.;kpk
fu.kZ;- 34 ldkG 18@3@07 okYg;kaP;k vathjkauk eaqcbZP;k cktkjisBsr
eksBh ekx.kh- 35 ldkG 18@3@07 ‘ksrhyk d”kh i;ZVukpk tksj 36 ldkG 18@3@07 vathj lhrkQGkpk lekos’k QyksRiknu
vfHk;kukr gokp 37 ldkG 18@3@07 rhl :i;kaph rjrwn % vathj- 38 ldkG 24@3@07 gokekukr cny >kY;kus vathjkph fLFkrh
lq/kkjyh- 39 ldkG 27@3@07 iqqjanjpk vathj rksM.kh gaxke ;ank fnM efguk
vk/khp 40 ldkG 12@5@07 iqjanjP;k vathjkph fu;kZr can 41 ldkG 12@5@07 iqjanj e/khy vathjckxk dqtY;k 42 ldkG 5@7@07 jk"Vªh; QyksRiknukr vfHk;kukrwu

221
vathjklkBh vuqnku feG.kkj- 43 ldkG 20@7@07 vathj mRikndkauh lsafnz; [krkapk
lq:okrhiklwu okij djkok- 44 ldkG 18@10@07 ra= vathj mRiknu ok<hps 45 ldkG 30@11@07 ‘ksrhph lkfgR;] lk/kus lkeqfgd i/nrhus
Hkwekrk d`”kheap [kjsnh dj.kkj 46 ldkG 30@1@08 dMkD;kP;k FkaMheqGs vathjkph xksMh gV.kkj 47 ldkG 15@3@08 tqUuje/khy fiaiGxko rQsZyk vathjkyk
;’kLoh mRiknu 48 ldkG 13@4@08 7000 fDoaVy ‘ksrhekykpk [ki 49 ldkG 8@5@08 lsanzh; i/nrhus vathjkps mRiknu 50 ldkG 16@5@08 vathj la’kks/ku dsanz fu;zkr{ke tkrh ‘kks/k.kkj 51 ldkG 26@5@08 rjp ‘ksrdÚ;kyk o xzkgdkyk ijoMsy- 52 ldkG 9@11@08 iqjanje/khy vathj---- gsDVjh lksGk Vu
mRiknu ‘kD;- 53 ldkG 7@1@09 fnudj vathj ¼oSf’k”V;s o egRo½ 54 ldkG 19@1@09 xqjksGhr] fnudj ph ykxoM 55 ldkG 24@1@09 [kV;k gaxkekdMs dy----- vathjkyk feGrks
vkgs lek/kkudkjd Hkko 56 ldkG 24@1@09 QG izfdz;klkBh mn;ksx daiU;kap gO;kr &
iokj 57 ldkG 11@3@09 vathjkph xksMh 58 ldkG 23@3@09 Tokjhizek.ksp vathj jk[k.;klkBh iqjanjyk
xksQ.khpk okij- 59 ldkG 26@3@09 vathjkP;k jk[k.khpk xksQ.k- 60 ldkG 8@4@09 vathjkph fu;kZr dsOgk\ 61 ldkG 14@4@09 lqD;k vathjklkBh mi;qDr tkrh yko.kkj
& MkW- [kSjs- 62 ldkG 22@4@09 vathjklkBh lsanzh; [krkapk okij 63 ldkG 29@4@09 iqjanje/;s vathj rksM.ks gaxke xqaMkGyk- 64 ldkG 27@10@11 QGckxkaukgh foE;kps dop-

222
APPENDIX 1 QUESTIONNAIRE FOR FIG PRODUCER FARMERS
AMjaIr ]%padkaMsaazI p`SnaavalaI maI iTLk maharaYT/ ivaVapIzacyaa ivaVavaacasptI ³pIeca.DI.´ pdvaIAMtga-t AByaasaËmaacaa ek Baaga mhNaUna maaJyaa ]prao> ivaYayaacyaa saMSaaoQanaasaazI maaihtI saMkilat krNyaacao kama krIt Aaho. %yaamaQyao AMjaIr fLbaagaÊ laagavaDÊ ]%padna Kca-Ê ]%pnnaÊ ivaËI samasyaaÊ ]payayaaojanaa yaabaabat saMSaaoQana krNyaacaa mau#ya ]_oSa Aaho.
sadr p`SnaavalaI Ba$na do}na malaa maaJyaa saMSaaoQana kayaa-saazI madt kravaI. hI sava- maaihtI saMSaaoQanakayaa-vyaitir> Anya karNaasaazI vaaprlaI jaaNaar naahI va idlaolaI maaihtI gaaopnaIya zovalaI jaa[-na yaabaabat maI AapNaasa Ka~I dotao.
Aaplaa ivaSvaasaU
³Paa. idgaMbar dugaa-Do´
1. tumacao naava p%ta AaiNa faona saaMgaa ³kuTuMba p`mau#a Saotk−yaacao´ ……………………………………………………………………
……………………………………………………………………… faona na. …………………..
2. tumacyaa kuTuMbaatIla sadsya saM#yaa iktI AahoÆ
1. ek to paca 2. saha to dha 3. dhapoxaa AiQak
3. tumacyaa kuTUMbaacao sva$p ksao AahoÆ
1. saMyau@t 2. ivaBa@t
4. tumacao iSaxaNa iktI Jaalao AahoÆ
1. inarxar 2. 1 laI to 8 vaI 3. 8vaI to 10 vaI 4. 10 to 12 vaI
5. pdvaI 6. Padvyau<ar 7. vyaavasaaiyak 8. [tr
5. tumacyaa p%naIcao iSaxaNa iktI Jaalao AahoÆ
1. inarxar 2. 1 laI to 8 vaI 3. 8vaI to 10 vaI 4. 10 to 12 vaI
5. pdvaI 6. Padvyau<ar 7. vyaavasaaiyak 8. [tr
6. tumacyaa maulaacao iSaxaNa iktI Jaalao AahoÆ
1. inarxar 2. 1 laI to 8 vaI 3. 8vaI to 10 vaI 4. 10 to 12 vaI
5. pdvaI 6. Padvyau<ar 7. vyaavasaaiyak 8. [tr
7. tumacyaa maulaIcao iSaxaNa iktI Jaalao AahoÆ
1. inarxar 2. 1 laI to 8 vaI 3. 8vaI to 10 vaI 4. 10 to 12 vaI
5. pdvaI 6. Padvyau<ar 7. vyaavasaaiyak 8. [tr

223
8. tumacaa Qama- kaoNata AahoÆ
1. ihMdU 2.mauuislama 3. iSaK 4. iKScana
5. baaOw À navabaaOw 6. jaOna 7. Qama- naahI 8. [tr 9. tumacaI jaat kaoNatI AahoÆ
……………………………………………………………… 10. tumacaa p`mauK vyavasaaya kaoNata AahoÆ
1. SaotI 2. vyaapar 3. ]Vaoga 4. naaokrI 11. tumacyaa SaotIcao ekUNa xao~ iktI AahoÆ
1. 0 to 2.5 ekr 2.2.5 to 5 ekr 3. 5 to 10 ekr 4. 10 to 15 ekr 5. 15 to 20 ekr 6. 20 ekrpoxaa jaast
12. kuTuMbaacyaa ]%pnnaacaa mau#ya stao~ kaoNataÆ
1. AMjaIr SaotI 2. SaotI AMjaIrotr 3. SaotIpUrk vyavasaaya
4.vyaapar 5. naaokrI 6. ]Vaoga 7. [tr ………………………
13. tumacao AMjaIracyaa laagavaDIKalaIla ekUNa xao~ iktIÆ
1. 1 ekrpya-Mt 2. 1 to 2 ekr 3. 2 to 3 ekr
4. 3 to 5 ekr 5.5 ekrpoxaa jaast
14. AMjaIr laagavaDIKalaIla ekUNa xao~ ³vaYa-inahaya´ :
15. AMjaIracaa dr ekrI ]%padna Kca- $pyao ³laagavaDÊ caaLNaIÊ KtoÊ AaOYaQaoÊ majaUrIÊ p^kIMgaÊ ivaËIKca-Ê vaahtUk A. P`a%yaxa Kcaa-caI r@kma AMjaIr
A. 2006 $pyao
ba. 2007 $pyao
k. 2008 $pyao
D. 2009 $pyao
[. 2010 $pyao
1 2 3 4 5 1 ekrpya-Mt 1 to 2 ekr 2 to 3ekr 3 to 5 ekr 5 ekrpoxaa jaast
A.2006
ba.2007 k.2008 D. 2009 [. 2010

224
16. dr ekrI ]%pnna $pyao AMjaIr A A. 2006 $pyao
ba. 2007 $pyao
k. 2008 $pyao
D. 2009 $pyao
[. 2010 $pyao
17. AMjaIr fLbaagaaMpasaUna ipkaMpasaUna dr ekrI nafa ³]%padna − ]%padna Kca- Ä nafa´
A AMjaIr A. 2006 $pyao
ba. 2007 $pyao
k. 2008 $pyao
D. 2009 $pyao
[. 2010 $pyao
18. kuTuMbaacao ekUNa vaaiYa-k ]%pnna $pyao 19. SaotI fLbaaga isaMcanaacyaa pwtI :
1. paTpaNaI 2. izbak isaMcana 3. tuYaar isaMcana 4. [tr
20. SaotIlaa paNaIpurvazyaacao stao~ kaoNato/Æ haoya naahI
A. Paa}sa 1 0 ba. ivahIr 1 0 k. baaoArvaola 1 0 D. SaottLo 1 0 [. ]psaa jalaisaMcana yaaojanaa 1 0 f. k^naala 1 0 ga. nadI 1 0 ca. [tr 1 0
21. AMjaIracaI ivaËI kaozoo haotoÆ 1. sqaainak baajaarpoz 2. talauka 3. ijalha 4. mauMba[- 5. doSaat 6. prdoSaI inayaa-t
22. AMjaIr ipkaMvar p`iËyaa krta kayaÆ 1. haoya 2. naahI

225
A. AMjaIravar p`iËyaa krIt Asalyaasa kaoNato ]ppdaqa- banavataÆ haoya naahI
1. saukamaovaa 1 0
2. caa^klaoT 1 0
3. jyaUsa 1 0
4.plp 1 0
5.pavaDr 1 0
6. Aa[saËIma 1 0
7.jaama va jaolaI 1 0
8. [tr ……………………………. 1 0
23. AMjaIr ]%padnaamauLo AapNa gaolyaa paca vaYaa-t [tr kaoNato SaotIpUrk va [tr vyavasaaya sau$ kolaoÆ
haoya naahI 1.dugQavyavasaaya 1 0 2.ku@kuTpalana 1 0
3.ma%syaSaotI 1 0
4. maoMZIopalana 1 0
5. SaoLIpalana 1 0
6.AMjaIracaa vyaapar 1 0
7. AMjaIr raopvaaiTka pnhorI ivaËI 1 0
8. vyaapar 1 0
9. ]Vaoga 1 0
10. kRYaI pya-Tna 1 0
11. [tr ……………………… 1 0
25. AMjaIr ]%padnaacaI porNaa kaoNaakDUna imaLalaIÆ
1. SaojaarIla SaotkrI 2. naatovaa[-k 3. ima~ 4. vat-maanap~o
5. kRYaI AiQakarI 6. cacaa-sa~o 7. kaya-SaaLa p`iSaxaNa 8. [tr ……
26. AMjaIr ]%padnaamauLo Aaplao kuTuMba sauKI Jaalao Aaho Asao AapNaasa vaaTto kayaÆ
1. naahI 2. AlpsamaaQaanaI 3. samaaQaanaI 4. savaao-cca pUNa- samaaQaana

226
27. AMjaIr ]%padnaacaa [tr SaotI vyavasaayaavar kaoNata pirNaama JaalaaÆ
haoya naahI A. pDIk jamaIna laagavaDIKalaI AaNalaI 1 0 ba. isaMcanaacyaa saaoyaI ³izbak isaMcanaÊ tuYaar isaMcanaÊ Paa[-plaa[-na [.´ 1 0 k. [tr fLbaagaaMcaI laagavaD 1 0 D. kRYaI pya-Tna vyavasaayaasa caalanaa 1 0 [. [tr pIk ]%padnaasa raojagaar Apura pDtao 1 0 f. [tr ipkaMnaa paNaI tuTvaDa 1 0 ca. [tr ipkaMnaa BaaMDvala kmaI pDto 1 0
28. AMjaIr SaotImauLo [tr iktI laaokaMnaa raojagaar imaLtao. A.hMgaamaI … 1. 1 to 2 majaUr 2. 3 to 5 majaUr 3. 5 to 10 majaUr 4. 10 poxaa AiQak ba. vaYa-Bar… 1. 1 to 2 majaUr 2. 3 to 5 majaUr 3. 5 to 10 majaUr 4. 10 poxaa AiQak
29. kuTuMbaacaa drmaihnaa ]pBaaoga Kca- 30. AMjaIr ]%padna krNaosaazI [traMnaa p`ao%saahna dota kayaÆ
1. haoya 2. naahI 31. SaotIsaazI kaoNatI Avajaaro vaaprtaÆ ³svat:caI´
haoya naahI A.baOlagaaDI 1 0 ba. T/^@Tr 1 0 k. jaIp 1 0 D. Tompao 1 0 [. T/k 1 0 Ga. jao.saI.baI. 1 0 f. AaOYaQa fvaarNaI poT/aola pMp 1 0 h. [tr 1 0
32. rah%yaa Garacaa pkar haoya naahI
A.JaaopDI 1 0 ba. kccao Gar 1 0 k. AQao-kccao AQao- p@ko ³iBaMtI kccyaaÊ Ct Ëa^MËITcao´ 1 0 D. imaEa Gar ³kahI p@@yaa kahI kccyaa Kaolyaa´ 1 0 [. p@ko Gar À baMgalaa 1 0 Ga. Fla^T 1 0
33. Aaplao ba^Mkot Kato Aaho kayaÆ 1. haoya 2. naahI

227
A. ba^MkomaQyao iktI zovaI AahotÆ 1. 1 to 10 hjaar $pyao 2. 10001 to 25000 $pyao 3.25,001 to 50Ê000 $pyao 4. 50Ê001 to 1 laaK 5. 1 laaKapoxaa AiQak 6. naahIt
34. AapNa kja- Gaotlao Aaho kayaÆ 1. haoya 2. naahI A. kja- kaoNa%yaa saMsqaakDUna GaotaÆ 1. saavakar 2. ptsaMsqaa 3. sahkarI ba^Mka 4. raYT/IyakRt baMka 5.KajagaI ba^Mka 6. naatovaa[-k ima~ 7. [tr ba. AapNa iktI kja- Gaotlao AahoÆ 1. 25 hjaarapya-Mt 2. 25 to 50 hjaar 3. 50 hjaar to 1 laaK 4. 1 laaKapoxaa jaast 5. naahI k. kjaa-caI prtfoD kolaI kayaÆ 1. naahI 2. vaoLovar kja-foD 3. qakIt kja- 4. saMpUNa- prtfoD kolaI
35. maaozyaa AajaarpNaat AapNa kaoNa%yaa dvaaKanyaat jaataÆ
1. naahI 2. gaavaat 3. Paaqaimak Aaraogya koMd` 4. KajagaI dvaaKanaa 5. sarkarI ha^ispTla 6. maaMi~k va GargautI ]paya
36. sahla pya-Tna ikMvaa tIqa-yaa~olaa jaata kayaÆ 1. naahI 2. haoya 3. 1 vaoLa 4. 2 vaoLa 5. 2 poxaa AiQak vaoLa
37. sahla pya-TnaasaazI kaozoo jaataƳsahla pya-Tna tIqa-yaa~a´ 1. pirsar 2. talauka 3. ijalha
4. rajya 5. doSa 6. prdoSaat
38. tumacyaakDo ikMvaa tumacyaa kuTuMbaakDo KalaIla gaaoYTI Aahot kayaÆ haoya naahI
A.saayakla 1 0
ba.svayaMpakacaa ga^sa 1 0 k. Toilafaona À maaobaa[-la 1 0
D. ivajaocaa pMKa 1 0
[. TI.vhI. 1 0
f. saMgaNak À[MTrnaoT 1 0
ga. skUTr À maaoTarsaayaklaÀ maaopoD 1 0
g. kar À jaIp À vhna 1 0
ya. eArkMDISanar À eArkular À if`ja 1 0
ja. T/^@Tr 1 0
k. pMpsaoT 1 0
la. vaR<ap~o 1 0

228
39. AMjaIr ]%padnaamaQyao yaoNaa−yaa p`mau#a samasyaa kaoNa%yaaÆ
haoya naahI A. BaaMDvalaacaa ABaava 1 0 ba. AMjaIravarIla raogaacao vaaZto p`maaNa 1 0 k. baajaarBaava 1 0 D. A&anaÊ p`iSaxaNaacaa ABaava 1 0 [. baajaarpozocyaa Apu−yaa saaoyaI 1 0 f. saazvaNaxamatocaa ABaava hrItgaRh 1 0 ga. paNyaacaa tuTvaDa 1 0 ma. majaUracaa tuTvaDa 1 0 ya. hvaamaana 1 0 k. maalaacaI inayaa-t naahI ³inayaa-t yaaogya´ 1 0 ma. PatvaarI va p`maaNaIkrNa 1 0 na. [tr samasyaa ………………………… 1 0 ……………………………………………………………………………………………………………………………………………………………………………………………………………………
40. AMjaIr ]%padnaamaQyao yaoNaa−yaa samasyaa saaoDivaNyaacao ]payayaaojanaa
haoya naahI 1.isaMcanaacyaa saaoyaI 1 0 2.p`iSaxaNa 1 0 3.kmaI vyaajadranao kja-Ê BaaMDvalapurvaza 1 0 4. saamauihk SaotI 1 0 5. AMjaIr ]%padk saMGa 1 0 6. P`aiËyaa krNaayaa ]VaogaacaI inaima-tI (maUlyavaiQa-t p`i`k`yaa´ 1 0 7. vaahtUkIcyaa saaoyaI 1 0 8. sarkarI Anaudana 1 0 9. yaaMi~kIkrNa 1 0 10. yaaogya baajaarBaava 1 0 11. kmaI saaKrocyaa va iTka} AMjaIracyaa jaatIMcao saMSaaoQana [. 1 0 12. AByaasadaOro 1 0
13. [tr ]payayaaojanaa 1 0 ……………………………………………………………………………………………………………………………………………………………………………………………………………………
Qanyavaad.
***********

229
APPENDIX 2 QUESTIONNAIRE FOR NON FIG PRODUCER FARMERS
ibagar AMjaIr ]%padkaMsaazI p`SnaavalaI maI iTLk maharaYT/ ivaVapIzacyaa ivaVavaacasptI ³pIeca.DI.´ pdvaIAMtga-t AByaasaËmaacaa ek Baaga mhNaUna maaJyaa ]prao> ivaYayaacyaa saMSaaoQanaasaazI maaihtI saMkilat krNyaacao kama krIt Aaho. %yaamaQyao AMjaIr fLbaagaÊ laagavaDÊ ]%padna Kca-Ê ]%pnnaÊ ivaËI samasyaaÊ ]payayaaojanaa yaabaabat saMSaaoQana krNyaacaa mau#ya ]_oSa Aaho.
sadr p`SnaavalaI Ba$na do}na malaa maaJyaa saMSaaoQana kayaa-saazI madt kravaI. hI sava- maaihtI saMSaaoQanakayaa-vyaitir> Anya karNaasaazI vaaprlaI jaaNaar naahI va idlaolaI maaihtI gaaopnaIya zovalaI jaa[-na yaabaabat maI AapNaasa Ka~I dotao.
Aaplaa ivaSvaasaU
³Paa. idgaMbar dugaa-Do´
1. tumacao naava p%ta AaiNa faona saaMgaa ³kuTuMba p`mau#a Saotk−yaacao´ ……………………………………………………………………
……………………………………………………………………… faona na. …………………..
2. tumacyaa kuTuMbaatIla sadsya saM#yaa iktI AahoÆ
1. ek to paca 2. saha to dha 3. dhapoxaa AiQak
3. tumacyaa kuTUMbaacao sva$p ksao AahoÆ
1. saMyau@t 2. ivaBa@t
4. tumacao iSaxaNa iktI Jaalao AahoÆ
1. inarxar 2. 1 laI to 8 vaI 3. 8vaI to 10 vaI 4. 10 to 12 vaI
5. o pdvaI 6. Padvyau<ar 7. vyaavasaaiyak 8. [tr
5. tumacyaa p%naIcao iSaxaNa iktI Jaalao AahoÆ
1. inarxar 2. 1 laI to 8 vaI 3. 8vaI to 10 vaI 4. 10 to 12 vaI
5. pdvaI 6. Padvyau<ar 7. vyaavasaaiyak 8. [tr
6. tumacyaa maulaacao iSaxaNa iktI Jaalao AahoÆ
1. inarxar 2. 1 laI to 8 vaI 3. 8vaI to 10 vaI 4. 10 to 12 vaI
5. pdvaI 6. Padvyau<ar 7. vyaavasaaiyak 8. [tr
7. tumacyaa maulaIcao iSaxaNa iktI Jaalao AahoÆ
1. inarxar 2. 1 laI to 8 vaI 3. 8vaI to 10 vaI 4. 10 to 12 vaI
5. pdvaI 6. Padvyau<ar 7. vyaavasaaiyak 8. [tr

230
8. tumacaa Qama- kaoNata AahoÆ
1. ihMdU 2.mauuislama 3. iSaK 4. iKScana
5. baaOw À navabaaOw 6. jaOna 7. Qama- naahI 8. [tr
9. tumacaI jaat kaoNatI AahoÆ
………………………………………………………………
10. tumacaa p`mauK vyavasaaya kaoNata AahoÆ
1. SaotI 2. vyaapar 3. ]Vaoga 4. naaokrI
11. tumacyaa SaotIcao ekUNa xao~ iktI AahoÆ
1. 0 to 2.5 ekr 2.2.5 to 5 ekr 3. 5 to 10 ekr
4. 10 to 15 ekr 5. 15 to 20 ekr 6. 20 ekrpoxaa jaast
12. kuTuMbaacyaa ]%pnnaacaa mau#ya stao~ kaoNataÆ
1. AMjaIr SaotI 2. SaotI AMjaIrotr 3. SaotIpUrk vyavasaaya
4.vyaapar 5. naaokrI 6. ]Vaoga 7. [tr ………………………
13. tumacao ibagar AMjaIracyaa laagavaDIKalaIla ekUNa xao~ iktIÆ
1. 1 ekrpya-Mt 2. 1 to 2 ekr 3. 2 to 3 ekr
4. 3 to 5 ekr 5.5 ekrpoxaa jaast
14. ibagar AMjaIr laagavaDIKalaIla ekUNa xao~ ³vaYa-inahaya´ :
1 2 3 4 5 1 ekrpya-Mt 1 to 2 ekr 2 to 3ekr 3 to 5 ekr 5 ekrpoxaa jaast
A.2006
ba.2007.
k.2008
D. 2009
[. 2010
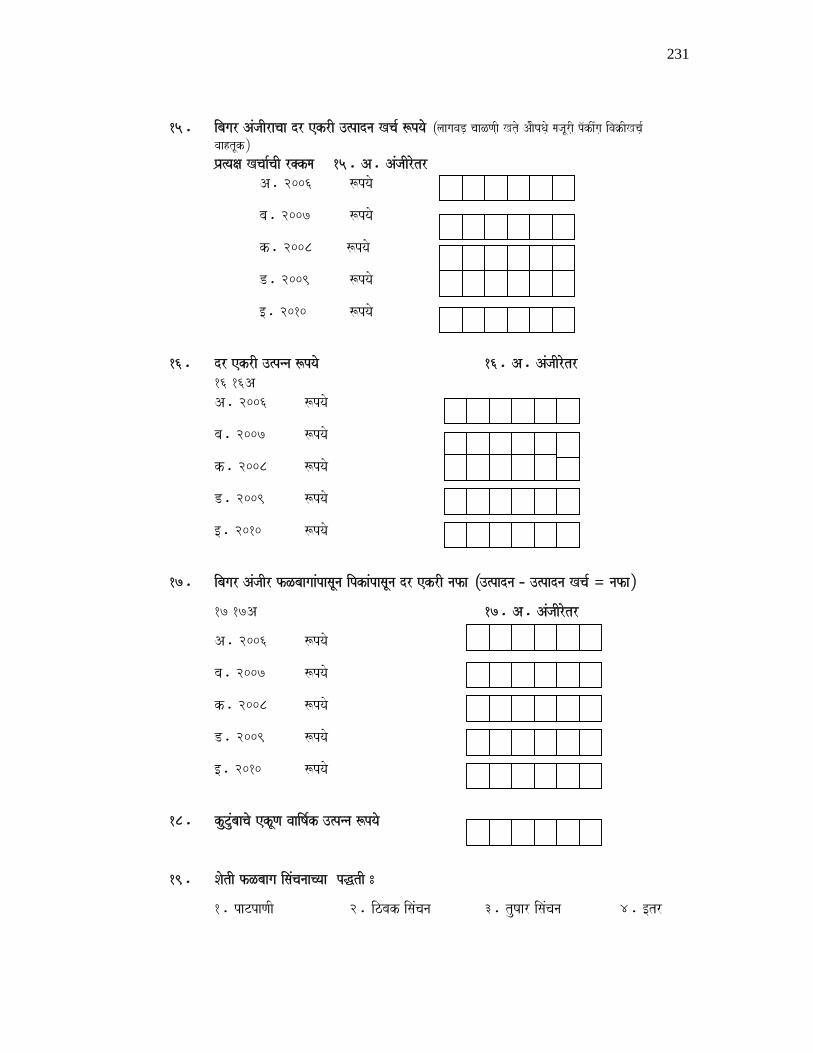
231
15. ibagar AMjaIracaa dr ekrI ]%padna Kca- $pyao ³laagavaDÊ caaLNaIÊ KtoÊ AaOYaQaoÊ majaUrIÊ p^kIMgaÊ ivaËIKca-Ê vaahtUk´ P`a%yaxa Kcaa-caI r@kma 15. A. AMjaIrotr
A. 2006 $pyao
ba. 2007 $pyao
k. 2008 $pyao
D. 2009 $pyao
[. 2010 $pyao
16. dr ekrI ]%pnna $pyao 16. A. AMjaIrotr
16 16A A. 2006 $pyao
ba. 2007 $pyao
k. 2008 $pyao
D. 2009 $pyao
[. 2010 $pyao
17. ibagar AMjaIr fLbaagaaMpasaUna ipkaMpasaUna dr ekrI nafa ³]%padna − ]%padna Kca- Ä nafa´
17 17A 17. A. AMjaIrotr
A. 2006 $pyao
ba. 2007 $pyao
k. 2008 $pyao
D. 2009 $pyao
[. 2010 $pyao
18. kuTuMbaacao ekUNa vaaiYa-k ]%pnna $pyao
19. SaotI fLbaaga isaMcanaacyaa pwtI :
1. paTpaNaI 2. izbak isaMcana 3. tuYaar isaMcana 4. [tr

232
20. SaotIlaa paNaIpurvazyaacao stao~ kaoNato/Æ haoya naahI
A. Paa}sa 1 0
ba. ivahIr 1 0 k. baaoArvaola 1 0 D. SaottLo 1 0 [. ]psaa jalaisaMcana yaaojanaa 1 0 f. k^naala 1 0 ga. nadI 1 0 ca. [tr 1 0
21. ibagar AMjaIracaI ivaËI kaozoo haotoÆ
1. sqaainak baajaarpoz 2. talauka 3. ijalha 4. mauMba[- 5. doSaat 6. prdoSaI inayaa-t
22. ibagar AMjaIr ipkaMvar p`iËyaa krta kayaÆ
1. haoya 2. naahI
22. A. ibagar AMjaIravar p`iËyaa krIt Asalyaasa kaoNato ]ppdaqa- banavataÆ haoya naahI
4. saukamaovaa 1 0
5. caa^klaoT 1 0
6. jyaUsa 1 0
4.plp 1 0
5.pavaDr 1 0
6. Aa[saËIma 1 0
7.jaama va jaolaI 1 0
8. [tr ……………………………. 1 0
23. kuTuMbaacaa drmaihnaa ]pBaaoga Kca- 24. SaotIsaazI kaoNatI Avajaaro vaaprtaÆ ³svat:caI´
haoya naahI A.baOlagaaDI 1 0 ba. T/^@Tr 1 0 k. jaIp 1 0 D. Tompao 1 0 [. T/k 1 0 Ga. jao.saI.baI. 1 0 f. AaOYaQa fvaarNaI poT/aola pMp 1 0 h. [tr 1 0

233
25. rah%yaa Garacaa pkar haoya naahI
A.JaaopDI 1 0 ba. kccao Gar 1 0 k. AQao-kccao AQao- p@ko ³iBaMtI kccyaaÊ Ct Ëa^MËITcao´ 1 0 D. imaEa Gar ³kahI p@@yaa kahI kccyaa Kaolyaa´ 1 0 [. p@ko Gar À baMgalaa 1 0 Ga. Fla^T 1 0
26. Aaplao ba^Mkot Kato Aaho kayaÆ
1. haoya 2. naahI A. ba^MkomaQyao iktI zovaI AahotÆ 1. 1 to 10 hjaar $pyao 2. 10001 to 25000 $pyao 3.25,001 to 50Ê000 $pyao 4. 50Ê001 to 1 laaK 5. 1 laaKapoxaa AiQak 6. naahIt
27. AapNa kja- Gaotlao Aaho kayaÆ 1. haoya 2. naahI A. kja- kaoNa%yaa saMsqaakDUna GaotaÆ 1. saavakar 2. ptsaMsqaa 3. sahkarI baMka 4. raYT/IyakRt ba^Mka 5.KajagaI ba^Mka 6. naatovaa[-k ima~ 7. [tr ba. AapNa iktI kja- Gaotlao AahoÆ 2. 25 hjaarapya-Mt 2. 25 to 50 hjaar
3. 50 hjaar to 1 laaK 4. 1 laaKapoxaa jaast 5. naahI k. kjaa-caI prtfoD kolaI kayaÆ 1. naahI 2. vaoLovar kja-foD 3. qakIt kja- 4. saMpUNa- prtfoD kolaI
28. maaozyaa AajaarpNaat AapNa kaoNa%yaa dvaaKanyaat jaataÆ
1. naahI 2. gaavaat 3. P`aaqaimak Aaraogya koMd` 4. KajagaI dvaaKanaa 5. sarkarI ha^ispTla 6. maaMi~k va GargautI ]paya
29. sahla pya-Tna ikMvaa tIqa-yaa~olaa jaata kayaÆ
1. naahI 2. haoya 3. 1 vaoLa 4. 2 vaoLa 5. 2 poxaa AiQak vaoLa
30. sahla pya-TnaasaazI kaozoo jaataƳsahla pya-Tna tIqa-yaa~a´ 1. pirsar 2. talauka 3. ijalha
4. rajya 5. doSa 6. prdoSaat

234
31. tumacyaakDo ikMvaa tumacyaa kuTuMbaakDo KalaIla gaaoYTI Aahot kayaÆ
haoya naahI A.saayakla 1 0
ba.svayaMpakacaa ga^sa 1 0 l. Toilafaona À maaobaa[-la 1 0
E. ivajaocaa pMKa 1 0
[. TI.vhI. 1 0 h. saMgaNak À[MTrnaoT 1 0
ga. skUTr À maaoTarsaayaklaÀ maaopoD 1 0 i. kar À jaIp À vhna 1 0
ya. eArkMDISanar À eArkular À if`ja 1 0 ja. T/^@Tr 1 0 k. pMpsaoT 1 0 la. vaR<ap~o 1 0
Qanyavaad.
***********
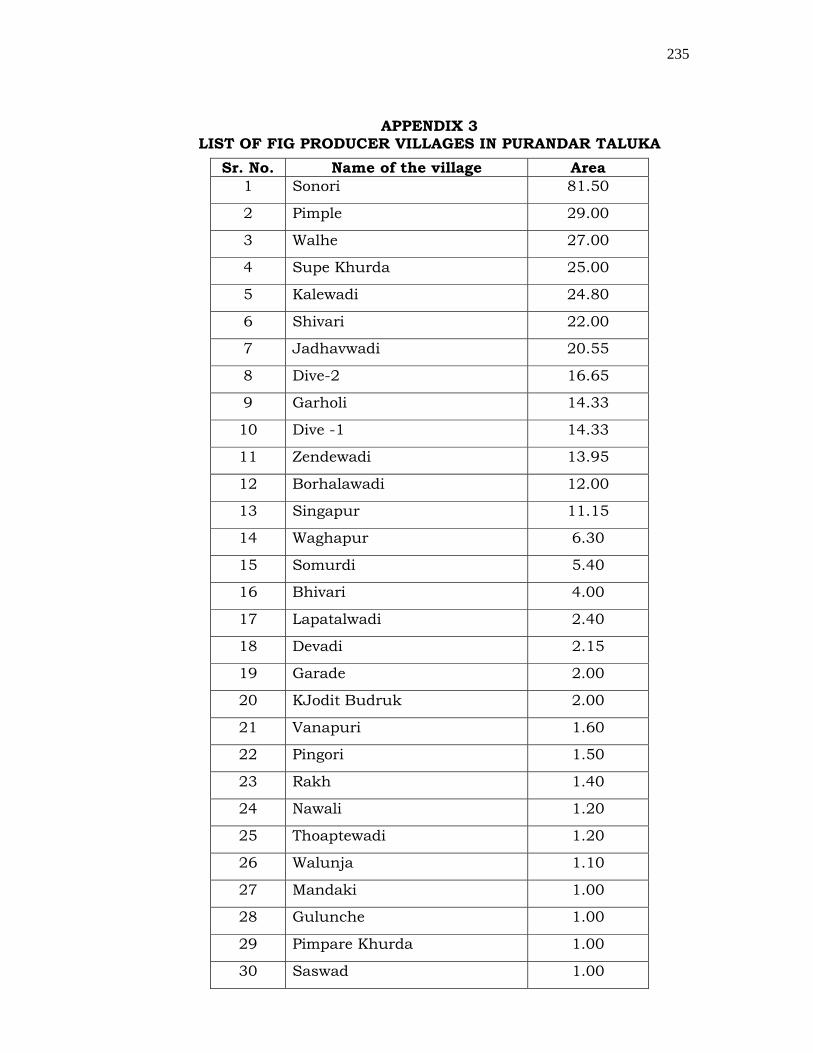
235
APPENDIX 3 LIST OF FIG PRODUCER VILLAGES IN PURANDAR TALUKA
Sr. No. Name of the village Area 1 Sonori 81.50
2 Pimple 29.00
3 Walhe 27.00
4 Supe Khurda 25.00
5 Kalewadi 24.80
6 Shivari 22.00
7 Jadhavwadi 20.55
8 Dive-2 16.65
9 Garholi 14.33
10 Dive -1 14.33
11 Zendewadi 13.95
12 Borhalawadi 12.00
13 Singapur 11.15
14 Waghapur 6.30
15 Somurdi 5.40
16 Bhivari 4.00
17 Lapatalwadi 2.40
18 Devadi 2.15
19 Garade 2.00
20 KJodit Budruk 2.00
21 Vanapuri 1.60
22 Pingori 1.50
23 Rakh 1.40
24 Nawali 1.20
25 Thoaptewadi 1.20
26 Walunja 1.10
27 Mandaki 1.00
28 Gulunche 1.00
29 Pimpare Khurda 1.00
30 Saswad 1.00

236
31 Kodit Khurda 1.00
32 Rajuri 1.00
33 Paragaon 1.00
34 Udachiwadi 0.90
35 Khalad 0.90
36 Bhivadi 0.870
37 Naygaon 0.80
38 Rajewadi 0.80
39 Pisarve 0.75
40 Pokhar 0.60
41 Sakurde 0.50
42 Jawalarjun 0.40
43 Karnalwadi 0.40
44 Jeur 0.40
45 Aambale 0.40
46 Vir 0.20
47 Nazare K. P. 0.20
48 Bhosalewadi 0.20
49 Khanwadi 0.20
50 Takrarwadi 0.15

237
APPENDIX 4 LIST OF FIG PRODUCERS IN PURANDAR TALUKA
Sr. No. Name of the Producers Village
1 Vilas Genaba Poman Pimple 2 Subhash Baban Poman Pimple 3 Gulab Baban Poman Pimple 4 Shivaji Bhiku Poman Pimple 5 Anil Shantaram Poman Pimple 6 Vitthal Dinkar Lolhe Pimple 7 Dattatraya Sitaram Poman Pimple 8 Laxman Mahadev Poman Pimple 9 Bharat Govinda Shivarkar Pimple 10 Ashok Mahadev Navale Pimple 11 Sopan Kondiba Navale Pimple 12 Dilip Tukaram Lolhe Pimple 13 Baburao Sambhaji Poman Pimple 14 Shantaram Ganpat Poman Pimple 15 Vilas Dhondiba Poman Pimple 16 Vasant Dnyanadev Poman Pimple 17 Laxman Bhikoba Poman Pimple 18 Mohan Ramchandra Walhekar Pimple 19 Balasaheb Vitthal Poman Pimple 20 Janardan Raghunath Poman Pimple 21 Tukaram Ganpat Poman Pimple 22 Kailas Ganpat Poman Pimple 23 Vilas Genaba Poman Pimple 24 Sudhakar Nivrutti Poman Pimple 25 Gajanan Gokul Borkar Sonori 26 Sandip Bandu Kale Sonori 27 Shantaram Dagadu Aadarake Sonori 28 Sukhadev Shankar Sonawane Sonori 29 Pandurang Rajaram Pawar Sonori 30 Pandharinath Damodar Kale Sonori 31 Gokul Baban More Sonori 32 Prakash Vitthal Kale Sonori 33 Dagadeu Mahadu Kamathe Sonori 34 Shivaji Khandu Kale Sonori 35 Baban Govinda Kale Sonori 36 Malhari Kalhuram Borkar Sonori 37 Dnyanadev Martand Kale Sonori

238
38 Chandrakant Ananta Kale Sonori 39 Annaso Dasharath Kale Sonori 40 Yashwant Rajaram Kale Sonori 41 Sanjay Raghunath Kale Sonori 42 Shantaram Pandit More Sonori 43 Baban Shripati More Sonori 44 Vaman Vitthal Kale Sonori 45 Mohan Sahebrao Kale Sonori 46 Dnyanadev Dagadu Kale Sonori 47 Balaso Pandurang Kale Sonori 48 Someshwar Balakrishna Kale Sonori 49 Krishna Jyotiba Kamathe Sonori 50 Subhas Shivaram Kale Sonori 51 Shankar Pandit More Sonori 52 Dnyanadev Tatyaba Kale Sonori 53 Dattatraya Nana Kale Sonori 54 Ramesh Rajaram Kale Sonori 55 Vilas Tatyaba Kale Sonori 56 Manoj Murlidhar Jagtap Supe 57 Anil Baburao Phadatare Supe 58 Vilas Tukaram Phadatare Supe 59 Sudhakar Kashinath Raut Supe 60 Vaman Tukaram Jagtap Supe 61 Nilesh Gulab Pawar Supe 62 Digambar Waghuji Bandal Supe 63 Ashok Sudam Jagtap Supe 64 Sandip Raghunath Katkar Supe 65 Dilip Krishna Subhagade Supe 66 Dilip Sitaram Chavan Supe 67 Rajendra Kashinath Mhetre Supe 68 Balasaheb Kashinath Mhetre Supe 69 Anil Ananta Poman Supe 70 Nitin Kaluram Phadatare Supe 71 Subhash Martand Jagtap Supe 72 Vilas Martand Jagtap Supe 73 Somnath Eknath Mhetre Supe 74 Ramesh Martand Jagtap Supe 75 Pandurang Baban Mhetre Supe 76 Balu Vithal Mhetre Supe 77 Vasant Haribhau Mhetre Supe

239
78 Eknath Shankar Jagtap Supe 79 Bapu Sadhu Mhetre Supe 80 Jaysingh Sadhu Mhetre Supe 81 Ankush Bhivan Pawar Supe 82 Sopan Sahebrao Shirke Walhe 83 Anand Manohar Pawar Walhe 84 Suryakant Anandarao Pawar Walhe 85 Namdev Genu Pawar Walhe 86 Tatyaba Nanaso Pawar Walhe 87 Babai Dhondiba Date Walhe 88 Dilip Maruti Pawar Walhe 89 Shamrao Bhikoba Pawar Walhe 90 Sudam Baburao Date Walhe 91 Dattatraya Shankar Pawar Walhe 92 Santosh Bolchanda Pawar Walhe 93 Gulab Baburao Date Walhe 94 Vishnu Bhiku Pawar Walhe 95 Dnyanadev Pandharinath Pawar Walhe 96 Sunil Baburao Kandhalkar Walhe 97 Jaysing Ramchandra Date Walhe 98 Maruti Gopinath Pawar Walhe 99 Sainath Chandrakant Chavan Walhe 100 Dattatraya Maruti Pawar Walhe

240
APPENDIX NO. 5 LIST OF NON FIG PRODUCERS IN PURANDAR TALUKA
Sr. No. Name of the Producers Village 1 Ganesh Dhondiba More Sonori
2 Alka Kisan Kale Sonori
3 Vasant Nana Kale Sonori
4 Bapu Sadhu Kale Sonori
5 Kisan Baban More Sonori
6 Abhijeet Shantaram More Sonori
7 Kailas Gokul Kale Sonori
8 Amol Dhondiba More Sonori
9 Saheberao Namdev Kale Sonori
10 Balaso Eknath Kale Sonori
11 Sopan Raaso Kale Sonori
12 Santosh Raghu Kale Sonori
13 Sarjerao Shripati Kale Sonori
14 Pandurang Vitthal Kale Sonori
15 Sudam Dasharath Kale Sonori
16 Ramchandra Shripati Kale Sonori
17 Mhasku Bhairu Kale Sonori
18 Baban Bhairu Kale Sonori
19 Shankar Ranu Kale Sonori
20 Dnyandev Mahadev Kale Sonori
21 Satish Shantaram Katkar Supe Khurd
22 Kundlik Sadashiv Jagtap Supe Khurd
23 Kishor Sahebrao Raut Supe Khurd
24 Narayan Shripati Aambole Supe Khurd
25 Vishwas Baban Katkar Supe Khurd
26 Machindra Murlidhar Jagtap Supe Khurd
27 Ashok Khandu Pawar Supe Khurd
28 Shankar Govind Jagtap Supe Khurd
29 Eknath Krushna Kale Supe Khurd
30 Balasaheb Sahebrao Pawar Supe Khurd
31 Hanumant Dattoba Kshirsagar Supe Khurd
32 Vijay Baban Mote Supe Khurd

241
33 Lahu Ramdas Kunjir Supe Khurd
34 Dyandev Khandu Pawar Supe Khurd
35 Pappu Maruti Raut Supe Khurd
36 Suresh Baburao Jagtap Supe Khurd
37 Anil Baban Jadhav Supe Khurd
38 Jairam Shankar Jagtap Supe Khurd
39 Raghunath Shankar Jagtap Supe Khurd
40 Gulab Pandharinath Jagtap Supe Khurd
41 Maruti Kashinath Mhetre Supe Khurd
42 Mugut Bajirao Jagtap Supe Khurd
43 Goturam Shrirang Jagtap Supe Khurd
44 Ramdas Dasharath Jagtap Supe Khurd
45 Shriramg Sopan Mhetre Supe Khurd
46 Vikas Chanedrakant Jagtap Supe Khurd
47 Mohan Kisan Jagtap. Supe Khurd
48 Suresh Chandrakant Jagtap Pimpale
49 Namdev Haribhau Poman Pimple
50 Sampat Shivaji Poman Pimple
51 Sahaji Chandrakant Poman Pimple
52 Dnyaneshwar Sitaram Poman Pimple
53 Sudam Vitthal Poman Pimple
54 Uttam Aashru Khairnar Pimple
55 Tulshiram Bhairu Poman Pimple
56 Tanaji Parvati Poman Pimple
57 Sampat Genba Poman Pimple
58 Sumit Maruti Borade Pimple
59 Suresh Sopanrao Saste Somurdi
60 Chandrakant Raghoba Surve Somurdi
61 Ankush Dashrath Durgade Walhe
62 Santosh Nanaso Durgade Walhe
63 Kamal Suresh Bhujbal Walhe
64 Ramdas Sahebrao Shirke Walhe
65 Sopanrao Sarjerao Pawar Walhe
66 Sonaba Raghunath Durgade Walhe
67 Tatyaba Raju Dargade Walhe

242
68 Haridas Ramchandra Durgade Walhe
69 Tukaram Sidu Pawar Walhe
70 Shivaji Namdev Pawar Walhe
71 Gorakh Gopichand Pawar. Walhe
72 Balu Kashiram Pawar Walhe
73 Jaywant Baburao Bhujbal Walhe
74 Ramchandra Aaju Durgade Walhe
75 Bhalchandra Sidram Durgade Walhe
76 Subhash Balaso Durgade Walhe
77 Tukaram Kondiram Durgade Walhe
78 Popat Sahadu Durgade Walhe
79 Laxman Baburao Bunage Walhe
80 Sunil Sopanrao Pawar Walhe
81 Laxman Baburao Pawar Walhe
82 Dhondba Tukaram Kale Walhe
83 Dhimrao Sidu Madane Walhe
84 Shrirang Tukaram Durgade Walhe
85 Haribhau Mahadu Durgade Walhe
86 Popat Raghu Pawar Walhe
87 Shantaram Bhikoba Pawar Walhe
88 Satywan Nathsaheb Suryawanshi Walhe
89 Kalyan Baburao Pawar Walhe
90 Rekhatai Hanumant Pawar Walhe
91 Nivrutti Krushna Pawar Walhe
92 Gangaram Tukaram Durgade Walhe
93 Pradip Vitthal Durgade Walhe
94 Kundlik Dharmaji Durgade Walhe
95 Dhananjay Ramchandra Pawar Walhe
96 Dattatray Tukaram Pawar Walhe
97 Bajrang Somaji Pawar Walhe
98 Dattatray Babaji Chavan Walhe
99 Ankush Dinkar Pawar Walhe
100 Dattatray Aashru Poman Walhe
*******
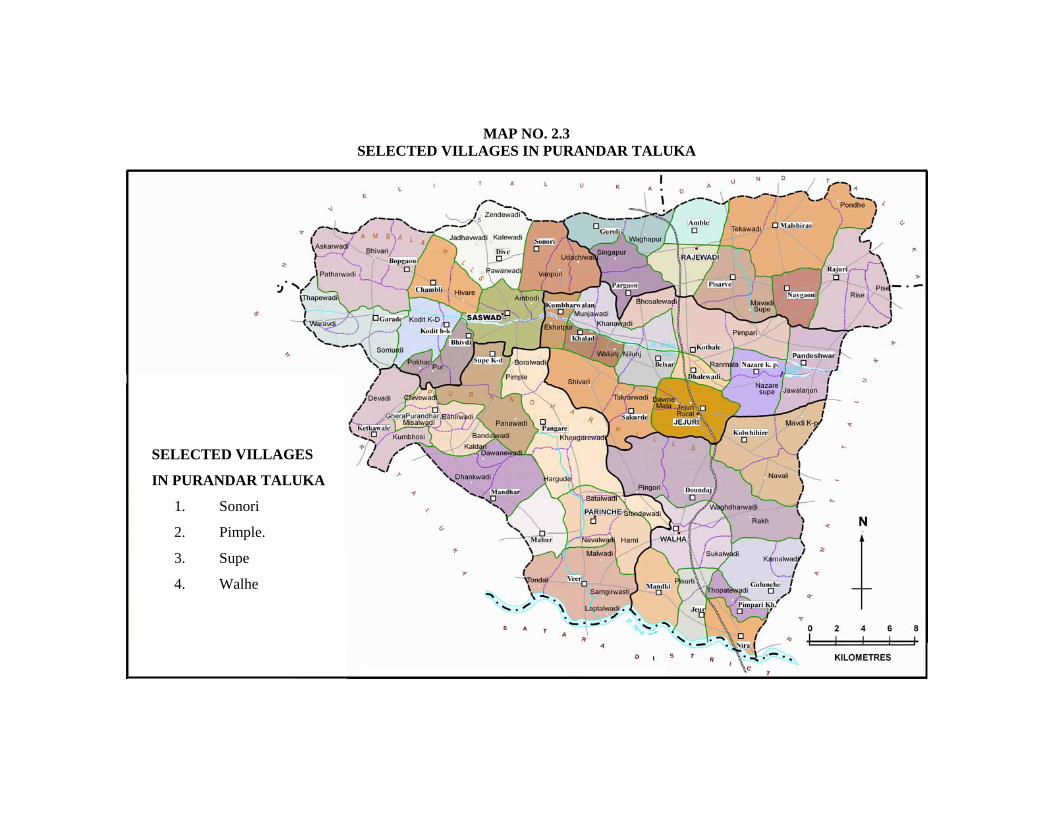
MAP NO. 2.3 SELECTED VILLAGES IN PURANDAR TALUKA
SELECTED VILLAGES
IN PURANDAR TALUKA
1. Sonori
2. Pimple.
3. Supe
4. Walhe

Photo No. 1.1
Trained / Pruned orchard of fig

Photo No. 2.1
Fully grown orchard of fig

Photo No. 3.1
Fig plant with fruits

Photo No. 4.1
Field visit of expert with farmers

Photo No. 5.1
Fig fruits before harvesting