The Economic Burden of HIV/AIDS in Canada
114
The Economic Burden of HIV/AIDS in Canada TERRY ALBERT GREGORY WILLIAMS with the collaboration of BARBARA LEGOWSKI and DR. ROBERT REMIS CPRN Study No. H|02|
-
Upload
independent -
Category
Documents
-
view
1 -
download
0
Transcript of The Economic Burden of HIV/AIDS in Canada

The Economic Burden ofHIV/AIDS in Canada
TERRY ALBERTGREGORY WILLIAMS
with the collaboration ofBARBARA LEGOWSKI and DR. ROBERT REMIS
CPRN Study No. H|02|

ISBN 1-896703-24-0© Canadian Policy Research Networks Inc., 1998
Available from:Renouf Publishing Co. Ltd.
5369 Canotek RoadOttawa, ON K1J 9J3Tel.: (613) 745-2665Fax: (613) 745-7660
Home Page: http://www.renoufbooks.com
The findings of this study are the sole responsibility of the authors and, as such, have notbeen endorsed by the individuals and agencies mentioned throughout this publication.

Contents
Foreword VII
Acknowledgments IX
I Overview 11 Background and Introduction 12 The Economic Burden of HIV/AIDS in Canada:
A Map of the Paper 1Appendix I 4Notes 5References 6
II HIV Epidemiology: A Dynamic Epidemic 71 Introduction 7
1.1 The Challenge of Surveillance 71.2 The History of Multiple Epidemics:
Biological and Environmental Factors 91.3 The First Infections: HIV among Persons
from Endemic Countries 101.4 The Epidemic among Men Who Have Sex with Men 101.5 The Epidemic among Injection Drug Users 101.6 The Epidemic in the Heterosexual Population 111.7 HIV Infection among Canadian Aboriginal People 121.8 HIV Infection among Canadian Youth 13
2 Methodology 142.1 Estimating the Plausible Limits of HIV Prevalence and
Incidence in 1996: The Base Case 143 Findings 144 Discussion 14
4.1 HIV Incidence, AIDS Incidence and AIDS Deaths 164.2 The Falling Curve 1985-88: Saturation or
Effective Prevention 164.3 Hot Spot: The IDU Epidemic in Vancouver 174.4 Ontario’s IDU Epidemic: Relative Success or
Emerging Problem? 174.5 Epidemiology for HIV Prevention 18
Appendix II 19Notes 21References 22
iii

III The Direct and Indirect Costs 251 Introduction 252 Methodology 26
2.1 Indirect Costs 262.2 Direct Costs 27
3 Findings 293.1 Episodic Costs 293.2 Disease Staging of the Prevalent HIV-infected
Population in Canada 323.3 Total Costs Associated with the Prevalent Population 343.4 Summary of Economic Burden 36
4 Discussion 384.1 Annual Direct Cost Projections 384.2 Annual Direct Cost Estimate for the
1997 Prevalent Population 384.3 Applying Costs to Populations vs. Individuals 384.4 Comparisons with Other Studies 394.5 The New Episode 404.6 Transfer Payments 404.7 Conclusion 41
Appendix III 42Notes 48References 49
IV Canada’s Investment in HIV Prevention 511 Introduction 51
1.1 Is Prevention a Good Investment? 511.2 Defining HIV/AIDS Prevention and Education 52
2 Methodology 532.1 The Public Sector 532.2 The Private Sector 542.3 Limitations of the Data 54
3 Findings 563.1 National Investment in HIV Prevention 563.2 Health Canada Expenditures 563.3 Provincial, Territorial and
Municipal Government Expenditures 573.4 Provincial/Territorial Health Department/
Ministry Expenditures 623.5 Private Sector 64
4 Discussion 664.1 Canada’s Response 664.2 Canada in an International Context 674.3 Is There Room for Improvement? 68
Appendix IV 71Notes 75References 75
IV

V Scenarios 771 Introduction 772 Methodology 77
2.1 Modelling HIV Incidence in Canada to 2001,Three Scenarios: Brief Description of the Model 77
2.2 Determining the Parameters 782.3 Description of Scenarios 782.4 Calculating Societal Costs 79
3 Findings 793.1 Scenarios of Incidence 793.2 Attributing Direct Costs and
Indirect Costs to the Scenarios 794 Discussion 80
4.1 The Benefits of Achieving Effective Control 80Appendix V 81Notes 94References 94
VI Policy Implications 951 Introduction 952 Key Findings 953 The Policy Context 974 New Surveillance Networks Are Needed 985 HIV Prevention: The Need for Best Practices 996 Concluding Comments 101Notes 102References 102
CPRN Funding Sources 105
V

vii
Foreword
In late 1994, CPRN was commissioned by Health Canada to coordinate anEconomic Research Initiative on HIV/AIDS. Accordingly, an AdvisoryCommittee was formed, priorities were established, a request for proposals wasissued, and the ensuing research proposals were carefully reviewed. Majorprojects to gather economic information in association with clinical and healthservice information were commissioned in Vancouver, Calgary, and Toronto. Inaddition, smaller community-based social, economic, and health service projectswere funded in Edmonton, Ottawa and Montreal. These projects will all becompleted in March 1998, and the project leaders will be publishing their ownresults.
More recently, Health Canada asked CPRN to coordinate a series of economicprojects on prevention of HIV/AIDS. They too will be completed in 1998.
In his site visits and regular contact with the researchers, Terry Albert, programcoordinator, has witnessed the human dimensions and the complexities of thisdisease, as well as the commitment of providers, caregivers, and researchers. Thisstudy is an early synthesis of learnings from many of the projects, while still inprogress. Project leaders have provided emerging data on costs, the changingpatterns of illness among HIV-positive people, and the shifting incidence of theinfection as witnessed from the clinics participating in the projects. The signifi-cance of this emerging information was assessed by CPRN with the help of twoexpert panels – one on epidemiology and the other on clinical issues.
Our object was to estimate the economic burden of HIV/AIDS. What does adisease cost? The obvious costs are for the care and treatment of people who areill. Add to that the loss to society when someone dies prematurely or is unable tofunction as well as he/she could have done in a healthy state.
But infectious diseases are different. They are preventable. Many have beenstopped by identifying a vaccine and organizing comprehensive immunizationprograms. But there is no vaccine or cure, as yet, for HIV, which is transmittedmainly through sexual intercourse and the injection of drugs. The only way toprevent HIV is through changes in behaviour. This presents challenges of adifferent order because it is necessary to ask why people engage in riskybehaviours. Some may do so out of ignorance. But the evidence on this epidemicis that the most vulnerable populations are now people who have been marginal-ized from society. They are poor, unemployed, suffer from racial discrimination,

viii
etc. For them, the risk of AIDS may seem remote or insignificant in relation to theother risks they face in their daily lives.
Thus what started out as fairly straightforward economic study was trans-formed into a serious set of social and political issues. The costs of this disease toCanadian society are very high. The epidemic is shifting to new populations. Thenumber of new infections has increased rapidly in the last few years. The solutionlies in prevention. But there is no instant tool kit of prevention programs that hasbeen proven to be effective among the marginalized people who are at risk ofbecoming HIV infected. The study therefore points to the need for a much greaterfocus on surveillance and prevention, and to new approaches to governance in thehealth system, which bring experts in criminal justice, housing, employment, andsocial services into the effort to address the economic and social costs ofHIV/AIDS.
I would like to thank Terry Albert, who is on the staff of CPRN, his coauthor,Gregory Williams, a consultant to the project, along with Barbara Legowski andDr. Robert Remis, who collaborated on key sections of the paper. I also want tothank the panels of experts and the Advisory Committee for this initiative forgiving us good advice as the authors diligently worked their way through a vastamount of raw data to come up with a comprehensive portrait of the state of theepidemic in Canada today.
Judith MaxwellPresident

Acknowledgments
This study would not have been possible without the cooperation and collabora-tion of several people and groups from across Canada. Health Canada must firstbe recognized for having the vision and foresight to invest in the HIV/AIDSEconomic Research Initiative and this research project in particular. Throughtheir cooperation and contribution of data, the various provincial departments andministries of health proved invaluable in this first attempt, in Canada, at measur-ing investment in HIV prevention.
As well, we are indebted to Dr. John Gill from the Southern Alberta Clinic,Calgary Regional Health Authority, and to his research associate, Mr. BillDavidson, for contributing key data. Dr. Gill’s investment in a longitudinaldatabase will be of ongoing value for many avenues of research. We also wish torecognize the work of Dr. Chris Archibald, from Health Canada’s LaboratoryCentre for Disease Control, for a very fruitful collaboration with CPRN in thedevelopment of epidemiological estimates. As well, the data provided by theBC Centre for Excellence in HIV/AIDS, the HIV Ontario ObservationalDatabase (HOOD) and numerous community-based AIDS service organizationsacross the country is much appreciated.
Two Delphi meetings were convened by CPRN involving experts from acrossthe country. The information generated from these sessions was critical to theresearch findings contained in this report. We wish to thank the participants andDr. Catherine Hankins and Dr. Mark Wainberg for chairing these sessions.Participants are listed in the Appendices to Chapters II and III.
Special thanks are due to our colleagues and collaborators in this research.Barbara Legowski was instrumental in acquiring and analysing the HIV preven-tion expenditure data collected within Canada and internationally. Dr. RobertRemis made a critical intellectual contribution to this project through his leader-ship and the expertise he provided in the epidemiological analysis and modelling.We are also indebted to Eden Cloutier for his statistical advice and input.
This research has been reviewed by several people whose comments haveimproved the final product. In particular, we would like to thank Doug Angus,Russell Armstrong, Janet Dunbrack, Robin Hanvelt, Philip Jacobs, BarbaraJones, Heidi Liepold, Julia Martin, Nancy Meagher, Bob Shearer and DavidSchneider.
Finally, we are truly grateful for the input, guidance and high-level thinking
ix

provided by Judith Maxwell. Her unwavering support, critical reviews andanalytical input were invaluable to this project and typify CPRN’s mission tocreate knowledge and lead public debate on socio-economic issues important tothe well-being of Canadians.
This project was funded by the AIDS Care, Treatment and Support Programunder the National AIDS Contribution Program of the National AIDS Strategy,Health Canada.
x

The Economic Burden ofHIV/AIDS in Canada

1 Background and Introduction
Concerns about the magnitude and impact of HIV/AIDS on the health care system and on society ingeneral were raised soon after AIDS was recognized in1981. Economists make up the third wave of re-searchers to consider the implications of HIV/AIDSafter the initial involvement by epidemiologists andclinicians, and second wave of social and be-havioural study researchers (Hanson, 1992). Fromthe perspective of a person living with HIV/AIDS(PHA), a cure will be the ultimate result of theresearch effort. However, it is widely accepted thatthe HIV/AIDS epidemic is still largely in front of usand not behind us (Hankins and Handley, 1992) andsociety must cope with cumulating numbers of newinfections each year and the related economic im-pacts. Hence, while the search for a cure continues,we must also better understand the economic dimen-sions of the epidemic in order to guide us inevidence-based policy formulation and optimal re-source allocation.
Health Canada’s contribution in this area wasthe creation of the National HIV/AIDS EconomicResearch Initiative. The primary objective was tomake a healthy start and build a solid foundation forfuture research. The initiative is comprised of twomajor components each with a number of majorprojects (refer to Appendix I) in locations across thecountry: 1) HIV/AIDS care, treatment and support;and 2) HIV prevention and education. CPRN wasgiven the mandate to coordinate the initiative and toalso undertake a research project on “The EconomicBurden of HIV/AIDS in Canada.”
Two research workshops were held under the ini-tiative in order to share interim results and explorelinkages between the research projects. A final na-tional workshop for the research initiative will be
held in February 1998. CPRN will be preparing afinal report in March, 1998, which will synthesizethe research findings from the initiative and identifya longer term research agenda in this area.
2 The Economic Burden ofHIV/AIDS in Canada:A Map of the Paper
A key objective in conducting this study was tocapitalize on the emerging findings from the researchprojects of the initiative, link these results to otherresearch and bring these interim results to bear onpressing policy issues. A cost of illness or economicburden approach was selected as the most suitableframework. The overriding objective was to quantifyand make explicit several key economic dimensionsof the HIV/AIDS epidemic in Canada.
Critics of economic burden studies have likenedthem to Oscar Wilde’s definition of a cynic: “onewho knows the price of everything, and the value ofnothing.” While this is harsh, it does highlight amajor limitation – they are not economic evaluationswhere costs are examined in relation to consequences(i.e., inputs relative to outputs). However, the outputof economic burden studies have an intrinsic value –the economic dimensions of specific diseases aremade explicit. They also provide the numerator forcost-effectiveness studies and significant value-added can accrue from linking this information toother areas such as prevention and epidemiology.
Examining the HIV/AIDS epidemic through aneconomic lens is one of several interrelated andcomplementary approaches that will assist in cre-ating a process of evidence-based policy develop-ment and decision making. But amid all the numbers
I Overview
1

and dollar figures we must not forget the pain andsuffering of those Canadians living with HIV/AIDS,and the rief and loss of their family, friends andloved ones.
2.1 Conceptual Overview
This paper sits on three pillars, which representthe analytical core for the research. As depicted inthe conceptual overview (Figure I-1), the three corecomponents are interrelated and the findings fromeach are brought to bear on a scenario chapter,which, in turn, informs the final chapter on policyimplications and options.
The rationale behind including these core com-ponents is quite simple. First, it is intuitive thatidentifying and capturing direct and indirect costsis a fundamental aspect of gaining a better under-
standing of the economic impact of ill health andin making societal losses explicit. Epidemiology,in turn, provides estimates of prevalence andincidence and hence functions as the multiplierfor determining overall economic burden. Finally,as a natural extension, our national investment inHIV prevention is included in the paper as ameasured response geared to reducing economicburden.1
Ultimately, the findings from these three analyt-ical components will reveal the contrast between thecost per case infected and cost per case averted.Additionally, it will allow for the establishment ofa break-even point in terms of the number ofprevented cases required in order to recover theannual national investment in HIV prevention.
Figure I-1
Conceptual Overview
Policy implications and options
Economic Burdenof HIV/AIDS
in Canada
Component 1: direct and
indirect costs
Component 2: prevention investment
Component 3: epidemiology
Scenarios
The Economic Burden of HIV/AIDS in Canada
2

2.2 Direct and Indirect Costs
Conflicting and contradictory estimates of thedirect costs of HIV/AIDS have been used in mediaand other reports over the past five or six years.The findings from this paper and the other researchprojects funded under this initiative will provideup-to-date information and better estimates morefirmly grounded in Canadian experience.
More importantly, however, is the objective ofderiving more current cost estimates associatedwith the new and emerging HIV/AIDS episode.Direct cost estimates produced in the late 1980sreflected an episode that was dominated by inpa-tient hospital costs. Over the past five years, thenatural history of HIV disease and treatmentpatterns have evolved and changed rapidly and anew HIV/AIDS episode has emerged. Drugs nowoutstrip inpatient hospital costs in the episodicresource consumption profile.
The main analytical challenges in capturing thesecosts relate to characterizing the new episode interms of duration and phases of illness and, second,to build resource consumption profiles over thesephases.
Fortunately, a recent and reliable Canadian estimateof the indirect episodic costs associated with HIV/AIDS is available from the literature for use withinthe context of this study (see Hanvelt et al., 1994).
2.3 Epidemiology
The HIV/AIDS epidemic has been characterizedas a somewhat hidden epidemic due to the lag timebetween time of infection and diagnostic discovery.Hence there is a risk of underestimating incidenceand prevalence. A number of analytical techniqueshave been employed by epidemiologists and statisti-cians in order to estimate current levels of theepidemic in the Canadian population.2 These esti-mates are adjusted downstream once closer to ac-tual incidence figures become available from HIVtesting data and AIDS case data.3 There is anecdo-
tal evidence that the time gap is narrowing betweendate of seroconversion (infection) and date of diag-nosis. Some attribute this to the new drug therapiesand the related incentive to get tested and start thedrugs as early as possible in the infection process.4
If this holds true, then there could be a positiveeffect on the timeliness and accuracy of epidemio-logical estimations. However, it is also known thatHIV infection is increasing in populations at themargins of society and many of these people, afterbecoming infected, present themselves to the healthcare system much later in the infection process.
The prevalence and incidence estimates for thisstudy were produced in collaboration with HealthCanada’s Laboratory Centre for Disease Control(LCDC). A component model patterned after theHolmberg (1996) study in the United States wasreplicated (see Chapter II). This essentially entailsbuilding prevalence estimates for Canada by sub-populations in major metropolitan centres.
While reliable estimates of the prevalent HIVpopulation in Canada are important for generatingthe multiplier for the cost data, they also providerich analytical potential in relation to Canada’sinvestment patterns and choices in HIV prevention.
2.4 Investment in HIV Prevention
This is the first time Canada’s national invest-ment in HIV prevention is quantified. This includesinvestments made at the federal, provincial andmunicipal levels as well as private investment fromcorporations and individuals. This data providesinitial insights into the types and level of investmentrelative to the directions of the epidemic over time.The data also enable some initial international com-parisons and provide some context for the Canadiandata.
2.5 Future Scenarios
The data from the three core components of theresearch are also applied in a “crystal ball” type ofexercise, where plausible future scenarios for the
3
Overview

direction of the epidemic are connected to the costdata as a means of exploring the future economicimpacts of the epidemic. This produces cost differen-tials between various incidence scenarios and makesexplicit the economic incentive behind investing inHIV prevention.
2.6 Policy Implications
The empirical findings of this paper raise keypolicy issues relating to the HIV/AIDS epidemicin Canada. Key policy questions are raised orframed as an important first step in future policydevelopment and formulation. We must betterunderstand the implications of our policies and the
consequences of not acting or acting inappropri-ately. While we have the benefit of learning fromour mistakes, we must also prevent mistakes inthe first place. We must keep a vigilant eye on thisepidemic and, to the extent possible, stay ahead ofit with innovative, fiscally responsible, ethical andequitable policy and program development.
Component 1: Care and Treatment
Major Projects
1. The Economic Costs and Resource Impacts ofHIV/AIDS in British Columbia (Robin Hanvelt,Robert Hogg, David Schneider, Tobin Copleyand Nancy Meagher), BC Centre for Excel-lence in HIV/AIDS and Faculty of Medicine,University of British Columbia.
2. The Cost of Community-based Care for Per-sons with HIV/AIDS (John Gill, Myron Weber,Bill Davidson), Southern Alberta Clinic,Foothills Hospital and Faculty of Management,University of Calgary.
3. Preventing Mycobacterium Avium ComplexInfection in People Living with HIV and AIDS:A Cost-Utility Analysis (Donald Redelmeier andAhmed Bayoumi), Wellesley Hospital ResearchInstitute and Department of Medicine, Univer-sity of Toronto.
4. Costing Community Care Programs for PeopleLiving with HIV/AIDS: A Pilot Study Proposal(Philip Jacobs, Peter Calder), University ofAlberta; (Russell Armstrong, Dawn Walker andBlaze Mumford) Canadian AIDS Society andCanadian Association for Community Care.
5. Economic Evaluation of Various PatientManagement Models for HIV-infected Womenand Children (Normand Lapointe, André-Pierre Contandriopoulos, Johanne Samson andCristian Morales), Sainte-Justine Hospital andUniversity of Montreal.
6. The Cost and Outcomes of the HIV/AIDSEpidemic in Ontario: Expanding the HIVOntario Observational Database (HOOD) toInform Policy-Makers on Service Utilization,Cost and Outcomes Related to HIV/AIDS(Margaret Millson, Gregory Robinson, JamesLavery, Ron Wall, Dale McMurchy), HOOD,University of Toronto, University of WesternOntario.
Appendix I
National HIV/AIDS Economic Research Initiative
The Economic Burden of HIV/AIDS in Canada
4

Building Research Capacity Projects
1. Two comprehensive literature reviews on HIV/AIDS and informal care:
The Opportunity Costs of Informal Care Giv-ing: A Review of the Literature (Marie Allard,enyse Dagenais, Paul Lanoie and VéroniqueOuellettte), École des Hautes Études Commer-ciales, Montreal.
Informal Delivery of Care and Support Ser-vices in General and in HIV/AIDS (Jean-PierreBélisle), École des Hautes Études Commerciales,Montreal.
2. Towards Development of a Management Infor-mation System for Community-based AIDSService Organizations (Joint project betweenthe Canadian AIDS Society, Health Canada andCPRN).
3. The Application of Resource Utilization Pro-files from the B.C. Community Care CostingProject in Other Jurisdictions (Robin Hanvelt,David Schneider, Nancy Meagher and TobinCopley).
Component 2:HIV Prevention and Education
1. Mathematical Modelling of HIV/AIDS Preven-tion: A Synthesis of Experience, Evidence, andTheory (Robin Hanvelt, Nancy Meagher, DavidSchneider and Tobin Copley), BC Centre forExcellence in HIV/AIDS and the Faculty ofMedicine, University of British Columbia.
2. The Cost-Effectiveness of Behavioural Interven-tions in an Emergent Risk Group: Edmonton=sStreetworks Program (Philip Jacobs, PeterCalder, Duncan Sanders, Stan Houston, MarlissTaylor and Jason Brown).
3. Development of a Prototype National HIV/AIDS Prevention Database (William Swan,Christine Knott and Patrick Taylor), Queen=sHealth Policy Research Unit, Kingston.
4. International Comparison of HIV Prevention inFive OECD Countries: In Search of Best Prac-tice (Gregory Williams and Barbara Legowski),Canadian Policy Research Networks and
Notes1 It is understood that the primary reason for engag-
ing in HIV prevention is to prevent unnecessarypain and suffering and to increase overall societalquality of life. In doing so, economic burden is alsoreduced.
2 For example, Dr. Ping Yan at Health Canada=s Labora-tory Centre for Disease Control used a back-calculationmodel using current AIDS case data in order to deriveHIV incidence estimates for previous periods.
3 An HIV case becomes designated as an AIDS casethrough a definitional process that is based on acombination of biological markers and clinical indi-
cators.
4 While many clinicians are reporting improvementsin biological markers in their patient populations(i.e., rebounding CD-4 counts and undetectable vi-ral load), there are many PHAs who cannot toleratethe toxic side effects of the new drug regimens. Aswe continue to evaluate the impacts of these newdrug therapies, quality of life/functional health sta-tus measures need to be examined alongside thebiological measures.
5
Overview

Williams Research.
Hankins, Catherine and Margaret Handley (1992),“Towards an HIV/AIDS Research Agenda for the1990s: A Background Discussion Paper,” preparedfor the Canadian Association for HIV Researchthrough a grant from the National Health Researchand Development Programme, Ottawa: HealthCanada.
Hanson, K. (1992), “AIDS: What Does Economics Haveto Offer,” Health Policy and Planning 7(4):315-28.
Hanvelt, Robin A. et al. (1994), “Indirect Costs ofHIV/AIDS Mortality in Canada,” AIDS 8(10).
References
The Economic Burden of HIV/AIDS in Canada
6

1 Introduction
Keeping track of the HIV epidemic is a challenge.Vital statistics on AIDS and HIV are potentiallyconfusing and misleading to the lay person. Forexample, at this year’s Canadian Association forHIV Research (CAHR) scientific conference, twoimportant findings were released: first, that AIDSincidence has decreased as has AIDS mortality;second, HIV infections according to a new estimateare increasing. HIV is the underlying viral infectionthat causes AIDS, a clinically and biologically de-fined illness. The lag time between viral infectionand presentation of even early illness may be as longas 5 to 10 years or more. The recent decrease inAIDS cases and AIDS deaths is a function of thesuccess in reducing new infections in the mid-1980sand improvements in treatment of HIV infection thattend to prolong life.
The increase in new infections reflects the spreadof the epidemic to new populations, especially injec-tion drug users (IDU). This has unleashed a thirdwave of HIV infection and created a whole new setof challenges to both health and social policy. Todate, there have been three waves of HIV infection inCanada:
C the first, among persons from countries where HIVis endemic to the heterosexual population;
C the second, and most significant wave thus far,among men who have sex with men (MSM);
C the third is driven by new infections among injec-tion drug users.
Chart II-1 shows the dynamic path of new infec-tions since the early 1980s. In the early years(1981-83), the infections were concentrated among
men who have sex with men (MSM) – 82 percent ofall new infections (Archibald et al., 1997). By 1996,their share of new infections had fallen to 37 percent.Intravenous drug users were not a major factor in theearly 1980s, but they now account for 49 percent ofall new infections. Rates of infection are also risingamong women. This chapter describes the shiftingpattern of the epidemic and the need for more accu-rate and comprehensive methods to track the epi-demic.
1.1 The Challenge of Surveillance
Annual incidence, the number of new infections ina given year, indicates whether the epidemic is grow-ing or shrinking over time, and is also, therefore, thesingle most important measure of success or failureat epidemic control. Unfortunately, unless a personis being repeatedly tested (e.g., volunteers in longitu-dinal studies like VIDUS,1 OMEGA,2 etc.), we sel-dom know the actual rate of infection, or incidentrate, for HIV in a given subpopulation when it isactually happening. Estimating incidence with anysensitivity on a year-to-year basis for the entirecountry in all its regional diversity therefore repre-sents an even greater challenge.
As more Canadians come forward for HIV testing,it is possible to compile HIV positive test reports orserodiagnostic data.3 Ontario, for example, has anexcellent serodiagnostic database. This is an impor-tant contribution, but again, the relationship betweentime of infection and time of diagnosis throughtesting is not consistent. There is also the question ofhow representative these databases are of both thegeneral population and, more importantly, thosepopulations that are most at risk. What prompts anindividual to be tested? According to a large nationalstudy, about 40 percent of Canadians who sought
II HIV Epidemiology: A Dynamic Epidemic
7

testing did so for purposes of monitoring their health,but about another 30 percent sought testing becausethey erceived themselves to be at risk for infection(Sutherland et al., 1996). Serodiagnostic databasestherefore have a substantial representation of indi-viduals that perceive themselves to be at high risk or,in epidemiologic jargon, a potential selection bias.These databases tell us less about populations thatdo not perceive themselves to be at serious risk.
Self-perceived risk and epidemiological risk arenot necessarily correlated. For example, in a recentstudy of women undergoing abortion in Quebec, 80percent of the HIV-positive women perceived them-selves to be a low risk (Remis et al., 1997). Women,in particular, appear to be underreported in serodi-agnostic data-bases. In New Brunswick, a recentstudy found 111 HIV-positive women of childbear-ing age although there are only 31 women currentlyreported in the system (Getty et al., 1997). HIVtesting data are important and contribute to theoverall picture of the epidemic’s evolution, but theyare a poor proxy for incidence data. Without somesense of incidence, the leading edge of the epidemic
remains hidden from view.
Despite the challenges associated with surveil-lance, there is a real need for reliable estimates ofHIV incidence – the number of new infections peryear, and HIV prevalence – the number of HIV-infected Canadians living in a given time. Incidence, inboth the general population but more specifically in thehigh-risk subpopulations or “core groups,” is a high-level indicator of success or failure of epidemic control.The size of the epidemic as determined by prevalence,and some under-standing of the composition of thatpopulation with respect to disease progression, is aprerequisite for estimating the resources needed toprovide care and treatment for that population. Inthis exercise, the prevalent population is the basicmultiplier used to determine the economic burden.Ideally, public policy is evidence based, and there-fore reliable estimates of both incidence and preva-lence are needed to inform decisions about theallocation of scarce resources to prevent the spreadof the epidemic and provide care and treatment forthe infected.
0
20
40
60
80
100
1981-83 1984-86 1987-90 1996
48
1419
82
64
50
37
2
8
24
49
Women
MSM
IDU
Percent
Chart II-1
HIV Incidence in Canada by Three Risk Groups
MSM = Men who have sex with men; IDU = injection drug users.Note: Comparison based on back-calculations.Source: Based on data presented by Dr. Chris Archibald, LCDC, at the Canadian Association for HIV Research Scientific Conference ‘97.
The Economic Burden of HIV/AIDS in Canada
8

The purpose of this chapter, therefore, is to shine alight on the hidden epidemic to provide: a) a concep-tual understanding of the dynamics of the epidemicthat can evade sight; b) plausible estimates of currentHIV prevalence and incidence for 1996; and c) plau-sible estimates of historical HIV prevalence and HIVincidence, and a critical interpretation of these trends.
1.2 The History of Multiple Epidemics:Biological and Environmental Factors
In Canada, as in other developed countries, theepidemiology of HIV has been characterized as“overlapping epidemics moving in waves through aseries of different risk groups” (Blower et al., 1990).The first evidence of a full-scale epidemic came in theearly 1980s with the presentation of previously rareforms of cancer and viral pneumonia among gaymen with severely suppressed immune systems. HIVwas not isolated in the laboratory until 1985. Priorto that, the exact etiology of Acquired Immune Defi-ciency Syndrome (AIDS) had not been known. HIVis a blood borne pathogen. Specific forms of humanbehaviour that promote the exchange of contaminatedblood or blood byproducts, like semen, are the bio-logical routes of infection. HIV has been isolated inother human body fluids, like saliva, but not insufficient quantities to promote effective transmis-sion. The precise pathways by which HIV causes thebreakdown of the immune system are still not under-stood, but all but a few skeptics now agree that HIVis requied in the body to produce AIDS. HIV is thenecessary causative agent at the root of a disastrousglobal epidemic, which has caused grave humansuffering and continues to have profound social andeconomic consequences.
Successful transmission of any infectious diseaserequires a susceptible host and a virulent agent.However, transmission occurs in an environment thesocial and economic characteristics of which mayserve to catalyze or inhibit the evolution of an epi-demic. In theory, virtually everyone is at risk for HIVinfection. Practically speaking, this is not the case.Who is actually exposed to contagion, and is there-
fore at practical risk, is determined by a host offactors including behavioural and environmental fac-tors. Tuberculosis, an old public health problem,which is occurring with renewed intensity, is associ-ated with poor housing and bad ventilation. It is alsoa disease of the poor and the marginalized. Like HIV,it disproportionately affects Aboriginals and is com-mon among the injection drug community andstreet-involved people, including youth. The very factof being either an Aboriginal, an injection drug useror a street-involved youth puts an individual atgreater risk for both HIV and tuberculosis.
Canada is a country of many subpopulations,which can be stratified by age, region, gender, ethnic-ity, sexual identity, income, etc. Different groupshave different health problems, but one truth is al-ways evident. The health of the poor is always worserelative to the health of the middle-class and the rich(Evans et al., 1994). The popular version of AIDS asan epidemic of rich, gay white men distorts the realityof the changing demographics of HIV/AIDS. Analy-sis of a national, cross-sectional survey of 1,136HIV-infected Canadians, most of whom identifiedthemselves as gay men, suggests a trend to bothlower education and lower income levels prior toinfection among those who were most recently in-fected (Echenberg, 1997).
The study of infectious disease in populations hasprovided insight into the way contagions interact withhuman society. A classical model of the epidemiologyof infectious disease tends to view society as a staticentity and the infectious agent as some-thing that actson the society. The public health goal that derivesfrom this model seeks to stop the spread of infectiousdisease without really changing the society (Mann,1996). A vaccine, for example, does not requiresubstantial social change to stop the spread of infec-tious disease, although producing one may requireboth substantial social organization and a commit-ment of resources. A vaccine acts at the biologicallevel to induce immunity in the host. If it is effective,it requires only one significant behavioural change:the vaccination itself.
9
HIV Epidemiology: A Dynamic Epidemic

Currently, there is no vaccine to decrease suscepti-bility and in turn to biologically block the spread ofHIV.4 Therefore, it is essential to anticipate theepidemic’s evolution, and make a concentrated ef-fort to help communities at risk so they may resistinfection. This effort will require a vigilant and imag-inative public health response that can elucidate andmonitor the leading edges of the epidemic (much likea probe searches the unknown regions of space), anddeliver timely, effective and measured interventions.Simultaneously, policy must address the social andeconomic conditions that are proving fertile soil forHIV, other infectious diseases, and a myriad ofhealth problems that waste human potential.
1.3 The First Infections: HIV amongPersons from Endemic Countries
Historically speaking, the first reported cases ofAIDS in Canada were among Canadians from Haitiliving in Quebec in the early 1980s. Haiti is a countrywhere HIV is pervasive, or endemic, among theheterosexual population. The first infections inCanada were among Canadians from “endemic coun-tries.” The primary modes of transmission for thisrisk group are sexual activity and perinatal transmis-sion from pregnant mother to child.
1.4 The Epidemic among MenWho Have Sex with Men
The second wave of infections, and to date the mostsubstantial, occurred among men who have sex withmen (MSM). In this community HIV is primarily asexually transmitted disease (STD). High rates ofinfection among men who have sex with men drovethe epidemic in Canada until between 1984 and1986 when it peaked and infection rates began todrop (Yan et al., 1996; Schecter et al., 1992). Cur-rently, MSM comprise approximately 37 percent ofnew infections compared to 82 percent in 1981-83(Archibald et al., 1997). There is some evidence tosupport a resurgence of infection among MSM in thelate 1980s as a new cohort of young MSM becamesexually active (Yan et al., 1996). This resurgence
would correspond to the second peak of the curve inChart II-2. There is also evidence to support thebelief that there is a new epidemic among young gaymen, at least in Vancouver,5 following similar pat-terns in American cities such as San Francisco. Thiscorresponds to the intuitive notion that young people,including young gay men, are at higher risk as theylearn to negotiate new sexual practices with confi-dence.
Social and economic marginalization appears tocontinue to play a role in undermining the health ofyoung gay men and making them susceptible to HIV.A study of risk-taking sexual behaviour amongyoung gay men found that risk takers were signifi-cantly more likely to have unstable housing, lesseducation, problems with depression, use cocaine,alcohol and nitrate inhalants and smoke cigarettesthan non-risk takers (Strathdee et al., 1996). Risktakers in this study were also more likely to have beenpaid for sex or having reported nonconsensual sex.6
A high proportion of young gay men in a recent studyof risk behaviour in a prospective cohort of younggay men in Vancouver reported high rates of suicidalthoughts and attempted suicide. The authors note thatdepression, substance abuse and homophobia impactnegatively on self-esteem and negotiating skillsthereby increasing vulnerability to HIV infection.The role of violence in compounding this phe-nomenon among young gay men is noted as animportant area for further investigation (Martindaleet al., 1997).
1.5 The Epidemic amongInjection Drug Users
This is a highly unstable and volatile epidemic. Asnoted earlier, injection drug users accounted for al-most half (49 percent) of new HIV infections in 1996compared to 24 percent in 1987-907 (Archibald etal., 1997). Recent data from the Vancouver Intra-venous Drug Users Study (VIDUS) indicates that theHIV incidence in Vancouver could be as high as 20percent, that is 1 in 5 injection drug users in Vancou-ver will become infected in a given year. The basecase model for 1996, developed by the Laboratory
The Economic Burden of HIV/AIDS in Canada
10

Centre for Disease Control in collaboration withCPRN, used a more conservative estimate of 12.3percent per 100 person-years under the assumptionthat VIDUS participants represented the VancouverIDU population at highest risk.
In Montreal, HIV prevalence among IDU remainsmoderate and stable over time. At the CACTUSneedle exchange, approximately 19 percent of 650IDU were infected. New infections are occurring inthis group at a rate of approximately 8.3 percentper 100 person-years. While not as explosive asVancouver’s reported incidence rates among IDU,this is still relatively high (Hankins et al., 1997). Thesame phenomenon of stable HIV prevalence and highHIV incidence has been observed in Québec City(Poulin et al., 1997). The combination of high inci-dence and stable prevalence points to a dynamicepidemic: one in which there is substantial outflowdue to mortality, rehabilitation, and out-migrationbut also a substantial inflow of new IDU due to
initiation, relapse, and in-migration. Although mod-erate and stable, these prevalence rates are substan-tial enough to fuel an epidemic in a communitywhere risk behaviours remain high. Both behaviouralrisk and HIV incidence rates among a network ofeight needle exchange programs in the province ofQuebec and in Ottawa were recently reported ashigh. Almost half the respondents in a recent study(1,041 out of 2,458) reported having injected withborrowed needles in the previous six months (Parentet al., 1997). A recent report of IDU and HIVinfection in Ottawa suggests that a fresh IDU epi-demic may be starting in that city (Leonard et al.,1997; Remis, Millson and Major, 1997).
1.6 The Epidemic in theHeterosexual Population
While there is limited data on HIV incidence andHIV prevalence in the heterosexual population over
0
1000
2000
3000
4000
5000
1978 1979 1980 1981 1982 1983 1984 1985 1986 1987 1988 1989 1990 1991 1992 1993 1994 1995 1996
HIV incidence
AIDS incidence
AIDS deaths
Chart II-2
HIV Incidence, AIDS Incidence and AIDS Deaths in Canada
Thousands
Source: Plausible estimate of HIV incidence modelled by Dr. Robert Remis and Gregory Williams. AIDS incidence and mortality data fromLCDC.
11
HIV Epidemiology: A Dynamic Epidemic

time, the number of Canadians living with HIVinfection in 1996 who contracted the virus throughheterosexual contact is estimated to be 7,300. Theestimated number of new infections among hetero-sexuals in 1996 was 5008 (Archibald et al., 1997).
AIDS data would indicate that heterosexuals rep-resent an increasing proportion of the epidemic(Chart II-3). These AIDS cases would representinfections that took place 5 to 10 years ago. Withinthe heterosexual population, HIV incidence amongwomen is increasing (Chart II-1). The majority ofheterosexual AIDS cases are the result of eitherexposure through sexual contact with a high-riskindividual or originate in an HIV endemic country.They are concentrated in British Columbia, Ontario,and Quebec.9
1.7 HIV Infection amongCanadian Aboriginal People
In the past 500 years, indigenous populationsworldwide have been vulnerable to emerging infec-tious disease and HIV is not an exception (Rowell,
1996). Canadian Aboriginal people experience highrates of socio-economic and behavioural risks forHIV, infection, including poverty, incarceration, in-jection drug use, sexually transmitted diseases(STDs) and commercial sex (Houston and Reese,1996).
STD rates among Canadian Aboriginals are threetimes higher than the national average (McKenna,1993). High rates of STD incidence have facilitatedthe rapid dissemination of HIV in the heterosexualpopulation in developing countries.10 In both Canadaand Australia, experts have warned that the highSTD rate among indigenous people, compoundedwith the other problems characteristic of social andeconomic marginalization, including poverty, druguse, etc., is a recipe for a disastrous epidemic amongAboriginals with the same characteristics noted indeveloping countries (Wortman, 1990; Heath et al.,1993).
The number of Aboriginal AIDS cases has in-creased steadily from 1984 to 1995 (Chart II-4).Again, these AIDS cases do not indicate what the
Chart II-3
Number of AIDS Cases Diagnosed by Year, Adjusted for Reporting Delays and Underreporting,Heterosexual Transmission
19821983
19841885
19861987
19881989
19901991
19921993
19941995
0
50
100
150
200
Note: Cumulative number of AIDS diagnosed: 920 (approximately).Source: Bureau of HIV/AIDS and STD, Laboratory Centre for Disease Control, Health Canada.
Num
ber
of A
IDS
case
s pe
r ye
ar
The Economic Burden of HIV/AIDS in Canada
12

current rates of infection are but rather what theywere 5 to 10 years ago. These reported cases proba-bly underrepresent the size of the epidemic amongAboriginals as approximately one-third of the AIDScases do not have ethnicity information (Nyguen et al.,1996). Compared to non-Aboriginals, AboriginalAIDS cases are more likely to be young (less than30) and injection drug users: in 1991, 38 percent ofthe 4,000 users of Vancouver’s needle exchangeprogram were Aboriginal(Rekart et al., 1991).
1.8 HIV Infection among Canadian Youth
The HIV epidemic has a disproportionate impacton young Canadians. The estimated median age at
the time of infection between 1985 and 1990 was 23years of age (LCDC, 1996a). For those infectedprior to 1983 the estimated median age of infection is32. Among young Canadians, socially and economi-cally marginalized youth are at greatest risk, includ-ing young gay men, street-involved youth and Abo-riginals.
Young women are biologically at higher risk forinfection because male to female HIV transmission,particularly in the absence of other STDs, is esti-mated to be several times more efficient than femaleto male. Young women alienated from their homesare found to be more likely to gravitate toward peergroups with antisocial behaviours, engage in
Chart II-4
Reported Aboriginal AIDS Cases in Canada (n = 187) by Year andTrend Adjusted for Reporting Delay1
1 Data to March 31, 1996.Source: Laboratory Centre for Disease Control, Health Canada.
Reported cases
Trend adjusted for reporting delay
Ann
uall
inci
denc
e
Year of diagnosis
Cases
1984 1985 1986 1988 1989 1990 1991 1992 1993 1994 1995 1987
13
HIV Epidemiology: A Dynamic Epidemic

spontaneous sexual encounters, use alcohol ordrugs during sex, use condoms inconsistently, andperceive themselves to be at low risk for contractingSTDs (Connop et al., 1997). For these women, peergroup expectations take precedence over protectingtheir own health.
Street-involved youth “are characterized by per-sonal histories of neglect, abuse, homelessness, lim-ited employment skills, and increased vulnerabilityto numerous health related risks, including AIDS”(Postiano and Vardy, 1996). The prevalence ratesfor HIV infection for street-involved youth are 700times higher than the general population (Postianoand Vardy, 1996). In the 1980s this population wasidentified as high-risk due to high rates of unpro-tected intercourse and needle sharing (Radford et al.,1989). Of 712 street-involved youth surveyed in1994 the majority were sexually active, 22 percentreported one previous STD. High-risk behavioursfor transmission of STDs, including HIV, werereported by 47 percent of males and 41 percent offemales (Macdonald et al., 1994). Youth in theprocess of dropping out of school and drifting to-ward the street have been found to be very sexuallyactive but not sufficiently educated to protect them-selves from STD transmission (Wells et al., 1992).
While young people often go through periods of riskybehaviour, they face greater risk in the presence of HIVand greater social and economic isolation than pre-vious generations. The disappearance of high-wagelow-skill jobs, the high rates of unemployment andlow wages for those who do work, combined withthe high costs of housing in urban areas and cut-backs in social services and transfers all conspire topush young people to the streets and into despair.
2 Methodology
2.1 Estimating the Plausible Limits ofHIV Prevalence and Incidence in 1996:The Base Case
At the beginning of this chapter, some of thechallenges in getting accurate reports on the inci-dence and prevalence of HIV infection are de-scribed. To overcome these challenges, CPRN
collaborated with the Laboratory Centre for DiseaseControl to adapt a new methodology to estimate thenumber of new infections in 1996 (HIV incidence)and the number of Canadians currently living withHIV infection (HIV prevalence). (An outline of themethods used to estimate national HIV prevalenceand incidence at the end of 1996 is included inAppendix II-A).
Four different methods are used to estimate preva-lence and incidence in various risk groups in majorurban areas using data from a wide variety ofsources. These estimates are then extrapolated to therest of Canada based on regional ratios in AIDScase reports and HIV positive test reports. Thesecomponents are then summed to construct a nationalestimate. The method for the Canadian analysiswas adapted from Scott Holmberg’s (1996) studyfor the United States. The process is iterative in thatit draws on the expertise and commentary fromCanadian HIV epidemiologists, researchers andpublic health officials, to interpret the data andweigh the contributing estimates of risk group popu-lation size, incidence and prevalence, in terms oftheir reliability, validity, and potential biases.
3 Findings
Tables II-1 and II-2 present the base case for HIVinfection in Canada in 1996. Table II-1 contains theestimated prevalence by risk group. Prevalencerefers to the number of Canadians currently esti-mated to be living with HIV infection. Table II-2presents the estimated number of incident infectionsfor 1996 or the number of estimated new infectionsin that year.
4 Discussion
These estimates are alarming. They show thatboth prevalence and incidence are increasing. Thenumber of infected persons living with HIV/AIDS inCanada reached 38,900 in 1996, up from approxi-mately 30,000 in 1989 (Schecter et al., 1992). Fromthe perspective of epidemic control, the increasedsize of the prevalent population increases the likeli-
The Economic Burden of HIV/AIDS in Canada
14

hood of further spread of the virus throughout thepopulation.
In the meantime, improved clinical managementand the relative success of new antiretroviral thera-pies have important consequences for the future ofthe epidemic. First, the new therapies should meanan improved quality of life for those living with HIVwho have access to the therapies and sufficientincome to procure adequate housing and nutrition toprovide a healthy basis from which to manage theinfection. It is not clear how helpful the therapieswill be to marginalized populations, particularlystreet-involved people and injection drug users, whohave difficulty complying with the stringent guide-lines required to make the new therapies effective.
Second, in epidemiologic terms, this shift in dis-ease management should decrease the incidence of
AIDS cases and AIDS-related mortality. The newtherapies reduce the amount of virus circulating inthe blood thereby slowing the immune deteriorationcaused by HIV.11 As long as the therapies continueto be effective, there should be a correspondingdecrease in the number of AIDS defining illnessesand AIDS deaths. The resource implications fortreating this growing population are discussed inChapter III.
The new incidence estimates are very troubling. Inthe past five years the number of new infections inCanada has increased from an estimated 2,700 ayear to approximately 4,000 a year. The proportionof prevalent infections resulting from new infectionsthat year has also increased from 9 to 11 percent inthe same period. One would expect that given thedecreasing mortality rates among the HIV infected,the opposite should be true. If we were successful in
Table II-1
Estimated HIV Prevalence or Number of Canadians Infected, by Exposure Group for 19961
Injectiondrug users
Men who havesex with men Heterosexuals Other Total
Number of infected(as percentage of total infected)
6,100
(16%)
25,100
(65%)
7,300
(19%)
300
(<1%)
38,900
(35,700-41,900)
1 LCDC (C. Archibald, P. Yan, J. Farley and S. Sutherland) in collaboration with CPRN (R. Remis, G. Williams, T. Albert, and E. Cloutier).
Table II-2
HIV Incidence or Number of New Infections, by Exposure Group for 19961
Injection drugusers
Men who havesex with men Heterosexuals Other Total
Number of new infec-tions(as percentage of total new infections)
1,950
(49%)
1,470
(37%)
500
(13%)
20
(<1%)
3,940
(2,950-4,900)
1 LCDC (C. Archibald, P. Yan, J. Farley and S. Sutherland) in collaboration with CPRN (R. Remis, G. Williams, T. Albert andE. Cloutier).
15
IV Epidemiology: A Dynamic Epidemic

stemming the “flow” of new infections, then theproportion of new to prior infections in the prevalentpopulation should be decreasing, especially as thosealready infected are living longer and AIDS-relatedmortality is decreasing.
4.1 HIV Incidence, AIDS Incidence andAIDS Deaths
Chart II-2 depicts three significant trends overtime: the annual number of HIV infections inCanada; the annual number of new AIDS cases; andthe annual number of AIDS related deaths. For thepast three years, the number of HIV infections hascontinued to increase while the annual number ofnew AIDS cases and AIDS deaths has decreased.
The HIV infection curve is based on plausibleestimates of HIV infection in an attempt to recon-struct the HIV epidemic in Canada.12 For the mostpart, the HIV curve is imputed from the AIDS curvethrough a method called back-calculation. The short-coming of the national time trend is that it tends toobscure the multiple epidemics described earlier.However, one can discern two broad trends based onthe two significant waves of the Canadian epidemic.The first significant wave of the epidemic was drivenby very high rates of infection among MSM and thesecond driven by high rates of infection among theIDU population. IDU HIV infection rates currentlyremain both high and unstable. Intensive infectionsin the IDU population did not probably begin until1985, at which point infections among MSM hadalready peaked. The HIV incidence curve is now risingagain steeply, driven by high rates of infection amonginjection drug users and, to a lesser extent, young gaymen. The IDU epidemic began earlier in Ontario andQuebec, and it is currently most volatile in BritishColumbia.
4.2 The Falling Curve 1985-88:Saturation or Effective Prevention
There is some controversy as to why HIV infectionamong MSM peaked and then fell so rapidly after
1985. There is evidence to suggest that many gaymen did modify their behaviour, which contributedto the decrease in new infections. Was the behavioursignificant enough to account for such a rapid de-crease in infection or did the susceptible populationof gay men become saturated with HIV infection?Gabrielle Rotello (1997) convincingly argues thatsaturation explains much of the rapid drop. Rotelloalso notes that rates of infection among young gaymen continue to increase as the epidemic is fed freshfuel.
Ping Yan’s work in Canada, which analyses thepatterns of infection by age cohort, indirectly sup-ports this hypothesis. Yan divided the patterns ofHIV infection among gay men by age cohort anddemonstrated that the epidemic moved into increas-ingly younger cohorts throughout the late 1980s(Yan et al., 1996). In Canada, one could argue, theepidemic moved into younger populations of gaymen and resurged at the end of the 1980s after it hadsaturated the population of older, susceptible gaymen.
It is likely that both factors, the prevention effectand saturation, contributed to the rapid drop inincidence among gay men after 1985 because bothreduced the size of the susceptible population. It is amorbid irony that successful prevention and satura-tion produce the same outcome: fewer individualssusceptible to infection. What this economic exercisemakes clear in Chapter V, however, is that saturationis a far more expensive means of reducing the size ofthe susceptible population.
Moreover, even after the virus appears to haveexhausted its possibilities in one population, it doesnot burn out. Most infectious diseases require aminimum number of susceptible individuals, orthreshold density, to become established in the pop-ulation. HIV and STDs are an exception to the rule.Persistence of HIV, and other STDs, does not appearto be dependent on population density (Boily andBrunham, 1993). HIV can therefore remain persis-tent in populations with a very low density. It ispossible, therefore, to reduce HIV to a burning
The Economic Burden of HIV/AIDS in Canada
16

ember only to have it flare up if it encounters a freshsusceptible population. Currently, the inflow of newsusceptibles, as young Canadians become sexuallyactive or start injecting drugs, is ensuring a steadysupply of fuel.
4.3 Hot Spot: The IDU Epidemicin Vancouver
The epidemic in Vancouver appears alarming,particularly in light of 2 million clean needles dis-tributed on a yearly basis. There are several reasonscited for the steep curve of the IDU epidemic inVancouver.
C When the drug of choice switched from heroine toinjection cocaine (approximately 1993-94), IDUbegan injecting three or four times a day as op-posed to once. It is conceivable that 2 millionneedles are therefore not enough. Moreover, toofew needles might encourage a rationing effect,which is counterproductive to the principle ofusing a clean needle every time one injects.
C Individuals are most infectious during seroconver-sion when the amount of virus in their blood isvery high. A high concentration of seroconvertersin a population with high-risk behaviour will pro-duce exponential rates of transmission.
C The use of a central needle exchange may havecreated social networks for needle sharing particu-larly if there was still a relative shortage of cleanneedles.
C As yet unpublished ethnographic studies indicatethat there are other dimensions to injection druguse aside from injection (e.g., the preparation ofthe drug prior to injection), that are an unacknowl-edged mode of transmission.
C Finally, although needle exchange has proved ef-fective around the world, it is not enough on itsown. For example, needle exchange should belinked to other services like counselling, STDtreatment, and drug treatment.
4.4 Ontario’s IDU Epidemic: RelativeSuccess or Emerging Problem?
Incidence and prevalence data collected to con-struct the base case estimate for 1996 would indicatethat Ontario’s IDU epidemic is currently less volatilethan either British Columbia’s or Quebec’s. At theDelphi session held in preparation for this study itwas suggested that the geographical diffusion ofdrug users in Metropolitan Toronto and across theprovince was probably contributing to the relativestability of the IDU epidemic in Ontario thus far.(Thirty-four percent of HIV+ tests between1992-96 attributed to IDU for the province of On-tario were diagnosed in Metropolitan Toronto com-pared to British Columbia, where 67 percent ofHIV+ tests attributed to IDU were diagnosed inVancouver.) As a result of the decentralization of theIDU community, needle-sharing networks are theo-retically more difficult to establish.
However, if the virus becomes established in a citylike Ottawa, with established networks of needlesharing and sexual pairing, there is a potential for arapid spread of the virus. This is especially true inthe early stages of infection when the virus is presentin greater quantities in the body and the chances ofsuccessful transmission are that much greater. In thisscenario, the rate of reproduction with the core groupheats up quickly increasing the risk to individuals atthe periphery of the group. The rate of reproduction,or R0, is the rate at which one person infects others.13
The time for aggressive intervention targeted at thecore group is in this early phase of an epidemic.14
Recent behavioural studies among IDU in severalcities, including Ottawa, reinforce the reason for alarm:the behavioural patterns to transmit the virus are inabundance (Parent et al., 1997) and rates of infectionappear to be climbing (Remis, Millson and Major,1997).
In summary, the prognosis at this juncture in theepidemic is not good.
C HIV prevalence is at an all time high. There aremore people than ever living with HIV infection inCanada.
C HIV incidence is substantially higher than it wasfive years ago and continues to rise.
17
IV Epidemiology: A Dynamic Epidemic

C Behavioural research indicates that the two be-haviours that most contribute to the spread ofHIV, unprotected sexual intercourse and the shar-ing of injection drug use equipment, are stillwidespread, particularly among marginalizedgroups.
C The trend toward social and economic marginal-ization continues to provide fertile ground for thevirus to spread. Increasingly, those communitiesmost at risk appear to be those most poorlyequipped to resist the epidemic.
4.5 Epidemiology for HIV Prevention
Epidemiology is the study of the distribution anddeterminants of disease in human populations. In thecontext of infectious disease, epidemiology plays acritical role in prevention, control, and treatment: itis the basic science that supports the public healthmandate of promoting and protecting the health ofthe population. The applications of epidemiologythat support HIV prevention include:
1. Surveillance: providing systematic and reliablereporting of the patterns of the epidemic’s evolu-tion.
2. Research: obtaining more detailed informationthat helps to characterize in more depth preva-lence and incidence of HIV/AIDS.
3. Interpretation: integrating data from surveillanceand research to explain the HIV epidemic’s oc-currence and evolution.
4. Evaluation: measuring the effectiveness of ourefforts to control the epidemic once it has begun.
These activities form the basis of epidemic pre-vention and control, and generate vital informationto guide prevention efforts. The HIV epidemiologydatabase in Canada is substantial but less thancomprehensive. It is unfortunately least informativeon the subject that is most urgent: where is the
leading edge of the epidemic now? If HIV in Canadais composed of multiple epidemics moving throughdifferent communities, then it is vital to know whereeach susceptible community is in the epidemic cyclein order to target prevention programs.
Gaps in the HIV epidemiology knowledge base arethe source of the real challenges to surveillancepresented by HIV. There are ways to fill the gaps, asdemonstrated by the successful collaboration of ex-perts from across the country in the preparation ofthe base case model for 1996, under the leadershipof Dr. Chris Archibald. By pooling data and re-search expertise from a de facto network of sentinelsurveillance sites, they were able to build a compos-ite picture of the state of the epidemic. Formalizingthis network and expediting the ongoing ex-change of important information by exploitingdevelopments in communications and informationtechnology, like the Internet, would make a substan-tial contribution to improving HIV surveillance inCanada. To be effective such a network cannot be adhoc. Epidemiology requires standardization. Datamust be systemically collected and analysed.
There is also considerable room in Canada, as inthe rest of the world, to develop innovative method-ologies to address the challenges presented by HIVto both surveillance and evaluation. For example,improving understanding of STD rates as potentialproxy markers for HIV incidence and/or HIV riskbehaviour would provide a useful outcome markerfor both surveillance and evaluation purposes.Epidemiology can also make a substantial contribu-tion to understanding how to combat infectiousdisease if it is linked to analysis of the social andeconomic factors that facilitate the spread of thesediseases.
Effective information systems are the cornerstoneof the policy response to the HIV epidemic. Theunique characteristics of the hidden epidemic can beaddressed through strategic use of the four coreapplications of epidemiology described above.
Coordination is imperative. Community-basedfront-line prevention efforts require epidemiologicanalysis to guide and evaluate interventions and
The Economic Burden of HIV/AIDS in Canada
18

programmes. The front lines can also providecritical data about the state of Canada’s multipleepidemics: STD clinics; HIV prevention programmes;Aboriginal health clinics, both on and off reserve;needle-exchange programs; homeless shelters, etc.are all important nodes for monitoring the evolutionof the epidemic and providing policymakers with theinformation they need to plan a rational policy re-sponse and allocate resources efficiently and equi-tably. Linking epidemiology to prevention meansenhancing Canada’s capacity for active epidemiolog-ical HIV surveillance at the front lines of the epi-demic and formalizing the two-way linkages betweenthe front lines, epidemiological laboratories at the
regional, provincial and national levels, and policy deci-sion makers. The challenge is to collect, analyse, andexpedite the timely flow of quality information tosupport a coordinated HIV prevention response thatis as dynamic as the epidemic itself. The opportunityis to prevent the spread of an infection that remainsone hundred percent preventable but for which thereis no cure. Canada’s goal should be to “break theback” of this epidemic.
To begin the estimation procedure, the countrywas divided into regions based on data availability,with the smallest regions being the major cities inCanada. Within each region, separate estimates weredeveloped for four risk categories: injection drugusers, men who have sex with men, heterosexuals,and “other.” These regional/risk group estimateswere then combined to produce the national esti-mate as of December 31, 1996.
Data sources used in the estimation procedure areas follows: AIDS case and death reports, provincialHIV serodiagnostic databases, provincial drug treat-ment programs, targeted epidemiological studies,unlinked anonymous antenatal seroprevalence sur-veys, population-based surveys of risk behaviourand HIV testing history, and expert opinion. Up tofour different methods were used to estimate eachparameter, depending on data availability. Althougheach method on its own was at times weak andresulted in a relatively uncertain estimate, the degreeof certainty was improved by calculating differentestimates and combining them in a type of
“triangulation” procedure. The four methods usedwere as follows:
1. The direct method or components model, whichwas the preferred method if data were available.In this method, the size of the population at risk ismultiplied by the prevalence (or incidence) rate togive the estimated prevalent (or incident) numberof infections at a point in time (1996 in thiscase). Population size was estimated from expertopinion, behavioural survey data, census data,and HIV testing data. Prevalence and incidencerates were obtained from specific epidemiologicstudies. This method (combined with point 3,below) was used by Holmberg (1996) to estimatecurrent incidence and prevalence in the UnitedStates.
2. The indirect method starts with the number ofindividuals in a particular region/risk group whoare known to be HIV infected (data obtained fromserodiagnostic databases). If the proportion thatthese individuals represent of all HIV-infected
Appendix II
A Outline of Methods Used to Estimate National HIV Prevalence andIncidence to the End of 1996
19
IV Epidemiology: A Dynamic Epidemic

persons is known, then the number of prevalentinfections can be calculated. The proportion ofknown infections was estimated from surveys ofHIV testing history in population-based and intargeted epidemiologic studies.
3. The third method, the ratio method, has two parts.First, the overall ratio of prevalent HIV infectionsto cumulative reported AIDS cases was calcu-lated and used as one estimate of prevalence.Second, this method was to estimate prevalenceand incidence in regions with limited data byextrapolating from neighbouring regions withmore extensive data. Extrapolation for preva-lence was based on the corresponding regionalratio among cumulative HIV-positive tests; ex-trapolation for incidence was based on the ratioamong recent HIV-positive tests (1995-96).
4. The final method was a type of modelling thatinvolved developing a spreadsheet of annual andcumulative HIV and AIDS data. Input data wereAIDS cases and deaths, cumulative positive sero-diagnostic tests, and previous estimates of cumu-lative incidence and prevalence. A sensitivityanalysis of estimated annual incidence was usedto examine the output of annual prevalence, andthis served as an internal consistency check withthe input data.
Thus, for each prevalence and incidence parame-ter, several estimates were generated with the likelypoint estimate being taken as the mean of the esti-mates. The advantages of this methodology are thatit makes maximum use of a wide variety of surveil-lance and research data, it can readily incorporatenew data, and it serves to highlight gaps in existingknowledge.
B Epidemiology Delphi Workshop Participants
Dr. Catherine Hankins (Chair)McGill UniversityMontreal General HospitalMontreal
Mr. Terry AlbertCPRNOttawa
Dr. Chris ArchibaldLaboratory Centre for Disease ControlHealth CanadaOttawa
Dr. Marie-Claude BoilyLaval UniversityQuébec
Ms. Janet DunbrackHealth CanadaOttawa
Dr. John FarleyLaboratory Centre for Disease ControlHealth CanadaOttawa
Dr. Robert RemisUniversity of TorontoToronto
Dr. Martin SchecterBC Centre for Excellence in HIV/AIDSVancouver
Mr. Gregory WilliamsCPRNOttawa
Dr. Ping YanLaboratory Centre for Disease ControlHealth CanadaOttawa
The Economic Burden of HIV/AIDS in Canada
20

HIV Epidemiology: A Dynamic Epidemic
1 Vancouver Injection Drug User Study (VIDUS).Longitudinal cohort of high-risk IDU with analarmingly high rate of HIV incidence(approximately 20 percent annually).
2 A longitudinal cohort of HIV-negative gay men inMontreal.
3 See LCDC (1996b), HIV in Canada: SurveillanceReport for the Period 1985-1995.
4 HIV vaccine research has been disappointing thusfar. However, even the development of a low effi-cacy vaccine could have a public health benefit. Alow efficacy vaccine could, if added to other inter-ventions, reduce the rate of transmission in coregroups where HIV infection is concentrated(Garnett and Anderson, 1996).
5 An analysis of recent seroconversions in theVANGUARD study released at CAHR in May 1997suggests an urgent need to intervene aggressively tostop the spread of HIV infection among young gaymen. Incidence in this study was 2.8 percent annu-ally, twice as high as expected (Strathdee et al.,1997).
6 Defined as “any type of sexual activity that you wereforced or coerced into.”
7 Estimate from back-calculation by Dr. Ping Yan,LCDC.
8 The incidence figures used for this estimate werederived not from seroconversion rates but ratherfrom serodiagnostic data, which may capture a por-tion of HIV diagnosis but not current rates of infec-tion. The estimate of 500 heterosexual infections for1996 is therefore likely conservative.
9 LCDC (1997), AIDS in Canada, Quarterly Report,April 1997.
10 The presence of ulcerative STDs increases the effi-ciency of HIV transmission by providing a point ofentry for the virus into the bloodstream. In addition,high rates of STDs among core groups are thoughtto reduce immunity thereby making people in thecore more susceptible to HIV infection once they areexposed. This complex of health problems related topoverty, substance abuse, inadequate medical care,exposure to other diseases such as tuberculosis andother STD infections is sometimes referred to as the“synergism of plagues” (Rotello, 1997).
11 Theoretically, reducing the amount of virus in thebody could also reduce the infectivity of the infectedindividual undergoing treatment and thereby alsoreduce the chances of infecting someone else.
12 Plausible estimates of HIV infection modelled byDr. Robert Remis and Gregory Williams.
13 The basic reproductive rate, or R0, is the averagenumber of secondary infections when an infectedindividual is introduced into the population.
R0 = B x K x d.
B is equal to the transmission risk per contact. K isthe average number of contacts a person has in aperiod of infectivity and d is the duration of infectiv-ity. If R0 is greater than 1, then the epidemic willgrow until it runs out, or saturates, the susceptiblepopulation. If R0 is equal to 1 then the epidemic willremain persistent, or endemic, and if R0 is less than1 then the epidemic will decay. The goal of aggres-sive targeted prevention at core groups is get thereproductive rate down.
14 Core groups are defined as those with high rates ofactivity that can transmit the virus, needle shar-ing or unprotected intercourse, high levels of HIVprevalence and incidence, and established links ofnetworking within the group. Core groups can sus-tain the infection within the overall population.
Notes
21

Archibald, Chris et al. (1997), “Estimating CurrentPrev-alence and Incidence of HIV in Canada,” Bureau ofHIV/AIDS and STD, Laboratory Centre for Disease Con-trol, Health Protection Branch, Health Canada in col-laboration with Canadian Policy Research Networks,Plenary Presentation at CAHR Conference, 1997.
Blower, S. M. et al. (1990), “Loglinear Models, SexualBehavior and HIV: Epidemiological Implications ofHeterosexual Transmission,” Journal of Acquired Im-mune Deficiency Syndromes 3(8).
Boily, M. C. and R. C. Brunham (1993), “The Impact ofHIV and Other STDs on Human Populations: ArePredictions Possible,” Infectious Disease Clinics ofNorth America 7(4) (December):771-91.
Canadian AIDS Society (1995), “Income Security Project,”unpublished data.
Connop, H. et al. (1997), “Young Women at Risk,” CAHRConference, abstract no. 129.
Echenberg, Havi (1997), “Personal Transfers: Analysisof CAS Income Security Data and Policy Implications,”background paper prepared for CPRN.
Evans, R. G. et al. (1994), “Producing Health, Consum-ing Health Care,” in R. G. Evans, M. L. Barer andT. R. Marmor (eds.) Why Are Some People Healthyand Others Not?: The Determinants of Health ofPopulations, New York: Aldine deGruyter (previouslypublished in 1990 in Social Science and Medicine31(12):1347-63).
Garnett, G. P. and R. M. Anderson (1996), “The Poten-tial Impact of Low Efficacy HIV Vaccines,” Centre forthe Epidemiology of Infectious Disease, University ofOxford, Oxford, U.K., in Conf. Adv. AIDS VaccineDev., February 11-15, p. 106.
Getty, G. et al. (1997), “NB Antenatal SeroprevalenceStudy,” CAHR Conference, abstract no. 223.
Hankins, Catherine et al. (1997), “Moving from Surveil-lance to the Measurement of Programme Impact:CACTUS-Montreal Needle Exchange Programme(NEP),” CAHR Conference, abstract no. 223.
Heath, T. et al. (1993), “The Acquired ImmunodeficiencySyndrome in the Northern Territory of Australia: AnImpending Fourth World Epidemic,” Royal DarwinHospital, Annual Conference Australia’s Soc. HIVMedicine, abstract no. FE5.
Holmberg, Scott (1996) “The Estimated Prevalence andIncidence of HIV in 96 Large US MetropolitanCities,” American Journal of Public Health86(5):642-54.
Houston, S. and H. Reese (1996), “HIV Infectionamong First Nations People in Northern Alberta,”University of Alberta Hospitals, Edmonton, Interna-tional Conference on AIDS, abstract no. Mo.C.1420.
Laboratory Centre for Disease Control (LCDC) (1997a),AIDS in Canada: Quarterly Surveillance Update,Division of HIV/AIDS Surveillance, Bureau of HIV/AIDS and STD, Health Protection Branch, Ottawa:Health Canada (May).
CCC (1997b), Inventory of HIV Incidence andPrevalence Studies in Canada, Division of HIV/AIDSSurveillance, Bureau of HIV/AIDS and STD, HealthProtection Branch, Ottawa: Health Canada.
CCC (1996a), Epi Update, Bureau of HIV/AIDS andSTD, Health Protection Branch, Ottawa: HealthCanada (December).
CCC (1996b), HIV in Canada: Surveillance Report forthe Period 1985-1995, Division of HIV/AIDSSurveillance, Bureau of HIV/AIDS and STD, HealthProtection Branch, Ottawa: Health Canada.
Leonard, L. (1997), “Differences in HIV-related RiskBehaviors and Behavioral Change Intention amongIDU Attending Ottawa-Carleton Needle Exchange,”Report to Public Health Branch, Ontario Ministry ofHealth.
Leonard, Lynne et al. (1997), “Are IDU an HomogenousRisk Group for HIV Infection: Implications for Tailor-ing Interventions,” CAHR Conference, abstract no. 223.
Macdonald, N. E. et al. (1994), “Canadian Street Youth:Correlates of Sexual Risk-taking Activity,” PediatricInfectious Disease Journal 13(8):690-7.
References
The Economic Burden of HIV/AIDS in Canada
22

Mann, Jonathan (1996), “AIDS and the Future of PublicHealth,” International Conference on AIDS, abstractno. Th.D.350.
Martindale, S. et al. (1997), “Evidence of PsychologicalDistress in a Cohort of Young Gay/Bisexual Men,”CAHR Conference, abstract no. 102.
McKenna, N. (1993), Disaster Waiting to Happen,World AIDS Day, as quoted in Rowell, R. M. (1996),“The Spread of HIV/AIDS....”
Nyguen, M. et al. (1996), “Aboriginal HIV/AIDS inCanada,” Bureau of HIV/AIDS and STD, LaboratoryCentre for Disease Control, Health Protection Branch,Health Canada, International Conference on AIDS,abstract no. Tu.C.2630.
Parent, R. et al. (1997), “HIV among IDU: SecondSurveillance Year of the Survidu Network,” CAHRConference, abstract no. 220.
Postiano, K. and G. Vardy (1996), “AIDS OutreachProgram Targeting Street-Involved AdolescentsThrough Peer Education,” International Conferenceon AIDS, abstract no. We.Cc.206.
Poulin, Céline et al. (1997), “Prevalence and Incidenceof HIV among Injection Drug Users (IDU) Attendinga Needle Exchange Program (NEP) in Quebec City,”CAHR Conference, abstract no. 218.
Radford, J. et al. (1989), “Adolescents at Risk for HIVInfection,” Queen’s University, Kingston, Ontario,International Conference on AIDS, abstract no. M.D.0.8.
Rekart, M. L. et al. (1991), “HIV and North AmericanAboriginal Peoples,” B.C. Centre for Disease Con-trol, International Conference on AIDS, abstractno. M.C.3237.
Remis, R. S. et al. (1997), “HIV Prevalence and Inci-dence and Reported Risk Factors among WomenUndergoing Abortion in Montreal,” CAHR Confer-ence, abstract no. 242.
Remis, Robert, Margaret Millson and Carol Major(1997), The HIV Epidemic among Injection DrugUsers in Ontario: The Situation in 1997, Departmentof Public Health Sciences, University of Toronto andHIV Laboratory, Central Public Health Laboratory,Laboratory Services Branch, Ontario Ministry ofHealth. Prepared for the AIDS Bureau, Ontario
Ministry of Health (July).
Rotello, Gabrielle (1997), Sexual Ecology: AIDS and theDestiny of Gay Men, New York: Dutton Publishing.
Rowell, R. M. (1996), “The Spread of HIV/AIDS in theWorld’s Indigenous Populations,” in JonathanM. Mann and Daniel J. M. Tarantola (eds.), AIDS inthe World 11: Global Dimensions, Social Roots, andResponses, New York: Oxford University Press.
Schecter, Martin et al. (1992), “How Many Persons inCanada Have Been Infected with Human Immunodefi-ciency Virus? An Exploration Using BackcalculationMethods,” Clinical Investigative Medicine 15(4):331-45.
Strathdee, S. A. et al. (1996), “Sexual Abuse Is anIndependent Predictor of Sexual Risk-taking amongHiv-negative Gay Men: Results from a ProspectiveStudy at Baseline,” International Conference onAIDS, abstract no. Mo.C.900.
——— (1997), “HIV Prevalence, Incidence and Risk Be-haviours among a Cohort of Young Gay/BisexualMen,” CAHR Conference, abstract no. 204.
Sutherland, D. et al. (1996) “HIV Testing Behavior ofCanadians,” Bureau of HIV/AIDS and STD, HealthCanada, International Conference on AIDS, abstractno. Mo.C.210.
Wells, G. et al. (1992), “HIV/STD Risk Behavior andKnowledge among Youth: Students, Dropouts, StreetYouth,” University of Ottawa, International Confer-ence on AIDS, abstract no. PoD 5864.
Wortman, J. A. (1990), “The AIDS Pattern amongCanadian Aboriginals,” Division of STD Control,Ministry of Health, Vancouver, B.C., InternationalConference on AIDS, abstract no. Th.C.709.
Wright, Nicola et al. (1995), “Trends of HIV PositiveTest Reports in Canada,” Division of HIV/AIDSSurveillance, Laboratory Centre for Disease Control,Health Canada, CAHR Conference, abstract no. 226.
Yan, P. et al. (1996), “Estimation of the HistoricalAge-specific HIV Incidence in Canada,” Bureau ofHIV/AIDS and STD, Laboratory Centre for DiseaseControl, Health Canada, International Conference onAIDS, abstract no. Tu.C.573.
HIV Epidemiology: A Dynamic Epidemic
23


1 Introduction
The seminal work on cost of illness (COI) or eco-nomic burden studies was completed by DorothyRice (1966) and updated a decade later (Cooper andRice, 1976). Subsequently, a body of COI literatureemerged covering several disease areas, includingHIV/AIDS (Scitovsky and Rice, 1987; Fraser andCox, 1988; Hellinger, 1993; and Harkness, 1989).
Examining the HIV epidemic through an economiclens is one of several interrelated and complementaryapproaches that will assist evidence-based policyformulation and decision making. It is important tonote at the outset that COI studies do have limita-tions. They are not economic evaluations and henceconclusions cannot be drawn concerning costs andconsequences/outcomes. COI studies quantify eco-nomic burden by measuring direct and indirect costs.However, there is a story behind the numbers that isnot captured (i.e., pain, suffering, restrictions inactivities of daily living, functional health status). Ithas been said that COI studies are much akin toOscar Wilde’s definition of a cynic – “one whoknows the price of everything, and the value ofnothing” (Thompson and Meyer, 1989). However,notwithstanding these limitations, economic burdenstudies do serve a role in making explicit the impact ofa disease on societal economic product.
Direct costs represent the value of resources usedto treat a given illness (e.g., hospitalizations, drugs)and indirect costs represent productivity losses(future income forgone due to premature mortalityand time away from regular activity due to disabil-ity). A standardized cost framework for HIV/AIDStreatment and care costs has been developed for usein Europe, which includes a schedule of cost itemsand a measurement protocol for unit costing andmarket/shadow pricing (Tolley and Gyldmark,
1993). This framework was used to guide the datacollection for this study. Indirect costs are generallycaptured through the human capital method, whichrepresents an estimate of productivity losses(expressed in monetary terms and potential years oflife lost) associated with disability and prematuredeath. For the purposes of this study, we havechosen to use estimates based on existing research inCanada specific to HIV/AIDS (Hanvelt et al., 1994;Harkness, 1989).
Tracking the direct costs associated with HIVdisease has been somewhat of a “moving target” dueto the changing natural history of the disease andtreatment patterns. Specifically, AIDS mortality isdecreasing and HIV disease has evolved from havinga resource consumption profile dominated by hospi-tal costs to a disease that is similar to a chronicillness where the venue of care is largely in primary/community care settings and where drug costs nowsurpass hospital costs.
Economic burden of disease studies usually em-ploy either a prevalence or incidence approach. Theprevalence approach involves measuring the directand indirect costs in a given time period, usually ayear. Direct costs are assigned to year of paymentand indirect costs to periods of disability or death(Thompson and Meyer, 1989). Prevalence is a stockconcept, while incidence relates to future flow(Lindgren and Silverberg, 1990). Hence the preva-lence approach is less dependent on assumptions.
Incidence costing entails estimating a stream ofpresent and future costs that relate to new cases in agiven period – i.e., the lifetime direct and indirectcosts of new cases in a given year and with all costsassigned to year of incidence (Scitovsky, 1982). Ofthe two, the prevalence costing approach is morecommonly used. Incidence costs are generally more
III The Direct and Indirect Costs
25

difficult to estimate given the need to know thenatural history of the disease and duration of theepisode (Rice, Hodgson and Hopstein, 1985). How-ever, advocates of the incidence approach suggestthat, since infectious diseases are preventable, costsshould be “preassigned, if anywhere, to the year ofincidence” – i.e., year of infection (Thompson andMeyer, 1989).
The incidence approach often requires a “crystalball” and realistic assumptions concerning the likelycourse of the disease. The characterization of the newand emerging HIV/AIDS episode contained in thisreport is also based on several assumptions gener-ated through a clinical key informant consultationprocess, which is described later in this chapter.
For the purposes of this study on the economicburden of HIV/AIDS in Canada, we have chosen toemploy a form of the incidence approach throughestimating the lifetime costs of the prevalent HIVpopulation in 1996. Otherwise, for those currentlyinfected with HIV, we estimate the direct and indi-rect costs incurred to date and the future direct andindirect costs (discounted to present value) that willbe incurred for the 1996 prevalent population (i.e.,the predominantly irreducible costs). In Chapter V ofthis report, streams of future costs are estimated forvarious incidence scenarios beginning in 1997 (i.e.,the preventable costs).
It is worth noting that estimates of prevalencecosts are possible since we have built the HIV/AIDSepisode by stage of illness, months in stage (i.e.,transit times) and average monthly costs by stage.This enables the assignment of annual costs “to theyears in which they are borne or directly associated”(Hartunian, Smart and Thompson, 1980).
The perspective for this study is societal. Theviewpoint for COI studies has a bearing on theschedule of costs to be included. For example, froma societal perspective, transfer payments such asCPP disability and social assistance are not consid-ered costs since they are a reallocation of resourcesand the net effect of the transfer to society is zero
(Rice et al., 1990; Thompson and Meyer, 1989).Others argue that personal transfers should be in-cluded as a cost since, if illness did not occur, thentransfer payments could be used for other purposes –e.g., reducing the deficit (Knapp and Beecham,1990). The compromise is to present the costs sepa-rately (Cassidy and Klymasz, 1995). Although weestimate the average episodic value of personaltransfers, we have chosen to present these figuresseparately from our estimates of overall economicburden. It should be noted that if this study wereconducted from a government perspective, thentransfer payments would be considered a cost.
2 Methodology
2.1 Indirect Costs
For the purposes of this study, we rely on theepisodic indirect costs estimates from a Canadianstudy (Hanvelt et al., 1994). There are two widelyknown approaches to estimating indirect costs –human capital and willingness to pay methods. Thehuman capital method is used to estimate the produc-tion losses attributable to premature mortality in thestudy referred to above. This method uses “an outputaccounting approach because an employed person isseen as producing a stream of output over the yearsthat is valued at the individual’s earnings” (Rice,Hodgson and Hopstein, 1985). The willingness topay approach takes human behaviour into accountby estimating the amount of money that people arewilling to pay in order to reduce the probability ofdeath. For example, “patients with moderately activerheumatoid arthritis have stated a willingness to pay22 percent of their household income for a hypotheti-cal cure” (Thompson and Meyer, 1989).
Some view the two approaches as being comple-mentary (not alternatives). It has also been suggestedthat the human capital method “may at least be alower bound to a person’s willingness to pay for adecreased risk of death” (Rice, Hodgson and Hop-stein, 1985). Noted limitations of the human capitalmethod include the failure to recognize pain, suffer-
The Economic Burden of HIV/AIDS in Canada
26

ing, and the value of retirement and pre-work yearsof life (e.g., adolescence). It also “sets a minimalvalue on the worth of the housespouse since themarket value of labour in the home is low” and itdoes not “adequately reflect the aspects of our livesthat our society values” (Thompson and Meyer,1989).
Specifically, Hanvelt et al. (1994) identify thenumber of premature deaths due to HIV/AIDS andthen apply “an estimated economic value of thefuture earnings produced for each of the potentialyears of life lost. Computed cost estimates take intoaccount varying life expectancies and labour forceparticipation rates for different age groups, shiftingpatterns of earnings at successive ages, and thediscounting of potential future earnings into theirpresent value.”
The average loss in human capital stock wasfound to be US$558,000 per HIV/AIDS case and,on a relative basis, HIV/AIDS ranked first in com-parison to other causes of death (motor vehicleaccidents – $547,300; suicide – $516,800; cerebrovas-cular disease – $223,000; and diabetes – $218,700).It is also noted that the effect of using a 5 percentdiscount rate as opposed to 3 percent would resultin a 20 percent reduction in the estimated humancapital loss (Hanvelt et al., 1994). The high indirectcosts associated with HIV/AIDS reflect the youthof those affected by the epidemic (i.e., the futureincome lost generated by the potential years of lifelost).
In the interest of deriving conservative and orders-of-magnitude estimates, we assume a 5 percent dis-count rate for the Hanvelt et al. estimate and con-vert this estimate to Canadian dollars. Based onthis, we estimate the episodic (per case) indirectcost to be $600,000.
2.2 Direct Costs
A key challenge for this study is identifying thechange in treatment patterns and cost of a typical
HIV/AIDS episode that is emerging as a result ofthe introduction of high activity antiretroviraltherapies (HAART) during 1996. These new drugregimens, also known as triple combination thera-pies (e.g., AZT, 3TC plus a protease inhibitor),have resulted in stabilized/rebounding CD-4 counts(a measure of immune system damage), reductionsin viral load (level of virus in the blood), reducedmortality and increases in the time spent in givenstages of illness. There is also anecdotal evidence ofimprovement in quality of life that accompanieschanges in these biological markers.1
The pre-HAART episode is used as our referencepoint in building and estimating the HAARTepisode. The pre-HAART HIV/AIDS episode oc-curs over a decade2 or more, involving severaldifferent types of care delivered through multiplevenues (e.g., hospitals, outpatient clinics, physicianoffices, AIDS service organizations [ASO], alterna-tive health care sites, home care, hospices, etc).Hence building an episodic resource consumptionprofile is a complex task and very often requirespatching and grafting data from several differentsources (i.e., hospital inpatient and outpatient data,physician billing data, home care data, drug data,out-of-pocket costs, etc.).
2.2.1 Episodic Cost Estimates
For the purposes of this study, an episode repre-sents the period in HIV disease from diagnosis todeath. In order to build the pre-HAART (i.e., base-line) and the HAART episodes, the required keyvariables include the average number of monthsspent in each of four CD-4 ranges3 (>500; 499 -200; 199 - 75; <75) and the average monthly costs
in each of the four CD-4 ranges. The SouthernAlberta Clinic (SAC) database4 was used to gener-ate most of this information. International literaturewas also reviewed. Summing across the averagecosts per stage yields the direct costs for one HIVepisode. The new transit times (i.e., time spent ineach stage of illness) for HAART were derivedfrom a one-day key informant consultation with
The Direct and Indirect Costs
27

HIV clinicians and other care experts.2.2.2 Distribution of Disease in the Population
Applying the episodic costs to the prevalentpopulation yields the total costs for caring forthose people living with HIV/AIDS in Canada.However, an intermediate step is required – it is firstnecessary to distribute the prevalent population overthe four CD-4 ranges and thereby assign the popula-tion to a stage of illness. This stratification of theinfected population is based on four regionaldatabases in Canada (i.e., Quebec, Ontario, BritishColumbia and the SAC in Alberta). While Albertamay not represent an epicentre per se, distributionsfrom the SAC are also included because of theimportance in terms of the fit with other centres andthe use of SAC cost data. As well, there is evidenceof an increasing and changing epidemic in Alberta.5
The mean of these distributions is used as a proxyfor the disease staging of the prevalent HIV popula-tion in Canada.
Given the relatively long transit times within eachCD-4 range, it is necessary to further stagger anddisaggregate these populations into more refinedstages of illness (i.e., assign by months already spentin the CD-4 range). This is accomplished by assign-ing one-third of each CD-4 range population to aspecific time in the range, thus creating 12 popula-tion cohorts (i.e., 4 stages x 3 cohorts per stage). Themore refined staging reduces the error associatedwith assigning cohorts to the beginning of each CD-4range and serves the objective of producing orders-of-magnitude cost estimates.
2.2.3 Total Direct Costs for thePrevalent Population
Both pre-HAART and HAART average monthlycosts are multiplied by the respective pre-HAARTand HAART transit times (i.e., number of months ineach stage) and the number of people in each of 12cohorts (a to l) to estimate: 1) pre-HAART costs forthe prevalent population (i.e., the irreducible costs oramount already expended); and 2) the expected
stream of future costs for the HAART portion of theepisode (commencing in January 1997) for theprevalent population.2.2.4 Summary of Methodology
Step 1: Determine Pre-HAART and HAART Episo-dic Costs
C Sum of stage totals = pre-HAART episodic costs.
C This formula is replicated using average monthlycosts and transit times specific to HAART in orderto calculate the total direct cost of the new episode(i.e., the HAART episodic costs).
Step 2: Assign the Prevalent HIV Population to aStage of Illness
C Based on the average of the distributions of HIV-infected populations from four regional databases,distribute the Canadian HIV-infected populationacross four CD-4 ranges (>500; 499 - 200; 199 -75; <75).
C Break down these four distributions further intothree cohorts within each of the four stages byassigning the cohorts to three different start pointswithin each stage (i.e., differing amounts of timealready spent in the stage).
Step 3: Calculate the Total Direct Costs for thePrevalent HIV Population in Canada
C Assign pre-HAART average monthly costs to thepre-HAART portion of the episode for eachcohort to determine the costs already incurred forthe prevalent population.
C Assign HAART average monthly costs to theHAART portion of the episode for each cohort todetermine the expected future stream of costs asso-ciated with caring for the prevalent population.
The Economic Burden of HIV/AIDS in Canada
28

3 Findings
Our findings fall into three interrelated categories– episodic costs; disease staging of the prevalentpopulation; and total direct and indirect costs for theprevalent population.
3.1 Episodic Costs
Three episodic cost estimates are derived for thepre-HAART, HAART 1 and HAART 2 episodes.Each episode varies according to the transit timeswithin each of the four CD-4 ranges. The pre-HAART and HAART episodes also differ in termsof average monthly costs in each CD-4 range.
3.1.1 Pre-HAART Episodic Costs
It is estimated that the pre-HAART episode occursover 130 months or roughly 11 years from diagnosisto death (Table III-1). A lymphadenopathy study in
British Columbia designed to measure the time fromseroconversion or infection (as opposed to diagno-sis) to death estimates this time to be between 11 and13 years.6 Given the time delay between seroconver-sion (time of infection) and diagnosis, the length ofthe pre-HAART episode based on the SAC dataappears reasonable as a baseline for developing theHAART episode and component transit times.
The international body of literature in this areaalso adds a degree of validation to this length ofepisode estimate (Table III-2). In particular, a studyon stage duration found good agreement betweenstudies in relation to the two middle CD-4 ranges.However, they note a lack of agreement in the transittimes for the >500 CD-4 range and attribute this tothe variable times between seroconversion and diag-nosis. For our study, they do point towards a fairlygood estimate of stage duration for the middle tworanges (Hurley et al., 1996). The end-stage diseaseduration times are difficult to compare due to theunstandardized classification of CD-4 ranges.
Table III-2
Transit Times by CD-4 Range, Multiple Studies
>500 499 - 200 <200a
(Months)
Longini et al. (1991)Hellinger (1993)Lange (1992)Mean of studies
49.067.054.056.6
46.044.062.050.6
19.012.0
–16.5
a Excludes time spent with AIDS diagnosis in nonterminal and terminal phases. For broad comparison purposes, we have assumed that this rangeextends down to between CD-4 = 75 to 50.
Source: Hurley et al., 1996.
Table III-1
Pre-HAART CD-4 Range Transit Time Estimates
>500 499 - 200 199 - 75 <75 Total
Months in stage 34 55 23 18 130
Source: SAC – Dr. John Gill and Mr. Bill Davidson.
29
The Direct and Indirect Costs

In order to calculate the pre-HAART episodiccost, average monthly costs by CD-4 range areestimated and multiplied by the corresponding CD-4range transit times. SAC data are used as the pri-mary source for this information. Out-of-pocketcosts and baseline health care costs are taken fromother sources and used to adjust the SAC data.
Out-of-pocket costs over the pre-HAART episodeamount to approximately $15,000 or, in presentvalue terms, approximately $12,000 (discounted at 4percent) (Table III-3).7 Out-of-pocket costs are animportant and integral item in the cost schedule whenthe societal perspective is employed in cost of illnessstudies (Tolley and Gyldmark, 1993). While at firstglance out-of-pocket costs may appear insignificantrelative to overall direct episodic costs, they areindeed nontrivial in terms of economic burden forinfected individuals who are increasingly comingfrom marginalized populations.
Some analysts have suggested that baseline healthcare costs should be deducted from estimates ofdirect costs (Hurley et al., 1996). Baseline healthcare costs represent the regular or non-HIV/AIDShealth care costs. Since SAC cost data are HIV/AIDS specific, there is no need to subtract thesecosts from the pre-HAART or HAART averagemonthly costs by stage of illness.8
Using SAC data as a foundation, monthly out-of-pocket costs are added to develop the pre-HAART
episodic cost estimates presented in Table III-4.For the purposes of discussion within the context ofthis study, we have chosen the discounted pre-HAART episodic cost figure of $67,355. Hence thetotal direct and indirect pre-HAART episodic costsamount to roughly $667,000 in present value terms.
3.1.2 HAART 1 and HAART 2 Episodic Costs
A key feature of this study is the estimate of newCD-4 range transit times based on new treatmentprotocols associated with HAART. The net effect ishigher average monthly costs (due primarily to thenew drug – viral load testing package) and extendedtransit times.
The new extended CD-4 transit time estimateswere developed through a key informant/Delphi con-sultation. (See Appendix III-A for a list of theparticipants.) These participants used several param-eters and preliminary clinical experience with thenew therapies in order to derive three transit timeestimates for each CD-4 range (pessimistic, likelyand optimistic). For purposes of this study, thepessimistic and likely estimates are used to derivedirect cost estimates (Table III-5). However, theHAART 2 (likely) episode is used to calculate theeconomic burden estimates presented later in thischapter. The HAART 1 episode is estimated to takeplace over approximately 13 years, while the likelyHAART 2 episode is estimated to occur over a17-year period.
Table III-3
Undiscounted Pre-HAART Out-of-pocket Costs
>500 499 - 200 199 - 75 <75 Total
(Dollars)
Episodic 3,446.26 5,856.95 2,900.07 2,683.80 14,887.08
Monthly1 101.36 106.49 126.09 149.10
1 From Williams (1996), “Canadian AIDS Society Income Security Study.”
The Economic Burden of HIV/AIDS in Canada
30

Estimates of the average monthly HAART costsby CD-4 range are primarily based on cost dataprovided by SAC (Table III-6). The increase inaverage monthly costs is attributable to the additionof a third antiretroviral drug and the viral loadtesting that is an integral part of HAART.
As shown in Table III-7, the out-of-pocket costscomponent is estimated to be $23,000 for HAART
or roughly $1,400 per year over the course of thenew episode.
Table III-8 displays the HAART 1 andHAART 2 episodic costs according to various dis-count rates. Again, for the purposes of this studywe have chosen the episodic cost figures associatedwith the 4 percent discount rate where theHAART 1 is estimated to be roughly $123,000 and
Table III-5
Pre-HAART, HAART 1 and HAART 2 CD-4 Range Transit Time Estimatesa
>500 499 - 200 199 - 75 <75 Total
(Months in stage)
Pre-HAARTb
HAART 1c
HAART 2c
344658
555769
233143
181830
130152200
Note: HAART 1 = pessimistic estimate; HAART 2 = likely estimate.a At the time of the clinical delphi session, pre-HAART stage duration times for the 499 - 200 and 199 - 75 stages based on SAC data were
estimated to be 45 and 19 months, respectively. Later, due to a change in methodology, these times changed to 55 and 23 months, respectively.b Data from Southern Alberta Clinic.c Consensus estimates from key informant meeting.
Table III-4
Pre-HAART Episodic Direct Costs1
CD-4 RangeAverage monthly costs
(dollars) Average number of months in stageTotal stage costs
(dollars)
>500499 - 200199 - 75<75Total
334.31 531.07 843.831,551.53
–
34 55 23 18130
11,36729,20919,40827,928
–
Total Pre-HAART Episodic Cost:Undiscounted= 87,911
Discounted 3 percent = 4 percent = 5 percent = 6 percent =
71,82267,35563,26359,510
1 Includes SAC clinic care, other physicians, drugs, outpatient lab and diagnostic imaging tests, hospitalizations and home care.
31
The Direct and Indirect Costs

HAART 2, $153,000.
As can be seen, the choice of discount rate canhave a significant effect on the estimated stream offuture costs. A recent Australian study employs a5 percent discount rate (Hurley et al., 1996). How-ever, given that current interest rates and inflationhave remained stable and low, a strong argument fora 4 percent discount rate can be made.
The HAART 2 (i.e., likely) episode has been cho-sen for the projections presented in this report.Hence, the total estimated direct and indirectepisodic costs for HAART amount to $753,000. The
remaining analysis in this report will be based onthis estimate.
3.2 Disease Staging of the PrevalentHIV-infected Population in Canada
The distribution of disease within the prevalentHIV-infected population in Canada is spread acrossthe four stages of illness used for this study. Assign-ing the prevalent population (n = 38,900) to a stageof illness is a prerequisite to calculating the overalleconomic burden associated with the pre-HAART
The Economic Burden of HIV/AIDS in Canada
Table III-7
Undiscounted HAART 1 and HAART 2 Out-of-pocket Costs1
>500 499 - 200 199 - 75 <75 Total
(Dollars)
HAART 1HAART 2
Monthly2
HAART
4,662.565,878.88
101.36
6,069.937,347.81
106.49
3,908.795,421.87
126.09
2,683.804,473.00
149.10
17,325.0823,121.56
1 For purposes of this study, it was assumed that pre-HAART and HAART average monthly out-of-pocket expenses are the same. While this maynot be the case, the CAS survey was conducted in a pre-HAART period and other data sources were not available.
2 See Williams (1996), “Canadian AIDS Society Income Security Study.”
Table III-6
Average Monthly Costs, Pre-HAART and HAART by CD-4 Range1
>500 499 - 200 199 - 75 <75
PH HPercentchange PH H
Percentchange PH H
Percentchange PH H
Percentchange
$334 $732 120 $531 $980 85 $844 $1,270 51 $1,552 $1,874 21
Note: Pre-HAART = PH; HAART = H1 Baseline health care costs for the HAART 1 episode would amount to $18,240 and approximately $24,000 for the HAART 2 episode. At a
4 percent discount rate, HAART 1 and HAART 2 baseline health care costs amount to $14,400 and $17,600, respectively. Again, SAC data didnot include these costs and hence we did not subtract them.
Source: SAC – Dr. John Gill and Mr. Bill Davidson; and clinical Delphi session.
32

care already received (the bills paid to date) and theexpected future stream of HAART costs.
This stratification of the prevalent population bystage of disease is accomplished by using the meanof the CD-4 distributed populations from fourregional databases (Table III-9). In effect, fourcohort populations are created.
Using the mean of the CD-4 ranges from theregional populations, the prevalent HIV-infectedpopulation in Canada is assigned to four CD-4ranges (Chart III-1). This assumes that the anchor-inpoint for this analysis and commencement of theHAART episode is January 1, 1997.
Given the relatively long transit times (especiallyin the first two stages), it is necessary to further
divide these four cohorts into more refined positionswithin each CD-4 range (i.e., assignment based onthe number of months already spent in a given CD-4range as of January 1, 1997). This yields a total of12 cohorts categorized from a to l. Table III-10contains a “snapshot” of where in the CD-4 rangecontinuum each cohort will commence the HAARTepisode.
In order to determine the residual amount ofHAART time remaining for each cohort, the pre-HAART time already spent in the commencementrange is subtracted from the estimated HAARTtransit time for the range. For example, as ofJanuary 1, 1997 cohort f had already spent 36 monthsof pre-HAART time in the 499 - 200 CD-4 range.
Table III-8
Discounted HAART Direct Episodic Costs, Per Case
Discount rate HAART 1 HAART 2
(Percent) (Dollars)
3456
131,342122,799115,033107,962
166,820152,875140,525129,560
Table III-9
Percentage Distribution of Populations by CD-4 Range
>500 499 - 200 199 - 75 <75
Ontario1
Quebec2
British Columbia3
Southern Alberta4
Mean
10.517.0 9.225.715.6
36.741.046.336.040.0
21.517.321.018.019.5
31.324.723.520.224.9
1 From the HIV Ontario Observational Database – Dr. Margaret Millson.2 Estimates based on Markov Model developed by Dr. Robert Remis, University of Toronto.3 From the BC Centre for Excellence in HIV/AIDS (Dr. Aslim Anis) – based on population in the Drug Database and most likely underrepresents
distribution in the >500 CD-4 range.4 From the Southern Alberta Clinic (Dr. John Gill).
33
The Direct and Indirect Costs

The estimated new transit time for HAART forthis stage of illness is 69 months. Cohort f willtherefore spend 33 months (69 minus 36) of HAARTtime in this CD-4 range.
The disease staging of the prevalent populationand the time spent in the pre-HAART and HAARTepisodes are presented in Table III-11.
3.3 Total Costs Associated with thePrevalent Population
The total costs associated with the prevalentHIV-infected population fall into two categories:pre-HAART costs already incurred and the ex-pected future stream of costs associated withHAART.
Table III-10
Assignment of 38,900 Prevalent Cases to 12 Cohorts, by CD-4 Range andHAART Commencement Position in Range
>500 499 - 200 199 - 75 <75
(Months in range and cases)
a) 1 (n = 2,022.8)b) 15 (n = 2,022.8)c) 30 (n = 2,022.8)
d) 1 (n = 5,186.7)e) 18 (n = 5,186.7)f) 36 (n = 5,186.7)
g) 1 (n = 2,528.5)h) 8 (n = 2,528.5)i) 16 (n = 2,528.5)
j) 1 (n = 3,228.7)k) 8 (n = 3,228.7)l) 16 (n = 3,228.7)
Interpretation: As of January 1, 1997, cohort f – 5,186.7 prevalent HIV cases have completed month 36 in the 499 - 200 CD-4 range in thepre-HAART episode and now commence the HAART episode within that range. Cohort a, on the other hand, has no pre-HAART episodic time and will commence the HAART episode in month 1 in the first CD-4 range. Otherwise, cohort a repre-sents the full HAART episode (refer to Appendix III-C for more detail).
<75 199 - 75
499 - 200
>500
Chart III-1
Distribution of Estimated Prevalent Cases by CD-4 Range
Based on mean CD-4 distributions and prevalence = 38,900
(6,068.4)(6,068.4)(6,068.4)
(15,560.0)
(7,585.5)(7,585.5)(7,585.5)(9,686.1)
The Economic Burden of HIV/AIDS in Canada
34

Tab
le I
II-1
1
Dis
ease
Sta
ging
of
the
Pre
vale
nt H
IV/A
IDS
Pop
ulat
ion
in C
anad
a
Tim
e sp
ent (
mon
ths)
by
12 c
ohor
ts in
eac
h C
D-4
ran
ge f
or p
re-H
AA
RT
and
HA
AR
T
Pr
e-H
AA
RT
(PH
)H
AA
RT
(H
)
PH to
tal
>50
049
9 -
200
199
- 75
<75
Coh
ort
>50
049
9 -
200
199
- 75
<75
H to
tal
0 15 30 34 52 70 89 97 105
112
120
128
Tot
al
0 15 30 34 34 34 34 34 34 34 34 34
0 0 0 0 18 36 55 55 55 55 55 55
0 0 0 0 0 0 0 8 16 23 23 23
0 0 0 0 0 0 0 0 0 0 8 16
a (n
= 2
,022
.8)
b (n
= 2
,022
.8)
c (n
= 2
,022
.8)
d (n
= 5
,186
.7)
e (n
= 5
,186
.7)
f (n
= 5
,186
.7)
g (n
= 2
,528
.5)
h (n
= 2
,528
.5)
i (n
= 2
,528
.5)
j (
n =
3,2
28.7
)
k (n
= 3
,228
.7)
l (n
= 3
,228
.7)
3
8,90
0
58 43 28 0 0 0 0 0 0 0 0 0
69 69 69 69 51 33 0 0 0 0 0 0
43 43 43 43 43 43 43 35 27 0 0 0
30 30 30 30 30 30 30 30 30 30 22 14
200
185
170
142
124
106
73
65
57
30
22
14
35
The Direct and Indirect Costs

Using both the pre-HAART and HAART transittimes and monthly cost estimates, and with theprevalent population stratified by stage of illness, theaggregate pre-HAART and HAART direct costs arecalculated for each of the 12 cohorts and thensummed to yield the overall economic burden.
The total economic burden related to the futurestream of HAART costs for all cohorts (i.e.,aggregate HAART costs for all cohorts) are pre-sented in Table III-12 according to the raw cost andthe discounted (present value) cost according todifferent discount rates. Hence the future directcosts (discounted at 4 percent) relating to the currentprevalent HIV-infected population in Canada isestimated to be almost $4 billion (refer to Ap-pendix III-C for detail).
In order to derive an overall estimate of futureeconomic burden, the discounted indirect cost esti-mated to be $600,000 per case must be calculatedfor the prevalent HIV population in order to takeaccount of the overall losses to society. Based on aprevalence of 38,900, the discounted future indirectcosts are estimated to amount to $23.3 billion.
Based on these aggregate direct and indirect costs,the future economic burden associated with the cur-rent prevalent HIV population in Canada is esti-mated to be $27.3 billion.
This does not include the costs already incurred forthe current prevalent population (i.e., the moneyalready expended on the pre-HAART portion of each
episode in the prevalent population). Based on pre-HAART average monthly costs and transit times,pre-HAART direct costs already incurred are esti-mated to be almost $1.4 billion (refer to Table III-13for detail).
When the pre-HAART (sunk) costs are added tothe HAART (future) costs, the overall economicburden for the prevalent HIV-infected population inCanada totals $28.7 billion or almost $1,000 perCanadian (refer to Table III-14).
3.4 Summary of Economic Burden
The main focus of the analysis in this chapter ison the prevalent HIV-infected population inCanada (i.e., those living with HIV/AIDS). In termsof assessing the overall economic impact of theHIV/AIDS epidemic to date in Canada, adding to theprevalent costs the human capital losses (indirectcosts) associated with the approximately 11,000AIDS deaths ($6.6 billion), plus the direct costs($970 million) associated with caring for theseindividuals until their death, provides a sense of themagnitude of the societal losses.
The total economic burden associated with theHIV/AIDS epidemic to date amounts to some $36billion or about $1,200 per Canadian (Table III-14).The costs associated with the expected new infec-tions for subsequent years (i.e., avoidable or re-ducible costs) will add to this total.
The Economic Burden of HIV/AIDS in Canada
Table III-12
Raw and Discounted Aggregate Future HAART Costs for the Prevalent Population
($ millions)
Raw cost (undiscounted) 4,940
Discount rate3 percent4 percent5 percent6 percent
4,1753,9633,7693,591
36

Table III-14
Total Economic Burden of HIV/AIDS Epidemic to Date
Prevalent population
AIDS deathsa Pre-HAART HAART Total
($ billions)
Direct costs 0.97b 1.4 4.0 6.4
Indirect costs 6.60 23.3 29.9
Total 7.60 28.7 36.3
a Based on 11,000 deaths to date in Canada.b Pre-HAART episodic costs x 11,000.
Table III-13
Total Pre-HAART Costs for the Prevalent Population
Total($ millions) >500 499 - 200 199 - 75 <75 Cohort
0 0 0 0 0 a (n = 2,022.8)
10.1 10.1 0 0 0 b (n = 2,022.8)
20.2 20.2 0 0 0 c (n = 2,022.8)
58.9 58.9 0 0 0 d (n = 5,186.7)
108.5 58.8 49.6 0 0 e (n = 5,186.7)
158.1 58.9 99.2 0 0 f (n = 5,186.7)
102.5 28.7 73.8 0 0 g (n = 2,528.5)
119.6 28.7 73.8 17.1 0 h (n = 2,528.5)
136.6 28.7 73.8 34.1 0 i (n = 2,528.5)
193.7 36.7 94.3 62.7 0 j (n = 3,228.7)
233.8 36.7 94.3 62.7 40.1 k (n = 3,228.7)
273.9 36.7 94.3 62.7 80.2 l (n = 3,228.7)
1,416 Total: 38,900
37
The Direct and Indirect Costs

4 Discussion
The costs presented here are not intended to beapplied on an individual basis. Rather they are usefulin planning for populations and for the purposes ofestimating economic burden. In addition, it should beunderstood that the average monthly costs used inthis study are based on a population that exhibitsvarying resource consumption profiles. Averagemonthly costs could rise if the uptake on the newdrug therapies increases (e.g., more people in the>500 CD-4 range deciding to take drug treatmentearlier and others moving from double combinationtherapies to triple).9
4.1 Annual Direct Cost Projections
Deriving annualized direct cost estimates associ-ated with the prevalent HIV population in Canadaover five years would require a complex and intricatedynamic modelling exercise driven by two interre-lated and primary factors.
First, there is a stock and flow situation involvingan interplay between incidence rates and mortalityrates. Otherwise, each year new (incident) cases areadded to the prevalent population and deaths aresubtracted. Several evidence-based assumptionswould be required in order to forecast these ratesover a five-year planning horizon.10
Second, the HIV-infected population is movingprogressively through the four stages of HIVdisease with stage durations and average monthlycosts changing from stage to stage and varying bysubpopulation (risk group). Disease staging of theprevalent population over a five-year modelling/planning period would be required. This componentof the exercise would also be fed by the stock andflow analysis above.
Finally, it should also be understood that simplyestimating HIV/AIDS incidence and prevalence isnot a straightforward exercise. As described inChapter I, the epidemic is largely hidden and thereare variable lag times between date of infection and
date of diagnosis. The modelling exercise describedabove is entirely dependent on a refined epidemiolog-ical analysis where incidence and prevalence areestimated by subpopulation (risk group) and majorregion across the country.
4.2 Annual Direct Cost Estimate for the1997 Prevalent Population
Based on the data used in this paper, it is possibleto estimate the direct costs for the prevalent pop-ulation for 1997. Estimating beyond this one yearwould require dynamic modelling.
The average monthly costs reflecting the new ther-apies and the new disease stage durations enables thecalculation of one year of HAART costs for theprevalent population.
The prevalent HIV-infected population was as-signed to a stage of disease for the 1997 calendaryear. Since during this one-year period none of thecohorts change stages of illness and HIV incidenceand mortality are reflected in the prevalence esti-mates, it is possible to estimate the direct costs forthe prevalent population for one year.
Based on a national prevalence of 38,900 for1996, the annual direct costs for this population areestimated to be approximately $570 million.
4.3 Applying Costs to Populationsvs. Individuals
The present value of the direct costs of the newHIV/AIDS episode is estimated to be $153,000spread over a 17-year episode. Although the averageannual costs change from year to year based on stageof illness, overall the average annual direct costsamount to $9,000 or $750 per month. This should beexamined on a population basis only.
It is critical to understand the limitations ofapplying this average figure. First, it cannot beapplied on an individual basis. The cost figures are
The Economic Burden of HIV/AIDS in Canada
38

derived from a population perspective and frompopulation databases. Within an HIV-infectedpopulation, a percentage of individuals would not bereceiving the new drug therapies for various reasons,some relating to personal choice and others relatingto clinical decision making and access to care.
It would be possible, however, to construct costprofiles for only those receiving HAART treatment.The databases from the Southern Alberta Clinic andthe BC Centre for Excellence in HIV/AIDS could beused for this purpose. Again, some limitations wouldapply. For example, a person moving from doublecombination therapy would most likely responddifferently to triple combination therapy and havedifferent downstream costs than someone who isnewly infected and starting triple combination ther-apy.
In terms of indirect costs (productivity losses),applying the average episodic figure of $600,000 toindividuals would be invalid. It is an average figurerepresenting the productivity losses across a spec-trum of income earners. While on the one hand itwould appear that this amount overestimates theindirect costs of an HIV-infected and marginalizedinjection drug user, on the other it could be arguedthat it underestimates the indirect costs of an HIV-infected software engineer. Given the shift of theepidemic to more marginalized populations, it maybe useful to revisit the current estimate. However,one would question the usefulness of discovering thatHIV-infected injection drug users generate lowerindirect costs – does this imply that less should bedone? It is obviously important to view the humancapital losses or indirect costs as the absolute mini-mum value of a human life or the potential minimumvalue of the forgone human potential due to prema-ture death.
4.4 Comparisons with Other Studies
The direct cost estimates presented are difficult tocompare with estimates from other studies due toseveral factors. First, in terms of HAART estimates,we did not find any other estimates in the literature.
In terms of pre-HAART estimates, comparisons arecomplicated because many studies do not presentdiscounted cost estimates, different currencies areused and access to health care and utilization variesconsiderably between countries.
Hurley et al. (1996) highlight the differences be-tween their pre-HAART episodic direct cost estimateof US$87,800 and the US$119,000 estimate ofHellinger (1993). The difference is not due to higherepisodic costs in the Hellinger estimate for theUnited States. Rather, the Hurley et al. estimate isdiscounted (at 5 percent) and Hellinger’s is not.When discounted, Hellinger’s episodic cost estimateis $74,900 (Hurley et al., 1996). Using the samediscount, our study yields an estimate of aboutC$63,300 for pre-HAART episodic costs.
It is difficult to ascertain the factors influencingthe difference between the Canadian and Australianestimates. Our study methodology compares wellwith the Australian study. However, it may be due tothe fact that the Australian figure is based on atheoretical episode commencing at seroconversion,while our study is based on an episode commencingat diagnosis. Still, it is difficult to determine theoverall impact this has on the difference between ourestimates. Other Canadian studies have producedconflicting estimates of pre-HAART episodic costsranging from $100,000 (Grover et al., 1992) to$82,000 (Fraser and Cox, 1988). However, thetreatment patterns during these study periods arequite different.
The recently released report on The EconomicBurden of Illness in Canada, 1993 (Health Canada,1997) provides estimates of the direct and indirectcosts of specific illness categories. HIV/AIDS isnested within the infectious and parasitic diseasecategory and not as a line item. Hence it is difficultto draw any comparisons to our estimates. However,one key and critical difference is that the HealthCanada estimates are annual aggregate costs foreach disease class and are not costs per episode. Assuch, cardiovascular diseases, musculoskeletal dis-eases, injuries and cancer rank as the top fourdisease categories in terms of overall economic bur-
39
The Direct and Indirect Costs

den. However, many of these diseases and conditionshave high front-end costs and limited time episodes.For example, many injuries are treated and resolvedwithin a short period of time and the episode ends.As well, a heart attack has an expensive front-endthat usually involves an inpatient stay with or with-out a surgical intervention. While upon discharge theepisode does not end since heart disease is considereda chronic illness, the costs over the entire episode ofcare are likely to be minimal in comparison to theepisodic costs for treating HIV/AIDS, where costsincreasingly escalate towards end-stage disease.
While it is clear that annual economic burden ofillness figures cannot be compared to episodicfigures, it should also be understood that the rankingof disease burden using annual costs can be mislead-ing due to length of episode and distribution of costsover the episode. Using the Health Canada annualcost estimates might lead one to conclude that, interms of prevention of disease, the top four diseaseclasses should have priority in resource allocationdecisions. Since HIV/AIDS is buried in the infec-tious and parasitic disease category, which does notrank in the top 10 diseases for either direct orindirect disease burden, it theoretically could receivea lower priority for prevention and other resources.
Annual economic burden of disease estimates areuseful for short-term-planning budgeting purposes.However, they are of limited use when comparingacross disease categories due to differences in thenatural history of the diseases/conditions and thecost and treatment patterns. Episodic costing, how-ever, is more costly and time consuming on the onehand, but provides more useful information to guidepublic policy.
Finally, the limitations of comparing infectiousdiseases to other less preventable diseases should befully understood. In fact, it is somewhat spurious.For example, while we have knowledge of how toreduce the risk of getting cancer, we cannot yetprevent many cancers. HIV/AIDS is theoretically100 percent preventable and hence so too are thecosts that go with an infected case. Investment in
prevention has a potentially large pay back (refer toChapter V). These differences are often forgotten orneglected when comparisons across disease entitiesare made.
4.5 The New Episode
It is expected that HAART will extend the lengthof the episode by approximately 6 years (+54 per-cent). Average monthly direct costs in each of thefour stages of illness have risen by 120, 85, 51 and21 percent, respectively. When the extended transittimes are factored in with the higher average monthlydirect costs, the HAART increases overall episodicdirect costs by 127 percent. In the pre-HAARTepisode, drug costs represent about 44 percent ofaverage monthly costs and approximately 77 percentover the HAART episode.
While the episode is expected to last longer andbecome more expensive, it should be understood thatthere are offsetting costs. For example, if the newdrug regimens increase productivity by reducingdisability, then the indirect costs associated withHIV disease will be reduced. If HAART treatmentincreases the period of productive life for thosepeople living with HIV/AIDS by 15 percent, thesavings in indirect costs will cover the increasedcosts of treatment.11 More important, however, is thefact that an economic value has not been placed onnor quantified for any improvements in quality of lifefrom the perspective of a person living with HIV/AIDS.
4.6 Transfer Payments
Although personal transfers such as social assis-tance, Canada Pension Plan Disability andemployer-based long-term disability are not con-sidered costs in cost-of-illness studies, we have cho-sen to present the average value of personal transfersfor a percentage of the HIV cases in a population inorder to identify a key policy issue.
The Economic Burden of HIV/AIDS in Canada
40

The data for this exercise are taken from theCanadian AIDS Society survey conducted as part ofthe Income Security Study (Williams, 1996). Thesedata reflect pre-HAART treatment patterns and pop-ulations. It is important to note that the survey wasconducted in 1993 and reflected an infected popula-tion with more resources than the more marginalizedHIV-infected population of today.
This shift has implications for social assistanceand welfare plans. The liability for income replace-ment is shifting away from CPP disability andemployer-based long-term disability to provincialand municipal welfare programs. The average valueof all types of personal transfers on an episodic basisis estimated to be $26,871.39, based on the oldepisode, and is likely to increase due to the increasedduration of the new episode. The only offset to thismay be the increases in productive living that may beachievable through the new drug therapies. But,there are other factors related to marginalizationthat are barriers to productive living (e.g., sub-stance abuse). Many of the newly infected people arenot receiving social assistance because they are in-fected. Rather, they were receiving personal trans-fers prior to becoming infected. Becoming HIV in-fected will most likely result in a continued relianceon some form of personal transfer, most likely wel-fare. Hence understanding the determinants ofmarginalzation will provide an important contextfor addressing the unique aspects of HIV/AIDS.
Equity in access to care and the distribution ofbenefit are ethical issues that must not be lost in thenational response to this epidemic. Marginalizedpopulations tend to be diagnosed later in the HIVinfection process, they are less compliant with the
new drug therapies and exhibit poorer outcomes.Hence there is limited benefit from the new therapiesfor this population. Compliance is an importantconsideration for clinicians when deciding to initiatetherapy. Poor compliance has two serious conse-quences: failure of the drug therapies and the devel-opment of drug resistant viruses. The latter can havefar-reaching consequences for the control of theepidemic.
These issues have a strong relationship to thepopulation health policy issues that are discussed inthe final chapter of this report. HIV infection can beconsidered a complicating factor of marginalizationalong with addiction, homelessness, unemployment,etc.
4.7 Conclusion
The magnitude of the economic impact of theHIV/AIDS epidemic is significant and, indeed, theHIV/AIDS epidemic is still largely in front of us, notbehind us. New challenges have arisen and more lieahead. Prevention is the only response available untilsuch time as a cure or vaccine is developed. Theeffectiveness of the prevention response is crucialto reducing the socio-economic and human impactsof the epidemic. The next chapter of this reportquantifies and examines Canada’s investment in HIVprevention over the course of the epidemic. Follow-ing this, Chapter V outlines plausible targets forreducing the economic burden and the pain andsuffering associated with the HIV/AIDS epidemic inCanada.
41
The Direct and Indirect Costs

Dr. Mark Wainberg (Chair)Canadian Association for HIV ResearchMontreal
Mr. Terry AlbertCPRNOttawa
Dr. Brian ConwayPhysician, BC Centre for Excellence in HIV/AIDSVancouver
Dr. John GoodhewPhysicianToronto
Dr. Colin KovacsPhysicianToronto
Mr. Craig McLureCommunity AIDS Treatment Information ExchangeToronto
Dr. Anne PhillipsPhysician, Wellesley HospitalToronto
Dr. Gary RubinPhysicianToronto
Dr. Chris TsoukasPhysician, Montreal General HospitalMontreal
Mr. Gregory WilliamsCPRNOttawa
Appendix III
A Clinical Delphi Workshop Participants
I Average Monthly Cost Calculations
Mean monthly health care costs were calculatedusing a methodology that implicitly recognizes thatthe CD-4 count of a person with HIV infection willchange over time. This process can be summarizedas follows:
1. Mean costs – by cost item, by disease stage andby month – were calculated for every patient whovisited SAC at least once during the period April1, 1995 to March 31, 1996. This end point waschosen for collecting cost information because3TC became widely accessible in April 1996 to
all persons living with HIV/AIDS in Alberta, as aresult of a decision by the Government of Albertato provide funding for these antiretroviral drugs.Hence pre-HAART = pre-3TC for the one-yearperiod referred to above.
2. Monthly costs were determined by multiplyingservice (or product in the case of pharma-ceuticals) usage by unit service costs (plus anappropriate overhead allocation) for each monthin the study period. Monthly costs were allocatedto a disease stage based on the patient’s mostrecent CD-4 count as of the end of the month inquestion.
B Southern Alberta Clinic Database Description
The Economic Burden of HIV/AIDS in Canada
42

3. All active SAC patients were allocated to one offour disease stages according to the patient’s mostrecent CD-4 count as of the end of the month inquestion, service usage during the month notwith-standing.
4. Mean costs were then calculated for each costcategory by dividing total monthly costs per dis-ease stage by the number of patients in eachdisease stage that month, matching disease stagesand months. The iterative process inherent incalculating mean costs on a monthly basis is thekey to recognizing and dealing with changingCD-4 counts over time. Each series of monthlymean costs was then summed and averaged toarrive at mean monthly costs per person for theentire period under review.
5. Costs were captured in the following categories:
– Pharmaceuticals– Hospitalizations– Outpatient laboratory tests and diagnostic
imaging– Clinical care (SAC and other physicians)– Home care
II Disease Staging and Occupancy Times
1. The mean occupancy time (stage duration ortransit time) in stage I was obtained by calculat-ing the mean time to a CD-4 count of 500 for allSAC patients who presented with a CD-4 count>500 (n = 243).
2. Mean occupancy times in stages II and III wereobtained from observations of changes in CD-4over time for all SAC patients who had at least 3recorded CD-4 counts. The methodology com-prised linear regression – where CD-4 count is thedependent variable, and time is the independentvariable. The mean rate of change was obtainedby averaging the rates of change for all SACpatients. The result is an average decline rate forall patients (n = 778) of 0.18 x 10⁶/L/day (about65 per year).
3. The mean occupancy time in stage IV was deter-mined by creating a subset of all SAC patientswith a recorded CD-4 count <75 who subse-quently died (n = 321). For this subset, the datewhen their CD-4 count would have reached 75was estimated by back-projecting from the date oftheir first CD-4 <75 at the rate of change notedabove. Stage IV occupancy time was then calcu-lated by averaging the time to death from theprojected date when the CD-4 count reached 75.
Based on the above information, stage duration esti-mates are as follows:
Stage Months in Stage
>500 34
499 - 200 55
199 - 75 23
<75 18
C Spreadsheets: HAART and Pre-HAART Episodic Costs
(See pages 44 to 47.)
43
The Direct and Indirect Costs

HIV
/AID
S E
piso
dic
Cos
ts -
HA
AR
T1,
HA
AR
T2
and
Pre
-HA
AR
T (
HA
AR
T c
omm
ence
s Ja
nuar
y 1,
199
7)
Eff
ecti
ve A
nnua
l Dis
coun
t R
ate
= 3.
00%
Eff
ecti
ve M
onth
ly D
isco
unt
Rat
e =
0.25
%
Mon
thly
Cos
t -
CD
-4>5
00$7
32
Mon
thly
Cos
t -
499>
CD
-4>2
00$9
80
Mon
thly
Cos
t -
199>
CD
-4>7
5$1
,270
Mon
thly
Cos
t -
75>C
D-4
$1,8
74
HA
AR
T 1
: 1
52 M
onth
s
CD
-4 >
500
499
> C
D-4
> 2
0019
9 >
CD
-4 >
75
75 >
CD
-4
Coh
ort
Cas
esM
onth
s$/
Mon
thP
V(1
997)
Mon
ths
$/M
onth
Raw
Cos
tP
V(1
997)
Mon
ths
$/M
onth
PV
(199
7)M
onth
s$/
Mon
thR
aw C
ost
PV
(199
7)R
aw C
ost
(Cas
e)R
aw C
ost
(Coh
ort)
PV
(199
7) (
Coh
ort)
a20
2346
$732
$3
3,65
1 $3
1,77
5 57
$980
$5
5,88
6 $4
6,49
7 31
$1,2
70
$39,
379
$29,
381
18$1
,874
$3
3,72
9 $2
3,68
8 $1
62,6
46
$131
,342
$3
29,0
00,0
05
$265
,678
,953
b20
2331
$732
$2
2,67
8 $2
1,80
7 57
$980
$5
5,88
6 $4
8,24
8 31
$1,2
70
$39,
379
$30,
487
18$1
,874
$3
3,72
9 $2
4,58
0 $1
51,6
73
$125
,121
$3
06,8
03,6
18
$253
,095
,290
c20
2316
$732
$1
1,70
5 $1
1,46
3 57
$980
$5
5,88
6 $5
0,06
4 31
$1,2
70
$39,
379
$31,
635
18$1
,874
$3
3,72
9 $2
5,50
5 $1
40,7
00
$118
,666
$2
84,6
07,2
32
$240
,037
,983
d51
870
00
057
$980
$5
5,88
6 $5
2,07
6 31
$1,2
70
$39,
379
$32,
906
18$1
,874
$3
3,72
9 $2
6,53
0 $1
28,9
95
$111
,513
$6
69,0
58,3
67
$578
,383
,277
e51
870
00
039
$980
$3
8,23
8 $3
6,41
4 31
$1,2
70
$39,
379
$34,
398
18$1
,874
$3
3,72
9 $2
7,73
3 $1
11,3
47
$98,
545
$577
,522
,033
$5
11,1
24,0
52
f51
870
00
021
$980
$2
0,59
0 $2
0,04
1 31
$1,2
70
$39,
379
$35,
958
18$1
,874
$3
3,72
9 $2
8,99
0 $9
3,69
8 $8
4,99
0 $4
85,9
85,6
99
$440
,815
,573
g25
290
00
00
00
031
$1,2
70
$39,
379
$37,
867
18$1
,874
$3
3,72
9 $3
0,52
9 $7
3,10
9 $6
8,39
6 $1
84,8
55,5
50
$172
,939
,672
h25
290
00
00
00
023
$1,2
70
$29,
217
$28,
370
18$1
,874
$3
3,72
9 $3
1,13
7 $6
2,94
6 $5
9,50
7 $1
59,1
59,9
22
$150
,462
,869
i25
290
00
00
00
015
$1,2
70
$19,
055
$18,
684
18$1
,874
$3
3,72
9 $3
1,75
7 $5
2,78
4 $5
0,44
0 $1
33,4
64,2
93
$127
,538
,748
j32
290
00
00
00
00
00
018
$1,8
74
$33,
729
$32,
952
$33,
729
$32,
952
$108
,902
,372
$1
06,3
92,2
52
k32
290
00
00
00
00
00
010
$1,8
74
$18,
739
$18,
487
$18,
739
$18,
487
$60,
501,
318
$59,
688,
680
l32
290
00
00
00
00
00
02
$1,8
74
$3,7
48
$3,7
34
$3,7
48
$3,7
34
$12,
100,
264
$12,
055,
647
HA
AR
T 2
: 2
00 M
onth
s
CD
-4 >
500
499
> C
D-4
> 2
0019
9 >
CD
-4 >
75
75 >
CD
-4
Coh
ort
Cas
esM
onth
s$/
Mon
thP
V(1
997)
Mon
ths
$/M
onth
Raw
Cos
tP
V(1
997)
Mon
ths
$/M
onth
PV
(199
7)M
onth
s$/
Mon
thR
aw C
ost
PV
(199
7)R
aw C
ost(
Cas
e)R
aw C
ost(
Coh
ort)
PV
(199
7)(C
ohor
t)
a20
2358
$732
$4
2,42
9 $3
9,48
9 69
$980
$6
7,65
2 $5
3,86
6 43
$1,2
70
$54,
623
$37,
860
30$1
,874
$5
6,21
6 $3
5,60
5 $2
20,9
20
$166
,820
$4
46,8
76,4
91
$337
,444
,157
b20
2343
$732
$3
1,45
6 $2
9,81
1 69
$980
$6
7,65
2 $5
5,89
3 43
$1,2
70
$54,
623
$39,
285
30$1
,874
$5
6,21
6 $3
6,94
5 $2
09,9
47
$161
,935
$4
24,6
80,1
04
$327
,561
,706
c20
2328
$732
$2
0,48
3 $1
9,76
8 69
$980
$6
7,65
2 $5
7,99
7 43
$1,2
70
$54,
623
$40,
764
30$1
,874
$5
6,21
6 $3
8,33
6 $1
98,9
74
$156
,865
$4
02,4
83,7
17
$317
,307
,284
d51
870
00
069
$980
$6
7,65
2 $6
2,13
8 43
$1,2
70
$54,
623
$43,
675
30$1
,874
$5
6,21
6 $4
1,07
3 $1
78,4
90
$146
,886
$9
25,7
76,3
65
$761
,855
,644
e51
870
00
051
$980
$5
0,00
3 $4
6,93
2 43
$1,2
70
$54,
623
$45,
655
30$1
,874
$5
6,21
6 $4
2,93
6 $1
60,8
42
$135
,522
$8
34,2
40,0
31
$702
,914
,290
f51
870
00
033
$980
$3
2,35
5 $3
1,03
7 43
$1,2
70
$54,
623
$47,
724
30$1
,874
$5
6,21
6 $4
4,88
2 $1
43,1
94
$123
,643
$7
42,7
03,6
97
$641
,300
,782
g25
290
00
00
00
043
$1,2
70
$54,
623
$51,
766
30$1
,874
$5
6,21
6 $4
8,68
3 $1
10,8
39
$100
,449
$2
80,2
55,6
53
$253
,984
,245
h25
290
00
00
00
035
$1,2
70
$44,
461
$42,
545
30$1
,874
$5
6,21
6 $4
9,65
2 $1
00,6
76
$92,
197
$254
,560
,025
$2
33,1
20,3
35
i25
290
00
00
00
027
$1,2
70
$34,
298
$33,
142
30$1
,874
$5
6,21
6 $5
0,64
0 $9
0,51
4 $8
3,78
1 $2
28,8
64,3
96
$211
,841
,207
j32
290
00
00
00
00
00
030
$1,8
74
$56,
216
$54,
122
$56,
216
$54,
122
$181
,503
,953
$1
74,7
44,4
44
k32
290
00
00
00
00
00
022
$1,8
74
$41,
225
$40,
078
$41,
225
$40,
078
$133
,102
,899
$1
29,4
01,1
71
l32
290
00
00
00
00
00
014
$1,8
74
$26,
234
$25,
755
$26,
234
$25,
755
$84,
701,
845
$83,
155,
507
Pre
-HA
AR
T :
130
Mon
ths
(Pre
-HA
AR
T d
efin
ed a
s pr
e-3T
C p
erio
d)
CD
-4 >
500
499
> C
D-4
> 2
0019
9 >
CD
-4 >
75
75 >
CD
-4
Mon
ths
$/M
onth
PV
(199
7)M
onth
s$/
Mon
thR
aw C
ost
PV
(199
7)M
onth
s$/
Mon
thP
V(1
997)
Mon
ths
$/M
onth
Raw
Cos
tP
V(1
997)
Raw
Cos
tP
V(1
997)
34$3
34
$11,
367
$10,
890
55$5
31
$29,
209
$25,
091
23$8
44
$19,
408
$15,
135
18$1
,552
$2
7,92
8 $2
0,70
6 $8
7,91
1 $7
1,82
2
Not
e:1.
The
dis
coun
t ra
te u
sed
thro
ugho
ut is
a m
onth
ly r
ate
of 0
.246
6% s
uch
that
whe
n co
mpo
unde
d to
ove
r 12
mon
ths,
pro
duce
s an
eff
ectiv
e an
nual
rat
e 3.
000%
.
2. T
he o
nly
cost
s co
nsid
ered
are
fut
ure
cost
. Sun
k co
sts
( ie
. tho
se in
curr
ed b
efor
e 19
97 )
are
rep
lace
d by
zer
o.
3. P
V(1
997)
is
the
pre
sent
val
ue a
t th
e s
tart
of
1997
of
futu
re c
osts
dis
coun
ted
mon
thly
at 0
.246
6%.
The Economic Burden of HIV/AIDS in Canada
44

HIV
/AID
S E
piso
dic
Cos
ts -
HA
AR
T1,
HA
AR
T2
and
Pre
-HA
AR
T (
HA
AR
T c
omm
ence
s Ja
nuar
y 1,
199
7)
Eff
ecti
ve A
nnua
l Dis
coun
t R
ate
= 4.
00%
Eff
ecti
ve M
onth
ly D
isco
unt
Rat
e =
0.33
%
Mon
thly
Cos
t -
CD
-4>5
00$7
32
Mon
thly
Cos
t -
499>
CD
-4>2
00$980
Mon
thly
Cos
t -
199>
CD
-4>7
5$1
,270
Mon
thly
Cos
t -
75>C
D-4
$1,8
74
HA
AR
T 1
: 1
52 M
onth
s
CD
-4 >
500
499
> C
D-4
> 2
0019
9 >
CD
-4 >
75
75 >
CD
-4
Cas
esM
onth
s$/
Mon
thR
aw C
ost
PV
(199
7)M
onth
s$/
Mon
thR
aw C
ost
PV
(199
7)M
onth
s$/
Mon
thR
aw C
ost
PV
(199
7)M
onth
s$/
Mon
thR
aw C
ost
PV
(199
7)R
aw C
ost
(Cas
e)P
V(1
997)
(C
ase)
Raw
Cos
t (C
ohor
t)P
V(1
997)
(C
ohor
t)
a20
2346
$732
$33,
651
$31,
192
57$9
80$5
5,88
6$4
3,80
031
$1,2
70$3
9,37
9$2
6,70
218
$1,8
74$3
3,72
9$2
1,10
5$1
62,6
46$1
22,7
99$3
29,0
00,0
05$2
48,3
97,5
77
b20
2331
$732
$22,
678
$21,
531
57$9
80$5
5,88
6$4
6,00
131
$1,2
70$3
9,37
9$2
8,04
318
$1,8
74$3
3,72
9$2
2,16
5$1
51,6
73$1
17,7
41$3
06,8
03,6
18$2
38,1
66,6
15
c20
2316
$732
$11,
705
$11,
385
57$9
80$5
5,88
6$4
8,31
231
$1,2
70$3
9,37
9$2
9,45
318
$1,8
74$3
3,72
9$2
3,27
9$1
40,7
00$1
12,4
29$2
84,6
07,2
32$2
27,4
21,5
72
d51
870
00
057
$980
$55,
886
$50,
906
31$1
,270
$39,
379
$31,
034
18$1
,874
$33,
729
$24,
529
$128
,995
$106
,468
$669
,058
,367
$552
,220
,042
e51
870
00
039
$980
$38,
238
$35,
843
31$1
,270
$39,
379
$32,
914
18$1
,874
$33,
729
$26,
015
$111
,347
$94,
772
$577
,522
,033
$491
,553
,880
f51
870
00
021
$980
$20,
590
$19,
866
31$1
,270
$39,
379
$34,
909
18$1
,874
$33,
729
$27,
592
$93,
698
$82,
367
$485
,985
,699
$427
,211
,588
g25
290
00
00
00
031
$1,2
70$3
9,37
9$3
7,38
918
$1,8
74$3
3,72
9$2
9,55
2$7
3,10
9$6
6,94
1$1
84,8
55,5
50$1
69,2
59,6
11
h25
290
00
00
00
023
$1,2
70$2
9,21
7$2
8,10
018
$1,8
74$3
3,72
9$3
0,33
5$6
2,94
6$5
8,43
5$1
59,1
59,9
22$1
47,7
51,6
46
i25
290
00
00
00
015
$1,2
70$1
9,05
5$1
8,56
518
$1,8
74$3
3,72
9$3
1,13
8$5
2,78
4$4
9,70
3$1
33,4
64,2
93$1
25,6
73,8
92
j32
290
00
00
00
00
00
018
$1,8
74$3
3,72
9$3
2,70
3$3
3,72
9$3
2,70
3$1
08,9
02,3
72$1
05,5
88,1
18
k32
290
00
00
00
00
00
010
$1,8
74$1
8,73
9$1
8,40
6$1
8,73
9$1
8,40
6$6
0,50
1,31
8$5
9,42
6,07
2
l32
290
00
00
00
00
00
02
$1,8
74$3
,748
$3,7
29$3
,748
$3,7
29$1
2,10
0,26
4$1
2,04
1,10
2
HA
AR
T 2
: 2
00 M
onth
s
CD
-4 >
500
499
> C
D-4
> 2
0019
9 >
CD
-4 >
75
75 >
CD
-4
Cas
esM
onth
s$/
Mon
thR
aw C
ost
PV
(199
7)M
onth
s$/
Mon
thR
aw C
ost
PV
(199
7)M
onth
s$/
Mon
thR
aw C
ost
PV
(199
7)M
onth
s$/
Mon
thR
aw C
ost
PV
(199
7)R
aw C
ost(
Cas
e)P
V(1
997)
(Cas
e)R
aw C
ost(
Coh
ort)
PV
(199
7)(C
ohor
t)
a20
2358
$732
$42,
429
$38,
587
69$9
80$6
7,65
2$5
0,02
543
$1,2
70$5
4,62
3$3
3,59
230
$1,8
74$5
6,21
6$3
0,67
1$2
20,9
20$1
52,8
75$4
46,8
76,4
91$3
09,2
35,9
45
b20
2343
$732
$31,
456
$29,
298
69$9
80$6
7,65
2$5
2,53
943
$1,2
70$5
4,62
3$3
5,28
030
$1,8
74$5
6,21
6$3
2,21
2$2
09,9
47$1
49,3
29$4
24,6
80,1
04$3
02,0
61,9
61
c20
2328
$732
$20,
483
$19,
542
69$9
80$6
7,65
2$5
5,17
943
$1,2
70$5
4,62
3$3
7,05
330
$1,8
74$5
6,21
6$3
3,83
1$1
98,9
74$1
45,6
04$4
02,4
83,7
17$2
94,5
27,5
02
d51
870
00
069
$980
$67,
652
$60,
467
43$1
,270
$54,
623
$40,
603
30$1
,874
$56,
216
$37,
073
$178
,490
$138
,143
$925
,776
,365
$716
,506
,057
e51
870
00
051
$980
$50,
003
$45,
983
43$1
,270
$54,
623
$43,
064
30$1
,874
$56,
216
$39,
319
$160
,842
$128
,366
$834
,240
,031
$665
,794
,979
f51
870
00
033
$980
$32,
355
$30,
621
43$1
,270
$54,
623
$45,
673
30$1
,874
$56,
216
$41,
702
$143
,194
$117
,996
$742
,703
,697
$612
,011
,011
g25
290
00
00
00
043
$1,2
70$5
4,62
3$5
0,87
530
$1,8
74$5
6,21
6$4
6,45
1$1
10,8
39$9
7,32
6$2
80,2
55,6
53$2
46,0
88,5
88
h25
290
00
00
00
035
$1,2
70$4
4,46
1$4
1,94
330
$1,8
74$5
6,21
6$4
7,68
2$1
00,6
76$8
9,62
5$2
54,5
60,0
25$2
26,6
15,9
74
i25
290
00
00
00
027
$1,2
70$3
4,29
8$3
2,77
530
$1,8
74$5
6,21
6$4
8,94
5$9
0,51
4$8
1,71
9$2
28,8
64,3
96$2
06,6
27,4
93
j32
290
00
00
00
00
00
030
$1,8
74$5
6,21
6$5
3,46
0$5
6,21
6$5
3,46
0$1
81,5
03,9
53$1
72,6
07,0
22
k32
290
00
00
00
00
00
022
$1,8
74$4
1,22
5$3
9,71
3$4
1,22
5$3
9,71
3$1
33,1
02,8
99$1
28,2
20,4
39
l32
290
00
00
00
00
00
014
$1,8
74$2
6,23
4$2
5,60
1$2
6,23
4$2
5,60
1$8
4,70
1,84
5$8
2,65
7,96
8
Pre
-HA
AR
T :
130
Mon
ths
(Pre
-HA
AR
T d
efin
ed a
s pr
e-3T
C p
erio
d)
CD
-4 >
500
499
> C
D-4
> 2
0019
9 >
CD
-4 >
75
75 >
CD
-4
Mon
ths
$/M
onth
Raw
Cos
tP
V(1
997)
Mon
ths
$/M
onth
Raw
Cos
tP
V(1
997)
Mon
ths
$/M
onth
Raw
Cos
tP
V(1
997)
Mon
ths
$/M
onth
Raw
Cos
tP
V(1
997)
Raw
Cos
tP
V(1
997)
34$3
34$1
1,36
7$1
0,74
055
$531
$29,
209
$23,
883
23$8
44$1
9,40
8$1
3,95
518
$1,5
52$2
7,92
8$1
8,77
7$8
7,91
1$6
7,35
5
Not
e:1.
The
dis
coun
t ra
te u
sed
thro
ugho
ut is
a m
onth
ly r
ate
of 0
.327
4% s
uch
that
whe
n co
mpo
unde
d ov
er 1
2 m
onth
s, p
rodu
ces
an e
ffec
tive
annu
al r
ate
4.00
00%
.
2. T
he o
nly
cost
s co
nsid
ered
are
fut
ure
cost
. Sun
k co
sts
( i.e
., th
ose
incu
rred
bef
ore
1997
) a
re r
epla
ced
by z
ero.
3. P
V(1
997)
is
the
pre
sent
val
ue a
t th
e s
tart
of
1997
of
futu
re c
osts
dis
coun
ted
mon
thly
at 0
.327
4%.
45
The Direct and Indirect Costs

HIV
/AID
S E
piso
dic
Cos
ts -
HA
AR
T1,
HA
AR
T2
and
Pre
-HA
AR
T (
HA
AR
T c
omm
ence
s Ja
nuar
y 1,
199
7)
Eff
ecti
ve A
nnua
l Dis
coun
t R
ate
= 5.
00%
Eff
ecti
ve M
onth
ly D
isco
unt
Rat
e =
0.41
%
Mon
thly
Cos
t -
CD
-4>5
00$7
32
Mon
thly
Cos
t -
499>
CD
-4>2
00$9
80
Mon
thly
Cos
t -
199>
CD
-4>7
5$1,
270
Mon
thly
Cos
t -
75>C
D-4
$1,8
74
HA
AR
T 1
: 1
52 M
onth
s
CD
-4 >
500
499
> C
D-4
> 2
0019
9 >
CD
-4 >
75
75 >
CD
-4
Coh
ort
Cas
esM
onth
s$/
Mon
thR
aw C
ost
PV
(199
7)M
onth
s$/
Mon
thR
aw C
ost
PV
(199
7)M
onth
s$/
Mon
thR
aw C
ost
PV
(199
7)M
onth
s$/
Mon
thR
aw C
ost
PV
(199
7)R
aw C
ost
(Cas
e)P
V(1
997)
(C
ase)
Raw
Cos
t (C
ohor
t)
a20
2346
$732
$33,
651
$30,
629
57$9
80$5
5,88
6$4
1,29
031
$1,2
70$3
9,37
9$2
4,29
018
$1,8
74$3
3,72
9$1
8,82
4$1
62,6
46$1
15,0
33$3
29,0
00,0
05
b20
2331
$732
$22,
678
$21,
263
57$9
80$5
5,88
6$4
3,88
631
$1,2
70$3
9,37
9$2
5,81
818
$1,8
74$3
3,72
9$2
0,00
8$1
51,6
73$1
10,9
75$3
06,8
03,6
18
c20
2316
$732
$11,
705
$11,
309
57$9
80$5
5,88
6$4
6,64
631
$1,2
70$3
9,37
9$2
7,44
118
$1,8
74$3
3,72
9$2
1,26
6$1
40,7
00$1
06,6
63$2
84,6
07,2
32
d51
870
00
057
$980
$55,
886
$49,
782
31$1
,270
$39,
379
$29,
286
18$1
,874
$33,
729
$22,
696
$128
,995
$101
,763
$669
,058
,367
e51
870
00
039
$980
$38,
238
$35,
289
31$1
,270
$39,
379
$31,
509
18$1
,874
$33,
729
$24,
419
$111
,347
$91,
217
$577
,522
,033
f51
870
00
021
$980
$20,
590
$19,
695
31$1
,270
$39,
379
$33,
902
18$1
,874
$33,
729
$26,
273
$93,
698
$79,
870
$485
,985
,699
g25
290
00
00
00
031
$1,2
70$3
9,37
9$3
6,92
318
$1,8
74$3
3,72
9$2
8,61
5$7
3,10
9$6
5,53
8$1
84,8
55,5
50
h25
290
00
00
00
023
$1,2
70$2
9,21
7$2
7,83
618
$1,8
74$3
3,72
9$2
9,56
1$6
2,94
6$5
7,39
7$1
59,1
59,9
22
i25
290
00
00
00
015
$1,2
70$1
9,05
5$1
8,44
818
$1,8
74$3
3,72
9$3
0,53
8$5
2,78
4$4
8,98
6$1
33,4
64,2
93
j32
290
00
00
00
00
00
018
$1,8
74$3
3,72
9$3
2,45
9$3
3,72
9$3
2,45
9$1
08,9
02,3
72
k32
290
00
00
00
00
00
010
$1,8
74$1
8,73
9$1
8,32
5$1
8,73
9$1
8,32
5$6
0,50
1,31
8
l32
290
00
00
00
00
00
02
$1,8
74$3
,748
$3,7
25$3
,748
$3,7
25$1
2,10
0,26
4
HA
AR
T 2
: 2
00 M
onth
s
CD
-4 >
500
499
> C
D-4
> 2
0019
9 >
CD
-4 >
75
75 >
CD
-4
Coh
ort
Cas
esM
onth
s$/
Mon
thR
aw C
ost
PV
(199
7)M
onth
s$/
Mon
thR
aw C
ost
PV
(199
7)M
onth
s$/
Mon
thR
aw C
ost
PV
(199
7)M
onth
s$/
Mon
thR
aw C
ost
PV
(199
7)R
aw C
ost(
Cas
e)P
V(1
997)
(Cas
e)R
aw C
ost(
Coh
ort)
a20
2358
$732
$42,
429
$37,
721
69$9
80$6
7,65
2$4
6,50
343
$1,2
70$5
4,62
3$2
9,84
230
$1,8
74$5
6,21
6$2
6,45
9$2
20,9
20$1
40,5
25$4
46,8
76,4
91
b20
2343
$732
$31,
456
$28,
801
69$9
80$6
7,65
2$4
9,42
843
$1,2
70$5
4,62
3$3
1,71
930
$1,8
74$5
6,21
6$2
8,12
3$2
09,9
47$1
38,0
71$4
24,6
80,1
04
c20
2328
$732
$20,
483
$19,
321
69$9
80$6
7,65
2$5
2,53
643
$1,2
70$5
4,62
3$3
3,71
330
$1,8
74$5
6,21
6$2
9,89
2$1
98,9
74$1
35,4
62$4
02,4
83,7
17
d51
870
00
069
$980
$67,
652
$58,
871
43$1
,270
$54,
623
$37,
778
30$1
,874
$56,
216
$33,
496
$178
,490
$130
,145
$925
,776
,365
e51
870
00
051
$980
$50,
003
$45,
068
43$1
,270
$54,
623
$40,
647
30$1
,874
$56,
216
$36,
039
$160
,842
$121
,754
$834
,240
,031
f51
870
00
033
$980
$32,
355
$30,
217
43$1
,270
$54,
623
$43,
733
30$1
,874
$56,
216
$38,
776
$143
,194
$112
,726
$742
,703
,697
g25
290
00
00
00
043
$1,2
70$5
4,62
3$5
0,01
330
$1,8
74$5
6,21
6$4
4,34
3$1
10,8
39$9
4,35
6$2
80,2
55,6
53
h25
290
00
00
00
035
$1,2
70$4
4,46
1$4
1,35
830
$1,8
74$5
6,21
6$4
5,81
0$1
00,6
76$8
7,16
7$2
54,5
60,0
25
i25
290
00
00
00
027
$1,2
70$3
4,29
8$3
2,41
730
$1,8
74$5
6,21
6$4
7,32
4$9
0,51
4$7
9,74
1$2
28,8
64,3
96
j32
290
00
00
00
00
00
030
$1,8
74$5
6,21
6$5
2,81
5$5
6,21
6$5
2,81
5$1
81,5
03,9
53
k32
290
00
00
00
00
00
022
$1,8
74$4
1,22
5$3
9,35
5$4
1,22
5$3
9,35
5$1
33,1
02,8
99
l32
290
00
00
00
00
00
014
$1,8
74$2
6,23
4$2
5,45
0$2
6,23
4$2
5,45
0$8
4,70
1,84
5
Pre
-HA
AR
T :
130
Mon
ths
(Pre
-HA
AR
T d
efin
ed a
s pr
e-3T
C p
erio
d)
CD
-4 >
500
499
> C
D-4
> 2
0019
9 >
CD
-4 >
75
75 >
CD
-4
Mon
ths
$/M
onth
Raw
Cos
tP
V(1
997)
Mon
ths
$/M
onth
Raw
Cos
tP
V(1
997)
Mon
ths
$/M
onth
Raw
Cos
tP
V(1
997)
Mon
ths
$/M
onth
Raw
Cos
tP
V(1
997)
Raw
Cos
tP
V(1
997)
34$3
34$1
1,36
7$1
0,59
455
$531
$29,
209
$22,
748
23$8
44$1
9,40
8$1
2,87
618
$1,5
52$2
7,92
8$1
7,04
5$8
7,91
1$6
3,26
3
Not
e:1.
The
dis
coun
t ra
te u
sed
thro
ugho
ut is
a m
onth
ly r
ate
of 0
.407
4% s
uch
that
whe
n co
mpo
unde
d ov
er 1
2 m
onth
s, p
rodu
ces
an e
ffec
tive
annu
al r
ate
5.00
00%
.
2. T
he o
nly
cost
s co
nsid
ered
are
fut
ure
cost
. Sun
k co
sts
( i.e
., th
ose
incu
rred
bef
ore
1997
) a
re r
epla
ced
by z
ero.
3. P
V(1
997)
is
the
pre
sent
val
ue a
t th
e s
tart
of
1997
of
futu
re c
osts
dis
coun
ted
mon
thly
at 0
.407
4%.
The Economic Burden of HIV/AIDS in Canada
45

HIV
/AID
S E
piso
dic
Cos
ts -
HA
AR
T1,
HA
AR
T2
and
Pre
-HA
AR
T (
HA
AR
T c
omm
ence
s Ja
nuar
y 1,
199
7)
Eff
ecti
ve A
nnua
l Dis
coun
t R
ate
= 6.
00%
Eff
ecti
ve M
onth
ly D
isco
unt
Rat
e =
0.49
%
Mon
thly
Cos
t -
CD
-4>5
00$7
32
Mon
thly
Cos
t -
499>
CD
-4>2
00$9
80
Mon
thly
Cos
t -
199>
CD
-4>7
5$1,
270
Mon
thly
Cos
t -
75>C
D-4
$1,8
74
HA
AR
T 1
: 1
52 M
onth
s
CD
-4 >
500
499
> C
D-4
> 2
0019
9 >
CD
-4 >
75
75 >
CD
-4
Coh
ort
Cas
esM
onth
sR
aw C
ost
PV
(199
7)M
onth
s$/
Mon
thR
aw C
ost
PV
(199
7)M
onth
s$/
Mon
thR
aw C
ost
PV
(199
7)M
onth
s$/
Mon
thR
aw C
ost
PV
(199
7)R
aw C
ost
(Cas
e)P
V(1
997)
(C
ase)
Raw
Cos
t (C
ohor
t)P
V(1
997)
(C
ohor
t)
a20
2346
$732
$33,
651
$30,
084
57$9
80$5
5,88
6$3
8,95
231
$1,2
70$3
9,37
9$2
2,11
718
$1,8
74$3
3,72
9$1
6,80
9$1
62,6
46$1
07,9
62$3
29,0
00,0
05$2
18,3
85,2
53
b20
2331
$732
$22,
678
$21,
002
57$9
80$5
5,88
6$4
1,89
531
$1,2
70$3
9,37
9$2
3,78
818
$1,8
74$3
3,72
9$1
8,07
9$1
51,6
73$1
04,7
64$3
06,8
03,6
18$2
11,9
16,3
25
c20
2316
$732
$11,
705
$11,
234
57$9
80$5
5,88
6$4
5,06
031
$1,2
70$3
9,37
9$2
5,58
518
$1,8
74$3
3,72
9$1
9,44
4$1
40,7
00$1
01,3
24$2
84,6
07,2
32$2
04,9
58,6
41
d51
870
00
057
$980
$55,
886
$48,
701
31$1
,270
$39,
379
$27,
652
18$1
,874
$33,
729
$21,
015
$128
,995
$97,
368
$669
,058
,367
$505
,020
,517
e51
870
00
039
$980
$38,
238
$34,
751
31$1
,270
$39,
379
$30,
178
18$1
,874
$33,
729
$22,
935
$111
,347
$87,
864
$577
,522
,033
$455
,723
,760
f51
870
00
021
$980
$20,
590
$19,
527
31$1
,270
$39,
379
$32,
935
18$1
,874
$33,
729
$25,
030
$93,
698
$77,
491
$485
,985
,699
$401
,924
,396
g25
290
00
00
00
031
$1,2
70$3
9,37
9$3
6,47
018
$1,8
74$3
3,72
9$2
7,71
7$7
3,10
9$6
4,18
7$1
84,8
55,5
50$1
62,2
95,9
76
h25
290
00
00
00
023
$1,2
70$2
9,21
7$2
7,57
718
$1,8
74$3
3,72
9$2
8,81
4$6
2,94
6$5
6,39
2$1
59,1
59,9
22$1
42,5
86,8
92
i25
290
00
00
00
015
$1,2
70$1
9,05
5$1
8,33
318
$1,8
74$3
3,72
9$2
9,95
6$5
2,78
4$4
8,28
8$1
33,4
64,2
93$1
22,0
97,1
25
j32
290
00
00
00
00
00
018
$1,8
74$3
3,72
9$3
2,21
9$3
3,72
9$3
2,21
9$1
08,9
02,3
72$1
04,0
25,8
64
k32
290
00
00
00
00
00
010
$1,8
74$1
8,73
9$1
8,24
7$1
8,73
9$1
8,24
7$6
0,50
1,31
8$5
8,91
2,64
9
l32
290
00
00
00
00
00
02
$1,8
74$3
,748
$3,7
21$3
,748
$3,7
21$1
2,10
0,26
4$1
2,01
2,48
6
HA
AR
T 2
: 2
00 M
onth
s
CD
-4 >
500
499
> C
D-4
> 2
0019
9 >
CD
-4 >
75
75 >
CD
-4
Coh
ort
Cas
esM
onth
sR
aw C
ost
PV
(199
7)M
onth
s$/
Mon
thR
aw C
ost
PV
(199
7)M
onth
s$/
Mon
thR
aw C
ost
PV
(199
7)M
onth
s$/
Mon
thR
aw C
ost
PV
(199
7)R
aw C
ost(
Cas
e)P
V(1
997)
(Cas
e)R
aw C
ost(
Coh
ort)
PV
(199
7)(C
ohor
t)
a20
2358
$732
$42,
429
$36,
888
69$9
80$6
7,65
2$4
3,27
043
$1,2
70$5
4,62
3$2
6,54
330
$1,8
74$5
6,21
6$2
2,85
9$2
20,9
20$1
29,5
60$4
46,8
76,4
91$2
62,0
74,5
03
b20
2343
$732
$31,
456
$28,
320
69$9
80$6
7,65
2$4
6,53
943
$1,2
70$5
4,62
3$2
8,54
830
$1,8
74$5
6,21
6$2
4,58
6$2
09,9
47$1
27,9
94$4
24,6
80,1
04$2
58,9
06,4
84
c20
2328
$732
$20,
483
$19,
105
69$9
80$6
7,65
2$5
0,05
643
$1,2
70$5
4,62
3$3
0,70
530
$1,8
74$5
6,21
6$2
6,44
4$1
98,9
74$1
26,3
10$4
02,4
83,7
17$2
55,4
99,1
08
d51
870
00
069
$980
$67,
652
$57,
345
43$1
,270
$54,
623
$35,
177
30$1
,874
$56,
216
$30,
295
$178
,490
$122
,817
$925
,776
,365
$637
,016
,593
e51
870
00
051
$980
$50,
003
$44,
185
43$1
,270
$54,
623
$38,
390
30$1
,874
$56,
216
$33,
062
$160
,842
$115
,637
$834
,240
,031
$599
,775
,935
f51
870
00
033
$980
$32,
355
$29,
823
43$1
,270
$54,
623
$41,
896
30$1
,874
$56,
216
$36,
082
$143
,194
$107
,801
$742
,703
,697
$559
,133
,835
g25
290
00
00
00
043
$1,2
70$5
4,62
3$4
9,17
830
$1,8
74$5
6,21
6$4
2,35
2$1
10,8
39$9
1,53
0$2
80,2
55,6
53$2
31,4
33,4
93
h25
290
00
00
00
035
$1,2
70$4
4,46
1$4
0,78
830
$1,8
74$5
6,21
6$4
4,03
0$1
00,6
76$8
4,81
8$2
54,5
60,0
25$2
14,4
62,9
67
i25
290
00
00
00
027
$1,2
70$3
4,29
8$3
2,06
730
$1,8
74$5
6,21
6$4
5,77
4$9
0,51
4$7
7,84
1$2
28,8
64,3
96$1
96,8
20,2
34
j32
290
00
00
00
00
00
030
$1,8
74$5
6,21
6$5
2,18
6$5
6,21
6$5
2,18
6$1
81,5
03,9
53$1
68,4
93,3
82
k32
290
00
00
00
00
00
022
$1,8
74$4
1,22
5$3
9,00
4$4
1,22
5$3
9,00
4$1
33,1
02,8
99$1
25,9
33,7
45
l32
290
00
00
00
00
00
014
$1,8
74$2
6,23
4$2
5,30
1$2
6,23
4$2
5,30
1$8
4,70
1,84
5$8
1,68
8,30
8
Pre
-HA
AR
T :
130
Mon
ths
(Pre
-HA
AR
T d
efin
ed a
s pr
e-3T
C p
erio
d)
CD
-4 >
500
499
> C
D-4
> 2
0019
9 >
CD
-4 >
75
75 >
CD
-4
Mon
ths
Raw
Cos
tP
V(1
997)
Mon
ths
$/M
onth
Raw
Cos
tP
V(1
997)
Mon
ths
$/M
onth
Raw
Cos
tP
V(1
997)
Mon
ths
$/M
onth
Raw
Cos
tP
V(1
997)
Raw
Cos
tP
V(1
997)
34$3
34$1
1,36
7$1
0,45
255
$531
$29,
209
$21,
680
23$8
44$1
9,40
8$1
1,89
118
$1,5
52$2
7,92
8$1
5,48
6$8
7,91
1$5
9,51
0
Not
e:1.
The
dis
coun
t ra
te u
sed
thro
ugho
ut is
a m
onth
ly r
ate
of 0
.486
8% s
uch
that
whe
n co
mpo
unde
d ov
er 1
2 m
onth
s, p
rodu
ces
an e
ffec
tive
annu
al r
ate
6.00
00%
.
2. T
he o
nly
cost
s co
nsid
ered
are
fut
ure
cost
. Sun
k co
sts
( i.e
., th
ose
incu
rred
bef
ore
1997
) a
re r
epla
ced
by z
ero.
3. P
V(1
997)
is
the
pre
sent
val
ue a
t th
e s
tart
of
1997
of
futu
re c
osts
dis
coun
ted
mon
thly
at 0
.486
8%.
47
The Direct and Indirect Costs
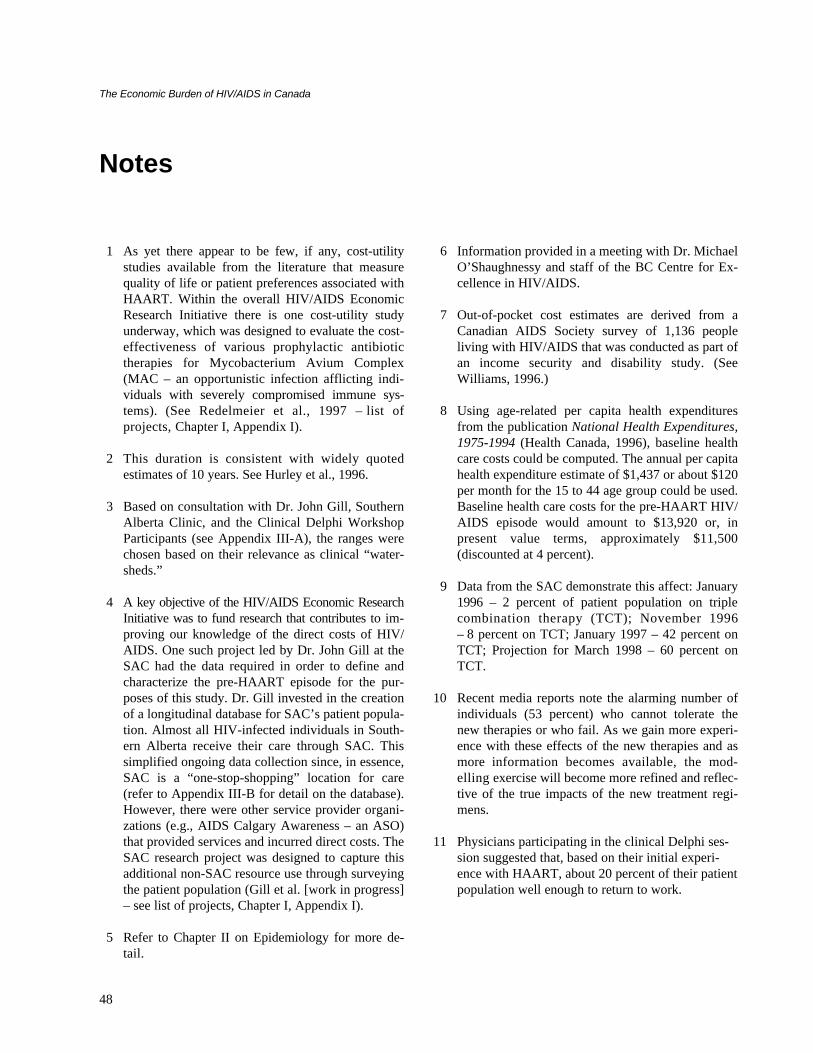
1 As yet there appear to be few, if any, cost-utilitystudies available from the literature that measurequality of life or patient preferences associated withHAART. Within the overall HIV/AIDS EconomicResearch Initiative there is one cost-utility studyunderway, which was designed to evaluate the cost-effectiveness of various prophylactic antibiotictherapies for Mycobacterium Avium Complex(MAC – an opportunistic infection afflicting indi-viduals with severely compromised immune sys-tems). (See Redelmeier et al., 1997 – list ofprojects, Chapter I, Appendix I).
2 This duration is consistent with widely quotedestimates of 10 years. See Hurley et al., 1996.
3 Based on consultation with Dr. John Gill, SouthernAlberta Clinic, and the Clinical Delphi WorkshopParticipants (see Appendix III-A), the ranges werechosen based on their relevance as clinical “water-sheds.”
4 A key objective of the HIV/AIDS Economic ResearchInitiative was to fund research that contributes to im-proving our knowledge of the direct costs of HIV/AIDS. One such project led by Dr. John Gill at theSAC had the data required in order to define andcharacterize the pre-HAART episode for the pur-poses of this study. Dr. Gill invested in the creationof a longitudinal database for SAC’s patient popula-tion. Almost all HIV-infected individuals in South-ern Alberta receive their care through SAC. Thissimplified ongoing data collection since, in essence,SAC is a “one-stop-shopping” location for care(refer to Appendix III-B for detail on the database).However, there were other service provider organi-zations (e.g., AIDS Calgary Awareness – an ASO)that provided services and incurred direct costs. TheSAC research project was designed to capture thisadditional non-SAC resource use through surveyingthe patient population (Gill et al. [work in progress]– see list of projects, Chapter I, Appendix I).
5 Refer to Chapter II on Epidemiology for more de-tail.
6 Information provided in a meeting with Dr. MichaelO’Shaughnessy and staff of the BC Centre for Ex-cellence in HIV/AIDS.
7 Out-of-pocket cost estimates are derived from aCanadian AIDS Society survey of 1,136 peopleliving with HIV/AIDS that was conducted as part ofan income security and disability study. (SeeWilliams, 1996.)
8 Using age-related per capita health expendituresfrom the publication National Health Expenditures,1975-1994 (Health Canada, 1996), baseline healthcare costs could be computed. The annual per capitahealth expenditure estimate of $1,437 or about $120per month for the 15 to 44 age group could be used.Baseline health care costs for the pre-HAART HIV/AIDS episode would amount to $13,920 or, inpresent value terms, approximately $11,500(discounted at 4 percent).
9 Data from the SAC demonstrate this affect: January1996 – 2 percent of patient population on triplecombination therapy (TCT); November 1996– 8 percent on TCT; January 1997 – 42 percent onTCT; Projection for March 1998 – 60 percent onTCT.
10 Recent media reports note the alarming number ofindividuals (53 percent) who cannot tolerate thenew therapies or who fail. As we gain more experi-ence with these effects of the new therapies and asmore information becomes available, the mod-elling exercise will become more refined and reflec-tive of the true impacts of the new treatment regi-mens.
11 Physicians participating in the clinical Delphi ses-sion suggested that, based on their initial experi-ence with HAART, about 20 percent of their patientpopulation well enough to return to work.
Notes
The Economic Burden of HIV/AIDS in Canada
48

Cassidy, Michael and Andrea Klymasz (1995), TheEconomic Costs of Schizophrenia in Canada: A Pre-liminary Study, Schizophrenia Society of Canada andHealth Canada.
Cooper, Barbara S. and Dorothy P. Rice (1976), “TheEconomic Cost of Illness Revisited,” Social SecurityBulletin, February.
Fraser, Rod and Ann Cox (1988), “The Economic Im-pact of HIV Infection and AIDS,” in Royal Society ofCanada, AIDS: A perspective for Canadians, Ottawa.
Grover, S. A. et al. (1992), The Natural History ofSymptomatic HIV Infection and the Costs Associatedwith Medical Care: Final Report, Montreal GeneralHospital, Centre for the Analysis of Cost-EffectiveCare, National Health Research and DevelopmentProgram Contract No. 6605-2938-AIDS.
Hanvelt, Robin A. et al. (1994), “Indirect Costs ofHIV/AIDS Mortality in Canada,” AIDS 8(10).
Harkness, John (1989), “The Economic Cost of AIDS inCanada,” Canadian Public Policy XV(4):405-12.
Hartunian, N. S., C. N. Smart and M. S. Thompson(1980), “The Incidence and Economic Costs of Can-cer, Motor Vehicle Injuries, Coronary Heart Disease,and Stroke: A Comparative Analysis,” AmericanJournal of Public Health 70(12):1249-60.
Health Canada (1996), National Health Expenditures inCanada, 1975-1994, Policy and ConsultationBranch, Ottawa: Supply and Services Canada.
——— (1997), The Economic Burden of Illness in Canada,1993, Health Protection Branch, Ottawa.
Hellinger, F. J. (1993), “The Lifetime Cost of Treating aPerson with HIV,” JAMA 270:474-78.
Hurley, Susan F. et al. (1996), “Lifetime Cost of HumanImmunodeficiency Virus-Related Health Care,”Journal of Acquired Immune Deficiency Syndromesand Human Retrovirology 12(4):371-78.
Knapp, Martin and Jennifer Beecham (1990), “CostingMental Health Services,” Psychological Medicine20:893-908.
Lange, N. et al. (1992), “Hierarchical Bayes Models forthe Progression of HIV Infection Using LongitudinalCD4 T-cell Numbers,” Journal of American StatAssos 87:615-26, cited in Hurley et al., op. cit.
Lindgren, B. and Raymunda Silverberg (1990),“Economic Burden of AIDS,” in M. F. Drummondand L. M. Davies, AIDS: The Challenge for Eco-nomic Analysis, University of Birmingham, UnitedKingdom.
Longini, I. M. et al. (1991), “The Dynamics of DC4T-lymphocyte Decline in HIV-infected Individuals:A Markov Modelling Approach,” J AIDS HumRetrovirol 4:1141-47, cited in Hurley et al., op cit.
Rice, Dorothy P. (1966), Estimating the Cost of Illness,Health Economic Series No. 6, U.S. Public HealthService, Washington.
Rice, Dorothy P., T. A. Hodgson and A. Hopstein(1985), “The Economic Cost of Illness: A Replicationand Update,” Health Care Financing Review 7:61-80.
Rice, Dorothy P. et al. (1990), Economic Costs of Alco-hol and Drug Abuse and Mental Illness, Alcohol,Drug Abuse and Mental Health Administration,Rockville, MD.
Scitovsky, Anne A. (1982), “Estimating the Direct Costsof Illness,” Millbank Memorial Fund Quarterly/Health and Society 60(3):463-91.
Scitovsky, Anne A. and Dorothy P. Rice (1987),“Estimates of the Direct and Indirect Costs of Ac-quired Immunodeficiency Syndrome in the UnitedStates, 1985, 1986, and 1991,” Public Health Reports102(1) (January-February).
Thompson, Mark S. and Heidi J. Meyer (1989), “TheCosts of AIDS: Alternative Methodological
References
49
The Direct and Indirect Costs

The Economic Burden of HIV/AIDS in Canada
Approaches,” in Conference Proceedings: Health Ser-vices Research Methodology: A Focus on AIDS,National Centre for Health Services Research andHealth Care Technology Assessment, Rockville, MD.
Tolley, K. and M. Gyldmark (1993), “The Treatmentand Care Costs of People Living with HIV Infection
or AIDS: Development of a Standardised CostFramework for Europe,” Health Policy 24:55-70.
Williams, Gregory T. (1996), Income Security Pro-ject – Phase II: Narrative Report, Ottawa: CanadianAIDS Society.
50

1 Introduction
Prevention has become an important issue in healthpolicy, especially in light of the fiscal pressuresexerted on the health care system. The control ofHIV infection is almost totally dependent on pre-vention interventions and strategies, and theoreti-cally, HIV is one hundred percent preventable. In theabsence of a cure or vaccine, the HIV/AIDS epi-demic remains a long-term threat to the well-being ofCanadian society and to the sustainability of thehealth care system.
It is clear that the resources available for HIVprevention are limited and resource allocationchoices have to be made. How should scarce re-sources be allocated? More specifically, how shouldfunds be allocated among alternative HIV preventionprograms and strategies in order to maximize thenumber of HIV infections averted? While these areimportant questions, a key prerequisite is to firstknow what we are investing in and how much. Theanalysis in this chapter takes account of Canada’sinvestment in HIV prevention since the mid-1980s.This accounting has never been done before inCanada and it enables several new analytical possi-bilities, such as international comparisons.
1.1 Is Prevention a Good Investment?
The impact of HIV prevention is difficult to mea-sure since an averted HIV infection is essentiallyinvisible. Hence several estimation techniques, proce-dures and models are used to estimate the number ofprevented infections. Kahn (1996) estimates that“the number of HIV infections averted in 5 yearswith $1 million in annual prevention spending rangesfrom 164 in high-risk populations to 0.4 in very-low-risk populations.” While the potential number of
infections averted is a useful statistic, so too is theclear message that targeting is a critical factor inmaximizing the output from prevention resources.Lurie and Drucker (1997) estimate the number ofinfections that could have been prevented had theUnited States implemented needle exchange pro-grams early in the HIV/AIDS epidemic. They con-clude that
our conservative estimate of the number of HIVinfections that could have been prevented rangedfrom 4,394 (15 percent incidence reduction due toneedle exchanges) to 9,666 (33 percent incidencereduction) ... If current policies are not changed, weestimate that an additional 5,150-11,329 pre-ventable HIV infections could occur by the year2000.
The estimates of the overall economic burden ofHIV/AIDS to Canadian society contained in thispaper demonstrate the strong economic incentive forinvesting in HIV prevention. Indeed, it is “the onlygame in town” and the British acknowledge preven-tion as the “core of the Governments AIDS Strategy”(Foreign and Commonwealth Office, 1995). Theyhave also set objectives and targets under the HIV/AIDS and Sexual Health umbrella as follows:
The Government’s main objectives are: to reducethe incidence of HIV infection and other sexuallytransmitted diseases; to develop further andstrengthen monitoring and surveillance; and toreduce the number of unintended pregnancies....National targets have been set: to reduce the inci-dence of gonorrhoea in people aged 15-64 by atleast 20 percent by 1995, as an indicator of HIV/AIDS trends; to reduce the percentage of injectingdrug misusers who report sharing in injectingequipment in the previous four weeks by at least50 per cent by 1997, and by at least a further 50per cent by the year 2000.
IV Canada==s Investment in HIV Prevention
51

Holtgrave et al. (1994), in a comprehensiveliterature review of the cost-effectiveness of HIVprevention, summarize the value of HIV preventionby tating, “HIV prevention programs need have onlya small positive impact on behavioural outcomes forthe program’s economic benefits to outweigh thefinancial costs.” HIV prevention is a sound invest-ment both in human and financial terms.
The accounting exercise contained in this chapter isa key first step in the process of designing andconfiguring a truly national response to the HIV/AIDS epidemic premised on best practice and thecost-effective use of limited resources.
1.2 Defining HIV/AIDSPrevention and Education
A key challenge for this study was to define a basicpackage of HIV prevention activities and interven-tions. However, these activities are often embeddedor nested within other activities and are often difficultto specifically identify in terms of definition and cost.
Some organizations engage in both treatment andprevention activity, and funding sources and financ-ing are often not separately identified. For example,while some activities are clearly identifiable as pre-vention and education, others such as research havebeen funded in blocks, and still others are notconsistently or specifically tied to prevention as op-posed to treatment. A key pre-requisite to conductinga survey on investment in HIV prevention and educa-tion is to first define an easily recognizable packageof prevention and education activity in order tostandardize data collection.
The substance of HIV/AIDS prevention andeducation is interventions designed to limit the dis-ease or block its emergence. Angus and Shariatmadar(1996) categorize primary interventions as: strategiesto prevent someone from contracting HIV; techniquesto influence behaviour of those infected to reduce orarrest transmission; and antibody screening and test-ing to determine the sources and degree of risk within
a population.
Expenditures on HIV/AIDS prevention andeducation are a function of the types of interventionsemployed, which are related to the number and cover-age of programs thought necessary. These in turn arerelated to the extent and location of the epidemicwithin a country’s population, and available funds.HIV/AIDS prevention and education strategies havetherefore included a variety of activities, of varyingcosts.
In developing countries, the World HealthOrganization (WHO) (1994) resource requirementmodel for HIV prevention describes a “HypotheticalPackage of Essential HIV Prevention Strategies,”with front-line interventions such as screening ofdonated blood and provision of condoms as part ofthe “feasible best practice” in the fiscal context ofdeveloping countries. The model estimates US$0.27to US$0.38 per capita as the range of expenditurerequired to provide the complete HIV preventionpackage (without STD treatment) in the developingcountries studied. By contrast, a study in 1987 onHIV/AIDS prevention and education expenditures bythe public sector in West Germany included typicalfront-line interventions, plus accounted for the costsof reducing occupational exposure, and the costs ofresearch on preventative interventions and vac-cines. The per capita cost estimated from that studyis US$1.05.1
The principle activities discussed in this chapter aresummarized below. They include the current compo-nents of Health Canada’s National AIDS Strategy,and the key initiatives funded by the provincial andterritorial health ministries/departments. Also in-cluded are the gross expenditures on HIV preventioninitiatives by other provincial and territorial govern-ment departments (labour, education, and social ser-vices), those of a sample of municipalities, and for asample of community-based AIDS organizations us-ing private contributions. All HIV prevention activi-ties captured are for Canada. Only broad interna-tional comparisons are presented in the discussionsection of this chapter.
The Economic Burden of HIV/AIDS in Canada
52

a) HIV/AIDS Prevention and Education Compo-nents of the National AIDS Strategy
• Community development and support to na-tional nongovernment organizations, includinginfrastructure costs
• Research on prevention interventions and ed-ucation techniques
• Epidemiology and surveillance• Research and interventions to ensure a safe
blood supply• Prevention and education interventions
b) By Provincial/Territorial Departments of Health
• Mass media campaigns• School education• Needle exchange• Prevention research• HIV testing• Hot lines• Advisory committees• Staff salaries not included in above categories• Other activities such as epidemiology and popu-
lation surveillance, conferences• Transfers to community-based AIDS organiza-
tions for HIV/AIDS prevention and education• Transfers to public health units or regional
health service structures for HIV/AIDS preven-tion and education
c) By Municipalities and Departments ofLabour/Workers’ Compensation Boards (WCB),Education, Correctional Services, and SocialServices
• Total expenditures attributable to HIV/AIDSprevention and education
d) With Private Funds through Community-basedAIDS Organizations
• Total expenditures attributable to HIV/AIDSprevention and education
2 Methodology
This study estimates the national aggregate expen-ditures on HIV/AIDS prevention and education byCanadian public sector institutions since 1985, andthe private contributions attributable to preventionand education in community-based AIDS organiza-tions in 1996. It includes a descriptive analysis offindings, including indicators of response (as expen-ditures) to need (as HIV prevalence and incidence) inCanada, and comparisons to the responses in threeother developed countries.
2.1 The Public Sector
Public sector data were collected from fundingsources. Some provincial health department/ministry contacts were members of the Federal/Provincial/Territorial Government (HIV/AIDS) Pre-vention Program Committee. For provinces and ter-ritories not represented on the Committee, forprovincial/territorial departments other than health,and for municipalities, contacts were determined byHealth Canada or CPRN. For Health Canada, thestaff of the HIV/AIDS Policy, Coordination, andPrograms Division, Health Promotion and ProgramsBranch, provided the expenditure data.
Provincial/territorial departments and ministrieswere surveyed using a data collection form based onan activity classification scheme developed with theassistance of key informants (see Appendix IV-A).Contacts were faxed a covering letter and the datacollection form. Follow-up phone calls were made toconfirm receipt of the form and to explain the datarequirements and deadline. Subsequently, contactswere called occasionally to determine status until thedata were received along with supporting documen-tation, whenever available.
Health Canada expenditure data were delivered inthe activity categories given in the National AIDSStrategy.
With the other provincial departments andmunicipalities, the covering letter and data collection
Canada’s Investment in HIV Prevention
53

form were sometimes faxed, but, most often, com-munication was by telephone, starting with an expla-nation of the research initiative and maintainingcontact until data were received. Most often esti-mates were given during the phone interviews.
2.2 The Private Sector
Private sector contributions were identified by thecommunity-based AIDS organizations that receivedthe funds. Data for 1996-97 were collected using aquestionnaire developed in consultation with keyinformants (see Appendix IV-B).
The questionnaire is modelled after the omnibussurvey conducted by the Canadian AIDS Society(CAS) in 1995-96. Contacts were provided byCAS, Coalition des organismes communautairesquébécois (COCQ-Sida), Health Canada’s AIDSCommunity Action Program, and AIDS Vancouver.The questionnaire was sent to 87 organizations thatagreed to participate. In addition, telephone inter-views were held with several participants. Privatedonations were considered to be contributions fromindividuals, private corporations, and agencies.
2.3 Limitations of the Data
Restructuring and downsizing in several provincialdepartments of health have left corporate historylimited to the most recent years. As well, the studycaught some health services in the process of beingregionalised, with central departments of health hav-ing only high-level budgets that did not isolateHIV/AIDS prevention and education activities, andregions varying in their recording of these expendi-tures. Estimates were accepted in these situationswhenever possible.
In situations where HIV/AIDS prevention and edu-cation programs had separate budgets, but whereinterventions for other sexually transmitted diseaseswere carried-out, the costs for the other interventionswere not subtracted. Conversely, in the case where aprogram was designed to prevent a range of infec-
tious diseases with HIV as one, a portion of theexpenditures attributable specifically to HIV had tobe estimated using an allocation guideline or proxy.For example, if a pamphlet on preventing sexuallytransmitted diseases was developed and one-third ofthe pamphlet was devoted to HIV/AIDS, then one-third of the total cost of this activity (i.e., contentdevelopment, printing, distribution, etc.) would beattributed to HIV prevention.
While they contribute to local public health units,municipalities were not able to consistently isolatethe proportion of their contributions to health unitsthat could be attributed specifically to HIV/AIDSprevention and education. They were however ableto identify their direct involvement in, or contribu-tions to local initiatives such as community-basedAIDS organizations and fundraising events.
With school education programs, expenditure dataon centrally developed curricula were sometimesavailable, and sometimes directly attributable toHIV/AIDS. In cases where curricula were developedfor general sexual health and included HIV/AIDS asa component, the expenditure for HIV/AIDS wasbased on the ratio of HIV/AIDS lessons to totallessons. The study does not capture comprehensivelythe individual school board responses to curriculumadjustment/development, procurement of trainingmaterials, and teacher training within each province.
Regarding provincial expenditures on HIV inthe workplace, the prevention and educationprograms are typically not specific to HIV/AIDS butdeal with universal precautions with blood bornepathogens. Departments of labour/WCB had diffi-culty extracting a portion of costs specific to HIV/AIDS from research and guidelines developed foruniversal precautions, and from the correspondingtraining and regulations enforcement. Furthermore,no attempt was made to capture the expense ofchanges in work practice, for example, in publiclaboratories dealing with infected body and bloodproducts. The data that were submitted were quali-fied as being a significant underestimate of the actualexpenditures.
The Economic Burden of HIV/AIDS in Canada
54

Tab
le I
V-1
Tot
al E
stim
ated
Exp
endi
ture
s on
HIV
/AID
S P
reve
ntio
n an
d E
duca
tion
, 198
5-86
to
1996
-97
(Una
djus
ted
Dol
lars
– M
illio
ns)
1985
-86
1986
-87
1987
-88
1988
-89
1989
-90
1990
-91
1991
-92
1992
-93
1993
-94
1994
-95
1995
-96
1996
-97
Tot
aldo
llars
Perc
ent
Prov
inci
al/
ter
rito
rial
hea
lth d
epar
tmen
ts/
min
istr
ies
5.00
6.00
19.0
21.0
30.0
30.0
34.0
39.0
43.0
47.0
50.0
55.0
379
66
Oth
er p
rovi
ncia
l d
epar
tmen
ts/
min
istr
ies
0.01
0.04
1.0
0.9
1.0
0.9
0.9
1.1
1.2
1.6
1.6
1.6
12
2
Mun
icip
aliti
es0
0.30
0.3
0.5
0.6
0.7
0.8
1.5
2.3
3.3
3.3
3.5
17
3
Hea
lth C
anad
a1.
00a
1.90
2.9
11.5
14.8
17.6
16.9
17.4
19.7
20.0
19.4
19.4
163
29
Tot
al p
ublic
sec
tor
exp
endi
ture
s6.
018.
2423
.233
.946
.449
.252
.659
.066
.271
.974
.379
.557
110
0
Priv
ate
cont
ribu
-tio
ns t
o A
IDS
serv
ice
org
aniz
atio
ns 4
.3
Publ
ic a
nd p
riva
te s
ecto
r ex
pend
iture
s83
.8
a R
epre
sent
s th
e su
m o
f exp
endi
ture
s up
to a
nd in
clud
ing
1985
-86.
55
Canada’s Investment in HIV Prevention

The countless in-service, training and education/information sessions provided in public and privatesector workplaces to introduce new practices basedon health and safety regulations for blood bornepathogens are not captured within the context of thisstudy.
In light of the limitations described above andbecause missing data were not imputed into thetotals, the estimates of public sector expendituresmay be considered conservative.
3 Findings
3.1 National Investment inHIV Prevention
From 1985 to 1996, Canadians spent an estimated$571 million through their public institutions onHIV/AIDS prevention and education. The federalcontribution through Health Canada was approxi-mately 29 percent of total expenditures ($163 mil-lion); the provincial and territorial expendituresamounted to 68 percent of the total ($391 million);and municipal funding was approximately 3 percentof the total ($17 million) (Table IV-1).
Canada invested over $80 million in HIV pre-vention and education in 1996-97 (Chart IV-1). Ofthe $60 million invested by the provinces, territoriesand municipalities, roughly 29 percent was trans-ferred to community-based AIDS service organi-zations (ASO) (Chart IV-2). At the federal level,Health Canada invested roughly 52 percent of itstotal HIV prevention and education funds at thecommunity-based level (Chart IV-3). In 1996, pri-vate contributions that supported HIV/AIDS pre-vention and education activities in community-basedAIDS organizations amounted to $4.3 million, or5 percent of the total public and private expendituresin that year.
3.2 Health Canada Expenditures
In the earliest days of the AIDS epidemic (the firstreported cases in Canada were in 1982), Health andWelfare Canada responded by taking steps applica-
ble to any communicable disease in that reportingrequirements for health authorities across the coun-try were instituted (Lindquist and Rayside, 1992).To review the information about the disease as itemerged, a National Advisory Council on AIDS wasformed in 1983. By 1985, the Health Services andPromotion Branch of Health and Welfare Canadahad begun giving grants for community develop-ment, but it was in 1986 that a substantial commit-ment was made by the federal government to fightAIDS. The National Centre for AIDS was createdand a budget for HIV prevention and education wasestablished. Prior to 1986-87, approximately$960,000 had been allocated for prevention andeducation from $3.2 million spent on HIV/AIDS(Table IV-2).
For 1986-87 and 1987-88, Health Canada promotedHIV prevention and education through communitydevelopment strategies, transferring approximately$4.6 million to community-based and nongovern-ment organizations. In 1988-89, Health Canada in-creased its monetary commitment to HIV/AIDS pre-vention and education four times compared to theprevious year, jumping from $2.9 to $11.5 million.The AIDS Community Action Program waslaunched to consolidate funding for communitygroups. As well, $8 million (70 percent of totalavailable funds for HIV/AIDS) were allocated tocollaborative prevention and education programs in-volving other federal agencies, and to those inprovinces and territories.
In 1989-90, Health Canada’s direct support forprevention and education began to decline relativeto its allocations to other HIV/AIDS preventioninitiatives (see Chart IV-4). The emerging strat-egy was to aim prevention and education activitiesat the populations where rates of transmissionwere known to be the highest, using organizationswith roots in the communities most vulnerable toHIV. Therefore, more Health Canada fundingstarted to shift to community-based AIDS organi-zations relative to other initiatives, to build localinfrastructures that supported prevention of infec-tion and care for those infected.
The Economic Burden of HIV/AIDS in Canada
56

As the threat of HIV/AIDS became more appar-ent, expenditures grew, and in 1990 the NationalAIDS Strategy (NAS) was launched. The first phasesaw a commitment of $112 million from 1990-91 to1992-93, and the second phase, 1993-94 to 1997-98, $203.5 million. For each phase, approxi-mately 42 percent of the total National AIDSStrategy funds is attributed to HIV/AIDS preventionand education (Table IV-3).
3.3 Provincial, Territorial andMunicipal Government Expenditures
The provincial, territorial and municipal govern-ments combined spent an estimated $407 millionfrom 1985 to 1996 on HIV/AIDS prevention andeducation, of which $379 million or 93 percentcame from departments/ministries of health. Ap-proximately 35 percent of the ministry of health
Provincial/Territorial Gov't.
MunicipalitiesHealth Canada
Private Contributions to AIDS Service Organizations
Chart IV-1
Total Estimated National Expenditures on HIV/AIDS Prevention and Education, 1996-97
Provincial/territorial governments67.5% (C$56.6 million)
Provincial/territorial governments67.5% (C$56.6 million)
Private contributions to ASOs5.1% (C$4.3 million)Private contributions to ASOs5.1% (C$4.3 million)Private contributions to ASOs5.1% (C$4.3 million)Private contributions to ASOs5.1% (C$4.3 million)
Municipalities4.2% (C$3.5 million)
Municipalities4.2% (C$3.5 million)
Municipalities4.2% (C$3.5 million)
Municipalities4.2% (C$3.5 million)
Health Canada23.2% (C$19.4 million)Health Canada23.2% (C$19.4 million)Health Canada23.2% (C$19.4 million)Health Canada23.2% (C$19.4 million)Health Canada23.2% (C$19.4 million)Health Canada23.2% (C$19.4 million)Health Canada23.2% (C$19.4 million)
Direct Activities, Health Departments/MinistriesTransfers to ASOs
Transfers to Public Health Units, Regional Health Service Transfers to Red Cross
Other Provincial Departments
Municipalities
C har t IV - 2
E s t i m at e d P rov i n c i a l , Te rr i t or i a l a nd M uni c i pa l HI V P rev en t i o n a nd E duc at i on Ex pe ndi t ure s , 1 99 6 - 97
Transfers to ASOs29.0% (C$17.5 million)
Transfers to ASOs29.0% (C$17.5 million)
Di r ec t ac t i v i t i e s , hea l t hdepar t men t s / mi n i s t r i e s25 .5% ( C$15 .4 mil l i on )
Di r ec t ac t i v i t i e s , hea l t hdepar t men t s / mi n i s t r i e s25 .5% ( C$15 .4 mil l i on )
Transfers to ASOs29.0% (C$17.5 million)
Di r ec t ac t i v i t i e s , hea l t hdepar t men t s / mi n i s t r i e s25 .5% ( C$15 .4 mil l i on )
Di r ec t ac t i v i t i e s , hea l t hdepar t men t s / mi n i s t r i e s25 .5% ( C$15 .4 mil l i on )
M un i c i pa l i t i e s5 .8 % ( C$3 . 5 mi l l ion )
Ot he r p r ov i nc i a ldepa r t men t s2 .6% ( C$1 .6 mi l l i on )
Tr ans f e r s t o Red C r oss15 .6% (C $9 .4 mi l l i on )
Tra n s fe r s to p u bl i c he a l t h uni t s and r egiona l he al th
se rvic e st ru ctures21. 5% (C$1 3.0 mi l l ion )
57
Canada’s Investment in HIV Prevention

funds went to programs and services that they pro-vided directly or developed for implementation byother government departments such as educationand correctional services. The remaining 65 percentof these funds was transferred to other agencieseither related to the ministries, such as public healthunits, or to independent bodies such as communityAIDS organizations or to the Red Cross(Table IV-4).
In some provinces, departments such as correc-tional services, education, and labour/Workers’Compensation Board directly supported their ownprograms, accounting for a very conservative esti-mate of $12 million or 3 percent of total provincial/territorial/municipal spending on HIV/AIDS preven-tion. The municipal portion was estimated at $17million or 4 percent of the combined provincial/terri-torial/municipal investment.
The allocation pattern of the provincial and territo-rial governments is somewhat similar to that ofHealth Canada in that, over time, relatively morefunds were transferred to community-based AIDSorganizations than were allocated to other initiatives(Chart IV-5). Nonetheless, there is an interestingdifference in Health Canada’s strategy versus that ofthe provinces in the early years of response to theepidemic. In 1986 and 1987, Health Canada chose topromote prevention and education almost exclusivelythrough community-based organizations, while theprovincial departments of health intervened directlyto a much greater extent, spending 44 percent offunds available for HIV/AIDS prevention and educa-tion on programs they developed and/or deliveredthemselves, while 5 percent was transferred to com-munity organizations. Presumably, the more aggres-sive intervention by the provinces and territories wasmotivated by their direct responsibility for health
The Economic Burden of HIV/AIDS in Canada
Transfers: Community Development
Research
Direct Funding for Education and Prevention Interventions
Blood Committee/Secretartiat
Chart IV-3
Health Canada Expenditures on HIV/AIDS Prevention and Education, 1996-97
Transf ers , community development51.5% (C$10.0 million)
Canadian BloodCommittee/Secretariat1 .5% (C$0.3 mill ion)
Canadian BloodCommittee/Secretariat1 .5% (C$0.3 mill ion)
Transf ers , community development51.5% (C$10.0 million)
Canadian BloodCommittee/Secretariat1 .5% (C$0.3 mill ion)
Direct funding for preventionand education interventions19.1% (C$3.7 mill ion)
Research27.8% (C$5.4 million)
111
2
3
4
1 Includes funds for infrastructure of NGOs; comprised of transfers to the AIDS Community Action Program (includes some care and support ac-tivities), and includes initiatives involving Correctional Services Canada, the Canadian AIDS Society, and the Canadian Hemophilia Society.
2 Includes 25 percent of total National Health Research and Development Program grants; includes epidemiology and surveillance; includes pro-grams for blood safety.
3 Assumed half of the total funding of the Canadian Blood Committee as attributable to HIV up to 1991-92 when HIV was an emerging issue indealing with blood borne pathogens; from 1993-94, includes total expenditures of the Canadian Blood Secretariat.
4 Includes “HIV in the Workplace” program; funding for First Nations and Inuit programs.
58

Tab
le I
V-2
Hea
lth
Can
ada
Exp
endi
ture
s on
HIV
/AID
S P
reve
ntio
n an
d E
duca
tion
Up
to 1
996-
97(U
nadj
uste
d D
olla
rs –
Mill
ions
)
Prio
r to
1986
-87
1986
-87
1987
-88
1988
-89
1989
-90
1990
-91
1991
-92
1992
-93
1993
-94
1994
-95
1995
-96
1996
-97
Tot
al
Dir
ect f
undi
ng f
or p
reve
ntio
n an
d e
duca
tion
int
erve
ntio
ns1
00
8.0
7.4
5.1
4.8
0 4
.8 3
.5 3
.5 3
.5 3
.7 4
4.30
Res
earc
h20
0 0
0 3
.2 3
.20
3.2
5.9
6.0
5.3
5.4
32.
20
Tra
nsfe
rs f
or c
omm
unity
dev
elop
men
t31.
92.
7 3
.3 7
.2 9
.1 8
.90
9.4
10.2
10.2
10.1
10.0
83.
00
Can
adia
n B
lood
Com
mitt
ee/
Sec
reta
riat
40.
2 0
.2 0
.2 0
.2 0
.05
0.1
0.3
0.5
0.3
2
.05
Hea
lth C
anad
a e
xpen
ditu
res
on H
IV/A
IDS
prev
entio
n a
nd e
duca
tion
1.0
1.9
2.9
11.5
14.8
17.6
16.9
517
.419
.720
.019
.419
.416
2.55
1In
clud
es “
HIV
in th
e W
orkp
lace
” pr
ogra
m; f
undi
ng f
or F
irst
Nat
ions
and
Inu
it pr
ogra
ms.
2In
clud
es 2
5 pe
rcen
t of
tota
l NH
RD
P gr
ants
; inc
lude
s ep
idem
iolo
gy a
nd s
urve
illan
ce; i
nclu
des
prog
ram
s fo
r bl
ood
safe
ty.
3In
clud
es f
unds
for
infr
astr
uctu
re o
f N
GO
s; c
ompr
ised
of
tran
sfer
s to
the
AID
S C
omm
unity
Act
ion
Prog
ram
(in
clud
es s
ome
care
and
sup
port
act
iviti
es )
, and
incl
udes
initi
ativ
es in
volv
ing
Cor
rec-
tiona
l Ser
vice
s C
anad
a, th
e C
anad
ian
AID
S So
ciet
y, a
nd th
e C
anad
ian
Hem
ophi
lia S
ocie
ty.
4A
ssum
ed h
alf
of th
e to
tal f
undi
ng o
f th
e C
anad
ian
Blo
od C
omm
ittee
as
attr
ibut
able
to H
IV u
p to
199
1-92
whe
n H
IV w
as a
n em
ergi
ng is
sue
in d
ealin
g w
ith b
lood
bor
ne p
atho
gens
; fro
m 1
993-
94,
incl
udes
tota
l exp
endi
ture
s of
the
Can
adia
n B
lood
Sec
reta
riat
.So
urce
:H
IV/A
IDS
Polic
y, C
oord
inat
ion
and
Prog
ram
s D
ivis
ion,
Hea
lth P
rom
otio
n an
d Pr
ogra
ms
Bra
nch,
Hea
lth C
anad
a.
59
Canada’s Investment in HIV Prevention

Chart IV-4
Relative Change in Health Canada Expenditures Up to 1996-97
Total education and prevention
Total research
Transfers to community-basedAIDS organizations
Canadian Blood Committee/Secretariat
Table IV-3
Health Canada HIV/AIDS Prevention and Education Expenditures
Phase Millions of dollars
Pre NAS up to 1989-90 32
NAS Phase I 1990-91 to 1992-93 52
NAS Phase II 1993-94 to 1996-97 79
Total 163
The Economic Burden of HIV/AIDS in Canada
60
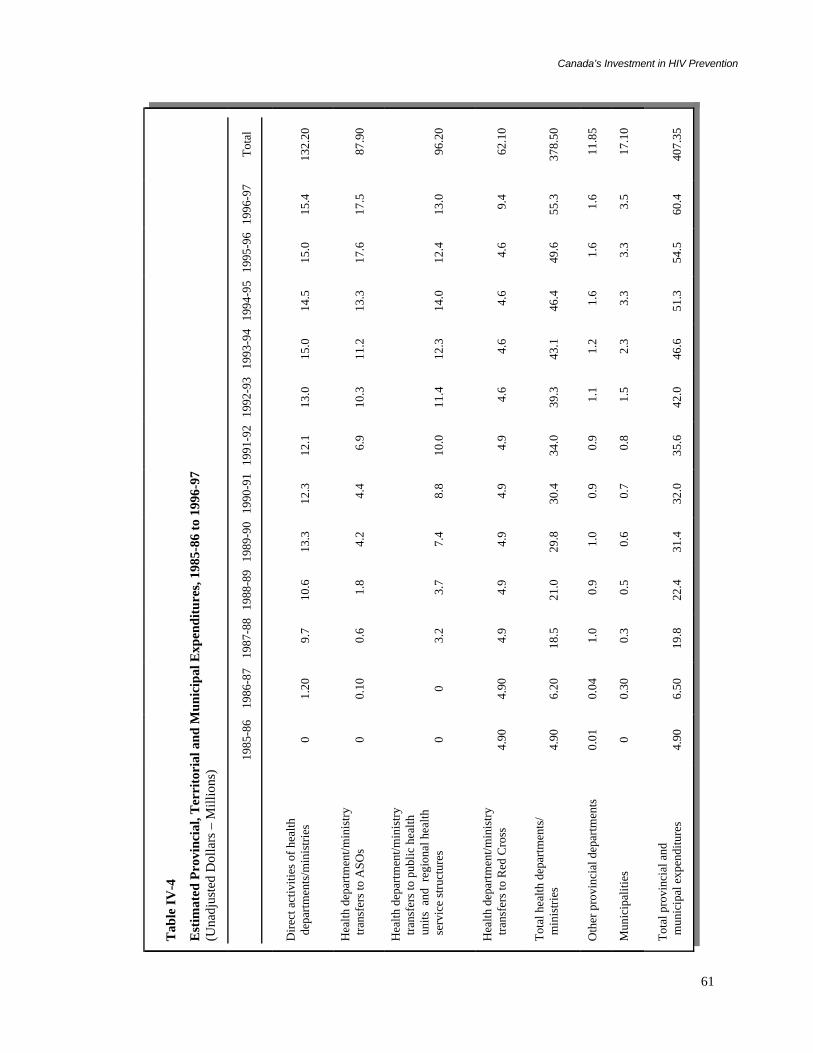
Tab
le I
V-4
Est
imat
ed P
rovi
ncia
l, T
erri
tori
al a
nd M
unic
ipal
Exp
endi
ture
s, 1
985-
86 t
o 19
96-9
7(U
nadj
uste
d D
olla
rs –
Mill
ions
)
1985
-86
1986
-87
1987
-88
1988
-89
1989
-90
1990
-91
1991
-92
1992
-93
1993
-94
1994
-95
1995
-96
1996
-97
Tot
al
Dir
ect a
ctiv
ities
of
heal
th d
epar
tmen
ts/m
inis
trie
s0
1.20
9.7
10.6
13.3
12.3
12.1
13.0
15.0
14.5
15.0
15.4
132.
20
Hea
lth d
epar
tmen
t/min
istr
y t
rans
fers
to A
SOs
00.
10 0
.6 1
.8 4
.2 4
.4 6
.910
.311
.213
.317
.617
.5 8
7.90
Hea
lth d
epar
tmen
t/min
istr
y t
rans
fers
to p
ublic
hea
lth u
nits
and
reg
iona
l hea
lth s
ervi
ce s
truc
ture
s0
0 3
.2 3
.7 7
.4 8
.810
.011
.412
.314
.012
.413
.0 9
6.20
Hea
lth d
epar
tmen
t/min
istr
y t
rans
fers
to R
ed C
ross
4.90
4.90
4.9
4.9
4.9
4.9
4.9
4.6
4.6
4.6
4.6
9.4
62.
10
Tot
al h
ealth
dep
artm
ents
/ m
inis
trie
s4.
906.
2018
.521
.029
.830
.434
.039
.343
.146
.449
.655
.337
8.50
Oth
er p
rovi
ncia
l dep
artm
ents
0.01
0.04
1.0
0.9
1.0
0.9
0.9
1.1
1.2
1.6
1.6
1.6
11.
85
Mun
icip
aliti
es0
0.30
0.3
0.5
0.6
0.7
0.8
1.5
2.3
3.3
3.3
3.5
17.
10
Tot
al p
rovi
ncia
l and
mun
icip
al e
xpen
ditu
res
4.90
6.50
19.8
22.4
31.4
32.0
35.6
42.0
46.6
51.3
54.5
60.4
407.
35
61
Canada’s Investment in HIV Prevention

care (except for First Nations and Inuit people).
3.4 Provincial/Territorial HealthDepartment/Ministry Expenditures
The earliest responses to the epidemic by min-istries of health, during 1986 and 1987, weredominated by programs that were directly providedby the ministries, in particular, mass media campaigns,HIV testing, and information hot lines (Table IV-5).The ministries were concentrating on monitoringthe progression of the epidemic, and were simultane-ously informing the general population on the extentof risk, the modes of transmission, and the means toprevent the disease. At the same time, funds had been
transferred to community-based organizations, al-though they were modest by comparison: $114,000in 1986 for community development compared to$1.2 million for the programs provided directly byministries.
By 1989, ministry of health transfers tocommunity-based AIDS organizations leapt to over$4 million or 17 percent of funds available for HIV/AIDS prevention and education, excluding transfersto the Red Cross. Direct activities by ministries stilldominated, at $13.3 million, and the second largestexpenditure was transfers to public health units andregional health service structures, worth $7.4 million(doubled from the previous year). Subsequently,transfers to community organizations grew every
0.00
0.01
0.01
0.02
0.02
0.03
0.03
0.04
0.04
0.05
0.05
Chart IV-5
Relative Change in Provincial/Territorial Health Department/Ministry Expendituresfrom 1985-86 to 1996-97
1985
-86
1986
-87
1987
-88
1988
-89
1989
-90
1990
-91
1994
-95
1991
-92
1992
-93
1993
-94
1995
-96
1996
-97
Ann
ual d
olla
rs r
elat
ive
to to
tal
Total direct activities of health departments
Transfers to ASOs
Transfers to public health andregional health services structures
Funding to Red Cross
The Economic Burden of HIV/AIDS in Canada
62

Tab
le I
V-5
Bre
akdo
wn
of E
stim
ated
Exp
endi
ture
s on
Dir
ect
Act
ivit
ies
of P
rovi
ncia
l/Ter
rito
rial
Hea
lth
Dep
artm
ents
/Min
istr
ies,
1985
-86
to 1
996-
97(U
nadj
uste
d D
olla
rs –
Mill
ions
)
1985
-86
1986
-87
1987
-88
1988
-89
1989
-90
1990
-91
1991
-92
1992
-93
1993
-94
1994
-95
1995
-96
1996
-97
Tot
al
Mas
s m
edia
00.
464.
565.
336.
174.
502.
902.
992.
301.
650.
690.
45 3
2.00
Scho
ol e
duca
tion
00
1.30
0.10
0.23
0.35
0.32
0.36
0.36
0.37
0.26
0.86
4
.51
Nee
dle
exch
ange
00
00
0.22
0.51
0.75
1.88
2.53
2.73
3.83
3.83
16.
28
Prev
entio
n re
sear
ch0
00.
300.
200.
050.
300.
200.
100.
210.
160.
380.
39
2.2
9
HIV
test
ing
00.
521.
291.
682.
432.
653.
273.
684.
064.
544.
684.
88 3
3.68
Adv
isor
y C
omm
ittee
00.
200.
210.
210.
220.
280.
230.
230.
280.
250.
230.
23
2.5
7
Hot
line
s0
01.
601.
701.
551.
481.
431.
151.
101.
131.
161.
13 1
3.43
Mis
cella
neou
s10
0.03
0.15
0.22
0.53
0.72
0.80
1.00
1.47
1.80
1.64
1.58
9
.94
Gov
ernm
ent s
taff
sal
arie
s0
0.01
0.29
1.14
1.92
1.52
2.24
1.55
2.65
1.85
2.08
2.07
17.
32
Tot
al d
irec
t a
ctiv
ities
of
heal
th d
epar
tmen
ts/
min
istr
ies
01.
229.
7010
.58
13.3
212
.31
12.1
412
.94
14.9
614
.48
14.9
515
.42
132.
02
1 C
ompr
ised
of
som
e su
rvei
llanc
e an
d ep
idem
iolo
gic
mon
itori
ng, t
rain
-the
-tra
iner
pro
gram
s, c
onfe
renc
es, s
essi
onal
spe
aker
s, c
ontr
ibut
ion
to s
peci
al f
eder
al/p
rovi
ncia
l sha
red
prog
ram
s.
63
Canada’s Investment in HIV Prevention

year until 1995-96. By that time, the value of thesetransfers had overtaken the funding for direct min-istry activities and transfers to public health units.By 1996, provincial departments of health weretransferring on average 31 percent (about $17.5million) of HIV/AIDS prevention and educationfunding to AIDS service organizations.
3.5 Private Sector
The private sector contributions shown inTable IV-6 are derived from two sources: a CPRNsurvey in 1997, and the Canadian AIDS Society(CAS) Omnibus Survey of 1995-96. The CPRNsurvey involved 87 organizations, some of themmembers of CAS. The CAS survey captured datafrom 55 member organizations in 1993-94, and 61member organizations in 1994-95.
Because of the different numbers of organizationsreporting in each year shown in Table IV-6, andbecause two surveys are informing the table, year-to-year variations must be interpreted cautiously.Nonetheless, there appears to have been a fairly
significant increase (about 40 percent) in provincialfunding in actual dollars from 1994-95 to 1996-97.This is confirmed by trends in provincial spendingshown earlier.2 Private funding sources appear tohave contributed significantly more to community-based organizations in 1996-97 than in 1994-95.Excluding gifts-in-kind and volunteer hours in 1996-97,3 private contributions doubled from 1994-95 to1996-97 (Table IV-7).
While Table IV-6 presents the actual funds re-ceived by the community organizations, a significantimpact of the funding, beyond the support for organi-zational infrastructures and activities, has been theleveraging of hundreds of thousands of volunteerhours. For example, the CAS Omnibus Survey re-ports 745,433 volunteer hours in 63 AIDS organiza-tions in 1994-95 (used in Table IV-7 as an estimatefor 1996-97). The value of these hours in 1996-97 ishalf of the total value of private contributions forthat year.
With gifts-in-kind and a value assigned to volun-teer input, the total private contributions for 1996-97were estimated to be worth $15 million. Based on the
The Economic Burden of HIV/AIDS in Canada
Table IV-6
Community-based AIDS Organizations Funding Sources(Unadjusted Dollars – Millions)
1993-94a 1994-95b 1996-97
Dollars Percent Dollars Percent Dollars Percent
Federal government 4.5 29 5.7 32 5.7 24
Provincial governments 5.8 37 6.6 37 9.3 38
Regional and municipal governments 0.9 6 1.2 7 1.3 6
Private (excluding volunteer time) 4.3 28 4.5 25 6.6c 32
Total 15.5 18.0 23.0
a Based on responses from 55 of the 99 CAS member organizations.b Based on responses from 61 of the 99 CAS member organizations.c Excludes gifts-in-kind for comparative purposes.
64

CPRN survey of AIDS Service Organizations it wasdetermined that, on average, 29 percent of fundsreceived by the organizaitons were attributed to HIV/AIDS prevention and education. Applying this pro-portion to $15 million yields an estimated $4.3million of total private contributions in 1996-97going towards prevention and education.
In general, the survey revealed that more resourceswere spent on direct support for infected personsthan on prevention and education. Respondentsexplained that this was because of the increasing needfor emergency relief for infected people asgovernment-funded support programs experiencebudget decreases, and also because private donorsoften request that their contributions be used tohelp those felt to be in greatest need.
While the expenditures for specific interventionswere not identified, a list of HIV/AIDS preventionand education activities undertaken by communityorganizations was compiled:
• general outreach, as distribution of printed ma-terial and condoms in schools, shopping malls, atpublic events;
• targeted outreach;
• information hot lines;
• training for volunteers and paid service providers;
• resource centres (with books, articles, pamphlets,etc.);
• speakers’ bureaus;
• HIV health promotion;
• individual and group counseling; and
• assistance to researchers and students studyingHIV/AIDS prevention and education.
Table IV-7
Private Contributions to Community-based AIDS Organizations(Unadjusted Dollars – Thousands)
1993-94a 1994-95b 1996-97
United Way 170 160 400
Membership fees 10 120 70
Individual donations 840 970 1,400
Foundations 500 230 300
Corporations 100 130 500
Fundraising events 1,400 1,300 3,300
Other 300 400 700
Value of gifts-in-kind 1,000
Value of volunteer input 7,400
Total 3,320 3,310 15,070
a Based on responses from 48 of the 99 CAS member organizations.b Based on responses from 52 of the 99 CAS member organizations.
65
Canada’s Investment in HIV Prevention

Where prevention and education were undertaken,and with limited resources available, activities weremost often directed at high-risk populations throughtargeted outreach.
4 Discussion
4.1 Canada’s Response
How much should Canada be investing in HIVprevention or how much is enough? This is a some-what simplistic question that would require substan-tial analysis and, in the end, there may not be adefinitive answer. However, we do know thatCanada (like any other country) does not have unlim-ited funds to invest in HIV prevention. Hence a keychallenge is to maximize the benefit available fromlimited HIV prevention resources. This is not to saythat Canada should not invest more in HIV preven-tion. Rather it is a recognition of the need to avert asmany new infections as possible through sound in-vestments in HIV prevention. The financial “howmuch” will be dependent on the prevention needs ofthe populations at risk and the level of the epidemicwithin these populations. The determination of needwill be dependent on information and intelligence
gathered through strategic sentinel surveillance, pre-vention research and timely and targeted preventioninterventions. Staying at the leading edge of theepidemic through an HIV prevention strategypremised on the principles of best practice and cost-effectiveness will not only stem the tide of the epi-demic but will also assist in the stabilization ofprevention expenditures.
Aside from a broad examination of HIV preventionexpenditure relative to incidence and prevalence, theresearch does not include measuring specific out-comes or impacts related to HIV prevention. Instead,the expenditures are viewed as indicating a level ofactivity, just as the percent of GDP attributable toresearch and development is presented as a compar-ative indicator of economic activity at a point intime. Spending on HIV/AIDS prevention and educa-tion therefore represents Canada’s response in thecontext of a certain incidence and prevalence ofHIV/AIDS cases. The epidemiological dynamics ofthe epidemic in Canada represent and define the needfor inter-vention.
Using prevalence and incidence figures developedwith a component modelling technique (described inChapter II), the following profile of HIV/AIDS pre-vention and education expenditures was developed
Table IV-8
Estimated Public Expenditures on HIV Prevention per Prevalent Case, Canada,1992-93 to 1996-97
1992-93 1993-94 1994-95 1995-96 1996-97
Total estimated public sector expenditures on HIV prevention (millions of dollars) 60.5 67.3 72.4 74.8 79.5
HIV prevalence 30,200 31,600 33,200 35,150 38,900
HIV incidence 2,700 3,100 3,400 3,600 4,000
Expenditures per prevalent case (dollars) 2,003 2,130 2,180 2,128 2,044
The Economic Burden of HIV/AIDS in Canada
66

(Table IV-8). Data from the last five years were usedas a sample of the relatively recent response to need,and expenditures per prevalent case were calculated.
In 1996, Canada invested $2.65 per capita or$2,044 per prevalent case in HIV prevention. In thatsame year, the country spent $570 million orabout $15,000 per prevalent case on direct healthcare. The prevention investment per prevalent caseis roughly 14 percent of the direct health carespending for the infected population in 1996. Over afive-year period, expenditures on HIV/AIDS pre-vention and education grew at approximately thesame rate as the number of prevalent cases for theperiod shown. Understandably, the expenditures perprevalent case in 1996-97 compared to 1992-93were similar, with a difference of only $41.
It is quite clear from the incidence estimates thatthe epidemic is gaining momentum again, despite theincreased effort at prevention and education. Hence,although prevention investment matched the growthin the epidemic, the impact was somewhat less effec-tive. This could reflect several possibilities: interven-tions targeted at specific populations may have beenineffective; the interventions may have been deliv-ered too late and a threshold prevalence was reached(i.e., “the horse was out of the barn”); new riskgroups were missed; effective programs were under-funded; or a combination of these factors. While itmay prove useful to engage in a diagnostic exerciseto illuminate these factors, it would be equallyimportant to take interim measures to ensure acloser link to the leading edge of the epidemic asmeans to better control. Is there room for improve-ment? Some very broad international comparisonssuggest that other countries have been more success-ful in epidemic control.
4.2 Canada in an International Context
How do Canadian expenditures on HIV/AIDSprevention and education compare to those of othercountries? Two high-level descriptive indicatorswere chosen for the comparison: expenditures percapita and expenditures per HIV prevalent case. HIV
prevalence as a percent of population is also in-cluded in order to provide more context for the firsttwo indicators relative to the size of the country-specific epidemics.
Using a familiar indicator such as per capita ex-penditures is a first step in an analysis of response toneed. It allows a ready comparison to other expendi-tures from the public purse that are typically pre-sented using the same ratio, such as health care,education, and defence. The indicator gives a senseof the relative funding implications of the differentprograms should this be of interest. Understandingthis and recognizing the limitations, the HIV preven-tion expenditures per prevalent case were alsocompared. This indicator is a better measure of theresponse to need than per capita expenditure.
Public sector data for one year, 1996-97, werecompared to the most readily available data fromthree other developed countries, namely Australia,Great Britain and the United States (Table IV-9).While the portion of U.S. expenditures attributed tostates is a very conservative estimate, it was ac-cepted nonetheless because the U.S. experience, typi-fied by a rapidly growing infection rate among intra-venous drug users and other marginalized people(the third wave of the epidemic), has the potential ofbecoming a Canadian reality.
For the one year, per capita expenditures, expendi-tures per prevalent case, and HIV prevalence per100,000 for Canada and Australia are similar. Onthe other hand, compared to Canada, the UnitedStates spent 37 percent more per capita, 36 percentless per prevalent case, and had over twice theprevalence per 100,000 population.
Great Britain’s performance stands out as theone country that seems to have controlled theepidemic through a strong commitment to HIVprevention and education. It had approximatelyone-third the HIV prevalence and invested 1.9 timesmore per prevalent case than Canada in 1996-97.However, because the epidemic has been better con-trolled, expenditures per capita are 30 percent lowerthan in Canada and half those in the United States.
67
Canada’s Investment in HIV Prevention

This first and limited comparison of Canadian expen-ditures on HIV/AIDS prevention and education en-courages a more detailed study of the strategies ofthese and other developed countries. Other countriesmay be facing the same new set of public healthchallenges as Canada in that if HIV is still spread-ing, it is likely that the characteristics of thepopulations at high risk of contracting it arechanging. A more detailed examination of Britain’sHIV prevention strategy over time would providemore insight into possible key best-practice at-tributes.4
4.3 Is There Room for Improvement?
The quick and simple answer to this question isyes. However, more questions must be asked in orderto delve further into the attributes of best practiceand factors influencing success both in Canada andinternationally.
Do we actually have a national HIV/AIDS strat-egy or do we have disparate strategies across thevarious levels of government and across community-
The Economic Burden of HIV/AIDS in Canada
Table IV-9
Profile of Comparative Expenditures on HIV/AIDS Prevention and Education, 1996-97
Panel A
Total populationa HIV prevalence Estimated public sector expenditures
(Millions) (C$ millions)
CanadaAustraliaUnited StatesGreat Britain
29.9 17.8268.5 58.9
38,900b
19,661c
750,000e
28,447g
79.5 47.3d
975.0f
110.8h
Panel B
HIV prevalenceper 100,000 population
Estimatedper capita expenditure
Estimated expenditureper prevalent case
(C$)
CanadaAustraliaUnited StatesGreat Britain
129109270 48
2.652.643.641.88
2,0442,4071,3003,897
a Populations for Great Britain and Australia based on 1993-94 figures, to which 1993-94 growth rates applied (compounded). OECD, LabourForce Statistics, 1974-94, Paris, 1996.
b Canadian prevalence was based on a components modelling technique (see Chapter II).c HIV infections. Source: Public Health Education Unit, Commonwealth Department of Health and Family Services.d Source: Public Health Education Unit, Commonwealth Department of Health and Family Services. Estimate includes Commonwealth funding,
plus contributions of States and Territories. Australian dollar multiplied by 1.08.e Prevalence estimate taken from Holmberg, S.D. (1996), “The Estimated Prevalence and Incidence of HIV in 96 Large US Metropolitan Areas,”
American Journal of Public Health 86.f Based on US$500 million expenditure by the Center for Disease Control plus a very conservative estimate of state investment of US$250 million.
The total does not include private investment, nor that of the National Institutes of Health. US$ multiplied by 1.3.g HIV infections. From Aggleton, P. (1997), “Success in HIV Prevention,” AVERT, West Sussex, England.h From AIDS Newsletter 1996, 12(1), Section 32, page 7. UK currency multiplied by 2.12.
68

based organizations? Is there duplication of effort?How well are the various HIV prevention strategiesand investments coordinated? Where have we failedand how can we avoid these failures in the future?Where are Canada’s successes and how can wecontinue to build on them? What has contributed toBritain’s relative success in containing the HIV/AIDS epidemic? These represent a sampling of thetypes of questions that could be addressed in movingtowards a best-practice model for Canada’s NationalHIV/AIDS strategy. While it is beyond the scopeof this paper to enter into a best-practice study, itis worthwhile to discuss some initial concepts inorder to stimulate discussion and further thought onthe subject.
The development and implementation of best-practice benchmarks would ideally take place at boththe micro and macro levels. For example, at themacro/national level, structural aspects of best prac-tice would include mechanisms for “gluing” thenational effort together. At the more micro level,best-practice design for the delivery of proven andwell-targeted prevention interventions could be stan-dardized and widely disseminated.
Currently there are some mechanisms in place forthe coordination of the national HIV preventioneffort and the obvious examples are the federal-provincial-territorial committee apparatus, theNational Advisory Committee on AIDS and theAIDS Community Action Program. In terms of bestpractice, these mechanisms might play a moreactive role in creating a more collaborative pre-vention response where funds are pooled anddirected at areas of need in a coordinated fashion.We have determined that both the federal andprovincial governments have made significant in-vestments in community-based AIDS service organi-zations. However, what emerged from this ac-counting exercise was the impression that nojurisdiction had a full understanding of the respec-tive investments at the community level and, to someextent, the combined effort appeared somewhat dis-jointed.
At the more micro or grass roots level, best prac-tice could furnish population-specific interventionsthat work best and delivery structures that maximizethe likelihood of the success of these interventions.
Ultimately, the macro and micro levels have to beiteratively connected. The feedback loops need to beexplicitly acknowledged and implemented throughformal mechanisms and structures. A key example isthe HIV surveillance and prevention linkage as afundamental attribute of best practice. This linkageis crucial, not only in terms of the informationfeedback loops between the two activities, but alsobetween the micro and macro activity levels. Na-tional HIV surveillance is dependent on provincial,regional and community level surveillance. In fact,the epidemiological analysis contained in this paperis based on building estimates from regional andsubpopulation data (i.e., the component model).
Two key challenges or questions surface from thisdiscussion. First, how can the formal linkage be-tween surveillance, prevention programming/designand evaluation be improved in terms of taking ad-vantage of synergistic opportunities, the timelinessof information/analytical exchange and overall crossfertilization of field intelligence and knowledge? Sec-ondly, in terms of the linkage between jurisdictionsor levels of activity, how can micro level surveillancebe better linked to the macro level in order to createa strategic sentinel surveillance system?
Partial answers to these questions are “on ourdoorstep.” For example, the BC Centre forExcellence in HIV/AIDS and AIDS Vancouverhave spearheaded the development of best-practicedesign and delivery of HIV prevention strategies andinterventions. Linking surveillance research such asthe Vancouver Injection Drug User Study with theprevention response and the ongoing evaluation ofboth embodies many best-practice attributes thatshould be more widely disseminated and also form akey input to a broader exercise in this area.
69
Canada’s Investment in HIV Prevention

In terms of the more micro-oriented HIV preven-tion activity, it is difficult to ascertain from thisstudy the degree to which prevention program-ming and delivery are based on proven, effica-cious or evidence-based prevention interventionsand practice. Many prevention strategies and in-terventions are guided by behavioural researchand therefore, to some extent, they are evidencebased. However, a key next step may be to improveupon the timeliness of these interventions in orderto keep our prevention efforts closely tied to theleading edge of the epidemic and, to the extentpossible, create more proactive as opposed to reac-tive responses. This strategy might mitigate “lettingthe horse out of the barn” or, in other words,
enable the fighting of the fire at the burning embersstage.
These important links between macro and microlevel activity within a larger best-practice frameworkinvolving surveillance, prevention, evaluation andresearch are discussed in more detail in Chapter VI.
A key first step has been completed in takinginventory of the national investment in HIV preven-tion in Canada. It has been demonstrated that there isa strong economic incentive to invest in HIV preven-tion and now is the time to improve upon the “bangfor each buck” invested. Indeed, it is the “only gamein town” until the research effort produces a vaccineor cure.
The Economic Burden of HIV/AIDS in Canada
70

Ap
pen
dix
IV
A
DA
TA
CO
LL
EC
TIO
N F
OR
M F
OR
PR
OV
INC
IAL
/TE
RR
ITO
RIA
L A
ND
MU
NIC
IPA
L H
IV P
RE
VE
NT
ION
EX
PE
ND
ITU
RE
S
CP
RN
-HE
AL
TH
CA
NA
DA
HIV
/AID
S E
CO
NO
MIC
RE
SE
AR
CH
INIT
IAT
IVE
Jan
uar
y 16
, 199
7
To
tal $
by
Act
ivit
y19
96-9
719
95-9
619
94-9
519
93-9
419
92-9
319
91-9
219
90-9
119
89-9
019
88-8
919
87-8
819
86-8
7?
1) D
irec
t P
rov.
Go
vt A
ctiv
itie
s *
•Gov
t Sta
ff S
alar
ies
(spe
cific
to H
IVpr
even
tion)
•Mas
s M
edia
•Sch
ool E
duca
tion
•Nee
dle
Exc
hang
e
•Pre
vent
ion
Res
earc
h
•HIV
Tes
ting
(incl
udin
g co
ntra
cted
Lab
serv
ices
)
•Adv
isor
yC
omm
ittee
s
•Hot
Lin
es
•Oth
er
71
Canada’s Investment in HIV Prevention

To
tal $
by
Act
ivit
y19
96-9
719
95-9
619
94-9
519
93-9
419
92-9
319
91-9
219
90-9
119
89-9
019
88-8
919
87-8
819
86-8
7?
2) T
ran
sfer
s to
AS
Os
*
•Pro
ject
s/A
ctiv
ities
•Inf
rast
ruct
ure
3) T
ran
sfer
s to
Pu
blic
Hea
lth
Un
its* •P
roje
cts/
Act
iviti
es
•Inf
rast
ruct
ure
4) O
ther
(In
clu
din
go
ther
dep
ts. -
So
cial
Ser
v., C
orr
ecti
on
s,E
du
cati
on
)
To
tal $
* T
he
pro
ject
fu
nd
ing
fo
r A
SO
s an
d P
ub
lic H
ealt
h U
nit
s (e
.g.,
Nee
dle
Exc
han
ge)
sh
ou
ld n
ot
be
incl
ud
ed in
th
e ca
teg
ori
es f
or
Dir
ect
Pro
vin
cial
Go
vern
men
t ac
tivi
ties
.
The Economic Burden of HIV/AIDS in Canada
72

NAME OF ORGANIZATION:
CPRN-Health Canada HIV/AIDS Economic Research Initiative
QUESTIONNAIRE ON PRIVATE INVESTMENT IN PREVENTION AND EDUCATION
* Please note : All information taken from this questionnaire will remain confidential and will be used toprovide national figures only. In addition to completing the questionnaire, please fax us a copy of yourmost recent annual report.
1.Which of the following was your last completed fiscal year? (Please check one box)
” Jan. 1, 1996 to Dec. 31, 1996” April 1, 1995 to March 31, 1996
” Other (please indicate the period) to ______________________month/day/yr month/day/year
2. Please list the amounts of funding your organization received from the following private sectorsources for your last completed fiscal year:
UNITED WAY $______________________INDIVIDUAL DONATIONS $______________________CORPORATIONS $______________________FOUNDATIONS $______________________MEMBERSHIP FEES $______________________FUNDRAISING EVENTS (net of costs) $______________________OTHER (e.g. sales of publications, conference fees)Please specify:__________________________________$____________________________________________________________________
3. Please assign (if possible) an approximate dollar value to all gifts received in kind (e.g. free printing,equipment donations etc.) from the private sector during your last completed fiscal year:
$______________________
4. Please indicate approximately what percentage of its private sector funding your organization spentin the following areas (including staff salaries) during your last completed fiscal year:
a) Care, treatment and support1 (medication, financial support, counselling and support groups, in-formation on treatments, health care, alternative therapies, etc.) _____ %
1 For the purposes of this study, we are considering care, treatment and support to include all services offered to help
those affected by HIV/AIDS to cope with the illness. Prevention and education would include all services andactivities aimed at preventing the spread of HIV/AIDS. If your organization has a different definition of thesecategories, or does not use them at all, please indicate your definition and/or categories in question 5.
B Questionnaire on Private Investment in Prevention and Education
73
Canada’s Investment in HIV Prevention

b) Prevention and education (outreach, condom distribution, production and/ordistribution of posters and brochures, workshops, information hot-lines etc.) _____ %c) Advocacy (on behalf of individuals and at the government level) _____ %d) Administration (program management, office supplies, office equipment, rent) _____ %e) Other (please indicate)_________________________________________ _____ %
5. How does your organization define and/or organize prevention and education?
6. Out of your administration costs that are covered by private sector funding (see question 4d),approximately what percentage went to supporting prevention and education programs?
_____%
7. Compared to 1993-1994, did your private sector funding during your last completed fiscal year(1995-1996)
” increase” decrease” stay the same” N/A
8. Compared to 1994-1995, did your private sector funding during your last completed fiscal year(1995-1996)
” increase” decrease” stay the same” N/A
9. Please list the amounts of funding your organization received from the following public sector sourcesfor your last completed fiscal year:
FEDERAL GOVERNMENT $______________________PROVINCIAL/TERRITORIAL GOVERNMENT $______________________REGIONAL GOVERNMENT $______________________MUNICIPAL GOVERNMENT $______________________
10.Do you have any comments to make on the role of prevention and education in your organization?
Please fax the completed questionnaire to Vanessa Nicolai at (514) 273-7813 no later than January 20, 1997. If you have any questions about the questionnaire or any problems with fax transmission, pleasecall me at (514) 273-8917. Thank you for your help!
The Economic Burden of HIV/AIDS in Canada
74

Notes
1 118.4 million DM, approximately equivalent toUS$64.3 million in 1987, divided by 61,035,000population in 1987. Based on data from Whitaker’s(World) Almanac, 1987 and 1988.
2 In terms of the timing of the increased transfersfrom provincial governments to community organi-zations, our findings are supported by those in aCPRN study of the Canadian nonprofit sector(Hirshhorn, 1997). Between 1986 and 1992, a pe-riod that approximately matches the time of ourstudy, the growth in provincial government trans-fers to nonprofits was the highest in its history,
jumping from about $4 billion to about $7 billion, a75 percent increase. The federal contributions bycomparison grew from about $1.5 billion to about$2.2 billion in the same period, and local govern-ment transfers stayed constant.
3 Excluded because figures were not available for1994-95.
4 Health Canada has commissioned CPRN under theNational HIV/AIDS Economic Research Initiativeto undertake a detailed international comparisonstudy in this area.
References
Angus, Douglas E. and A. Shariatmadar (1996), “HIVPrevention Strategies: A Review of the Literatureand Experience on Evaluation/Economic Evalua-tion Programs,” Ottawa: Canadian Policy ResearchNetworks, March (draft paper).
Canadian AIDS Society (1996), “CAS Omnibus Survey1995/96,” Ottawa, September.
Foreign and Commonwealth Office (1995), ImprovingBritain’s Health, London, UK.
Health Canada (1996), “AIDS Community ActionProgram, Selected Project Summaries, SupplementaryInformation by Sector of Activity for OperationallyFunded Groups,” Ottawa, July.
Hirshhorn, Ronald (1997), The Emerging Sector: InSearch of a Framework, CPRN Study No. CPRN|01,Ottawa: Canadian Policy Research Networks.
Holtgrave, David R. et al. (1994), “Effectiveness andEfficiency of HIV Prevention Programs: An Overview,”draft manuscript, Atlanta: Center for Disease Con-trol.
Jenke, A. and A.-M. Reinkemeier (1990), “The Cost ofAIDS and HIV Infection: Public Expenditures for AIDSPrevention in the Federal Republic of Germany,” inD. Schwefel et al. (eds.), Economic Aspects of AIDSand HIV Infection, Springer-Verlag.
Kahn, James G. (1996), “The Cost-Effectiveness of HIVPrevention Targeting: How Much More Bang for theBuck?,” American Journal of Public Health 86(12)(December).
Lindquist E. and D. Rayside (1992), “Federal AIDSPolicy for the 1990s: Is It Too Early for‘Mainstreaming’ in Canada?,” How Ottawa Spends:The Politics of Competitiveness 1992-93, Ottawa:Carleton University Press.
Lurie, Peter and Ernest Drucker (1997), “An opportunityLost: HIV Infections Associated with a Lack of aNeedle-Exchange Programme in the USA,” TheLancet 349 (March).
World Health Organization (1994), “Modelling theCosts of HIV Prevention: A Resource RequirementModel for Developing Countries,” Geneva, Septem-ber.
75
Canada’s Investment in HIV Prevention


1 Introduction
Chapter II describes the historical rise of HIV/AIDSin Canada and emphasizes the variation among dif-ferent risk groups. In this chapter we explore theeconomic impact of three scenarios for the futureevolution of the epidemic. The scenarios are ex-ploratory, not forecasts. The complexity and uncer-tainty of the world create a demand for projectionsto counter uncertainty (Jager and van den Boom,1994). There is much about the AIDS epidemic thatis uncertain: prevalence and incidence in differentpopulations, incubation time, infectivity, diseaseprogression, and the social and economic impact.Scenario research provides an alternative to fore-casting in that it takes an integrated view of theimpact of the epidemic under specific assumedconditions drawing on understanding from morethan one discipline (Jager and van den Boom,1994). This chapter uses experts’ opinions fromtwo key informant processes: one of HIV epidemi-ologists and the other of HIV clinicians and scien-tists to develop assumptions about two iportantvariables that will determine the economic impactof the epidemic: the number of new infections incore groups that will drive the epidemic and theeffects of a whole new drug treatment paradigm,HAART, that should extend and improve the livesof the HIV infected.
The epidemiological scenarios presented here aretheoretically plausible. The growth or decay of theepidemic that they capture is consistent with anepidemic that is very dynamic. Recorded high andlow incidences in each population were used tocapture the extremes of where we might actually bein terms of epidemic growth. To promote discussion,scenarios should portray the extremes of situations(Jager and van den Boom, 1994).
All three scenarios are rooted in a 1996 base casemodel incorporating much of the same data used byLCDC, in collaboration with CPRN, to determinethe 1996 HIV incidence and prevalence estimatespresented in Chapter II. Innovations were made tocapture the evolution of the heterosexual epidemicbased on an analysis of its three most importantsubgroups.1 The 1996 estimate for HIV incidence inCanada produced by this model is therefore slightlyhigher than the one presented in Chapter II, but iswithin the same order of magnitude and grounded inthe reality of the present.
The discussion of the scenarios includes nationalinvestment/expenditures in HIV prevention, a keyinput in efforts to control the epidemic to date. Whilethere is no empirical evidence of the causal relation-ship between investment and HIV incidence, invest-ment is an important factor in the baseline scenariofor 1996 as an indicator of prevention activity inthe context of a growing epidemic.
2 Methodology
2.1 Modelling HIV Incidence in Canadato 2001, Three Scenarios:Brief Description of the Model
CPRN, in collaboration with Dr. Robert Remis,2
developed the model to project HIV incidence to2001 in three scenarios. The model takes the form ofan electronic tool developed in spreadsheet format. Ituses the best available data on incidence and the sizeof the population at risk to determine incidence. Themodel is adaptable and as new estimates of incidenceand the size of populations at risk become available,parameters can be quickly changed and the outputwill change accordingly. (The complete parametersand output of the model are included in AppendixV.)
V Scenarios
77

The model uses three basic parameters for cal-culation of HIV incidence:
C estimated size of the populations at risk inCanada’s three largest urban centers: Montreal,Toronto, and Vancouver;
C incidence estimates for each of the risk groups;
C a scaling factor to simulate growth or decay of theepidemic, which takes into account the maturityof the epidemic in each of the three centers in eachof the subpopulations at risk. The scaling factorssimulate three plausible scenarios for the evolu-tion of the epidemic: uncontrolled growth; thestatus quo; and effective control. (The slope ofeach curve for the scaling factors is appended inthe scaling gallery.)
The output for the model is determined bymultiplying the rate of incidence for each sub-population in each regional center by the estimatedsize of the subpopulation at risk. This produces theincidence for 1996. The three scaling factors for thefollowing five years are then applied to the 1996estimate to produce projected incidence underthree different scenarios for the epidemic. Theseprojections by subpopulation and centre are thenextrapolated to the rest of the province based on thedistribution of recent AIDS cases and recent HIV+test results. Extrapolations to the rest of Canada arebased on the distribution of recent AIDS cases.
2.2 Determining the Parameters
A model is only as good as the assumptions onwhich it is based. To collect information on theparameters used to build this model, CPRN partici-pated in two important processes. The first was aDelphi session of Canadian HIV epidemiologistscoordinated by CPRN and held in Montreal onMarch 1, 1997, in which experts pooled their knowl-edge to discuss the dynamic course of the epidemicby risk group in Canada’s three largest urban cen-ters. The second process was led by Dr. Chris
Archibald of LCDC to collect information for theestimation of base case incidence and prevalencepresented in Chapter II. CPRN attended these con-sultations of epidemiologists, researchers, and publichealth specialists, and used this key informant inputin the construction of the model. In addition, whereno Canadian data were available, the literature pro-vided proxy data on comparable American cities.
2.3 Description of Scenarios
Three different scenarios were modelled in thisexercise to capture the potential for HIV epidemicgrowth or decay over the next five years for thefollowing risk groups: MSM, IDU, heterosexualsfrom endemic countries, heterosexuals with contactwith persons from endemic countries, and heterosex-uals with contact with MSM and IDU. Broadlyspeaking, two important factors determine the evolu-tion of the epidemic for each scenario:
1. The historical epidemiology of the epidemic inmajor epidemic centers by risk group – Forexample, is the epidemic in a given city among aspecific group old or relatively new? What is thepotential for epidemic spread based on the size ofthe susceptible population? Montreal’s IDU epi-demic was determined to be older than Toronto’s,for example, and therefore with less potentialfor growth. Is the epidemic close to saturation inthat group? Vancouver’s IDU epidemic wasdeemed to be approaching saturation. Qualitativeinput to answer these questions was collected atthe Delphi session of Canadian HIV epidemiolo-gists coordinated by CPRN and combined withquantitative data on HIV incidence, prevalence,risk group size, etc., to produce the parametersfor the model.
2. The effectiveness of the prevention response incontrolling the growth of the epidemic – Theseare the determinants from which the scenariostake their titles:
The Economic Burden of HIV/AIDS in Canada
78
C Scenario 1: Effective control represents a publichealth goal and opportunity. If prevention inter-ventions were strategic, timely and aggressivelyaimed in the early stage of the epidemic cycle,there exists an opportunity to control epidemicgrowth in centers where the infection rates havenot yet become exponential. In centers where corepopulations have already experienced exponen-tial growth and/or saturation, prevention interven-tions would be aimed at peripheral groups. Forexample, women who have sexual contact withmale IDU. This will require a coordinated, ade-quately resourced prevention response guided by thefour core activities of epidemiology outlined inChapter II, Section 4.5: Epidemiology for HIVPrevention.
C Scenario 2: Status Quo assumes that nothingchanges in our approach to controlling the epi-demic. Infection rates remain constant until thesusceptible populations saturate and the epidemiccurve begins to fall.
C Scenario 3: Uncontrolled is a worst case scenario inwhich prevention efforts fail because they arenot strategic, timely or aggressive. Cities in whichHIV infection rates have remained low or stablegrow to exponential within core groups.
2.4 Calculating Societal Costs
The next step in exploring the economic impact ofthe new infections projected by the model definedabove is to attach the discounted episodic costs.3 Theepisodic direct medical costs imputed from the yearof infection and discounted at a rate of 4 percent for
all three epidemiological scenarios. Costs are calcu-lated for the HAART episode as described in Chap-ter III. Incremental indirect costs are also calculatedfor each scenario.
3 Findings
These exploratory scenarios provide: incidenceestimates for the five years commencing in 1997 andthe direct and indirect costs associated with HIVincidence in each scenario.
3.1 Scenarios of Incidence
In the uncontrolled epidemic growth scenariothere are 29,507 new cases of HIV infection between1997-2001. The status quo produces 19,578 newcases in the same period. Effective control produces13,888 new infections over five years (Table V-1).
Modelling a theoretical saturation point in theIDU epidemic in Vancouver and Montreal has amajor impact on Scenario 2. As a result, the numberof annual infections drops in this scenario althoughincident rates for all other subpopulations in Van-couver, Toronto and Montreal remain stable. Thethree scenarios are represented graphically in ChartV-1 as three potential extensions of the base case in1996.
3.2 Attributing Direct Costs andIndirect Costs to the Scenarios
For the purposes of further analysis and discus-
Table V-1
Number of New Infections Per Year in Canada Based on Three Scenarios
1997 1998 1999 2000 2001 Total
Scenario 1Scenario 2Scenario 3
EffectiveStatus quoUncontrolled
4,4584,4584,458
3,0624,1355,029
2,5453,8875,665
2,1403,6376,638
1,6833,4617,717
13,88819,57829,507
Scenarios
79

sion, a 4 percent discount rate is applied to HAARTdirect costs. The indirect costs associated withmortality were previously discounted by Hanvelt(1994) at 3 percent.
Costs increase or decrease dramatically with fluc-tuations in incidence. Scenario 1, in which the epi-demic is effectively controlled and incidence drops to1,683 infections a year by 2001, generates $2.1billion in direct medical costs over five years (TableV-2). In Scenario 2, the status quo, the epidemic isproducing 3,461 new infections a year and generatingdirect medical costs of almost $3 billion.
4 Discussion
The total direct and indirect costs are presented inthe same table in order to make the order of magni-tude clear. Both costs contribute to the cost estimate
from a societal perspective. The indirect costs re-main the largest portion of the economic burden ofHIV in all three scenarios.
4.1 The Benefits of AchievingEffective Control
There is strong economic rationale for reducingthe number of annual HIV infections in Canada. Thecost savings in direct medical costs alone amount toalmost $900 million over five years. In addition, theinfections avoided permit 5,690 young Canadians tolead productive lives and to contribute to society.These indirect savings amount to $3.4 billion overfive years.
Canada currently spends $83 million a year toprevent the spread of HIV. If spending is held con-stant, this would amount to $415 million over fiveyears. The cost savings in direct medical costs alone
Chart V-1
Historical HIV Incidence in Canada and Three Plausible Scenarios of Infection to 2001
Modelled estimates of plausible incidence
Uncontrolled $22.2 billion
Status quo $14.7 billion
Effective control $10.4 billion
8
6
4
2
1978 1980 1982 1984 1986 1988 1990 1992 1994 1996 2001
Thousands
The Economic Burden of HIV/AIDS in Canada
80

Table V-2
Total and Indirect Costs of Three Scenarios Over Five Years
Epidemiccontrol Direct costs
Percent changefrom SQ
Indirectcosts
Percent changefrom SQ Combined
Percent changefrom SQ
($ billions) ($ billions) ($ billions)
Scenario 1(effective) 2.1 30 8.3 30 10.4 30
Scenario II(status quo) 3.0 – 11.7 – 14.7 –
Scenario III(uncontrolle) 4.5 +50 17.7 +50 22.2 +50
SQ = status quo
made available by achieving effective control are$900 million. Total HIV prevention expenditurescould be increased by $500 million nationally overthe next five years to achieve effective epidemiccontrol and the country would break even in terms ofdirect costs. When indirect costs are included there isa healthy return on this additional investment.
It is difficult to determine how much of an invest-ment is enough at the macro level. Given the
potentially large return on investment, however, itseems that there is a strong economic rationalefor intensive resource allocation to prevent sub-stantial direct and indirect costs to Canadiansociety that are attributable to HIV infection.
Appendix V
The Scenarios Model: Parameters and Output
(See page 82 to page 93.)
81
Scenarios

MSM Projections Lower Upper
MODEL PARAMETERS Point Confidence Confidence
Estimate Limits Limits
Montreal Population@risk 35000 28000 45000HIV prevalence, rate 0.17 0.12 0.24HIV prevalence, number 5950HIV incidence, annual 0.012 0.005 0.025Default scale AExtrap. to Quebec, factor 1.33
Toronto Population@risk 38000 30000 50000HIV prevalence, rate 0.14 0.1 0.2HIV prevalence, number 5320HIV incidence, annual 0.012 0.005 0.025Default scale AExtrap. to Ontario, factor 1.28
Vancouver Population@risk 12000 9000 16000HIV prevalence, rate 0.12 0.08 0.2HIV prevalence, number 1440HIV incidence, annual 0.015 0.005 0.026Default scale AExtrap. to BC, factor 1.27
Canada Extrap. to Canada factor 1.13
PROJECTED HIV INCIDENCE1996 1997 1998 1999 2000 2001
MSM - Montreal Effective control, factor 1 0.85 0.75 0.65 0.5Effective control, infections 420 420 357 315 273 210Status quo, factor 1 1 1 1 1Status quo, infections 420 420 420 420 420 420Uncontrolled, factor 1 1.2 1.4 1.7 2Uncontrolled, infections 420 420 504 588 714 840
MSM - E xtrap. to Quebec Effective control, infections 559 559 475 419 363 279Status quo, infections 559 559 559 559 559 559Uncontrolled, infections 559 559 670 782 950 1117
MSM - Toronto Effective control, factor 1 0.85 0.75 0.65 0.5Effective control, infections 456 456 388 342 296 228Status quo, factor 1 1 1 1 1Status quo, infections 456 456 456 456 456 456Uncontrolled, factor 1 1.2 1.4 1.7 2Uncontrolled, infections 456 456 547 638 775 912
MSM - Extrap. to Ontario Effective control, infections 584 584 497 438 379 292Status quo, infections 584 584 584 584 584 584Uncontrolled, infections 584 584 700 817 992 1167
MSM - Vancouver Effective control, factor 1 0.85 0.75 0.65 0.5Effective control, infections 180 180 153 135 117 90Status quo, factor 1 1 1 1 1Status quo, infections 180 180 180 180 180 180Uncontrolled, factor 1 1.2 1.4 1.7 2Uncontrolled, infections 180 180 216 252 306 360
MSM - Extrap. to BC Effective control, infections 229 229 194 171 149 114Status quo, infections 229 229 229 229 229 229Uncontrolled, infections 229 229 274 320 389 457
Total - Quebec, Ontario, and B.C. Effective control, infections 1372 1372 1166 1028 891 685Status quo, infections 1372 1372 1372 1372 1372 1372Uncontrolled, infections 1372 1372 1644 1919 2331 2741
Extrapolated to Canada Effective control, infections 1550 1550 1318 1162 1007 774Status quo, infections 1550 1550 1550 1550 1550 1550Uncontrolled, infections 1550 1550 1858 2168 2634 3097
The Economic Burden of HIV/AIDS in Canada
82

IDU Projec t ions Lower U p p e r
M O D E L P A R A M E T E R S Point Conf idence Conf idence
Est imate Limits Limits
Montrea l Popula t ion@ risk 11000 6000 18000HIV prevalence, ra te 0 .1 0 .05 0 .18HIV prevalence , number 1100HIV incidence , annual 0 .04 0 .02 0 .06Defaul t scale M IExtrap. to Quebec, factor 1 .32
Toronto Popula t ion@ risk 13000 7000 20000HIV prevalence, ra te 0 .05 0 .03 0 .08HIV prevalence , number 650HIV incidence , annual 0 .012 0 .008 0.03Defaul t scale TIExtrap. to Ontario, factor 1 .58
Vancouver Popula t ion@ risk 8000 4000 13000HIV prevalence, ra te 0 .15 0 .1 0 .23HIV prevalence , number 1200HIV incidence , annual 0 .12 0 .03 0 .19Defaul t scale VIExtrap. to BC factor 1 .33
C a n a d a Extrap. to Canada factor 1 .13
P R O J E C T E D H I V I N C I D E N C E1996 1997 1998 1999 2000 2001
IDU - Mont rea l Effective control, factor 1 0 .85 0 .75 0 .65 0 .5Effective control , infections 440 440 374 330 286 220Status quo, factor 1 0 .95 0 .9 0 .85 0 .8Status quo, infect ions 440 440 418 396 374 352Uncontrol led, factor 1 1 .1 1 .2 1 .35 1 .5Uncontrol led, infect ions 440 440 484 528 594 660
IDU - Ex t rap . to Quebec Effective control , infections 581 581 494 436 378 290Status quo, infect ions 581 581 552 523 494 465Uncontrol led, infect ions 581 581 639 697 784 871
IDU - Toron to Effective control, factor 1 0 .95 0 .85 0 .75 0 .65Effective control , infections 156 156 148.2 132.6 117 101.4Status quo, factor 1 1 1 1 1Status quo, infect ions 156 156 156 156 156 156Uncontrol led, factor 1 1 .9 3 4 .5 6Uncontrol led, infect ions 156 156 296.4 468 702 936
IDU - Extrap . to Ontar io Effective control , infections 246 246 234 210 185 160Status quo, infect ions 246 246 246 246 246 246Uncontrol led, infect ions 246 246 468 739 1109 1479
IDU - Vancouver Effective control, factor 1 0 .3 0 .15 0 .09 0 .07Effective control , infections 960 960 288 144 86.4 67 .2Status quo, factor 1 0 .8 0 .65 0 .5 0 .4Status quo, infect ions 960 960 768 624 480 384Uncontrol led, factor 1 0 .9 0 .8 0 .7 0 .65Uncontrol led, infect ions 960 960 864 768 672 624
IDU - Ex t rap . t o BC Effective control , infections 1277 1277 383 192 115 8 9Status quo, infect ions 1277 1277 1021 830 638 511Uncontrol led, infect ions 1277 1277 1149 1021 894 830
Quebec , Ontar io , BC Effective control , infections 2104 2104 1111 838 678 539Status quo, infect ions 2104 2104 1819 1599 1378 1222Uncontrol led, infect ions 2104 2104 2256 2457 2787 3180
Extrapo la ted to Canada Effective control , infections 2378 2378 1255 947 766 609Status quo, infect ions 2378 2378 2055 1807 1557 1381Uncontrol led, infect ions 2378 2378 2549 2776 3149 3593
83
Scenarios

Hetero. Contact w MSM, IDU Lower Upper
MODEL PARAMETERS Point Confidence Confidence
Estimate Limits Limits
Montreal Population@risk 0 10150 40600HIV prevalence, rate 0.02 0.01 0.04HIV prevalence, number 0HIV incidence, annual 0.003 0.0015 0.006Default scale HMIExtrap. to Quebec factor 1.32
Toronto Population@risk 0 11160 44600HIV prevalence, rate 0.017 0.0085 0.034HIV prevalence, number 0HIV incidence, annual 0.003 0.0015 0.006Default scale HMIExtrap. to Ontario factor 1.46
Vancouver Population@risk #REF! 5900 23700HIV prevalence, rate 0.008 0.004 0.016HIV prevalence, number #REF!HIV incidence, annual 0.002 0.001 0.004Default scale HMIExtrap. to BC factor 1.31
Canada Extrap. to Canada factor 1.13
PROJECTED HIV INCIDENCEHETMSMIDU - Montreal 1996 1997 1998 1999 2000 2001
Effective control, factor 1 0.95 0.85 0.75 0.65Effective control, infections 0 0 0 0 0 0Status quo, factor 1 1 1 1 1Status quo, infections 0 0 0 0 0 0Uncontrolled, factor 1 1.2 1.45 1.8 2.2Uncontrolled, infections 0 0 0 0 0 0
HETMSMIDU - Extrap. to Quebec Effective control, infections 0 0 0 0 0 0Status quo, infections 0 0 0 0 0 0Uncontrolled, infections 0 0 0 0 0 0
HETMSMIDU - Toronto Effective control, factor 1 0.95 0.85 0.75 0.65Effective control, infections 0 0 0 0 0 0Status quo, factor 1 1 1 1 1Status quo, infections 0 0 0 0 0 0Uncontrolled, factor 1 1.2 1.45 1.8 2.2Uncontrolled, infections 0 0 0 0 0 0
HETMSMIDU - Extrap. to Ontario Effective control, infections 0 0 0 0 0 0Status quo, infections 0 0 0 0 0 0Uncontrolled, infections 0 0 0 0 0 0
HETMSMIDU - Vancouver Effective control, factor 1 0.95 0.85 0.75 0.65Effective control, infections 24 24 22.8 20.4 18 15.6Status quo, factor 1 1 1 1 1Status quo, infections 24 24 24 24 24 24Uncontrolled, factor 1 1.2 1.45 1.8 2.2Uncontrolled, infections 24 24 28.8 34.8 43.2 52.8
HETMSMIDU - Extrap. to BC Effective control, infections 31 31 30 27 24 20Status quo, infections 31 31 31 31 31 31Uncontrolled, infections 31 31 38 46 57 69
HETMSMIDU - PQ, Ontario and BC Effective control, infections 210 210 200 179 157 136Status quo, infections 210 210 210 210 210 210Uncontrolled, infections 210 210 252 305 378 481
HETMSMIDU total - Canada Effective control, infections 237 237 226 202 177 154Status quo, infections 237 237 237 237 237 237Uncontrolled, infections 237 237 285 345 427 521
The Economic Burden of HIV/AIDS in Canada
84
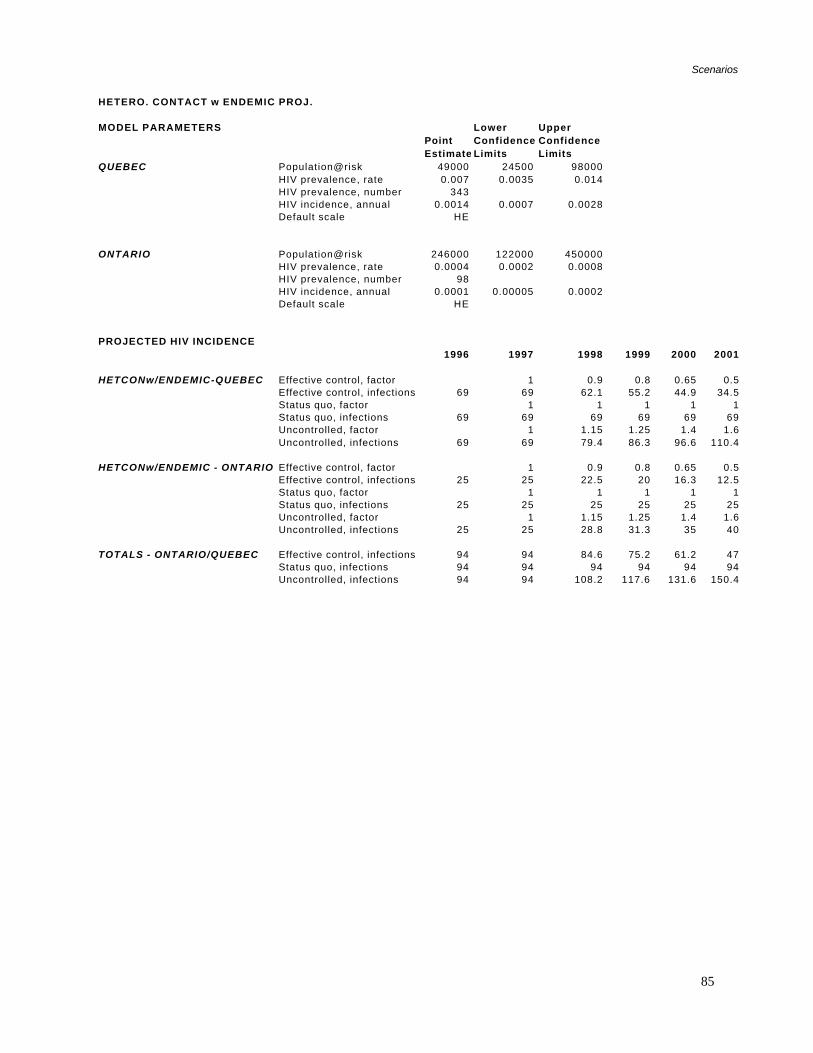
HETERO. CONTACT w ENDEMIC PROJ.
MODEL PARAMETERS Lower UpperPoint Confidence ConfidenceEstimate Limits Limits
QUEBEC Population@risk 49000 24500 98000HIV prevalence, rate 0.007 0.0035 0.014HIV prevalence, number 343HIV incidence, annual 0.0014 0.0007 0.0028Default scale HE
ONTARIO Population@risk 246000 122000 450000HIV prevalence, rate 0.0004 0.0002 0.0008HIV prevalence, number 98HIV incidence, annual 0.0001 0.00005 0.0002Default scale HE
PROJECTED HIV INCIDENCE1996 1997 1998 1999 2000 2001
HETCONw/ENDEMIC-QUEBEC Effective control, factor 1 0.9 0.8 0.65 0.5Effective control, infections 69 69 62.1 55.2 44.9 34.5Status quo, factor 1 1 1 1 1Status quo, infections 69 69 69 69 69 69Uncontrolled, factor 1 1.15 1.25 1.4 1.6Uncontrolled, infections 69 69 79.4 86.3 96.6 110.4
HETCONw/ENDEMIC - ONTARIO Effective control, factor 1 0.9 0.8 0.65 0.5Effective control, infections 25 25 22.5 20 16.3 12.5Status quo, factor 1 1 1 1 1Status quo, infections 25 25 25 25 25 25Uncontrolled, factor 1 1.15 1.25 1.4 1.6Uncontrolled, infections 25 25 28.8 31.3 35 40
TOTALS - ONTARIO/QUEBEC Effective control, infections 94 94 84.6 75.2 61.2 47Status quo, infections 94 94 94 94 94 94Uncontrolled, infections 94 94 108.2 117.6 131.6 150.4
85
Scenarios

HETERO-ENDEMIC PROJECTIONS Lower UpperMODEL PARAMETERS Point Confidence Confidence
Estimate Limits LimitsQUEBEC Population@risk 35000 35000 35000Haitian HIV prevalence, rate 0.03 0.015 0.045
HIV prevalence, number 1050HIV incidence 0.002 0.001 0.003Default scale E
QUEBEC Population@risk 7810 7810 7810Carribean, non-Haitian HIV prevalence, rate 0.0025 0.001 0.005
HIV prevalence, number 20HIV incidence 0.00025 0.00015 0.0004Default scale E
QUEBEC Population@risk 5970 5970 5970African HIV prevalence, rate 0.03 0.02 0.05
HIV prevalence, number 179HIV incidence 0.003 0.0015 0.005Default scale E
Ontario Population@risk 2000 2000 2000Haitian HIV prevalence, rate 0.03 0.015 0.045
HIV prevalence, number 60HIV incidence 0.002 2378 0.003Default scale E 2378
1255947
Ontario Population@risk 198000 766 198000Carribean, non-Haitian HIV prevalence, rate 0.0015 609 0.003
HIV prevalence, number 297HIV incidence 0.00015Default scale E
Ontario Population@risk 40000 40000 40000African HIV prevalence, rate 0.015 0.01 0.025
HIV prevalence, number 600HIV incidence 0.0015 0.0008 0.0025Default scale E
PROJECTED HIV INCIDENCE 1996 1997 1998 1999 2000 2001
HETENDEMIC-QUEBEC Effective control, factor 1 0.9 0.8 0.65 0.5Carribean - Haitian Effective control, infections 70 70 63 56 45.5 35
Status quo, factor 1 1 1 1 1Status quo, infections 70 70 70 70 70 70Uncontrolled, factor 1 1.15 1.3 1.5 1.8
* Uncontrolled, infections 70 70 80.5 91 105 126
'HETENDEMIC-QUEBEC Effective control, factor 1 0.9 0.8 0.65 0.5'Carribean - Non-Haitian Effective control, infections 2 2 1.8 1.6 1.3 1
Status quo, factor 1 1 1 1 1Status quo, infections 2 2 2 2 2 2Uncontrolled, factor 1 1.15 1.3 1.5 1.8Uncontrolled, infections 2 2 2.3 2.6 3 3.6
'HETENDEMIC-QUEBEC Effective control, factor 1 0.9 0.8 0.65 0.5Africa Effective control, infections 18 18 16.2 14.4 11.7 9
Status quo, factor 1 1 1 1 1Status quo, infections 18 18 18 18 18 18Uncontrolled, factor 1 1.15 1.3 1.5 1.8Uncontrolled, infections 18 18 20.7 23.4 27 32.4
QUEBEC TOTALS Effective control, infections 90 90 81 72 58.5 45Status quo, infections 90 90 90 90 90 90Uncontrolled, infections 90 90 103.5 117 135 162
(cont'd)
The Economic Burden of HIV/AIDS in Canada
86

HETERO-ENDEMIC PROJECTIONS (cont'd) 1996 1997 1998 1999 2000 2001
'HETENDEMIC-ONTARIO Effective control, factor 1 0.9 0.8 0.65 0.5Carribean - Haitian Effective control, infections 4 4 3.6 3.2 2.6 2
Status quo, factor 1 1 1 1 1Status quo, infections 4 4 4 4 4 4Uncontrolled, factor 1 1.15 1.3 1.5 1.8Uncontrolled, infections 4 4 4.6 5.2 6 7.2
HETENDEMIC-ONTARIO Effective control, factor 1 0.9 0.8 0.65 0.5'Carribean - Non-Haitian Effective control, infections 30 30 27 24 19.5 15
Status quo, factor 1 1 1 1 1Status quo, infections 30 30 30 30 30 30Uncontrolled, factor 1 1.15 1.3 1.5 1.8Uncontrolled, infections 30 30 34.5 39 45 54
HETENDEMIC-ONTARIO Effective control, factor 1 0.9 0.8 0.65 0.5Africa Effective control, infections 60 60 54 48 39 30
Status quo, factor 1 1 1 1 1Status quo, infections 60 60 60 60 60 60Uncontrolled, factor 1 1.15 1.3 1.5 1.8Uncontrolled, infections 60 60 69 78 90 108
ONTARIO TOTALS Effective control, infections 94 94 84.6 75.2 61.1 47Status quo, infections 94 94 94 94 94 94Uncontrolled, infections 94 94 108.1 122.2 141 169
ONTARIO/QUEBEC TOTALS Effective control, infections 184 184 165.6 147.2 120 92Status quo, infections 184 184 184 184 184 184Uncontrolled, infections 184 184 211.6 239.2 276 331
87
Scenarios

SC
AL
ING
GA
LL
ER
Y
Po
pu
lati
on
@ri
sk
Cit
y o
r
Pro
vin
ceE
pid
emic
Co
ntr
ol
TY
PE
1997
1998
1999
2000
2001
MS
MA
ll C
ities
Effe
ctiv
e co
ntro
l, in
fect
ions
A1
10.
850.
750.
650.
5S
tatu
s qu
o, in
fect
ions
A2
11
11
1U
ncon
trol
led,
infe
ctio
nsA
31
1.2
1.4
1.7
2
IDU
Mon
trea
lE
ffect
ive
cont
rol,
infe
ctio
nsM
I11
0.85
0.75
0.65
0.5
Sta
tus
quo,
infe
ctio
nsM
I21
0.95
0.9
0.85
0.8
Unc
ontr
olle
d, in
fect
ions
MI3
11.
11.
21.
351.
5
Tor
onto
Effe
ctiv
e co
ntro
l, in
fect
ions
TI1
10.
950.
850.
750.
65S
tatu
s qu
o, in
fect
ions
2378
11
11
1U
ncon
trol
led,
infe
ctio
ns23
781
1.9
34.
56
1255 94
776
660
9
Van
couv
erE
ffect
ive
cont
rol,
infe
ctio
nsV
I11
0.3
0.15
0.09
0.07
Sta
tus
quo,
infe
ctio
nsV
I21
0.8
0.65
0.5
0.4
Unc
ontr
olle
d, in
fect
ions
VI3
10.
90.
80.
70.
65
(con
t'd)
Evo
luti
on
, MS
M, C
anad
a
00.
511.
522.
5
1997
1998
1999
2000
2001
Yea
r
Factor (/1997)
Effe
ctiv
e
Sta
tus
quo
Unc
ontr
olle
d
Evo
luti
on
, ID
U, M
on
trea
l
0
0.51
1.52
1997
1998
1999
2000
2001
Yea
r
Factor (/1997)
Effe
ctiv
e
Sta
tus
quo
Unc
ontr
olle
d
Evo
luti
on
, ID
U, T
oro
nto
02468
1997
1998
1999
2000
2001
Yea
r
Factor (/1997)
Effe
ctiv
e
Sta
tus
quo
Unc
ontr
olle
d
Evo
luti
on
, ID
U, V
anco
uve
r
0
0.51
1.5
1997
1998
1999
2000
2001
Yea
r
Factor (/1997)
Effe
ctiv
e
Sta
tus
quo
Unc
ontr
olle
d
The Economic Burden of HIV/AIDS in Canada
88

SC
AL
ING
GA
LL
ER
Y (
con
t'd)
HE
TE
RO
Can
ada
Effe
ctiv
e co
ntro
l, in
fect
ions
HM
I11
0.95
0.85
0.75
0.65
CO
NT
MS
MID
U(A
ll pr
ovin
ces)
Sta
tus
quo,
infe
ctio
nsH
MI2
11
11
1
Unc
ontr
olle
d, in
fect
ions
HM
I31
1.2
1.45
1.8
2.2
EN
DE
MIC
Que
bec
& O
ntar
ioEffe
ctiv
e co
ntro
l, in
fect
ions
E1
10.
90.
80.
650.
5
Sta
tus
quo,
infe
ctio
nsE
21
11
11
Unc
ontr
olle
d, in
fect
ions
E3
11.
151.
31.
51.
8
HE
TE
RO
Que
bec
& O
ntar
ioEffe
ctiv
e co
ntro
l, in
fect
ions
HE
11
0.9
0.8
0.65
0.5
CO
NT
EN
DE
MIC
Sta
tus
quo,
infe
ctio
nsH
E2
11
11
1
Unc
ontr
olle
d, in
fect
ions
HE
31
1.15
1.25
1.4
1.6
Evo
luti
on
, Het
ero
MS
M/ID
U, C
anad
a
0123
1997
1998
1999
2000
2001
Yea
r
Factor (/1997)
Effe
ctiv
e
Sta
tus
quo
Unc
ontr
olle
d
Evo
luti
on
, En
dem
ic, P
Q &
On
tari
o
0
0.51
1.52
1997
1998
1999
2000
2001
Yea
r
Factor (/1997)
Effe
ctiv
e
Sta
tus
quo
Unc
ontr
olle
d
Evo
luti
on
, Het
ero
En
d, P
Q &
On
tari
o
0
0.51
1.52
1997
1998
1999
2000
2001
Yea
r
Factor (/1997)
Effe
ctiv
e
Sta
tus
quo
Unc
ontr
olle
d
89
Scenarios

Can
ada
Su
mm
ary
- E
ffec
tive
Co
ntr
ol
Par
amet
res
HA
AR
T 2
Cos
t$1
52,8
75
Indi
rect
Cos
ts$6
00,0
00H
et c
on
tact
Het
co
nta
ct
MS
MID
UE
nd
emic
MS
M /
IDU
En
dem
icT
ota
lT
ota
l In
cid
ent
Dir
ect
Co
sts
To
tal I
nd
irec
t C
ost
sT
ota
l Dir
ect
& In
dir
ect
Co
sts
$
CA
N
$C
AN
$C
AN
Qu
ebec
1996
559
581
9081
6913
80$2
10,9
67,5
00.0
0$8
28,0
00,0
00.0
0$1
,038
,967
,500
.00
1997
559
581
9081
6913
80$2
10,9
67,5
00.0
0$8
28,0
00,0
00.0
0$1
,038
,967
,500
.00
1998
475
494
8177
62.1
1189
$181
,768
,375
.00
$713
,400
,000
.00
$895
,168
,375
.00
1999
419
436
7269
55.2
1051
$160
,671
,625
.00
$630
,600
,000
.00
$791
,271
,625
.00
2000
363
378
58.5
6044
.990
4$1
38,1
99,0
00.0
0$5
42,4
00,0
00.0
0$6
80,5
99,0
00.0
0
2001
279
290
4552
34.5
701
$107
,165
,375
.00
$420
,600
,000
.00
$527
,765
,375
.00
On
tari
o19
9658
424
694
9825
1047
$160
,060
,125
.00
$628
,200
,000
.00
$788
,260
,125
.00
1997
584
246
9498
2510
47$1
60,0
60,1
25.0
0$6
28,2
00,0
00.0
0$7
88,2
60,1
25.0
0
1998
497
234
84.6
9322
.593
1$1
42,3
26,6
25.0
0$5
58,6
00,0
00.0
0$7
00,9
26,6
25.0
0
1999
438
210
75.2
8320
826
$126
,274
,750
.00
$495
,600
,000
.00
$621
,874
,750
.00
2000
379
185
61.1
7316
.371
4$1
09,1
52,7
50.0
0$4
28,4
00,0
00.0
0$5
37,5
52,7
50.0
0
2001
292
160
4764
12.5
576
$88,
056,
000.
00$3
45,6
00,0
00.0
0$4
33,6
56,0
00.0
0
B.C
.19
9622
912
773.
131
1.6
1542
$235
,733
,250
.00
$925
,200
,000
.00
$1,1
60,9
33,2
50.0
0
1997
229
1277
3.1
311.
615
42$2
35,7
33,2
50.0
0$9
25,2
00,0
00.0
0$1
,160
,933
,250
.00
1998
194
383
2.8
301.
461
1$9
3,40
6,62
5.00
$366
,600
,000
.00
$460
,006
,625
.00
1999
171
192
2.5
271.
339
4$6
0,23
2,75
0.00
$236
,400
,000
.00
$296
,632
,750
.00
2000
149
115
224
129
1$4
4,48
6,62
5.00
$174
,600
,000
.00
$219
,086
,625
.00
2001
114
891.
620
0.8
225
$34,
396,
875.
00$1
35,0
00,0
00.0
0$1
69,3
96,8
75.0
0
Res
t o
f C
anad
a19
9617
827
46.
427
3.3
489
$74,
755,
875.
00$2
93,4
00,0
00.0
0$3
68,1
55,8
75.0
0
1997
178
274
6.4
273.
348
9$7
4,75
5,87
5.00
$293
,400
,000
.00
$368
,155
,875
.00
1998
152
144
5.8
263
331
$50,
601,
625.
00$1
98,6
00,0
00.0
0$2
49,2
01,6
25.0
0
1999
134
109
5.2
232.
627
4$4
1,88
7,75
0.00
$164
,400
,000
.00
$206
,287
,750
.00
2000
116
884.
220
2.1
230
$35,
161,
250.
00$1
38,0
00,0
00.0
0$1
73,1
61,2
50.0
0
2001
8970
3.2
181.
618
2$2
7,82
3,25
0.00
$109
,200
,000
.00
$137
,023
,250
.00
Can
ada
tota
l19
9615
5023
7819
423
799
4458
$681
,516
,750
.00
$2,6
74,8
00,0
00.0
0$3
,356
,316
,750
.00
1997
1550
2378
194
237
9944
58$6
81,5
16,7
50.0
0$2
,674
,800
,000
.00
$3,3
56,3
16,7
50.0
0
1998
1318
1255
174
226
8930
62$4
68,1
03,2
50.0
0$1
,837
,200
,000
.00
$2,3
05,3
03,2
50.0
0
1999
1162
947
155
202
7925
45$3
89,0
66,8
75.0
0$1
,527
,000
,000
.00
$1,9
16,0
66,8
75.0
0
2000
1007
766
126
177
6421
40$3
27,1
52,5
00.0
0$1
,284
,000
,000
.00
$1,6
11,1
52,5
00.0
0
2001
774
609
9715
449
1683
$257
,288
,625
.00
$1,0
09,8
00,0
00.0
0$1
,267
,088
,625
.00
1388
8$2
,123
,128
,000
.00
$8,3
32,8
00,0
00.0
0$1
0,45
5,92
8,00
0.00
To
tal 1
997-
2001
The Economic Burden of HIV/AIDS in Canada
90

Can
ada
Su
mm
ary
and
Inci
den
t C
ost
s -
Sta
tus
qu
o
Par
amet
res
HA
AR
T 2
Cos
t$1
52,8
75
Indi
rect
Cos
ts$6
00,0
00H
et c
on
tact
Het
co
nta
ct
MS
MID
UE
nd
emic
MS
M /
IDU
En
dem
icT
ota
lT
ota
l In
cid
ent
Dir
ect
Co
sts
To
tal I
nd
irec
t C
ost
sT
ota
l Dir
ect
and
Ind
irec
t C
ost
s
$CA
N
$CA
N
$CA
NQ
ueb
ec19
9655
958
190
8169
1380
$210
,967
,500
.00
$828
,000
,000
.00
$1,0
38,9
67,5
00.0
019
9755
958
190
8169
1380
$210
,967
,500
.00
$828
,000
,000
.00
$1,0
38,9
67,5
00.0
0
1998
559
552
9081
6913
51$2
06,5
34,1
25.0
0$8
10,6
00,0
00.0
0$1
,017
,134
,125
.00
1999
559
523
9081
6913
22$2
02,1
00,7
50.0
0$7
93,2
00,0
00.0
0$9
95,3
00,7
50.0
020
0055
949
490
8169
1293
$197
,667
,375
.00
$775
,800
,000
.00
$973
,467
,375
.00
2001
559
465
9081
6912
64$1
93,2
34,0
00.0
0$7
58,4
00,0
00.0
0$9
51,6
34,0
00.0
0
On
tari
o19
9658
424
694
9825
1047
$160
,060
,125
.00
$628
,200
,000
.00
$788
,260
,125
.00
1997
584
246
9498
2510
47$1
60,0
60,1
25.0
0$6
28,2
00,0
00.0
0$7
88,2
60,1
25.0
0
1998
584
246
9498
2510
47$1
60,0
60,1
25.0
0$6
28,2
00,0
00.0
0$7
88,2
60,1
25.0
019
9958
424
694
9825
1047
$160
,060
,125
.00
$628
,200
,000
.00
$788
,260
,125
.00
2000
584
246
9498
2510
47$1
60,0
60,1
25.0
0$6
28,2
00,0
00.0
0$7
88,2
60,1
25.0
020
0158
424
694
9825
1047
$160
,060
,125
.00
$628
,200
,000
.00
$788
,260
,125
.00
B.C
.19
9622
912
773.
131
1.6
1542
$235
,733
,250
.00
$925
,200
,000
.00
$1,1
60,9
33,2
50.0
0
1997
229
1277
3.1
311.
615
42$2
35,7
33,2
50.0
0$9
25,2
00,0
00.0
0$1
,160
,933
,250
.00
1998
229
1021
3.1
311.
612
86$1
96,5
97,2
50.0
0$7
71,6
00,0
00.0
0$9
68,1
97,2
50.0
019
9922
983
03.
131
1.6
1095
$167
,398
,125
.00
$657
,000
,000
.00
$824
,398
,125
.00
2000
229
638
3.1
311.
690
3$1
38,0
46,1
25.0
0$5
41,8
00,0
00.0
0$6
79,8
46,1
25.0
0
2001
229
511
3.1
311.
677
6$1
18,6
31,0
00.0
0$4
65,6
00,0
00.0
0$5
84,2
31,0
00.0
0
Res
t o
f C
anad
a19
9617
823
786.
427
3.3
2593
$396
,404
,875
.00
$1,5
55,8
00,0
00.0
0$1
,952
,204
,875
.00
1997
178
2378
6.4
273.
325
93$3
96,4
04,8
75.0
0$1
,555
,800
,000
.00
$1,9
52,2
04,8
75.0
0
1998
178
1255
6.4
273.
314
70$2
24,7
26,2
50.0
0$8
82,0
00,0
00.0
0$1
,106
,726
,250
.00
1999
178
947
6.4
273.
311
62$1
77,6
40,7
50.0
0$6
97,2
00,0
00.0
0$8
74,8
40,7
50.0
0
2000
178
766
6.4
273.
398
1$1
49,9
70,3
75.0
0$5
88,6
00,0
00.0
0$7
38,5
70,3
75.0
0
2001
178
609
6.4
273.
382
4$1
25,9
69,0
00.0
0$4
94,4
00,0
00.0
0$6
20,3
69,0
00.0
0
Can
ada
tota
l19
9615
5023
7819
423
799
4458
$681
,516
,750
.00
$2,6
74,8
00,0
00.0
0$3
,356
,316
,750
.00
1997
1550
2378
194
237
9944
58$6
81,5
16,7
50.0
0$2
,674
,800
,000
.00
$3,3
56,3
16,7
50.0
019
9815
5020
5519
423
799
4135
$632
,138
,125
.00
$2,4
81,0
00,0
00.0
0$3
,113
,138
,125
.00
1999
1550
1807
194
237
9938
87$5
94,2
25,1
25.0
0$2
,332
,200
,000
.00
$2,9
26,4
25,1
25.0
0
2000
1550
1557
194
237
9936
37$5
56,0
06,3
75.0
0$2
,182
,200
,000
.00
$2,7
38,2
06,3
75.0
020
0115
5013
8119
423
799
3461
$529
,100
,375
.00
$2,0
76,6
00,0
00.0
0$2
,605
,700
,375
.00
1957
8$2
,992
,986
,750
.00
$11,
746,
800,
000.
00$1
4,73
9,78
6,75
0.00
To
tal 1
997-
2001
91
Scenarios

Can
ada
Su
mm
ary
- U
nco
ntr
olle
d
Par
amet
res
HA
AR
T 2
Cos
t$1
52,8
75
Indi
rect
Cos
ts$6
00,0
00H
et c
on
tact
Het
co
nta
ct
MS
MID
UE
nd
emic
MS
M /
IDU
En
dem
icT
ota
lT
ota
l In
cid
ent
Dir
ect
Co
sts
To
tal I
nd
irec
t C
ost
sT
ota
l Dir
ect
and
Ind
irec
t C
ost
s
$C
AN
$C
AN
$C
AN
Qu
ebec
1996
559
581
9081
6913
80$2
10,9
67,5
00.0
0$8
28,0
00,0
00.0
0$1
,038
,967
,500
.00
1997
559
581
9081
6913
80$2
10,9
67,5
00.0
0$8
28,0
00,0
00.0
0$1
,038
,967
,500
.00
1998
670
639
103.
597
79.4
1589
$210
,967
,500
.00
$953
,400
,000
.00
$1,1
64,3
67,5
00.0
0
1999
782
697
117
117
86.3
1799
$242
,918
,375
.00
$1,0
79,4
00,0
00.0
0$1
,322
,318
,375
.00
2000
950
784
135
145
96.6
2111
$322
,719
,125
.00
$1,2
66,6
00,0
00.0
0$1
,589
,319
,125
.00
2001
1117
871
162
177
110.
424
37$3
72,5
56,3
75.0
0$1
,462
,200
,000
.00
$1,8
34,7
56,3
75.0
0
On
tari
o19
9658
424
694
9825
1047
$160
,060
,125
.00
$628
,200
,000
.00
$788
,260
,125
.00
1997
584
246
9498
2510
47$1
60,0
60,1
25.0
0$6
28,2
00,0
00.0
0$7
88,2
60,1
25.0
0
1998
700
468
108.
111
728
.814
22$2
17,3
88,2
50.0
0$8
53,2
00,0
00.0
0$1
,070
,588
,250
.00
1999
817
739
122.
214
231
.318
52$2
83,1
24,5
00.0
0$1
,111
,200
,000
.00
$1,3
94,3
24,5
00.0
0
2000
992
1109
141
176
3524
53$3
75,0
02,3
75.0
0$1
,471
,800
,000
.00
$1,8
46,8
02,3
75.0
0
2001
1167
1479
169.
221
540
3070
$469
,326
,250
.00
$1,8
42,0
00,0
00.0
0$2
,311
,326
,250
.00
B.C
.19
9622
912
773.
131
1.6
1542
$235
,733
,250
.00
$925
,200
,000
.00
$1,1
60,9
33,2
50.0
0
1997
229
1277
3.1
311.
615
42$2
35,7
33,2
50.0
0$9
25,2
00,0
00.0
0$1
,160
,933
,250
.00
1998
274
1149
3.6
381.
814
66$2
24,1
14,7
50.0
0$8
79,6
00,0
00.0
0$1
,103
,714
,750
.00
1999
320
1021
4.1
462
1393
$212
,954
,875
.00
$835
,800
,000
.00
$1,0
48,7
54,8
75.0
0
2000
389
894
4.7
572.
213
47$2
05,9
22,6
25.0
0$8
08,2
00,0
00.0
0$1
,014
,122
,625
.00
2001
457
830
5.6
692.
613
64$2
08,5
21,5
00.0
0$8
18,4
00,0
00.0
0$1
,026
,921
,500
.00
Res
t o
f C
anad
a19
9617
827
46.
427
3.3
489
$74,
755,
875.
00$2
93,4
00,0
00.0
0$3
68,1
55,8
75.0
0
1997
178
274
6.4
273.
348
9$7
4,75
5,87
5.00
$293
,400
,000
.00
$368
,155
,875
.00
1998
214
293
7.4
333.
855
1$8
4,23
4,12
5.00
$330
,600
,000
.00
$414
,834
,125
.00
1999
249
319
8.4
404.
162
1$9
4,93
5,37
5.00
$372
,600
,000
.00
$467
,535
,375
.00
2000
303
362
9.7
494.
672
8$1
11,2
93,0
00.0
0$4
36,8
00,0
00.0
0$5
48,0
93,0
00.0
0
2001
356
413
11.6
605.
384
6$1
29,3
32,2
50.0
0$5
07,6
00,0
00.0
0$6
36,9
32,2
50.0
0
Can
ada
tota
l19
9615
5023
7819
423
799
4458
$681
,516
,750
.00
$2,6
74,8
00,0
00.0
0$3
,356
,316
,750
.00
1997
1550
2378
194
237
9944
58$6
81,5
16,7
50.0
0$2
,674
,800
,000
.00
$3,3
56,3
16,7
50.0
0
1998
1858
2549
223
285
114
5029
$768
,808
,375
.00
$3,0
17,4
00,0
00.0
0$3
,786
,208
,375
.00
1999
2168
2776
252
345
124
5665
$866
,036
,875
.00
$3,3
99,0
00,0
00.0
0$4
,265
,036
,875
.00
2000
2634
3149
290
427
138
6638
$1,0
14,7
84,2
50.0
0$3
,982
,800
,000
.00
$4,9
97,5
84,2
50.0
0
2001
3097
3593
348
521
158
7717
$1,1
79,7
36,3
75.0
0$4
,630
,200
,000
.00
$5,8
09,9
36,3
75.0
0
2950
7$4
,510
,882
,625
.00
$17,
704,
200,
000.
00$2
2,21
5,08
2,62
5.00
To
tal 1
997-
2001
The Economic Burden of HIV/AIDS in Canada
92

93
Scenarios
Co
sts
Sav
ing
sE
ffec
tive
Co
ntr
ol v
s.E
ffec
tive
vs.
Sta
tus
Qu
o U
nco
ntr
olle
d
To
tal I
nci
den
tT
ota
l In
cid
ent
To
tal I
nci
den
t D
irec
tT
ota
l In
cid
ent
To
tal I
nci
den
tT
ota
l In
cid
ent
Dir
ect
Dir
ect
Co
sts
Sav
ing
s In
dir
ect
Co
sts
Sav
ing
s&
Ind
irec
t C
ost
s S
avin
gs
Dir
ect
Co
sts
Sav
ing
s In
dir
ect
Co
sts
Sav
ing
s &
Ind
irec
t C
ost
s S
avin
gs
Can
ada
tota
l19
96C
$0C
$0C
$0C
$0C
$0C
$0
1997
C$0
C$0
C$0
C$0
C$0
C$0
1998
C$1
64,0
34,8
75C
$643
,800
,000
C$8
07,8
34,8
75C
$300
,705
,125
C$1
,180
,200
,000
C$1
,480
,905
,125
1999
C$2
05,1
58,2
50C
$805
,200
,000
C$1
,010
,358
,250
C$4
76,9
70,0
00C
$1,8
72,0
00,0
00C
$2,3
48,9
70,0
00
2000
C$2
28,8
53,8
75C
$898
,200
,000
C$1
,127
,053
,875
C$6
87,6
31,7
50C
$2,6
98,8
00,0
00C
$3,3
86,4
31,7
50
2001
C$2
71,8
11,7
50C
$1,0
66,8
00,0
00C
$1,3
38,6
11,7
50C
$922
,447
,750
C$3
,620
,400
,000
C$4
,542
,847
,750
To
tal S
avin
gs
C$8
69,8
58,7
50C
$3,4
14,0
00,0
00C
$4,2
83,8
58,7
50C
$2,3
87,7
54,6
25C
$9,3
71,4
00,0
00C
$11,
759,
154,
625
Co
sts
Sav
ing
sS
tatu
s Q
uo
vs
Un
con
tro
lled T
ota
l In
cid
ent
To
tal I
nci
den
tT
ota
l In
cid
ent
Dir
ect
Dir
ect
Co
sts
Sav
ing
s In
dir
ect
Co
sts
Sav
ing
s&
Ind
irec
t C
ost
s S
avin
gs
Can
ada
tota
l19
96C
$0C
$0C
$0
1997
C$0
C$0
C$0
1998
C$1
36,6
70,2
50C
$536
,400
,000
C$6
73,0
70,2
50
1999
C$2
71,8
11,7
50C
$1,0
66,8
00,0
00C
$1,3
38,6
11,7
50
2000
C$4
58,7
77,8
75C
$1,8
00,6
00,0
00C
$2,2
59,3
77,8
75
2001
C$6
50,6
36,0
00C
$2,5
53,6
00,0
00C
$3,2
04,2
36,0
00
To
tal S
avin
gs
C$1
,517
,895
,875
C$5
,957
,400
,000
C$7
,475
,295
,875

1 The three most important subgroups, which consti-tute most heterosexual HIV infections are: hetero-sexuals from endemic countries; heterosexuals withcontact with persons from endemic countries, andheterosexuals with contact with MSM or IDU.
2 Dr. Remis is Associate Professor, Department ofPreventive Medicine, University of Toronto. He has
worked and published extensively on HIV epidemi-ology in Canada with a special focus on Quebec andmore recently Ontario.
3 In effect, we have created five new incident cohorts,each assigned discounted costs of a full episode.
Notes
Hanvelt, Robin A. et al. (1994), “Indirect Costs ofHIV/AIDS Mortality in Canada,” AIDS 8(10).
Jager, J. C. and M. L. G. van den Boom (1994),“Scenario Analysis, Health Policy, and Decision
Making,” in Edward H. Kaplan and Margaret L.Brandeau (eds.), Modelling the AIDS Epidemic: Plan-ning, Policy, Prediction, New York: Raven Press.
References
94
The Economic Burden of HIV/AIDS in Canada

Introduction
Seven years ago the report card on the HIV/AIDSepidemic would have been impressive. Preventioninvestments of the 1980s were paying off, and thetide of the epidemic was subsiding. HIV incidenceamong gay men dropped to half of the 1985 peakincidence and remained fairly flat from 1987 to1990.
Since 1990, the epidemic has gained ground pri-marily through a shift into younger and moremarginalized populations comprised of injectiondrug users (IDU), Aboriginals, women and younggay men. The spread in the IDU risk group was intheory predictable, a research paper in the journalPublic Health Reports in 1988 warned of the“underrecognized potential for a rapid increase ininfection ... and a silent explosion of infection amongIV drug abusers could occur long before a rise in IVdrug-associated AIDS cases became evident”(Dondero et al., 1988). The increase in incidenceamong young gay men came as a surprise to many.Both groups have two things in common –marginalization and high risk of contracting HIV.Both groups also represent avenues for the spread ofHIV into other populations. The prevention needs ofboth groups were probably addressed too late asevident in the higher levels of incidence reported inthis study.
There are lessons to be learned from the lostground in the fight against the HIV/AIDS epidemicand there can be far-reaching consequences to notacting or not acting appropriately. The design of athird national AIDS strategy offers an opportunity toavoid old pitfalls and move towards a truly inte-grated strategy that is based on the principles of bestpractice and upstream endeavours. It will be criticalto improve upon surveillance in order to provide for
pre-emptive strikes at the leading edge of the epi-demic. The key message: surveillance and preventionmust be as dynamic as the epidemic itself.
Key Findings
The new methods of research used in the Na-tional HIV/AIDS Economic Research Initiative co-ordinated by CPRN have produced a solid base ofevidence to support decisions in the next phase of theNational AIDS Strategy. Much more will be addedonce the findings of all the projects commissioned byHealth Canada in this initiative are completed in theSpring of 1998. In the meantime, the main findingsare the following:
1. New Trends in the Epidemic
The epidemic has increased: HIV is on the riseagain and infection is spreading in moremarginalized and younger populations. The me-dian age of infection is now 23 and many youngCanadians are becoming infected in their teens(LCDC, 1996). HIV prevalence is at an all timehigh – almost 40,000 people living with HIV/AIDS and the annual number of new infections(incidence) has risen by 33 percent over the pastfive years from 2,700 to 4,000 (Remis, 1997).Most of this increase (86 percent) stems from theinjection drug user and young gay men popula-tions. There is also evidence of an increase amongAboriginals and women.
2. New Populations Affected
The epidemic is spreading to new populations –drug users, Aboriginal people, young gay men,and vulnerable women – people who live at themargins of society. They are hard to reach and
VI Policy Implications
95

challenge current techniques for monitoring andfor preventing the spread of the epidemic. Inshort, the epidemic has become more complex.
3. Economic Burden Is Significant
The economic burden is rising significantlybecause the number of cases is increasing, thepeople infected are living longer, and new thera-pies are more expensive. The lifetime costs oftreating someone living with HIV infection are$153,000. The total tab to date amounts to some$36 billion or about $1,200 per Canadian citizen.Between 1997 and 2001, financial savings in theorder of $4 billion are available in moving fromthe status quo to more effective epidemic control.More importantly, if the epidemic shifts from thestatus quo to becoming uncontrolled, the costincreases are estimated to be some $7.5 billionover this five-year period.
4. Productivity Losses and the New Therapies
To the extent that the new therapies permitpeople living with HIV to return to normal pat-terns of living, the economic burden – in terms oflost productivity and participation in society – isreduced. If HAART treatment increases the pe-riod of productive life for those people living withHIV/AIDS by 15 percent, the savings in indirectcosts will cover the increased costs of treatment.1
These indirect costs of HIV/AIDS far outweighthe costs of care and treatment, and prevention.
5. Economic Burden and the Prevention Response
There is a strong economic incentive for invest-ment in HIV prevention and education. Canadainvested over $80 million in HIV preventionand education in 1996. Of the $60 millioninvested by the provinces, territories and munici-palities, roughly 29 percent was transferred tocommunity-based AIDS service organizations. Atthe federal level, Health Canada invested roughly52 percent of its total HIV prevention and educa-tion funds at the community-based level. Canada
invested roughly $2,044 per person living withHIV compared to $3,897 in Britain and $1,300 inthe United States.
6. Canada in an International Context
Control of an HIV epidemic is not just a pipedream. Britain, for example, has made a solid,ongoing commitment to prevention over time. Itspends much more per prevalent case on preven-tion than does Canada, but the result seems to bea much smaller epidemic – 48 people living withHIV/AIDS per 100,000 population compared to129 per 100,000 in Canada. Success in prevent-ing infections reduces total investment in care andtreatment, as well as the suffering and productiv-ity losses when relatively young people die.
The United States provides the opposite example.Its investments in prevention and education perprevalent case are less than Canada’s, and theepidemic there is twice the size of Canada’s, at270 per 100,000 population.
Investing in well-targeted prevention interventionsthat have strong links to a well-structured surveil-lance network could contribute to achieving effec-tive epidemic control and savings in the order ofsome $4 billion over the next five years. Upfrontinvestments in HIV prevention are required toachieve this potential pay back.
These findings lead to two sets of conclusionsthat are highly relevant to the National AIDSStrategy, which will begin in 1998-99. Thatstrategy will have to include initiatives with respectto clinical research and the ongoing care and treat-ment of people with HIV, in order to build theknowledge base required to find the cure and im-prove care. But, if Canada is to regain control of theHIV epidemic, it will have to move on two fronts.
C First, the National Strategy must significantlyimprove the techniques for monitoring an epi-demic that is largely hidden from view.
The Economic Burden of HIV/AIDS in Canada
96

C Second, the National Strategy must give a muchhigher priority (in money and leadership) toneeds-based investment in prevention andeducation, targeting the marginalized populationsthat are now so vulnerable to infection.
In both cases, governments, communities, andsociety are confronting the complex challenge ofreaching out to people living on the margins ofsociety. For the most part, these are people who donot hear or read the messages from mainstreamsociety, and when they do, they reject these mes-sages out of distrust or a sense of hopelessness.
The Policy Context
Sometimes it feels like this. There I am standing bythe shore of a swiftly flowing river and I hear thecry of a drowning man. So I jump into the river,put my arms around him, pull him to shore andapply artificial respiration. Just when he begins tobreathe, there is another cry for help. So I jumpinto the river, reach him, pull him to shore, applyartificial respiration, and then just as he begins tobreathe, another cry for help. So back into theriver again, reaching, pulling, applying, breathingand then another yell. Again and again, withoutend, goes the sequence. You know, I am so busyjumping in, pulling them to shore, applying artifi-cial respiration, that I have no time to see who thehell is upstream pushing them all in (McKinlay,1990).
Canadian society has experienced substantialsocio-economic change over the last five to sevenyears. The combination of new technologies andglobal competition has polarized the labour marketinto good jobs and bad jobs, and cutbacks in thesocial safety net have pushed more people to themargins of society (Betcherman and Lowe, 1997;Maxwell, 1996). In general, there are fewer socialbuffers and the bridges to a better life are lacking formany.
Canadians are alarmed at this polarization – forcinggovernments to give a higher priority to addressingchild poverty and youth unemployment, for example.
The current challenges in containing the HIV/AIDSepidemic are very much tied to poverty and lack ofhope among marginalized groups in society – espe-cially vulnerable women and young people. The riskof becoming HIV infected is only one of several risksto “well-being” for this disenfranchised population,which faces risks such as addiction, homelessness, un-employment, violence, crime, and so on.
The links between socio-economic status andhealth are more than a matter of ideology and specu-lation. Research from Manitoba has demonstratedthat those regions whose residents were in thepoorest health score the most poorly on indicatorsof socio-economic risk (Cohen and MacWilliam,1995). Low dwelling value; unemployment at allages; lack of high school completion at all ages; andfemale-headed single-parent families all increase therisk of poor health. The residents of these regionshave good access to health care. Much of the varia-tion in health status can be explained by a fewsocio-economic factors (Mustard and Frohlich,1995).
Socio-economic indicators are also predictiveof risk for infectious disease including HIV infection.An investigation into the behaviour of HIV-negativegay men identified that risk takers were both youngerand had lower incomes than non-risk takers in thestudy (Hogg et al., 1993). In Quebec, HIV-infectedmothers reside in regions with revenue indexes belowthe Quebec provincial median (Hankins et al., 1990).Within the HIV-infected population, socio-economicstatus prior to infection is a predictor of the rate ofdisease progression and survival (Schecter et al.,1994; Hogg et al., 1994). For example, HIV-positivegay men with incomes less than $10,000 annuallyexpe-rienced significant weight loss, as apre-AIDS defining condition, significantly fasterthan their richer counterparts (Voight, 1994). Inshort, scoring poorly on indicators of socio-economic risk has not only put subpopulations atgreater risk for HIV infection but can also acceleratethe rate at which these individuals will become sickand die after infection.
Policy Implications
97

Success in controlling the current wave of theepidemic will have to focus on all the social andeconomic factors that determine the health of thesesubpopulations. The ideal policy framework willrequire an integrated approach by a large number ofgovernment agencies (across agencies and acrossjurisdictions) and community-based organizations.Better coordination would mitigate situations wheresome government departments develop policies thatconfound the efforts of others. A prime example isthe tension between the criminal justice system anddepartments of health with respect to injection druguse. Needle exchange programs are directed at re-ducing the risk of HIV transmission among drugusers. Because the use of these needles to inject illicitdrugs is a criminal offence, law enforcement officerssometimes pursue clients of needle exchange pro-grams, often driving them away from a risk reduc-tion service.2
A first step towards a new strategy for HIV/AIDSwill be to better understand the organizational barri-ers to implementing population health. As GregStoddart (1996) says, “New policy partnershipsand coalitions will need to be developed.” He goeson to point out that departments apply their knowl-edge of the determinants of health “vertically” totheir own policy sector and thereby miss the horizon-tal linkages needed for effective policy.
The Federal-Provincial-Territorial (FPT) Com-mittee apparatus functioning under the Conferenceof Ministers of Health has served as a coordinatingmechanism for health issues within the ambit ofdepartments of health (some of which also deal withsocial and community services). The problem is,however, that population health issues like HIV/AIDS are not and cannot be the sole responsibility ofministries of health. Thus the FPT Advisory Com-mittee on HIV/AIDS should include representativesfrom justice, housing, education and employment, at aminimum.
The role of governments is in setting the policyframeworks, monitoring progress and funding anddelivering both treatment and prevention. But inter-ventions on the ground critically depend on commu-
nity organizations. Community interventions havebeen shown to be highly effective at reaching peopleat high risk of becoming HIV infected. Most of theseorganizations emerged as the gay community mobi-lized to deal with the first and second waves of theepidemic in the 1980s. They have been remarkablyeffective in looking after their own, but if they aregoing to remain at the leading edge, they will have tofind ways to serve the injection drug users, the youth,the poor women and Aboriginal people who arecaught in the third wave of the epidemic. Govern-ments must monitor the response of the existingAIDS service organizations and determine whetherand where they need to promote the development ofnew community-based infrastructures to reach themost vulnerable population groups.
New Surveillance NetworksAre Needed
Clearly, there is a critical need to stay as closeas possible to the leading edge of this elusive epi-demic. What best practices can be defined and oper-ationalized to assist in this effort? One possibilitylies in the development of a formal and strategicnational sentinel surveillance system (i.e., an earlywarning system). Sentinel is defined as “a personstationed to keep watch and guard against surpriseattack” (Gage Canadian Dictionary, 1983).
Surveillance is currently performed at the na-tional, provincial and regional levels through sev-eral mechanisms and techniques.3 While much infor-mation and intelligence is shared, it is not done in asystematic nor integrated fashion. Dondero et al.(1988) note that,
For monitoring the levels and trends of a conditionsuch as HIV infection, which is not routinely orcompletely ascertained, quality information col-lected under standardized conditions in a limitednumber of places is preferable to information col-lected haphazardly everywhere.
Examples of sentinels relevant to the currentepidemic in Canada would include: select hospitals,
The Economic Burden of HIV/AIDS in Canada
98

women’s health clinics, addiction treatment centres,homeless shelters, food banks and free-meal loca-tions, needle exchange programs, physician HIVpractices, Aboriginal reserves, prisons and HIV test-ing sites. As well, monitoring the results of otherrelated HIV studies would contribute further to stay-ing at the leading edge of the epidemic. For example,two studies currently underway through the NationalHIV/AIDS Economic Research Initiative have dis-covered striking insights into the level of the epi-demic in the Aboriginal community.4 Studies follow-ing cohorts of risk populations would also be consid-ered key sentinels. It is critical to note that surveil-lance should respect the well-established privacy,confidentiality and human rights policies in Canada.
Many of the necessary sentinel sites currentlyexist but are not formally integrated into a strate-gic national surveillance framework. Ultimately, thisorganized series of sentinel sites would form a net-work to support highly effective surveillance thatwill inform decisions about timely and well-targetedprevention policies, programs and interventions.Creating this network should be a primary goal forthe next phase of the national AIDS strategy.
HIV Prevention:The Need for Best Practices
Greg Stoddart (1996) has observed that
Specific policies, however, come not from frame-works but from evidence about which interven-tions work well for different targets and in differ-ent groups. At this level of detail, our knowledgeof effective interventions appears to lag behind ourknowledge of determinants.
As far as HIV prevention interventions are con-cerned, knowledge of effectiveness is very limited.The HIV/AIDS epidemic has pushed the limits ofexisting capacity to respond and, at times, it isnecessary to move quickly based on very little infor-mation and evidence. Hence prevention practice hasadvanced much faster than the evaluation researchsurrounding these practices. Governments have a
responsibility to invest on two fronts: preventionprograms and research that will shed light on whatprograms work best and why, and what does notwork and why.
The main objective now is to identify the principalattributes of best practice in order to ensure that theresources available for HIV prevention will be usedto maximize the number of infections averted.
Best practice should occur within a surveillance-response-evaluation cycle (see the figure on BestPractice) responding to the dynamics of the epi-demic. Surveillance intelligence can inform the pre-vention response and allow for the design and deliv-ery of timely interventions before “the horse is out ofthe barn.” It will allow for the location and contain-ment of the “burning embers” of the epidemic so thatit does not flare up into a raging and uncontrollableforest fire. The best-practice model shows that forhigh-risk populations, the number of infections pre-vented is maximized when prevention is targetedearly or at a time of low HIV prevalence in thepopulation in question (Kahn, 1996).
There is an urgent need to identify best practicesin targeting prevention programs at the hard-to-reachpopulations who are most vulnerable to this epi-demic. Governments and community organizationsneed to know what are the optimal methods, designsand structures for delivering and supporting HIVprevention services. Much can be learned from thesuccess in prevention programs that persuaded gaymen to change their behaviours in the 1980s, fromthe rich experiences developed by the AIDS serviceorganizations that sprang up in every major commu-nity across the country during the 1980s, and frominternational successes. In many cases, these sameorganizations may be well placed to reach one ormore of these groups: young gay men, drug users,street people, Aboriginal people and vulnerablewomen. In other cases, however, it may be necessaryto foster the development of new kinds ofcommunity-based organizations to reach thesegroups.
99
Policy Implications

The Economic Burden of HIV/AIDS in Canada
Prev
entio
n
Surv
eilla
nce
and
epid
emio
logy
Eva
luat
ionB
est
Pra
ctic
e
Lea
ding
edg
eof
epi
dem
ic
100

At the same time, the lessons learned frompopulation health literature suggest that many of themost successful interventions will be at the“community level”:
A community-level intervention is an interventionorganized to modify the entire community throughcommunity organization and activation, as distinctfrom interventions that are simply community-based, which may attempt to modify individualbehaviours. (Patrick and Wickizer, 1995, cited inLomas, 1997.)
The distinction between community-level andcommunity-based is important. It is clear that thefirst-order buffers against HIV infection are a safehome, a job, and an education. When young peoplelack those buffers, they drift to the streets, and beginto engage in risky behaviours. The second-orderbuffers, then, are likely to be youth-service supportsthat offer safe housing, mentoring, drug addictionprograms, a chance to get into a training program,complete their education, and/or to find a job. Whileindividual community organizations can and do offerone or more of these buffers, it will take acommunity-level commitment to ensure that youngpeople drifting to the streets are aware that suchoptions exist and are encouraged to try them out.
The third-order buffers are the programs aimed atpeople who have already committed to risky be-haviours in terms of drug use and sexual activity.These programs are aimed at harm reduction, butthey do not in any way alter the tendency to takerisks in the first place: they offer clean needles todrug users and condoms to those who engage in riskysexual activity.
Health Canada has commissioned CPRN to un-dertake a number of economic research projects onprevention interventions to be completed in thespring of 1998. These projects will add to the limitedexisting knowledge base, but they are only the firststage of an intensive effort to think through the bestways to target vulnerable groups and to begin toestablish best practices.
At this early stage, the major steps to include in
the prevention segment of the National AIDS Strat-egy are:
1. A commitment to build careful evaluation into allprevention programs, so that the successful onesare emphasized and the ones that do not work areeliminated. In addition, the key factors leading tosuccess should be well documented and publi-cized so that they will shape the design of preven-tion programs across all jurisdictions and alltypes of government agencies.
2. A commitment to open up a dialogue with all thehealth and social service agencies that under-stand, have access to, and are likely to encounterthe vulnerable groups, in order to discover howbest to mobilize their resources to prevent thespread of HIV infection.
3. A commitment to explore with existing AIDSservice organizations, many of which have a his-torical connection to the gay community, thedegree to which they are able to use their existinginfrastructure to serve the needs of the new targetgroups.
4. A commitment to work with youth-servingagencies in all types of government departmentsat all levels of government to think through thekinds of community-level strategies that wouldoffer young people drifting to the streets alterna-tives to life on the margins. What many of themneed most is hope – a chance to escape marginal-ization.
Concluding Comments
The economic analysis presented in this reportshows that Canada has once again lost effectivecontrol of the HIV/AIDS epidemic, that the directhealth care costs (excluding indirect costs) of theepidemic are already in the range of $570 million ayear, and that the leading edge of the epidemic islargely hidden from view. Nevertheless, there is goodreason to hope that the epidemic can be controlled.To regain control, it will be essential to do three
101
Policy Implications

things: 1) make an unwavering commitment tobetter surveillance through a formal network ofsentinel observers; 2) give a much higher priorityto prevention and education that is rooted in bestpractice; and 3) ensure a close linkage betweensurveillance and the prevention response.
HIV infection is a life-shattering event – wher-ever it hits. In its new metamorphosis, the epidemicattacks, for the most part, young people who are
already feeling down and out. As long as the epi-demic thrives among these marginalized people,there is a risk that it will spread to others who arealso marginalized and, through them, to those in themainstream. There is, as yet, no cure and theepidemic remains a current and long-term threatto the well-being of Canadian society and to thesustainability of its health care system. But this is adisease that is preventable – one hundred percentpreventable.
The Economic Burden of HIV/AIDS in Canada
Notes
1 Physicians participating in the clinical Delphi ses-sion convened by CPRN for the purposes of thisstudy suggested that, based on their initial experi-ence with HAART, about 20 percent of their patientpopulation would become well enough to return towork.
2 As well, governments are reluctant to embrace inno-vative prevention approaches such as the creation ofcontrolled injection centres (sometimes referred toas shooting galleries), which would ensure saferinjection practices. These are difficult decisions thatoften boil down to choosing “the lesser of two evils.”
3 For example, HIV testing centres provide data for
surveillance. Back-calculation is a technique thatuses AIDS data to provide insights into the histori-cal directions of the epidemic.
4 Dr. Robin Hanvelt and his research team at theBC Centre for Excellence in HIV/AIDS recruited asignificant cohort of Aboriginals to the CommunityHealth Resource Project in Vancouver. Dr. PhilipJacobs and his research team (located at theStreetworks Program in Edmonton) conducted in-terviews from the back of a needle exchange vanand discovered that two-thirds of those interviewedwere Aboriginal.
Betcherman, Gordon and Graham S. Lowe (1997), TheFuture of Work in Canada – A Synthesis Report,Ottawa: Canadian Policy Research Networks Inc.
Cohen, Marsha M. and Leonard MacWilliam (1995),“Measuring the Health of the Population,” MedicalCare 33(12) (Supplement, December): DS21-DS42.
Dondero, Timothy J. et al. (1988), “Monitoring theLevels and Trends of HIV Infection: The Public
Health Service’s HIV Surveillance Program,” PublicHealth Reports 103(3):213-20.
Hankins, Catherine et al. (1990), “HIV Infection amongQuebec Women Giving Birth to Live Infants,”Journal of the Canadian Medical Association 143(9).
Hogg, R. et al. (1993), “Sociodemographic Correlatesfor Risk-taking Behaviour among HIV SeronegativeMen,” Canadian Journal of Public Health 84(6).
References
102

——— (1994), Lower Socioeconomic Status andShorter Survival Following HIV Infection, Vancou-ver: BC Centre for Excellence in HIV/AIDS.
Kahn, James G. (1996), “The Cost-Effectiveness of HIVPrevention Targeting: How Much More Bang for theBuck?,” American Journal of Public Health 86(12):1709-12.
Laboratory Centre for Disease Control (LCDC)(1996), Epi Update, Bureau of HIV/AIDS andSTD, Health Protection Branch, Ottawa: HealthCanada.
Maxwell, Judith (1996), Social Dimensions of EconomicGrowth, The Eric Hanson Memorial Lecture Series,Volume VIII, Department of Economics, Edmonton:University of Alberta.
McKinlay, John B. (1990), “A Case for RefocussingUpstream: The Political Economy of Illness,” inP. Conrad and R. Kern (eds.), The Sociology ofHealth and Illness: Critical Perspectives, 3rd edi-tion, New York: St. Martins Press.
Mustard, Cameron A. and Norman Frohlich (1995),“Socioeconomic Status and the Health of the Popula-tion,” Medical Care 33(12) (Supplement, December):DS43-DS54.
Patrick, D. L. and T. M. Wickizer (1995), “Communityand Health,” in Amick B. C. et al. (eds.), Societyand Health, New York: Oxford University Press.Cited in Jonathon Lomas (1997), Social Capital andHealth: Implications for Public Health and Epi-demiology, Working Paper 97-6, Centre for HealthEconomics and Policy Analysis, Hamilton: McMasterUniversity.
Remis, Robert (1997), “Modelled Estimates of thePlausible Limits of HIV Incidence and Prevalence:1978-1996,” developed in collaboration with CPRNfor inclusion in The Economic Burden of HIV/AIDSin Canada (unpublished).
Schecter, Martin T. et al. (1994), “Higher Socioeco-nomic Status Is Associated with Slower Progressionof HIV Infection Independent of Access to HealthCare,” Journal of Clinical Epidemiology 47:59-67.
Stoddart, Greg L. (1996), The Challenge of ProducingHealth in Modern Economics, Working Paper No.46, CIAR Program in Population Health, Toronto:The Canadian Institute for Advanced Research.
Voight, Robert (1994), Socioeconomic CharacteristicsAre Associated with Rate of Weight Loss in Homo-sexual Men, Vancouver: BC Centre for Excellence inHIV/AIDS.
103
Policy Implications

CPRN projects are funded by a mix of federal, provincial, foundation and corporate sponsors.
CPRN Core Funders
! Canadian International Development Agency! Citizenship and Immigration! Environment Canada! Fisheries and Oceans! Health Canada! Human Resources Development Canada! Public Works and Government Services Canada (1998-2000)! Transport Canada
CPRN Funding Sponsor
! The Royal Bank of Canada
CPRN Funding Supporters
! Hongkong Bank of Canada! IPSCO Inc.! The Mutual Group! NOVA Corporation! Power Corporation of Canada! Scotiabank! Sun Life Assurance Company of Canada! The Toronto-Dominion Bank
Health Network Sponsor
• Max Bell Foundation
Project Funder
• Health Canada
CPRN Funding Sources