The Economic Benefits of the Possum Control Area Programme
77
The Economic Benefits of the Possum Control Area Programme Glen Greer Research Report No. 282 May 2006
-
Upload
lincoln-nz -
Category
Documents
-
view
4 -
download
0
Transcript of The Economic Benefits of the Possum Control Area Programme
�������������� ����
���������������
����The Economic Benefits of the Possum Control Area Programme Glen Greer
Research Report No. 282May 2006
Research to improve decisions and outcomes in agribusiness, resource, environmental, and social issues.
The Agribusiness and Economics Research Unit (AERU) operates from Lincoln University providing research expertise for a wide range of organisations. AERU research focuses on agribusiness, resource, environment, and social issues. Founded as the Agricultural Economics Research Unit in 1962 the AERU has evolved to become an independent, major source of business and economic research expertise.
The Agribusiness and Economics Research Unit (AERU) has five main areas of focus.
These areas are trade and environment; economic development; business and sustainability, non-market valuation, and social research. Research clients include Government Departments, both within New Zealand and from other countries, international agencies, New Zealand companies and organisations, individuals and farmers. Two publication series are supported from the AERU Research Reports and Discussion Papers.
DISCLAIMER While every effort has been made to ensure that the information herein is accurate, the AERU does not accept any liability for error of fact or opinion which may be present, nor for the consequences of any decision based on this information. A summary of AERU Research Reports, beginning with #235, are available at the AERU website http://www.lincoln.ac.nz/aeru Printed copies of AERU Research Reports are available from the Secretary. Information contained in AERU Research Reports may be reproduced, providing credit is given and a copy of the reproduced text is sent to the AERU.
The Economic Benefits of the Possum Control Area Programme
Glen Greer
May 2006
Research Report No. 282
Agribusiness & Economics Research Unit PO Box 84
Lincoln University Canterbury
New Zealand Ph: (64) (3) 325-2811 Fax: (64) (3) 325 3847
http://www.lincoln.ac.nz/aeru
ISSN 1170-7682 ISBN 0-909042-68-3

Contents
List of Tables ........................................................................................................ i
List of Figures..................................................................................................... iii
Acknowledgements...............................................................................................v
Executive Summary .......................................................................................... vii
Chapter 1 Introduction......................................................................................1
1.1 Background to the study .............................................................................................1 1.2 Study methodology .....................................................................................................2 1.3 Hawke’s Bay agricultural, horticultural and forestry production ...............................2
Chapter 2 Literature Review ............................................................................5
2.1 Production values........................................................................................................5 2.1.1 Impacts of possums on agricultural and horticultural production ......................5 2.1.2 The impacts of possums on commercial forestry production .............................6 2.1.3 Damage to the honey industry ............................................................................7 2.1.4 Damage to the tourism industry..........................................................................8
2.2 Possums and disease ...................................................................................................8 2.2.1 Possums and bovine tuberculosis........................................................................8 2.2.2 Possums and other zoonoses...............................................................................9
2.3 Possums and conservation values .............................................................................10 2.3.1 Native vegetation ..............................................................................................10 2.3.2 Native fauna ......................................................................................................11 2.3.3 Possums and erosion control.............................................................................12
Chapter 3 The Focus Groups..........................................................................15
3.1 Structure and organisation of the focus groups.........................................................15 3.2 Motivation to join the PCA programme ...................................................................16 3.3 Impacts of the PCA programme ...............................................................................16 3.4 Satisfaction with the PCA programme .....................................................................18 3.5 Operational issues .....................................................................................................18
3.5.1 Re-infestation from uncontrolled areas.............................................................18 3.5.2 Communication.................................................................................................19 3.5.3 Contractors........................................................................................................20 3.5.4 Monitoring ........................................................................................................20 3.5.5 Relationship with HBRC ..................................................................................20
3.6 The future..................................................................................................................21
Chapter 4 The Farmer Survey .......................................................................23
4.1 Survey methodology .................................................................................................23 4.2 Response rate ............................................................................................................23 4.3 Initial and current attitudes to the PCA programme .................................................24 4.4 Production losses before implementation of the programme ...................................26
4.4.1 Pasture...............................................................................................................26 4.4.2 Erosion control plantings ..................................................................................26 4.4.3 Feed and other crops .........................................................................................27
4.5 Impacts of the PCA programme ...............................................................................27 4.5.1 Most important impacts of the PCA programme..............................................28 4.5.2 Impacts on production values ...........................................................................29
4.6 Maintenance control under the PCA programme .....................................................29 4.6.1 Undertaking maintenance control .....................................................................29 4.6.2 Costs of maintenance control............................................................................31 4.6.3 Possum numbers before the PCA programme..................................................32
4.7 The operation of the PCA programme......................................................................32 4.7.1 Satisfaction levels with the PCA programme ...................................................32 4.7.2 Information provision .......................................................................................32 4.7.2 Information provision .......................................................................................33 4.7.3 Service provision by HBRC Biosecurity Advisory Team ................................33 4.7.4 Programme management ..................................................................................33
Chapter 5 Economic Analysis .........................................................................35
5.1 Possum density before the PCA programme ............................................................35 5.2 Production losses ......................................................................................................37 5.3 Farm level economic costs and benefits ...................................................................38
5.3.1 Increased net value of production .....................................................................38 5.3.2 Cost of possum control .....................................................................................38 5.3.2 Net financial impact..........................................................................................39
5.4 Regional Economic Benefits.....................................................................................39
Chapter 6 Discussion and Conclusions ..........................................................43
References ...........................................................................................................47
Appendix 1: The Postal Questionaire ..............................................................53
i
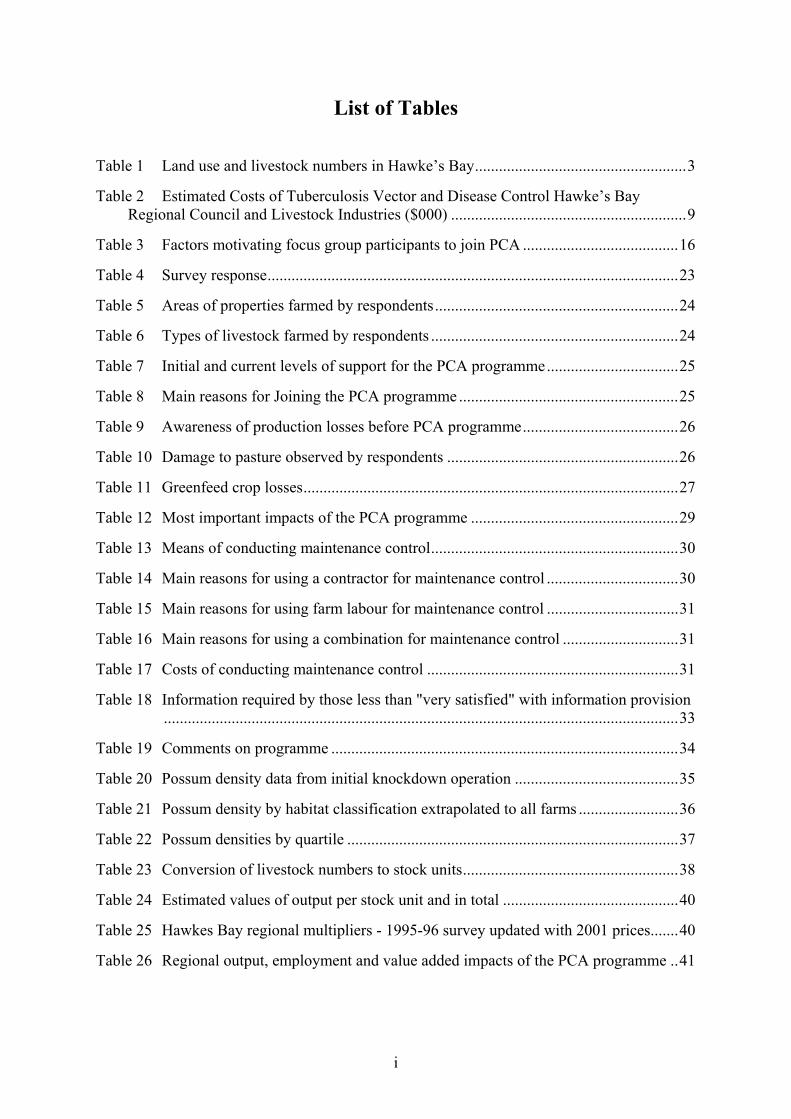
List of Tables Table 1 Land use and livestock numbers in Hawke’s Bay.....................................................3
Table 2 Estimated Costs of Tuberculosis Vector and Disease Control Hawke’s Bay Regional Council and Livestock Industries ($000) ...........................................................9
Table 3 Factors motivating focus group participants to join PCA .......................................16
Table 4 Survey response.......................................................................................................23
Table 5 Areas of properties farmed by respondents.............................................................24
Table 6 Types of livestock farmed by respondents ..............................................................24
Table 7 Initial and current levels of support for the PCA programme.................................25
Table 8 Main reasons for Joining the PCA programme .......................................................25
Table 9 Awareness of production losses before PCA programme.......................................26
Table 10 Damage to pasture observed by respondents ..........................................................26
Table 11 Greenfeed crop losses..............................................................................................27
Table 12 Most important impacts of the PCA programme ....................................................29
Table 13 Means of conducting maintenance control..............................................................30
Table 14 Main reasons for using a contractor for maintenance control .................................30
Table 15 Main reasons for using farm labour for maintenance control .................................31
Table 16 Main reasons for using a combination for maintenance control .............................31
Table 17 Costs of conducting maintenance control ...............................................................31
Table 18 Information required by those less than "very satisfied" with information provision .................................................................................................................................33
Table 19 Comments on programme .......................................................................................34
Table 20 Possum density data from initial knockdown operation .........................................35
Table 21 Possum density by habitat classification extrapolated to all farms .........................36
Table 22 Possum densities by quartile ...................................................................................37
Table 23 Conversion of livestock numbers to stock units......................................................38
Table 24 Estimated values of output per stock unit and in total ............................................40
Table 25 Hawkes Bay regional multipliers - 1995-96 survey updated with 2001 prices.......40
Table 26 Regional output, employment and value added impacts of the PCA programme ..41

ii
iii
List of Figures Figure 1 Extent to which expectations have been met...........................................................27
Figure 2 Value for money......................................................................................................28
Figure 3 Satisfaction with aspects of the PCA programme ...................................................32
Figure 4 Possum density per hectare by proportion of farms and area..................................36
Figure 5 Changing product prices and the relativity between ...............................................39

iv
v
Acknowledgements The author is grateful for the assistance of the HBRC Biosecurity Advisory Team members for their prompt responses to a host of enquiries, and willing assistance with organisational issues. Anita Wreford of the AERU helped to facilitate the focus groups and her insight was of considerable value. The study could not have been undertaken without the cooperation of the farmers in the Hawke’s Bay Possum Control Area programme. The assistance of those who completed surveys, and particularly those who attended focus groups and participated in personal interviews, was very much appreciated.

vi
vii
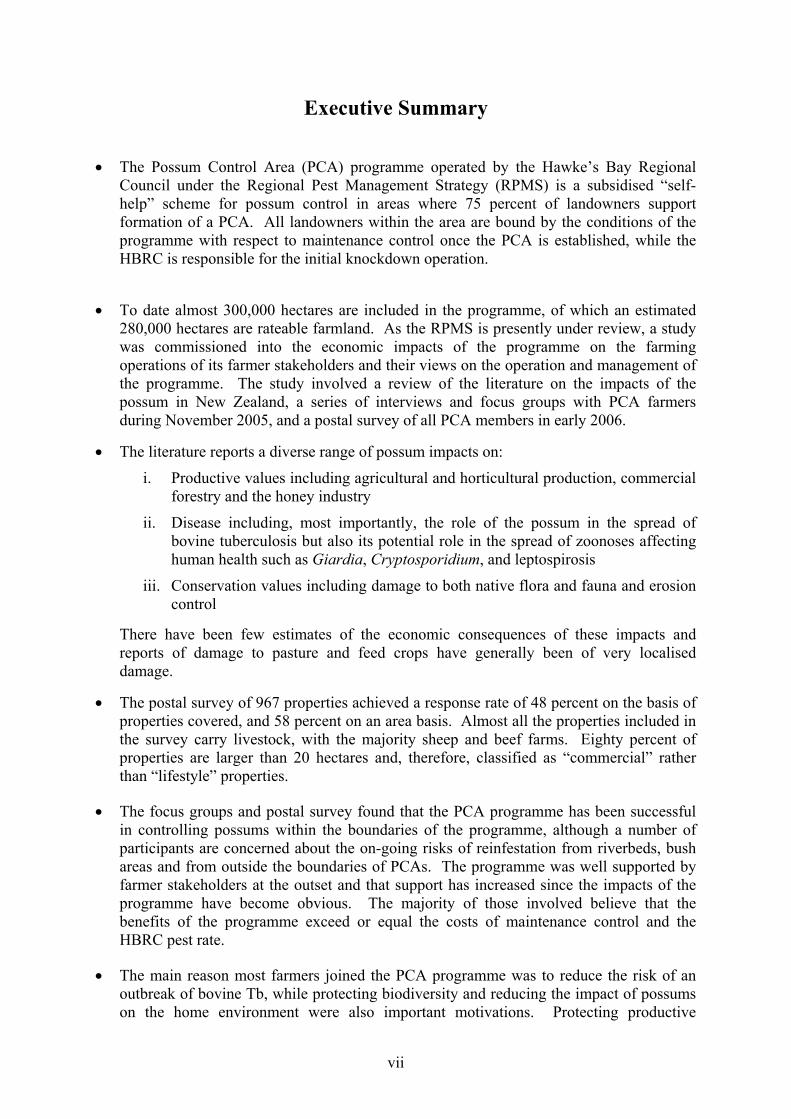
Executive Summary • The Possum Control Area (PCA) programme operated by the Hawke’s Bay Regional
Council under the Regional Pest Management Strategy (RPMS) is a subsidised “self-help” scheme for possum control in areas where 75 percent of landowners support formation of a PCA. All landowners within the area are bound by the conditions of the programme with respect to maintenance control once the PCA is established, while the HBRC is responsible for the initial knockdown operation.
• To date almost 300,000 hectares are included in the programme, of which an estimated 280,000 hectares are rateable farmland. As the RPMS is presently under review, a study was commissioned into the economic impacts of the programme on the farming operations of its farmer stakeholders and their views on the operation and management of the programme. The study involved a review of the literature on the impacts of the possum in New Zealand, a series of interviews and focus groups with PCA farmers during November 2005, and a postal survey of all PCA members in early 2006.
• The literature reports a diverse range of possum impacts on:
i. Productive values including agricultural and horticultural production, commercial forestry and the honey industry
ii. Disease including, most importantly, the role of the possum in the spread of bovine tuberculosis but also its potential role in the spread of zoonoses affecting human health such as Giardia, Cryptosporidium, and leptospirosis
iii. Conservation values including damage to both native flora and fauna and erosion control
There have been few estimates of the economic consequences of these impacts and reports of damage to pasture and feed crops have generally been of very localised damage.
• The postal survey of 967 properties achieved a response rate of 48 percent on the basis of properties covered, and 58 percent on an area basis. Almost all the properties included in the survey carry livestock, with the majority sheep and beef farms. Eighty percent of properties are larger than 20 hectares and, therefore, classified as “commercial” rather than “lifestyle” properties.
• The focus groups and postal survey found that the PCA programme has been successful in controlling possums within the boundaries of the programme, although a number of participants are concerned about the on-going risks of reinfestation from riverbeds, bush areas and from outside the boundaries of PCAs. The programme was well supported by farmer stakeholders at the outset and that support has increased since the impacts of the programme have become obvious. The majority of those involved believe that the benefits of the programme exceed or equal the costs of maintenance control and the HBRC pest rate.
• The main reason most farmers joined the PCA programme was to reduce the risk of an outbreak of bovine Tb, while protecting biodiversity and reducing the impact of possums on the home environment were also important motivations. Protecting productive
viii
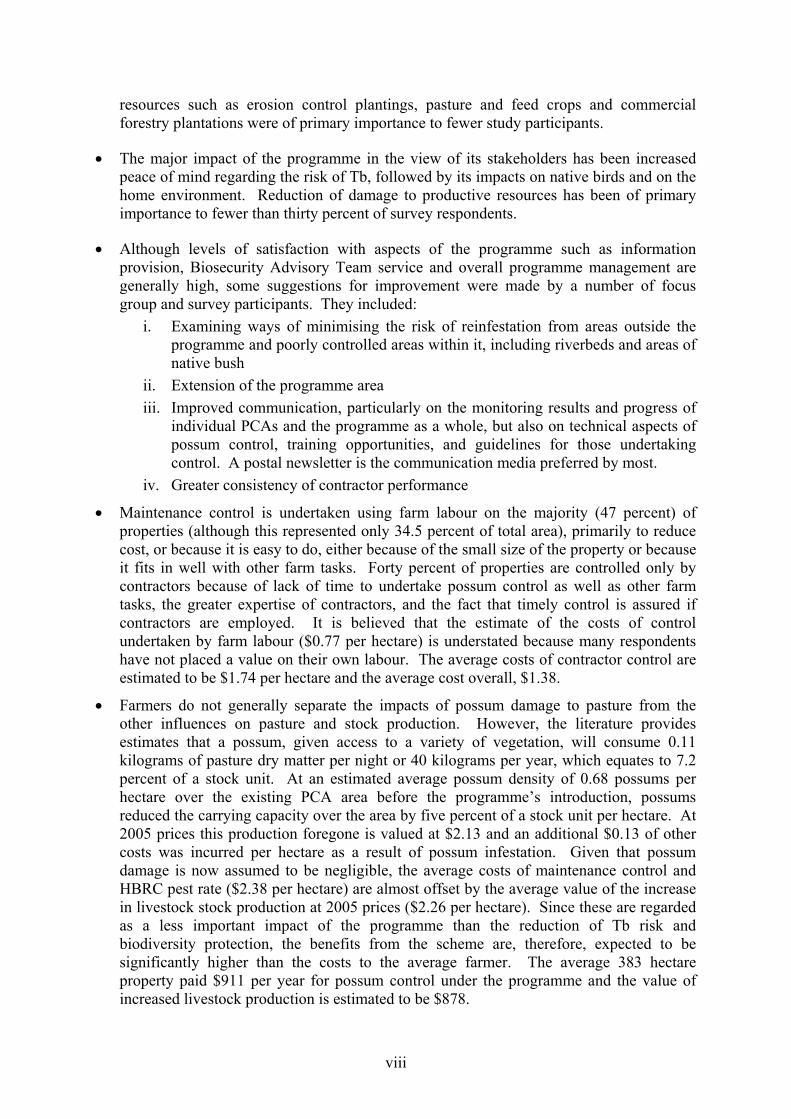
resources such as erosion control plantings, pasture and feed crops and commercial forestry plantations were of primary importance to fewer study participants.
• The major impact of the programme in the view of its stakeholders has been increased peace of mind regarding the risk of Tb, followed by its impacts on native birds and on the home environment. Reduction of damage to productive resources has been of primary importance to fewer than thirty percent of survey respondents.
• Although levels of satisfaction with aspects of the programme such as information provision, Biosecurity Advisory Team service and overall programme management are generally high, some suggestions for improvement were made by a number of focus group and survey participants. They included:
i. Examining ways of minimising the risk of reinfestation from areas outside the programme and poorly controlled areas within it, including riverbeds and areas of native bush
ii. Extension of the programme area iii. Improved communication, particularly on the monitoring results and progress of
individual PCAs and the programme as a whole, but also on technical aspects of possum control, training opportunities, and guidelines for those undertaking control. A postal newsletter is the communication media preferred by most.
iv. Greater consistency of contractor performance
• Maintenance control is undertaken using farm labour on the majority (47 percent) of properties (although this represented only 34.5 percent of total area), primarily to reduce cost, or because it is easy to do, either because of the small size of the property or because it fits in well with other farm tasks. Forty percent of properties are controlled only by contractors because of lack of time to undertake possum control as well as other farm tasks, the greater expertise of contractors, and the fact that timely control is assured if contractors are employed. It is believed that the estimate of the costs of control undertaken by farm labour ($0.77 per hectare) is understated because many respondents have not placed a value on their own labour. The average costs of contractor control are estimated to be $1.74 per hectare and the average cost overall, $1.38.
• Farmers do not generally separate the impacts of possum damage to pasture from the other influences on pasture and stock production. However, the literature provides estimates that a possum, given access to a variety of vegetation, will consume 0.11 kilograms of pasture dry matter per night or 40 kilograms per year, which equates to 7.2 percent of a stock unit. At an estimated average possum density of 0.68 possums per hectare over the existing PCA area before the programme’s introduction, possums reduced the carrying capacity over the area by five percent of a stock unit per hectare. At 2005 prices this production foregone is valued at $2.13 and an additional $0.13 of other costs was incurred per hectare as a result of possum infestation. Given that possum damage is now assumed to be negligible, the average costs of maintenance control and HBRC pest rate ($2.38 per hectare) are almost offset by the average value of the increase in livestock stock production at 2005 prices ($2.26 per hectare). Since these are regarded as a less important impact of the programme than the reduction of Tb risk and biodiversity protection, the benefits from the scheme are, therefore, expected to be significantly higher than the costs to the average farmer. The average 383 hectare property paid $911 per year for possum control under the programme and the value of increased livestock production is estimated to be $878.

ix
• The regional estimate of the total value of increased output as a result of the PCA programme at the farmgate is approximately $1.3 million per annum. Estimated downstream economic impacts, as a result of increased economic output from industries supplying the agricultural sector and of increased consumer spending, contribute between $700,000 and $800,000 per annum to a total regional value of increased output of the order of two million dollars per year. This value excludes the value of the reduction in the risk of bovine tuberculosis and the biodiversity benefits of possum control.

x
1
Chapter 1 Introduction
1.1 Background to the study
Possums are deemed to be the most significant animal pest in the Hawke’s Bay, spreading bovine tuberculosis, destroying native bush, damaging agricultural and horticultural crops and, through pasture consumption, reducing pastoral productivity. Their control is the major focus of the animal pest control programme operated by the Hawke’s Bay Regional Council (HBRC). An objective of the Hawke’s Bay Regional Animal Pest and Plant Pest Management Strategy (RPMS) is that “by 30 June 2006 possum control measures will be operating over 500,000 hectares of land, ensuring that possum density on that land is below 5 percent trap catch” (HBRC, 2001).
A major initiative set up to achieve that objective has been the establishment of Possum Control Areas (PCAs), in areas where the occupiers of at least 75 percent of the land area have agreed to maintain low possum densities on their properties. PCAs must lie within clearly defined boundaries such as rivers, streams, roads, ridgelines or legal boundaries, to help reduce the level of possum reinvasion, and should be at least 500 hectares in area.
If an Animal Health Board possum control programme is withdrawn from an area, and insufficient support exists for a PCA, HBRC will direct land occupiers to maintain possum densities at or below five percent residual trap catch using powers granted under Section 122 of the Biosecurity Act (1993) (HBRC, 2001).
Under the programme, a PCA is established when support has been gained from occupiers of 75 percent of land. The HBRC then arranges, and pays, for contractors to carry out initial possum control operations that reduce numbers to below three percent residual trap catch (fewer than three possums are caught for every hundred traps set on one night). The costs of initial control on land owned by the Department of Conservation are recovered from the Department, and commercial forestry companies whose land is included in a PCA are directed to carry out initial control work at their own expense.
After the initial control operations have been conducted, landowners are required to maintain possum numbers on their land to below five percent residual trap catch at their own expense, but the Regional Council provides subsidised pest control products and bait stations. Monitoring on a random basis, or if complaints are received about high possum numbers on specific properties, is undertaken by Regional Council staff, who then work with landowners on whose properties the five percent threshold is exceeded to develop better control programmes.
Since 2001/02 almost 300,000 hectares of land, primarily rateable farmland, have been incorporated into PCAs and the costs of initial control and subsidies on pest control products and bait stations incurred by HBRC have been $6.8 million since that time (Campbell Leckie, HBRC, pers. comm.). As the Regional Pest Management Strategy under which the PCA programme operates is to be reviewed in 2006, HBRC needs to evaluate the costs and benefits of the programme. However, as the costs of possum damage have not been well documented, and some of the reports of damage have been conflicting, HBRC commissioned the AERU at Lincoln University to undertake research into the losses incurred by Hawke’s Bay farmers as a result of possum damage. The specific objectives of the study were to:
2
• Assess the current 300,000 hectares of land under the PCA by land use and the likely impact of possums on this area.
• To review the literature to assess the negative impacts of possums by type of agricultural and forestry land use
• To quantitatively assess benefits associated with the PCA by type of land use within the 300,000 hectares
• To review other potential benefits from possum control, including increased biodiversity; increased tourism; and reduced risks of disease and restricted market access.
1.2 Study methodology
The study comprised four main stages. The first was a review of the literature relating to possum damage, with particular emphasis on studies that attempted to place an economic value on the losses attributable to possum damage in New Zealand. In the second stage four interviews and three focus groups were conducted in PCA areas throughout the Hawke’s Bay region during November 2005. The purpose of these was to gain understanding of the approaches by which farmers themselves are evaluating the success of the PCA programme. This was required in order to facilitate design of a questionnaire to be sent to all PCA farmers to obtain the information required for a cost-benefit analysis of the programme. In addition, a range of issues related to the PCA programme and other pest issues in the region was examined during the focus groups in greater detail than is possible in by means of postal survey. The results of the focus group discussions are described in Section 3.
In January 2006 a postal survey of 967 PCA farmers was carried out (questionnaire included as Appendix 1) to obtain quantitative data on issues identified during the focus groups, and information held by HBRC on possum densities and areas of each category of possum habitat in the region was obtained and analysed. In total 423 valid responses covering 464 properties were received, a response rate of 48 percent (58 percent on an area basis). The results of the survey analysis are presented in Section 4.
The final stage of the research involved integration of the information obtained directly from farmers, from HBRC and from previous studies to carry out an economic analysis of the PCA programme, which is discussed in Section 5.
1.3 Hawke’s Bay agricultural, horticultural and forestry production
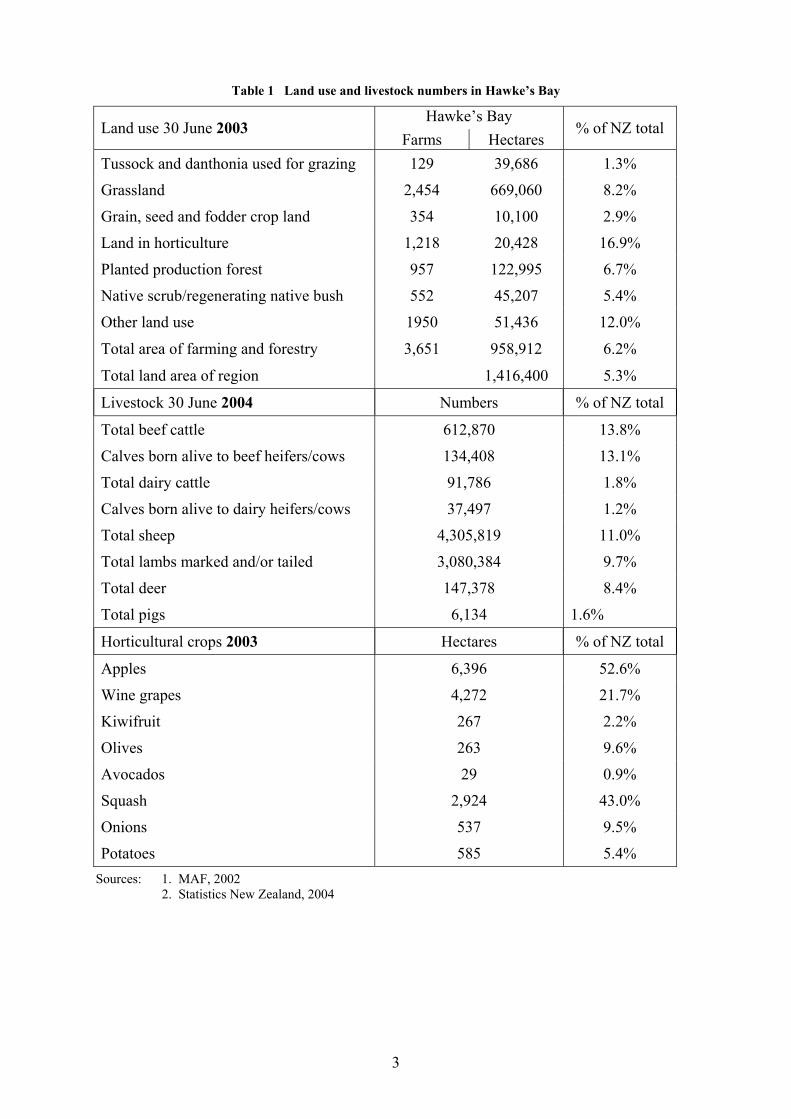
The dominant industries in the Hawke’s Bay region are pastoral farming (primarily sheep and beef farming), horticulture (particularly apple and squash growing), viticulture and forestry, as well as the downstream food processing industries. The primary production and related processing and manufacturing industries account for approximately 40 percent of GDP and employment in the region (Vision 2020, 2002). Hawke’s Bay is New Zealand’s largest producer of apples and squash, the second largest producer of wine grapes, and grazes the third largest number of beef cattle of all regions and the fifth highest number of sheep. The most recent statistics on land use and livestock numbers are summarised in Table 1.
3
Table 1 Land use and livestock numbers in Hawke’s Bay
Hawke’s Bay Land use 30 June 2003
Farms Hectares % of NZ total
Tussock and danthonia used for grazing 129 39,686 1.3%
Grassland 2,454 669,060 8.2%
Grain, seed and fodder crop land 354 10,100 2.9%
Land in horticulture 1,218 20,428 16.9%
Planted production forest 957 122,995 6.7%
Native scrub/regenerating native bush 552 45,207 5.4%
Other land use 1950 51,436 12.0%
Total area of farming and forestry 3,651 958,912 6.2%
Total land area of region 1,416,400 5.3%
Livestock 30 June 2004 Numbers % of NZ total
Total beef cattle 612,870 13.8%
Calves born alive to beef heifers/cows 134,408 13.1%
Total dairy cattle 91,786 1.8%
Calves born alive to dairy heifers/cows 37,497 1.2%
Total sheep 4,305,819 11.0%
Total lambs marked and/or tailed 3,080,384 9.7%
Total deer 147,378 8.4%
Total pigs 6,134 1.6%
Horticultural crops 2003 Hectares % of NZ total
Apples 6,396 52.6%
Wine grapes 4,272 21.7%
Kiwifruit 267 2.2%
Olives 263 9.6%
Avocados 29 0.9%
Squash 2,924 43.0%
Onions 537 9.5%
Potatoes 585 5.4% Sources: 1. MAF, 2002 2. Statistics New Zealand, 2004

4
5
Chapter 2 Literature Review
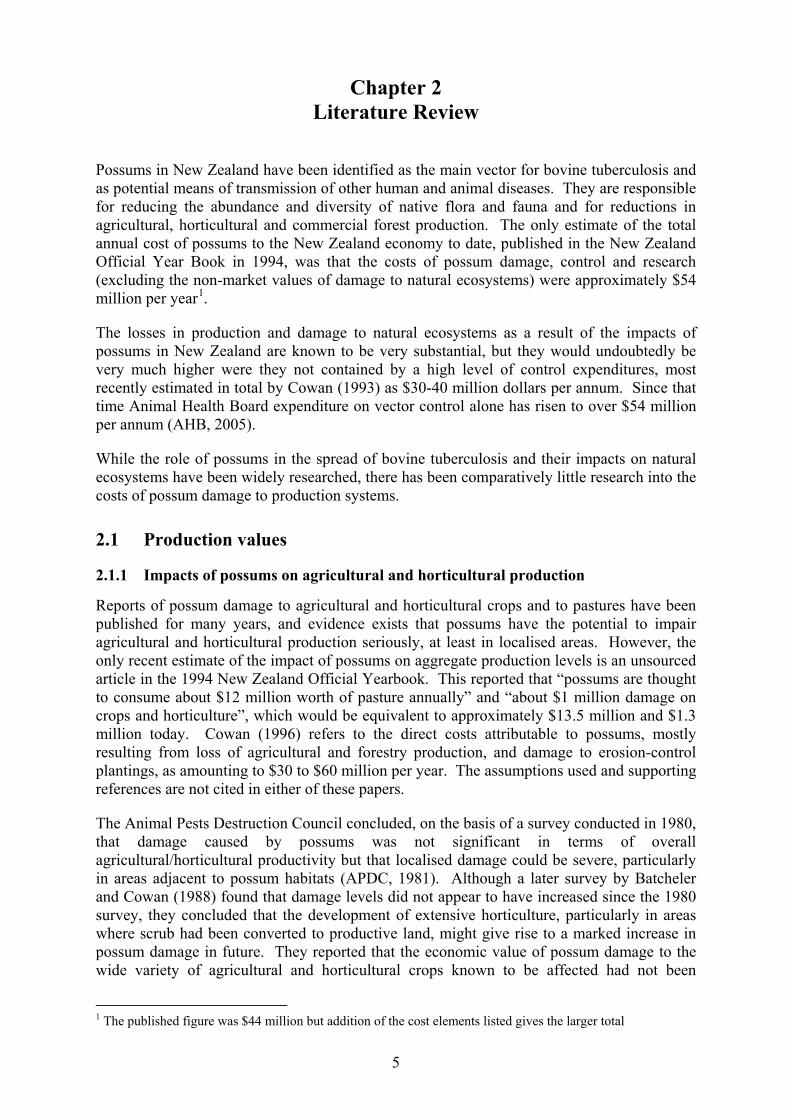
Possums in New Zealand have been identified as the main vector for bovine tuberculosis and as potential means of transmission of other human and animal diseases. They are responsible for reducing the abundance and diversity of native flora and fauna and for reductions in agricultural, horticultural and commercial forest production. The only estimate of the total annual cost of possums to the New Zealand economy to date, published in the New Zealand Official Year Book in 1994, was that the costs of possum damage, control and research (excluding the non-market values of damage to natural ecosystems) were approximately $54 million per year1.
The losses in production and damage to natural ecosystems as a result of the impacts of possums in New Zealand are known to be very substantial, but they would undoubtedly be very much higher were they not contained by a high level of control expenditures, most recently estimated in total by Cowan (1993) as $30-40 million dollars per annum. Since that time Animal Health Board expenditure on vector control alone has risen to over $54 million per annum (AHB, 2005).
While the role of possums in the spread of bovine tuberculosis and their impacts on natural ecosystems have been widely researched, there has been comparatively little research into the costs of possum damage to production systems.
2.1 Production values
2.1.1 Impacts of possums on agricultural and horticultural production
Reports of possum damage to agricultural and horticultural crops and to pastures have been published for many years, and evidence exists that possums have the potential to impair agricultural and horticultural production seriously, at least in localised areas. However, the only recent estimate of the impact of possums on aggregate production levels is an unsourced article in the 1994 New Zealand Official Yearbook. This reported that “possums are thought to consume about $12 million worth of pasture annually” and “about $1 million damage on crops and horticulture”, which would be equivalent to approximately $13.5 million and $1.3 million today. Cowan (1996) refers to the direct costs attributable to possums, mostly resulting from loss of agricultural and forestry production, and damage to erosion-control plantings, as amounting to $30 to $60 million per year. The assumptions used and supporting references are not cited in either of these papers.
The Animal Pests Destruction Council concluded, on the basis of a survey conducted in 1980, that damage caused by possums was not significant in terms of overall agricultural/horticultural productivity but that localised damage could be severe, particularly in areas adjacent to possum habitats (APDC, 1981). Although a later survey by Batcheler and Cowan (1988) found that damage levels did not appear to have increased since the 1980 survey, they concluded that the development of extensive horticulture, particularly in areas where scrub had been converted to productive land, might give rise to a marked increase in possum damage in future. They reported that the economic value of possum damage to the wide variety of agricultural and horticultural crops known to be affected had not been
1 The published figure was $44 million but addition of the cost elements listed gives the larger total
6
quantified at that time, and recommended that more precise measurements be obtained to facilitate estimation of the costs and benefits of possum control. However, little more detail has been collected to date, as Bertram and Hacknell (1999) and Butcher (2000) have reported.
Although no robust, large-scale, estimation of the losses incurred on pastoral farms in New Zealand as a result of browsing of pasture and forage species by possums has been undertaken, several studies have supported the view that such losses are potentially large, at least in localised areas.
A number of studies have shown that pasture and forage species are favoured food sources of possums. On Banks Peninsula in Canterbury, Gilmore (1965) observed that possums would travel long distances to feed on root crops grown as winter feed for livestock, and Green and Coleman (1981) found that possums at Lake Haupiri in Westland moved several hundreds of metres to feed on pasture and may have done so frequently. Gilmour (1967) found that white clover and a number of grasses formed an important part of the diet of possums throughout the year, while Harvie (1973), in a study of the stomach contents of possums in an area in which a wide variety of vegetation types was available, found that about 30 percent of the possum diet comprised pasture species. At possum densities of approximately 43 per hectare (previously reported on one of the properties in Harvie’s study area by Quinn, 1968), this equated to 4.7 kilograms of pasture dry matter per day or 1.34 sheep per hectare (Fitzgerald, 1977).
Butcher (2000) calculated that a typical Taranaki dairy farm with a possum population of 4.5 possums per hectare would have foregone production valued at $2,800 per year at that time. He based this calculation on Harvie’s estimate that a possum consumes 0.11 kilograms of pasture dry matter per night, and an estimated intake of 17.5 kilograms of dry matter per dairy cow per day. A similar calculation for the average Hawke’s Bay dairy farm of 205 hectares, producing 313 kilograms of milksolids per cow, using 2003/04 prices (LIC, 2004), yields an estimate of the value of production foregone of $7,700.
Spurr and Jolly (1981) found a yield reduction of 26 percent in a crop of choumoellier and swedes in a small-scale trial designed to test a methodology for obtaining the objective measurements of loss on which to base cost-benefit studies.
Anecdotal evidence exists (Nelson, 1983; Batcheler and Cowan, 1988) that possums will damage most of the types of fruit, vegetable and flower crops grown commercially in New Zealand by eating fruit, flowers and leaves, and damaging trees by breaking branches, biting bark and spoiling leaves. In addition, damage to shelter belts may increase the costs of shelter to growers and slow its establishment, thus reducing orchard yields in the early years. Possum damage generally occurs when crops are maturing and is, therefore, highly seasonal. Losses can be high even when damage levels are comparatively low for crops such as avocados where the unit value is high, but such damage is not sufficient to warrant much interest except at the local level (Batcheler and Cowan, 1988). Butcher (2000) reported the destruction of between one and two hectares of carrots over three nights in a Pukekohe block. No recent analyses of the extent of damage to horticultural crops have been published.
2.1.2 The impacts of possums on commercial forestry production
In New Zealand, as 90 percent of exotic forest plantations are Pinus radiata (Ministry of Agriculture and Forestry, 2000), most possum damage occurs in P. radiata plantations, although damage to other pine species and to eucalypts has also been recorded (Batcheler and Cowan, 1988). Possum damage, which usually occurs when trees are young, can consist of browsing of terminal shoots in the first two years after planting, bark stripping and chewing
7
on trees less than ten years old; breakage of leaders and top whorls on trees between five and fifteen years old; and cone loss from seed stands after eight years of age. The types of damage inflicted appear to vary by locality and season (Batcheler and Cowan, 1988) but bark stripping has been of most widespread concern to foresters (Clout, 1977).
Butcher (2000) relates changing perceptions of the overall impact of possum damage on forestry production to changes in the average age of New Zealand plantations, as well as to changes in the possum population. Although possum damage was reported in the 1930s when North Island forests were being established (Clout, 1977) the absence of large numbers of possums in the Central North Island meant that possum damage was not considered to be a serious problem. However, by the 1960s and early 1970s when the 1930s forests were being replanted, possums had spread into most plantation areas and their damage was considered to have reached significant levels. By the 1980s when these plantings had grown beyond their most vulnerable stage and the level of new plantings had declined, possum damage was again considered to be minor only. Butcher hypothesised that as new planting increased in the late 1990s, it can reasonably be expected that losses of trees will also have increased again in areas of high possum density. No reports to support this have been located.
The potential level of possum damage to young exotic forest plantations has been highlighted by a number of studies in which high levels of localised damage to P. radiata plantations have been found. Jacometti et al. (1997) reported that damage levels varied up to 30 percent in certain parts of a forest near Whangamata, and surveys of possum damage conducted during 1970-75 (reviewed by Clout, 1977) reported losses of up to 50 percent of two to three year old trees.
However, despite wide localised variation in damage levels, studies of possum damage in commercial forests fail to demonstrate significant economic damage overall. In a study of possum damage in young plantations Clout (1977) found that, overall, there were low levels of seedling mortality and low incidence of damage over large areas. Because damage is largely limited to young trees, losses can be minimised by appropriate thinning practices. Only in stands where tree numbers are already low because of losses from causes other than possums did he consider that serious impacts were likely. Warburton (1978) found that at a density of one possum per hectare no economic damage was sustained in the Ashley State Forest, while Keber (1988) concluded that the impact of possum damage on the final yield of a commercial P. radiata plantation was slight. Even in the worst-case scenario he estimated that the value of damage was approximately one to two percent of the value of the crop. He concluded that, in most cases, the costs of controlling possums in commercial forest plantations by aerial poisoning exceeded the benefits from doing so.
Jacometti et al. (1997) found that, even where possums are present in a P. radiata forest over three years of age at levels sufficient to cause severe damage in indigenous forests, damage levels are not severe, as possums damage few trees over three years old. The damage that does occur is unlikely to result in structural damage to milling logs.
Batcheler and Cowan (1988) warned that changes in silvicultural regimes leading to low stocking rates when trees are only eight to ten years old, and the planting of grafted trees at final stocking rates, reduces the scope for removal of damaged trees by thinning or pruning and, therefore, might increase vulnerability to possum damage.
2.1.3 Damage to the honey industry
There is some evidence that commercial production of bush honeys has been affected by possum damage to flowering native tree species. Honey production on Rangitoto Island
8
declined steadily from the mid-1980s with increasing damage to nectar-producing rata trees by possums. After aerial poisoning and the ground-trapping of possums on the island a significant upward trend in honey production was recorded over the next few years (Mowbray, 1992, Spurr and Anderson, 2004). Cowan and Batcheler (1988) concluded that the large-scale possum damage to West Coast rata forests, and seasonally high level of feeding by possum on the flowers of native tree species, suggest that the initial impact of possums on honey production had probably been sustained.
2.1.4 Damage to the tourism industry
No work on the attitudes of tourists to possums and possum damage has been identified. However, studies do exist that demonstrate that New Zealand’s natural environment is important to tourists. Significant damage to that environment may, consequently, have negative impacts on at least some sectors of the tourism industry. Kearsley et al. (2001) found that 78 percent of visitors to the more accessible parts of the New Zealand conservation estate considered its scenic beauty and naturalness to be an extremely important motivation for their visits and 16 percent regarded it as an important motivation.
2.2 Possums and disease
2.2.1 Possums and bovine tuberculosis
The possum is the maintenance host and a primary vector for bovine tuberculosis (Mycobacterium bovis) in New Zealand. Although tuberculosis (Tb) is now rare among New Zealanders, partly because of pasteurization of dairy products (Crump et al., 2001), it is the most important disease of cattle and deer (Coleman and Livingstone, 2000) and infected possum populations are the major barrier to eradication of the disease from these species (Animal Health Board, 2001).
Animal Health Board (AHB) manages an extensive programme of possum control under the National Pest Management Strategy for Bovine Tuberculosis (NPMS), which has the primary objective of reducing the number of Tb-infected cattle and deer herds in New Zealand to 0.2 percent, the international benchmark for recognising a country as officially free of bovine Tb. This equates to having approximately 50 infected herds nationally. As at 30 June 2004, the proportion of infected herds was 0.77 percent, compared to a forecast rate of 1.15 percent and was 10 percent lower than the rate in the previous year (AHB, 2005).
The main justification for the implementation of the NPMS has been to reduce the market access risks associated with the presence of tuberculosis in New Zealand, which are believed to have increased as the Tb status of trading partners has improved and as consumers have become more aware of food safety issues. It is also feared that the re-emergence of Tb as a human health risk in many countries may trigger a consumer response despite the fact that livestock are not the source of this infection. Only three percent of New Zealand’s Tb cases are caused by M. bovis (Ministry of Health, 2003).
The Strategy, which is funded jointly by the beef, dairy and deer industries, the Government and the regions involves both vector (primarily possum) control and measures to control spread of the disease itself, including movement control of cattle herds in regions of endemic disease and a "test and slaughter" policy. In 2001 it was estimated that the average costs over the first five years of the strategy, including vector control, disease control and national costs

9
of research, communication and compensation for animals slaughtered would be $79.78 million shared amongst industry, the Crown and the regions, in the ratio of 54:38:8 (AHB, 2001).
The estimated contribution to the costs of the NPMS by the Hawke’s Bay Regional Council and the region’s livestock industries from 2001/02 to 2004/05 are shown in Table 2. Estimates of industry contributions are based on the total contributions of the New Zealand livestock industries and the share of the national beef, dairy and deer herds farmed in Hawke’s Bay.
Table 2 Estimated Costs of Tuberculosis Vector and Disease Control Hawke’s Bay Regional Council and Livestock Industries ($000)
Vector control
HBRC contribution
Cattle slaughter levy Deer levy Dairy
contribution Total
2004/05 $5,380 $4,521 $175 $170 $10,248
2003/04 $4,701 $4,369 $170 $177 $9,417
2002/03 $3,888 $4,491 $180 $120 $8,679
2001/02 $2,018 $3,366 $135 $105 $5,623 Sources: HBRC Annual Reports AHB Annual Reports
The potential magnitude of the trade losses if access to the high value markets of the EU and the USA were to be lost for two years was estimated to have a net present value to the dairy, beef and deer industries of 1.29 billion dollars in 1998 terms (AHB, 2001). This assumes that there would be a three year “tail” before export volumes reached previous levels. At the time, there was debate about the risks of trade sanctions, which the AHB after consultation with industry estimated to be two percent per year. However, a Treasury re-analysis of the AHB estimates found the risk of such a simultaneous ban being permitted under WTO rules to be so small “that it is almost non-existent”. This conclusion was based on the facts that the EU still has a significant problem with Tb and that it would be difficult to demonstrate a sound scientific basis for the implementation of a ban (Clough and Nixon, 2000). AHB responded that the scenario was, however, realistic in view of the time taken to resolve market access issues by the WTO. In addition, importing companies might exploit increases in consumer preference for primary products from Tb-free sources – a market impact outside the control of the WTO (Coleman and Livingstone, 2000).
2.2.2 Possums and other zoonoses
Although the possum is best known for its role as a vector for tuberculosis, it is also considered to have the potential to act as a vector for several other important diseases of humans and animals in New Zealand.
However, the extent to which possums and other wildlife species are implicated in transmission of these diseases has yet to be established.
Giardia and Crytosporidium are regarded as the parasites of greatest concern (Priority 1) in New Zealand drinking water supplies (Ministry of Health, 2005), and the possum is regarded as a potential means of water supply contamination with both of these pathogens. Possums infected with Giardia intestinalis are widespread in native forest and open farmland in the
10
North Island. Although it is not known whether the possum strains of Giardia will affect humans, it has been shown overseas that geographic karotypes can be transmitted between mammalian hosts and humans (Marino et al., 1992). One of the contributing factors in the increasing incidence of Cryptosporidium parvum, identified as a key infectious disease threat facing New Zealand, is the high density of reservoir animals (Crump et al., 2001), including the possum.
New Zealanders, particularly meat workers and the farming community, have a high rate of leptospirosis infection compared to similar temperate countries (OSH, 2000), and it is regarded as the major infectious occupational disease in this country. The possum is the maintenance host for Leptospira balanica (Horner, Heath and Cowan, 1996), and possum culling is one of the strategies recommended for prevention of the disease in the integrated approach to infectious disease that has been adopted in New Zealand (Ministry of Health, 2001). Although transmission from possums to production animals to humans has been identified as a pathway for the spread of this disease (OSH, 2001), Crump et al., 2001 conclude that transmission from possums to production animals appears uncommon.
Cases of a rickettsial disease, first reported from Northland in the 1990s, have often been reported in possum hunters and have been clustered around the Kaukapakapa region. The rickettsial species, yet to be determined, is probably from the typhus group and may be transmitted to humans from possums by a flea vector (Crump et al., 2001).
Possums may also act as vectors for other parasites and diseases in farm animals (liver flukes, nematodes, rota virus) but the linkages are uncertain (Parliamentary Commissioner for the Environment, 1994).
2.3 Possums and conservation values
2.3.1 Native vegetation
The New Zealand Biodiversity Strategy (Department of Conservation, 2000) states that “Invasive pests and weeds pose the single greatest threat to biodiversity on land …. Browsing and grazing animals, such as goats… and, above all, possums, eat our native plants.” In 1994, it was estimated that between 24 and 38 percent of the conservation estate was “at-risk” from possum damage (Parliamentary Commissioner for the Environment, 1994). No studies of the costs of possum damage to native forest, or values of preventing this damage, have been located. However, Greer and Sheppard (1990) found that New Zealanders were prepared to pay between $44 and $111 million ($60 and $150 million in 2005 dollars) to fund research, which had no certainty of success, into biological control of Clematis vitalba, a much less well known and less widely distributed pest than the possum.
Although Kirk (1920) reported that the adverse effects of possums on native forests were negligible, by the 1940s possums were viewed differently (Pracy and Kean, 1949). Since that time there have been many studies of the impacts of possums on the composition and structure of indigenous forests in New Zealand, a number of which are summarised by Payton (2000). He found that while possums have now modified most New Zealand forests, the reported impacts of possum damage in forested areas have been far from uniform, varying both within and between populations of the same plant species, as well as between communities and ecosystems. He acknowledges that scientists do not yet fully understand the reasons for the patterns of damage observed, but that the composition and structure of stands, which are determined largely by the stability of the landscape, predispose communities and ecosystems to possum damage.
11
Where species extensively browsed by possums are the major structural components of native forests, possum related damage is severe and can lead to complete canopy collapse. Halls totara, Southern rata and kamahi (Batcheler, 1983; Campbell, 1990; Rose et al., 1992; Bellingham et al., 1999) have been found to be particularly susceptible to damage in a number of studies, while structural damage is minimal in predominantly beech (Nothofagus spp.) forests (Wardle, 1984). The abundance of some plant species, such as mistletoe, in beech forests has, however, declined drastically (Batcheler and Cowan, 1988) because of possum damage.
Some studies have shown that eradication of possums has been successful in restoring degenerating forests. Mowbray (2002) found that, following the removal of possums and wallabies from Rangitoto and Motutapu Islands, rapid canopy and understorey recovery was evident, but in other studies the impacts of possum control are less clear-cut. Norton (2000) concluded that a variety of factors, including the density of possums before and after control; the frequency of control; the influence of other herbivores on vegetation response; the plant species present and the time elapsed since control was undertaken, will influence the impact of possum control on degenerating forests. In addition, not all damage to native forest canopies is attributable to possums or other mammals – a range of factors including earthquakes, pests and adverse climatic conditions also trigger or accelerate canopy dieback Payton (2000).
2.3.2 Native fauna
There is evidence that possums do destroy the habitat of native animal species, kill and/or eat eggs, chicks, adult birds and native snails, and may compete with them for food. There are also a number of studies reporting increased abundance of native bird species after possum eradication. In general, however, these studies have not investigated the possibility that other threats to these species co-varied with possum numbers. Rose et al. (1990) found that at study sites in South Westland kaka numbers were greatest at sites not yet colonised by possums and where colonisation was recent, and declined with increasing possum numbers. However, Veltman (2000) raises the possibility that stoat and possum numbers may have varied similarly between sites and that stoats may also be responsible for the observed pattern of kaka abundance. Consequently, after reviewing the evidence published prior to 2000, Veltman reported that no strong test of the hypothesis that native wildlife do benefit from possum control had been published, although some evidence has been found that this is likely to be the case. She concludes that logical and financial constraints on researchers have precluded their gathering all the data required to assess the results of possum control on native wildlife over ecologically meaningful timeframes.
Possums as predators of native wildlife
Innes (1994) reported that strong circumstantial evidence or direct observation had shown that possums kill eggs, chicks or adults of at least six native bird species (kokako, brown kiwi, kahu, fantail, North Island saddleback and kereru), but acknowledges that it was not known whether “these were isolated events or the tip of an iceberg”.
The clearest evidence that possums are predators of wildlife has been provided by several studies in which time-lapse video cameras have been installed at bird nests, and by direct observation of predation. Brown et al. (1993) detail several reported observations of possums eating birds, while Innes et al. (1996) found that approximately 25 percent of kokako nest failures from known causes filmed over three years, at Roroehu Forest and on Little Barrier Island, were attributable to possums.
12
Sadleir (2000), reviewing evidence that possums ate large land snails of the genus Powhelliphanta reported from personal communications with K. Walker and G. Elliot (Department of Conservation, Nelson) that possum damaged shells of these snails have been found in many snail populations in the Marlborough Sounds, Nelson, North Westland and in the Kaimanawa and Ruahine ranges. From the proportions of shells observed, and the declining populations of these snails, they conclude that possums are having a major detrimental effect on six species of the snails.
The remains of a number of native invertebrates were found in the stomach contents or faecal pellets of possums by Cowan and Moeed (1987) during a five year study of possums in the Orongorongo Valley. These invertebrates comprised only a small part of the possums’ diet but the authors suggested that small local populations of species such as the giant weta may be endangered by possum predation. Cowan and Moeed reviewed ten other papers that report invertebrate predation by possums.
Although it is clear that possums do eat native animals, Sadleir (2000) found only four papers that provided estimates of the proportions of predation of native animals attributable to possums. These varied from six to 40 percent. Publications also record the views of wildlife workers who are certain that possum predation contributes significantly to low rates of increase of kokako populations (Innes et al., 1996). McLennan et al. (1996) observed that even a low level of predation can significantly decrease adult longevity and productivity and that predators of adult kiwi may, therefore, be significant agents of decline even though they kill relatively few birds.
Destruction of habitat and competition for food
Because possums reduce the biomass of the preferred plant foods of a number of species of native fauna, it seems probable competition for food occurs (Innes, 1994). However, although several studies have established dietary overlap between possums and native bird species such as the kokako, they have not demonstrated actual competition in a population sense. Consequently, it is not yet clear whether there is really an effect of competition on native bird species (Sadleir, 2000).
Innes (1994) in reviewing earlier studies concluded that because many invertebrates are dependent on only one or few plant species, competition from possums is likely to affect them seriously. This may be particularly important for the invertebrate species that are vulnerable to extinction because they are restricted to a single habitat remnant.
More recently, Spurr and Anderson (2004) concluded that significant increases in the abundance of tui and silvereye on Rangitoto Island in the Hauraki Gulf, after the eradication of the possum and the brushtail wallaby, occurred because of the increased flowering of pohutukawa (Metrosideros excelsa) and rewarewa (Knightia excelsa) as a result of the eradication of these pest species. Other bird species did not increase in abundance and there was no increase in species diversity because, Spurr and Anderson believe, other species of introduced predators were not eradicated.
2.3.3 Possums and erosion control
The damage to protection forests on steep erodible areas, caused by possum browsing, increases the risk of soil erosion, flooding, property damage, water quality problems and road damage (Northland Regional Council, 2004) in surrounding areas.

13
In addition, considerable possum damage to poplar and willow cuttings, planted extensively on farmland to control erosion without retiring the land from grazing, has been shown to occur over a wide area (Jolly and Spurr, 1981). In many areas, protection of the poles using expandable plastic sleeves is required for their survival.

14

15
Chapter 3 The Focus Groups
3.1 Structure and organisation of the focus groups
In November 2005 a series of three focus groups, to be facilitated by the researchers, was organised by members of the HBRC Biosecurity Advisory Team. The objectives of these discussions were:
• To gain an understanding of the way in which farmers evaluate the outcomes of the PCA project, in order to facilitate design of the postal survey questionnaire
• To determine whether data collected by survey means was likely to provide sufficient information on which to base the economic analysis, and the extent to which secondary data analysis would be required
• To explore aspects of the programme in greater depth than is possible using a structured questionnaire format
After introductions, and a brief discussion of group members’ motivations to join the programme, the discussion was structured around three broad headings including the impacts of the programme to date, operational issues and the future of the programme and, more broadly, pest control in the area.
Participants in the focus groups were drawn from lists of farmers currently involved in the programme, and the meetings were held in local hotels in different parts of the Hawke’s Bay region in order to provide participants with easy access to a venue in which they felt relaxed.
The first focus group, held at lunchtime at the Patangata Hotel, was attended by ten farmers from the Pourerere, Haumoana–Tukituki, Tukituki, Elsthorpe-Kairakau and Hautope PCAs, which have now been in existence for either two or three years. All group members were primarily sheep and beef farmers who owned or managed medium or large properties. They were unanimously supportive of the programme and raised few issues for discussion.
An evening meeting at the Wanstead Hotel was attended by ten members of the Baker 1, Baker 2, Wanstead, Porangahau and Te Uri PCAs. These are some of the farmers who had been in the PCA programme the longest and have been operating for either four or five years. All were sheep and beef farmers, of whom several run deer as well, these farmers were also generally very supportive of the programme, but raised a diverse range of issues for discussion and made some suggestions for change in future.
The third group, held at lunchtime at the Tikokino Hotel, was poorly attended. Only five group members attended, representing the Tikokino, Tikokino North and Ongaonga PCAs, which have been in existence for two or three years and were automatically implemented (i.e. there was no farmer vote) on completion of Animal Health Board control operations. The attitudes of some members of this group differed markedly from those of other groups and a number of reservations about the programme in its existing form were discussed. However, while these farmers raised several relevant issues, particularly to the specific areas in which they farm, the small size of the group suggests that their overall attitude to the programme should not be given undue weight in the conclusions to be drawn from the focus groups.
16
3.2 Motivation to join the PCA programme
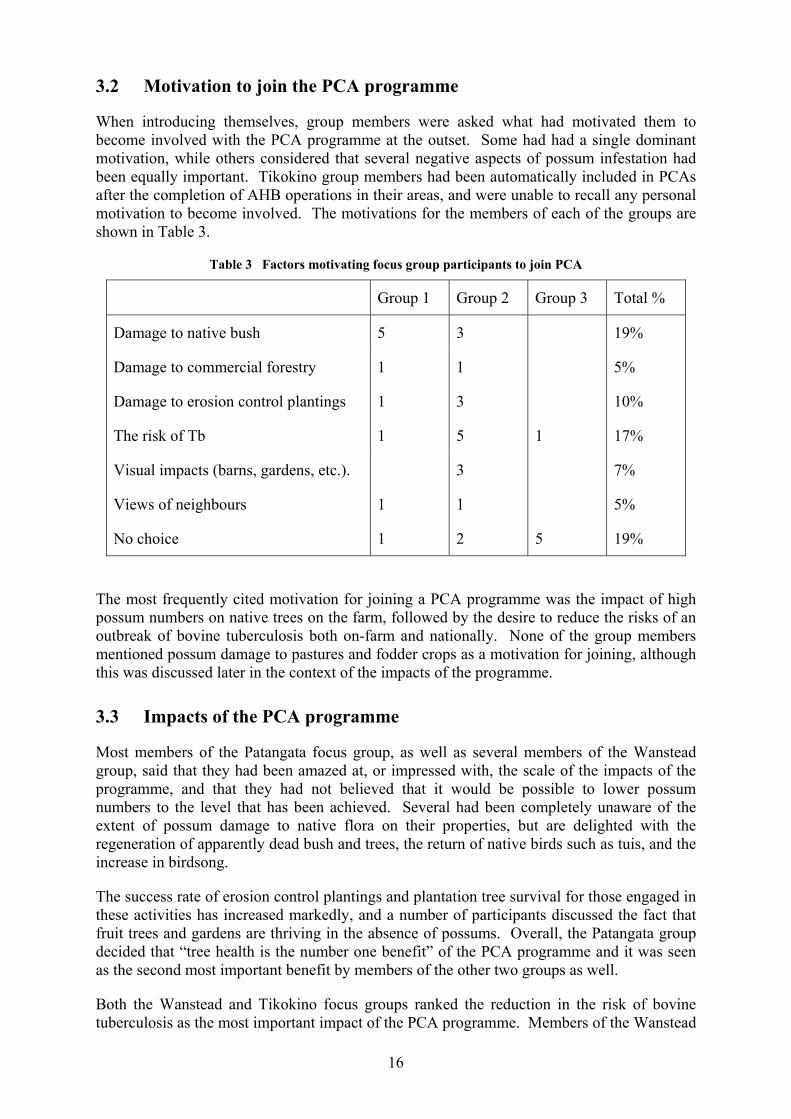
When introducing themselves, group members were asked what had motivated them to become involved with the PCA programme at the outset. Some had had a single dominant motivation, while others considered that several negative aspects of possum infestation had been equally important. Tikokino group members had been automatically included in PCAs after the completion of AHB operations in their areas, and were unable to recall any personal motivation to become involved. The motivations for the members of each of the groups are shown in Table 3.
Table 3 Factors motivating focus group participants to join PCA
Group 1 Group 2 Group 3 Total %
Damage to native bush 5 3 19%
Damage to commercial forestry 1 1 5%
Damage to erosion control plantings 1 3 10%
The risk of Tb 1 5 1 17%
Visual impacts (barns, gardens, etc.). 3 7%
Views of neighbours 1 1 5%
No choice 1 2 5 19%
The most frequently cited motivation for joining a PCA programme was the impact of high possum numbers on native trees on the farm, followed by the desire to reduce the risks of an outbreak of bovine tuberculosis both on-farm and nationally. None of the group members mentioned possum damage to pastures and fodder crops as a motivation for joining, although this was discussed later in the context of the impacts of the programme.
3.3 Impacts of the PCA programme
Most members of the Patangata focus group, as well as several members of the Wanstead group, said that they had been amazed at, or impressed with, the scale of the impacts of the programme, and that they had not believed that it would be possible to lower possum numbers to the level that has been achieved. Several had been completely unaware of the extent of possum damage to native flora on their properties, but are delighted with the regeneration of apparently dead bush and trees, the return of native birds such as tuis, and the increase in birdsong.
The success rate of erosion control plantings and plantation tree survival for those engaged in these activities has increased markedly, and a number of participants discussed the fact that fruit trees and gardens are thriving in the absence of possums. Overall, the Patangata group decided that “tree health is the number one benefit” of the PCA programme and it was seen as the second most important benefit by members of the other two groups as well.
Both the Wanstead and Tikokino focus groups ranked the reduction in the risk of bovine tuberculosis as the most important impact of the PCA programme. Members of the Wanstead
17
group described this at the farm level as wanting to minimise the risk of a breakdown on their own properties, or of being seen as the person responsible for introducing it to an area, as well as regarding it as important in the broader national context. The Tikokino group members were primarily concerned with the wider context and spent some time discussing the importance of possum control for this reason. For the Patangata group the reduction of risk associated with Tb was an important impact of the programme, but less important than biodiversity issues.
It was agreed by both the first and second groups that the improvement in the overall farm and home environment in terms of minimised plant damage, cleaner buildings, non-contaminated feed supplies and lower risk to domestic rainwater supplies was a significant benefit of the PCA programme.
At each meeting the issue of a reduction in the consumption of pasture and fodder crops was raised by the facilitators, after group members had finished listing the impacts of the programme. None of the participants was conscious of having increased stock numbers as possum numbers declined and none had experienced significant losses of fodder crops. Two farmers on coastal properties were aware of having “a bit more feed available”. Two others, who had had particularly high infestations of possums acknowledged that these must have been eating significant quantities of pasture drymatter, and considered that the change must have translated into higher livestock bodyweights. For the majority, however, the reduction in pasture consumption was not seen as a very significant impact of the PCA programme.
At each group, participants were asked how well they believed they were able to estimate the number of possums that had been on their properties before the PCA programme was implemented, as this would provide a basis for estimating drymatter consumption and, therefore, lost agricultural production. While a number of participants felt that they could estimate this based on previous control activities and/or initial kill data under the programme, it was generally agreed that these figures would underestimate total possum numbers. The difficulties of estimating numbers over whole properties rather than in specific areas, and in view of the fact that possums move around and between properties, were discussed. The variability in the responses given by group members to this question indicated that it will be necessary to use secondary data sources as well as, or instead of, information obtained by means of the postal survey as a basis for estimating the value of increased agricultural production that has been achieved as a result of the PCA programme.
Potentially adverse developments that have been observed at the same time as the reduction in possum numbers have been the increase of blackberry in forested areas (one group member had observed a four-fold increase in three years) and very much higher numbers of both rabbits and hares. Group members discussed the possibility that these developments were related to the decline in possums but reached no conclusion.
At both the Patangata and Wanstead meetings group members discussed the danger of allowing the decline in possum numbers that has been achieved under the programme to lead to complacency, and a reduction in the possum control effort. It was felt that possum numbers could build up again very rapidly, and that continuing follow-up in existing areas and extension of the areas controlled is essential.
18
3.4 Satisfaction with the PCA programme
The members of the Patangata group were all very satisfied with the PCA programme and almost all considered it to be value for money. The only threats to the programme’s success identified by this group were that possums could travel onto farms in the PCA from lifestyle blocks on which owners do not do maintenance control, and from forestry blocks on which they believe HBRC does not monitor maintenance operations, thus reducing the effectiveness of control measures taken. This group felt that a key element of the programme’s success was the provision by HBRC of the funding for the initial knock-down. Without that, they did not consider that there would have been sufficient stakeholder buy-in for the programme to proceed.
While all members of the Wanstead group were satisfied with the achievements of the programme to date, and most considered that it provides value for money, a number of operational issues in which effectiveness could be improved were identified and discussed at some length. A few group members felt that improvements in these areas, which are discussed in Section 3.5, would increase the value for money spent, but most felt that value for money is achieved by the programme in its present form.
Levels of satisfaction with the programme varied amongst the members of the Tikokino focus group. There were particular concerns about re-infestation from neighbouring uncontrolled areas (see Section 3.5) that makes it difficult for farmers in the PCA to obtain full value for the money they spend on possum control. The group was divided on whether the programme represents value for money.
3.5 Operational issues
3.5.1 Re-infestation from uncontrolled areas
In each group, there were members concerned that even if they are scrupulous about possum control on their own properties, they are powerless to prevent re-infestation from adjacent blocks. A number of different problems in this area were discussed, including:
• Rivers and native bush blocks were seen as reservoirs of possums that increase the costs of control, and reduce the chances of successful control, for farmers in adjacent areas. Rivers were of particular concern to some participants, particularly those involved in the Tikokino discussion. It was felt that many farmers were probably unaware of whether their river boundaries were in the middle of the river, or to one side and that HBRC was not fully conversant with boundary issues or with the levels of possum infestation in riverbeds.
• A number of group participants were concerned that they could be “doing everything right” but be unable to achieve on-going high levels of control because of neighbours who had done little or no maintenance work. They wanted reassurance that HBRC would be “ruthless” with people not complying with programme requirements. A few participants were particularly concerned that people not using contractors are likely to be achieving poorer results than those who do.
• Members of the Patangata group did not express concerns about re-infestation from rivers or bush blocks but some felt that lack of commitment to on-going possum control on lifestyle blocks might be an issue in the areas in which they farm.
19
• Several participants talked of the importance of co-ordinating maintenance control on neighbouring properties for greater efficiency. They were also concerned at the possibility of failing monitors if possums travelling through were trapped on their properties.
3.5.2 Communication
Participants were divided in their opinions on whether a higher level of communication between HBRC and PCA members is desirable. Members of the Patangata group felt that they have a good relationship with HBRC and generally receive all the information they require. They only want to see someone “when there is something particular to talk about”. The only suggestion made was that an information sheet about possums, covering issues such as bait shyness and other behavioural aspects might be useful. They did, however, consider that sending newsletters and information to lifestyle block owners would raise their level of consciousness of the problem and increase their involvement in possum control.
Members of the Wanstead group raised far more concerns about communication, both with HBRC and with some contractors. While some issues such as lack of information on contractors dated back to the initiation of the schemes, which were amongst the first to be implemented, others are of on-going concern. This group, and the Tikokino group, considered that quarterly newsletters would be of value and that more individual feedback is necessary. Regular updates are required on:
• Monitoring results, both at scheme level in aggregate terms in a newsletter format and on individual properties by means of a letter to the occupier. Farmers would also like reassurance that enforcement is working in cases where properties are failing monitors. The Tikokino group discussed the fact that information from all sources, including Animal Health Board data on the region as well as information on all PCAs, should be collated and regularly supplied to PCA members
• Regular updates on control technologies including information on strategies to avoid bait shyness, new poisons or problems with existing ones, and methods of ensuring that spillage from bait stations is minimised
• Information on opportunities to obtain licences to use poisons such as Feratox
Topics suggested for one-off articles in a newsletter or other format were:
• Monitoring procedures (see Section 3.5.4)
• Possum behaviour including seasonal differences in feed preferences
• A set of guidelines for contractors and those who do their own control dealing with issues such as regular review of bait station placement to ensure both that costs are being kept to the lowest levels consistent with effective control, and that effective control continues to be achieved
• Farmers could be given the option of receiving a newsletter by mail, by email or on the HBRC website.
20
3.5.3 Contractors
In total 17 group members elect to have possum control on their properties undertaken by contractors, six do the work themselves and two do part of the work themselves and contract the rest. Those who use a contractor do so because they feel that doing the work themselves would take time they cannot spare away from farm management, or because they feel that contractors have a much higher level of expertise and they want “the job done properly”. The main reason given for undertaking control work themselves or using farm labour was cost, or the fact that it fitted in well with other work or labour availability on the property and was not a problem. Two considered that doing the work themselves was more effective. Of the group members using both approaches, one alternately used contractors and did the work himself to strike a balance between minimising cost and ensuring that control is done properly, while the other used contractors on much of the farm, but undertook work in particularly difficult terrain himself to reduce costs.
It was clear that the level of service provided differs between contractors. Most members of the Patangata group dealt with a single contractor with whom there was a very high level of satisfaction. He provides a considerable level of feedback to farmers including advice on reducing the numbers of bait stations, or changing the frequency of operations where this was indicated.
The Wanstead group discussed at some length what some perceived as “dodginess/politicking happening between contractors and the HBRC”. Several rumours were discussed and the relationship between HBRC and contractors appears to require clarification, although most of the difficulties people had experienced dated back to the early days of the programme.
An issue that troubled some members of the Wanstead focus group was that if a property fails a monitor, the landowner is responsible for ensuring that possum densities are reduced and the HBRC does not take action against the contractor. They appeared to consider that involvement in the programme means that their relationship with the contractor differs from the normal relationship between purchasers and providers of contracted services, i.e. the purchaser takes action if the provider does not deliver. They did not appear to have a clear understanding of the process that would be followed in the event of a failed monitor and this is one of the areas that should be covered in future communications.
3.5.4 Monitoring
The way in which farms are selected for monitoring is not well understood. Some farmers are concerned that their properties have been monitored several times while neighbouring farms have yet to be monitored at all. There was discussion amongst the Wanstead group over whether those who choose to do their own control are “being picked on”.
There was also debate about the way in which monitoring sites were selected with some believing that the most likely habitat for possums on a property was targeted, and others that the GPS coordinates are set randomly without regard to the type of cover.
3.5.5 Relationship with HBRC
All members of the Patangata group considered that their relationship with the HBRC was excellent and that no changes to the level of information or service were required. While it is possible that this response was influenced to some extent by the fact that a member of the Biosecurity Advisory Team was present, there was no suggestion of dissatisfaction at any
21
time during the meeting. The group did stress that maintaining a strong relationship between HBRC and contractors working in the area is extremely important to ensure that a high standard of work is maintained by all contractors.
Some members of the Wanstead group did express concerns about aspects of their dealings with HBRC (detailed separately) and there was some discussion about losses of personal contact with Council because of changing staff and expansion of the PCA programme. In addition, there were a number of areas in which members of this group felt that they were not adequately informed (see Section 3.5.2).
The Tikokino group felt that more feedback from HBRC with respect to aspects of the scheme’s operation is necessary but, with one exception, were happy with the level of service received at a personal level.
3.6 The future
Each group was asked its views on the possibility that in areas where a high level of control has been achieved, maintenance control work could be deferred for a year to reduce costs, but almost all participants considered that this would be too risky, particularly so early in the programme.
While some other pests for which control programmes could be implemented were discussed, the suggestion that money saved by deferring possum control for a year could be used in controlling other pests did not receive support from any of the groups. This was in part because members did not think possum control could be deferred, and in part because they considered that any other pest would need an on-going annual programme for successful control.
The Patangata group thought that rooks are the only other vertebrate pest that would justify a control programme, but considered that plant pests in the region probably pose more of a threat that other vertebrates. Cats and stoats were identified as potential species for regional control by several members of the Wanstead group, but there was discussion about the need to consider species interactions before embarking on such programmes because the removal of predators of rabbits and hares may lead to an explosion of these populations. Any further programmes should, like the PCA programme, proceed only with group consent.
Rooks were seen as the next most important vertebrate pest by members of the Wanstead group but it was not considered that a monitored self-help programme would be appropriate for this pest. There was some inconclusive discussion about the importance of cats and rabbits but it was felt that plant pests, in particular, Chilean needle grass, were potentially of greater importance to regional agriculture.
Expansion of the programme throughout the rest of Hawke’s Bay was seen as the next step by members of the Wanstead and Tikokino groups, but not mentioned by members of the Patangata group. Further, the Tikokino group agreed that HBRC should be proactive in encouraging other regional councils to adopt similar programmes to achieve North Island, or even nationwide, possum control.

22
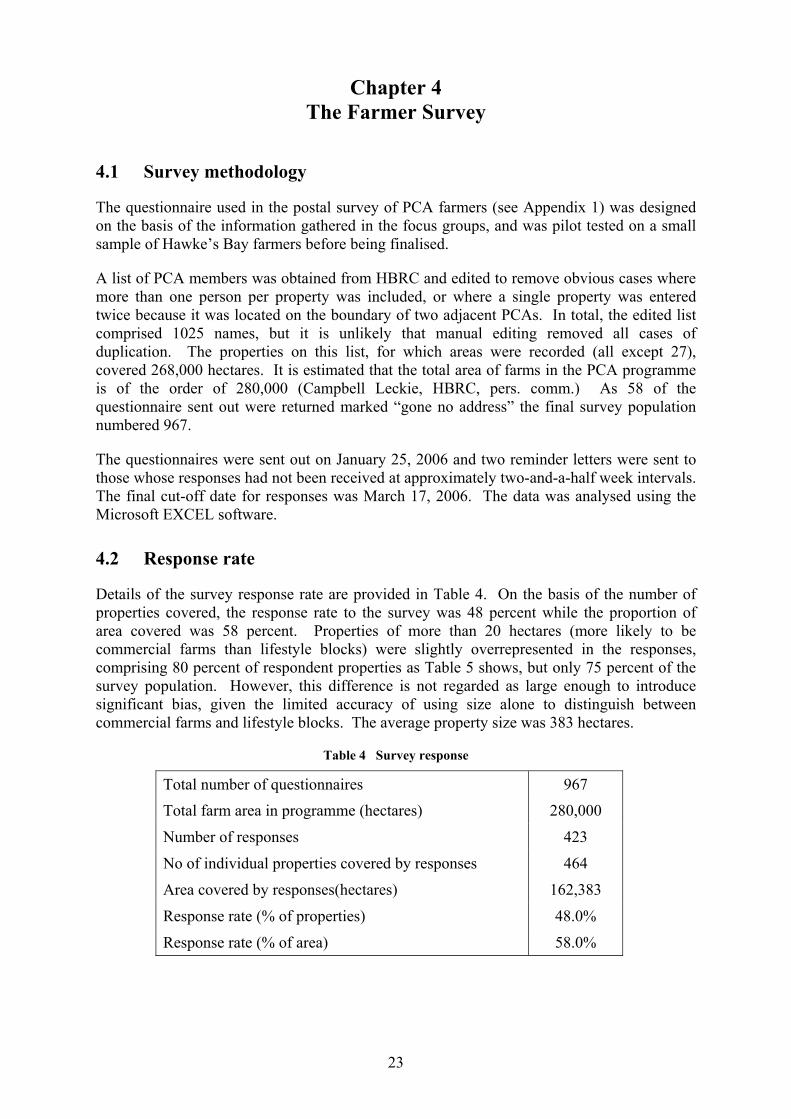
23
Chapter 4 The Farmer Survey
4.1 Survey methodology
The questionnaire used in the postal survey of PCA farmers (see Appendix 1) was designed on the basis of the information gathered in the focus groups, and was pilot tested on a small sample of Hawke’s Bay farmers before being finalised.
A list of PCA members was obtained from HBRC and edited to remove obvious cases where more than one person per property was included, or where a single property was entered twice because it was located on the boundary of two adjacent PCAs. In total, the edited list comprised 1025 names, but it is unlikely that manual editing removed all cases of duplication. The properties on this list, for which areas were recorded (all except 27), covered 268,000 hectares. It is estimated that the total area of farms in the PCA programme is of the order of 280,000 (Campbell Leckie, HBRC, pers. comm.) As 58 of the questionnaire sent out were returned marked “gone no address” the final survey population numbered 967.
The questionnaires were sent out on January 25, 2006 and two reminder letters were sent to those whose responses had not been received at approximately two-and-a-half week intervals. The final cut-off date for responses was March 17, 2006. The data was analysed using the Microsoft EXCEL software.
4.2 Response rate
Details of the survey response rate are provided in Table 4. On the basis of the number of properties covered, the response rate to the survey was 48 percent while the proportion of area covered was 58 percent. Properties of more than 20 hectares (more likely to be commercial farms than lifestyle blocks) were slightly overrepresented in the responses, comprising 80 percent of respondent properties as Table 5 shows, but only 75 percent of the survey population. However, this difference is not regarded as large enough to introduce significant bias, given the limited accuracy of using size alone to distinguish between commercial farms and lifestyle blocks. The average property size was 383 hectares.
Table 4 Survey response
Total number of questionnaires 967 Total farm area in programme (hectares) 280,000
Number of responses 423
No of individual properties covered by responses 464
Area covered by responses(hectares) 162,383
Response rate (% of properties) 48.0%
Response rate (% of area) 58.0%
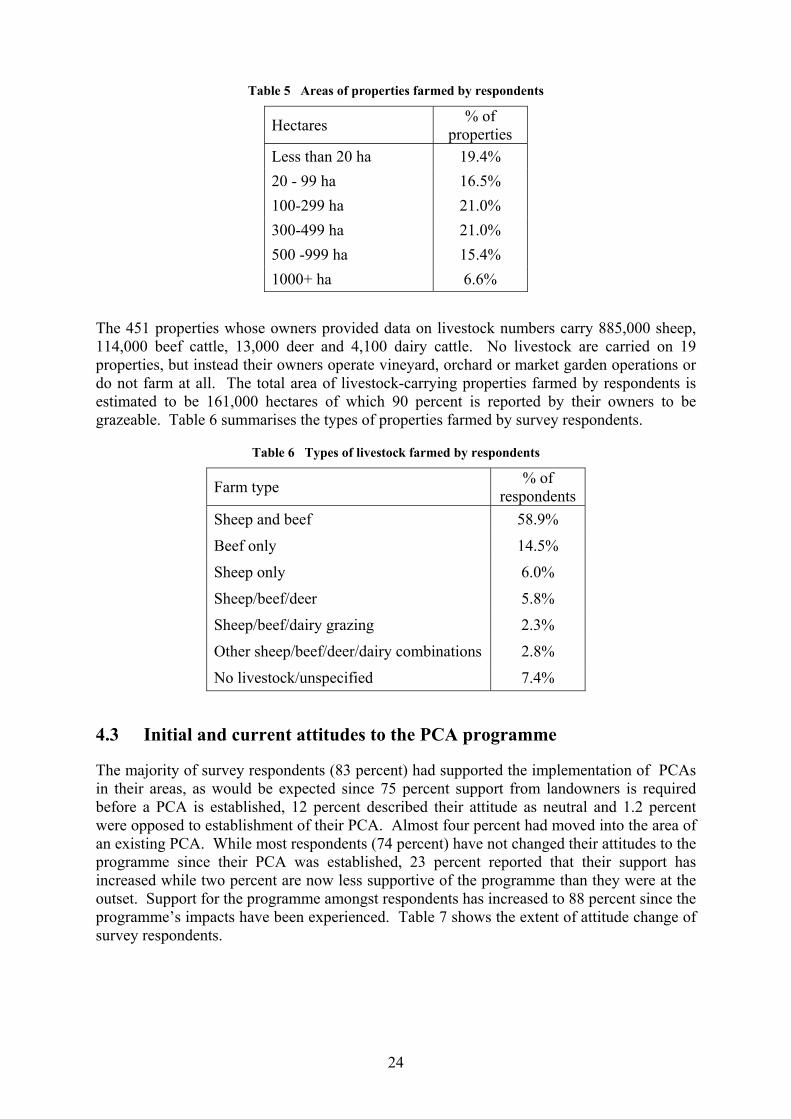
24
Table 5 Areas of properties farmed by respondents
Hectares % of properties
Less than 20 ha 19.4% 20 - 99 ha 16.5% 100-299 ha 21.0% 300-499 ha 21.0% 500 -999 ha 15.4% 1000+ ha 6.6%
The 451 properties whose owners provided data on livestock numbers carry 885,000 sheep, 114,000 beef cattle, 13,000 deer and 4,100 dairy cattle. No livestock are carried on 19 properties, but instead their owners operate vineyard, orchard or market garden operations or do not farm at all. The total area of livestock-carrying properties farmed by respondents is estimated to be 161,000 hectares of which 90 percent is reported by their owners to be grazeable. Table 6 summarises the types of properties farmed by survey respondents.
Table 6 Types of livestock farmed by respondents
Farm type % of respondents
Sheep and beef 58.9%
Beef only 14.5%
Sheep only 6.0%
Sheep/beef/deer 5.8%
Sheep/beef/dairy grazing 2.3%
Other sheep/beef/deer/dairy combinations 2.8%
No livestock/unspecified 7.4%
4.3 Initial and current attitudes to the PCA programme
The majority of survey respondents (83 percent) had supported the implementation of PCAs in their areas, as would be expected since 75 percent support from landowners is required before a PCA is established, 12 percent described their attitude as neutral and 1.2 percent were opposed to establishment of their PCA. Almost four percent had moved into the area of an existing PCA. While most respondents (74 percent) have not changed their attitudes to the programme since their PCA was established, 23 percent reported that their support has increased while two percent are now less supportive of the programme than they were at the outset. Support for the programme amongst respondents has increased to 88 percent since the programme’s impacts have been experienced. Table 7 shows the extent of attitude change of survey respondents.

25
Table 7 Initial and current levels of support for the PCA programme
(Initial attitude as percentage of all valid responses) (Current attitude as percent of all those with specified initial response)
Current attitude
Support Support Support
Initial attitude
Unchanged Increased Decreased Supported the PCA 83.0% 83.5% 21.1% 1.4%
Neutral 12.1% 52.9% 41.2% 9.8%
Opposed the PCA 1.2% 80.0% 20.0% 0.0%
Not farming in area at the time 3.8% N/A 37.5% N/A
When asked to identify up to three main reasons why they had joined the PCA programme, the largest group considered the role of possums in the transmission of bovine tuberculosis to have been the most important (60 percent) and almost 79 percent ranked it among their top three reasons. This was followed by a desire to reduce possum damage to native bush (14 and 47 percent) and to native birds and other fauna (11 and 45 percent). Damage to production resources, including erosion control plantings, pasture and feed crops and forestry plantations motivated fewer respondents to join the programme than the damage done by possums to home gardens and orchards. Thirteen percent reported that their main reason for joining was that they had had no choice. The reasons given by respondents are detailed in Table 8. As a number of respondents gave several reasons equal ranking, the total proportions assigned to each ranking are greater than 100 percent.
Table 8 Main reasons for Joining the PCA programme
(Percentage of respondents)
1st 2nd 3rd "Top 3"The role of possums in Tb transmission 60.3% 12.5% 5.9% 78.7% The effects of possums on native bush 13.7% 16.1% 16.8% 46.6% The effects of possums on native birds and fauna 11.3% 21.5% 12.3% 45.2% Possum damage to home gardens/orchards 9.2% 13.0% 16.3% 38.5% Possum damage to erosion control plantings 9.9% 13.5% 12.3% 35.7% Possum damage to pasture and feed crops 5.2% 10.2% 12.5% 27.9% Fouling of farm buildings/feed supplies by possums 5.2% 8.0% 10.4% 23.6% Possum damage to forestry plantations 4.0% 5.7% 9.7% 19.4% No choice 13.5% 2.6% 3.3% 19.4% Other 0.7% 0.2% 0.0% 0.9% Total 133.1% 103.3% 99.5% 335.9%
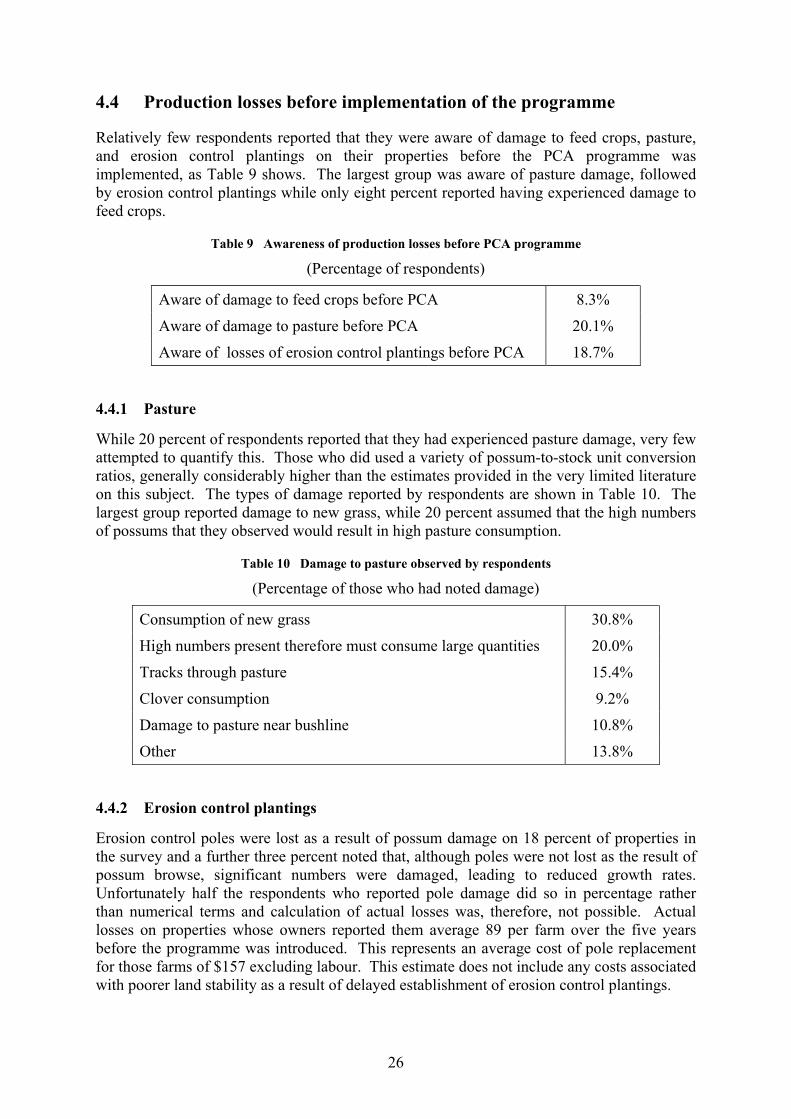
26
4.4 Production losses before implementation of the programme
Relatively few respondents reported that they were aware of damage to feed crops, pasture, and erosion control plantings on their properties before the PCA programme was implemented, as Table 9 shows. The largest group was aware of pasture damage, followed by erosion control plantings while only eight percent reported having experienced damage to feed crops.
Table 9 Awareness of production losses before PCA programme (Percentage of respondents)
Aware of damage to feed crops before PCA 8.3%
Aware of damage to pasture before PCA 20.1%
Aware of losses of erosion control plantings before PCA 18.7%
4.4.1 Pasture
While 20 percent of respondents reported that they had experienced pasture damage, very few attempted to quantify this. Those who did used a variety of possum-to-stock unit conversion ratios, generally considerably higher than the estimates provided in the very limited literature on this subject. The types of damage reported by respondents are shown in Table 10. The largest group reported damage to new grass, while 20 percent assumed that the high numbers of possums that they observed would result in high pasture consumption.
Table 10 Damage to pasture observed by respondents (Percentage of those who had noted damage)
Consumption of new grass 30.8%
High numbers present therefore must consume large quantities 20.0%
Tracks through pasture 15.4%
Clover consumption 9.2%
Damage to pasture near bushline 10.8%
Other 13.8%
4.4.2 Erosion control plantings
Erosion control poles were lost as a result of possum damage on 18 percent of properties in the survey and a further three percent noted that, although poles were not lost as the result of possum browse, significant numbers were damaged, leading to reduced growth rates. Unfortunately half the respondents who reported pole damage did so in percentage rather than numerical terms and calculation of actual losses was, therefore, not possible. Actual losses on properties whose owners reported them average 89 per farm over the five years before the programme was introduced. This represents an average cost of pole replacement for those farms of $157 excluding labour. This estimate does not include any costs associated with poorer land stability as a result of delayed establishment of erosion control plantings.
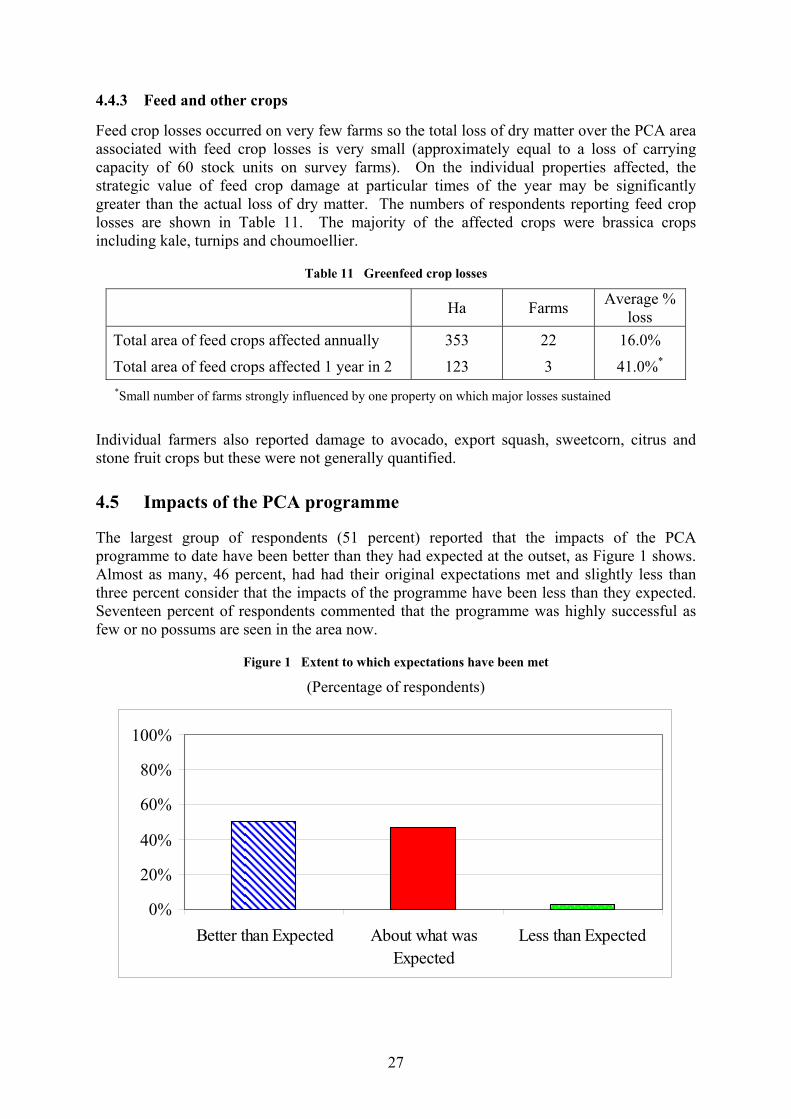
27
4.4.3 Feed and other crops
Feed crop losses occurred on very few farms so the total loss of dry matter over the PCA area associated with feed crop losses is very small (approximately equal to a loss of carrying capacity of 60 stock units on survey farms). On the individual properties affected, the strategic value of feed crop damage at particular times of the year may be significantly greater than the actual loss of dry matter. The numbers of respondents reporting feed crop losses are shown in Table 11. The majority of the affected crops were brassica crops including kale, turnips and choumoellier.
Table 11 Greenfeed crop losses
Ha Farms Average % loss
Total area of feed crops affected annually 353 22 16.0%
Total area of feed crops affected 1 year in 2 123 3 41.0%*
*Small number of farms strongly influenced by one property on which major losses sustained
Individual farmers also reported damage to avocado, export squash, sweetcorn, citrus and stone fruit crops but these were not generally quantified.
4.5 Impacts of the PCA programme
The largest group of respondents (51 percent) reported that the impacts of the PCA programme to date have been better than they had expected at the outset, as Figure 1 shows. Almost as many, 46 percent, had had their original expectations met and slightly less than three percent consider that the impacts of the programme have been less than they expected. Seventeen percent of respondents commented that the programme was highly successful as few or no possums are seen in the area now.
Figure 1 Extent to which expectations have been met (Percentage of respondents)
0%
20%
40%
60%
80%
100%
Better than Expected About what wasExpected
Less than Expected
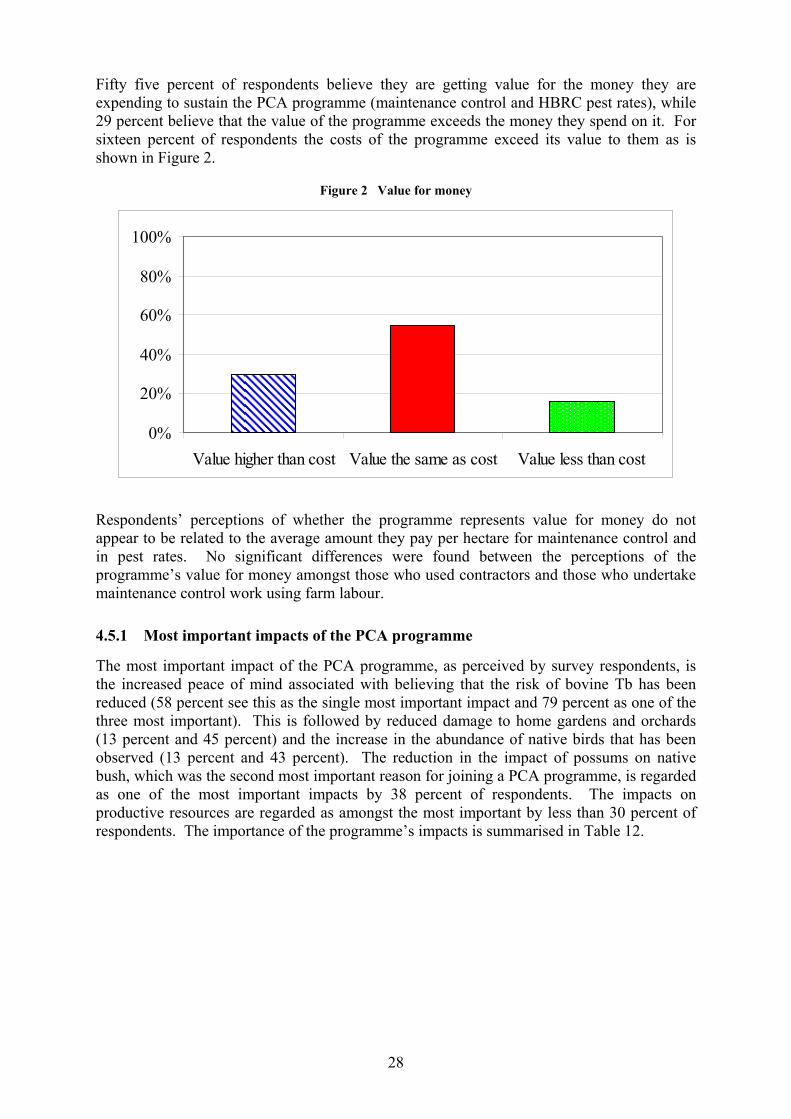
28
Fifty five percent of respondents believe they are getting value for the money they are expending to sustain the PCA programme (maintenance control and HBRC pest rates), while 29 percent believe that the value of the programme exceeds the money they spend on it. For sixteen percent of respondents the costs of the programme exceed its value to them as is shown in Figure 2.
Figure 2 Value for money
Respondents’ perceptions of whether the programme represents value for money do not appear to be related to the average amount they pay per hectare for maintenance control and in pest rates. No significant differences were found between the perceptions of the programme’s value for money amongst those who used contractors and those who undertake maintenance control work using farm labour.
4.5.1 Most important impacts of the PCA programme
The most important impact of the PCA programme, as perceived by survey respondents, is the increased peace of mind associated with believing that the risk of bovine Tb has been reduced (58 percent see this as the single most important impact and 79 percent as one of the three most important). This is followed by reduced damage to home gardens and orchards (13 percent and 45 percent) and the increase in the abundance of native birds that has been observed (13 percent and 43 percent). The reduction in the impact of possums on native bush, which was the second most important reason for joining a PCA programme, is regarded as one of the most important impacts by 38 percent of respondents. The impacts on productive resources are regarded as amongst the most important by less than 30 percent of respondents. The importance of the programme’s impacts is summarised in Table 12.
0%
20%
40%
60%
80%
100%
Value higher than cost Value the same as cost Value less than cost
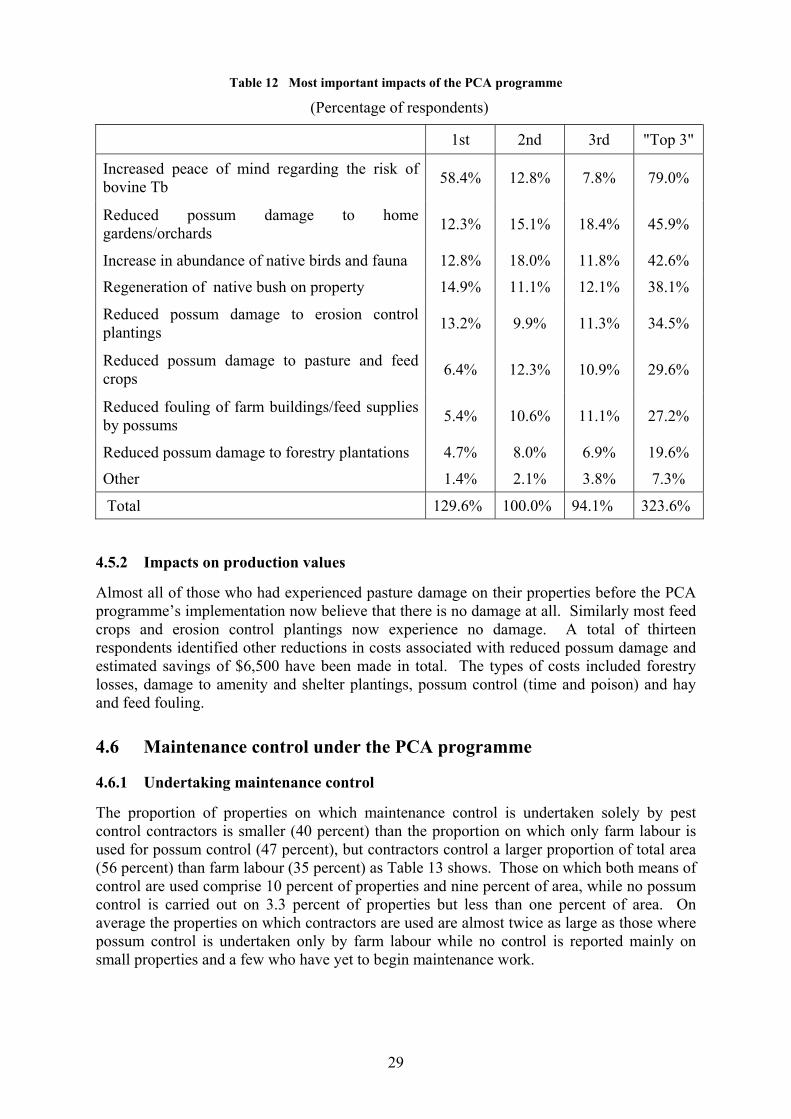
29
Table 12 Most important impacts of the PCA programme
(Percentage of respondents)
1st 2nd 3rd "Top 3"
Increased peace of mind regarding the risk of bovine Tb 58.4% 12.8% 7.8% 79.0%
Reduced possum damage to home gardens/orchards 12.3% 15.1% 18.4% 45.9%
Increase in abundance of native birds and fauna 12.8% 18.0% 11.8% 42.6%
Regeneration of native bush on property 14.9% 11.1% 12.1% 38.1%
Reduced possum damage to erosion control plantings 13.2% 9.9% 11.3% 34.5%
Reduced possum damage to pasture and feed crops 6.4% 12.3% 10.9% 29.6%
Reduced fouling of farm buildings/feed supplies by possums 5.4% 10.6% 11.1% 27.2%
Reduced possum damage to forestry plantations 4.7% 8.0% 6.9% 19.6%
Other 1.4% 2.1% 3.8% 7.3%
Total 129.6% 100.0% 94.1% 323.6%
4.5.2 Impacts on production values
Almost all of those who had experienced pasture damage on their properties before the PCA programme’s implementation now believe that there is no damage at all. Similarly most feed crops and erosion control plantings now experience no damage. A total of thirteen respondents identified other reductions in costs associated with reduced possum damage and estimated savings of $6,500 have been made in total. The types of costs included forestry losses, damage to amenity and shelter plantings, possum control (time and poison) and hay and feed fouling.
4.6 Maintenance control under the PCA programme
4.6.1 Undertaking maintenance control
The proportion of properties on which maintenance control is undertaken solely by pest control contractors is smaller (40 percent) than the proportion on which only farm labour is used for possum control (47 percent), but contractors control a larger proportion of total area (56 percent) than farm labour (35 percent) as Table 13 shows. Those on which both means of control are used comprise 10 percent of properties and nine percent of area, while no possum control is carried out on 3.3 percent of properties but less than one percent of area. On average the properties on which contractors are used are almost twice as large as those where possum control is undertaken only by farm labour while no control is reported mainly on small properties and a few who have yet to begin maintenance work.
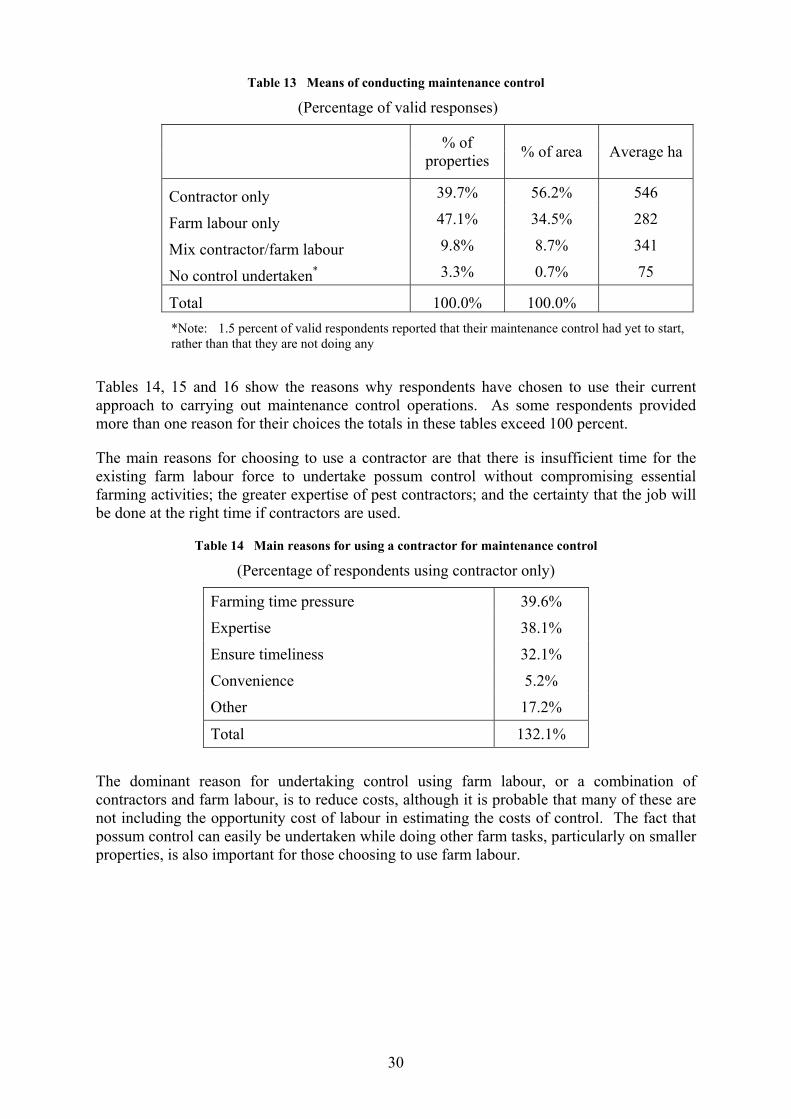
30
Table 13 Means of conducting maintenance control
(Percentage of valid responses)
% of properties % of area Average ha
Contractor only 39.7% 56.2% 546
Farm labour only 47.1% 34.5% 282
Mix contractor/farm labour 9.8% 8.7% 341
No control undertaken* 3.3% 0.7% 75
Total 100.0% 100.0%
*Note: 1.5 percent of valid respondents reported that their maintenance control had yet to start, rather than that they are not doing any
Tables 14, 15 and 16 show the reasons why respondents have chosen to use their current approach to carrying out maintenance control operations. As some respondents provided more than one reason for their choices the totals in these tables exceed 100 percent.
The main reasons for choosing to use a contractor are that there is insufficient time for the existing farm labour force to undertake possum control without compromising essential farming activities; the greater expertise of pest contractors; and the certainty that the job will be done at the right time if contractors are used.
Table 14 Main reasons for using a contractor for maintenance control
(Percentage of respondents using contractor only)
Farming time pressure 39.6%
Expertise 38.1%
Ensure timeliness 32.1%
Convenience 5.2%
Other 17.2%
Total 132.1%
The dominant reason for undertaking control using farm labour, or a combination of contractors and farm labour, is to reduce costs, although it is probable that many of these are not including the opportunity cost of labour in estimating the costs of control. The fact that possum control can easily be undertaken while doing other farm tasks, particularly on smaller properties, is also important for those choosing to use farm labour.
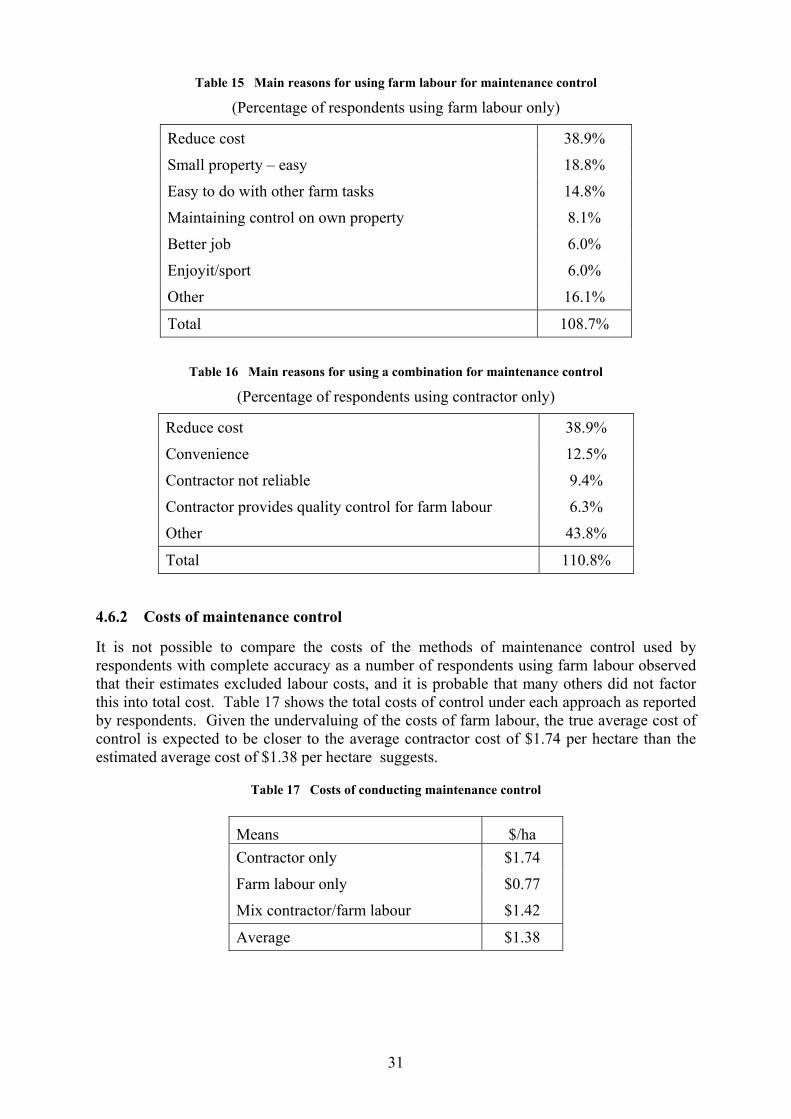
31
Table 15 Main reasons for using farm labour for maintenance control
(Percentage of respondents using farm labour only)
Reduce cost 38.9%
Small property – easy 18.8%
Easy to do with other farm tasks 14.8%
Maintaining control on own property 8.1%
Better job 6.0%
Enjoyit/sport 6.0%
Other 16.1%
Total 108.7%
Table 16 Main reasons for using a combination for maintenance control
(Percentage of respondents using contractor only)
Reduce cost 38.9%
Convenience 12.5%
Contractor not reliable 9.4%
Contractor provides quality control for farm labour 6.3%
Other 43.8%
Total 110.8%
4.6.2 Costs of maintenance control
It is not possible to compare the costs of the methods of maintenance control used by respondents with complete accuracy as a number of respondents using farm labour observed that their estimates excluded labour costs, and it is probable that many others did not factor this into total cost. Table 17 shows the total costs of control under each approach as reported by respondents. Given the undervaluing of the costs of farm labour, the true average cost of control is expected to be closer to the average contractor cost of $1.74 per hectare than the estimated average cost of $1.38 per hectare suggests.
Table 17 Costs of conducting maintenance control
Means $/ha Contractor only $1.74
Farm labour only $0.77
Mix contractor/farm labour $1.42
Average $1.38
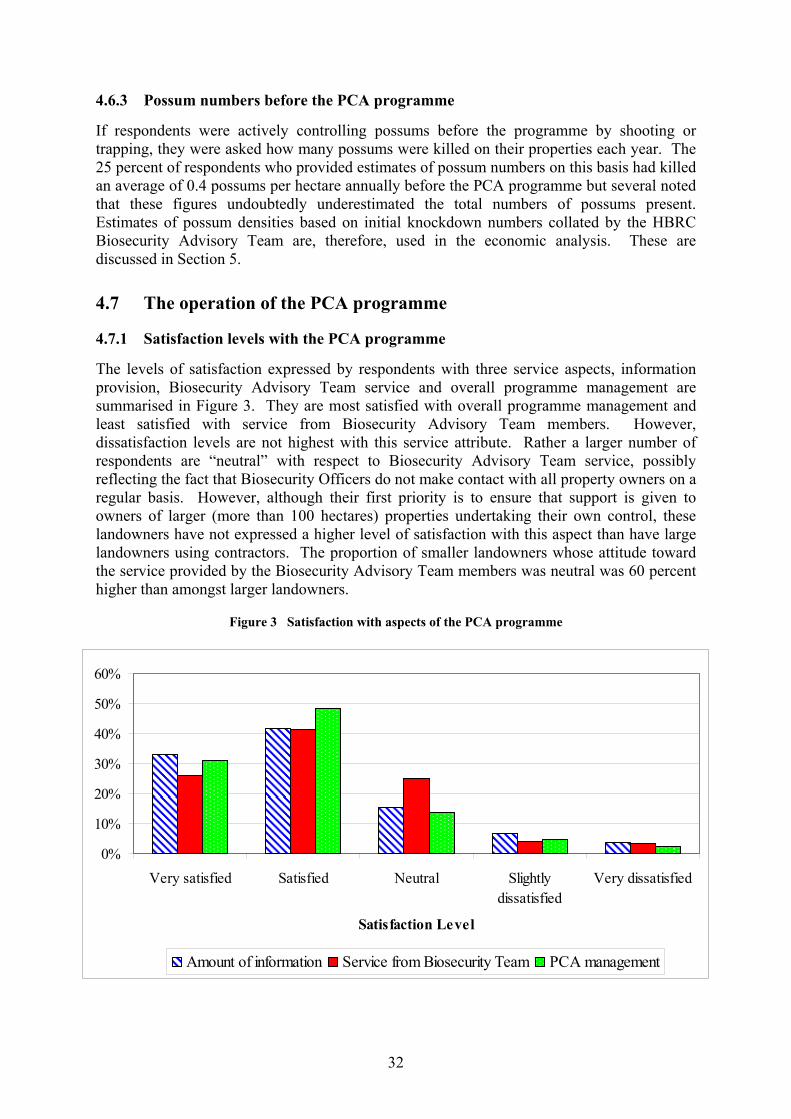
32
4.6.3 Possum numbers before the PCA programme
If respondents were actively controlling possums before the programme by shooting or trapping, they were asked how many possums were killed on their properties each year. The 25 percent of respondents who provided estimates of possum numbers on this basis had killed an average of 0.4 possums per hectare annually before the PCA programme but several noted that these figures undoubtedly underestimated the total numbers of possums present. Estimates of possum densities based on initial knockdown numbers collated by the HBRC Biosecurity Advisory Team are, therefore, used in the economic analysis. These are discussed in Section 5.
4.7 The operation of the PCA programme
4.7.1 Satisfaction levels with the PCA programme
The levels of satisfaction expressed by respondents with three service aspects, information provision, Biosecurity Advisory Team service and overall programme management are summarised in Figure 3. They are most satisfied with overall programme management and least satisfied with service from Biosecurity Advisory Team members. However, dissatisfaction levels are not highest with this service attribute. Rather a larger number of respondents are “neutral” with respect to Biosecurity Advisory Team service, possibly reflecting the fact that Biosecurity Officers do not make contact with all property owners on a regular basis. However, although their first priority is to ensure that support is given to owners of larger (more than 100 hectares) properties undertaking their own control, these landowners have not expressed a higher level of satisfaction with this aspect than have large landowners using contractors. The proportion of smaller landowners whose attitude toward the service provided by the Biosecurity Advisory Team members was neutral was 60 percent higher than amongst larger landowners.
Figure 3 Satisfaction with aspects of the PCA programme
0%
10%
20%
30%
40%
50%
60%
Very satisfied Satisfied Neutral Slightlydissatisfied
Very dissatisfied
Satisfaction Level
Amount of information Service from Biosecurity Team PCA management
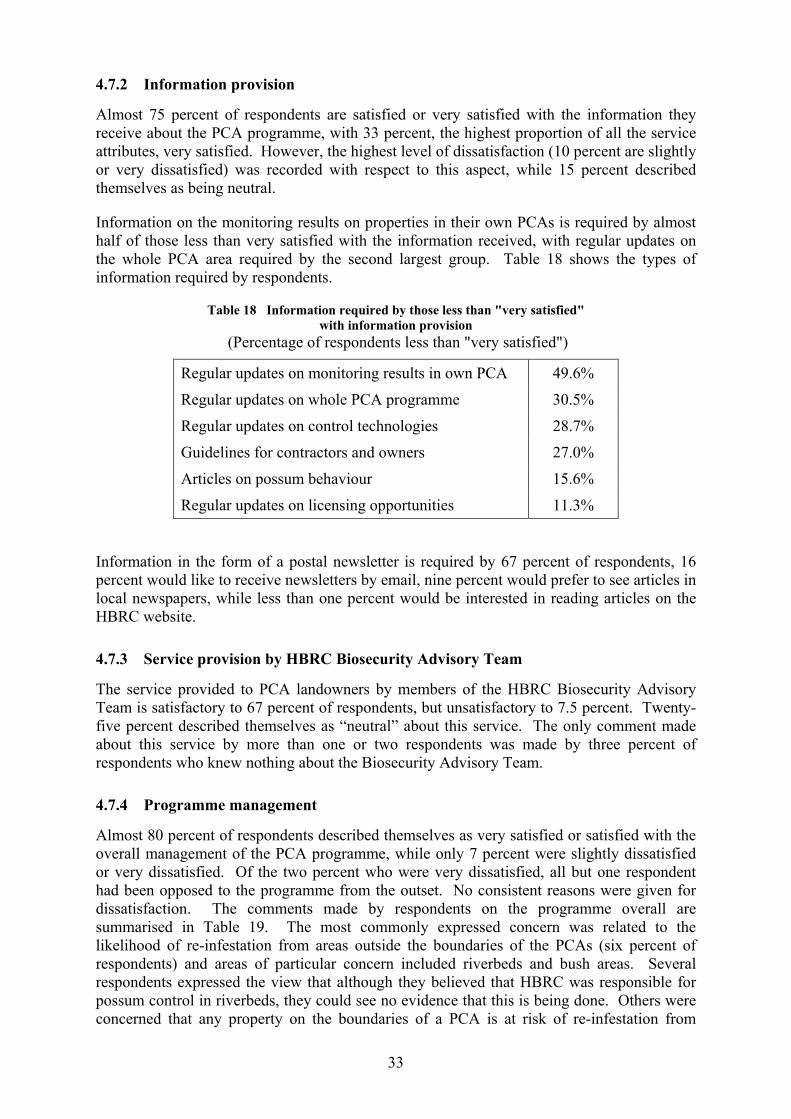
33
4.7.2 Information provision
Almost 75 percent of respondents are satisfied or very satisfied with the information they receive about the PCA programme, with 33 percent, the highest proportion of all the service attributes, very satisfied. However, the highest level of dissatisfaction (10 percent are slightly or very dissatisfied) was recorded with respect to this aspect, while 15 percent described themselves as being neutral.
Information on the monitoring results on properties in their own PCAs is required by almost half of those less than very satisfied with the information received, with regular updates on the whole PCA area required by the second largest group. Table 18 shows the types of information required by respondents.
Table 18 Information required by those less than "very satisfied" with information provision
(Percentage of respondents less than "very satisfied")
Regular updates on monitoring results in own PCA 49.6%
Regular updates on whole PCA programme 30.5%
Regular updates on control technologies 28.7%
Guidelines for contractors and owners 27.0%
Articles on possum behaviour 15.6%
Regular updates on licensing opportunities 11.3%
Information in the form of a postal newsletter is required by 67 percent of respondents, 16 percent would like to receive newsletters by email, nine percent would prefer to see articles in local newspapers, while less than one percent would be interested in reading articles on the HBRC website.
4.7.3 Service provision by HBRC Biosecurity Advisory Team
The service provided to PCA landowners by members of the HBRC Biosecurity Advisory Team is satisfactory to 67 percent of respondents, but unsatisfactory to 7.5 percent. Twenty-five percent described themselves as “neutral” about this service. The only comment made about this service by more than one or two respondents was made by three percent of respondents who knew nothing about the Biosecurity Advisory Team.
4.7.4 Programme management
Almost 80 percent of respondents described themselves as very satisfied or satisfied with the overall management of the PCA programme, while only 7 percent were slightly dissatisfied or very dissatisfied. Of the two percent who were very dissatisfied, all but one respondent had been opposed to the programme from the outset. No consistent reasons were given for dissatisfaction. The comments made by respondents on the programme overall are summarised in Table 19. The most commonly expressed concern was related to the likelihood of re-infestation from areas outside the boundaries of the PCAs (six percent of respondents) and areas of particular concern included riverbeds and bush areas. Several respondents expressed the view that although they believed that HBRC was responsible for possum control in riverbeds, they could see no evidence that this is being done. Others were concerned that any property on the boundaries of a PCA is at risk of re-infestation from
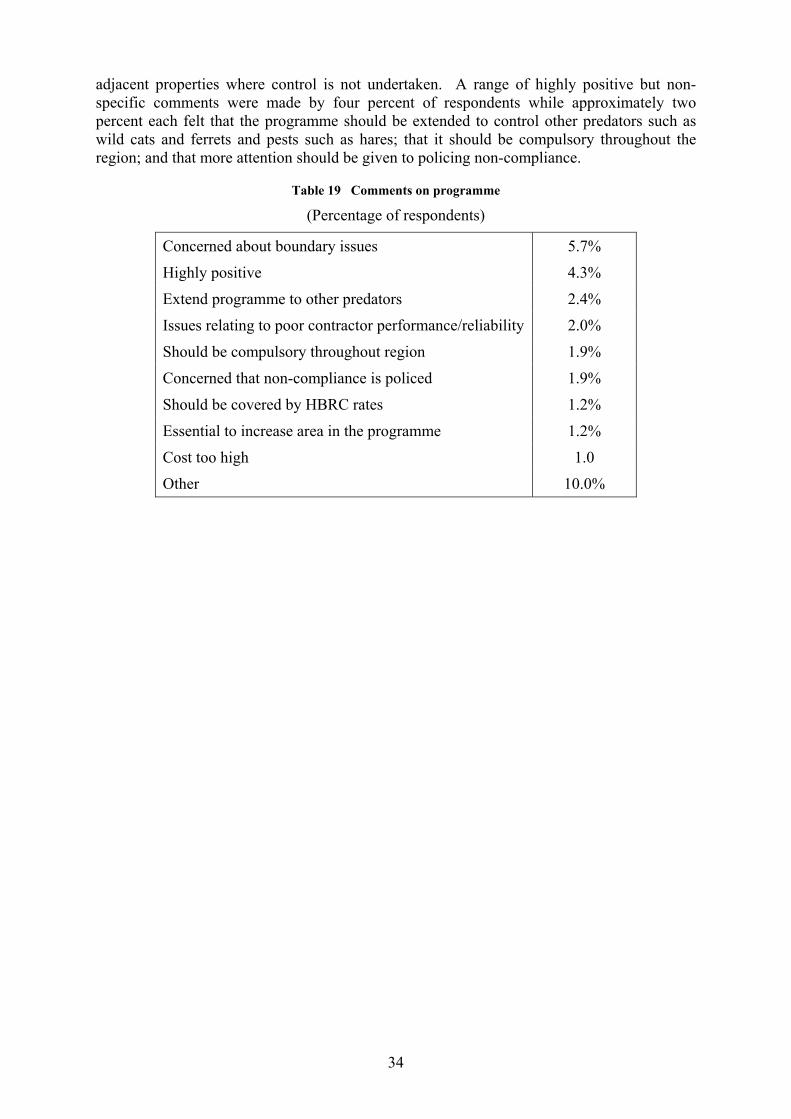
34
adjacent properties where control is not undertaken. A range of highly positive but non-specific comments were made by four percent of respondents while approximately two percent each felt that the programme should be extended to control other predators such as wild cats and ferrets and pests such as hares; that it should be compulsory throughout the region; and that more attention should be given to policing non-compliance.
Table 19 Comments on programme (Percentage of respondents)
Concerned about boundary issues 5.7%
Highly positive 4.3%
Extend programme to other predators 2.4%
Issues relating to poor contractor performance/reliability 2.0%
Should be compulsory throughout region 1.9%
Concerned that non-compliance is policed 1.9%
Should be covered by HBRC rates 1.2%
Essential to increase area in the programme 1.2%
Cost too high 1.0
Other 10.0%
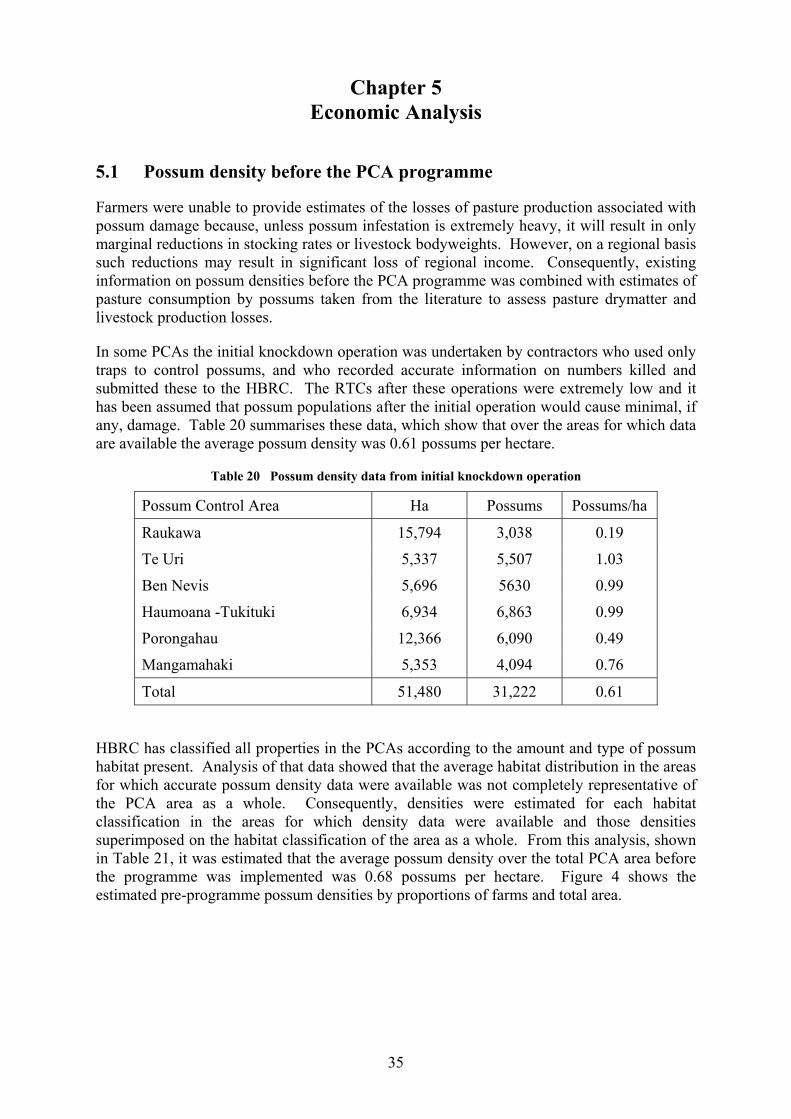
35
Chapter 5 Economic Analysis
5.1 Possum density before the PCA programme
Farmers were unable to provide estimates of the losses of pasture production associated with possum damage because, unless possum infestation is extremely heavy, it will result in only marginal reductions in stocking rates or livestock bodyweights. However, on a regional basis such reductions may result in significant loss of regional income. Consequently, existing information on possum densities before the PCA programme was combined with estimates of pasture consumption by possums taken from the literature to assess pasture drymatter and livestock production losses.
In some PCAs the initial knockdown operation was undertaken by contractors who used only traps to control possums, and who recorded accurate information on numbers killed and submitted these to the HBRC. The RTCs after these operations were extremely low and it has been assumed that possum populations after the initial operation would cause minimal, if any, damage. Table 20 summarises these data, which show that over the areas for which data are available the average possum density was 0.61 possums per hectare.
Table 20 Possum density data from initial knockdown operation
Possum Control Area Ha Possums Possums/ha
Raukawa 15,794 3,038 0.19
Te Uri 5,337 5,507 1.03
Ben Nevis 5,696 5630 0.99
Haumoana -Tukituki 6,934 6,863 0.99
Porongahau 12,366 6,090 0.49
Mangamahaki 5,353 4,094 0.76
Total 51,480 31,222 0.61
HBRC has classified all properties in the PCAs according to the amount and type of possum habitat present. Analysis of that data showed that the average habitat distribution in the areas for which accurate possum density data were available was not completely representative of the PCA area as a whole. Consequently, densities were estimated for each habitat classification in the areas for which density data were available and those densities superimposed on the habitat classification of the area as a whole. From this analysis, shown in Table 21, it was estimated that the average possum density over the total PCA area before the programme was implemented was 0.68 possums per hectare. Figure 4 shows the estimated pre-programme possum densities by proportions of farms and total area.
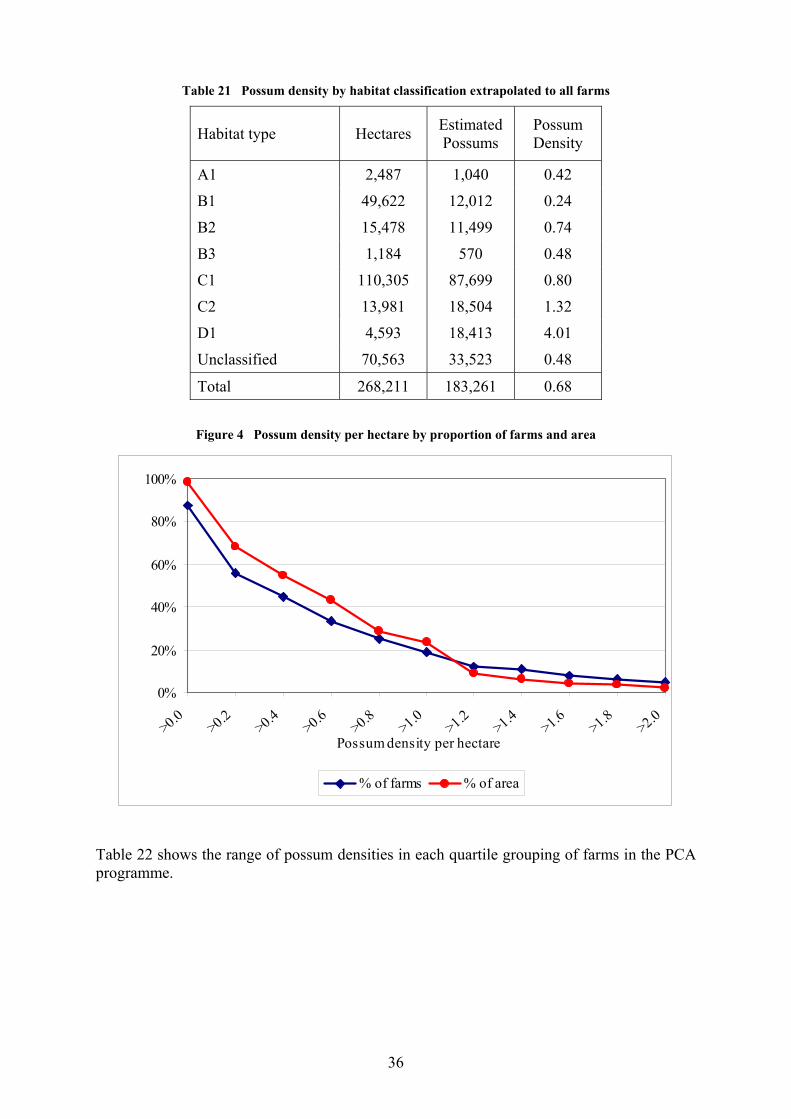
36
Table 21 Possum density by habitat classification extrapolated to all farms
Habitat type Hectares Estimated Possums
Possum Density
A1 2,487 1,040 0.42
B1 49,622 12,012 0.24
B2 15,478 11,499 0.74
B3 1,184 570 0.48
C1 110,305 87,699 0.80
C2 13,981 18,504 1.32
D1 4,593 18,413 4.01
Unclassified 70,563 33,523 0.48
Total 268,211 183,261 0.68
Figure 4 Possum density per hectare by proportion of farms and area
Table 22 shows the range of possum densities in each quartile grouping of farms in the PCA programme.
0%
20%
40%
60%
80%
100%
>0.0>0.2
>0.4>0.6
>0.8>1.0
>1.2>1.4
>1.6>1.8
>2.0
Possum density per hectare
% of farms % of area
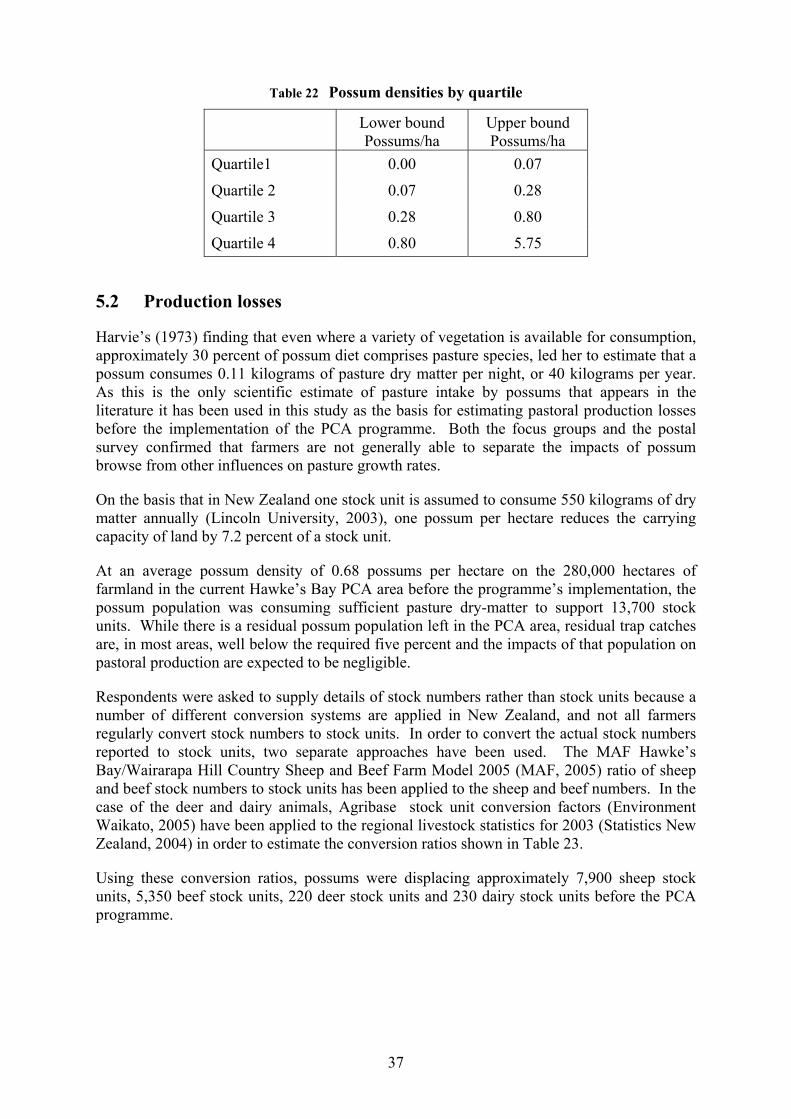
37
Table 22 Possum densities by quartile
Lower bound Possums/ha
Upper bound Possums/ha
Quartile1 0.00 0.07
Quartile 2 0.07 0.28
Quartile 3 0.28 0.80
Quartile 4 0.80 5.75
5.2 Production losses
Harvie’s (1973) finding that even where a variety of vegetation is available for consumption, approximately 30 percent of possum diet comprises pasture species, led her to estimate that a possum consumes 0.11 kilograms of pasture dry matter per night, or 40 kilograms per year. As this is the only scientific estimate of pasture intake by possums that appears in the literature it has been used in this study as the basis for estimating pastoral production losses before the implementation of the PCA programme. Both the focus groups and the postal survey confirmed that farmers are not generally able to separate the impacts of possum browse from other influences on pasture growth rates.
On the basis that in New Zealand one stock unit is assumed to consume 550 kilograms of dry matter annually (Lincoln University, 2003), one possum per hectare reduces the carrying capacity of land by 7.2 percent of a stock unit.
At an average possum density of 0.68 possums per hectare on the 280,000 hectares of farmland in the current Hawke’s Bay PCA area before the programme’s implementation, the possum population was consuming sufficient pasture dry-matter to support 13,700 stock units. While there is a residual possum population left in the PCA area, residual trap catches are, in most areas, well below the required five percent and the impacts of that population on pastoral production are expected to be negligible.
Respondents were asked to supply details of stock numbers rather than stock units because a number of different conversion systems are applied in New Zealand, and not all farmers regularly convert stock numbers to stock units. In order to convert the actual stock numbers reported to stock units, two separate approaches have been used. The MAF Hawke’s Bay/Wairarapa Hill Country Sheep and Beef Farm Model 2005 (MAF, 2005) ratio of sheep and beef stock numbers to stock units has been applied to the sheep and beef numbers. In the case of the deer and dairy animals, Agribase stock unit conversion factors (Environment Waikato, 2005) have been applied to the regional livestock statistics for 2003 (Statistics New Zealand, 2004) in order to estimate the conversion ratios shown in Table 23.
Using these conversion ratios, possums were displacing approximately 7,900 sheep stock units, 5,350 beef stock units, 220 deer stock units and 230 dairy stock units before the PCA programme.
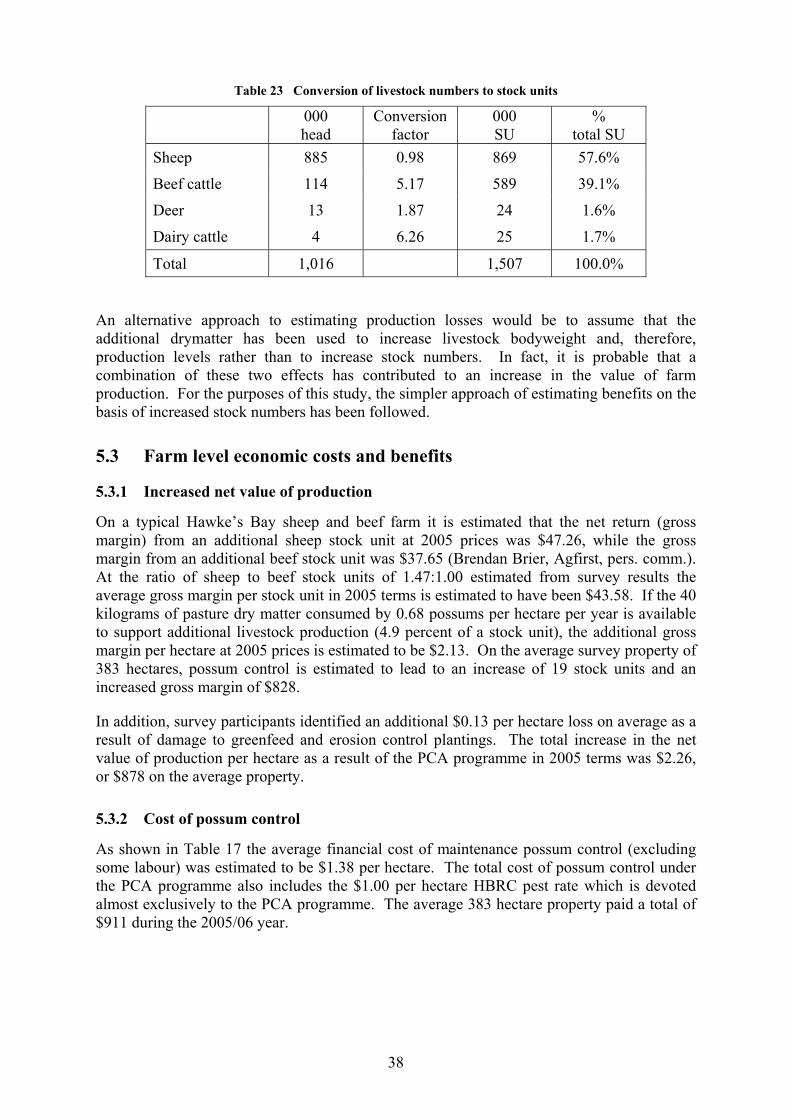
38
Table 23 Conversion of livestock numbers to stock units
000 head
Conversion factor
000 SU
% total SU
Sheep 885 0.98 869 57.6%
Beef cattle 114 5.17 589 39.1%
Deer 13 1.87 24 1.6%
Dairy cattle 4 6.26 25 1.7%
Total 1,016 1,507 100.0%
An alternative approach to estimating production losses would be to assume that the additional drymatter has been used to increase livestock bodyweight and, therefore, production levels rather than to increase stock numbers. In fact, it is probable that a combination of these two effects has contributed to an increase in the value of farm production. For the purposes of this study, the simpler approach of estimating benefits on the basis of increased stock numbers has been followed.
5.3 Farm level economic costs and benefits
5.3.1 Increased net value of production
On a typical Hawke’s Bay sheep and beef farm it is estimated that the net return (gross margin) from an additional sheep stock unit at 2005 prices was $47.26, while the gross margin from an additional beef stock unit was $37.65 (Brendan Brier, Agfirst, pers. comm.). At the ratio of sheep to beef stock units of 1.47:1.00 estimated from survey results the average gross margin per stock unit in 2005 terms is estimated to have been $43.58. If the 40 kilograms of pasture dry matter consumed by 0.68 possums per hectare per year is available to support additional livestock production (4.9 percent of a stock unit), the additional gross margin per hectare at 2005 prices is estimated to be $2.13. On the average survey property of 383 hectares, possum control is estimated to lead to an increase of 19 stock units and an increased gross margin of $828.
In addition, survey participants identified an additional $0.13 per hectare loss on average as a result of damage to greenfeed and erosion control plantings. The total increase in the net value of production per hectare as a result of the PCA programme in 2005 terms was $2.26, or $878 on the average property.
5.3.2 Cost of possum control
As shown in Table 17 the average financial cost of maintenance possum control (excluding some labour) was estimated to be $1.38 per hectare. The total cost of possum control under the PCA programme also includes the $1.00 per hectare HBRC pest rate which is devoted almost exclusively to the PCA programme. The average 383 hectare property paid a total of $911 during the 2005/06 year.
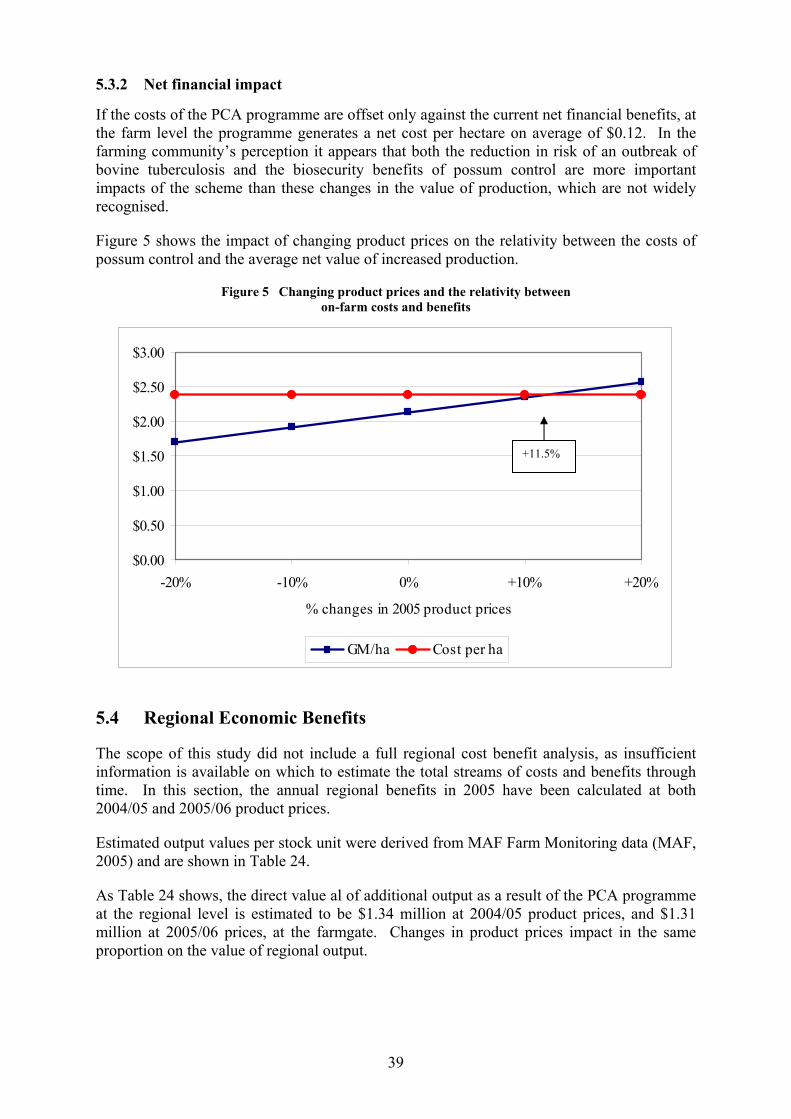
39
5.3.2 Net financial impact
If the costs of the PCA programme are offset only against the current net financial benefits, at the farm level the programme generates a net cost per hectare on average of $0.12. In the farming community’s perception it appears that both the reduction in risk of an outbreak of bovine tuberculosis and the biosecurity benefits of possum control are more important impacts of the scheme than these changes in the value of production, which are not widely recognised.
Figure 5 shows the impact of changing product prices on the relativity between the costs of possum control and the average net value of increased production.
Figure 5 Changing product prices and the relativity between on-farm costs and benefits
5.4 Regional Economic Benefits
The scope of this study did not include a full regional cost benefit analysis, as insufficient information is available on which to estimate the total streams of costs and benefits through time. In this section, the annual regional benefits in 2005 have been calculated at both 2004/05 and 2005/06 product prices.
Estimated output values per stock unit were derived from MAF Farm Monitoring data (MAF, 2005) and are shown in Table 24.
As Table 24 shows, the direct value al of additional output as a result of the PCA programme at the regional level is estimated to be $1.34 million at 2004/05 product prices, and $1.31 million at 2005/06 prices, at the farmgate. Changes in product prices impact in the same proportion on the value of regional output.
$0.00
$0.50
$1.00
$1.50
$2.00
$2.50
$3.00
-20% -10% 0% +10% +20%
% changes in 2005 product prices
GM/ha Cost per ha
+11.5%

40
Table 24 Estimated values of output per stock unit and in total
Output per SU 2004/05 2005/06
Sheep $90.17 $711,550 $92.48 $729,778
Beef $105.75 $566,471 $95.96 $514,029
Deer $66.51 $14,579 $71.74 $15,725
Dairy $219.99 $51,236 $212.77 $49,554
Total $1,343,835 $1,309,087
However, when any industry increases its output, it requires additional inputs from other industries, which in their turn also require inputs. This is called the “indirect effect”. The total direct and indirect effect is calculated by applying the Type IB multipliers shown in Table 25 to the initial value of the output increase at the farmgate. The regional share of the total value of output from all industries involved in increasing the output of the Hawke’s Bay farming sector is estimated to be $2.03 million per year at 2004/05 prices and $1.97 million per year at 2005/06 prices.
As the industries of Hawke’s Bay increase their output, households receive more income and consequently increase their demand for goods and services. This increases outputs from industries that produce those goods and services and from their supplying industries, which is known as the “induced effect”. The Type II multipliers shown in Table 25 are used to calculate the total value of direct, indirect and induced changes in output. This total annual value of output increase as a result of the PCA programme is estimated to be $2.3 million in 2004/05 terms and $2.24 million in 2005/06 terms.
In fact, the true economic impact of the programme is likely to lie between the estimated values of direct plus indirect and the total value of direct, indirect and induced output. Type I multipliers understate the total impact by excluding any induced effect, while Type II multipliers are likely to overstate it to some extent because of the way in which the underlying input-output model is constructed (Harris et al, 2004). Thus, as table 26 shows, the total regional increase in output from the area currently in the PCA programme is estimated to be in the vicinity of two million dollars per year at current prices while the regional value added (i.e contribution to GDP) is estimated to be approximately $1.1 million per year.
Table 25 Hawkes Bay regional multipliers - 1995-96 survey updated with 2001 prices
Multiplier Type Sheep/beef Dairy
Type 1B 1.51 1.43 Output
Type 2 1.71 1.69
Initial 0.50 0.54
Type 1B 1.48 1.35 Value added
Type 2 1.69 1.60
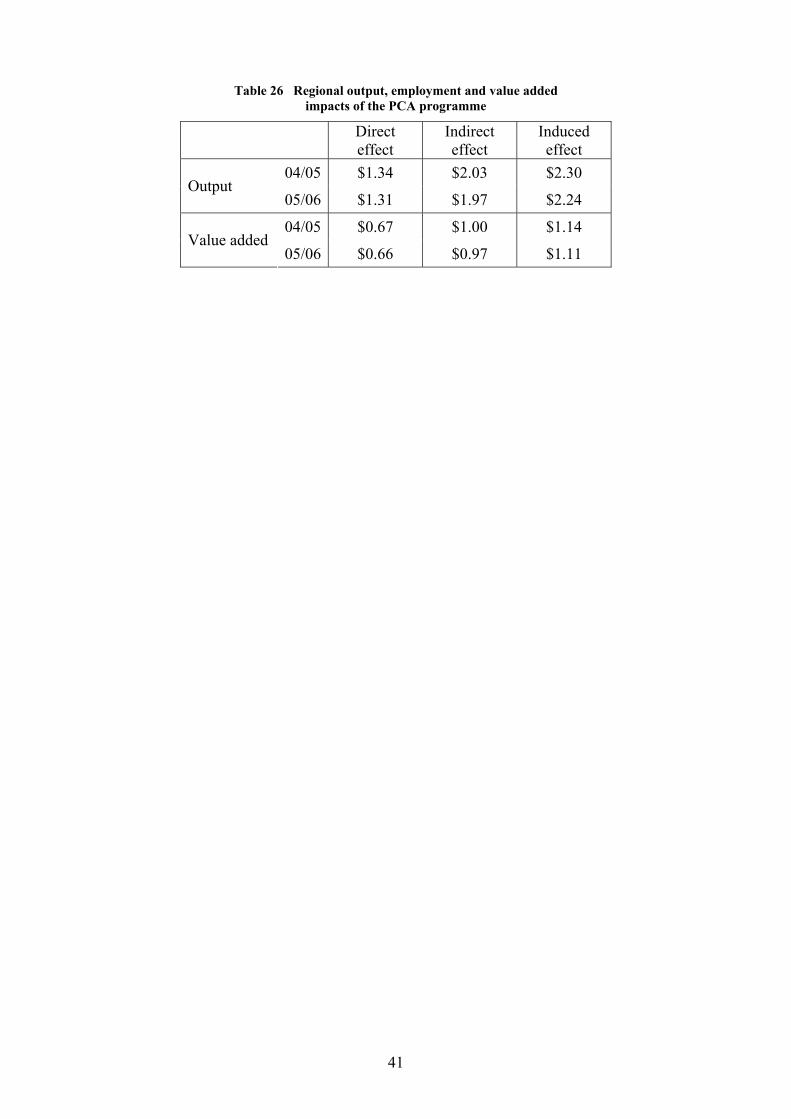
41
Table 26 Regional output, employment and value added impacts of the PCA programme
Direct effect
Indirect effect
Induced effect
04/05 $1.34 $2.03 $2.30 Output
05/06 $1.31 $1.97 $2.24
04/05 $0.67 $1.00 $1.14 Value added
05/06 $0.66 $0.97 $1.11

42
43
Chapter 6 Discussion and Conclusions
• The Possum Control Area programme in Hawke’s Bay has, in the view of the majority of its farmer stakeholders, been very successful in reducing the possum population to a level at which it has negligible impacts on productive, biosecurity and aesthetic values. The only concerns about the programme that have been expressed by more than a small number of survey and focus group participants relate to the risks of reinfestation from areas that are not presently under possum control. Most concerns were expressed about the risks of reinfestation from areas outside the existing scheme boundaries. These include riverbeds and areas of bush as well as adjacent uncontrolled properties and, in the widest context, other regions. Some respondents considered that the HBRC should be extending the area of the programme within Hawke’s Bay as rapidly as possible.
The programme enjoyed a high level of support at the outset and support amongst existing members has grown since the scheme was implemented. Over half of the stakeholders reported that their expectations of the scheme have been exceeded. Most (84 percent) consider that the value of the scheme equals or exceeds the money they spend on maintenance control and HBRC pest rates.
• The most important reason why farmers have elected to become part of PCAs is to reduce the risk of an outbreak of bovine tuberculosis in the area. Preserving biodiversity is the second most important reason for forming a PCA, followed by the need to reduce to possum damage to the home environment. The impacts of the scheme have also been greatest in these areas. Direct production values have been of lesser importance, both as a motivation for joining the programme and as one of its perceived impacts.
Although farmers have been prepared to finance possum control under the PCA programme from farm working expenses, they have done so without expectation that they will be able to recoup all of those costs directly through increased farm revenue, or that they will be able to internalise all the benefits to their own farming operations. The biodiversity benefits that have been both a significant motivator for joining PCAs and a major impact of the programme are “public goods” to be shared by the region as a whole.
• Some operational issues of the scheme warrant consideration, although satisfaction with the way in which it is presently operating is high. The issue of possum control round the boundaries of PCA areas, particularly in river beds and bush areas was of concern to a number of focus group and survey participants. They consider that the opportunities for individual farmers to benefit from their own maintenance control efforts are being limited by reinfestation from publicly managed areas, areas outside the programme and poorly controlled areas within the programme.
A higher level of feedback on the scheme, particularly with respect to monitoring results and information on the extent and consequences of non-compliance, is required by PCA members. While some do not appear to be aware of the results of monitoring on their own properties, many would like regular reports on the achievements of their whole PCA and of the programme as whole. This is a programme that is working and positive feedback would be appreciated.
A regular, probably quarterly, newsletter that PCA members can elect to receive by post or email would meet the information needs of most PCA members. This could include:
44
i. a regular update on all aspects of programme performance
ii. information on proposals to extend the programme area
iii. dates for opportunities to obtain poison licenses or any other educational opportunities that may be relevant
iv. an article on an aspect of possum behaviour or control technology
v. perhaps a case study on a property that is experiencing particular success or difficulties
The results of the focus groups and comments from a number of survey participants suggested the rationale behind, and approach taken to, monitoring is poorly understood and explanation of this should be a priority if a system of regular communication is to be established. A second priority for a specialist article is the preparation and publication of guidelines for contractors and those who undertake control themselves on aspects such as bait station placement, etc. (see Section 3.5.2).
A further aspect of communication, not covered by the survey specifically, is that of communication with the ratepayers of the wider Hawke’s Bay region, who are also stakeholders in the programme. This programme has positive environmental and economic benefits for the region as a whole, not just part of its farming community, and although articles in local papers are not the preferred means of communication for PCA members, they may be of value in informing other stakeholders and in encouraging other farming areas to consider joining the programme.
The third operational issue highlighted by focus group and some survey participants was the inconsistency of contractor performance. Some contractors are very highly regarded for their efficiency, reliability and communication with customers. The most frequently cited complaint about others was that they “did not turn up”, but some doubts about competence were also raised. The PCA programme may be improved if a quality control and education system for contractors can be implemented by HBRC.
• As reported by survey respondents, the average costs of control are very much lower when undertaken using farm labour than when employing contractors ($0.77 compared with $1.74). However, a number of respondents noted that their estimate did not include labour, and it was evident from the low per hectare costs reported by others, that they too had excluded any valuation of labour. Consequently, farmer decision-making in this area may be based on a distorted perception of the relativity between the costs of the two approaches to maintenance control.
• Assessment of the economic effects of the PCA programme is difficult because of the diversity of its impacts. Aspects completely outside the scope of this study include the major impacts of reduction in risk of bovine tuberculosis outbreaks and biodiversity protection. Because the impacts of possums on pastoral productivity are, for the majority of farmers, small in comparison with the impacts of other physical and economic influences on farm production and revenue, they are not able to identify them separately. It has, however, been established in the literature that possums do consume pasture and the results of this study suggest that on average, the costs of the PCA programme to farmers are almost met by the potential increases in stock production that result from increased pasture availability. Given that these are regarded as a less important impact of the programme than risk reduction and biodiversity protection, the total benefits of the scheme to individual farmers are undoubtedly positive. This is supported by the fact that
45
the majority of participants believe that they are getting “value for money” from the PCA programme.
At a regional level, the direct benefits of increased pastoral production accrue directly to the farming community, but the downstream benefits associated with increased activity in other industries and increased regional income accrue to the wider community. While it is estimated that the total regional increase in output associated with the PCA is of the order of two million dollar per annum at 2005 prices, approximately 40 percent of that, or almost 800,000 dollars, and a similar percentage of the total value added as a result of the programme, accrues beyond the farmgate. A similar proportion of any reduction in output as a result of an outbreak of bovine tuberculosis would also be incurred by other industries and consumers, and the biodiversity benefits of the scheme are shared by all of Hawke’s Bay.

46
47
References Animal Health Board, (2001). Bovine tuberculosis Pest Management Strategy 2001-2013.
An amendment Proposal prepared by the Animal Health Board Incorporated. Wellington New Zealand.
Animal Health Board. (2003). Annual report for the year ending 30 June 2004. Retrieved
August 18, 2005 from: http://www.ahb.org.nz/AHBWebsite/AHB/AnnualReports/ Animal Health Board. (2004). Annual report for the year ending 30 June 2004. Retrieved
August 18, 2005 from: http://www.ahb.org.nz/AHBWebsite/AHB/AnnualReports/ Animal Health Board. (2005). Annual report for the year ending 30 June 2004. Retrieved
March 3, 2006 from: http://www.ahb.org.nz/AHBWebsite/AHB/AnnualReports/ Animal Health Board. (2005). About the Strategy: progress. Retrieved August 18, 2005
from: http://www.ahb.org.nz/AHBWebsite/NationalTBStrategy/2_1+About+the+Strategy/2.1.2+Progress.htm
Batcheler C.L. (1983). The possum and rata-kamahi dieback in New Zealand. Pacific
Science 37: 415-426. Batcheler C.L. and Cowan, P.E. (1988). Review of The status of the possum (Trichosurus
vulpecula) In New Zealand. Unpublished FRI contract Report to the Technical Advisory Committee (Animal Pests) for the Agricultural Pests Destruction Council, Department of Conservation, and Ministry of Agriculture and Fisheries, Wellington. 129 pp.
Bellingham, P.J. et al. (1999). Impacts of possum browsing on the long-term maintenance of
forest biodiversity. Science for Conservation: 103. Wellington, New Zealand Forest Service. 30pp.
Brown, K., Innes, J. and Shorten, R. (1993). Evidence that possums prey on and scavenge
birds’ eggs, birds and mammals. Notornis 40:169-177. Campbell, D.J. (1990). Changes in structure and composition of a New Zealand lowland
forest inhabited by brushtail possums. Pacific Science 44: 277-296. Clough, P and Nixon, C. (2000). Coughing up for Bovine Tb control: economic review of
the Proposed National Pest Management Strategy for Bovine Tuberculosis Treasury Working Paper 00.24. Prepared at NZIER.
Coleman, J. and Livingstone, P. (2000). Fewer possums: less bovine Tb. In Montague, T.L.
ed. The Brushtail Possum: Biology, impact and management of an introduced marsupial. Manaaki Whenua Press, Lincoln, New Zealand, pp220-231.
Cowan, P.E. (1993). Environmental Pests: How can we identify the values at risk? New
Zealand Journal of Zoology 20:279-283. Cowan, P.E. (1996). Possum Biocontrol: Prospects for Fertility Regulation. Reproduction,
Fertility and Development 8:655-660.
48
Cowan, P.E. and Moeed, A. (1987). Invertebrates in the diet of brushtail possums. Trichosurus vulpecula, in the lowland podocarp/broadleaf forest, Orongorongo Valley; Wellington, New Zealand. New Zealand Journal of Zoology 14: 163-177.
Butcher, S. (2000). Impact of possums on primary production. In Montague, T.L. ed. The
Brushtail Possum: Biology, impact and management of an introduced marsupial. Manaaki Whenua Press, Lincoln, New Zealand, pp105-110.
Crump, J.A., Murdoch, D.R. and Baker, M.G. (2001). Emerging infectious diseases in an
island ecosystem: the New Zealand perspective. Emerging Infectious Diseases 7(5) 767-772.
Department of Conservation. (2000). The New Zealand Biodiversity Strategy. February
2000. Retrieved 22 August 2005 from: http://www.biodiversity.govt.nz/picture/doing/nzbs/index.html
Environment Waikato. (2005). Stock Density Technical Information. Retrieved March 3
2006 from:http://www.ew.govt.nz/enviroinfo/indicators/land/use/riv9/techinfo.htm Fitzgerald, A.E. (1977).Letter to the Editor, Proceedings of the New Zealand Ecological
Society 24:139. Green, W.Q. and Coleman, J.D. (1981). A progress report on the movements of possums
between native forest and pasture. In Bell, B. D. ed. Proceedings of the first symposium on marsupials in New Zealand. Zoology Publications from the Victoria University of Wellington No 74:51-62.
Harris, S, Clough, P., Walton, M and Taylor, N. (2004). Regional Economic Analysis –Uses
of Water in the Waitaki Catchment. Wellington, Ministry for the Environment. 102 pp.
Hawke’s Bay Regional Council. (2001). Regional Plant Pest and Animal Pest Strategy. July
2001. Retrieved August 18, 2005 from: http://www.hbrc.govt.nz/Portals/57ad7180-c5e7-49f5-b282-c6475cdb7ee7/Pest%20 Management%20Strategy.pdf
Hawke’s Bay Regional Council. (2003). 2002-2003 Annual Report. Retrieved August 18, 2005 from: http://www.hbrc.govt.nz/DesktopDefault.aspx?tabid=256
Hawke’s Bay Regional Council. (2004). 2003-2004 Annual Report. Retrieved August 18, 2005 from: http://www.hbrc.govt.nz/DesktopDefault.aspx?tabid=256
Hawke’s Bay Regional Council. (2004). Possum Control: A guide to Self-help Possum Control areas. Environmental topics: Animal Pest Control. Retrieved August 22, 2005 from: http://www.hbrc.govt.nz/Portals/57ad7180-c5e7-49f5-b282-c6475cdb7ee7/ PossumControl.pdf
Hawke’s Bay Regional Council. (2005). 2004-2005 Annual Report. Retrieved August 18, 2005 from:
49
http://www.hbrc.govt.nz/DesktopDefault.aspx?tabid=256 Horner, D.W.., Heath, D.D. and Cowan, P.E. (1996). Distribution of leptospirosis in
possums from New Zealand and its offshore islands. New Zealand Veterinary Journal 44:161.
Innes, J. (1994). The Impacts of Possums on Native Flora. In O’Donnell, C.F.S. edp.
Possums as Conservation Pests. Proceedings of a Workshop on Possums as Conservation Pests. Possum and Bovine TB Control NSS Committee 29-30 November, 1994. Christchurch.
Innes, J., Crook, B, and Jansen, P. (1994). A time-lapse video camera system for detecting
predators at nests of forest birds: A trial with North Island kokako. In: Bishop, I ed. Proceedings of the Resource Technology ’94 Conference, Melbourne. University of Melbourne Press. Pp 439-448.
Innes, J, Brown, K., Shorten R and Williams, D. (1996). Kokako population studies at
Rotoehu Forest and on Little Barrier Island. Science for Conservation 30. Wellington, Department of Conservation, 39p.
James, R.E. and Clout, M.N. (1996) Nesting success of New Zealand pigeons (Hemiphaga
novaeseelandia) in response to a rat (Rattus rattus) poisoning programme at Wenderholm Regional Park. New Zealand Journal of Ecology 20(1): 45-51.
Kirk, H.B. (1920). Opossums in New Zealand. Wellington, New Zealand. Appendices to the
Journal of the House of Representatives. 12pp. Keber, A.W. (1988). An enquiry into the economic significance of possum damage in an
exotic forest near Taupo. Unpublished PhD thesis, 2 vols, University of Auckland New Zealand.
Lincoln University. (2003). Farm Technical Manual. Fleming, P.H. (Ed.), Farm Technical
Manual. Dept of Farm and Horticultural Management, Lincoln University. Livestock Improvement Corporation. (2004). Dairy Statistics 2003-2004. Retrieved August
22, 2005 from: http://www.lic.co.nz/113_7.cfm Marino, M.R. et al. (1992). (2004). Giardia intestinalis in North Island possums, house mice
and ship rats. New Zealand Veterinary Journal 40: 24-27. McLennan, et al. (1996) Role of predation in the decline of kiwi, Apteryx spp., in New
Zealand. New Zealand Journal of Ecology 20(1): 27-35. Ministry of Agriculture and Forestry. (2000). New Zealand Forestry Statistics 2000.
Retrieved August 31, 2005 from: http://www.maf.govt.nz/statistics/primaryindustries/forestry/nzstats2000/asection/asection.htm
Ministry of Agriculture and Forestry. (2002). Land Cover Database. Retrieved April 26, 2006 from: http://www.maf.govt.nz/statistics/primaryindustries/landcover/index.htm
50
Ministry of Agriculture and Forestry. (2005). Farm Monitoring Reports (various). Retrieved March 3 2006 from: http://www.maf.govt.nz/mafnet/rural-nz/statistics-and-forecasts/farm-monitoring/ index.htm
Ministry of Health. (2001). An Integrated Approach to Infectious Disease: Priorities for Action 2002–2006. November 2001. Retrieved August 24, 2005 from: http://www.moh.govt.nz/moh.nsf/0/B1A861634F82C22CCC256AFA00792AF6/$File/integratedapproachtoinfectiousdisease-prioritiesforaction.pdf
Ministry of Health. (2003). Guidelines for Tuberculosis Control in New Zealand December 2002. Retrieved August 24, 2005 from: http://www.moh.govt.nz/moh.nsf/0/4760DF3580A6F5B5CC256C86006ED394/$File/TBControlGuidelines03.pdf
Ministry of Health. (2005). Drinking-water Standards for New Zealand 2005. May 2005. Retrieved August 24, 2005 from: http://www.moh.govt.nz/moh.nsf/0/12F2D7FFADC900A4CC256FAF0007E8A0/$File/drinkingwaterstandards-nz2005.pdf
Mowbray, S.C. (1992). Eradication of introduced Australian marsupials (brushtail possum and brushtailed rock wallaby) from Rangitoto and Motutapu Islands, New Zealand. In Veitch, C.R. and Clout, M.N. eds. Turning the tide: the eradication of invasive species. IUCN SSC Invasive Species Specialist Group, IUCN. Switzerland and Cambridge UK.
Nelson, P.C. (1983). Possum control: horticultural crops and orchards. Aglink: Horticultural
Production and Practice No 273. Wellington, Ministry of Agriculture and Fisheries. 4pp.
Northland Regional Council. (2004). Pest Management Strategy 2004. Retrieved August 23 from: http://www.nrc.govt.nz/pests.and.weeds/pdf/Pest%20Mgmt%20Strategy/ Possums.pdf
Norton, D. (2000). Benefits of possum control for native vegetation. In Montague, T.L. ed The Brushtail Possum: Biology, impact and management of an introduced marsupial. Manaaki Whenua Press, Lincoln, New Zealand, pp232-238.
Occupational Safety and Health Service. (2001). Leptospirosis. Farming Bulletin 7. Retrieved August 24, 2005 from: http://www.osh.govt.nz/order/catalogue/pdfs/farm007.pdf
Parliamentary Commissioner for the Environment. (1994). Possum Management in New
Zealand. Wellington, New Zealand. Payton, I.J. (2000). Damage to native forests. In Montague, T.L. ed The Brushtail Possum:
Biology, impact and management of an introduced marsupial. Manaaki Whenua Press, Lincoln, New Zealand, pp111-125.
Pracy, L.T. and Kean, R.I. (1949). Control of opossums an urgent problem. New Zealand
Journal of Agriculture 78: 225-232.
51
Rose, A.B., Pekelharing, C.J. and Platt, K.H. (1992). Magnitude of canopy dieback and implications for conservation of southern rata-kamahi (Metrosideros umbellate-Weinmannia racemosa) foests, Central Westland, New Zealand. New Zaeland Journal of Ecology 16: 23-32.
Quinn, J. (1968). Opossums deplete Wanganui pastures. New Zealand Journal of
Agriculture 117(5):17-20. Sadleir, C. (2000). Evidence of possums as predators of native animals. In Montague, T.L.
ed. The Brushtail Possum: Biology, impact and management of an introduced marsupial. Manaaki Whenua Press, Lincoln, New Zealand, pp126-131.
Spurr, E.B. and Jolly, J.N. (1981). Damage by possums Trichosurus vulpecula to farm crops
and pasture. In Bell, B. D. ed. Proceedings of the first symposium on marsupials in New Zealand. Zoology Publications from the Victoria University of Wellington No 74:197-202.
Spurr, E.B. and Anderson, S.H. (2004). Short Communication : Bird species diversity and
abundance before and after eradication of possums and wallabies on Rangitoto Island, Hauraki Gulf, New Zealand. New Zealand Journal of Ecology 28(1): 143-149.
Statistics New Zealand. (2004). Agricultural Production Statistics (Final). June 2004. Retrieved August 18, 2005 from: http://www2.stats.govt.nz/domino/external/pasfull/pasfull.nsf/7cf46ae26dcb6800cc256a62000a2248/4c2567ef00247c6acc256fe2001333dd?OpenDocument
Statistics New Zealand. (2004). Forestry by Regional Council. June 2004. Retrieved August 18, 2005 from: http://xtabs.stats.govt.nz/eng/TableViewer/Wdsview/dispviewp.asp?ReportName=Agriculture/Forestry%20by%20Regional%20Council
Thornley, C.N., Baker M.G., Weinstein, P and Maas, E.W. (2002). Changing epidemiology of human leptospirosis in New Zealand. Epidemiology Infect 128(1): 29-36.
Veltman, C. (2000). Do native wildlife benefit from possum control. In Montague, T.L. ed.
The Brushtail Possum: Biology, impact and management of an introduced marsupial. Manaaki Whenua Press, Lincoln, New Zealand, pp241-250.
Vision 2020. (2002). Collaborating for Community Prosperity: Hawke’s Bay’s Economic
Development Strategy. Prepared for Vision 2020 by Innovations Systems, April 2002. Retrieved August 18, 2005 from: http://www.investhawkesbay.com/docs/edastrategy.pdf
Wardle, J (1984). The New Zealand beeches: ecology, utilization and management. Christchurch, New Zealand Forest Service.

52

53
APPENDIX 1
THE POSTAL QUESTIONAIRE
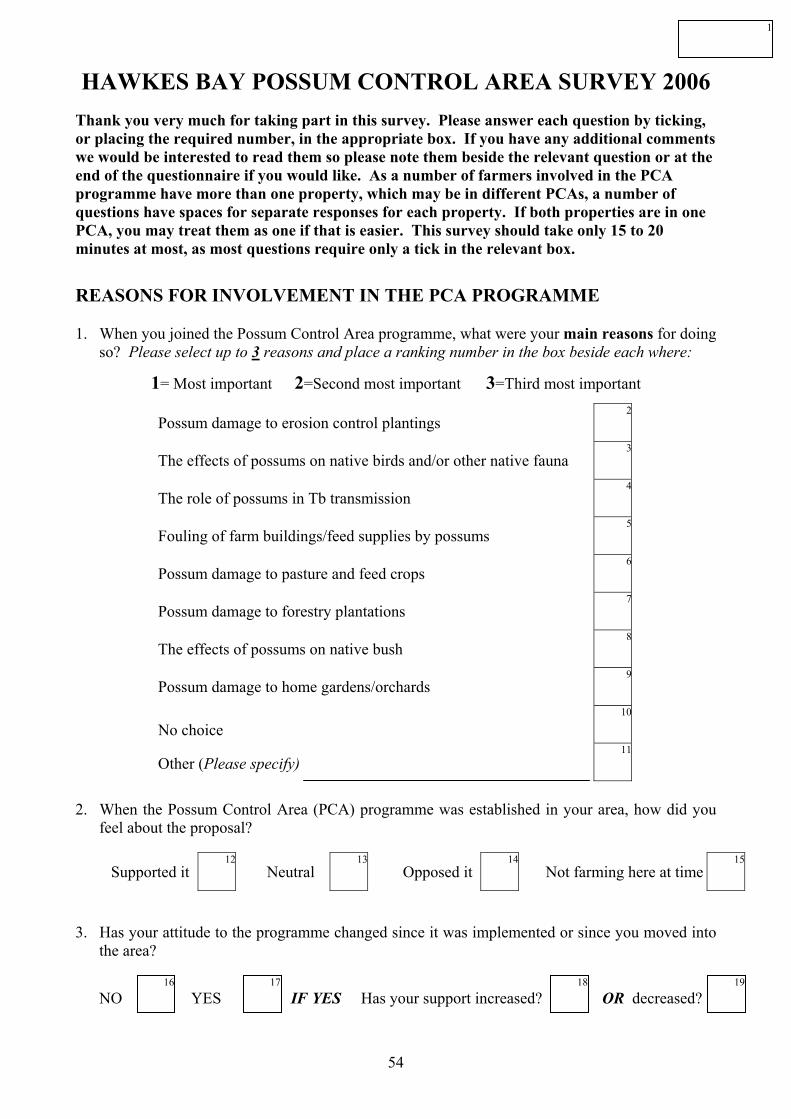
54
HAWKES BAY POSSUM CONTROL AREA SURVEY 2006 Thank you very much for taking part in this survey. Please answer each question by ticking, or placing the required number, in the appropriate box. If you have any additional comments we would be interested to read them so please note them beside the relevant question or at the end of the questionnaire if you would like. As a number of farmers involved in the PCA programme have more than one property, which may be in different PCAs, a number of questions have spaces for separate responses for each property. If both properties are in one PCA, you may treat them as one if that is easier. This survey should take only 15 to 20 minutes at most, as most questions require only a tick in the relevant box.
REASONS FOR INVOLVEMENT IN THE PCA PROGRAMME
1. When you joined the Possum Control Area programme, what were your main reasons for doing so? Please select up to 3 reasons and place a ranking number in the box beside each where:
1= Most important 2=Second most important 3=Third most important
Possum damage to erosion control plantings 2
The effects of possums on native birds and/or other native fauna 3
The role of possums in Tb transmission 4
Fouling of farm buildings/feed supplies by possums 5
Possum damage to pasture and feed crops 6
Possum damage to forestry plantations 7
The effects of possums on native bush 8
Possum damage to home gardens/orchards 9
No choice 10
Other (Please specify) 11
2. When the Possum Control Area (PCA) programme was established in your area, how did you feel about the proposal?
Supported it 12
Neutral 13
Opposed it 14
Not farming here at time15
3. Has your attitude to the programme changed since it was implemented or since you moved into the area?
NO YES IF YES Has your support increased? OR decreased?
1
16 17 18 19
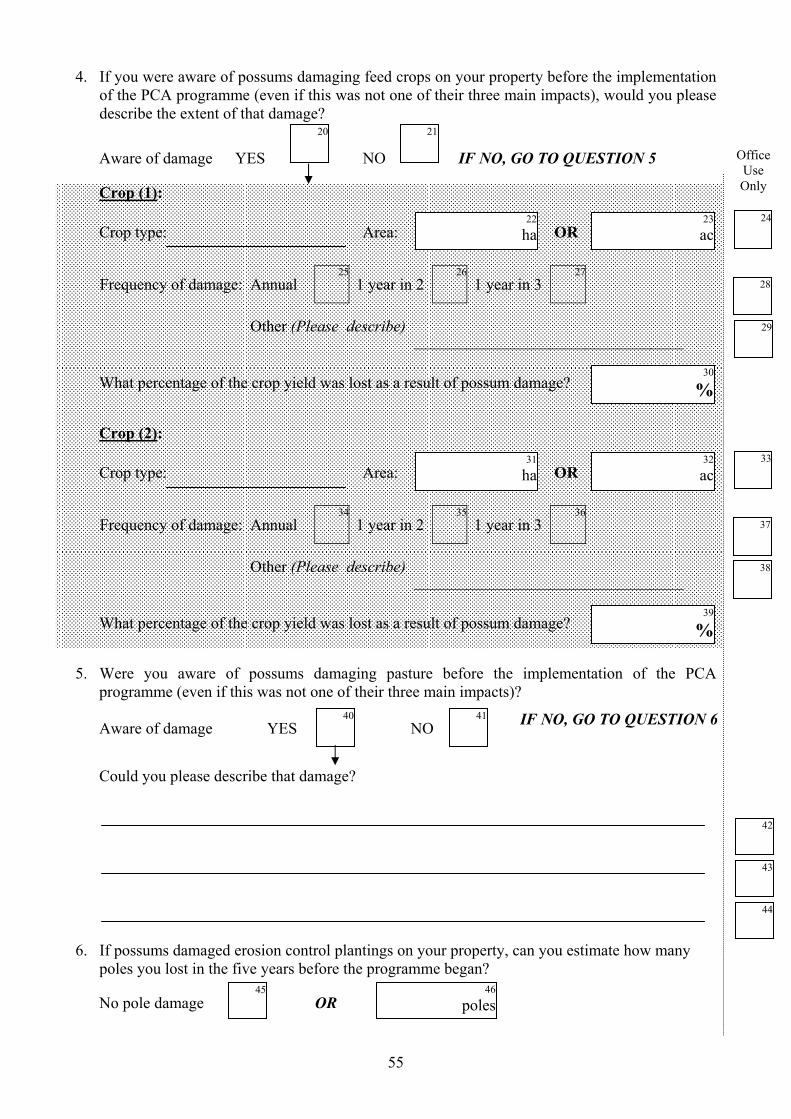
55
Office Use Only
4. If you were aware of possums damaging feed crops on your property before the implementation of the PCA programme (even if this was not one of their three main impacts), would you please describe the extent of that damage?
Aware of damage YES NO IF NO, GO TO QUESTION 5
Crop (1):
Crop type: Area: OR
Frequency of damage: Annual 25
1 year in 2 26
1 year in 3 27
Other (Please describe)
What percentage of the crop yield was lost as a result of possum damage?
Crop (2):
Crop type: Area: OR
Frequency of damage: Annual 34
1 year in 2 35
1 year in 3 36
Other (Please describe)
What percentage of the crop yield was lost as a result of possum damage?
5. Were you aware of possums damaging pasture before the implementation of the PCA programme (even if this was not one of their three main impacts)? Aware of damage YES NO
Could you please describe that damage?
6. If possums damaged erosion control plantings on your property, can you estimate how many poles you lost in the five years before the programme began?
No pole damage OR
20 21
22
ha23
ac
28
29
30
%
24
31
ha32
ac
37
38
39
%
33
42
43
46
poles
40 41 IF NO, GO TO QUESTION 6
44
45
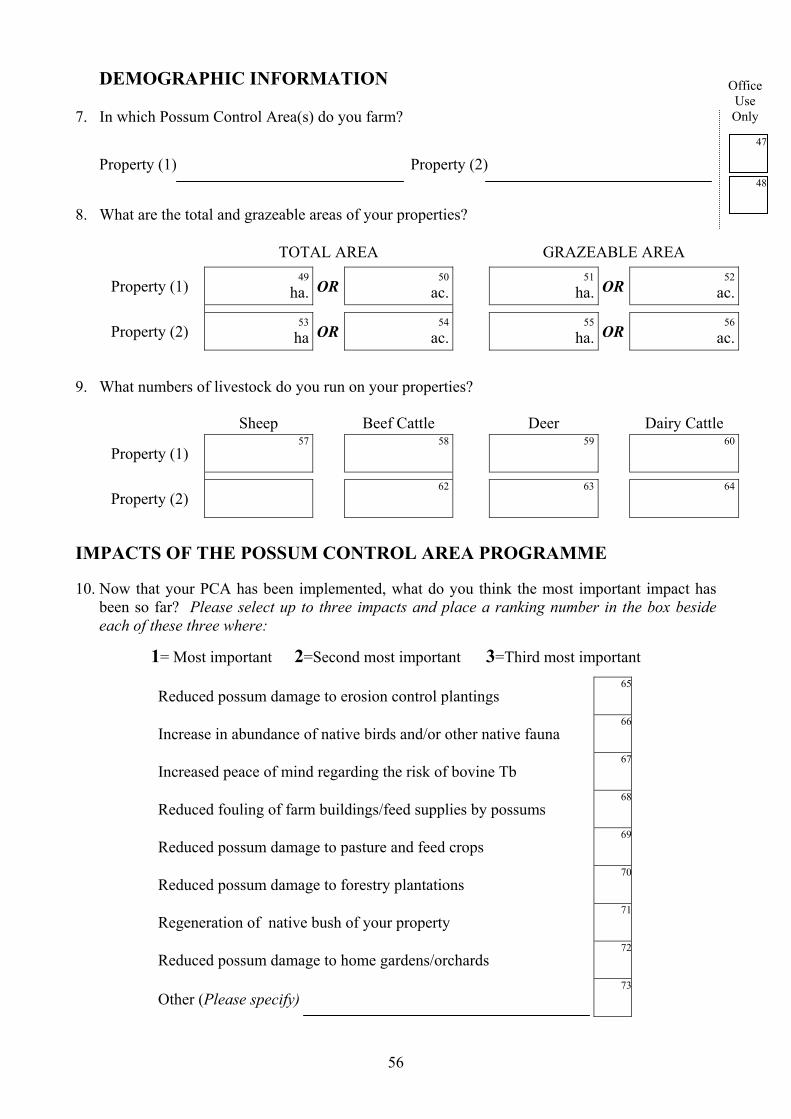
56
DEMOGRAPHIC INFORMATION
7. In which Possum Control Area(s) do you farm?
Property (1) Property (2)
8. What are the total and grazeable areas of your properties?
TOTAL AREA GRAZEABLE AREA
Property (1) 49
ha. OR50
ac. 51
ha. OR 52
ac.
Property (2) 53
ha OR54
ac. 55
ha. OR 56
ac.
9. What numbers of livestock do you run on your properties?
Sheep Beef Cattle Deer Dairy Cattle
Property (1) 57 58 59 60
Property (2) 62 63 64
IMPACTS OF THE POSSUM CONTROL AREA PROGRAMME
10. Now that your PCA has been implemented, what do you think the most important impact has been so far? Please select up to three impacts and place a ranking number in the box beside each of these three where:
1= Most important 2=Second most important 3=Third most important
Reduced possum damage to erosion control plantings 65
Increase in abundance of native birds and/or other native fauna 66
Increased peace of mind regarding the risk of bovine Tb 67
Reduced fouling of farm buildings/feed supplies by possums 68
Reduced possum damage to pasture and feed crops 69
Reduced possum damage to forestry plantations 70
Regeneration of native bush of your property 71
Reduced possum damage to home gardens/orchards 72
Other (Please specify) 73
Office Use Only
48
47
57
11. Have the impacts of the PCA programme to date been:
Better than expected? 74
About what you expected? 75
Less than expected? 76
12. Do you have any comments you would like to make about the impacts of the PCA programme on your farm or in your area?
We would like to be able to estimate the number of possums that were on your property before the programme was implemented.
13. If you kept possums on your property to a low level by shooting before joining the PCA programme, can you estimate the numbers of possums killed per year?
No estimate 80
Possums killed Property 181
Possums killed Property 2 82
14. Do you have any other estimates of the numbers of possums on your property before the PCA programme? If so could you describe these please?
15. If you provided estimates of losses of feed crops before the PCA programme in Question 4, what level of loss resulting from possum damage have you typically experienced since joining the PCA programme?
No losses before PCA IF SO GO TO QUESTION 17 NEXT PAGE
Losses in Crop 1 after PCA Losses in Crop 2 after PCA
78
79
77
Office use only
84
85
83
86
87
%88
%

58
16. If you described pasture losses in Question 5, how have these changed since you joined the programme? IF NOT GO TO QUESTION 17
17. If you are able to identify any other reductions in the costs of possum damage on your property(ies) as a result of the PCA programme, could you please describe these briefly and, if possible put a dollar figure on the annual savings from them?
Annual cost saving
18. What is (are) the annual costs of maintenance control under the PCA programme on your property(ies)?
Property 1 Property 2
19. Overall, do you feel that you are getting value for money from the money you spend on the Possum Control Area Programme (both in pest rates and in maintenance control of possums on your property)?
Value exceeds what I pay 96
Value equals what I pay 97
Value less than I pay 98
OPERATIONAL ISSUES
20. How satisfied are you with the amount of information about the PCA programme you receive from the Hawke’s Bay Regional Council?
Very satisfied
99Satisfied
100Neutral
101 Slightly dissatisfied
102 Very dissatisfied
103
IF YOU ARE VERY SATISFIED, GO TO QUESTION 22, OTHERWISE PLEASE CONTINUE
Office use only
89
90
91
92
93
$
94
$ 95
$ 95A
59
21. Would you like to receive more information about:
Regular updates on control technologies e.g. how to minimise bait shyness,new poisons
104
Regular updates on monitoring results in your PCA 105
Regular updates on the PCA programme in Hawke’s Bay as a whole 106
Articles on possum behaviour 107
Regular updates on opportunities to obtain licenses for using poisons 108
Guidelines for contractors and those who do their own control on bait station placement etc.
109
Other (1) (Please describe)
Other (2) (Please describe)
22. Would you prefer to receive this information in the form of:
Postal newsletter 112
Email newsletter 113
Articles on HBRC website 114
Articles in local papers 115
Other (Please describe)
23. How satisfied are you with the service you receive from the Hawkes Bay Biosecurity Team Officers with respect to your involvement in the PCA programme?
Very satisfied
116Satisfied
117Neutral
118 Slightly dissatisfied
119 Very dissatisfied
120
Please describe any changes to that service that you think would improve it.
24. Do you use contractors for your maintenance work under the PCA programme or undertake the work using farm labour?
123
122
121
Office use only
110
111
115A
60
Contractors only 124
Farm labour only 125 Mix of contractors
and farm labour 126
25. What are your main reasons for undertaking the work in this way?
26. Overall, how satisfied are you with the way in which the Possum Control Area programme is being managed?
Very satisfied
129Satisfied
130 Neutral
131 Slightly dissatisfied
132 Very dissatisfied
133
27. Do you have any other comments you would like to make about any aspect of the PCA
programme?
Thank you very much for taking part in the survey. This information will help us understand the potential benefits to the region from the programme’s implementation. Could you please return the questionnaire in the postage-paid envelope provided?
137
99
127
134
135
136
Office use only
128
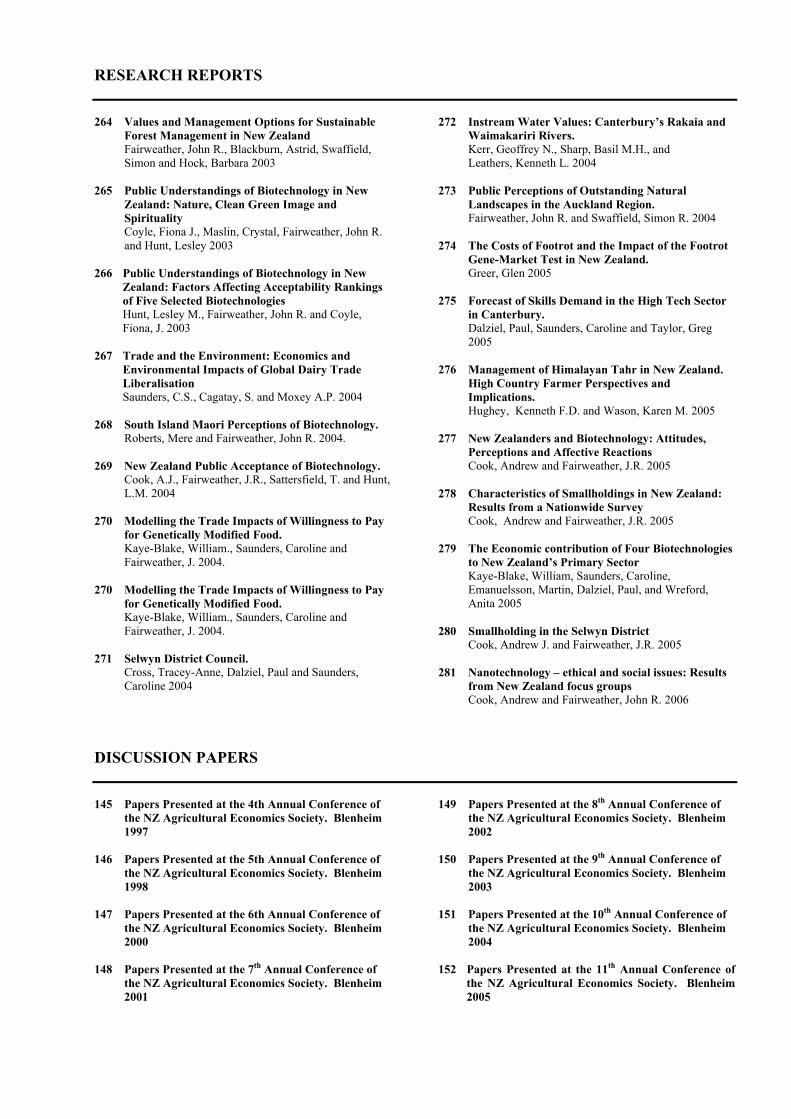
RESEARCH REPORTS 264 Values and Management Options for Sustainable Forest Management in New Zealand Fairweather, John R., Blackburn, Astrid, Swaffield, Simon and Hock, Barbara 2003 265 Public Understandings of Biotechnology in New Zealand: Nature, Clean Green Image and Spirituality Coyle, Fiona J., Maslin, Crystal, Fairweather, John R. and Hunt, Lesley 2003 266 Public Understandings of Biotechnology in New
Zealand: Factors Affecting Acceptability Rankings of Five Selected Biotechnologies Hunt, Lesley M., Fairweather, John R. and Coyle, Fiona, J. 2003
267 Trade and the Environment: Economics and Environmental Impacts of Global Dairy Trade Liberalisation
Saunders, C.S., Cagatay, S. and Moxey A.P. 2004
268 South Island Maori Perceptions of Biotechnology. Roberts, Mere and Fairweather, John R. 2004. 269 New Zealand Public Acceptance of Biotechnology. Cook, A.J., Fairweather, J.R., Sattersfield, T. and Hunt,
L.M. 2004 270 Modelling the Trade Impacts of Willingness to Pay
for Genetically Modified Food. Kaye-Blake, William., Saunders, Caroline and
Fairweather, J. 2004. 270 Modelling the Trade Impacts of Willingness to Pay for Genetically Modified Food. Kaye-Blake, William., Saunders, Caroline and
Fairweather, J. 2004. 271 Selwyn District Council. Cross, Tracey-Anne, Dalziel, Paul and Saunders, Caroline 2004
272 Instream Water Values: Canterbury’s Rakaia and Waimakariri Rivers. Kerr, Geoffrey N., Sharp, Basil M.H., and Leathers, Kenneth L. 2004 273 Public Perceptions of Outstanding Natural
Landscapes in the Auckland Region. Fairweather, John R. and Swaffield, Simon R. 2004 274 The Costs of Footrot and the Impact of the Footrot
Gene-Market Test in New Zealand. Greer, Glen 2005 275 Forecast of Skills Demand in the High Tech Sector
in Canterbury. Dalziel, Paul, Saunders, Caroline and Taylor, Greg 2005 276 Management of Himalayan Tahr in New Zealand. High Country Farmer Perspectives and
Implications. Hughey, Kenneth F.D. and Wason, Karen M. 2005 277 New Zealanders and Biotechnology: Attitudes,
Perceptions and Affective Reactions Cook, Andrew and Fairweather, J.R. 2005 278 Characteristics of Smallholdings in New Zealand: Results from a Nationwide Survey Cook, Andrew and Fairweather, J.R. 2005 279 The Economic contribution of Four Biotechnologies
to New Zealand’s Primary Sector Kaye-Blake, William, Saunders, Caroline,
Emanuelsson, Martin, Dalziel, Paul, and Wreford, Anita 2005
280 Smallholding in the Selwyn District Cook, Andrew J. and Fairweather, J.R. 2005 281 Nanotechnology – ethical and social issues: Results from New Zealand focus groups Cook, Andrew and Fairweather, John R. 2006
DISCUSSION PAPERS 145 Papers Presented at the 4th Annual Conference of
the NZ Agricultural Economics Society. Blenheim 1997
146 Papers Presented at the 5th Annual Conference of
the NZ Agricultural Economics Society. Blenheim 1998
147 Papers Presented at the 6th Annual Conference of
the NZ Agricultural Economics Society. Blenheim 2000
148 Papers Presented at the 7th Annual Conference of the NZ Agricultural Economics Society. Blenheim 2001
149 Papers Presented at the 8th Annual Conference of the NZ Agricultural Economics Society. Blenheim 2002 150 Papers Presented at the 9th Annual Conference of the NZ Agricultural Economics Society. Blenheim 2003 151 Papers Presented at the 10th Annual Conference of the NZ Agricultural Economics Society. Blenheim 2004 152 Papers Presented at the 11th Annual Conference of
the NZ Agricultural Economics Society. Blenheim 2005