The dynamics and sustainable use of high-value tree species of the coastal Pondoland forests of the...
18
The dynamics and sustainable use of high-value tree species of the coastal Pondoland forests of the Eastern Cape Province, South Africa John Obiri a,b , Michael Lawes a,* , Michael Mukolwe b a Forest Biodiversity Programme, School of Botany and Zoology, University of Natal, Private Bag X01, Scottsville 3209, South Africa b Kenya Forestry Research Institute, P.O. Box 20412, Nairobi, Kenya Received 5 July 2000; received in revised form 19 March 2001; accepted 31 May 2001 Abstract We investigate the ecological status of the standing crop of high-value tree species in coastal scarp forest of the Eastern Cape Province of South Africa. We compare resource availability, distribution and use in several forests that are under state and community management. Species suitable for harvesting were identified using a simple linear-programming model based on the frequency and scale of regeneration (grain) of the tree species. Twenty high-value tree species were widely used. Nine species were apparently over-exploited and absent from community forests. Tree densities were higher in state forests than community forest. Size-class distribution profiles for all species, except Harpephyllum caffrum and Heywoodia lucens, displayed the characteristic inverse J-shaped distribution that generally indicates stable populations. Tree species varied in their spatial scale of recruitment, but were mostly intermediate- to coarse- grained. Two fine-grained species in state forest (Englerophytum natalense and Millettia grandis) and only one species in community forest (E. natalense) had densities that could potentially sustain current levels of exploitation. The prevailing tenurial system (i.e. state or community forest), the tree species and category of stem size (dbh) used, all affected tree harvesting off-take levels. Trees in the 10–20 cm diameter size-class (poles) were most harvested. Harvesting levels of pole-sized stems were more influenced by tree size than species, were significantly greater in community than state forests, and could be explained by the closer proximity of households to community ( x¼ 1:5 km) than state forests ( x¼ 3:2 km). Given the willingness of communities distant from forests to plant multipurpose indigenous trees, there is the potential for strengthening community forestry, and thus rural development, via forestry interventions such as agroforestry. However, the survival of these forests depends on the establishment of suitable integrated community-based institutions and management practices. # 2002 Elsevier Science B.V. All rights reserved. Keywords: Ecological grain; Harvesting; Community forestry; Forest products; Poles; Size-class distributions; Sustainable use; Subtropical forest 1. Introduction In this study we examine the use, by rural commu- nities, of high-value tree species from the coastal scarp forests of Umzimvubu district in the Eastern Cape Province of South Africa. Our aims are: (1) to quantify Forest Ecology and Management 166 (2002) 131–148 * Corresponding author. Tel.: þ27-33-2605443; fax: þ27-33-2605105. E-mail address: [email protected] (M. Lawes). 0378-1127/02/$ – see front matter # 2002 Elsevier Science B.V. All rights reserved. PII:S0378-1127(01)00665-X
-
Upload
independent -
Category
Documents
-
view
2 -
download
0
Transcript of The dynamics and sustainable use of high-value tree species of the coastal Pondoland forests of the...
The dynamics and sustainable use of high-value tree speciesof the coastal Pondoland forests of the Eastern Cape Province,
South Africa
John Obiria,b, Michael Lawesa,*, Michael Mukolweb
aForest Biodiversity Programme, School of Botany and Zoology, University of Natal,
Private Bag X01, Scottsville 3209, South AfricabKenya Forestry Research Institute, P.O. Box 20412, Nairobi, Kenya
Received 5 July 2000; received in revised form 19 March 2001; accepted 31 May 2001
Abstract
We investigate the ecological status of the standing crop of high-value tree species in coastal scarp forest of the Eastern
Cape Province of South Africa. We compare resource availability, distribution and use in several forests that are under state
and community management. Species suitable for harvesting were identified using a simple linear-programming model based
on the frequency and scale of regeneration (grain) of the tree species.
Twenty high-value tree species were widely used. Nine species were apparently over-exploited and absent from community
forests. Tree densities were higher in state forests than community forest. Size-class distribution profiles for all species, except
Harpephyllum caffrum and Heywoodia lucens, displayed the characteristic inverse J-shaped distribution that generally
indicates stable populations. Tree species varied in their spatial scale of recruitment, but were mostly intermediate- to coarse-
grained. Two fine-grained species in state forest (Englerophytum natalense and Millettia grandis) and only one species in
community forest (E. natalense) had densities that could potentially sustain current levels of exploitation.
The prevailing tenurial system (i.e. state or community forest), the tree species and category of stem size (dbh) used, all
affected tree harvesting off-take levels. Trees in the 10–20 cm diameter size-class (poles) were most harvested. Harvesting
levels of pole-sized stems were more influenced by tree size than species, were significantly greater in community than state
forests, and could be explained by the closer proximity of households to community (x¼ 1:5 km) than state forests
(x¼ 3:2 km). Given the willingness of communities distant from forests to plant multipurpose indigenous trees, there is the
potential for strengthening community forestry, and thus rural development, via forestry interventions such as agroforestry.
However, the survival of these forests depends on the establishment of suitable integrated community-based institutions and
management practices. # 2002 Elsevier Science B.V. All rights reserved.
Keywords: Ecological grain; Harvesting; Community forestry; Forest products; Poles; Size-class distributions; Sustainable use; Subtropical forest
1. Introduction
In this study we examine the use, by rural commu-
nities, of high-value tree species from the coastal scarp
forests of Umzimvubu district in the Eastern Cape
Province of South Africa. Our aims are: (1) to quantify
Forest Ecology and Management 166 (2002) 131–148
* Corresponding author. Tel.: þ27-33-2605443;
fax: þ27-33-2605105.
E-mail address: [email protected] (M. Lawes).
0378-1127/02/$ – see front matter # 2002 Elsevier Science B.V. All rights reserved.
PII: S 0 3 7 8 - 1 1 2 7 ( 0 1 ) 0 0 6 6 5 - X
resource availability and distribution in state and
community managed forests; (2) to document the
current patterns of tree species use; (3) to establish
local attitudes toward forest conservation, and (4)
provide harvesting and conservation guidelines for
their future use.
An optimal harvesting system should consider the
availability of resources, their rate of use, and their
regeneration potential (McGregor, 1994; Hartshorn,
1995). Management systems that marginally alter the
resource availability, and whose off-take patterns do
not exceed resource regeneration, should be promoted.
An understanding of the dynamics of the resource base
is fundamental to developing sound management
systems for harvesting resources (Seydack, 1991;
Everard et al., 1995). Unfortunately there are few
longitudinal studies from which the population dyna-
mics of important species can be estimated. Forest
dynamics are most often inferred from single survey,
size-class frequency descriptions of population struc-
ture (Swaine et al., 1990; Shackleton, 1993a; Poorter
et al., 1996; Sano, 1997). Although these data have the
relative merits of being easily collected and are often
available from forestry records, they are static rep-
resentations of population composition at a certain
moment in time, and confound attempts to accurately
estimate rates of change. Nevertheless, in the absence
of long-term data on population dynamics, as much
information as possible must be gleaned from static
population descriptions. We combine a traditional
analysis of population size-class frequency distribu-
tions (SCDs; Condit et al., 1998; Lykke, 1998) with a
further analysis of the apparent spatial grain of popula-
tion regeneration (e.g. Everard et al., 1995) from these
same static data. This approach allows us to estimate
what tree species can potentially sustain moderate
harvesting levels, and further identify those species
that should not be used. While these data do not permit
an estimate of absolute optimal harvesting limits, used
judiciously they do provide a useful framework upon
which to base operational harvesting rates.
The success of resource management under two
different tenurial systems has been widely debated:
management under park (state) authorities as opposed
to community management (Hartshorn, 1995; Lewis
and Alpert, 1997; Nhira et al., 1998). Sustainable use
of natural resources under community tenure can imp-
rove the living standards of rural people and decrease
conflicts with park authorities (Song et al., 1997;
Wiersum, 1997; Deboer and Baquete, 1998; Banana
and Gombya-Ssembajjwe, 2000). But there are many
cases where community control has resulted in resource
degradation (Paulson, 1994; Laurance, 1999) and a
conflict of interests between conservationists and
resource users (Noss, 1997; Sutherland and Reynolds,
1998; Gibson and Becker, 2000). On the other hand,
while resource management under park authorities may
initially increase the resource base, it too can lead to
conflict with local communities (Vandergeest, 1996).
The division between state and community forests
in South Africa can be traced back to the early 19th
century when tribal land was annexed (Johnson,
1983). Chiefs who accepted colonial rule were granted
some authority to oversee resource use in the annexed
forest reserves. These forests subsequently became
community forests (Headman’s or Nkosi forest) while
other annexed reserves became state forests under
government control. Today 70% of the indigenous
forests in the Eastern Cape Province (370 km2; Low
and Rebelo, 1997) are under state management and the
remainder are under community control (Cooper and
Swart, 1992; DWAF, 1997). These community forests
developed into local resource management systems,
supplying the community with timber and non-timber
forests products (NTFP) (McKenzie, 1989; Mander,
1989; Van Eck et al., 1997). However, in recent years a
decline in the control of forest resources has been
noted in both state and community forests (DWAF,
1996), resulting in resurgence in the exploitation of
forest products. We compare and contrast the use of
resources from state forest and community forest and
comment on the consequences of relatively uncon-
trolled exploitation of community forests. Our app-
roach integrates our understanding of the ecological
processes underpinning the population dynamics of
the high-value tree species with the needs and social
attitudes of local peoples towards conserving these
trees in state and community forests.
2. Methods
2.1. Study site
The forests in this study lie in the Umzimvubu
district (318300–318450S and 298150–298300E) of the
132 J. Obiri et al. / Forest Ecology and Management 166 (2002) 131–148
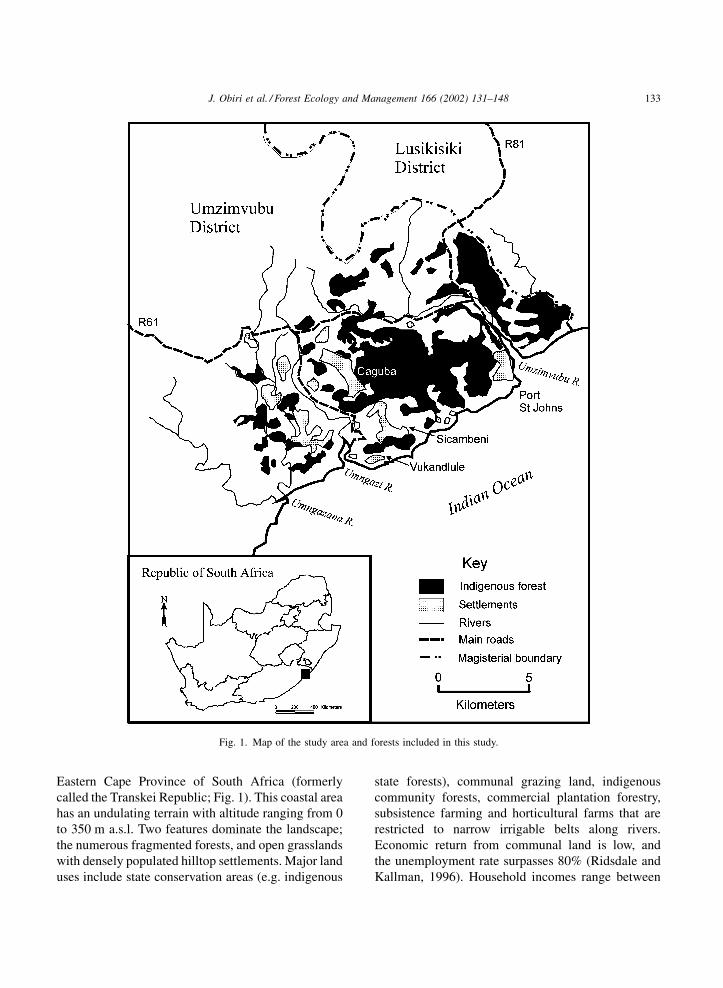
Eastern Cape Province of South Africa (formerly
called the Transkei Republic; Fig. 1). This coastal area
has an undulating terrain with altitude ranging from 0
to 350 m a.s.l. Two features dominate the landscape;
the numerous fragmented forests, and open grasslands
with densely populated hilltop settlements. Major land
uses include state conservation areas (e.g. indigenous
state forests), communal grazing land, indigenous
community forests, commercial plantation forestry,
subsistence farming and horticultural farms that are
restricted to narrow irrigable belts along rivers.
Economic return from communal land is low, and
the unemployment rate surpasses 80% (Ridsdale and
Kallman, 1996). Household incomes range between
Fig. 1. Map of the study area and forests included in this study.
J. Obiri et al. / Forest Ecology and Management 166 (2002) 131–148 133
US$ 32 and 160 per month (Kieplei and Quinlan,
1996). Income is mainly from remittances from
migrant workers and pensions. Natural resources are
highly exploited to subsidise these meager incomes.
2.2. Resource distribution and availability
Resource distribution, availability and use was
investigated during 1999 and 2000, in seven commu-
nity forests and 10 state forests (Table 1) neighbouring
on four local communities (Caguba, Vukandlule,
Sicambeni and Tombo villages). Since local people
readily identify all tree species by common name, it
was possible to identify the most popular indigenous
tree species used by the communities from ques-
tionnaire responses. Of these, the population densities
and size-class distributions of 20 commonly used
indigenous tree species were estimated using the
modified Whittaker plot sampling method (Stohlgren
et al., 1995). Stohlgren (1994) showed that the shape
of the plot influences the number of species encoun-
tered in a sample, with more species detected in long-
thin rectangular plots. Each sampling plot was
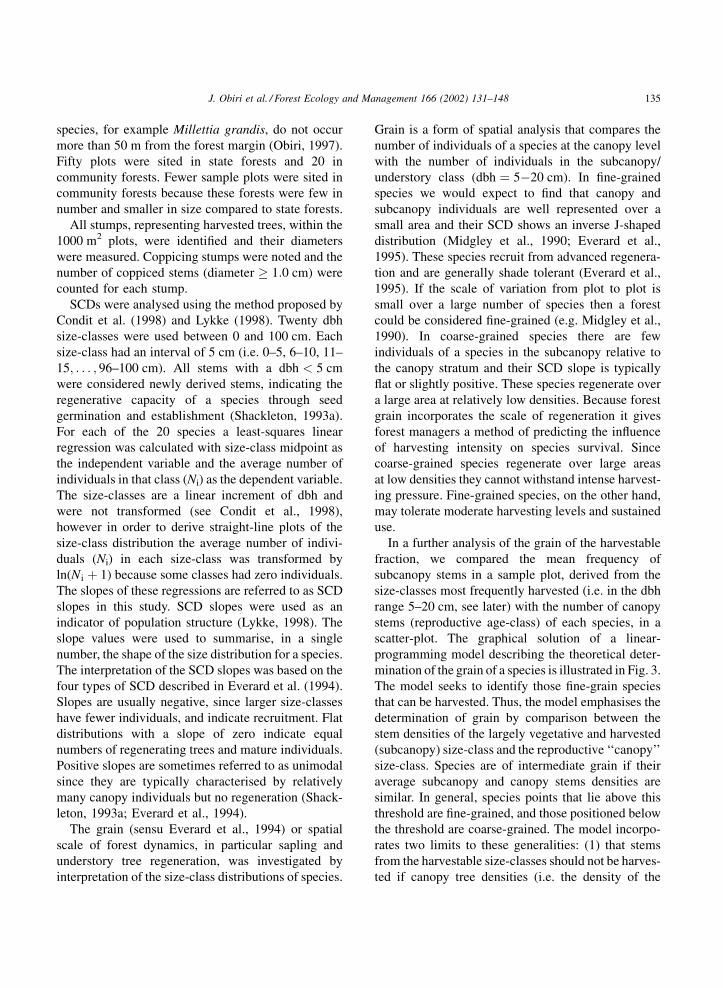
1000 m2 (50 m � 20 m). Ten proportionately long-
thin 1 m2 subplots and two 10 m2 subplots were
arranged independently around the perimeter of the
50 m � 20 m sample plot (Fig. 2). In each plot the
diameter at breast height (dbh) of each stem was
measured. The number of seedlings and saplings
(dbh < 5 cm) of each species were counted in the 1 m2
plots. The number of subcanopy trees in the dbh size-
class of 5–10 cm were counted for each species in the
10 m2 plots. Subcanopy trees (dbh ¼ 10�20 cm) were
counted over the whole 50 m � 20 m plot, rather than
from a smaller, centrally located 20 m � 5 m subplot
as in Stohlgren’s design. Similarly, canopy trees
(>20 cm dbh) were counted over the whole 1000 m2
plot too. Our modified design maximised the number
of target species encountered in each plot, permitted
independent estimates of size-class densities, and
provided considerable economy in sampling effort.
Unlike other species Ptaeroxylon obliquum was
most frequently observed at forest margins. In order to
sample this highly desirable species we used ten
100 m � 5 m plots extending from the forest edge
100 m into the forest interior. In this way we
established whether or not P. obliquum was a forest
margin species. The numbers of seedlings/saplings of
P. obliquum were counted in 15 subplots (1 m � 1 m)
placed 5 m apart along the 100 m transect. Larger size-
classes were counted in contiguous 5 m � 5 m sub-
plots over the 100 m length of the plot.
Seventy modified Whittaker plots were randomly
sited within two broad strata—the forest margin and
the forest interior. The forest interior was defined as
that region of the forest greater than 60 m from the
edge. The 60 m criterion was used because most edge
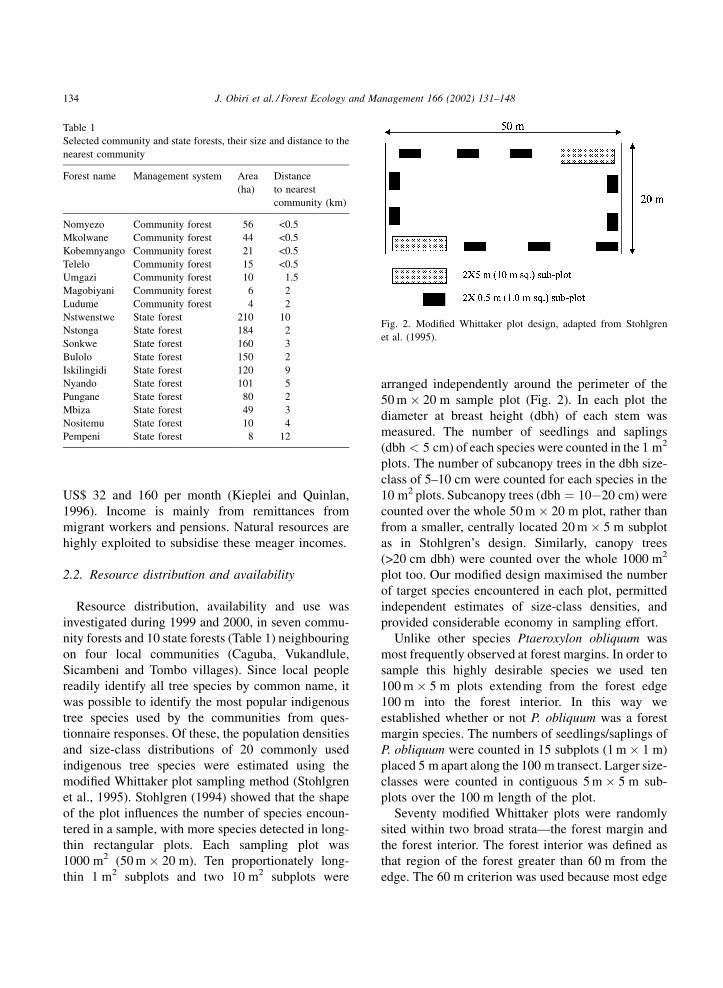
Table 1
Selected community and state forests, their size and distance to the
nearest community
Forest name Management system Area
(ha)
Distance
to nearest
community (km)
Nomyezo Community forest 56 <0.5
Mkolwane Community forest 44 <0.5
Kobemnyango Community forest 21 <0.5
Telelo Community forest 15 <0.5
Umgazi Community forest 10 1.5
Magobiyani Community forest 6 2
Ludume Community forest 4 2
Nstwenstwe State forest 210 10
Nstonga State forest 184 2
Sonkwe State forest 160 3
Bulolo State forest 150 2
Iskilingidi State forest 120 9
Nyando State forest 101 5
Pungane State forest 80 2
Mbiza State forest 49 3
Nositemu State forest 10 4
Pempeni State forest 8 12
Fig. 2. Modified Whittaker plot design, adapted from Stohlgren
et al. (1995).
134 J. Obiri et al. / Forest Ecology and Management 166 (2002) 131–148
species, for example Millettia grandis, do not occur
more than 50 m from the forest margin (Obiri, 1997).
Fifty plots were sited in state forests and 20 in
community forests. Fewer sample plots were sited in
community forests because these forests were few in
number and smaller in size compared to state forests.
All stumps, representing harvested trees, within the
1000 m2 plots, were identified and their diameters
were measured. Coppicing stumps were noted and the
number of coppiced stems (diameter � 1:0 cm) were
counted for each stump.
SCDs were analysed using the method proposed by
Condit et al. (1998) and Lykke (1998). Twenty dbh
size-classes were used between 0 and 100 cm. Each
size-class had an interval of 5 cm (i.e. 0–5, 6–10, 11–
15; . . . ; 96–100 cm). All stems with a dbh < 5 cm
were considered newly derived stems, indicating the
regenerative capacity of a species through seed
germination and establishment (Shackleton, 1993a).
For each of the 20 species a least-squares linear
regression was calculated with size-class midpoint as
the independent variable and the average number of
individuals in that class (Ni) as the dependent variable.
The size-classes are a linear increment of dbh and
were not transformed (see Condit et al., 1998),
however in order to derive straight-line plots of the
size-class distribution the average number of indivi-
duals (Ni) in each size-class was transformed by
ln(N i þ 1) because some classes had zero individuals.
The slopes of these regressions are referred to as SCD
slopes in this study. SCD slopes were used as an
indicator of population structure (Lykke, 1998). The
slope values were used to summarise, in a single
number, the shape of the size distribution for a species.
The interpretation of the SCD slopes was based on the
four types of SCD described in Everard et al. (1994).
Slopes are usually negative, since larger size-classes
have fewer individuals, and indicate recruitment. Flat
distributions with a slope of zero indicate equal
numbers of regenerating trees and mature individuals.
Positive slopes are sometimes referred to as unimodal
since they are typically characterised by relatively
many canopy individuals but no regeneration (Shack-
leton, 1993a; Everard et al., 1994).
The grain (sensu Everard et al., 1994) or spatial
scale of forest dynamics, in particular sapling and
understory tree regeneration, was investigated by
interpretation of the size-class distributions of species.
Grain is a form of spatial analysis that compares the
number of individuals of a species at the canopy level
with the number of individuals in the subcanopy/
understory class (dbh ¼ 5�20 cm). In fine-grained
species we would expect to find that canopy and
subcanopy individuals are well represented over a
small area and their SCD shows an inverse J-shaped
distribution (Midgley et al., 1990; Everard et al.,
1995). These species recruit from advanced regenera-
tion and are generally shade tolerant (Everard et al.,
1995). If the scale of variation from plot to plot is
small over a large number of species then a forest
could be considered fine-grained (e.g. Midgley et al.,
1990). In coarse-grained species there are few
individuals of a species in the subcanopy relative to
the canopy stratum and their SCD slope is typically
flat or slightly positive. These species regenerate over
a large area at relatively low densities. Because forest
grain incorporates the scale of regeneration it gives
forest managers a method of predicting the influence
of harvesting intensity on species survival. Since
coarse-grained species regenerate over large areas
at low densities they cannot withstand intense harvest-
ing pressure. Fine-grained species, on the other hand,
may tolerate moderate harvesting levels and sustained
use.
In a further analysis of the grain of the harvestable
fraction, we compared the mean frequency of
subcanopy stems in a sample plot, derived from the
size-classes most frequently harvested (i.e. in the dbh
range 5–20 cm, see later) with the number of canopy
stems (reproductive age-class) of each species, in a
scatter-plot. The graphical solution of a linear-
programming model describing the theoretical deter-
mination of the grain of a species is illustrated in Fig. 3.
The model seeks to identify those fine-grain species
that can be harvested. Thus, the model emphasises the
determination of grain by comparison between the
stem densities of the largely vegetative and harvested
(subcanopy) size-class and the reproductive ‘‘canopy’’
size-class. Species are of intermediate grain if their
average subcanopy and canopy stems densities are
similar. In general, species points that lie above this
threshold are fine-grained, and those positioned below
the threshold are coarse-grained. The model incorpo-
rates two limits to these generalities: (1) that stems
from the harvestable size-classes should not be harves-
ted if canopy tree densities (i.e. the density of the
J. Obiri et al. / Forest Ecology and Management 166 (2002) 131–148 135
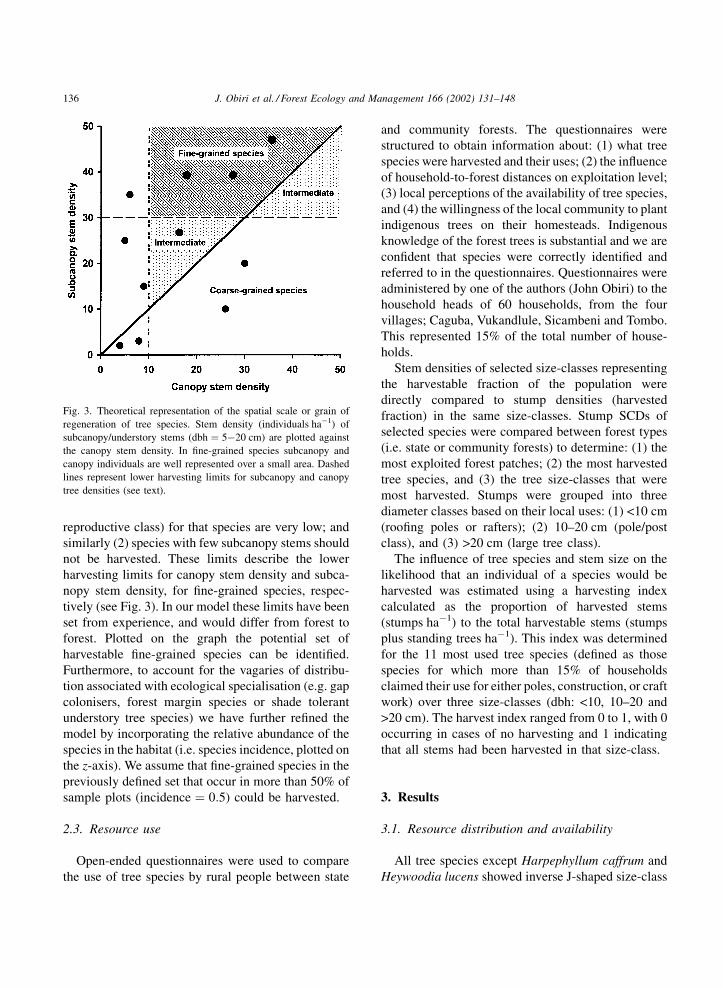
reproductive class) for that species are very low; and
similarly (2) species with few subcanopy stems should
not be harvested. These limits describe the lower
harvesting limits for canopy stem density and subca-
nopy stem density, for fine-grained species, respec-
tively (see Fig. 3). In our model these limits have been
set from experience, and would differ from forest to
forest. Plotted on the graph the potential set of
harvestable fine-grained species can be identified.
Furthermore, to account for the vagaries of distribu-
tion associated with ecological specialisation (e.g. gap
colonisers, forest margin species or shade tolerant
understory tree species) we have further refined the
model by incorporating the relative abundance of the
species in the habitat (i.e. species incidence, plotted on
the z-axis). We assume that fine-grained species in the
previously defined set that occur in more than 50% of
sample plots (incidence ¼ 0:5) could be harvested.
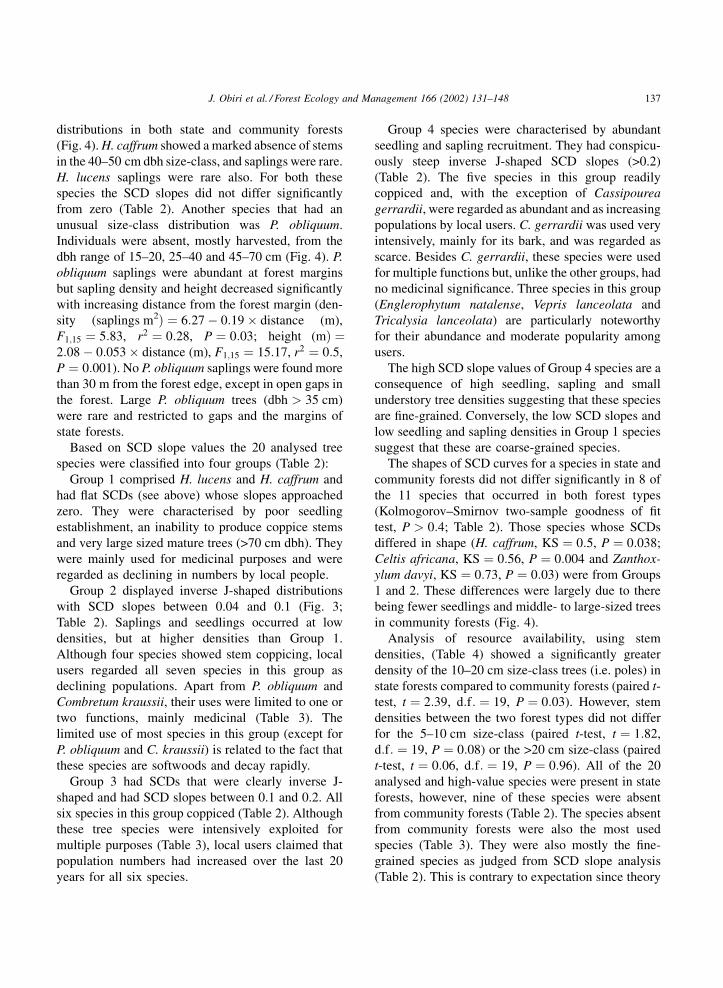
2.3. Resource use
Open-ended questionnaires were used to compare
the use of tree species by rural people between state
and community forests. The questionnaires were
structured to obtain information about: (1) what tree
species were harvested and their uses; (2) the influence
of household-to-forest distances on exploitation level;
(3) local perceptions of the availability of tree species,
and (4) the willingness of the local community to plant
indigenous trees on their homesteads. Indigenous
knowledge of the forest trees is substantial and we are
confident that species were correctly identified and
referred to in the questionnaires. Questionnaires were
administered by one of the authors (John Obiri) to the
household heads of 60 households, from the four
villages; Caguba, Vukandlule, Sicambeni and Tombo.
This represented 15% of the total number of house-
holds.
Stem densities of selected size-classes representing
the harvestable fraction of the population were
directly compared to stump densities (harvested
fraction) in the same size-classes. Stump SCDs of
selected species were compared between forest types
(i.e. state or community forests) to determine: (1) the
most exploited forest patches; (2) the most harvested
tree species, and (3) the tree size-classes that were
most harvested. Stumps were grouped into three
diameter classes based on their local uses: (1) <10 cm
(roofing poles or rafters); (2) 10–20 cm (pole/post
class), and (3) >20 cm (large tree class).
The influence of tree species and stem size on the
likelihood that an individual of a species would be
harvested was estimated using a harvesting index
calculated as the proportion of harvested stems
(stumps ha�1) to the total harvestable stems (stumps
plus standing trees ha�1). This index was determined
for the 11 most used tree species (defined as those
species for which more than 15% of households
claimed their use for either poles, construction, or craft
work) over three size-classes (dbh: <10, 10–20 and
>20 cm). The harvest index ranged from 0 to 1, with 0
occurring in cases of no harvesting and 1 indicating
that all stems had been harvested in that size-class.
3. Results
3.1. Resource distribution and availability
All tree species except Harpephyllum caffrum and
Heywoodia lucens showed inverse J-shaped size-class
Fig. 3. Theoretical representation of the spatial scale or grain of
regeneration of tree species. Stem density (individuals ha�1) of
subcanopy/understory stems (dbh ¼ 5�20 cm) are plotted against
the canopy stem density. In fine-grained species subcanopy and
canopy individuals are well represented over a small area. Dashed
lines represent lower harvesting limits for subcanopy and canopy
tree densities (see text).
136 J. Obiri et al. / Forest Ecology and Management 166 (2002) 131–148
distributions in both state and community forests
(Fig. 4). H. caffrum showed a marked absence of stems
in the 40–50 cm dbh size-class, and saplings were rare.
H. lucens saplings were rare also. For both these
species the SCD slopes did not differ significantly
from zero (Table 2). Another species that had an
unusual size-class distribution was P. obliquum.
Individuals were absent, mostly harvested, from the
dbh range of 15–20, 25–40 and 45–70 cm (Fig. 4). P.
obliquum saplings were abundant at forest margins
but sapling density and height decreased significantly
with increasing distance from the forest margin (den-
sity (saplings m2Þ ¼ 6:27 � 0:19 � distance (m),
F1;15 ¼ 5:83, r2 ¼ 0:28, P ¼ 0:03; height (mÞ ¼2:08 � 0:053 � distance (m), F1;15 ¼ 15:17, r2 ¼ 0:5,
P ¼ 0:001). No P. obliquum saplings were found more
than 30 m from the forest edge, except in open gaps in
the forest. Large P. obliquum trees (dbh > 35 cm)
were rare and restricted to gaps and the margins of
state forests.
Based on SCD slope values the 20 analysed tree
species were classified into four groups (Table 2):
Group 1 comprised H. lucens and H. caffrum and
had flat SCDs (see above) whose slopes approached
zero. They were characterised by poor seedling
establishment, an inability to produce coppice stems
and very large sized mature trees (>70 cm dbh). They
were mainly used for medicinal purposes and were
regarded as declining in numbers by local people.
Group 2 displayed inverse J-shaped distributions
with SCD slopes between 0.04 and 0.1 (Fig. 3;
Table 2). Saplings and seedlings occurred at low
densities, but at higher densities than Group 1.
Although four species showed stem coppicing, local
users regarded all seven species in this group as
declining populations. Apart from P. obliquum and
Combretum kraussii, their uses were limited to one or
two functions, mainly medicinal (Table 3). The
limited use of most species in this group (except for
P. obliquum and C. kraussii) is related to the fact that
these species are softwoods and decay rapidly.
Group 3 had SCDs that were clearly inverse J-
shaped and had SCD slopes between 0.1 and 0.2. All
six species in this group coppiced (Table 2). Although
these tree species were intensively exploited for
multiple purposes (Table 3), local users claimed that
population numbers had increased over the last 20
years for all six species.
Group 4 species were characterised by abundant
seedling and sapling recruitment. They had conspicu-
ously steep inverse J-shaped SCD slopes (>0.2)
(Table 2). The five species in this group readily
coppiced and, with the exception of Cassipourea
gerrardii, were regarded as abundant and as increasing
populations by local users. C. gerrardii was used very
intensively, mainly for its bark, and was regarded as
scarce. Besides C. gerrardii, these species were used
for multiple functions but, unlike the other groups, had
no medicinal significance. Three species in this group
(Englerophytum natalense, Vepris lanceolata and
Tricalysia lanceolata) are particularly noteworthy
for their abundance and moderate popularity among
users.
The high SCD slope values of Group 4 species are a
consequence of high seedling, sapling and small
understory tree densities suggesting that these species
are fine-grained. Conversely, the low SCD slopes and
low seedling and sapling densities in Group 1 species
suggest that these are coarse-grained species.
The shapes of SCD curves for a species in state and
community forests did not differ significantly in 8 of
the 11 species that occurred in both forest types
(Kolmogorov–Smirnov two-sample goodness of fit
test, P > 0:4; Table 2). Those species whose SCDs
differed in shape (H. caffrum, KS ¼ 0:5, P ¼ 0:038;
Celtis africana, KS ¼ 0:56, P ¼ 0:004 and Zanthox-
ylum davyi, KS ¼ 0:73, P ¼ 0:03) were from Groups
1 and 2. These differences were largely due to there
being fewer seedlings and middle- to large-sized trees
in community forests (Fig. 4).
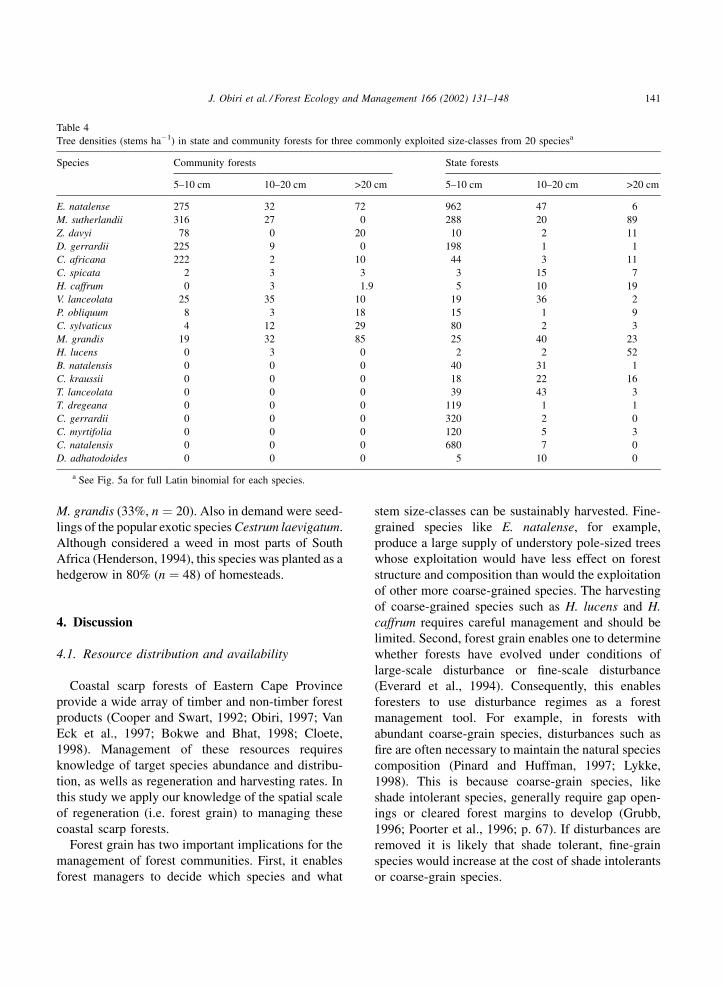
Analysis of resource availability, using stem
densities, (Table 4) showed a significantly greater
density of the 10–20 cm size-class trees (i.e. poles) in
state forests compared to community forests (paired t-
test, t ¼ 2:39, d:f: ¼ 19, P ¼ 0:03). However, stem
densities between the two forest types did not differ
for the 5–10 cm size-class (paired t-test, t ¼ 1:82,
d:f: ¼ 19, P ¼ 0:08) or the >20 cm size-class (paired
t-test, t ¼ 0:06, d:f: ¼ 19, P ¼ 0:96). All of the 20
analysed and high-value species were present in state
forests, however, nine of these species were absent
from community forests (Table 2). The species absent
from community forests were also the most used
species (Table 3). They were also mostly the fine-
grained species as judged from SCD slope analysis
(Table 2). This is contrary to expectation since theory
J. Obiri et al. / Forest Ecology and Management 166 (2002) 131–148 137
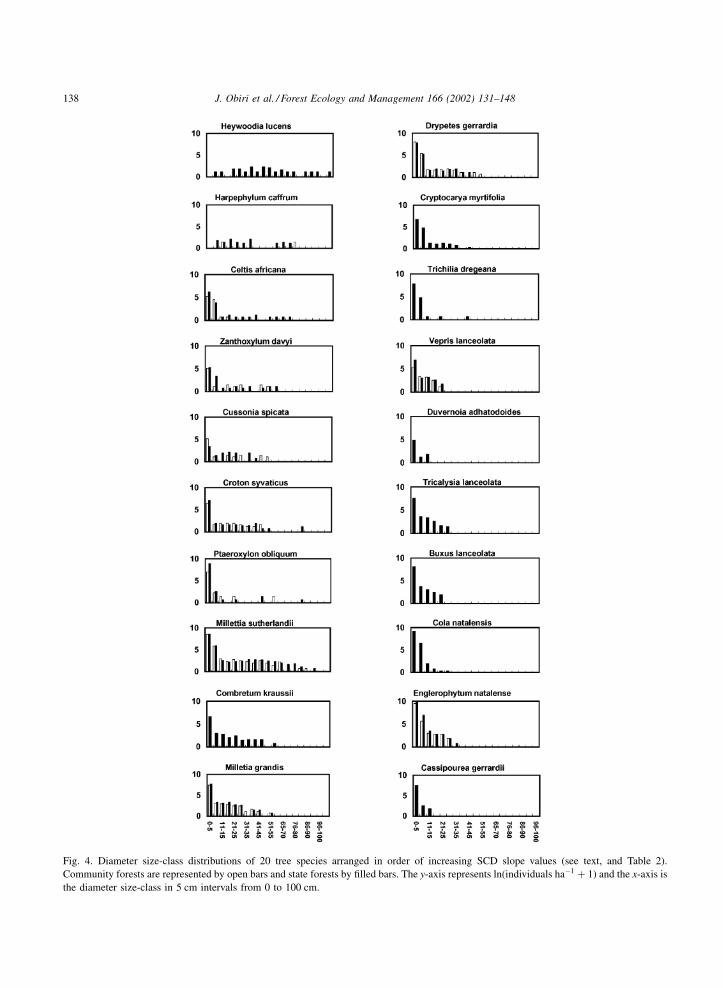
Fig. 4. Diameter size-class distributions of 20 tree species arranged in order of increasing SCD slope values (see text, and Table 2).
Community forests are represented by open bars and state forests by filled bars. The y-axis represents ln(individuals ha�1 þ 1) and the x-axis is
the diameter size-class in 5 cm intervals from 0 to 100 cm.
138 J. Obiri et al. / Forest Ecology and Management 166 (2002) 131–148
suggests fine-grained species should be able to
withstand moderate levels of use. Clearly considerable
harvesting pressure on these fine-grained species in
community forest has led to their extirpation, and they
now survive in state forest only.
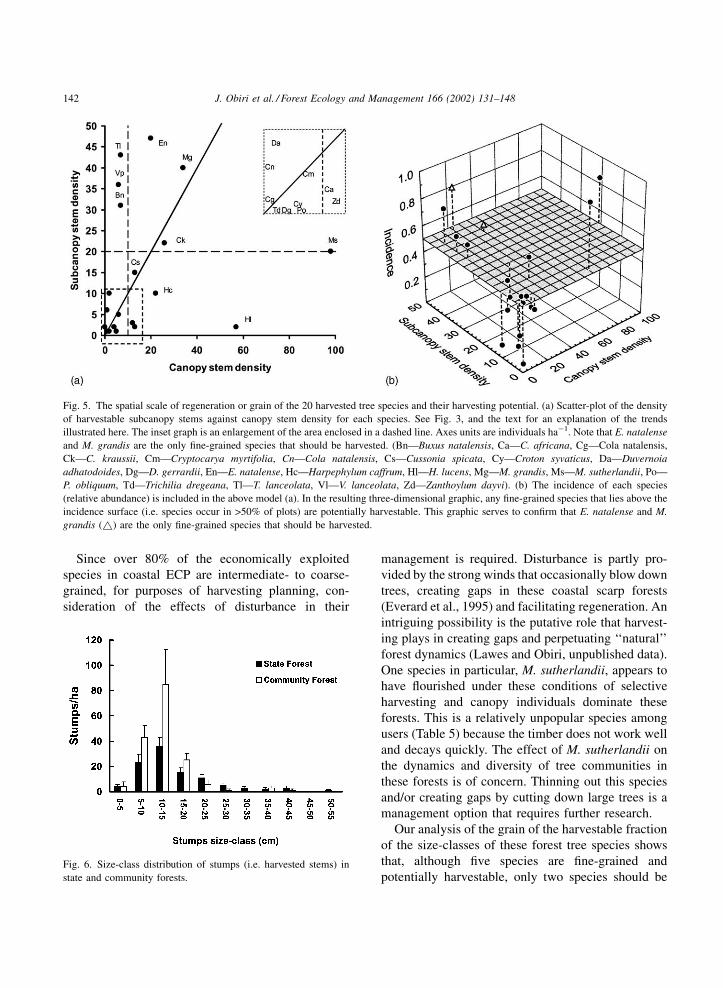
The results of the linear-programming model
confirmed the trends described in the SCD grain
analysis above (Fig. 5a). In other words the species are
broadly grouped into the Groups 1–4 (coarse- to fine-
grained) as before. However, the final model shows
that only two species (E. natalense and M. grandis)
from Groups 3 and 4 are unequivocally harvestable
(Fig. 5b). Although T. lanceolata, V. lanceolata, and B.
natalensis, are all fine-grained, and stems in the
harvestable size-class are abundant, their density of
canopy stems is very low, reducing their potential in
the model as harvestable species. However, bearing in
mind that the lower canopy stem density limit was set
arbitrarily at 10 stems ha�1, and these three species
have canopy stem densities > 6 stems ha�1, their
controlled use could be contemplated. M. sutherlandii
is unusual among all the species in that there are very
high densities of canopy individuals and relatively few
understory trees (Fig. 5a).
3.2. Resource use
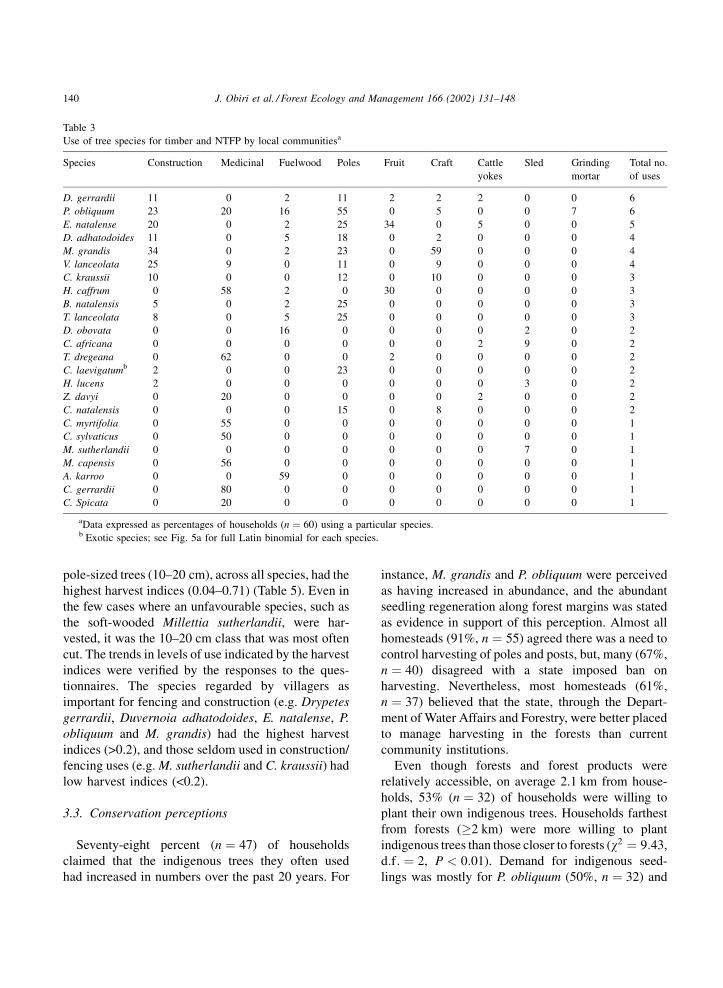
Of the 20 commonly used species, 11 were used for
garden/homestead fencing poles and for construction
purposes, and seven for wood carving (Table 3). Three
stem size-classes of extractive use were identified: (1)
rafters and fence-droppers (cut from saplings and
small trees <10 cm); (2) poles and posts (cut from
mostly understory trees of 10–20 cm), and (3) sawn
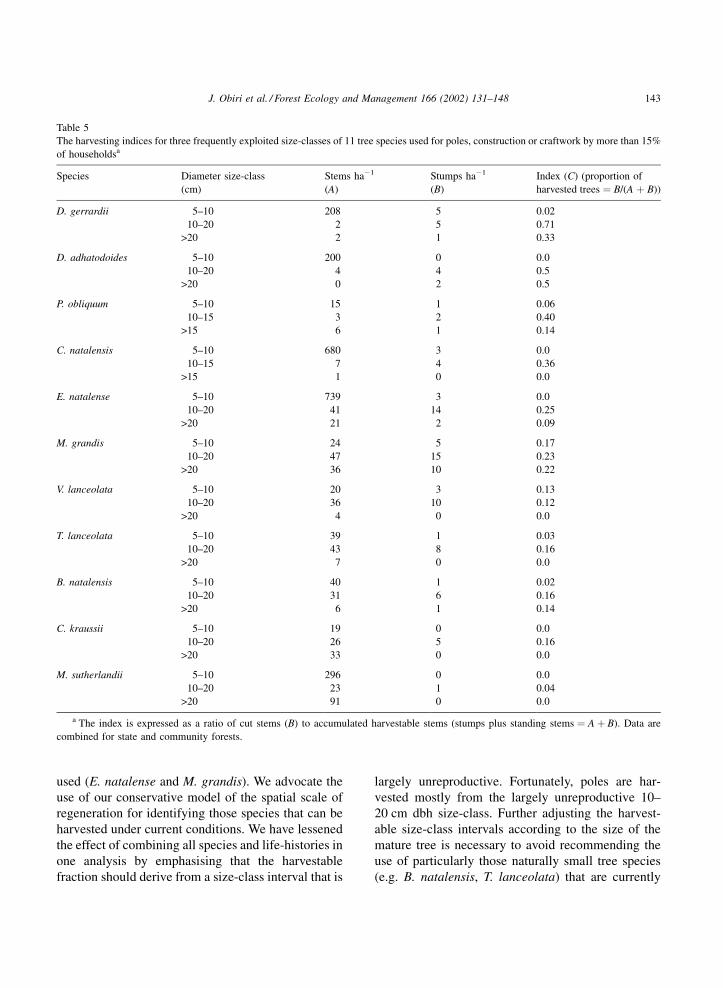
timber (from trees > 20 cm). Distribution of stumps
in these three classes differed significantly between
state and community forests (w2 ¼ 21:8, d:f: ¼ 2,
P < 0:001; Fig. 6) with community forests having a
greater density of stumps. Among the three most
exploited size-classes (<10, 10–20 and >20 cm) the
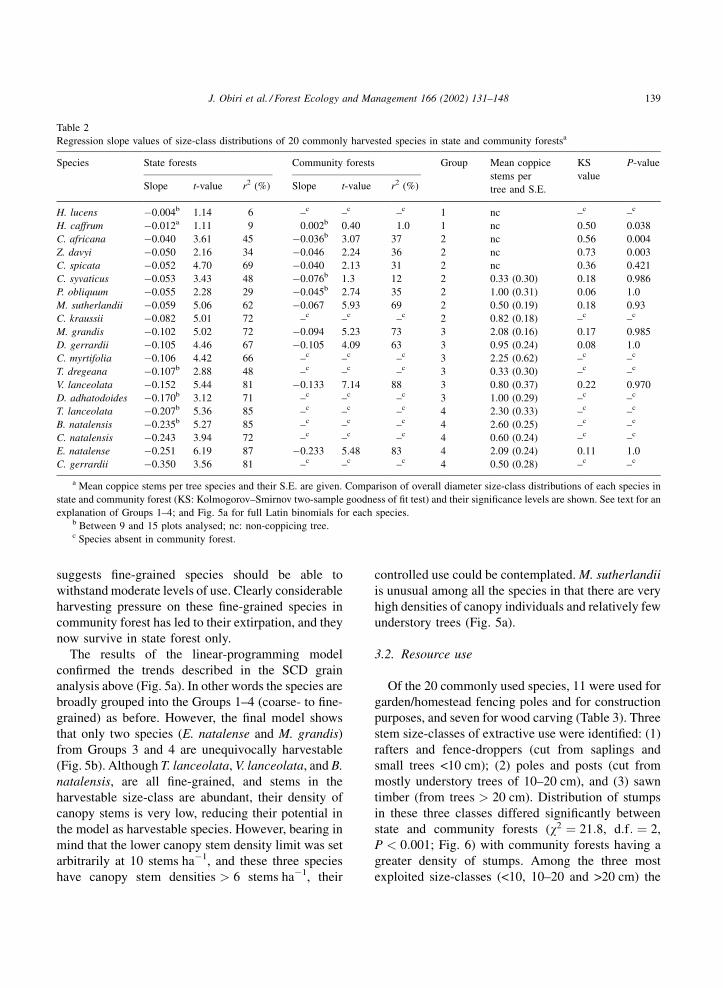
Table 2
Regression slope values of size-class distributions of 20 commonly harvested species in state and community forestsa
Species State forests Community forests Group Mean coppice
stems per
tree and S.E.
KS
value
P-value
Slope t-value r2 (%) Slope t-value r2 (%)
H. lucens �0.004b 1.14 6 –c –c –c 1 nc –c –c
H. caffrum �0.012a 1.11 9 0.002b 0.40 1.0 1 nc 0.50 0.038
C. africana �0.040 3.61 45 �0.036b 3.07 37 2 nc 0.56 0.004
Z. davyi �0.050 2.16 34 �0.046 2.24 36 2 nc 0.73 0.003
C. spicata �0.052 4.70 69 �0.040 2.13 31 2 nc 0.36 0.421
C. syvaticus �0.053 3.43 48 �0.076b 1.3 12 2 0.33 (0.30) 0.18 0.986
P. obliquum �0.055 2.28 29 �0.045b 2.74 35 2 1.00 (0.31) 0.06 1.0
M. sutherlandii �0.059 5.06 62 �0.067 5.93 69 2 0.50 (0.19) 0.18 0.93
C. kraussii �0.082 5.01 72 –c –c –c 2 0.82 (0.18) –c –c
M. grandis �0.102 5.02 72 �0.094 5.23 73 3 2.08 (0.16) 0.17 0.985
D. gerrardii �0.105 4.46 67 �0.105 4.09 63 3 0.95 (0.24) 0.08 1.0
C. myrtifolia �0.106 4.42 66 –c –c –c 3 2.25 (0.62) –c –c
T. dregeana �0.107b 2.88 48 –c –c –c 3 0.33 (0.30) –c –c
V. lanceolata �0.152 5.44 81 �0.133 7.14 88 3 0.80 (0.37) 0.22 0.970
D. adhatodoides �0.170b 3.12 71 –c –c –c 3 1.00 (0.29) –c –c
T. lanceolata �0.207b 5.36 85 –c –c –c 4 2.30 (0.33) –c –c
B. natalensis �0.235b 5.27 85 –c –c –c 4 2.60 (0.25) –c –c
C. natalensis �0.243 3.94 72 –c –c –c 4 0.60 (0.24) –c –c
E. natalense �0.251 6.19 87 �0.233 5.48 83 4 2.09 (0.24) 0.11 1.0
C. gerrardii �0.350 3.56 81 –c –c –c 4 0.50 (0.28) –c –c
a Mean coppice stems per tree species and their S.E. are given. Comparison of overall diameter size-class distributions of each species in
state and community forest (KS: Kolmogorov–Smirnov two-sample goodness of fit test) and their significance levels are shown. See text for an
explanation of Groups 1–4; and Fig. 5a for full Latin binomials for each species.b Between 9 and 15 plots analysed; nc: non-coppicing tree.c Species absent in community forest.
J. Obiri et al. / Forest Ecology and Management 166 (2002) 131–148 139
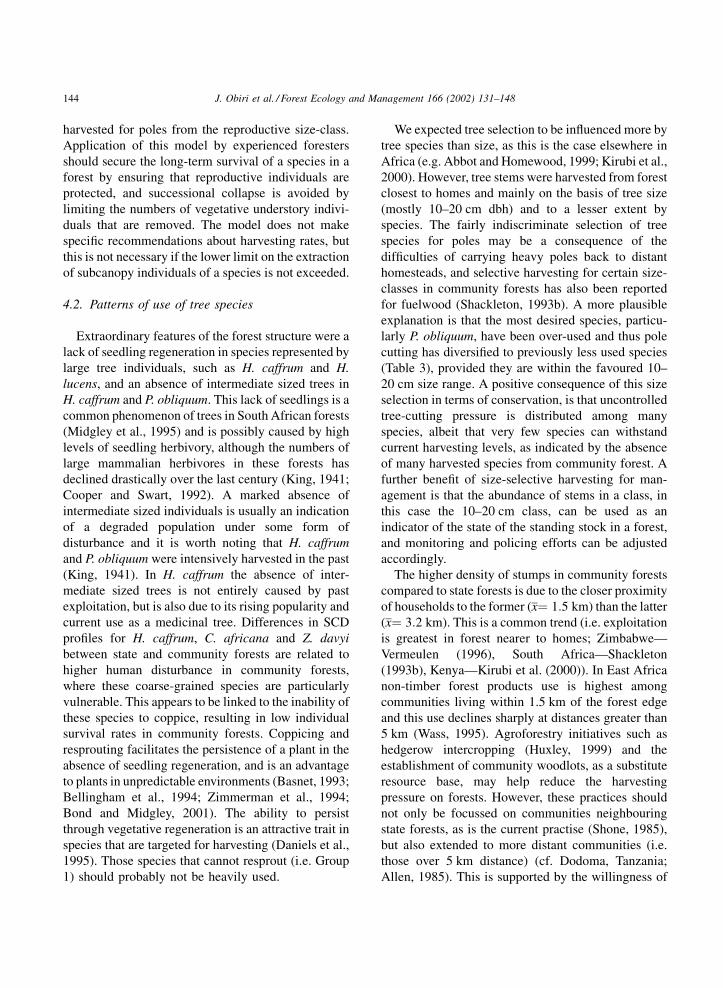
pole-sized trees (10–20 cm), across all species, had the
highest harvest indices (0.04–0.71) (Table 5). Even in
the few cases where an unfavourable species, such as
the soft-wooded Millettia sutherlandii, were har-
vested, it was the 10–20 cm class that was most often
cut. The trends in levels of use indicated by the harvest
indices were verified by the responses to the ques-
tionnaires. The species regarded by villagers as
important for fencing and construction (e.g. Drypetes
gerrardii, Duvernoia adhatodoides, E. natalense, P.
obliquum and M. grandis) had the highest harvest
indices (>0.2), and those seldom used in construction/
fencing uses (e.g. M. sutherlandii and C. kraussii) had
low harvest indices (<0.2).
3.3. Conservation perceptions
Seventy-eight percent (n ¼ 47) of households
claimed that the indigenous trees they often used
had increased in numbers over the past 20 years. For
instance, M. grandis and P. obliquum were perceived
as having increased in abundance, and the abundant
seedling regeneration along forest margins was stated
as evidence in support of this perception. Almost all
homesteads (91%, n ¼ 55) agreed there was a need to
control harvesting of poles and posts, but, many (67%,
n ¼ 40) disagreed with a state imposed ban on
harvesting. Nevertheless, most homesteads (61%,
n ¼ 37) believed that the state, through the Depart-
ment of Water Affairs and Forestry, were better placed
to manage harvesting in the forests than current
community institutions.
Even though forests and forest products were
relatively accessible, on average 2.1 km from house-
holds, 53% (n ¼ 32) of households were willing to
plant their own indigenous trees. Households farthest
from forests (�2 km) were more willing to plant
indigenous trees than those closer to forests (w2 ¼ 9:43,
d:f: ¼ 2, P < 0:01). Demand for indigenous seed-
lings was mostly for P. obliquum (50%, n ¼ 32) and
Table 3
Use of tree species for timber and NTFP by local communitiesa
Species Construction Medicinal Fuelwood Poles Fruit Craft Cattle
yokes
Sled Grinding
mortar
Total no.
of uses
D. gerrardii 11 0 2 11 2 2 2 0 0 6
P. obliquum 23 20 16 55 0 5 0 0 7 6
E. natalense 20 0 2 25 34 0 5 0 0 5
D. adhatodoides 11 0 5 18 0 2 0 0 0 4
M. grandis 34 0 2 23 0 59 0 0 0 4
V. lanceolata 25 9 0 11 0 9 0 0 0 4
C. kraussii 10 0 0 12 0 10 0 0 0 3
H. caffrum 0 58 2 0 30 0 0 0 0 3
B. natalensis 5 0 2 25 0 0 0 0 0 3
T. lanceolata 8 0 5 25 0 0 0 0 0 3
D. obovata 0 0 16 0 0 0 0 2 0 2
C. africana 0 0 0 0 0 0 2 9 0 2
T. dregeana 0 62 0 0 2 0 0 0 0 2
C. laevigatumb 2 0 0 23 0 0 0 0 0 2
H. lucens 2 0 0 0 0 0 0 3 0 2
Z. davyi 0 20 0 0 0 0 2 0 0 2
C. natalensis 0 0 0 15 0 8 0 0 0 2
C. myrtifolia 0 55 0 0 0 0 0 0 0 1
C. sylvaticus 0 50 0 0 0 0 0 0 0 1
M. sutherlandii 0 0 0 0 0 0 0 7 0 1
M. capensis 0 56 0 0 0 0 0 0 0 1
A. karroo 0 0 59 0 0 0 0 0 0 1
C. gerrardii 0 80 0 0 0 0 0 0 0 1
C. Spicata 0 20 0 0 0 0 0 0 0 1
aData expressed as percentages of households (n ¼ 60) using a particular species.b Exotic species; see Fig. 5a for full Latin binomial for each species.
140 J. Obiri et al. / Forest Ecology and Management 166 (2002) 131–148
M. grandis (33%, n ¼ 20). Also in demand were seed-
lings of the popular exotic species Cestrum laevigatum.
Although considered a weed in most parts of South
Africa (Henderson, 1994), this species was planted as a
hedgerow in 80% (n ¼ 48) of homesteads.
4. Discussion
4.1. Resource distribution and availability
Coastal scarp forests of Eastern Cape Province
provide a wide array of timber and non-timber forest
products (Cooper and Swart, 1992; Obiri, 1997; Van
Eck et al., 1997; Bokwe and Bhat, 1998; Cloete,
1998). Management of these resources requires
knowledge of target species abundance and distribu-
tion, as wells as regeneration and harvesting rates. In
this study we apply our knowledge of the spatial scale
of regeneration (i.e. forest grain) to managing these
coastal scarp forests.
Forest grain has two important implications for the
management of forest communities. First, it enables
forest managers to decide which species and what
stem size-classes can be sustainably harvested. Fine-
grained species like E. natalense, for example,
produce a large supply of understory pole-sized trees
whose exploitation would have less effect on forest
structure and composition than would the exploitation
of other more coarse-grained species. The harvesting
of coarse-grained species such as H. lucens and H.
caffrum requires careful management and should be
limited. Second, forest grain enables one to determine
whether forests have evolved under conditions of
large-scale disturbance or fine-scale disturbance
(Everard et al., 1994). Consequently, this enables
foresters to use disturbance regimes as a forest
management tool. For example, in forests with
abundant coarse-grain species, disturbances such as
fire are often necessary to maintain the natural species
composition (Pinard and Huffman, 1997; Lykke,
1998). This is because coarse-grain species, like
shade intolerant species, generally require gap open-
ings or cleared forest margins to develop (Grubb,
1996; Poorter et al., 1996; p. 67). If disturbances are
removed it is likely that shade tolerant, fine-grain
species would increase at the cost of shade intolerants
or coarse-grain species.
Table 4
Tree densities (stems ha�1) in state and community forests for three commonly exploited size-classes from 20 speciesa
Species Community forests State forests
5–10 cm 10–20 cm >20 cm 5–10 cm 10–20 cm >20 cm
E. natalense 275 32 72 962 47 6
M. sutherlandii 316 27 0 288 20 89
Z. davyi 78 0 20 10 2 11
D. gerrardii 225 9 0 198 1 1
C. africana 222 2 10 44 3 11
C. spicata 2 3 3 3 15 7
H. caffrum 0 3 1.9 5 10 19
V. lanceolata 25 35 10 19 36 2
P. obliquum 8 3 18 15 1 9
C. sylvaticus 4 12 29 80 2 3
M. grandis 19 32 85 25 40 23
H. lucens 0 3 0 2 2 52
B. natalensis 0 0 0 40 31 1
C. kraussii 0 0 0 18 22 16
T. lanceolata 0 0 0 39 43 3
T. dregeana 0 0 0 119 1 1
C. gerrardii 0 0 0 320 2 0
C. myrtifolia 0 0 0 120 5 3
C. natalensis 0 0 0 680 7 0
D. adhatodoides 0 0 0 5 10 0
a See Fig. 5a for full Latin binomial for each species.
J. Obiri et al. / Forest Ecology and Management 166 (2002) 131–148 141
Since over 80% of the economically exploited
species in coastal ECP are intermediate- to coarse-
grained, for purposes of harvesting planning, con-
sideration of the effects of disturbance in their
management is required. Disturbance is partly pro-
vided by the strong winds that occasionally blow down
trees, creating gaps in these coastal scarp forests
(Everard et al., 1995) and facilitating regeneration. An
intriguing possibility is the putative role that harvest-
ing plays in creating gaps and perpetuating ‘‘natural’’
forest dynamics (Lawes and Obiri, unpublished data).
One species in particular, M. sutherlandii, appears to
have flourished under these conditions of selective
harvesting and canopy individuals dominate these
forests. This is a relatively unpopular species among
users (Table 5) because the timber does not work well
and decays quickly. The effect of M. sutherlandii on
the dynamics and diversity of tree communities in
these forests is of concern. Thinning out this species
and/or creating gaps by cutting down large trees is a
management option that requires further research.
Our analysis of the grain of the harvestable fraction
of the size-classes of these forest tree species shows
that, although five species are fine-grained and
potentially harvestable, only two species should be
Fig. 5. The spatial scale of regeneration or grain of the 20 harvested tree species and their harvesting potential. (a) Scatter-plot of the density
of harvestable subcanopy stems against canopy stem density for each species. See Fig. 3, and the text for an explanation of the trends
illustrated here. The inset graph is an enlargement of the area enclosed in a dashed line. Axes units are individuals ha�1. Note that E. natalense
and M. grandis are the only fine-grained species that should be harvested. (Bn—Buxus natalensis, Ca—C. africana, Cg—Cola natalensis,
Ck—C. kraussii, Cm—Cryptocarya myrtifolia, Cn—Cola natalensis, Cs—Cussonia spicata, Cy—Croton syvaticus, Da—Duvernoia
adhatodoides, Dg—D. gerrardii, En—E. natalense, Hc—Harpephylum caffrum, Hl—H. lucens, Mg—M. grandis, Ms—M. sutherlandii, Po—
P. obliquum, Td—Trichilia dregeana, Tl—T. lanceolata, Vl—V. lanceolata, Zd—Zanthoylum dayvi). (b) The incidence of each species
(relative abundance) is included in the above model (a). In the resulting three-dimensional graphic, any fine-grained species that lies above the
incidence surface (i.e. species occur in >50% of plots) are potentially harvestable. This graphic serves to confirm that E. natalense and M.
grandis (~) are the only fine-grained species that should be harvested.
Fig. 6. Size-class distribution of stumps (i.e. harvested stems) in
state and community forests.
142 J. Obiri et al. / Forest Ecology and Management 166 (2002) 131–148
used (E. natalense and M. grandis). We advocate the
use of our conservative model of the spatial scale of
regeneration for identifying those species that can be
harvested under current conditions. We have lessened
the effect of combining all species and life-histories in
one analysis by emphasising that the harvestable
fraction should derive from a size-class interval that is
largely unreproductive. Fortunately, poles are har-
vested mostly from the largely unreproductive 10–
20 cm dbh size-class. Further adjusting the harvest-
able size-class intervals according to the size of the
mature tree is necessary to avoid recommending the
use of particularly those naturally small tree species
(e.g. B. natalensis, T. lanceolata) that are currently
Table 5
The harvesting indices for three frequently exploited size-classes of 11 tree species used for poles, construction or craftwork by more than 15%
of householdsa
Species Diameter size-class
(cm)
Stems ha�1
(A)
Stumps ha�1
(B)
Index (C) (proportion of
harvested trees ¼ B/(A þ B))
D. gerrardii 5–10 208 5 0.02
10–20 2 5 0.71
>20 2 1 0.33
D. adhatodoides 5–10 200 0 0.0
10–20 4 4 0.5
>20 0 2 0.5
P. obliquum 5–10 15 1 0.06
10–15 3 2 0.40
>15 6 1 0.14
C. natalensis 5–10 680 3 0.0
10–15 7 4 0.36
>15 1 0 0.0
E. natalense 5–10 739 3 0.0
10–20 41 14 0.25
>20 21 2 0.09
M. grandis 5–10 24 5 0.17
10–20 47 15 0.23
>20 36 10 0.22
V. lanceolata 5–10 20 3 0.13
10–20 36 10 0.12
>20 4 0 0.0
T. lanceolata 5–10 39 1 0.03
10–20 43 8 0.16
>20 7 0 0.0
B. natalensis 5–10 40 1 0.02
10–20 31 6 0.16
>20 6 1 0.14
C. kraussii 5–10 19 0 0.0
10–20 26 5 0.16
>20 33 0 0.0
M. sutherlandii 5–10 296 0 0.0
10–20 23 1 0.04
>20 91 0 0.0
a The index is expressed as a ratio of cut stems (B) to accumulated harvestable stems (stumps plus standing stems ¼ A þ B). Data are
combined for state and community forests.
J. Obiri et al. / Forest Ecology and Management 166 (2002) 131–148 143
harvested for poles from the reproductive size-class.
Application of this model by experienced foresters
should secure the long-term survival of a species in a
forest by ensuring that reproductive individuals are
protected, and successional collapse is avoided by
limiting the numbers of vegetative understory indivi-
duals that are removed. The model does not make
specific recommendations about harvesting rates, but
this is not necessary if the lower limit on the extraction
of subcanopy individuals of a species is not exceeded.
4.2. Patterns of use of tree species
Extraordinary features of the forest structure were a
lack of seedling regeneration in species represented by
large tree individuals, such as H. caffrum and H.
lucens, and an absence of intermediate sized trees in
H. caffrum and P. obliquum. This lack of seedlings is a
common phenomenon of trees in South African forests
(Midgley et al., 1995) and is possibly caused by high
levels of seedling herbivory, although the numbers of
large mammalian herbivores in these forests has
declined drastically over the last century (King, 1941;
Cooper and Swart, 1992). A marked absence of
intermediate sized individuals is usually an indication
of a degraded population under some form of
disturbance and it is worth noting that H. caffrum
and P. obliquum were intensively harvested in the past
(King, 1941). In H. caffrum the absence of inter-
mediate sized trees is not entirely caused by past
exploitation, but is also due to its rising popularity and
current use as a medicinal tree. Differences in SCD
profiles for H. caffrum, C. africana and Z. davyi
between state and community forests are related to
higher human disturbance in community forests,
where these coarse-grained species are particularly
vulnerable. This appears to be linked to the inability of
these species to coppice, resulting in low individual
survival rates in community forests. Coppicing and
resprouting facilitates the persistence of a plant in the
absence of seedling regeneration, and is an advantage
to plants in unpredictable environments (Basnet, 1993;
Bellingham et al., 1994; Zimmerman et al., 1994;
Bond and Midgley, 2001). The ability to persist
through vegetative regeneration is an attractive trait in
species that are targeted for harvesting (Daniels et al.,
1995). Those species that cannot resprout (i.e. Group
1) should probably not be heavily used.
We expected tree selection to be influenced more by
tree species than size, as this is the case elsewhere in
Africa (e.g. Abbot and Homewood, 1999; Kirubi et al.,
2000). However, tree stems were harvested from forest
closest to homes and mainly on the basis of tree size
(mostly 10–20 cm dbh) and to a lesser extent by
species. The fairly indiscriminate selection of tree
species for poles may be a consequence of the
difficulties of carrying heavy poles back to distant
homesteads, and selective harvesting for certain size-
classes in community forests has also been reported
for fuelwood (Shackleton, 1993b). A more plausible
explanation is that the most desired species, particu-
larly P. obliquum, have been over-used and thus pole
cutting has diversified to previously less used species
(Table 3), provided they are within the favoured 10–
20 cm size range. A positive consequence of this size
selection in terms of conservation, is that uncontrolled
tree-cutting pressure is distributed among many
species, albeit that very few species can withstand
current harvesting levels, as indicated by the absence
of many harvested species from community forest. A
further benefit of size-selective harvesting for man-
agement is that the abundance of stems in a class, in
this case the 10–20 cm class, can be used as an
indicator of the state of the standing stock in a forest,
and monitoring and policing efforts can be adjusted
accordingly.
The higher density of stumps in community forests
compared to state forests is due to the closer proximity
of households to the former (x¼ 1:5 km) than the latter
(x¼ 3:2 km). This is a common trend (i.e. exploitation
is greatest in forest nearer to homes; Zimbabwe—
Vermeulen (1996), South Africa—Shackleton
(1993b), Kenya—Kirubi et al. (2000)). In East Africa
non-timber forest products use is highest among
communities living within 1.5 km of the forest edge
and this use declines sharply at distances greater than
5 km (Wass, 1995). Agroforestry initiatives such as
hedgerow intercropping (Huxley, 1999) and the
establishment of community woodlots, as a substitute
resource base, may help reduce the harvesting
pressure on forests. However, these practices should
not only be focussed on communities neighbouring
state forests, as is the current practise (Shone, 1985),
but also extended to more distant communities (i.e.
those over 5 km distance) (cf. Dodoma, Tanzania;
Allen, 1985). This is supported by the willingness of
144 J. Obiri et al. / Forest Ecology and Management 166 (2002) 131–148
homesteads farthest from forests to plant their own
trees.
The high demand for P. obliquum and M. grandis
seedlings for planting on homesteads, was contrary to
our expectation since these two popular species were
regarded by users as abundant in all forests and
presumably readily available. However, it is possible
that local perceptions of abundance were based on the
visible presence of these species growing at the forest
margin, although they are uncommon in the forest
interior. It is equally likely that users have deliberately
over-estimated the abundance of these species because
of their popularity. Unfortunately these over-estimates
are used to justify the current high harvesting rates that
could result in local extinction of some species. Future
forestry management will have to reconcile the
difference in perception of tree abundance with the
actual abundance of a species, since no harvesting
limit on a species will be accepted if it is perceived to
be abundant.
4.3. Conservation recommendations
Although we recommend the use of some fine-
grained, Group 4, species in state forest these same
species have been virtually extirpated in community
forest. Clearly, the uncontrolled use of even the most
abundant and resilient resources can result in severe
resource depletion and possibly irreversible degrada-
tion (e.g. Struhsaker, 1997). Community forests are
heavily used and in poor condition because the local
community can legally use these forests, but there are
also fewer community forests, they are closer to
homesteads, and they are mostly small in area. It is
inevitable that the larger state forests will have to be
used by local communities, if for no other reason than
it is difficult to justify the existence of exclusive
protected areas when faced by burgeoning community
needs (e.g. Vermeulen, 1996). To ban the use of state
forest resources is not a viable option because this
would effectively alienate rural communities, making
it difficult to both implement sustainable community
forestry practices and to control resource use. Thus,
although the use of Group 4 species in state forests is
recommended, the survival of state forests is con-
tingent upon (1) the implementation of suitable
control measures, and (2) identifying and securing
suitable alternative sources for forest wood products
(e.g. woodlots and agroforestry initiatives) to lessen
the harvesting pressure on these forests.
Although knowledge of a forest’s resource base and
its ecological functioning are prerequisites for sustain-
able forest management, equally important is the
attitude of communities towards a management
system. Where attitudes are negative, mainly because
access to resources is limited, conservation initiatives
often fail (Obua et al., 1998; Banana and Gombya-
Ssembajjwe, 2000; Gibson and Becker, 2000).
Because the communities in our study have a
generally positive attitude towards state management
we are optimistic that the current resource over-
exploitation can be reversed. The somewhat negative
attitude toward community management may partly
be explained by a reduction in local chiefs’ control
over community forest caused by new political
dispensations. With the introduction of the Transi-
tional Rural Council, chiefs’ powers have dwindled
(Pycroft, 1996, 1999) and so have forests under their
control (DWAF, 1997). This loss of influence may
have reduced local confidence in the ability of the
traditional tenure system to manage forests. Notwith-
standing these attitudes and perceptions, participation
of chiefs and the community in forest management is
highly important (Poffenberger, 1996; Gibson and
Becker, 2000) and we suggest a joint management
forum for this region.
5. Conclusions
Sustainable development is critical to the survival
of indigenous forests in Umzimvubu district. Based on
the ecological findings of this study we can conclude
that forests under state authority in Umzimvubu
district are in better condition and more biodiverse
than community forests. Community forests had: (1)
higher stump densities; (2) lower densities of seed-
lings and saplings in important species such as H.
caffrum, C. africana and Z. davyi; (3) lower densities
of the highly sought after 10–20 cm dbh size-class
trees, and (4) fewer high-value species, than state
forests. Shackleton (1993b) and Higgins et al. (1999)
have reported similar trends in community managed
woodlands in South Africa.
This study provides an ecological basis for the
sustainable harvesting of high-value tree species from
J. Obiri et al. / Forest Ecology and Management 166 (2002) 131–148 145
forests of the Umzimvubu district. Direct recommen-
dations to arise from this study are as follows:
1. Harvesting of pole-sized stems should be limited
to fine-grained species, currently one species only
in community forest (E. natalense) and two in
state forest (E. natalense and M. grandis) can
support moderate use. Some fine-grained species
such as T. lanceolata, B. natalensis and V.
lanceolata may be harvestable in state forest
under strictly controlled conditions.
2. Pole and post harvesting and the overall state of
the standing stock can be rapidly monitored by
estimating the abundance of trees in the highly
desired 10–20 cm dbh size-class.
3. Since households far from forest were willing to
plant indigenous trees, there is potential for
establishing community forestry initiatives, such
as woodlots (Ahlback, 1995). Emphasis could be
placed on indigenous trees, such as A. karroo and
P. obliquum, which are popular with the commu-
nities.
4. The establishment of suitable integrated commu-
nity-based institutions and management practises
are required for forests in the region to have any
future at all.
While our data provide a strong case for state
control over forests, community management options
should not be dismissed. Effective protection of either
tenurial category of forest is impossible without the
co-operation of local users and collaboration between
state and community institutions is required if
indigenous forest is to survive. A joint forest manage-
ment system steered by the local chief, representatives
of the Transitional Rural Council and resource
managers from the forestry Department would appear
to be the most effective way of moving forward.
Acknowledgements
Financial support from the Charlotte Conservation
Fellowship Program of the African Wildlife Founda-
tion, and the National Research Foundation (Sustain-
able Environment theme) of South Africa, is greatly
appreciated. The authors also wish to acknowledge the
help and support from the Department of Water
Affairs and forestry personnel at Mt Thesiger forest
Station at Port St. Johns. This study would not have
been possible without the support and co-operation of
the people of Umzimvubu district. The Mazda Wild-
life Fund provided logistical support.
References
Abbot, J.I.O., Homewood, K., 1999. A history of change: causes of
Miombo woodland decline in a protected area in Malawi. J.
Appl. Ecol. 36, 422–433.
Ahlback, A.J., 1995. Mobilising rural people in Tanzania to tree
planting—why and how. Ambio 24 (5), 304–310.
Allen, J.C., 1985. Wood energy and preservation of woodlands in
semi-arid developing countries. The case of Dodoma Region,
Tanzania. J. Dev. Econ. 19, 59–84.
Banana, A.Y., Gombya-Ssembajjwe, W., 2000. Successful forest
management: the importance of security of tenure and rule
enforcement in Ugandan forests. In: Gibson, C.C., McKean,
M.A., Ostrom, E. (Eds.), People and Forests: Communities,
Institutions, and Governance. MIT Press, Cambridge, MA,
pp. 87–98.
Basnet, K., 1993. Recovery of a tropical rain forest after hurricane
damage. Vegetatio 109, 1–4.
Bellingham, P.J., Tanner, E.V.J., Healey, J.R., 1994. Sprouting of
trees in Jamaican montane forests, after a hurricane. J. Ecol. 82,
747–758.
Bokwe, T.T., Bhat, R.B., 1998. Indigenous plants used in the
cottage industry in the Transkei region of Eastern Cape
Province, South Africa. Int. J. Exp. Bot. 63, 39–49.
Bond, W.J., Midgley, J.J., 2001. Ecology of sprouting in woody
plants: the persistence niche. Trends Ecol. Evol. 16, 45–51.
Cloete, E., 1998. Floristic and vegetation of six sites: a preliminary
baseline study completed for the Master farmers programme.
Unpublished report, University of Transkei, Umtata.
Condit, R., Sukumar, R., Hubbell, S.P., Foster, R.B., 1998.
Predicting population trends from size distributions—a direct
test in a tropical tree community. Am. Nat. 152 (4), 494–509.
Cooper, K.H., Swart, W., 1992. Transkei Forest Survey. Wildlife
Society of South Africa, Durban, p. 96.
Daniels, R.J.R., Gadgil, M., Joshi, N.V., 1995. Impact of human
extraction of tropical humid forests in the Western Ghats in
Uttara Kannada, South India. J. Appl. Ecol. 32, 866–874.
Deboer, W., Baquete, D.S., 1998. Natural resource use, crop
damage and attitudes of rural people in the vicinity of the
Maputo Elephant Reserve, Mozambique. Environ. Conserv. 25
(3), 208–218.
DWAF, 1996. Sustainable Forest Development in South Africa: the
Policy of the Government of National Unity. Department of
Water Affairs and forestry, Pretoria, 29 pp.
DWAF, 1997. South Africa’s National Forestry Action Plan.
Department of Water Affairs and Forestry, Pretoria, p. 148.
Everard, D.A., van Wyk, G.F., Midgley, J.J., 1994. Disturbance and
the diversity of forests in Natal, South Africa: lessons for their
utilization. In: Huntley, B.J. (Ed.), Strelitzia 1. Botanical
146 J. Obiri et al. / Forest Ecology and Management 166 (2002) 131–148
Diversity in Southern Africa. National Botanical Institute,
Pretoria, pp. 275–285.
Everard, D.A., Midgley, J.J., Van Wyk, G.F., 1995. Dynamics of
some forests in KwaZulu-Natal, South Africa, based on
ordinations and size class distributions. S. Afr. J. Bot. 61 (6),
283–292.
Gibson, C.C., Becker, C.D., 2000. A lack of institutional demand:
why a strong local community in western Ecuador fails to
protect its forest. In: Gibson, C.C., McKean, M.A., Ostrom, E.
(Eds.), People and Forests: Communities, Institutions, and
Governance. MIT Press, Cambridge, MA, pp. 135–162.
Grubb, P.J., 1996. Rainforest dynamics: the need for new
paradigms. In: Edwards, D.S., Choy, S.C., Booth, W.E.
(Eds.), Tropical Rainforest Research: Current Issues. Kluwer
Academic Publishers, Dordrecht, pp. 215–233.
Hartshorn, G.S., 1995. Ecological basis for sustainable develop-
ment in tropical forests. Ann. Rev. Ecol. Syst. 26, 155–175.
Henderson, L., 1994. Plant Invaders of Southern Africa. Agricul-
tural Research Council, Pretoria, p. 176.
Higgins, S.I., Shackleton, C.M., Robinson, E.R., 1999. Changes in
woody communities and composition under contrasting landuse
systems in a semiarid savannah, South Africa. J. Biogeogr. 26
(3), 619–627.
Huxley, P., 1999. Tropical Agroforestry. Cambridge University
Press, Cambridge, 371 pp.
Johnson, C.T., 1983. The forests and trees of Transkei. Veld and
Flora 69 (1), 26–27.
Kieplei, J., Quinlan, T., 1996. Transkei coastal fisheries resources
phase 2: resource utilisation, development and tourism.
Unpublished Report, Oceanographic Research Institute, Dur-
ban, p. 59.
King, N.L., 1941. The exploitation of indigenous forests in South
Africa. S. Afr. J. Bot. 48, 455–480.
Kirubi, C., Wamicha, W.N., Laichena, J.K., 2000. The effects of
fuelwood consumption in the ASAL areas of Kenya: the case
study of Marsabit forest. Afr. J. Ecol. 38, 47–52.
Laurance, W.F., 1999. Reflections on the tropical deforestation
crisis. Biol. Conserv. 91 (2/3), 109–117.
Lewis, D.M., Alpert, P., 1997. Trophy hunting and wildlife
conservation in Zambia. Conserv. Biol. 11 (1), 59–68.
Low, A.B., Rebelo, T.G., 1997. Vegetation of South Africa,
Lesotho and Swaziland. Department of Environmental Affairs
and Tourism Press, Pretoria, pp. 85.
Lykke, A.M., 1998. Assessment of species composition change in
savanna vegetation by means of woody plants’ size class
distributions and local information. Biodiv. Conserv. 7, 1261–
1275.
Mander, P., 1989. Management recommendation for the sustained
use of indigenous forests: In: Mckenzie, B. (Ed.), Guidelines
for the Sustained Use of Indigenous Forests and Forest
Products. Occasional Report no. 35, Foundation for Research
and Development, Pretoria, pp. 43–53.
McGregor, J., 1994. Woodland pattern and structure in a peasant
farming area of Zimbabwe: ecological determinants, present
and past use. For. Ecol. Manage. 63 (2/3), 97–133.
McKenzie, B., 1989. Guidelines for the Sustained Use of
Indigenous Forests and Forest Products. Occasional Report
no. 35. Foundation for Research and Development, Pretoria, 69
pp.
Midgley, J., Seydack, A., Reynell, D., Mckelly, D., 1990. Fine grain
pattern in southern Cape plateau forests. J. Veg. Sci. 1, 539–
546.
Midgley, J.J., Everard, D.A., van Wyk, G., 1995. Relative lack of
regeneration of shade intolerant canopy species in some South
African forests. S. Afr. J. Sci. 91, 7–8.
Nhira, C., Baker, S., Gondo, P., Mangono, J.J., Marunda, C., 1998.
Contesting inequality in access to forests. Policy that works for
forests and people series no. 5: Zimbabwe. Centre for applied
social services and forestry commission, Harare and Interna-
tional Institute for Environment and Development, London,
p. 130.
Noss, A.J., 1997. Challenges to nature conservation with commu-
nity-development in Central Africa. Oryx 31 (3), 180–188.
Obiri, J.A., 1997. Socio-economic and environmental impacts on
the utilisation of the umsimbithi tree Millettia grandis in
eastern Cape: A case study of Mt Thesiger forest Reserve
Pondoland. Unpublished MSc Thesis, University of Natal,
Pietermaritzburg.
Obua, J., Banana, A.Y., Turyahabwe, N., 1998. Attitudes of local
communities towards forest management practices in Uganda:
the case of Budongo forest reserve. Common. For. Rev. 77 (2),
113–118.
Paulson, D.D., 1994. Understanding tropical deforestation: the case
of Western Samoa. Environ. Conserv. 21 (4), 326–332.
Pinard, M.A., Huffman, A., 1997. Fire resistance and bark
properties of trees in seasonally dry forest in eastern Bolivia.
J. Trop. Ecol. 13, 727–740.
Poffenberger, M., 1996. Communities and Forest Management.
International Union for Conservation of Nature, Washington,
p. 41.
Poorter, L., Bongers, F., van Rompaey, R.S.A.R., de Klerk, M.,
1996. Regeneration of canopy tree species at five sites in West
African moist forest. For. Ecol. Manage. 85, 61–69.
Pycroft, C., 1996. Local government in the new South Africa.
Public Administration Dev. 16 (3), 233–245.
Pycroft, C., 1999. Restructuring non-metropolitan local govern-
ment in South Africa. Public Administration Dev. 19 (2), 179–
192.
Ridsdale, G., Kallman, K., 1996. A case study of a tourism/
employment development strategy for Port St Johns. Unpub-
lished Report, Land and Agriculture Policy Centre, Johannes-
burg.
Sano, J., 1997. Age and size distribution in a long-term forest
dynamics. For. Ecol. Manage. 92 (1–3), 39–44.
Seydack, A.H.W., 1991. Inventory of South Africa national forest
for management purposes. S. Afr. For. J. 158, 105–108.
Shackleton, C.M., 1993a. Demography and dynamics of the
dominant woody species in a communal and protected area
of the eastern Transvaal Lowveld. S. Afr. J. Bot. 59, 569–574.
Shackleton, C.M., 1993b. Fuelwood harvesting and sustainable
utilisation in a communal grazing land and protected area of the
eastern Transvaal Lowveld. Biol. Conserv. 63, 247–254.
Shone, A.K., 1985. Forestry in Transkei. Department of Agricul-
ture and Forestry, Transkei, p. 50.
J. Obiri et al. / Forest Ecology and Management 166 (2002) 131–148 147
Song, Y.J., Burch, W., Geballe, G., Geng, L.P., 1997. New
organisational strategy of managing the forests of southeast
China: the share holding integrated forest holding (Shift)
system. For. Ecol. Manage. 91 (23), 183–194.
Stohlgren, T.J., 1994. Planning long-term vegetation studies at
landscape scales. In: Powell, T.M., Steele, J. (Eds.), Ecological
Time Series. Chapman & Hall, New York, pp. 209–241.
Stohlgren, T.J., Falkner, M.B., Schell, L.D., 1995. A modified-
Whittaker nested vegetation sampling method. Vegetatio 117,
113–121.
Struhsaker, T.T., 1997. Ecology of an African Rainforest: Logging
in Kibale and the Conflict between Conservation and Exploita-
tion. University Press of Florida, Gainesville, FL, p. 434.
Sutherland, W.J., Reynolds, J.D., 1998. Sustainable and unsustain-
able exploitation. In: Sutherland, W.J. (Ed.), Conservation
Science in Action. Blackwell Science, Oxford, pp. 90–115.
Swaine, M.D., Lieberman, D., Hall, J.B., 1990. Structure and
dynamics of a tropical dry forest in Ghana. Vegetatio 88, 31–
51.
Vandergeest, P., 1996. Property rights in protected areas: obstacles
to community involvement as a solution in Thailand. Environ.
Conserv. 23 (3), 259–268.
Van Eck, H., Ham, C., Van Wyk, G., 1997. Survey of indigenous
trees and preferences in eastern Cape. S. Afr. For. J. 180, 61–
64.
Vermeulen, S.J., 1996. Cutting of trees by local residents in a
communal area of an adjacent state forest in Zimbabwe. For.
Ecol. Manage. 81, 101–111.
Wass, P., 1995. Kenya Indigenous Forests: Status, Management and
Conservation. International Union for the Conservation of
Nature Press, Cambridge, 135 pp.
Wiersum, K.F., 1997. Indigenous exploitation and management of
tropical forest resources: an evolutionary continuum in forest–
people interactions. AEENDO 63 (1), 1–16.
Zimmerman, J.K., Everham, E.M., Waide, R.B., Lodge, D.J.,
Taylor, C.M., Brokaw, N.V.L., 1994. Responses of tree species
to hurricane winds in subtropical wet forest in Puerto Rico:
implications for tropical tree life histories. J. Ecol. 82, 911–922.
148 J. Obiri et al. / Forest Ecology and Management 166 (2002) 131–148